
For personal use only - ASX · • Plant changes will provide additional operational security and...
19
ASX RELEASE 9 July, 2020 DFS REVIEW SIGNIFICANTLY IMPROVES FINANCIAL MODEL & FURTHER DERISKS BORBOREMA PROJECT ____________________________________________________________________________________________________ • Review of processing plant confirms proposed treatment path and recommends plant and equipment changes to the comminution and elution circuits. • Plant changes will provide additional operational security and benefits and include: • planned SAG mill circuit to be replaced by three stage crushing and Ball mill; • AARL elution circuit to be replaced by Pressure Zadra plant. • Start up Capital costs reduced to US$90.7M including contingency of US$11.3M. • Updated Project Financial Model using a gold price of US$1,550 demonstrates that the Borborema project will: • produce 729,400 ounces of gold over the 10.2 year mine life of Stage 1 at, • an AISC of US$713 per ounce. • The Stage 1 project shows an increase of: • Pre tax NPV (8%) to US$342M (A$496M) and an IRR of 64.7% • Post tax NPV (8%) to US$287M (A$416M) and an IRR of 57.9% __________________________________________________________________________________ Big River Gold Ltd (ASX: BRV) (Company or Big River) is pleased to advise shareholders that the review of the Definitive Feasibility Study (DFS) 1 for the Borborema Project released in December 2019 was completed as scheduled in June. It resulted in changes to the process design that further de-risks the operation and provided substantial improvement to the project economics. Start-up capital costs of the 2Mtpa Project were reduced to US$90.7M which includes contingency of US$11.33M and the average All In Sustaining Cost (AISC) has seen a significant reduction to US$713 per ounce gold over the 10.2 years of production scheduled for Stage 1. Stage 1 is expected to produce 729,400 oz gold over 10.2 years which comprises only a portion of the Borborema Resource/Reserves of 2.43Moz and 1.61Moz respectively. Refer to ASX announcements of 23 December, 2019 and 6 March, 2018 for more details on reserves and resources. The pre tax Project NPV (at 8% discount) increased from US$218M to US$342M (A$496M) 2 while the after tax NPV (at 8% discount) increased to US$287M (A$416M). The updated Project Financial Model used a flat gold price of US1,550 per ounce compared to the 2019 DFS assumption of US$1,400 which remains below the consensus of recent forecasts compiled by Bloomberg 3 and is substantially lower than the current spot price of over US$1,800 per ounce. 1 For full details of the Definitive Feasibility Study, refer to ASX announcement of 23 December, 2019. 2 AUD:USD exchange rate unchanged at 0.6900 3 Bloomberg. 11 June, 2020 For personal use only
Transcript of For personal use only - ASX · • Plant changes will provide additional operational security and...

ASX RELEASE 9 July, 2020
DFS REVIEW SIGNIFICANTLY IMPROVES FINANCIAL MODEL & FURTHER DERISKS BORBOREMA PROJECT
____________________________________________________________________________________________________
• Review of processing plant confirms proposed treatment path and recommends plant and equipment changes to the comminution and elution circuits.
• Plant changes will provide additional operational security and benefits and include:
• planned SAG mill circuit to be replaced by three stage crushing and Ball mill;
• AARL elution circuit to be replaced by Pressure Zadra plant.
• Start up Capital costs reduced to US$90.7M including contingency of US$11.3M.
• Updated Project Financial Model using a gold price of US$1,550 demonstrates that the Borborema project will:
• produce 729,400 ounces of gold over the 10.2 year mine life of Stage 1 at,
• an AISC of US$713 per ounce.
• The Stage 1 project shows an increase of:
• Pre tax NPV (8%) to US$342M (A$496M) and an IRR of 64.7%
• Post tax NPV (8%) to US$287M (A$416M) and an IRR of 57.9% __________________________________________________________________________________
Big River Gold Ltd (ASX: BRV) (Company or Big River) is pleased to advise shareholders that the review of the Definitive Feasibility Study (DFS)1 for the Borborema Project released in December 2019 was completed as scheduled in June. It resulted in changes to the process design that further de-risks the operation and provided substantial improvement to the project economics. Start-up capital costs of the 2Mtpa Project were reduced to US$90.7M which includes contingency of US$11.33M and the average All In Sustaining Cost (AISC) has seen a significant reduction to US$713 per ounce gold over the 10.2 years of production scheduled for Stage 1. Stage 1 is expected to produce 729,400 oz gold over 10.2 years which comprises only a portion of the Borborema Resource/Reserves of 2.43Moz and 1.61Moz respectively. Refer to ASX announcements of 23 December, 2019 and 6 March, 2018 for more details on reserves and resources. The pre tax Project NPV (at 8% discount) increased from US$218M to US$342M (A$496M)2 while the after tax NPV (at 8% discount) increased to US$287M (A$416M). The updated Project Financial Model used a flat gold price of US1,550 per ounce compared to the 2019 DFS assumption of US$1,400 which remains below the consensus of recent forecasts compiled by Bloomberg3 and is substantially lower than the current spot price of over US$1,800 per ounce.
1 For full details of the Definitive Feasibility Study, refer to ASX announcement of 23 December, 2019. 2 AUD:USD exchange rate unchanged at 0.6900 3 Bloomberg. 11 June, 2020
For
per
sona
l use
onl
y

2
Highlights - Review and Update of 2019 DFS
A review of the 2019 DFS concentrated on improving the processing plant and performance. All other technical and financial aspects of the DFS as described in the ASX announcement dated 23 December, 2019 remain unchanged, including mining, environmental and social aspects. The review confirmed the suitability of the proposed processing path but recommended changes that were accepted by the Company to:
• the location and layout of the process plant (now finalised);
• the choice of some plant and equipment used in the crushing and grinding circuits and elution circuit.
It was decided to replace the SAG and ball mill in the comminution circuit as proposed in the 2019 DFS with a three stage crushing plant and ball mill. This was done to reduce the risk and increase the security of the operation by minimising the possibility of a long shutdown of the plant caused by a SAG mill equipment failure and the lack of available spare parts or skilled technicians. It was considered a SAG mill would be more exposed to this risk than the conventional ball mill. The selection of a Pressure Zadra plant to replace the proposed AARL elution circuit was made to conserve water and is considered better suited when operating with the treated sewage water from Currais Novos. The studies demonstrated that the proposed capital equipment changes will not show a marked difference in operational performance and may result in improvements as discussed below. They do however, provide additional security for ongoing operations and the cost estimates indicate some savings in capital expenditure will be obtained. Table 1 summarises the revised capital estimates and more details are provided in the following sections. The revised capital costs were incorporated into the Project Financial Model along with updates to taxation regimes. Improved taxation rates granted in April by the local authorities on service providers were also included. Currency exchange rates were largely unchanged except for the Brazilian Real for which an exchange rate of 0.2000 BRL:USD was assumed that remains more conservative than recent forecasts.
Table 1. Capital cost breakdown and comparison
Works Area - Description DFS (2019) DFS Update
(2020)
Mine – Quarry 1,386,400 1,155,900
Industrial Plant 60,025,500 54,428,600
Non-Process Infrastructure 7,395,800 6,181,500
Other – First Fills and Spares 2,482,900 1,818,000
Indirect Costs 16,679,200 15,790,600
Total, excluding contingency 87,969,900 79,374,800
Contingency 11,361,000 11,333,900
Project Total 99,330,900 90,708,600
A flat gold price of US$1,550 was applied in the cashflow model which is markedly less than current prices of over US$1,800 and below the consensus of recent forecasts compiled and published by Bloomberg. Table 2 summarises the key operating and financial results of the revised DFS.
For
per
sona
l use
onl
y
3
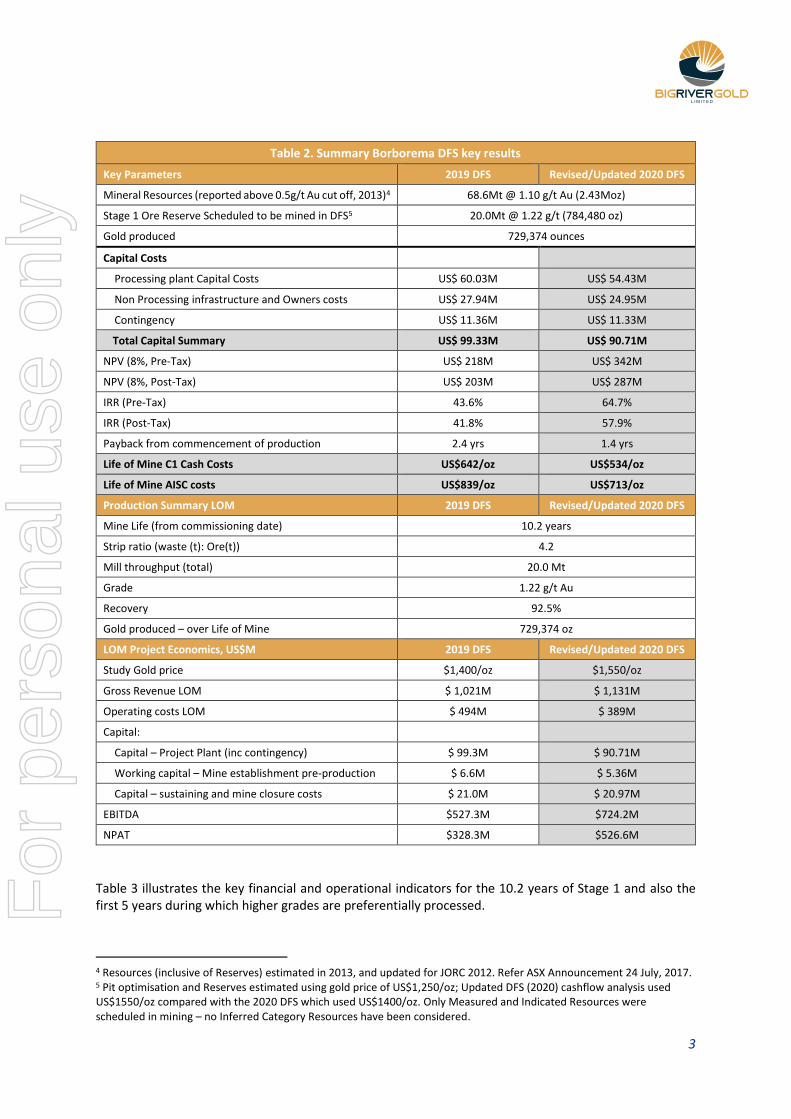
Table 2. Summary Borborema DFS key results
Key Parameters 2019 DFS Revised/Updated 2020 DFS
Mineral Resources (reported above 0.5g/t Au cut off, 2013)4 68.6Mt @ 1.10 g/t Au (2.43Moz)
Stage 1 Ore Reserve Scheduled to be mined in DFS5 20.0Mt @ 1.22 g/t (784,480 oz)
Gold produced 729,374 ounces
Capital Costs
Processing plant Capital Costs US$ 60.03M US$ 54.43M
Non Processing infrastructure and Owners costs US$ 27.94M US$ 24.95M
Contingency US$ 11.36M US$ 11.33M
Total Capital Summary US$ 99.33M US$ 90.71M
NPV (8%, Pre-Tax) US$ 218M US$ 342M
NPV (8%, Post-Tax) US$ 203M US$ 287M
IRR (Pre-Tax) 43.6% 64.7%
IRR (Post-Tax) 41.8% 57.9%
Payback from commencement of production 2.4 yrs 1.4 yrs
Life of Mine C1 Cash Costs US$642/oz US$534/oz
Life of Mine AISC costs US$839/oz US$713/oz
Production Summary LOM 2019 DFS Revised/Updated 2020 DFS
Mine Life (from commissioning date) 10.2 years
Strip ratio (waste (t): Ore(t)) 4.2
Mill throughput (total) 20.0 Mt
Grade 1.22 g/t Au
Recovery 92.5%
Gold produced – over Life of Mine 729,374 oz
LOM Project Economics, US$M 2019 DFS Revised/Updated 2020 DFS
Study Gold price $1,400/oz $1,550/oz
Gross Revenue LOM $ 1,021M $ 1,131M
Operating costs LOM $ 494M $ 389M
Capital:
Capital – Project Plant (inc contingency) $ 99.3M $ 90.71M
Working capital – Mine establishment pre-production $ 6.6M $ 5.36M
Capital – sustaining and mine closure costs $ 21.0M $ 20.97M
EBITDA $527.3M $724.2M
NPAT $328.3M $526.6M
Table 3 illustrates the key financial and operational indicators for the 10.2 years of Stage 1 and also the first 5 years during which higher grades are preferentially processed.
4 Resources (inclusive of Reserves) estimated in 2013, and updated for JORC 2012. Refer ASX Announcement 24 July, 2017. 5 Pit optimisation and Reserves estimated using gold price of US$1,250/oz; Updated DFS (2020) cashflow analysis used US$1550/oz compared with the 2020 DFS which used US$1400/oz. Only Measured and Indicated Resources were scheduled in mining – no Inferred Category Resources have been considered.
For
per
sona
l use
onl
y
4
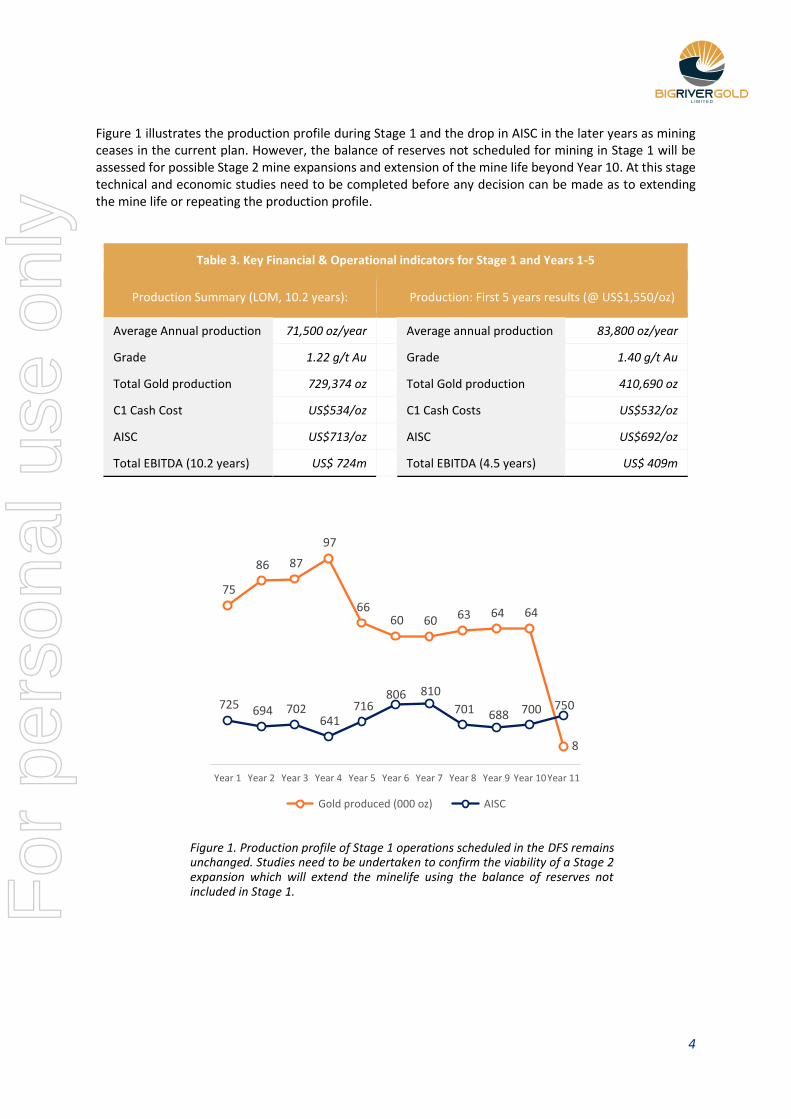
Figure 1 illustrates the production profile during Stage 1 and the drop in AISC in the later years as mining ceases in the current plan. However, the balance of reserves not scheduled for mining in Stage 1 will be assessed for possible Stage 2 mine expansions and extension of the mine life beyond Year 10. At this stage technical and economic studies need to be completed before any decision can be made as to extending the mine life or repeating the production profile.
Table 3. Key Financial & Operational indicators for Stage 1 and Years 1-5
Production Summary (LOM, 10.2 years): Production: First 5 years results (@ US$1,550/oz)
Average Annual production 71,500 oz/year Average annual production 83,800 oz/year
Grade 1.22 g/t Au Grade 1.40 g/t Au
Total Gold production 729,374 oz Total Gold production 410,690 oz
C1 Cash Cost US$534/oz C1 Cash Costs US$532/oz
AISC US$713/oz AISC US$692/oz
Total EBITDA (10.2 years) US$ 724m Total EBITDA (4.5 years) US$ 409m
Figure 1. Production profile of Stage 1 operations scheduled in the DFS remains unchanged. Studies need to be undertaken to confirm the viability of a Stage 2 expansion which will extend the minelife using the balance of reserves not included in Stage 1.
725 694 702 641
716 806 810
701 688 700 750
Year 1 Year 2 Year 3 Year 4 Year 5 Year 6 Year 7 Year 8 Year 9 Year 10Year 11
Gold produced (000 oz) AISC
For
per
sona
l use
onl
y

5
Figure 2. View to the south west over the Borborema pit showing the exposed ore zone and infrastructure.
Review and Update of 2019 DFS – Detailed Discussion
The following provides detail on the work undertaken between April and June 2020 and conclusions drawn from reviews of the Definitive Feasibility Study (DFS) completed by Wave Engineering (Wave) in December 2019. A report titled DFS Changes & Estimate Update was completed in June 2020 by engineering consultants, CPC Project Design (CPC) following a review of plant layout and water usage by Wave in April 2020. The work concentrated solely on improving the processing plant and performance. All other technical and financial aspects of the DFS as described in the ASX announcement dated 23 December, 2019 remain unchanged, including mining, environmental and social aspects.
The work subsequent to the 2019 DFS completion comprised:
1. Wave completed a first pass concept layout that relocated the process plant and incorporated a 3 stage crushing plant and ball mill to replace the primary crush SAG/ball mill (SAGB) circuit in the original design.
2. Wave investigating the selection of an AARL elution circuit and elected to replace that with a Pressure Zadra Plant, thereby lowering both the quality and quantity of water required for the Project.
3. CPC prepared a DFS Design Changes and Estimate Report with a revised capital cost estimate including taxes payable on the mechanical and electrical equipment. The revised capital estimate was of the same order of accuracy as the original DFS.
For
per
sona
l use
onl
y
6
Plant Location and Layout
The plant site layout and design were reviewed to optimise the site location, layout and earthworks required which led to:
1. The plant being relocated to:
i) optimise the haulage distance from mine to ROM Pad.
ii) comply with legislation requiring blast zone clearance.
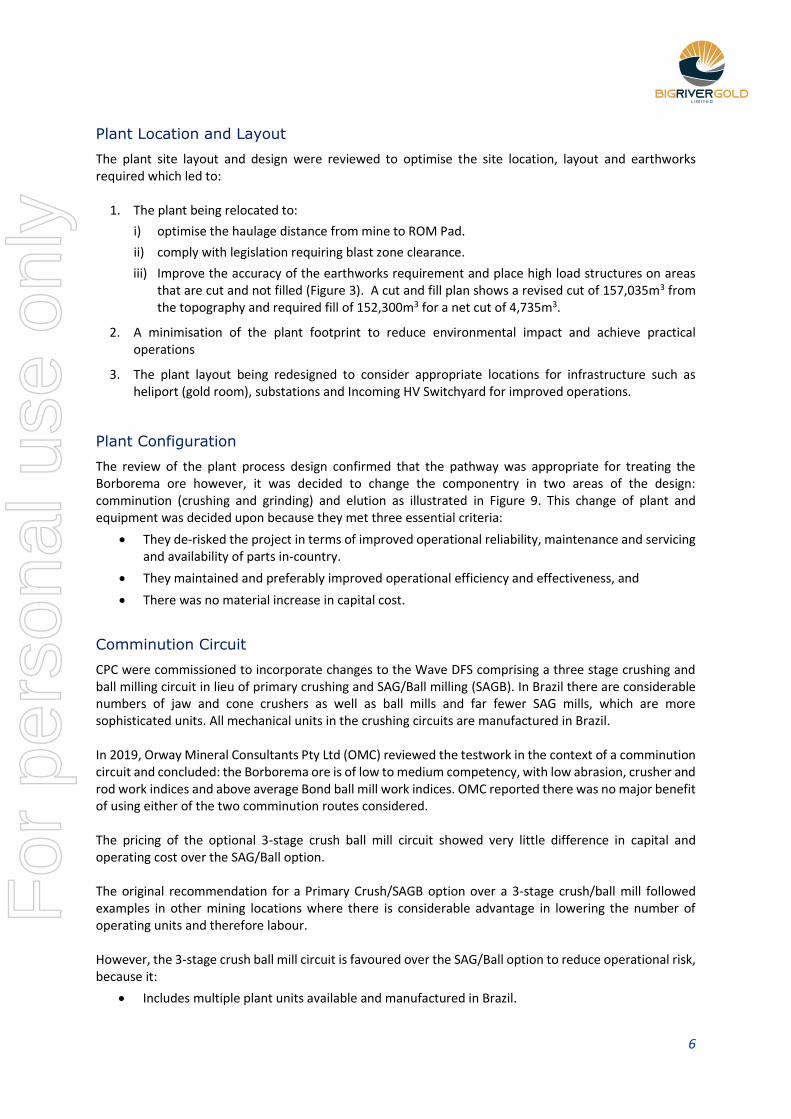
iii) Improve the accuracy of the earthworks requirement and place high load structures on areas that are cut and not filled (Figure 3). A cut and fill plan shows a revised cut of 157,035m3 from the topography and required fill of 152,300m3 for a net cut of 4,735m3.
2. A minimisation of the plant footprint to reduce environmental impact and achieve practical operations
3. The plant layout being redesigned to consider appropriate locations for infrastructure such as heliport (gold room), substations and Incoming HV Switchyard for improved operations.
Plant Configuration
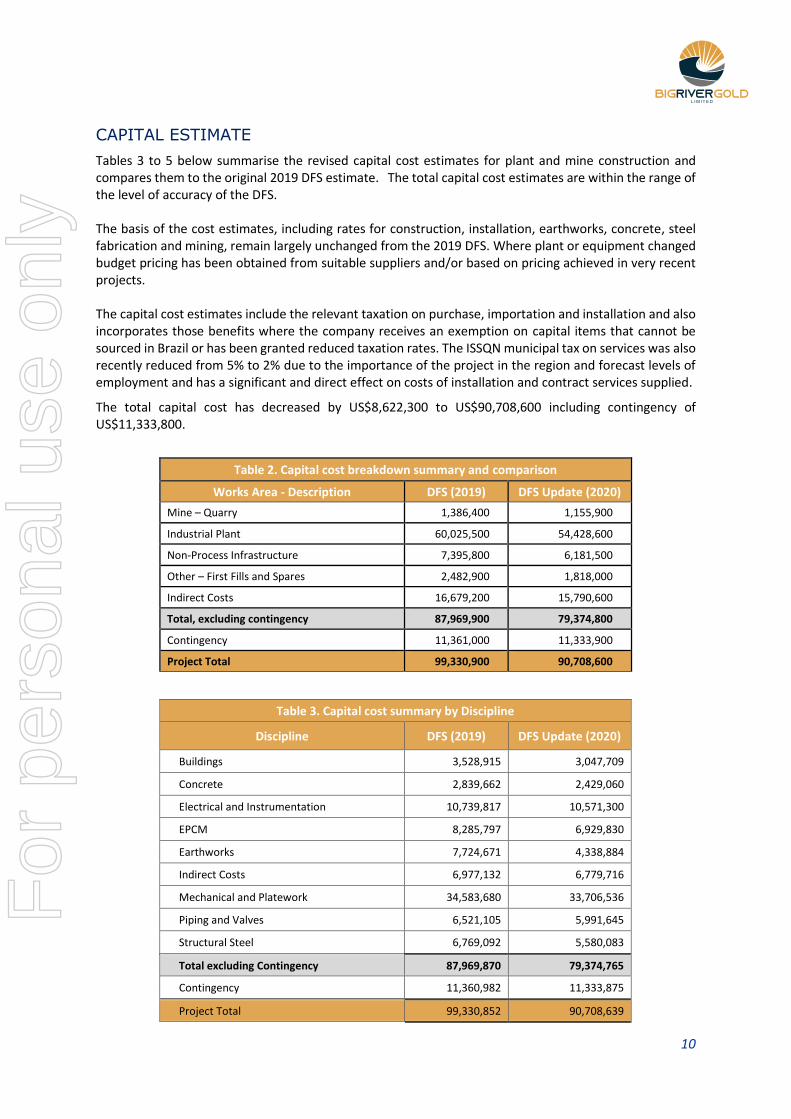
The review of the plant process design confirmed that the pathway was appropriate for treating the Borborema ore however, it was decided to change the componentry in two areas of the design: comminution (crushing and grinding) and elution as illustrated in Figure 9. This change of plant and equipment was decided upon because they met three essential criteria:
• They de-risked the project in terms of improved operational reliability, maintenance and servicing and availability of parts in-country.
• They maintained and preferably improved operational efficiency and effectiveness, and
• There was no material increase in capital cost.
Comminution Circuit
CPC were commissioned to incorporate changes to the Wave DFS comprising a three stage crushing and ball milling circuit in lieu of primary crushing and SAG/Ball milling (SAGB). In Brazil there are considerable numbers of jaw and cone crushers as well as ball mills and far fewer SAG mills, which are more sophisticated units. All mechanical units in the crushing circuits are manufactured in Brazil. In 2019, Orway Mineral Consultants Pty Ltd (OMC) reviewed the testwork in the context of a comminution circuit and concluded: the Borborema ore is of low to medium competency, with low abrasion, crusher and rod work indices and above average Bond ball mill work indices. OMC reported there was no major benefit of using either of the two comminution routes considered. The pricing of the optional 3-stage crush ball mill circuit showed very little difference in capital and operating cost over the SAG/Ball option. The original recommendation for a Primary Crush/SAGB option over a 3-stage crush/ball mill followed examples in other mining locations where there is considerable advantage in lowering the number of operating units and therefore labour. However, the 3-stage crush ball mill circuit is favoured over the SAG/Ball option to reduce operational risk, because it:
• Includes multiple plant units available and manufactured in Brazil.
For
per
sona
l use
onl
y
7
• Provides for a shorter delivery time than for a SAG mill.
• Means only a ball mill is imported. This is a more common occurrence in Brazil with less likely importation difficulties.
• Provides better support, maintenance and availability of spare parts in Brazil than a SAG mill.
• Results in less complicated operations and maintenance.
Figure 3. Revised plant layout (Wave 2020) with a smaller footprint and relocated. Note high load structure located on ’cut’ areas (in red) rather than areas of infill.
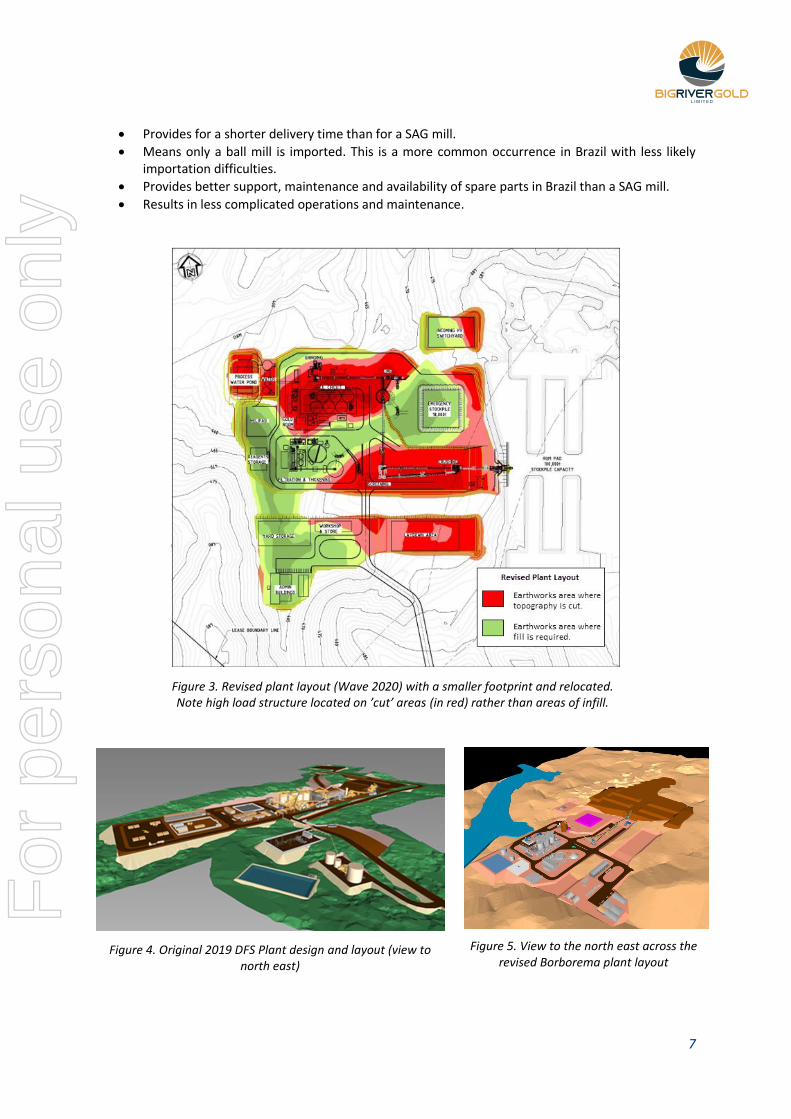
Figure 4. Original 2019 DFS Plant design and layout (view to north east)
Figure 5. View to the north east across the revised Borborema plant layout
For
per
sona
l use
onl
y
8
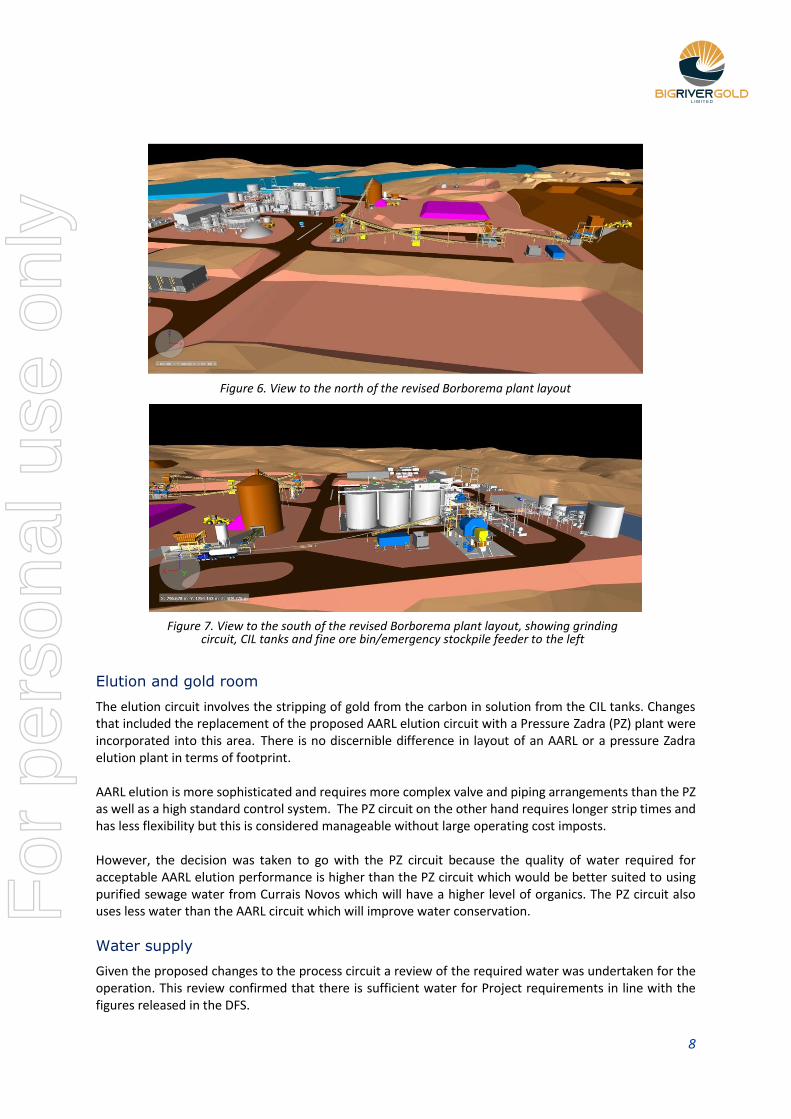
Figure 6. View to the north of the revised Borborema plant layout
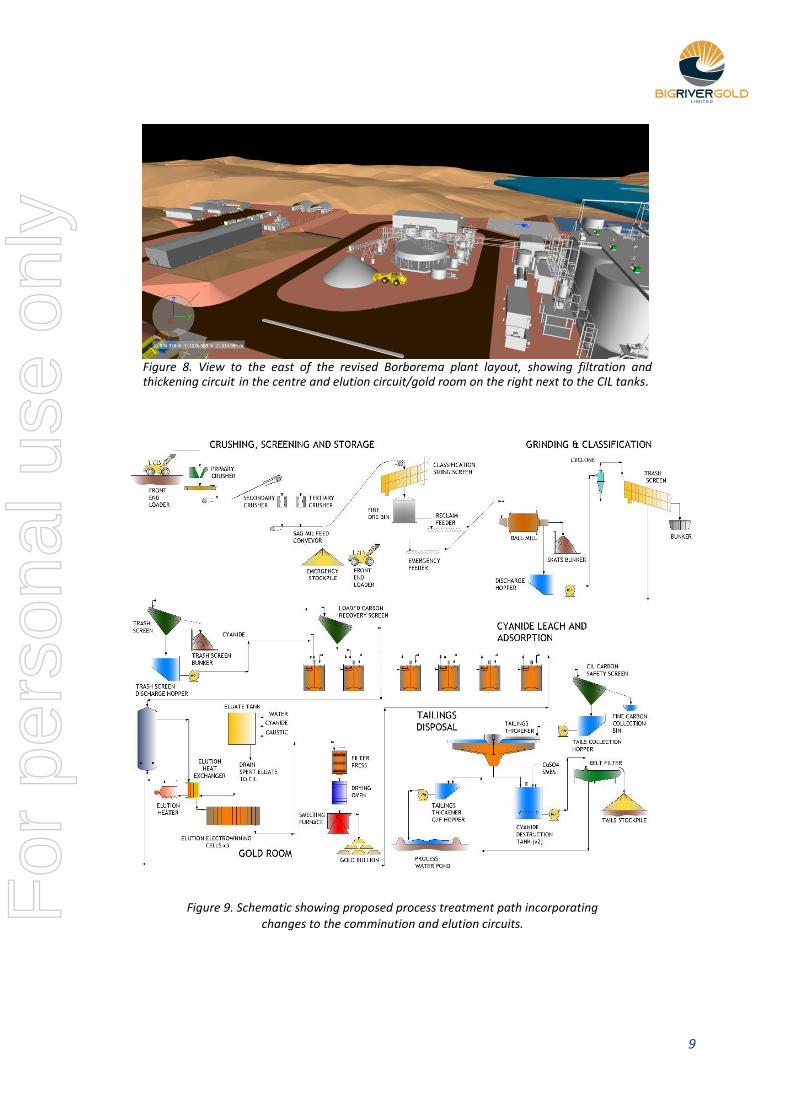
Figure 7. View to the south of the revised Borborema plant layout, showing grinding
circuit, CIL tanks and fine ore bin/emergency stockpile feeder to the left
Elution and gold room
The elution circuit involves the stripping of gold from the carbon in solution from the CIL tanks. Changes that included the replacement of the proposed AARL elution circuit with a Pressure Zadra (PZ) plant were incorporated into this area. There is no discernible difference in layout of an AARL or a pressure Zadra elution plant in terms of footprint. AARL elution is more sophisticated and requires more complex valve and piping arrangements than the PZ as well as a high standard control system. The PZ circuit on the other hand requires longer strip times and has less flexibility but this is considered manageable without large operating cost imposts. However, the decision was taken to go with the PZ circuit because the quality of water required for acceptable AARL elution performance is higher than the PZ circuit which would be better suited to using purified sewage water from Currais Novos which will have a higher level of organics. The PZ circuit also uses less water than the AARL circuit which will improve water conservation.
Water supply
Given the proposed changes to the process circuit a review of the required water was undertaken for the operation. This review confirmed that there is sufficient water for Project requirements in line with the figures released in the DFS.
For
per
sona
l use
onl
y
9
Figure 8. View to the east of the revised Borborema plant layout, showing filtration and thickening circuit in the centre and elution circuit/gold room on the right next to the CIL tanks.
Figure 9. Schematic showing proposed process treatment path incorporating changes to the comminution and elution circuits.
For
per
sona
l use
onl
y
10
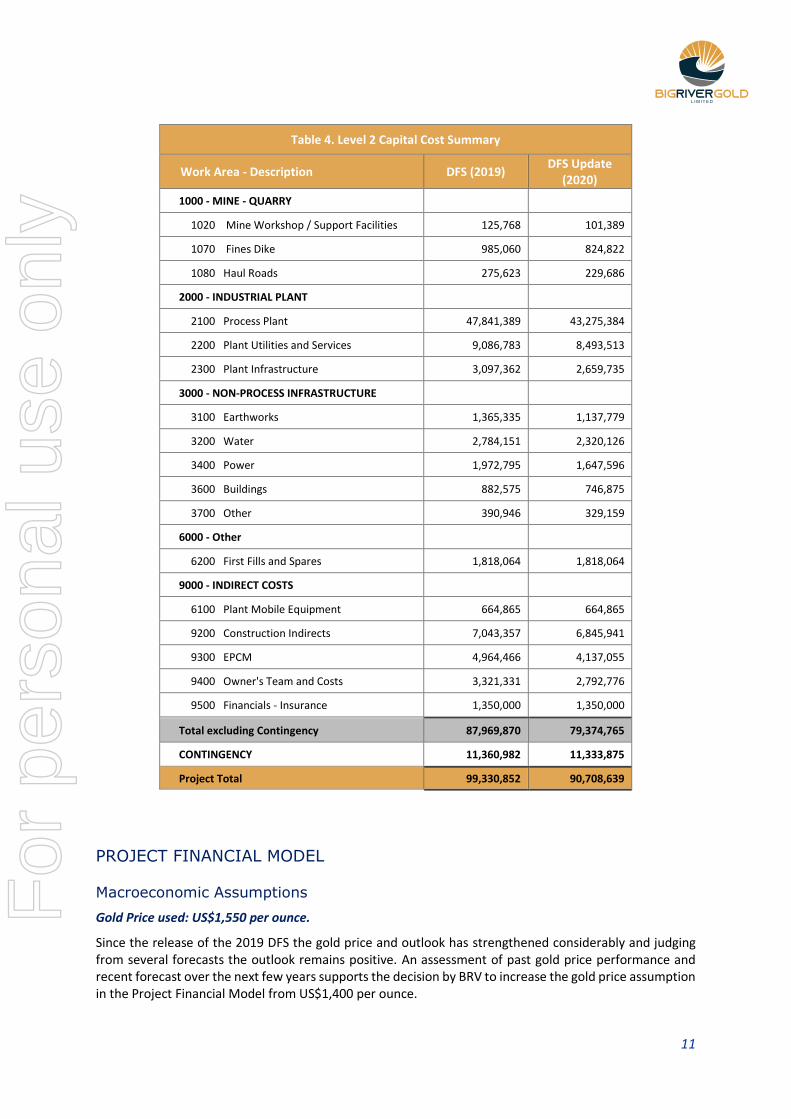
CAPITAL ESTIMATE
Tables 3 to 5 below summarise the revised capital cost estimates for plant and mine construction and compares them to the original 2019 DFS estimate. The total capital cost estimates are within the range of the level of accuracy of the DFS. The basis of the cost estimates, including rates for construction, installation, earthworks, concrete, steel fabrication and mining, remain largely unchanged from the 2019 DFS. Where plant or equipment changed budget pricing has been obtained from suitable suppliers and/or based on pricing achieved in very recent projects. The capital cost estimates include the relevant taxation on purchase, importation and installation and also incorporates those benefits where the company receives an exemption on capital items that cannot be sourced in Brazil or has been granted reduced taxation rates. The ISSQN municipal tax on services was also recently reduced from 5% to 2% due to the importance of the project in the region and forecast levels of employment and has a significant and direct effect on costs of installation and contract services supplied.
The total capital cost has decreased by US$8,622,300 to US$90,708,600 including contingency of US$11,333,800.
Table 2. Capital cost breakdown summary and comparison
Works Area - Description DFS (2019) DFS Update (2020)
Mine – Quarry 1,386,400 1,155,900
Industrial Plant 60,025,500 54,428,600
Non-Process Infrastructure 7,395,800 6,181,500
Other – First Fills and Spares 2,482,900 1,818,000
Indirect Costs 16,679,200 15,790,600
Total, excluding contingency 87,969,900 79,374,800
Contingency 11,361,000 11,333,900
Project Total 99,330,900 90,708,600
Table 3. Capital cost summary by Discipline
Discipline DFS (2019) DFS Update (2020)
Buildings 3,528,915 3,047,709
Concrete 2,839,662 2,429,060
Electrical and Instrumentation 10,739,817 10,571,300
EPCM 8,285,797 6,929,830
Earthworks 7,724,671 4,338,884
Indirect Costs 6,977,132 6,779,716
Mechanical and Platework 34,583,680 33,706,536
Piping and Valves 6,521,105 5,991,645
Structural Steel 6,769,092 5,580,083
Total excluding Contingency 87,969,870 79,374,765
Contingency 11,360,982 11,333,875
Project Total 99,330,852 90,708,639
For
per
sona
l use
onl
y
11
Table 4. Level 2 Capital Cost Summary
Work Area - Description DFS (2019) DFS Update
(2020)
1000 - MINE - QUARRY
1020 Mine Workshop / Support Facilities 125,768 101,389
1070 Fines Dike 985,060 824,822
1080 Haul Roads 275,623 229,686
2000 - INDUSTRIAL PLANT
2100 Process Plant 47,841,389 43,275,384
2200 Plant Utilities and Services 9,086,783 8,493,513
2300 Plant Infrastructure 3,097,362 2,659,735
3000 - NON-PROCESS INFRASTRUCTURE
3100 Earthworks 1,365,335 1,137,779
3200 Water 2,784,151 2,320,126
3400 Power 1,972,795 1,647,596
3600 Buildings 882,575 746,875
3700 Other 390,946 329,159
6000 - Other
6200 First Fills and Spares 1,818,064 1,818,064
9000 - INDIRECT COSTS
6100 Plant Mobile Equipment 664,865 664,865
9200 Construction Indirects 7,043,357 6,845,941
9300 EPCM 4,964,466 4,137,055
9400 Owner's Team and Costs 3,321,331 2,792,776
9500 Financials - Insurance 1,350,000 1,350,000
Total excluding Contingency 87,969,870 79,374,765
CONTINGENCY 11,360,982 11,333,875
Project Total 99,330,852 90,708,639
PROJECT FINANCIAL MODEL
Macroeconomic Assumptions
Gold Price used: US$1,550 per ounce.
Since the release of the 2019 DFS the gold price and outlook has strengthened considerably and judging from several forecasts the outlook remains positive. An assessment of past gold price performance and recent forecast over the next few years supports the decision by BRV to increase the gold price assumption in the Project Financial Model from US$1,400 per ounce.
For
per
sona
l use
onl
y
12
Recent gold price forecasts over the next four years were taken from forecasts completed by Bloomberg (11 June, 2020) for which the average consensus forecast (outliers removed) ranged from US$1,604 to US$1,705 per ounce.
However, for conservatism the Company has elected to use a flat US$1,550 per ounce which is less than the average consensus of recent forecasts and substantially less than current spot prices.
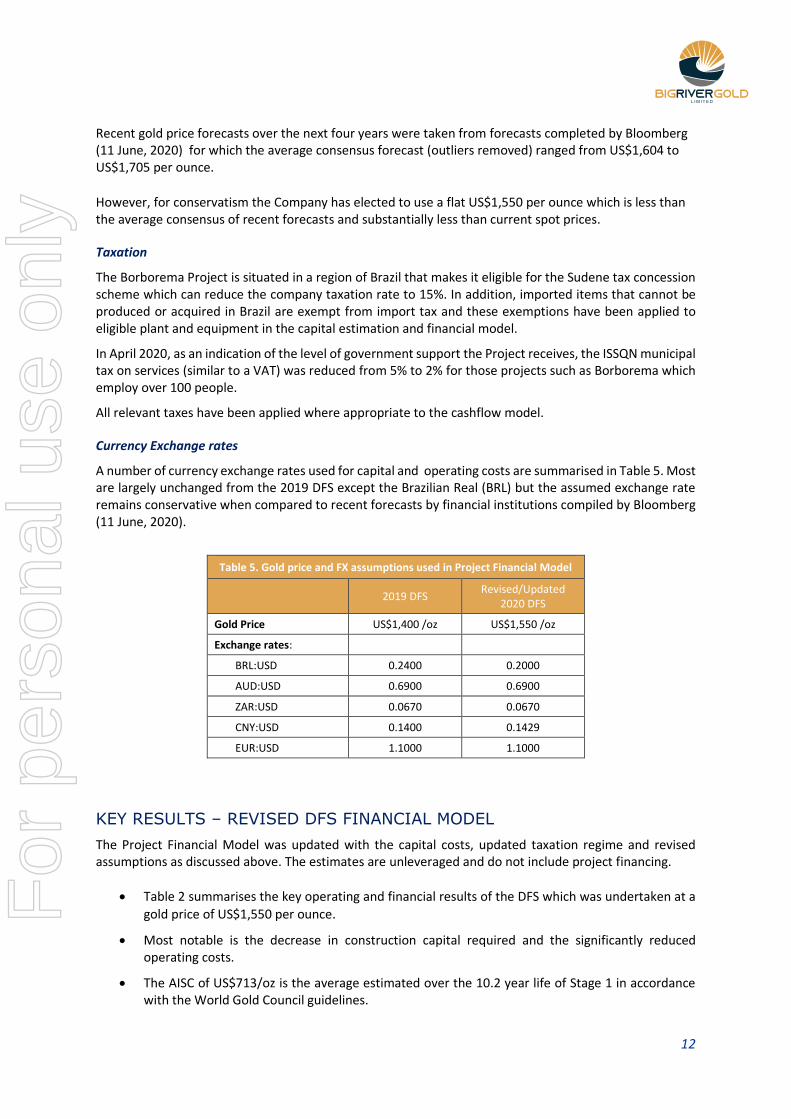
Taxation
The Borborema Project is situated in a region of Brazil that makes it eligible for the Sudene tax concession scheme which can reduce the company taxation rate to 15%. In addition, imported items that cannot be produced or acquired in Brazil are exempt from import tax and these exemptions have been applied to eligible plant and equipment in the capital estimation and financial model.
In April 2020, as an indication of the level of government support the Project receives, the ISSQN municipal tax on services (similar to a VAT) was reduced from 5% to 2% for those projects such as Borborema which employ over 100 people.
All relevant taxes have been applied where appropriate to the cashflow model.
Currency Exchange rates
A number of currency exchange rates used for capital and operating costs are summarised in Table 5. Most are largely unchanged from the 2019 DFS except the Brazilian Real (BRL) but the assumed exchange rate remains conservative when compared to recent forecasts by financial institutions compiled by Bloomberg (11 June, 2020).
Table 5. Gold price and FX assumptions used in Project Financial Model
2019 DFS Revised/Updated
2020 DFS
Gold Price US$1,400 /oz US$1,550 /oz
Exchange rates:
BRL:USD 0.2400 0.2000
AUD:USD 0.6900 0.6900
ZAR:USD 0.0670 0.0670
CNY:USD 0.1400 0.1429
EUR:USD 1.1000 1.1000
KEY RESULTS – REVISED DFS FINANCIAL MODEL
The Project Financial Model was updated with the capital costs, updated taxation regime and revised assumptions as discussed above. The estimates are unleveraged and do not include project financing.
• Table 2 summarises the key operating and financial results of the DFS which was undertaken at a
gold price of US$1,550 per ounce.
• Most notable is the decrease in construction capital required and the significantly reduced operating costs.
• The AISC of US$713/oz is the average estimated over the 10.2 year life of Stage 1 in accordance with the World Gold Council guidelines.
For
per
sona
l use
onl
y
13
• Cash operating costs (C1) by area are summarised in Table 7:
Table 7. Unit cash operating costs (C1)
US$/oz Au US$/t ROM
Mining Cost - Fixed 38.53 1.40
Mining Cost - Variable 187.50 6.82
Processing 164.21 5.97
G&A 143.99 5.24
Total cash cost (C1) 534.23 19.43
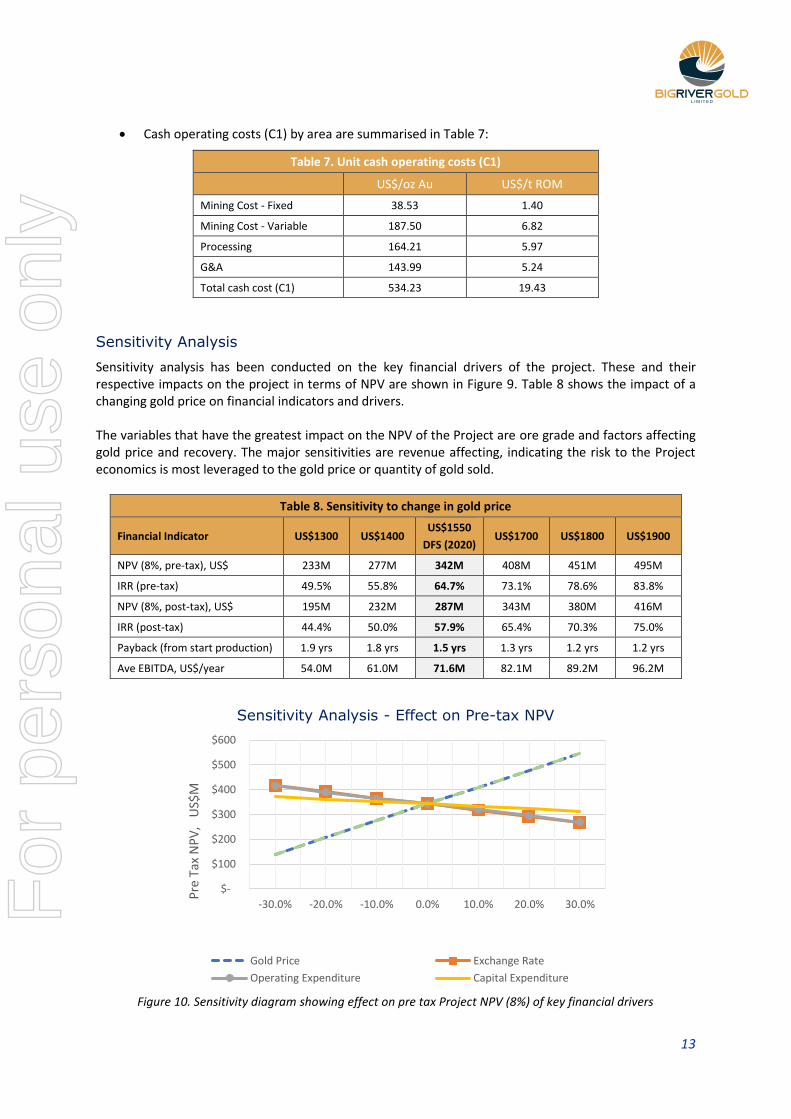
Sensitivity Analysis
Sensitivity analysis has been conducted on the key financial drivers of the project. These and their respective impacts on the project in terms of NPV are shown in Figure 9. Table 8 shows the impact of a changing gold price on financial indicators and drivers. The variables that have the greatest impact on the NPV of the Project are ore grade and factors affecting gold price and recovery. The major sensitivities are revenue affecting, indicating the risk to the Project economics is most leveraged to the gold price or quantity of gold sold.
Table 8. Sensitivity to change in gold price
Financial Indicator US$1300 US$1400 US$1550
DFS (2020) US$1700 US$1800 US$1900
NPV (8%, pre-tax), US$ 233M 277M 342M 408M 451M 495M
IRR (pre-tax) 49.5% 55.8% 64.7% 73.1% 78.6% 83.8%
NPV (8%, post-tax), US$ 195M 232M 287M 343M 380M 416M
IRR (post-tax) 44.4% 50.0% 57.9% 65.4% 70.3% 75.0%
Payback (from start production) 1.9 yrs 1.8 yrs 1.5 yrs 1.3 yrs 1.2 yrs 1.2 yrs
Ave EBITDA, US$/year 54.0M 61.0M 71.6M 82.1M 89.2M 96.2M
Figure 10. Sensitivity diagram showing effect on pre tax Project NPV (8%) of key financial drivers
$-
$100
$200
$300
$400
$500
$600
-30.0% -20.0% -10.0% 0.0% 10.0% 20.0% 30.0%
Pre
Tax
NP
V,
US$
M
Sensitivity Analysis - Effect on Pre-tax NPV
Gold Price Exchange Rate
Operating Expenditure Capital Expenditure
For
per
sona
l use
onl
y
14
On behalf of the Board.
Andrew Richards
Executive Chairman
Big River Gold Ltd
About Big River Gold
Big River Gold Ltd (ASX:BRV), is a mineral exploration and development company listed on the Australian Securities Exchange. Its major focus is the 2.43M ounce Borborema Gold Project in Brazil; a country the Company believes is underexplored and offers high potential for the discovery of world class mineral deposits.
Borborema Gold Project
Borborema is a project with a resource of 2.43Moz gold, located in the Seridó area of the Borborema province in north-eastern Brazil. It is 100% owned by Big River and consists of three mining leases covering a total area of 29 km2 including freehold title over the main prospect area.
The Project benefits from a favourable taxation regime, existing on-site facilities and excellent infrastructure such as buildings, grid power, water and sealed roads. It is close to major cities and regional centres and the services they can provide.
Definitive Feasibility Study (DFS) A DFS for development and construction of Stage 1 of the Borborema Project was completed in December 2019 as detailed in the ASX Announcement of 23 December, 2019. It confirmed the project’s strong economics and optimised a profitable open pit with a mine life of more than 10 years producing approximately 729,000 ounces gold at a C1 cash cost of US$534/oz and AISC of US$713/oz.
Assuming a gold price of US$1,550 per ounce, the pre-tax NPV (8%) returned US$342M with an IRR of 64.7%. The project returns an average EBITDA of US$72M pa.
Competent Person Statements
Borborema mineral resource estimate
The information in this announcement that relates to the mineral resource estimate for the Borborema Project was first reported in accordance with ASX Listing Rule 5.8 on 24 July 2017. Big River confirms that it is not aware of any new information or data that materially affects the information included in the announcement of 24 July 2017 and that all material assumptions and technical parameters underpinning the Mineral Resource estimate continue to apply and have not materially changed.
Borborema ore reserve estimate
The information in this announcement that relates to the Ore Reserve estimate for the Borborema Gold Project was first reported in accordance with ASX Listing Rule 5.9 on 6 March 2018, 29 March 2018 and 11 April 2018. All material assumptions and technical parameters underpinning the Ore Reserve estimate continue to apply or have been updated in the attached JORC Table 1. That portion of the Ore Reserve that was included in the Stage 1 Mining Schedule for the December 2019 Definitive Feasibility Study (DFS) was reviewed by Porfirio Cabaleiro Rodriguez, BSc. (MEng), MAIG of GE21 as part of the DFS. The Ore Reserve was first reported in accordance with ASX Listing Rule 5.9 on 24 July 2017 and updated on 6 March 2018 and is based on information compiled by Mr. Linton Kirk, Competent Person who is a Fellow and Chartered Professional of The Australasian Institute of Mining and Metallurgy. Mr. Kirk is employed by Kirk Mining Consultants Pty Ltd and is an independent consultant to the company.
For
per
sona
l use
onl
y
15
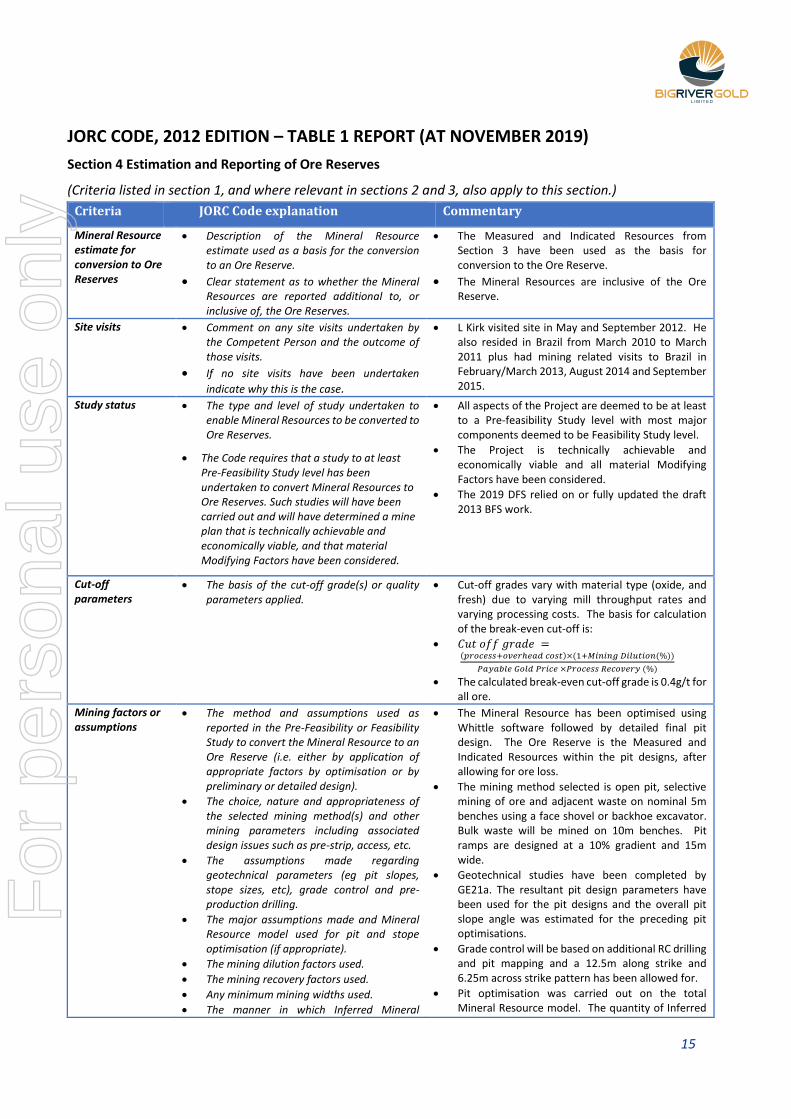
JORC CODE, 2012 EDITION – TABLE 1 REPORT (AT NOVEMBER 2019)
Section 4 Estimation and Reporting of Ore Reserves
(Criteria listed in section 1, and where relevant in sections 2 and 3, also apply to this section.)
Criteria JORC Code explanation Commentary
Mineral Resource estimate for conversion to Ore Reserves
• Description of the Mineral Resource estimate used as a basis for the conversion to an Ore Reserve.
• Clear statement as to whether the Mineral Resources are reported additional to, or inclusive of, the Ore Reserves.
• The Measured and Indicated Resources from Section 3 have been used as the basis for conversion to the Ore Reserve.
• The Mineral Resources are inclusive of the Ore Reserve.
Site visits • Comment on any site visits undertaken by the Competent Person and the outcome of those visits.
• If no site visits have been undertaken
indicate why this is the case.
• L Kirk visited site in May and September 2012. He also resided in Brazil from March 2010 to March 2011 plus had mining related visits to Brazil in February/March 2013, August 2014 and September 2015.
Study status • The type and level of study undertaken to enable Mineral Resources to be converted to Ore Reserves.
• The Code requires that a study to at least Pre-Feasibility Study level has been undertaken to convert Mineral Resources to Ore Reserves. Such studies will have been carried out and will have determined a mine plan that is technically achievable and economically viable, and that material Modifying Factors have been considered.
• All aspects of the Project are deemed to be at least to a Pre-feasibility Study level with most major components deemed to be Feasibility Study level.
• The Project is technically achievable and economically viable and all material Modifying Factors have been considered.
• The 2019 DFS relied on or fully updated the draft 2013 BFS work.
Cut-off parameters
• The basis of the cut-off grade(s) or quality parameters applied.
• Cut-off grades vary with material type (oxide, and fresh) due to varying mill throughput rates and varying processing costs. The basis for calculation of the break-even cut-off is:
• 𝐶𝑢𝑡 𝑜𝑓𝑓 𝑔𝑟𝑎𝑑𝑒 =
(𝑝𝑟𝑜𝑐𝑒𝑠𝑠+𝑜𝑣𝑒𝑟ℎ𝑒𝑎𝑑 𝑐𝑜𝑠𝑡)×(1+𝑀𝑖𝑛𝑖𝑛𝑔 𝐷𝑖𝑙𝑢𝑡𝑖𝑜𝑛(%))
𝑃𝑎𝑦𝑎𝑏𝑙𝑒 𝐺𝑜𝑙𝑑 𝑃𝑟𝑖𝑐𝑒 ×𝑃𝑟𝑜𝑐𝑒𝑠𝑠 𝑅𝑒𝑐𝑜𝑣𝑒𝑟𝑦 (%)
• The calculated break-even cut-off grade is 0.4g/t for all ore.
Mining factors or assumptions
• The method and assumptions used as reported in the Pre-Feasibility or Feasibility Study to convert the Mineral Resource to an Ore Reserve (i.e. either by application of appropriate factors by optimisation or by preliminary or detailed design).
• The choice, nature and appropriateness of the selected mining method(s) and other mining parameters including associated design issues such as pre-strip, access, etc.
• The assumptions made regarding geotechnical parameters (eg pit slopes, stope sizes, etc), grade control and pre-production drilling.
• The major assumptions made and Mineral Resource model used for pit and stope optimisation (if appropriate).
• The mining dilution factors used.
• The mining recovery factors used.
• Any minimum mining widths used.
• The manner in which Inferred Mineral
• The Mineral Resource has been optimised using Whittle software followed by detailed final pit design. The Ore Reserve is the Measured and Indicated Resources within the pit designs, after allowing for ore loss.
• The mining method selected is open pit, selective mining of ore and adjacent waste on nominal 5m benches using a face shovel or backhoe excavator. Bulk waste will be mined on 10m benches. Pit ramps are designed at a 10% gradient and 15m wide.
• Geotechnical studies have been completed by GE21a. The resultant pit design parameters have been used for the pit designs and the overall pit slope angle was estimated for the preceding pit optimisations.
• Grade control will be based on additional RC drilling and pit mapping and a 12.5m along strike and 6.25m across strike pattern has been allowed for.
• Pit optimisation was carried out on the total Mineral Resource model. The quantity of Inferred
For
per
sona
l use
onl
y
16
Criteria JORC Code explanation Commentary
Resources are utilised in mining studies and the sensitivity of the outcome to their inclusion.
• The infrastructure requirements of the selected mining methods.
Resources within the pit shell selected for the final pit design was only 1.4% of the contained Resources.
• The MIK Resource model is a recoverable model and no additional mining dilution has been added.
• Mining recovery allows for a 2% ore loss.
• A minimum mining width at the pit base was 20m however the mineralization horizontal width is mostly greater than 20m.
• Inferred Resources within the pit design contains only 1.4% of total gold resources and has not been considered for Ore Reserve estimates.
• Infrastructure required for the open pit mining operations will comprise mining workshop, mining office, fuel and explosives storage.
Metallurgical factors or assumptions
• The metallurgical process proposed and the appropriateness of that process to the style of mineralisation.
• Whether the metallurgical process is well-tested technology or novel in nature.
• The nature, amount and representativeness of metallurgical test work undertaken, the nature of the metallurgical domaining applied and the corresponding metallurgical recovery factors applied.
• Any assumptions or allowances made for deleterious elements.
• The existence of any bulk sample or pilot scale test work and the degree to which such samples are considered representative of the orebody as a whole.
• For minerals that are defined by a specification, has the ore reserve estimation been based on the appropriate mineralogy to meet the specifications?
• The metallurgical process proposed is conventional carbon-in-leach (CIL) gold extraction.
• All metallurgical processes proposed are all well-tested technology and appropriate for the styles of mineralisation.
• Extensive metallurgical testwork has been undertaken and included: o Preliminary Mineralogy. o Column leach tests. o Bottle roll tests. o Flotation tests. o Leach kinetic tests. o Gravity concentration. o Settling tests. o Bond Work Index. o Cyanide Neutralization. o Grinding pilot plant study. o Tailings filtration
• Metallurgical domaining is into oxides and fresh mineralization, as defined in the Mineral Resource model.
• Gold recoveries are between 93 and 96% depending on the feed grade. Silver recovery after 24 hours is approximately 51%.
• No deleterious elements have been identified.
• Results of the testwork indicate that Borborema material is suitable for grinding in Semi-Autogenous mills and there is unlikely to be a need for pebble crushing to be included. A pilot scale grinding testing programme was established to obtain data that was used as a basis for performing grinding circuit simulations.
Environmental • The status of studies of potential environmental impacts of the mining and processing operation. Details of waste rock characterisation and the consideration of potential sites, status of design options considered and, where applicable, the status of approvals for process residue storage and waste dumps should be reported.
• The major studies incorporated by the Environmental Impact Study (EIA) and Environmental Impact Report (RIMA) included the following: o Physical environment assessment; o Terrestrial fauna and flora inventory survey; o Physical-chemical and bacteriological
analyses of water; o Aquatic fauna and flora inventory survey and
assessment; o Socioeconomic assessment;
For
per
sona
l use
onl
y
17
Criteria JORC Code explanation Commentary
o Analysis of environmental impacts, impact mitigation measures and environmental control programs; and
o Archeological inventory survey.
• Geochemical testing has shown that the Borborema tailings and waste rock are geochemically inert. The results from static geochemical testing and on-site geochemical kinetic testing completed over a period of 2 years show no alkaline drainage risk and no ARD risk from the waste samples. Also, the kinetic cells have not exhibited metals leaching of significant concern.
• Cascar has received the critical Pre‐Licence (Licença Previa or ‘LP’) for its Borborema Gold Project from the Rio Grande do Norte State Government Environmental Department (IDEMA). This is approval of the EIA, based on the reduced project footprint for stage 1 of the project and dry stacked tailings.
• The Installation License (LI) was also approved in April 2019 by IDEMA
Infrastructure • The existence of appropriate infrastructure: availability of land for plant development, power, water, transportation (particularly for bulk commodities), labour, accommodation; or the ease with which the infrastructure can be provided, or accessed.
• Infrastructure is excellent with a sealed highway beside the project area, two existing 230kV power lines, waste water is available from the nearby town of Currais Novos.
• All the land area required for stage 1 of the project is owned by Cascar.
• Currais Novos, population ~45,000, is located 30 km west of the project and provides a full range of commercial services, banking facilities, hotel accommodation, potential staff accommodation, schooling and basic medical and hospital facilities.
Costs • The derivation of, or assumptions made, regarding projected capital costs in the study.
• The methodology used to estimate operating costs.
• Allowances made for the content of deleterious elements.
• The source of exchange rates used in the study.
• Derivation of transportation charges.
• The basis for forecasting or source of treatment and refining charges, penalties for failure to meet specification, etc.
• The allowances made for royalties payable, both Government and private.
• Capital costs were estimated by Wave International and other feasibility study contributors in 2019 as part of the DFS for a 2Mtpa process plant. Capital costs included the mining fleet, mine pre-production costs, process facilities, site infrastructure, tailings filtration, utilities and support facilities and a contingency and totaled USD99M.
• DFS operating costs for mining, treatment and G&A were derived from first principles by GE21 (mining), Wave (treatment and services) and Cascar (G&A).
• In November 2019 the average mining cost was estimated at US$2.72/t mined and the average mill throughput cost (processing plus G&A) was US$12.89t milled.
• As the revenue from gold sales is effectively received in US$ exchange rates for the Brazilian Real and to a much lesser extent other currencies have been used at the prevailing public mid-rate when costs have been estimated.
• Transportation and local freight costs have been provided by international and local suppliers as part of the estimation of capital and operating costs and are well established for projects in Brazil.
• Off-site refining costs have been based on typical rates prevailing in Brazil and are within a small
For
per
sona
l use
onl
y
18
Criteria JORC Code explanation Commentary
range for refining of bars of gold doré.
• The royalty paid to the Brazilian government will be 1.5% of gross revenue. There are no other royalties payable.
Revenue factors • The derivation of, or assumptions made regarding revenue factors including head grade, metal or commodity price(s) exchange rates, transportation and treatment charges, penalties, net smelter returns, etc.
• The derivation of assumptions made of metal or commodity price(s), for the principal metals, minerals and co-products.
• Revenue is based on a US$ gold price and the BRL:USD exchange rate at a specific time to derive the BRL gross revenue/oz. For the DFS, this was US$1,400/oz and a BRL:USD rate of 4.17:1 or BRL5,838/oz.
• No revenue was allowed for silver as it is not material.
Market assessment
• The demand, supply and stock situation for the particular commodity, consumption trends and factors likely to affect supply and demand into the future.
• A customer and competitor analysis along with the identification of likely market windows for the product.
• Price and volume forecasts and the basis for these forecasts.
• For industrial minerals the customer specification, testing and acceptance requirements prior to a supply contract.
• The market for gold is well established and liquid and the price has varied in recent times from a high of around US$1,800/oz in 2011-2012 to a low of around US$1,070 in December 2015. The spot price of gold at the end of December 2019 was US$1,510/oz.
• No formal market assessment or forecast for the gold price or silver price has been undertaken.
Economic • The inputs to the economic analysis to produce the net present value (NPV) in the study, the source and confidence of these economic inputs including estimated inflation, discount rate, etc.
• NPV ranges and sensitivity to variations in the significant assumptions and inputs.
• The main tool used for the analysis is an Excel-based discounted cash-flow model used by Wave, including full allowance for all taxes, sustaining capital and mine closure costs. Revenue, exchange rates and key cost inputs were as covered above. The discount rate used in the 2019 DFS was 8%.
• An NPV of US$203M post tax was estimated based on all key inputs adjusted for November 2019. The project is most sensitive to revenue (gold price, ore grade, BRL:USD exchange rate and processing recovery).
Social • The status of agreements with key stakeholders and matters leading to social licence to operate.
• Strong support for the project has been received from both the environmental agency, local municipal council, the State Government of Rio Grande do Norte and the local community, as demonstrated with the approval of the EIA. (refer ASX release 20 April 2017) and granting of both LP and LI.
Other • To the extent relevant, the impact of the following on the project and/or on the estimation and classification of the Ore Reserves:
• Any identified material naturally occurring risks.
• The status of material legal agreements and marketing arrangements.
• The status of governmental agreements and approvals critical to the viability of the project, such as mineral tenement status, and government and statutory approvals. There must be reasonable grounds to expect that all necessary Government approvals will be received within the timeframes
• No material naturally occurring risks have been identified.
• No material legal or marketing agreements are required to be entered into.
• With the key environmental licenses now received, Cascar will work to fulfil the standard conditions of the LP, which have largely already been achieved. Work will also comply with the granted “Installation Licence” (Licença de Instalação or LI).
•
For
per
sona
l use
onl
y
19
Criteria JORC Code explanation Commentary
anticipated in the Pre-Feasibility or Feasibility study. Highlight and discuss the materiality of any unresolved matter that is dependent on a third party on which extraction of the reserve is contingent.
Classification • The basis for the classification of the Ore Reserves into varying confidence categories.
• Whether the result appropriately reflects the Competent Person’s view of the deposit.
• The proportion of Probable Ore Reserves that have been derived from Measured Mineral Resources (if any).
• Measured Resources have been converted to Proved Reserves. Indicated Resources have been converted to Probable Reserves.
• The estimated Ore Reserves are, in the opinion of the Competent Persons, appropriate for these deposits.
• No Measured Resources have been classified as Probable Reserves.
Audits or reviews • The results of any audits or reviews of Ore Reserve estimates.
• GE21 has reviewed the portion of the Ore Reserve that is part of the Stage 1 development.
Discussion of relative accuracy/ confidence
• Where appropriate a statement of the relative accuracy and confidence level in the Ore Reserve estimate using an approach or procedure deemed appropriate by the Competent Person. For example, the application of statistical or geostatistical procedures to quantify the relative accuracy of the reserve within stated confidence limits, or, if such an approach is not deemed appropriate, a qualitative discussion of the factors which could affect the relative accuracy and confidence of the estimate.
• The statement should specify whether it relates to global or local estimates, and, if local, state the relevant tonnages, which should be relevant to technical and economic evaluation. Documentation should include assumptions made and the procedures used.
• Accuracy and confidence discussions should extend to specific discussions of any applied Modifying Factors that may have a material impact on Ore Reserve viability, or for which there are remaining areas of uncertainty at the current study stage.
• It is recognised that this may not be possible or appropriate in all circumstances. These statements of relative accuracy and confidence of the estimate should be compared with production data, where available.
• As detailed above the Ore Reserve has been based on the draft 2013 feasibility study, subsequent work and the work completed as part of the DFS for Stage 1 of the project. All aspects of the Project are currently at least to a Pre-Feasibility Study level of accuracy and confidence.
• The Modifying Factors included consideration of mining, processing, metallurgical, infrastructure, economic, gold price, legal, environmental, social and governmental factors as detailed in sections above. The Project viability is most susceptible to gold price.
• The previous production data of heap leach operations in the 1980’s and 1990’s is very limited and not relevant to the planned new project.
F
or p
erso
nal u
se o
nly


