For personal use only - ASX · 2017-08-29 · o Speedcast CEO, Pierre-Jean Beylier received Finance...
24
1 SpeedCast International Limited ACN 600 699 241 Appendix 4D and Financial Statements for the Half Year Ended 30 June 2017 For personal use only
Transcript of For personal use only - ASX · 2017-08-29 · o Speedcast CEO, Pierre-Jean Beylier received Finance...

1
SpeedCast International Limited
ACN 600 699 241
Appendix 4D and Financial Statements for the
Half Year Ended 30 June 2017
For
per
sona
l use
onl
y

2
APPENDIX 4D
For the half year ended 30 June 2017
Results for Announcement to the Market
All comparisons are to the half year ended 30 June 2016 unless otherwise stated.
All amounts are in US$ million unless otherwise specified.
2017US$ million
Up/Down Movement%
Revenue from ordinary activities 246.3 Up 143%
Loss after tax from ordinary activities attributable to the owners of the Company (5.7) Down (202%)
Dividend InformationAmount per share(AUD cents)
Franked %per share
Final dividend for 2016 (paid on 11 April 2017) 2.40 100
Proposed interim dividend for 2017 2.40 100
On 28 August 2017, the Board approved an interim dividend of AUD 2.40 cents per share for the six months ended30 June 2017. The dividend will be paid on 13 October 2017 to all shareholders registered on the record date of 11September 2017. The ex-dividend date for dividend entitlement will be 12 September 2017. The dividend will be fullyfranked for Australian taxation purposes.
No dividend reinvestment plan was in operation during the half year ended 30 June 2017.
For
per
sona
l use
onl
y
3
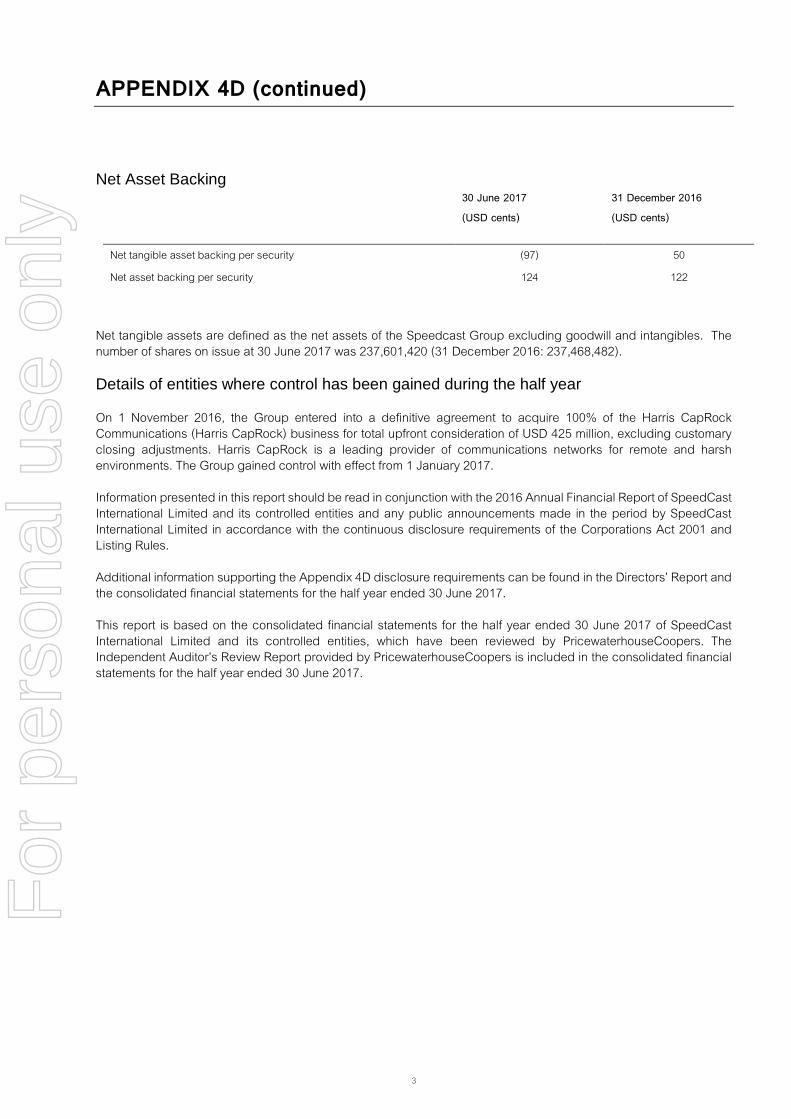
APPENDIX 4D (continued)
Net Asset Backing30 June 2017(USD cents)
31 December 2016(USD cents)
Net tangible asset backing per security
Net asset backing per security
(97)
124
50
122
Net tangible assets are defined as the net assets of the Speedcast Group excluding goodwill and intangibles. Thenumber of shares on issue at 30 June 2017 was 237,601,420 (31 December 2016: 237,468,482).
Details of entities where control has been gained during the half year
On 1 November 2016, the Group entered into a definitive agreement to acquire 100% of the Harris CapRockCommunications (Harris CapRock) business for total upfront consideration of USD 425 million, excluding customaryclosing adjustments. Harris CapRock is a leading provider of communications networks for remote and harshenvironments. The Group gained control with effect from 1 January 2017.
Information presented in this report should be read in conjunction with the 2016 Annual Financial Report of SpeedCastInternational Limited and its controlled entities and any public announcements made in the period by SpeedCastInternational Limited in accordance with the continuous disclosure requirements of the Corporations Act 2001 andListing Rules.
Additional information supporting the Appendix 4D disclosure requirements can be found in the Directors’ Report andthe consolidated financial statements for the half year ended 30 June 2017.
This report is based on the consolidated financial statements for the half year ended 30 June 2017 of SpeedCastInternational Limited and its controlled entities, which have been reviewed by PricewaterhouseCoopers. TheIndependent Auditor’s Review Report provided by PricewaterhouseCoopers is included in the consolidated financialstatements for the half year ended 30 June 2017.
For
per
sona
l use
onl
y

4
DIRECTORS’ REPORT
The Directors present their report together with the consolidated financial statements of SpeedCast InternationalLimited (Speedcast or the Company) and its subsidiaries (together referred to as the Group), for the half year ended30 June 2017 and the auditor’s report thereon.
About SpeedCast International Limited
Speedcast (ASX: SDA) is the world’s most trusted provider of highly reliable, fully managed, end-to end remotecommunication and IT solutions. The Company utilises an extensive worldwide footprint of local support,infrastructure and coverage to design, integrate, secure and optimise networks tailored to customer needs. Withdifferentiated technology, an intense customer focus and a strong safety culture, Speedcast serves more than 2,000customers in over 140 countries via 39 teleports, including offshore rigs and cruise ships, 10,000+ maritime vesselsand 4,500+ terrestrial sites. Speedcast supports mission-critical applications in industries such as maritime, oil andgas, enterprise, media, cruise and government. Learn more at www.speedcast.com.
Information on Directors
The names of each person who has been a director during the half year and to the date of this report are:John MackayPierre-Jean BeylierMichael BerkGrant FergusonPeter JacksonMichael MaloneEdward Sippel
Review of Operations
Highlights
Group revenue grew 143% to USD 246.3 million for the period ended 30 June 2017, while services revenuegrew 165% to USD 231.9 million;
Underlying EBITDA profitability was USD 52.8 million, a 210% increase over the same period last year; Underlying NPATA, excluding non-recurring costs, was USD 15.1 million, an increase of 86% period-on-period; The Board declared a fully franked interim dividend of AUD 2.40 cents per share for the half year period ended
30 June 2017, consistent with the final dividend for 2016 and utilising the maximum amount of franking credits; On 1 January 2017, Speedcast completed the acquisition of Harris CapRock. The acquisition positions
Speedcast to be the global leader with market leading positions in the key markets of energy, maritime, andenterprise;
On 23 July 2017, Speedcast entered into definitive agreement to acquire UltiSat for a purchase considerationof up to USD 100 million. This acquisition will create a fourth pillar of growth for Speedcast, within thegovernment and defence sector;
As of 30 June 2017, Speedcast had completed 75% of the Harris CapRock integration work streams to buildone Speedcast. Key initiatives remaining include ERP implementation, full integration of the ticketing system,and further network consolidation;
Speedcast had a 100% renewal rate within the energy sector for the first half of the year. Speedcast ispositioning itself to be the partner of choice to lead customers through the recovery;
For
per
sona
l use
onl
y
5
DIRECTORS’ REPORT (continued)
Review of Operations (continued)
The maritime division has made much progress in the integration of the cruise business, while establishingrelationships with key customers. In addition, a successful pilot was completed demonstrating > 400 Mbps toone cruise ship;
Speedcast is experiencing a strong win rate within the cellular backhaul market. Cellular Backhaul is expectedto be one of the fundamental growth areas in the satellite industry for the next 10 years with double digit CAGRgrowth expected (Source: NSR); and
Speedcast’s services and commitment to excellence is also being recognised by industry authorities. In 1H2017, Speedcast were awarded industry recognitions including:
o 2017 World Teleport Association’s (WTA) Independent Teleport Operator of the Year; ando Speedcast CEO, Pierre-Jean Beylier received Finance Monthly CEO Award 2017.
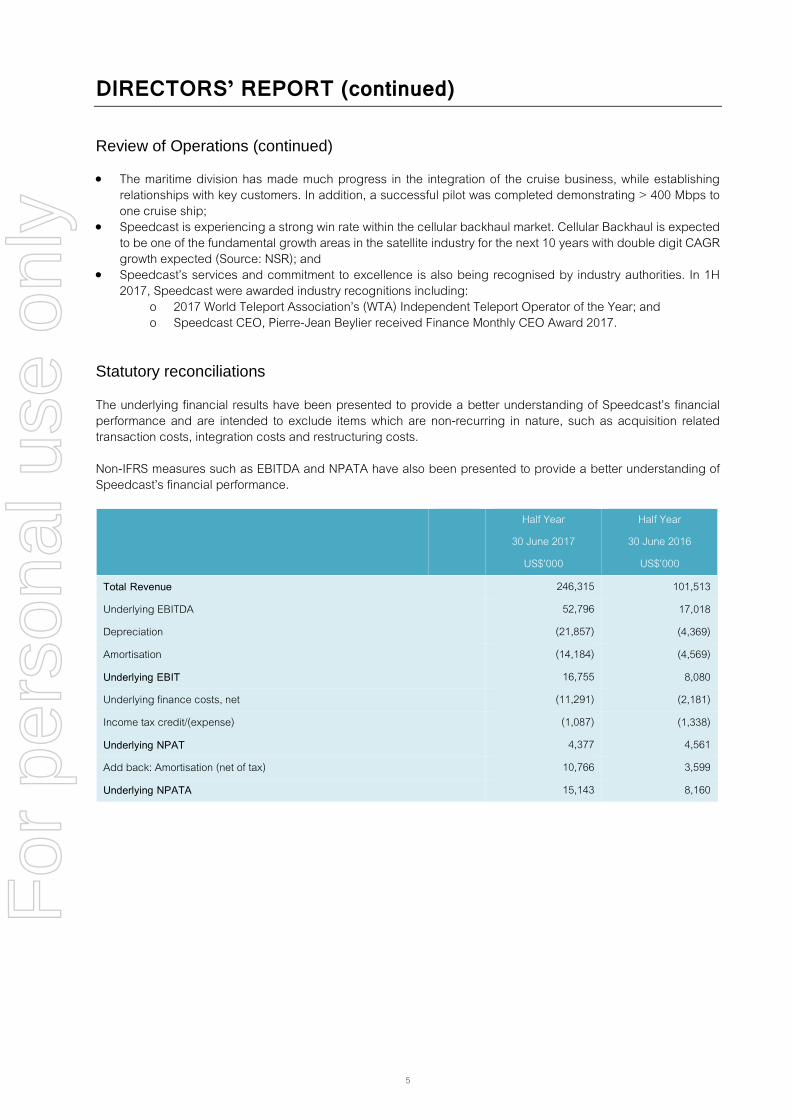
Statutory reconciliations
The underlying financial results have been presented to provide a better understanding of Speedcast’s financialperformance and are intended to exclude items which are non-recurring in nature, such as acquisition relatedtransaction costs, integration costs and restructuring costs.
Non-IFRS measures such as EBITDA and NPATA have also been presented to provide a better understanding ofSpeedcast’s financial performance.
Half Year
30 June 2017
US$’000
Half Year
30 June 2016
US$’000
Total Revenue 246,315 101,513
Underlying EBITDA 52,796 17,018
Depreciation (21,857) (4,369)
Amortisation (14,184) (4,569)
Underlying EBIT 16,755 8,080
Underlying finance costs, net (11,291) (2,181)
Income tax credit/(expense) (1,087) (1,338)
Underlying NPAT 4,377 4,561
Add back: Amortisation (net of tax) 10,766 3,599
Underlying NPATA 15,143 8,160
For
per
sona
l use
onl
y

6
DIRECTORS’ REPORT (continued)
Statutory reconciliations (continued)
Half Year
30 June 2017
US$’000
Half Year
30 June 2016
US$’000
Statutory revenue 246,315 101,513
Statutory net (loss)/profit after tax attributable to owners of the company (5,737) 5,617
Acquisition related costs 5,953 585
Integration costs 764 -
Restructuring costs 3,646 -
Fair value (gain)/loss on deferred consideration 550 (1,916)
ST Teleport consideration – finance costs - 275
Unwinding of fair value adjustments on Harris CapRock acquisition – finance cost 414 -
Tax effect of above items (1,213) -
Underlying NPAT 4,377 4,561
Add back: Amortisation (net of tax) 10,766 3,599
Underlying NPATA 15,143 8,160
Analysis of statutory to underlying reconciliations
There was no difference between underlying and statutory revenue; Acquisition related costs such as due diligence, M&A, consultants and legal fees totalling USD 6.0 million have
been excluded from the underlying financial results. These largely relate to the Harris CapRock acquisitioncompleted on 1 January 2017;
As forewarned in the Harris CapRock acquisition announcement, one-time integration and restructuring costswere expected to be incurred to deliver the cost synergy benefits of USD 15 million in year 1 and USD 24 millionin year 2 outlined in the investment case. In 1H 2017, USD 4.4 million of additional costs have been incurred inrelation to these activities;
A fair value loss was recorded in relation to the deferred contingent consideration of SAIT CommunicationsLimited, due to its better than forecast revenue growth since acquisition;
Finance costs of USD 0.4 million associated with the unwinding of fair value provisions booked on the acquisitionof Harris CapRock have been included in the statutory income statement in 1H 2017;
The collective tax impact of the above adjustments is a tax credit of USD 1.2 million; Underlying NPAT for the period after these adjustments was USD 4.4 million; and After adding back the amortisation of intangibles (net of tax) the underlying NPATA of the Group rises to USD
15.1 million compared with USD 8.2 million in 1H 2016.
For
per
sona
l use
onl
y
7
DIRECTORS’ REPORT (continued)
Auditor's independence declaration
A copy of the auditor’s independence declaration as required under section 307C of the Corporations Act 2001 isset out on page 8.
Rounding of amounts
The Company is of a kind referred to in the ASIC Corporations (Rounding in Financial/Directors’ Reports) Instrument2016/191 issued by the Australian Securities and Investments Commission, relating to the “rounding off” of amountsin the Directors’ Report and financial statements. Amounts in the Directors’ Report and financial report have beenrounded off in accordance with that class order to the nearest thousand dollars.
This Directors’ Report is signed in accordance with a resolution of the Board of Directors.
Pierre-Jean BeylierChief Executive Officer, Executive Director29 August 2017
For
per
sona
l use
onl
y

PricewaterhouseCoopers, ABN 52 780 433 757Level 11, 70 Franklin Street, ADELAIDE SA 5000, GPO Box 418, ADELAIDE SA 5001T: +61 8 8218 7000, F: +61 8 8218 7999, www.pwc.com.au
Liability limited by a scheme approved under Professional Standards Legislation.
Auditor’s Independence Declaration
As lead auditor for the review of SpeedCast International Limited for the half-year ended 30 June2017, I declare that to the best of my knowledge and belief, there have been:
(a) no contraventions of the auditor independence requirements of the Corporations Act 2001 inrelation to the review; and
(b) no contraventions of any applicable code of professional conduct in relation to the review.
This declaration is in respect of SpeedCast International Limited and the entities it controlled duringthe period.
Andrew Forman AdelaidePartnerPricewaterhouseCoopers
29 August 2017
For
per
sona
l use
onl
y
9
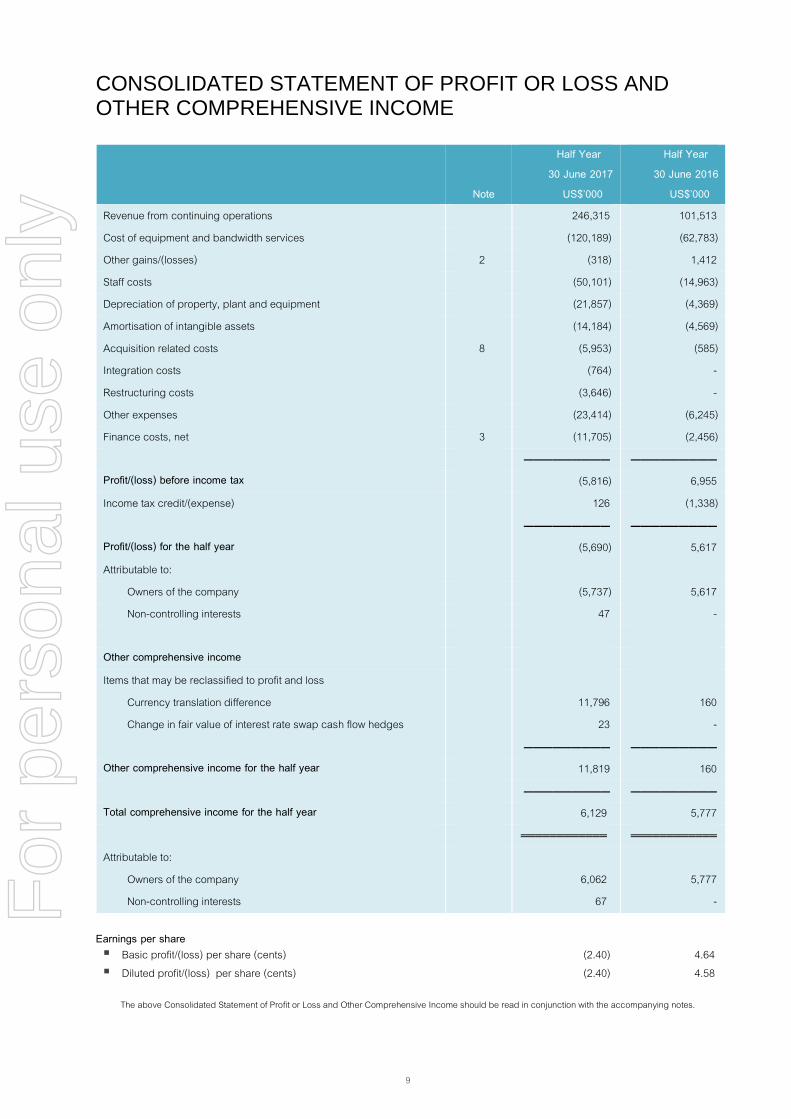
CONSOLIDATED STATEMENT OF PROFIT OR LOSS ANDOTHER COMPREHENSIVE INCOME
Note
Half Year30 June 2017
US$’000
Half Year30 June 2016
US$’000
Revenue from continuing operations 246,315 101,513
Cost of equipment and bandwidth services (120,189) (62,783)
Other gains/(losses) 2 (318) 1,412
Staff costs (50,101) (14,963)
Depreciation of property, plant and equipment (21,857) (4,369)
Amortisation of intangible assets (14,184) (4,569)
Acquisition related costs 8 (5,953) (585)
Integration costs (764) -
Restructuring costs (3,646) -
Other expenses (23,414) (6,245)
Finance costs, net 3 (11,705) (2,456)
───────── ─────────Profit/(loss) before income tax (5,816) 6,955
Income tax credit/(expense) 126 (1,338)
───────── ─────────Profit/(loss) for the half year (5,690) 5,617
Attributable to:
Owners of the company (5,737) 5,617
Non-controlling interests 47 -
Other comprehensive income
Items that may be reclassified to profit and loss
Currency translation difference 11,796 160
Change in fair value of interest rate swap cash flow hedges 23 -
───────── ─────────Other comprehensive income for the half year 11,819 160
───────── ─────────Total comprehensive income for the half year 6,129 5,777
════════════ ════════════
Attributable to:
Owners of the company 6,062 5,777
Non-controlling interests 67 -
Earnings per share Basic profit/(loss) per share (cents) (2.40) 4.64 Diluted profit/(loss) per share (cents) (2.40) 4.58
The above Consolidated Statement of Profit or Loss and Other Comprehensive Income should be read in conjunction with the accompanying notes.
For
per
sona
l use
onl
y
10
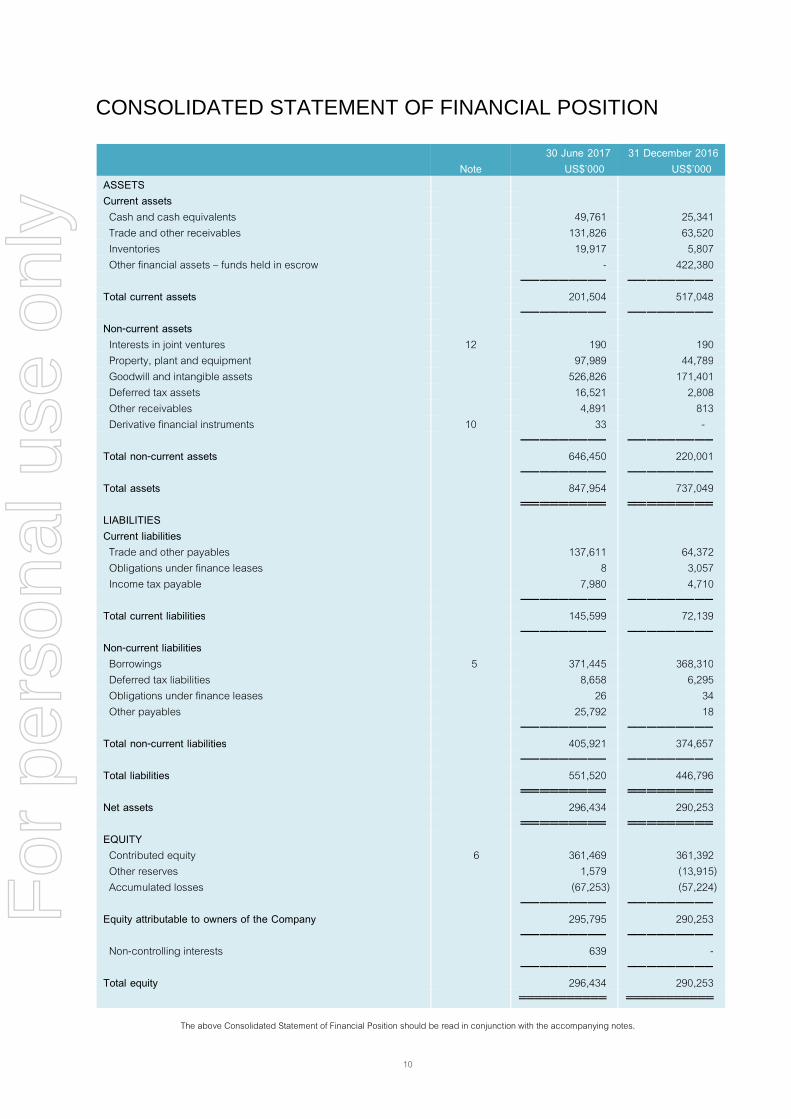
CONSOLIDATED STATEMENT OF FINANCIAL POSITION
Note30 June 2017
US$’00031 December 2016
US$’000ASSETSCurrent assetsCash and cash equivalents 49,761 25,341Trade and other receivables 131,826 63,520Inventories 19,917 5,807Other financial assets – funds held in escrow - 422,380
───────── ─────────Total current assets 201,504 517,048
───────── ─────────Non-current assetsInterests in joint ventures 12 190 190Property, plant and equipment 97,989 44,789Goodwill and intangible assets 526,826 171,401Deferred tax assets 16,521 2,808Other receivables 4,891 813Derivative financial instruments 10 33 -
───────── ─────────Total non-current assets 646,450 220,001
───────── ─────────Total assets 847,954 737,049
═════════ ═════════LIABILITIESCurrent liabilitiesTrade and other payables 137,611 64,372Obligations under finance leases 8 3,057Income tax payable 7,980 4,710
───────── ─────────Total current liabilities 145,599 72,139
───────── ─────────Non-current liabilitiesBorrowings 5 371,445 368,310Deferred tax liabilities 8,658 6,295Obligations under finance leases 26 34Other payables 25,792 18
───────── ─────────Total non-current liabilities 405,921 374,657
───────── ─────────Total liabilities 551,520 446,796
═════════ ═════════Net assets 296,434 290,253
═════════ ═════════EQUITYContributed equity 6 361,469 361,392Other reserves 1,579 (13,915)Accumulated losses (67,253) (57,224)
───────── ─────────Equity attributable to owners of the Company 295,795 290,253
───────── ─────────Non-controlling interests 639 -
───────── ─────────Total equity 296,434 290,253
═══════════ ═══════════
The above Consolidated Statement of Financial Position should be read in conjunction with the accompanying notes.
For
per
sona
l use
onl
y

11
CONSOLIDATED STATEMENT OF CHANGES IN EQUITY
Attributable to owners of SpeedCast International LimitedNon-
controllinginterests Total equity
Contributedequity
Accumulatedlosses
Otherreserves
Total
US$’000 US$’000 US$’000 US$’000 US$’000 US$’000
Balance at 1 January 2016 84,892 (56,478) (1,171) 27,243 - 27,243
Profit for the half year - 5,617 - 5,617 - 5,617Other comprehensive income - - 160 160 - 160
─────── ─────── ────── ───── ────── ──────Total comprehensive income - 5,617 160 5,777 - 5,777
─────── ─────── ────── ───── ────── ──────Dividend (note 7) - (3,292) - (3,292) - (3,292)Issue of ordinary shares 2,081 - - 2,081 - 2,081Capital raising costs, net of tax - - - - - -Employee share scheme – issue of
shares73 - (73) - - -
Employee share scheme – value ofemployee services
- - 167 167 - 167
─────── ─────── ────── ───── ────── ──────2,154 (3,292) 94 (1,044) - (1,044)
─────── ─────── ────── ───── ────── ──────Balance at 30 June 2016 87,046 (54,153) (917) 31,976 - 31,976
═══════ ═══════ ══════ ═════ ══════ ══════Balance at 1 January 2017 361,392 (57,224) (13,915) 290,253 - 290,253
Profit/(loss) for the half year - (5,737) - (5,737) 47 (5,690)Other comprehensive income - - 11,799 11,799 20 11,819
─────── ─────── ────── ───── ────── ──────Total comprehensive profit - (5,737) 11,799 6,062 67 6,129
─────── ─────── ────── ───── ────── ──────Shares to be issued in relation to SAIT
deferred consideration (note 9)- - 3,150 3,150 - 3,150
Business combination (note 8) - - - - 572 572Dividend (note 7) - (4,292) - (4,292) - (4,292)Employee share scheme – issue of
shares (note 6)77 - (77) - - -
Employee share scheme – value ofemployee services
- - 622 622 - 622
─────── ─────── ────── ───── ────── ──────77 (4,292) 3,695 (520) 572 52
─────── ─────── ────── ───── ────── ──────Balance at 30 June 2017 361,469 (67,253) 1,579 295,759 639 296,434
═══════ ═══════ ══════ ═════ ══════ ══════
The above Consolidated Statement of Changes in Equity should be read in conjunction with the accompanying notes.
For
per
sona
l use
onl
y

12
CONSOLIDATED STATEMENT OF CASH FLOWS
Note
Half Year30 June 2017
US$’000
Half Year30 June 2016
US$’000
Cash flows from operating activitiesCash receipts from customers 261,536 103,163Cash paid to suppliers (215,312) (86,761)Interest paid (5,006) (1,984)Interest received 8 13Taxes paid (3,888) (947)
───────── ─────────Net cash inflows from operating activities 37,338 13,484
───────── ─────────Cash flows from investing activities
Payments for acquisition of businesses, net of cash acquired 8 (413,047) (11,674)Receipt of funds held in escrow 422,380 -Business acquisition transaction costs (7,384) (1,215)Payments for property, plant and equipment (10,054) (5,352)Payments for intangible assets (1,395) (982)Proceeds from disposal of property, plant and equipment 2,160 -
───────── ─────────Net cash (outflows) from investing activities (7,340) (19,223)
───────── ─────────Cash flows from financing activities
Proceeds from issuance of ordinary shares - -Transaction costs of issuance of ordinary shares (550) -Proceeds from borrowings, net of transaction costs 1,799 19,950Dividend paid 7 (4,292) (3,292)Repayments of obligations under finance leases (3,059) (25)
───────── ─────────Net cash (outflows)/inflows from financing activities (6,102) 16,633
───────── ─────────
Net increase in cash and cash equivalents 23,896 10,894
Cash and cash equivalents at beginning of the year 25,341 15,114
Effects of exchange rate changes on cash and cash equivalents 524 131───────── ─────────
Cash and cash equivalents at the end of the half year 49,761 26,139═════════ ═════════
The above Consolidated Statement of Cash Flows should be read in conjunction with the accompanying notes.
For
per
sona
l use
onl
y
13
NOTES TO THE CONSOLIDATED FINANCIAL STATEMENTS
1 Basis of preparation
This condensed consolidated interim financial report for the half year reporting period ended 30 June 2017 hasbeen prepared in accordance with Accounting Standard AASB 134 Interim Financial Reporting and theCorporations Act 2001.
This condensed consolidated interim financial report does not include all the notes of the type normally includedin an annual financial report. Accordingly, this report is to be read in conjunction with the annual report for theyear ended 31 December 2016 and any public announcements made by SpeedCast International Limited (“theCompany”) during the interim reporting period in accordance with the continuous disclosure requirements ofthe Corporations Act 2001.
The accounting policies adopted are consistent with those of the previous financial year and correspondinginterim reporting period.
SpeedCast International Limited is a company domiciled and incorporated in Australia. The half year financialstatements are for the consolidated entity consisting of the Company and its subsidiaries (together referred toas “Speedcast” or the “Group”).
The half year financial statements were authorised for issuance by the Board of Directors on 29 August 2017.
New and amended standards and interpretations adopted by the GroupThe Company adopted the following new or revised accounting standards which are relevant to the Group andbecame effective for the reporting period commencing on 1 January 2017:
AASB 2016-1: Recognition of Deferred Tax Assets for Unrealised Losses; AASB 2016-2: Disclosure Initiative: Amendments to AASB 107; and AASB 2017-2: Further Annual improvements 2014-16.
While these new standards introduce new disclosure requirements within the annual report, they do not affectthe Group’s accounting policies or any of the amounts recognised in the financial statements.
For
per
sona
l use
onl
y

14
NOTES TO THE CONSOLIDATED FINANCIAL STATEMENTS
2 Other gains/(losses)
Half Year
30 June 2017
US$’000
Half Year
30 June 2016
US$’000
Foreign exchange gain/(loss) 370 (504)Gain/(loss) on disposal of property, plant and equipment (138) -Fair value gain/(loss) on deferred consideration (550) 1,916
─────── ───────Other gains/(losses) (318) 1,412
═══════ ═══════
3 Finance costs, net
Half Year
30 June 2017
US$’000
Half Year
30 June 2016
US$’000
Finance income 8 12Finance expense (11,713) (2,468)
─────── ───────Finance costs, net (11,705) (2,456)
═══════ ═══════
For
per
sona
l use
onl
y

15
NOTES TO THE CONSOLIDATED FINANCIAL STATEMENTS
4 Operating Segments
Identification of reportable segmentsThe Group has identified its operating segment based on the reports reviewed by the Chief Executive Officer(“CEO”) that are used to make strategic decisions. The Group consists of one operating segment being thesale of broadband access services.
Geographical informationThe table below presents geographical information of total revenue based on customers’ geography and, wherethat relates to a vessel, is included in the Maritime category.
Maritime AustraliaPacificIslands
EMEA andother Asia Americas Total
US$’000 US$’000 US$’000 US$’000 US$’000 US$’000 US$’000Half year ended 30 June 2017 96,917 20,444 18,724 22,938 10,241 77,051 246,315
════ ════ ════ ════ ════ ════ ════Half year ended 30 June 2016 29,422 23,429 18,425 14,188 13,631 2,418 101,513
════ ════ ════ ════ ════ ════ ════
The table below presents geographical information of the Group’s non-current assets.
MaritimeUS$’000
AustraliaUS$’000
PacificIslands
US$’000
EMEA andother
US$’000Asia
US$’000AmericasUS$’000
TotalUS$’000
As at 30 June 2017Property, plant and equipment 14,920 10,624 1,128 11,787 27,943 31,587 97,989
════ ════ ════ ═════ ═════ ════ ════As at 31 December 2016Property, plant and equipment 3,232 8,823 1,044 4,412 25,786 1,492 44,789
════ ════ ════ ═════ ═════ ════ ════
Major customers
There are no individual customers who contributed more than 10% of the total revenue in the current orcomparative period.
For
per
sona
l use
onl
y

16
NOTES TO THE CONSOLIDATED FINANCIAL STATEMENTS
5 Borrowings
On 27 December 2016, the Group entered into a new syndicated facility of USD 385 million with Credit SuisseAG and ING Bank. As at 31 December 2016, USD 381.2 million was drawn in USD. The balance, along withexisting cash, was used to fund the acquisition of Harris CapRock Communications (Harris CapRock), whichwas settled in 2017. Refer to note 8 for further details regarding this acquisition.
Significant terms and conditions
The credit lines are subject to the completion of affirmative and negative covenants, including the commitmentnot to exceed certain financial ratios semi-annually, commencing from 30 June 2017. The covenants includethe following ratios, which are contractually defined in the agreement:
(a) The ratio of pro forma EBITDA to net interest expenses; and(b) The ratio of net debt to pro forma EBITDA.
The Group has complied with these covenants during the period.
Interest payable on the new facility is subject to a floating margin rate. This exposes the Group to interest raterisk. To hedge this risk, and as a requirement of the syndicated debt facility agreement, the Group has enteredinto interest rate swaps in the period to 30 June 2017, refer to note 10.
Interest-bearing bank loans are due for payment as follows:
30 June 2017US$’000
31 December 2016US$’000
Portion of bank loans due for repayment within one year - -After 1 year but within 2 years - -After 2 years but within 5 years 382,972 381,173Less: Prepaid facility fees (11,527) (12,863)
────────── ──────────Borrowings 371,445 368,310
══════════ ══════════
For
per
sona
l use
onl
y

17
NOTES TO THE CONSOLIDATED FINANCIAL STATEMENTS
6 Contributed equity
Half year 2017No. of shares USD$’000
Contributed equityShare capital as at 1 January 237,468,482 361,392
Conversion of Restricted Management Rights to ordinary shares 132,938 77_____________ _________
Share Capital as at 30 June 237,601,420 361,469═══════ ═════
The Company does not have a limited amount of authorised capital or par value in respect of its shares.
As disclosed in note 12 of the 2016 annual report, a long term incentive plan (“LTIP”) was established in 2014in order to facilitate remuneration for the Group’s senior management and to enhance the alignment of theirinterests with those of shareholders.
The Company issued 132,938 shares in fulfilment of the Restricted Management Rights scheme in the period.
On 15 May 2017, the Board granted awards of performance rights under the LTIP scheme to the CEO, CFOand other members of Senior Management (“the 2017 LTIP”).
In total 894,042 performance rights, with a nil exercise price, were issued. The performance conditions thatmust be satisfied in order for the performance rights to vest are consistent with those of the 2014 and 2015LTIP, as disclosed in note 12 to the 2016 annual report.
7 Dividends
Half Year
30 June 2017US$’000
Half Year
30 June 2016US$’000
Dividends declared and paid during the half yearFinal dividend paid for the year ended 31 December 2016 AUD 2.40 cents(2015: AUD 3.65 cents)
4,292 3,292
On 28 August 2017, the Directors approved the payment of a dividend of AUD 2.40 cents per share which willbe fully franked.
For
per
sona
l use
onl
y
18
NOTES TO THE CONSOLIDATED FINANCIAL STATEMENTS
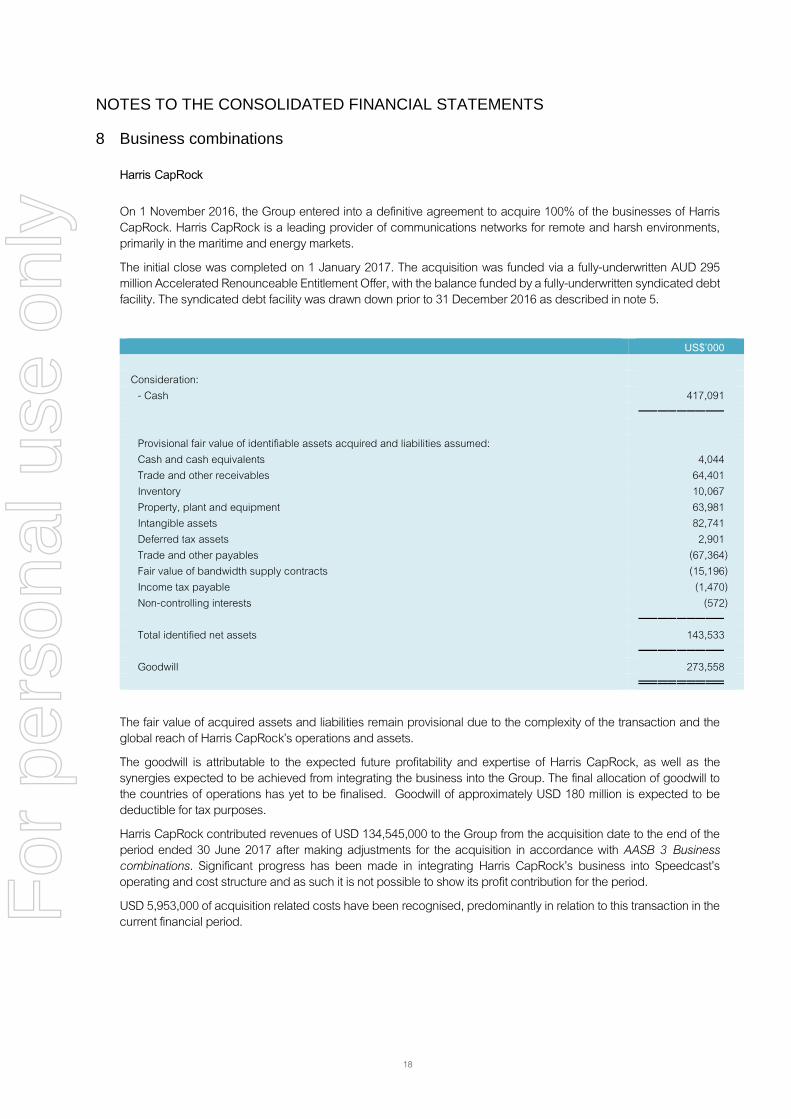
8 Business combinations
Harris CapRock
On 1 November 2016, the Group entered into a definitive agreement to acquire 100% of the businesses of HarrisCapRock. Harris CapRock is a leading provider of communications networks for remote and harsh environments,primarily in the maritime and energy markets.
The initial close was completed on 1 January 2017. The acquisition was funded via a fully-underwritten AUD 295million Accelerated Renounceable Entitlement Offer, with the balance funded by a fully-underwritten syndicated debtfacility. The syndicated debt facility was drawn down prior to 31 December 2016 as described in note 5.
US$’000
Consideration:- Cash 417,091
─────────
Provisional fair value of identifiable assets acquired and liabilities assumed:Cash and cash equivalents 4,044Trade and other receivables 64,401Inventory 10,067Property, plant and equipment 63,981Intangible assets 82,741Deferred tax assets 2,901Trade and other payables (67,364)Fair value of bandwidth supply contracts (15,196)Income tax payable (1,470)Non-controlling interests (572)
─────────Total identified net assets 143,533
─────────Goodwill 273,558
═════════
The fair value of acquired assets and liabilities remain provisional due to the complexity of the transaction and theglobal reach of Harris CapRock’s operations and assets.
The goodwill is attributable to the expected future profitability and expertise of Harris CapRock, as well as thesynergies expected to be achieved from integrating the business into the Group. The final allocation of goodwill tothe countries of operations has yet to be finalised. Goodwill of approximately USD 180 million is expected to bedeductible for tax purposes.
Harris CapRock contributed revenues of USD 134,545,000 to the Group from the acquisition date to the end of theperiod ended 30 June 2017 after making adjustments for the acquisition in accordance with AASB 3 Businesscombinations. Significant progress has been made in integrating Harris CapRock’s business into Speedcast’soperating and cost structure and as such it is not possible to show its profit contribution for the period.
USD 5,953,000 of acquisition related costs have been recognised, predominantly in relation to this transaction in thecurrent financial period.F
or p
erso
nal u
se o
nly
19
NOTES TO THE CONSOLIDATED FINANCIAL STATEMENTS
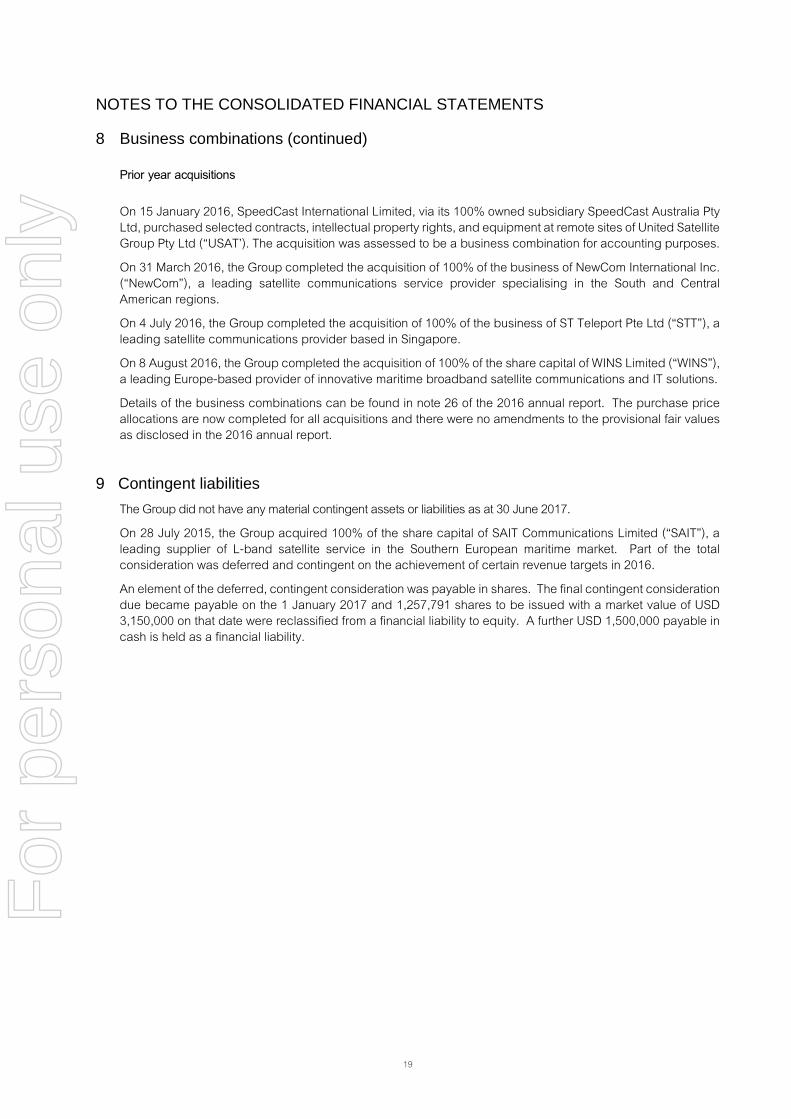
8 Business combinations (continued)
Prior year acquisitions
On 15 January 2016, SpeedCast International Limited, via its 100% owned subsidiary SpeedCast Australia PtyLtd, purchased selected contracts, intellectual property rights, and equipment at remote sites of United SatelliteGroup Pty Ltd (“USAT’). The acquisition was assessed to be a business combination for accounting purposes.
On 31 March 2016, the Group completed the acquisition of 100% of the business of NewCom International Inc.(“NewCom”), a leading satellite communications service provider specialising in the South and CentralAmerican regions.
On 4 July 2016, the Group completed the acquisition of 100% of the business of ST Teleport Pte Ltd (“STT”), aleading satellite communications provider based in Singapore.
On 8 August 2016, the Group completed the acquisition of 100% of the share capital of WINS Limited (“WINS”),a leading Europe-based provider of innovative maritime broadband satellite communications and IT solutions.
Details of the business combinations can be found in note 26 of the 2016 annual report. The purchase priceallocations are now completed for all acquisitions and there were no amendments to the provisional fair valuesas disclosed in the 2016 annual report.
9 Contingent liabilities
The Group did not have any material contingent assets or liabilities as at 30 June 2017.
On 28 July 2015, the Group acquired 100% of the share capital of SAIT Communications Limited (“SAIT”), aleading supplier of L-band satellite service in the Southern European maritime market. Part of the totalconsideration was deferred and contingent on the achievement of certain revenue targets in 2016.
An element of the deferred, contingent consideration was payable in shares. The final contingent considerationdue became payable on the 1 January 2017 and 1,257,791 shares to be issued with a market value of USD3,150,000 on that date were reclassified from a financial liability to equity. A further USD 1,500,000 payable incash is held as a financial liability.
For
per
sona
l use
onl
y
20
NOTES TO THE CONSOLIDATED FINANCIAL STATEMENTS
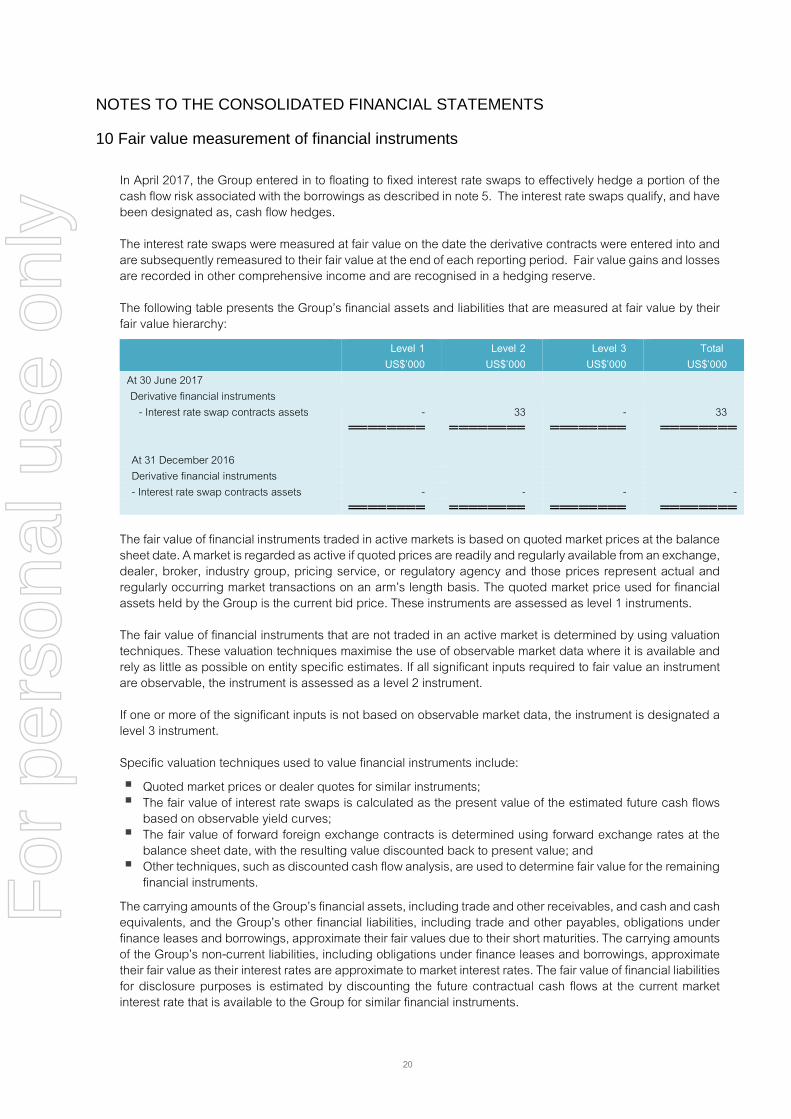
10 Fair value measurement of financial instruments
In April 2017, the Group entered in to floating to fixed interest rate swaps to effectively hedge a portion of thecash flow risk associated with the borrowings as described in note 5. The interest rate swaps qualify, and havebeen designated as, cash flow hedges.
The interest rate swaps were measured at fair value on the date the derivative contracts were entered into andare subsequently remeasured to their fair value at the end of each reporting period. Fair value gains and lossesare recorded in other comprehensive income and are recognised in a hedging reserve.
The following table presents the Group’s financial assets and liabilities that are measured at fair value by theirfair value hierarchy:
Level 1 Level 2 Level 3 TotalUS$’000 US$’000 US$’000 US$’000
At 30 June 2017Derivative financial instruments
- Interest rate swap contracts assets - 33 - 33════════ ════════ ════════ ════════
At 31 December 2016Derivative financial instruments- Interest rate swap contracts assets - - - -
════════ ════════ ════════ ════════
The fair value of financial instruments traded in active markets is based on quoted market prices at the balancesheet date. A market is regarded as active if quoted prices are readily and regularly available from an exchange,dealer, broker, industry group, pricing service, or regulatory agency and those prices represent actual andregularly occurring market transactions on an arm’s length basis. The quoted market price used for financialassets held by the Group is the current bid price. These instruments are assessed as level 1 instruments.
The fair value of financial instruments that are not traded in an active market is determined by using valuationtechniques. These valuation techniques maximise the use of observable market data where it is available andrely as little as possible on entity specific estimates. If all significant inputs required to fair value an instrumentare observable, the instrument is assessed as a level 2 instrument.
If one or more of the significant inputs is not based on observable market data, the instrument is designated alevel 3 instrument.
Specific valuation techniques used to value financial instruments include:
Quoted market prices or dealer quotes for similar instruments; The fair value of interest rate swaps is calculated as the present value of the estimated future cash flows
based on observable yield curves; The fair value of forward foreign exchange contracts is determined using forward exchange rates at the
balance sheet date, with the resulting value discounted back to present value; and Other techniques, such as discounted cash flow analysis, are used to determine fair value for the remaining
financial instruments.
The carrying amounts of the Group’s financial assets, including trade and other receivables, and cash and cashequivalents, and the Group’s other financial liabilities, including trade and other payables, obligations underfinance leases and borrowings, approximate their fair values due to their short maturities. The carrying amountsof the Group’s non-current liabilities, including obligations under finance leases and borrowings, approximatetheir fair value as their interest rates are approximate to market interest rates. The fair value of financial liabilitiesfor disclosure purposes is estimated by discounting the future contractual cash flows at the current marketinterest rate that is available to the Group for similar financial instruments.
For
per
sona
l use
onl
y
21
NOTES TO THE CONSOLIDATED FINANCIAL STATEMENTS
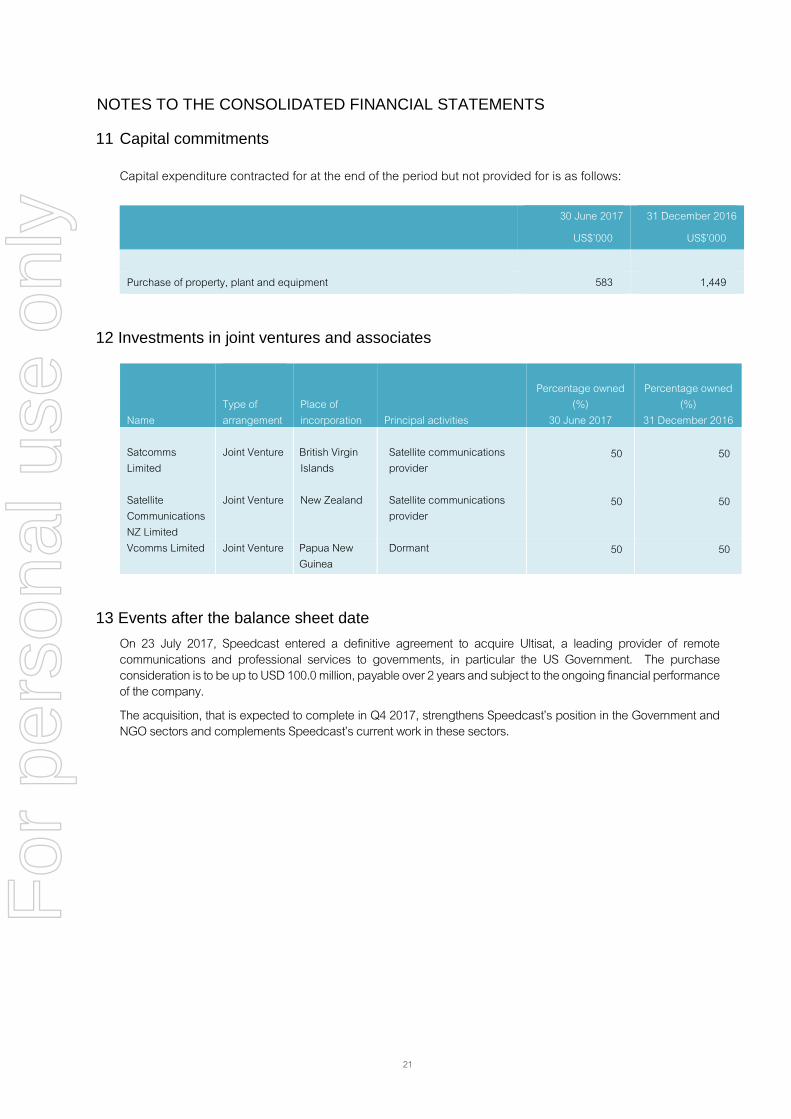
11 Capital commitments
Capital expenditure contracted for at the end of the period but not provided for is as follows:
30 June 2017
US$’000
31 December 2016
US$’000
Purchase of property, plant and equipment 583 1,449
12 Investments in joint ventures and associates
NameType ofarrangement
Place ofincorporation Principal activities
Percentage owned(%)
30 June 2017
Percentage owned(%)
31 December 2016
SatcommsLimited
Joint Venture British VirginIslands
Satellite communicationsprovider
50 50
SatelliteCommunicationsNZ Limited
Joint Venture New Zealand Satellite communicationsprovider
50 50
Vcomms Limited Joint Venture Papua NewGuinea
Dormant 50 50
13 Events after the balance sheet date
On 23 July 2017, Speedcast entered a definitive agreement to acquire Ultisat, a leading provider of remotecommunications and professional services to governments, in particular the US Government. The purchaseconsideration is to be up to USD 100.0 million, payable over 2 years and subject to the ongoing financial performanceof the company.
The acquisition, that is expected to complete in Q4 2017, strengthens Speedcast’s position in the Government andNGO sectors and complements Speedcast’s current work in these sectors.
For
per
sona
l use
onl
y
22
DIRECTORS’ DECLARATION
In the Directors’ opinion:
(a) the financial statements and notes set out on pages 9 to 21 are in accordance with the Corporations Act2001, including:(i) complying with Accounting Standards, the Corporations Regulations 2001 and other mandatory
professional reporting requirements; and(ii) giving a true and fair view of the consolidated entity’s financial position as at 30 June 2017 and of
its performance for the half year ended on that date; and(b) there are reasonable grounds to believe that the Company will be able to pay its debts as and when they
become due and payable
This declaration is made in accordance with a resolution of the Directors dated on 29 August 2017.
Pierre-Jean BeylierChief Executive Officer, Executive Director29 August 2017
For
per
sona
l use
onl
y

PricewaterhouseCoopers, ABN 52 780 433 757Level 11, 70 Franklin Street, ADELAIDE SA 5000, GPO Box 418, ADELAIDE SA 5001T: +61 8 8218 7000, F: +61 8 8218 7999, www.pwc.com.au
Liability limited by a scheme approved under Professional Standards Legislation.
Independent auditor's review report to the shareholders ofSpeedCast International Limited
Report on the Half-Year Financial ReportWe have reviewed the accompanying half-year financial report of SpeedCast International Limited (theCompany), which comprises the consolidated statement of financial position as at 30 June 2017,consolidated statement of profit or loss and other comprehensive income, consolidated statement ofchanges in equity and the consolidated statement of cash flows for the half-year ended on that date,selected explanatory notes and the directors' declaration for SpeedCast International Limited Group (theconsolidated entity). The consolidated entity comprises the Company and the entities it controlledduring that half-year.
Directors' responsibility for the half-year financial reportThe directors of the Company are responsible for the preparation of the half-year financial report thatgives a true and fair view in accordance with Australian Accounting Standards and the Corporations Act2001 and for such internal control as the directors determine is necessary to enable the preparation ofthe half-year financial report that is free from material misstatement whether due to fraud or error.
Auditor's responsibilityOur responsibility is to express a conclusion on the half-year financial report based on our review. Weconducted our review in accordance with Australian Auditing Standard on Review Engagements ASRE2410 Review of a Financial Report Performed by the Independent Auditor of the Entity, in order tostate whether, on the basis of the procedures described, we have become aware of any matter that makesus believe that the half-year financial report is not in accordance with the Corporations Act 2001including giving a true and fair view of the consolidated entity’s financial position as at 30 June 2017 andits performance for the half-year ended on that date; and complying with Accounting Standard AASB 134Interim Financial Reporting and the Corporations Regulations 2001. As the auditor of SpeedCastInternational Limited, ASRE 2410 requires that we comply with the ethical requirements relevant to theaudit of the annual financial report.
A review of a half-year financial report consists of making enquiries, primarily of persons responsible forfinancial and accounting matters, and applying analytical and other review procedures. A review issubstantially less in scope than an audit conducted in accordance with Australian Auditing Standardsand consequently does not enable us to obtain assurance that we would become aware of all significantmatters that might be identified in an audit. Accordingly, we do not express an audit opinion.
IndependenceIn conducting our review, we have complied with the independence requirements of the CorporationsAct 2001.
For
per
sona
l use
onl
y

Independent auditor's review report to the shareholders of
SpeedCast International Limited (continued)
ConclusionBased on our review, which is not an audit, we have not become aware of any matter that makes usbelieve that the half-year financial report of SpeedCast International Limited is not in accordance withthe Corporations Act 2001 including:
1. giving a true and fair view of the consolidated entity’s financial position as at 30 June 2017 and ofits performance for the half-year ended on that date;
2. complying with Accounting Standard AASB 134 Interim Financial Reporting and theCorporations Regulations 2001.
PricewaterhouseCoopers
Andrew Forman AdelaidePartner 29 August 2017
For
per
sona
l use
onl
y