For personal use only - ASX · Africa –Contract update Full Year to 30 Jun 2015 –Results...
41
FULL YEAR TO 30 JUNE 2015 RESULTS PRESENTATION For personal use only
Transcript of For personal use only - ASX · Africa –Contract update Full Year to 30 Jun 2015 –Results...

FULL YEAR TO 30 JUNE 2015RESULTS PRESENTATIONF
or p
erso
nal u
se o
nly

Overview
Although operating conditions remain challenging Ausdrill was successful in securing several
key contracts in the financial year
Strong operational cash flow generation in tough market of $117.9 million
Net capital expenditure restricted to $22.6 million
Deleveraging strategy continued with secured debt repayments totalling $100.1 million
Successful refinancing of Senior Secured Debt to secure liquidity – now maturing March 2018
Asset finance continues to amortise
Significant non cash items include impairment of intangibles $10.3 million and plant and
equipment $192.5 million
Gearing (Net Debt: Net Debt & Equity) at 39.5% as at 30 June 2015 and at expected levels
Modest operating profit before tax in a challenging environment
FULL YEAR KEY POINTS
2Full Year to 30 Jun 2015 – Results Presentation
For
per
sona
l use
onl
y

FULL YEAR KEY POINTS
Full Year to 30 Jun 2015 – Results Presentation 3
Operational Performance
Margins and revenues impacted by:
initial start up costs for Peabody contract, coupled with low equipment utilisation in equipment hire
lower material movements and cost reduction strategies throughout the mining industry
cessation of drill and blast contracts in iron ore as miners self-perform
provisions for doubtful debts – Western Desert Resources $7.5 million
very low exploration activity in Africa and lower activity in iron ore, particularly in waterwell drilling
redundancy costs across the Group of $3.8 million
FX expense of $7.7 million (FY14: gain of $5.8 million)
Strong focus on safety with the roll out of “One Safe - All Safe” initiative
Group employees (including AUMS JV) decreased to 4,080 from 4,578 in corresponding periodFor
per
sona
l use
onl
y

Full Year to 30 Jun 2015 – Results Presentation 4
Australia – Contract update
CONTRACT AWARDS AND EXTENSIONS
During the financial year Ausdrill won the following key contracts in Australia:
3 year contract to Gold Fields to provide exploration drilling services at its St Ives gold mine in
Western Australia
4 year sub-contract to Piacentini & Son to provide drill and blast services at Alcoa’s Huntly and
Willowdale mine sites in Western Australia
3 year sub-contract extension to Piacentini & Son to provide drill and blast services at the
Ravensthorpe nickel mine in Western Australia
2 year sub-contract to Macmahon to provide drill and blast services at the Tropicana gold mine
in Western Australia
2 year sub-contract to Thiess to provide drill and blast services at the Rocky’s Reward nickel
project in Western Australia
4 year contract to Peabody Energy Australia for BTP Equipment to supply equipment across
six Peabody mine sites on the East Coast of Australia
6–8 month contract for a Schramm TXD200 drill rig to provide shallow well land drilling for
Heritage PNG, in Papua New Guinea (completed in June 15)
For
per
sona
l use
onl
y

Africa – Contract update
Full Year to 30 Jun 2015 – Results Presentation 5
CONTRACT AWARDS AND EXTENSIONS
During the financial year African Mining Services won the following contracts in Africa:
12 month contract extension to AngloGold Ashanti for open pit mining services at its Iduapriem
gold mine, Ghana
3 year contract (with 2 year option to extend) to Perseus Mining for the provision of open pit
mining services at its Edikan gold mine, Eastern Pits operations, Ghana
2 year contract to B2Gold for exploration drilling services at its Fekola gold mine, Mali
Equipment hire contracts with Ghana Manganese Company in Ghana and with Nordgold at the
Bissa and Taparko gold mines in Burkina Faso
Work commenced at Syama satellite pits but Stage 2 cutback at sulphide pit ceased by client
For
per
sona
l use
onl
y

FINANCIAL PERFORMANCE
6Full Year to 30 Jun 2015 – Results Presentation
For
per
sona
l use
onl
y

Financial Performance
Sales Revenue down 7.3% to $765.8 million
EBITDA(1) down 34% to $114.7 million
EBIT(1) down 50% to $37.2 million
Operating PBT(1) down 93.9% to $2.1 million
Statutory loss after tax of $175.6 million
Return on average capital employed(2) decreased from 6.1% to 3.7%
FULL YEAR KEY POINTS
(1) Excludes significant items
(2) Return on average capital employed = EBIT excluding significant items/sum of average receivables, inventories, PP&E, intangibles, associates less trade payables
7Full Year to 30 Jun 2015 – Results Presentation
For
per
sona
l use
onl
y

FINANCIAL PERFORMANCE
Profit and Loss - A$ million FY13FY14 Non-
IFRS*FY15 - IFRS
FY15 Non-
IFRS*% Change from previous
corresponding period
Sales Revenue 1,128.6 826.3 765.8 765.8 (7.3%)
EBITDA* 272.7 173.7 114.7 (34.0%)
EBITDA Margin (1) 22.1% 20.8% 13.3% (756bp)
EBIT* 149.0 74.5 37.2 (50.0%)
EBIT Margin (2) 11.2% 8.8% 3.2% (568bp)
Profit/(Loss) Before Tax 109.5 34.4 (200.7) 2.1 (93.9%)
Profit Before Tax Margin (3) 9.7% 4.2% 0.3%
Profit/(Loss) After Tax 90.4 (175.6)
Return on Average Capital (4) 12.9% 6.1% 3.7% (248bp)
8
Revenue decrease as a result of lower activity levels and challenging market conditions
Profits and margins impacted by slowdown in mining industry and consequent demand for services
1) EBITDA Margin = Profit from continuing operations excluding tax, equity accounted profits, depreciation, amortisation, significant items and net finance costs as a % of sales revenue
2) EBIT Margin = Profit from continuing operations excluding tax, equity accounted profits, significant items and net finance costs as a % of sales revenue
3) Profit Before Tax Margin = Profit before tax from continuing operations excluding equity accounted profits and significant items as a % of sales revenue
4) Return on Average Capital = EBIT excluding significant items / sum of average receivables, inventories, PP&E, intangibles, associates less trade payables
Full Year to 30 Jun 2015 – Results Presentation
* Excludes significant items
For
per
sona
l use
onl
y

FINANCIAL PERFORMANCE – SIGNIFICANT/UNUSUAL ITEMS
Significant items - A$ million FY14 FY15
Impairment of goodwill and other intangibles (61.4) (10.3)
Impairment of plant and equipment (16.5) (192.5)
Effect on Net Profit Before Tax (77.9) (202.8)
9
Significant or unusual items are highlighted as these items are either non-recurring or do not reflect the
underlying operational profitability of the businesses
A reconciliation of Non-IFRS information is provided on page 35
Full Year to 30 Jun 2015 – Results Presentation
For
per
sona
l use
onl
y

10
FINANCIAL PERFORMANCE
Balance Sheet - A$ million FY14 FY15
Cash and cash equivalents 62.7 77.9
Receivables 157.6 141.8
Inventories 233.1 226.9
Property, plant and equipment 777.2 559.7
Intangibles 10.6 -
Other Assets 126.5 123.7
Total Assets 1,367.7 1,130.0
Payables 111.9 106.3
Borrowings (1) 453.3 433.8
Provisions 10.9 10.0
Other Liabilities 39.4 26.6
Total Liabilities 615.5 576.7
Shareholder Equity 752.2 553.3
Note: Columns may not add due to rounding
At 30 June 2015 the Group had
net debt of $360.7 million
(excluding prepaid borrowing
costs and insurance premium
funding)
NTA per share decreased to
$1.77
Working capital decreased by
$16.5 million
Net investment in plant and
equipment of $22.6 million
Full Year to 30 Jun 2015 – Results Presentation
(1) Includes pre-paid borrowing costs and insurance premium funding
For
per
sona
l use
onl
y

11
Group Debt Position (1)
FINANCIAL PERFORMANCE
At 30 June 2015 the Group had gross debt of $438.6
million, net debt of $360.7 million
USD debt naturally hedged with African business
Gearing (Net Debt : Net Debt & Equity) is 39.5%
Net Interest Cover (EBITDA: Net Cash Interest) of 3.7x
Cash exceeded Secured Debt
No off balance sheet debt – no operating leases are
used for P&E
AUMS JV is separately funded and its debt is not
included on Ausdrill’s balance sheet as it is equity
accounted
Full Year to 30 Jun 2015 – Results Presentation
(1) Excludes pre-paid borrowing costs and insurance premium funding
7.6%
92.4%
AUD Debt
USD Debt
For
per
sona
l use
onl
y

12
Group Debt Position and Maturity Profile
FINANCIAL PERFORMANCE
Full Year to 30 Jun 2015 – Results Presentation
Group debt - A$ million FY14 FY15
Revolving cash advance facility 75.0 25.0
Asset finance and other loans (1) 70.4 22.9
US$300 million unsecured notes 318.2 390.7
Total borrowings (1) 463.6 438.6
Cash and cash equivalents (62.7) (77.9)
Net Debt 400.9 360.7
Gearing Ratio 34.8% 39.5%
Borrowings include an FX impact of $75.1 m due to a
weaker A$ at the year end
(1) Excludes pre-paid borrowing costs of $9.5 million and insurance premium funding of $4.7 million
-
50.0
100.0
150.0
200.0
250.0
300.0
350.0
400.0
FY16 FY17 FY18 FY19 FY20
A$
Mil
lio
nRevolving Cash Advance Facility - undrawn US$300 Million Unsecured Notes
Asset Finance Africa (USD) Asset Finance Australia
Revolving Cash Advance Facility
For
per
sona
l use
onl
y

13
FINANCIAL PERFORMANCE
Cash Flow - A$ million FY14 FY15
Operating cash flows after interest and tax 142.1 117.9
Net Debt proceeds/(repayments) (77.0) (95.4)
Capital expenditure (64.7) (28.5)
Proceeds from asset disposals 10.2 5.9
Distributions from Associates - 17.8
Loans repaid by Associates 2.8 6.7
Other movements (3.8) (2.5)
Cash flow before shareholder return 9.7 21.9
Dividends (25.0) (9.4)
Net Cash Flow (15.3) 12.5
Note: Columns may not add due to rounding
Working Capital Changes
since June 2014A$m
Receivables (15.9)
Inventories (6.2)
Payables 5.6
Net Decrease 16.5
Operating cash generated declined reflecting lower activity levels
Lower level of capex as expected
Full Year to 30 Jun 2015 – Results Presentation
Cash Flow Conversion A$m
EBITDA* 114.7
Operating cash flow plus
net interest and taxes141.8
EBITDA conversion 123.6%
* Excludes significant items
* Excludes the negative effect of FX translation
on working capital of $19.8 million
For
per
sona
l use
onl
y

14
FINANCIAL PERFORMANCE
Capital expenditure - A$ million FY15
Australia Drill & Blast, Exploration,
Connector, EDA5.8
Mining Services
(Equipment Hire)7.5
13.3
Africa Ghana 10.3
Mali 1.9
Guinea 1.5
Burkina Faso 0.3
Manufacturing 0.2
Supply & Logistics 0.1
Other 0.8
Less Proceeds from Asset Sales (5.9)
TOTAL 22.6
Net Capex spend in FY2015 of
$22.6 million
Depreciation of $77.5 million
FY2016 capex to be restricted
Full Year to 30 Jun 2015 – Results Presentation
Note: Columns may not add due to rounding
For
per
sona
l use
onl
y

15
MINING SERVICES AUSTRALIA
Full Year to 30 Jun 2015 – Results Presentation
FINANCIAL PERFORMANCE
External Sales Revenue - A$ million EBIT - A$ million EBIT Margin
Revenues impacted by challenging conditions in mining industry which translate to subdued activity levels
Exploration activity decreased in iron ore but improved in the gold sector
Demand for equipment, parts and maintenance remains at subdued levels
Drill & Blast services in the Pilbara decreased as majors self perform
New contracts with Goldfields, Macmahon, Peabody, Piacentini & Son and Thiess
Commenced drilling program for Heritage Oil in PNG
Margins impacted by provision for doubtful debts, underperformance of waterwell, energy drilling operations
and equipment hire and parts businesses
Significant items expense not included above
472.1
386.6
FY 14 FY 15
8.7%
1.4%
FY 14 FY 15
41.0
5.5
FY 14 FY 15
For
per
sona
l use
onl
y

16
CONTRACT MINING SERVICES AFRICA
FINANCIAL PERFORMANCE
Full Year to 30 Jun 2015 – Results Presentation
Revenues improved mainly due to translation benefits of lower A$
Syama satellite pits commenced however stage 2 cutback ceased by client and lower volumes at Edikan
Over 70% of exploration drilling fleet is idle
Iduapriem (Ghana) and Siguiri (Guinea) projects for AngloGold are now well established
African Underground Mining Services (50% owned) contributed net profit of $13.0 million (FY14: $1.4 million)
and is excluded from above results
Effect of lower average A$ has had 8.5% positive impact on reported revenues and earnings this half year
compared to corresponding period
Significant items expense not included above
251.1276.4
FY 14 FY 15
13.6%
10.0%
FY 14 FY 15
34.0
27.6
FY 14 FY 15
External Sales Revenue - A$ million EBIT- A$ million EBIT Margin
For
per
sona
l use
onl
y

17
MANUFACTURING
FINANCIAL PERFORMANCE
Full Year to 30 Jun 2015 – Results Presentation
Commenced supply of drilling consumables for BHPB in the Pilbara leading to increased revenues
Reported margins include effects of amortisation of intangibles of $0.3 million (FY14: $0.6 million)
Significant items expense not included above
54.9 57.7
FY 14 FY 15
1.9%
(0.9%)
FY 14 FY 15
1.0
(0.5)
FY 14 FY 15
External Sales Revenue - A$ million EBIT - A$ million EBIT Margin
For
per
sona
l use
onl
y

18
SUPPLY AND LOGISTICS
FINANCIAL PERFORMANCE
Full Year to 30 Jun 2015 – Results Presentation
Revenues impacted by lower activity levels
Improved EBIT resulting form restructure of operations
External Sales Revenue - A$ million EBIT - A$ million EBIT Margin
30.626.7
FY 14 FY 15
1.0
2.2
FY 14 FY 15
3.2%
8.2%
FY 14 FY 15
For
per
sona
l use
onl
y

19
ALL OTHER
FINANCIAL PERFORMANCE
Comprises Diamond Communications, Properties, Corporate overheads and Finance
EBIT includes FX losses of $7.7 million (FY14: Gain of $5.8 million)
Full Year to 30 Jun 2015 – Results Presentation
17.4 18.3
FY 14 FY 15
(23.0%)
(56.9%)
FY 14 FY 15
-4.0
-10.4
FY 14 FY 15
External Sales Revenue - A$ million EBIT - A$ million EBIT Margin
For
per
sona
l use
onl
y

AFRICAN UNDERGROUND MINING SERVICES
20
FINANCIAL PERFORMANCE
Profit and loss - A$ million FY13 FY14 FY15
Sales Revenue 150.0 136.8 110.1
EBITDA 41.9 23.4 29.3
EBITDA Margin 27.9% 17.1% 26.6%
EBIT 26.2 4.0 16.3
EBIT Margin 17.5% 2.9% 14.8%
Profit before tax 23.8 2.0 16.3
Net profit after tax 22.9 1.5 13.0
Ausdrill’s 50% share on a pro-forma basis
Revenues fell as AUMS activity levels declined
Profits increased due to improved efficiencies, tighter cost control and the weaker A$
Currently focussed in Ghana, Burkina Faso and Mali
Major work ceased at Chirano project, works commenced at Subika (Newmont), Bibiani (Resolute) and
preparation for Yaramoko (Roxgold)
Contract at Gara/Yalea for Randgold to cease October 2015
The reported segment results for Contract Mining Services - Africa only includes the equity accounted share of
profits of African Underground Mining Services (50% owned)
Full Year to 30 Jun 2015 – Results Presentation
For
per
sona
l use
onl
y

AFRICAN UNDERGROUND MINING SERVICES
21
FINANCIAL PERFORMANCE
Balance Sheet - A$ million FY13 FY14 FY15
Cash and cash equivalents 13.9 15.9 20.5
Receivables 45.6 33.4 28.8
Inventories 28.8 22.9 22.3
Property, plant and equipment 44.8 24.9 19.6
Other Assets - - 2.2
Total Assets 133.2 97.1 93.4
Payables 39.5 19.0 22.5
Borrowings – External 16.0 3.0 0.2
Borrowings – Shareholder 8.1 6.7 -
Provisions 0.2 - 0.1
Other Liabilities 4.0 0.8 3.0
Total Liabilities 67.8 29.5 25.8
Shareholder Equity 65.5 67.6 67.6
Full Year to 30 Jun 2015 – Results Presentation
Note: Columns may not add due to rounding
Ausdrill’s 50% share on a pro-forma basis
For
per
sona
l use
onl
y

SAFETY AND PEOPLE
22Full Year to 30 Jun 2015 – Results Presentation
For
per
sona
l use
onl
y

SAFETY
23Full Year to 30 Jun 2015 – Results Presentation
During the year we have refined our Safety
Management System in line with the requirements
of AS4801. We have gained certification for two
business units and are currently working towards
certification for three more business units.
Continued development and refinement of the
MYOSH data management system will see a
more robust KPI module released in the first
quarter.
The training team is developing more online
modules and all business units are now using
position profiles to build training matrix and
training needs analysis.
LTIFR: Lost Time Injury
MTIFR: Medical Treatment Injury
TRIFR: Total Recordable Injuries (sum of LTI’s and MTI’s)
RWIFA: Restricted Work Injury
0.00
5.00
10.00
15.00
20.00
25.00
Jun
-09
Oct
-09
Feb
-10
Jun
-10
Oct
-10
Feb
-11
Jun
-11
Oct
-11
Feb
-12
Jun
-12
Oct
-12
Feb
-13
Jun
-13
Oct
-13
Feb
-14
Jun
-14
Oct
-14
Feb
-15
Jun
-15
12 mnth rolling TRIFR 12 mnth rolling LTIFR
12 mnth rolling MTIFR 12 mnth rolling RWIFR
Current Projects
The One Safe All Safe program
has been released and is currently
being rolled out to all Business
Units. Training of the leadership
group has commenced and will be
completed by December 2015.
For
per
sona
l use
onl
y

2,072
2,531
3,366
4,362
6,003
5,703
4,578
FY08 FY09 FY10 FY11 FY12 FY13 FY14 FY15
4,080
Aust
Africa
AUMS
JV
PEOPLE
24Full Year to 30 Jun 2015 – Results Presentation
At 30 June 2015 the number of
employees within the Group,
including jointly owned entities,
decreased to 4,080 – a
decrease of 10.9% at the
corresponding time last year.
The total number of Australian
employees reduced from 1,772
in July 2014 to 1,388 in June
2015, a decline of 21.7% due to
redundancies and natural
attrition.
For
per
sona
l use
onl
y

OUTLOOK AND STRATEGY
Full Year to 30 Jun 2015 – Results Presentation 25
For
per
sona
l use
onl
y

Current Environment
Environment remains competitive with a focus on costs and safety
General exploration activity shows no signs of improving – affects exploration drilling,
mineral assaying and some manufacturing. Gold exploration has improved, but is limited
to a small number of mining companies
Equipment hire continues to experience tough conditions
Reduced spend by miners affects maintenance activities
Iron ore price weaker, however, production volumes are increasing
Gold prices are volatile, however, world economies still mixed and subject to uncertainty
Weaker A$ provides cushion for domestic miners
Equity markets not conducive to funding of new resource projects
Tender activity continues to provide opportunities for Ausdrill to source new work and
redeploy capital
OUTLOOK
26Full Year to 30 Jun 2015 – Results Presentation
For
per
sona
l use
onl
y

Business Improvement Initiative
Strong focus on safety with the roll out of “One Safe - All Safe” initiative across the Group
Continue to focus on repaying secured debt, which was reduced by $100.1 million
during FY2015
Efficiency gains of $45 million per annum over three years with $24 million per annum already
identified over the next two years in the following areas:
- Strategic Sourcing Program
- Business Consolidations
Reviewing working capital, particularly inventory levels, to ensure that it is commensurate with
current levels of activity
Restricting capital expenditure to replacement needs or identified growth opportunities
OUTLOOK
27Full Year to 30 Jun 2015 – Results Presentation
For
per
sona
l use
onl
y

APPENDICES
28Full Year to 30 Jun 2015 – Results Presentation
For
per
sona
l use
onl
y

APPENDICES
29Full Year to 30 Jun 2015 – Results Presentation
For
per
sona
l use
onl
y
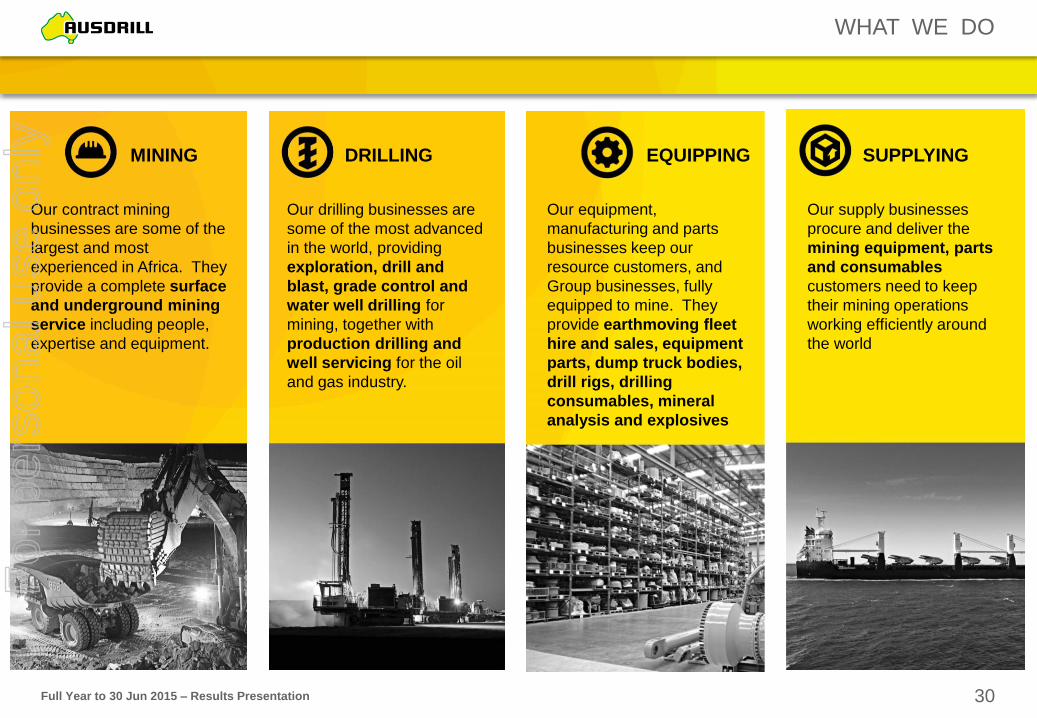
WHAT WE DO
Full Year to 30 Jun 2015 – Results Presentation
Our contract mining
businesses are some of the
largest and most
experienced in Africa. They
provide a complete surface
and underground mining
service including people,
expertise and equipment.
MINING DRILLING EQUIPPING SUPPLYING
Our drilling businesses are
some of the most advanced
in the world, providing
exploration, drill and
blast, grade control and
water well drilling for
mining, together with
production drilling and
well servicing for the oil
and gas industry.
Our equipment,
manufacturing and parts
businesses keep our
resource customers, and
Group businesses, fully
equipped to mine. They
provide earthmoving fleet
hire and sales, equipment
parts, dump truck bodies,
drill rigs, drilling
consumables, mineral
analysis and explosives
Our supply businesses
procure and deliver the
mining equipment, parts
and consumables
customers need to keep
their mining operations
working efficiently around
the world
30
For
per
sona
l use
onl
y

WHERE WE OPERATE
MINING SERVICESAUSTRALIA
Gold Fields – St Ives, Kambalda
Exploration drilling services
Associated since 1996
Ensham Resources – Ensham, QLD
Production drilling services
Associated since 2004
Oz Minerals – Prominent Hill
Production drilling and grade control
Associated since 2007
La Mancha – White Foil
Exploration drilling services
Drill and blast and grade control services
First Quantum Minerals – Ravensthorpe
Grade control services
Piacentini & Son – Ravensthorpe
Drill and blast services
KCGM – Superpit
Production drilling and grade control
Associated since 1989
Peabody Energy – NSW & QLD
Equipment hire
BHPBIO – Pilbara region
Equipment hire
BHPBIO – Pilbara region
Exploration drilling services
BHPBIO – Pilbara region
Drill and blast services
Perth
Adelaide
Brisbane
Full Year to 30 Jun 2015 – Results Presentation
Northern Star – Kundana
Exploration drilling services
Piacentini & Son – Huntly & Willowdale
Drill and blast services
Macmahon – Tropicana
Drill and blast services
Thiess – Rocky’s reward
Drill and blast services
31
For
per
sona
l use
onl
y

WHERE WE OPERATE
AngloGold Ashanti – Iduapriem, Ghana
Gold - Open pit mining services
Endeavour Mining – Nzema, Ghana
Gold - Open pit mining services
Perseus Mining – Edikan, Ghana
Gold - Open pit mining services
Ghana Manganese – Nsuta, Ghana
Manganese – Equipment hire
Resolute Mining – Syama, Mali
Gold - Open pit mining services
B2Gold – Fekola, Mali
Gold - Exploration drilling
African Mining Services
African Underground Mining Services
(AUMS 50% JV)
AngloGold Ashanti – Siguiri, Guinea
Gold - Open pit mining services
CONTRACT MINING SERVICESAFRICA
Tanzania
Ghana
Burkina FasoMali
Guinea
Full Year to 30 Jun 2015 – Results Presentation
Roxgold – Yaramoko, Burkina Faso
Gold – Underground mining services
Nantou Mining – Perkoa, Burkina Faso
Zinc – Underground mining services
Randgold Resources –
Gara, Loulo Operation, Mali
Gold - Underground mining services
Randgold Resources –
Yalea - Loulo Operation, Mali
Gold - Underground mining services
Nordgold – Bissa and Taparko,
Burkina Faso
Gold - Equipment hire
Newmont Mining – Subika, Ghana
Gold – Underground mining services
Resolute Mining – Bibiani, Ghana
Gold – Underground mining services
32
For
per
sona
l use
onl
y

OUR EQUIPMENT
33Full Year to 30 Jun 2015 – Results Presentation
Note: Numbers represent the number of major equipment items owned by the Group and AUMS
For
per
sona
l use
onl
y

PROFIT & LOSS
34Full Year to 30 Jun 2015 – Results Presentation
A$ million FY13 FY14 FY15% Change from previous
corresponding period
Sales Revenue 1,128.6 826.3 765.8 (7.3%)
Interest Income 2.7 1.6 1.9 20.0%
Materials (376.8) (290.0) (313.8) (8.2%)
Labour (367.8) (292.8) (266.5) 9.0%
Rental and hire (22.2) (13.5) (13.0) 3.8%
Depreciation & Amortisation Expense (123.7) (99.2) (77.5) 21.9%
Finance Costs (42.3) (41.6) (37.0) 11.1%
Share of Associates Profits 22.9 1.4 13.0 800.3%
Other items (111.9) (57.8) (70.8) (22.5%)
Profit Before Tax and impairment 109.5 34.4 2.1 (93.9%)
EBITDA(4)272.7 173.7 114.7 (34.0%)
EBITDA Margin (1)22.1% 20.8% 13.3%
EBIT(4)149.0 74.5 37.2 (50.0%)
EBIT Margin (2)11.2% 8.8% 3.2%
Operating Profit Before Tax(4)109.5 34.4 2.1 (93.9%)
Operating Profit Margin (3)9.7% 4.2% 0.3%
Profit/(Loss) After Tax and Impairment 90.4 (43.9) (175.6) (300.0%)
Note: Columns may not add due to rounding
(1) EBITDA Margin = Profit from continuing operations excluding significant items, equity accounted profits, depreciation and amortisation expense and net finance costs as a % of sales revenue
(2) EBIT Margin = Profit from continuing operations excluding significant items, equity accounted profits and net finance costs as a % of sales revenue
(3) Operating Profit Margin = Profit before tax from continuing operations excluding significant items as a % of sales revenue
(4) Excludes significant items
For
per
sona
l use
onl
y

RECONCILIATION OF NON-IFRS FINANCIAL INFORMATION
35Full Year to 30 Jun 2015 – Results Presentation
A$ million FY14 FY15
Loss after tax as reported (43.9) (175.6)
Add back:
Impairment expense 77.9 202.8
Deduct:
Tax (credit) / expense 0.4 (25.1)
Profit before tax 34.4 2.1
Net Interest Expense 40.1 35.1
EBIT 74.5 37.2
Depreciation and amortisation expense 99.2 77.5
EBITDA 173.7 114.7
Note: Columns may not add due to rounding
For
per
sona
l use
onl
y

BALANCE SHEET
36Full Year to 30 Jun 2015 – Results Presentation
A$ million FY13 FY14 FY15
Cash and cash equivalents 78.8 62.7 77.9
Current Receivables 186.9 157.6 141.8
Inventories 257.3 233.1 226.9
Property, plant and equipment 840.8 777.2 559.7
Intangibles 71.9 10.6 -
Other Assets 103.7 126.5 123.7
Total Assets 1,539.4 1,367.7 1,130.0
Payables 131.7 111.9 106.3
Borrowings 537.5 453.3 433.8
Provisions 12.0 10.9 10.0
Other Liabilities 40.8 39.4 26.6
Total Liabilities 722.0 615.5 576.7
Shareholder Equity 817.4 752.2 553.3
Net Debt (1) 472.5 400.9 360.7
Note: Columns may not add due to rounding
(1) Excludes prepaid borrowing costs and insurance premium funding
For
per
sona
l use
onl
y

CASHFLOW
37Full Year to 30 Jun 2015 – Results Presentation
A$ million FY13 FY14 FY15
Receipts from customers (inclusive of GST) 1,254.7 912.2 830.2
Payments to suppliers and employees (inclusive of GST) (990.7) (719.9) (691.7)
264.0 192.4 138.5
Interest received 2.7 1.6 1.7
Interest and other costs of finance paid (35.2) (31.3) (33.1)
Income taxes received / (paid) (46.3) (21.9) 7.1
Other 2.2 1.4 3.7
Net cash inflow from operating activities 187.3 142.1 117.9
Payment for purchase of business (161.3) - -
Payments for property, plant and equipment (172.6) (64.7) (28.5)
Proceeds from sale of property, plant and equipment 4.3 10.2 5.9
Distributions from Associates and loan repayments - 2.8 24.5
Other (0.7) (4.5) (2.7)
Net cash (outflow) from investing activities (330.3) (56.2) (0.7)
Proceeds from issues of shares and other equity securities 8.3 - -
Proceeds from secured borrowings 446.7 47.5 12.5
Proceeds from unsecured borrowings 287.0 - 6.8
Repayment of borrowings (514.5) (78.0) (96.2)
Repayment of hire purchase and lease liabilities (101.1) (46.5) (18.5)
Dividends paid to company’s shareholders (34.9) (25.0) (9.4)
Other 1.8 0.8 0.1
Net cash (outflow) inflow from financing activities 93.3 (101.2) (104.7)
Net (decrease) increase in cash and cash equivalents (49.7) (15.3) 12.5
Cash and cash equivalents at the beginning of the period 124.2 78.8 62.7
Effects of exchange rate changes on cash and cash equivalents 4.3 (0.8) 2.7
Cash and cash equivalents at end of period 78.8 62.7 77.9
Note: Columns may not add due to rounding
For
per
sona
l use
onl
y

CORPORATE SNAPSHOT
38
CAPITAL STRUCTURE
Share price (close as at 26 Aug 2015) $0.21
Fully paid ordinary shares 312.3 million
Market capitalisation (undiluted) $65.6 million
Net Tangible Assets (30 Jun 2015) $553.3 million
Cash (as at 30 Jun 2015) $77.9 million
Debt (as at 30 Jun 2015) $438.6 million
Enterprise value $914.0 million
Net Debt/Net Debt & Equity (as at 30 Jun 2015) 39.5%
DIRECTORS AND SENIOR MANAGEMENT
Terence O'Connor Chairman, Non-executive Director
Ronald Sayers Managing Director
Terrence Strapp Non-executive Director
Donald Argent Non-executive Director
Mark Connelly Non-executive Director
Mark Hine Non-executive Director
José Martins Chief Financial Officer
Andrew Broad COO Australian Operations
John Kavanagh COO African Operations
Domenic Santini Company Secretary
Strati Gregoriadis General Counsel/Company Secretary
SUBSTANTIAL SHAREHOLDERS
Name Shareholding
Ronald Sayers / Cherry Garden Nominees 11.80%
FMR LLC 6.89%
PM & JL Bartlett / Bremerton Group 6.07%
SHARE PRICE PERFORMANCE (REBASED)
Full Year to 30 Jun 2015 – Results Presentation
20%
30%
40%
50%
60%
70%
80%
90%
100%
110%
120%
ASL.ASX XJO.ASX
For
per
sona
l use
onl
y

DIVERSIFIED REVENUE
39Full Year to 30 Jun 2015 – Results Presentation
Sales Revenue By Business Activity (1)
Sales Revenue By Top 10 Customers (1)
Sales Revenue By Geography (1)
MSA and CMSA Sales Revenue by Commodity (2)
Notes
1. Based on FY15 sales - figures may not add due to rounding
2. Based on FY15 sales revenue for Mining Services Australia (MSA) and Contract Mining Services Africa (CMSA) – representing 91.1% of total external revenue
Aust 63.1%
Ghana 17.7%
Mali 9.4%
Guinea 7.3%Other 2.5%
Aust.63.1%
Africa34.4%
Other 2.5%
Contract Mining Africa 32.3%
Drill & Blast16.3%Equipment Hire
& Parts 14.8%
Waterwell Drilling 3.7%
Exploration 9.0%
Manufacturing10.3%
Supply Logistics5.0%
Coal Seam Gas4.6%
Other 3.9%
Explor.9.0%
Other23.8%
Production67.2%
AngloGold 9.9%
Resolute 9.2% BHP 8.1%
Perseus 7.8%
Newmont/Barrick 5.3%
Endeavour 4.3%
Rio 3.3%
OZ Minerals 3.0%
Senex Energy 2.5%
Goldfields 2.3%
Others 44.3%
Gold/Copper72.7%
Iron Ore 16.7%Other 10.6%
For
per
sona
l use
onl
y

This presentation and these materials (together the “Presentation”) has been prepared by
Ausdrill Limited ABN 95 009 211 474 (ASX:ASL) (“Ausdrill”) as an Investor Presentation and a
summary of Ausdrill’s results for the full year to 30 June 2015. By participating in this
Presentation or reviewing or retaining these materials, you acknowledge and represent that you
have read, understood and accepted the terms of this Important Notice and Disclaimer.
This presentation should be read in conjunction with Ausdrill’s 2015 statutory accounts lodged
with the Australian Securities Exchange (ASX) on 26 August 2015, the Interim Financial Report
lodged with ASX on 25 February 2015 and other periodic and continuous disclosure
announcements that have been lodged by Ausdrill with the ASX.
This presentation is not intended as an offer, invitation, solicitation or recommendation with
respect to the purchase or sale of any security in the United States or any other jurisdiction.
Securities may not be offered or sold in the United States absent registration under the
Securities Act of 1933 or an applicable exemption from registration.
This Presentation may contain forward looking statements concerning projected earnings,
revenue, growth, outlook or other matters (“Projections”) for the financial year ending 30 June
2016 or beyond. Any such Projections are based on assumptions which may differ materially
from the actual circumstances which may arise. Ausdrill undertakes no obligation to update any
Projections for events or circumstances that occur subsequent to the date of this Presentation or
to keep current any of the information provided. Past performance is no guarantee of future
performance.
Recipients of this Presentation are advised that the information contained in this Presentation is
not legal, tax, accounting, investment or financial product advice and should not be used as the
basis for making investment decisions in relation to Ausdrill securities.
In addition, some of the financial data included in this presentation are “non-GAAP” financial
measures under Regulation G under the Securities Exchange Act of 1934. Certain of these
measures may not be comparable to similarly titled measures of other companies.
The information contained in this Presentation is for information purposes only and does not
constitute an offer to issue, or arrange to issue, securities or other financial products. Ausdrill has
no obligation to tell recipients if it becomes aware of any inaccuracy in or omission from the
information in this Presentation. This Presentation has been prepared without taking into account
the investment objectives, financial situation or particular needs of any particular person. You
should consult your own advisors as to legal, tax, financial and related matters and conduct your
own investigations, enquiries and analysis concerning any transaction or investment or other
financial decision.
This Presentation, including opinions set out in it, is based on information compiled or prepared
by Ausdrill from sources believed to be reliable, although such information has not been verified
in all instances. No representation or warranty, express or implied, is made as to the fairness,
accuracy, completeness or correctness of the information, opinions or conclusions contained in
this Presentation. To the maximum extent permitted by law, none of Ausdrill, its directors,
employees, advisors or agents, nor any other person, accepts any liability, including without
limitation any liability arising out of fault or negligence, for any loss arising from the use of the
information contained in this Presentation. In particular, no representation or warranty, express
or implied, is given as to the accuracy, completeness, likelihood of achievement or
reasonableness of any forecasts, Projections or prospects referred to in this presentation.
Non-IFRS Financial Information
This presentation uses non-IFRS financial information including EBITDA, EBIT, Group EBITDA
and Group EBIT which are used to measure both group and operational performance. A
reconciliation of non-IFRS financial information to profit before tax is included in the
supplementary slides. Non-IFRS measures have not been subject to audit or review.
40Full Year to 30 Jun 2015 – Results Presentation
For
per
sona
l use
onl
y