
For personal use only - ASX · • Walnut nursery infrastructure & capability expanded and seed...
23
W E B S T E R G R O U P DECEMBER 2014 PRESENTATION For personal use only
Transcript of For personal use only - ASX · • Walnut nursery infrastructure & capability expanded and seed...

W E B S T E R G R O U P
DECEMBER 2014 PRESENTATION
For
per
sona
l use
onl
y
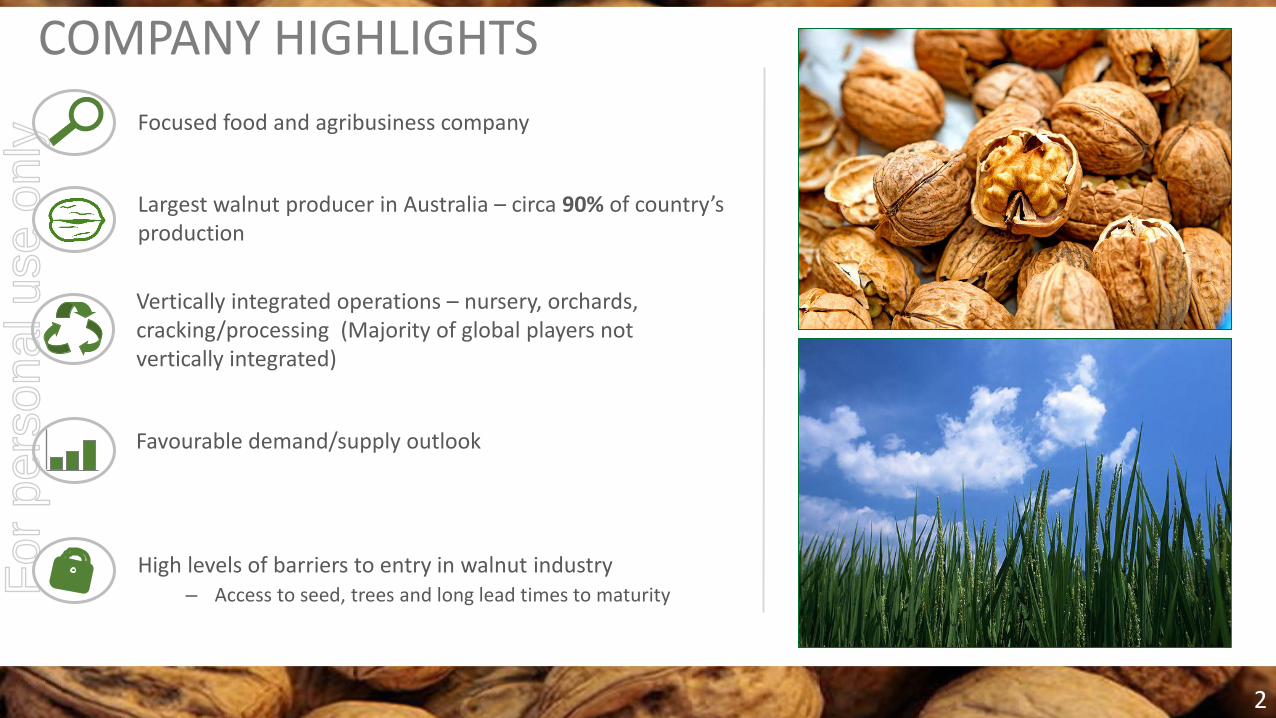
COMPANY HIGHLIGHTS
Focused food and agribusiness company
Largest walnut producer in Australia – circa 90% of country’s production
Vertically integrated operations – nursery, orchards, cracking/processing (Majority of global players not vertically integrated)
Favourable demand/supply outlook
High levels of barriers to entry in walnut industry – Access to seed, trees and long lead times to maturity
2
For
per
sona
l use
onl
y

COMPANY HIGHLIGHTS
Strong international demand – Australian production is counter seasonal to Northern hemisphere
Efficient, low cost producer – five years of demonstrated earnings growth
Favourable currency tailwinds – walnut exports sold in USD
Attractive maturity profile and increasing yields
Eubalong Booberoi
Darlington Point Kooba Bringagee/Benerembah
Avondale West Walnut orchard
under development
Tabbita Walnut
Orchard Harvesting Processing
Leeton Walnut
Orchard Harvesting Processing Packing Walnut Nursery Swansea Walnut Orchards
3
For
per
sona
l use
onl
y
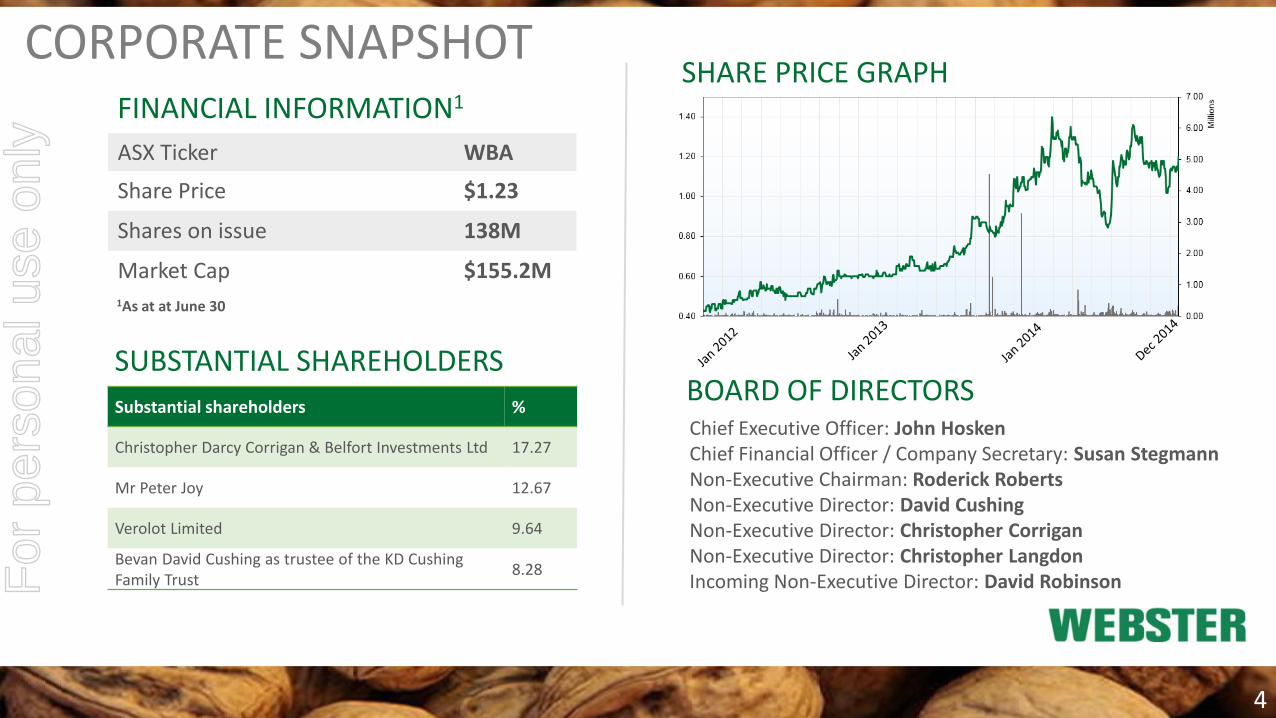
CORPORATE SNAPSHOT SHARE PRICE GRAPH
SUBSTANTIAL SHAREHOLDERS
FINANCIAL INFORMATION1
BOARD OF DIRECTORS Chief Executive Officer: John Hosken Chief Financial Officer / Company Secretary: Susan Stegmann Non-Executive Chairman: Roderick Roberts Non-Executive Director: David Cushing Non-Executive Director: Christopher Corrigan Non-Executive Director: Christopher Langdon Incoming Non-Executive Director: David Robinson
4
1As at at June 30
Substantial shareholders %
Christopher Darcy Corrigan & Belfort Investments Ltd 17.27
Mr Peter Joy 12.67
Verolot Limited 9.64
Bevan David Cushing as trustee of the KD Cushing Family Trust
8.28
ASX Ticker WBA
Share Price $1.23
Shares on issue 138M
Market Cap $155.2M
For
per
sona
l use
onl
y
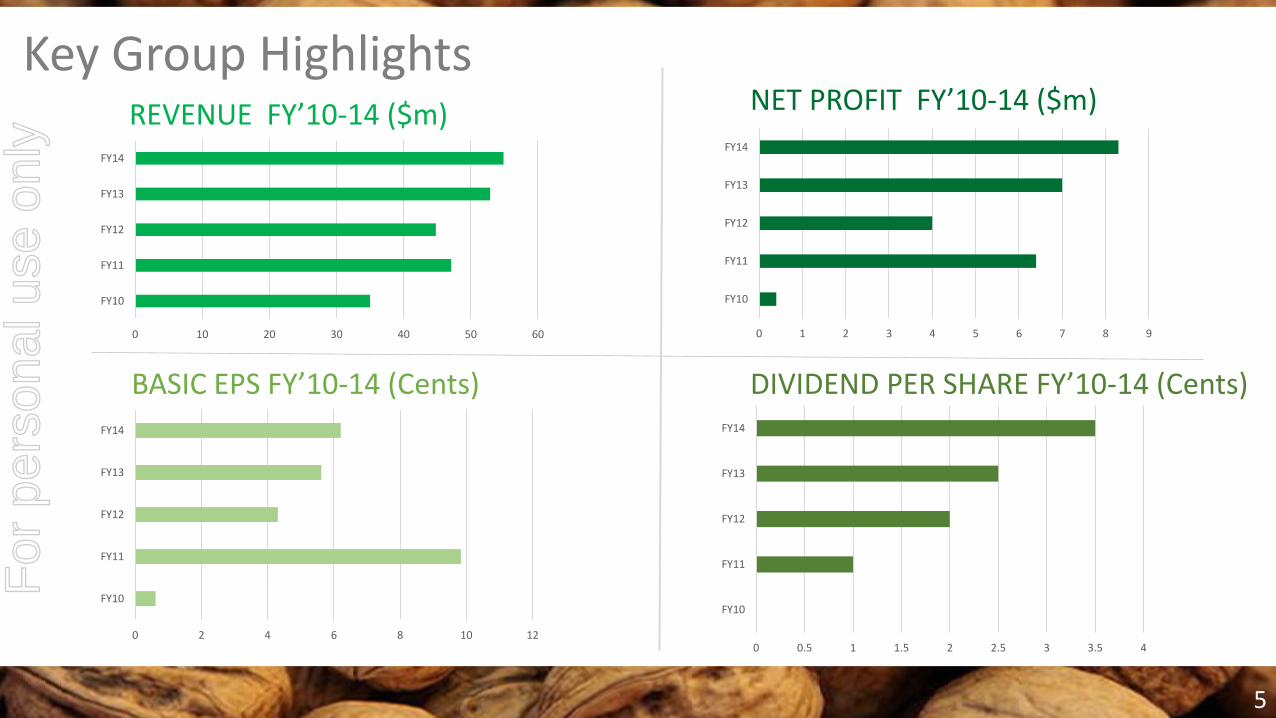
Key Group Highlights
0 10 20 30 40 50 60
FY10
FY11
FY12
FY13
FY14
BASIC EPS FY’10-14 (Cents)
0 1 2 3 4 5 6 7 8 9
FY10
FY11
FY12
FY13
FY14
NET PROFIT FY’10-14 ($m) REVENUE FY’10-14 ($m)
DIVIDEND PER SHARE FY’10-14 (Cents)
5
0 0.5 1 1.5 2 2.5 3 3.5 4
FY10
FY11
FY12
FY13
FY14
0 2 4 6 8 10 12
FY10
FY11
FY12
FY13
FY14
For
per
sona
l use
onl
y

FY14 HIGHLIGHTS • Total revenue increase of 6% to $65.65m
• Net Profit Before Tax increase of 21% to $11.98m
• EPS up 10% to 6.21 cents
• Full year dividends paid and declared up 40% to 3.5 cents (fully
franked)
• Fifth consecutive year of earnings growth
• Successful commissioning of new $12 million walnut processing
facility
• Walnut nursery infrastructure & capability expanded and seed
sourcing secured
• New orchard establishment, Avondale West in the Riverina, NSW 0%
5%
10%
15%
20%
25%
30%
35%
40%
45%
Revenue EBITDA NPBT EPS Dividend
FY13-FY14 YEAR ON YEAR GROWTH %
6
For
per
sona
l use
onl
y
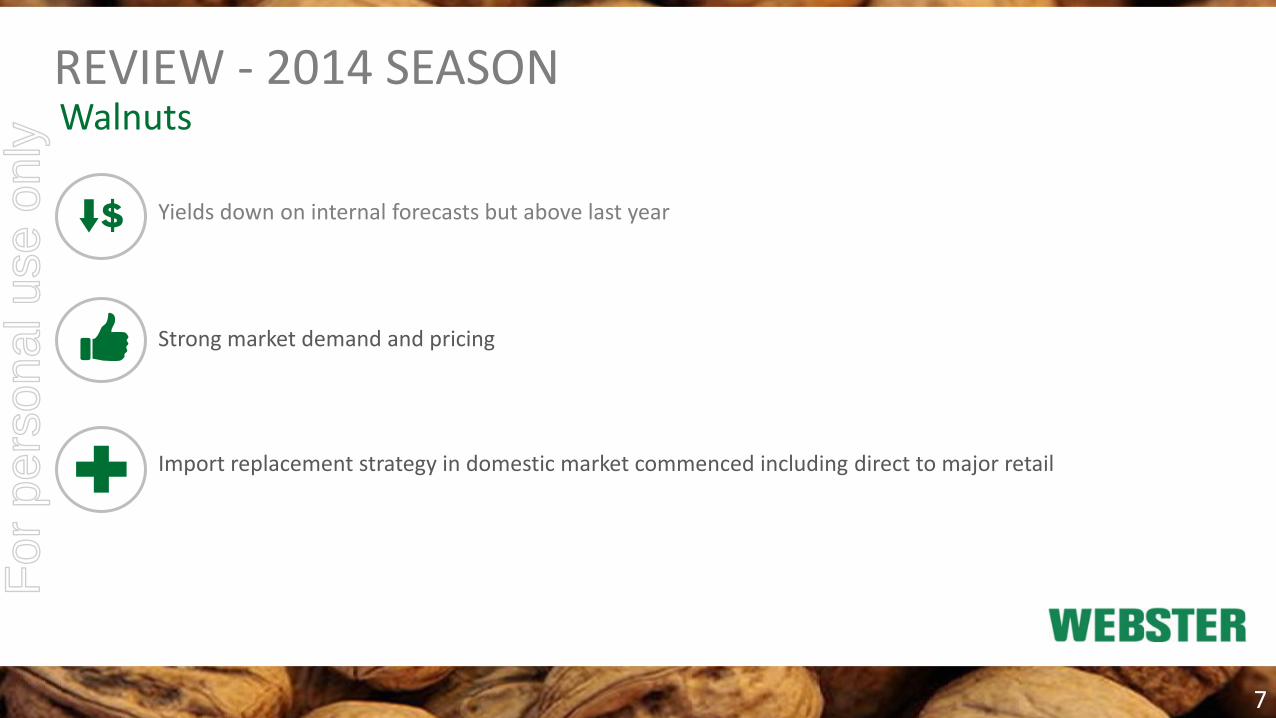
REVIEW - 2014 SEASON
Strong market demand and pricing
Yields down on internal forecasts but above last year
Import replacement strategy in domestic market commenced including direct to major retail
Walnuts
7
For
per
sona
l use
onl
y
Yields were down on budget
Positive contribution to the earnings result
Upgrades to the onion packing operation
including the installation of pre packing capability
Onions
Rebalanced sales mix between domestic and export
Direct onion supply commenced to a major Australian retailer
REVIEW - 2014 SEASON
8
For
per
sona
l use
onl
y
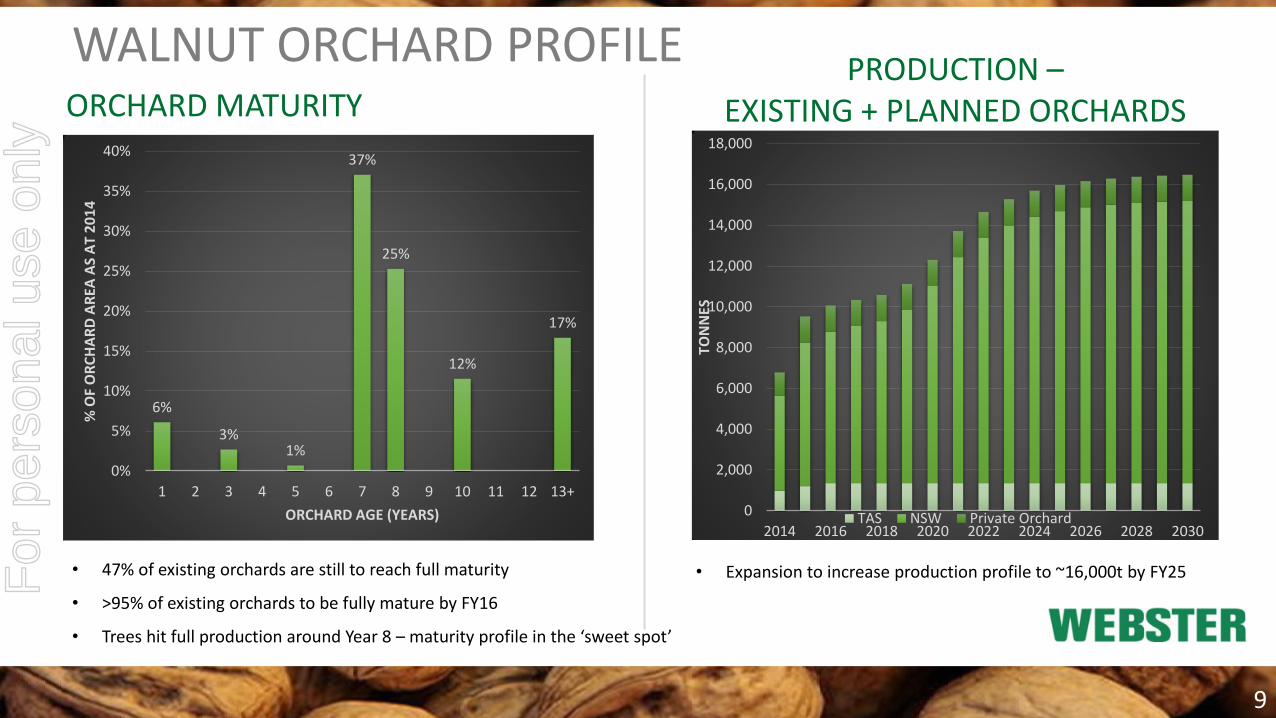
WALNUT ORCHARD PROFILE PRODUCTION –
EXISTING + PLANNED ORCHARDS
6%
3% 1%
37%
25%
12%
17%
0%
5%
10%
15%
20%
25%
30%
35%
40%
1 2 3 4 5 6 7 8 9 10 11 12 13+
% O
F O
RC
HA
RD
AR
EA A
S A
T 2
01
4
ORCHARD AGE (YEARS)
ORCHARD MATURITY
• Expansion to increase production profile to ~16,000t by FY25 • 47% of existing orchards are still to reach full maturity
• >95% of existing orchards to be fully mature by FY16
• Trees hit full production around Year 8 – maturity profile in the ‘sweet spot’
0
2,000
4,000
6,000
8,000
10,000
12,000
14,000
16,000
18,000
2014 2016 2018 2020 2022 2024 2026 2028 2030
TON
NES
TAS NSW Private Orchard
9
For
per
sona
l use
onl
y
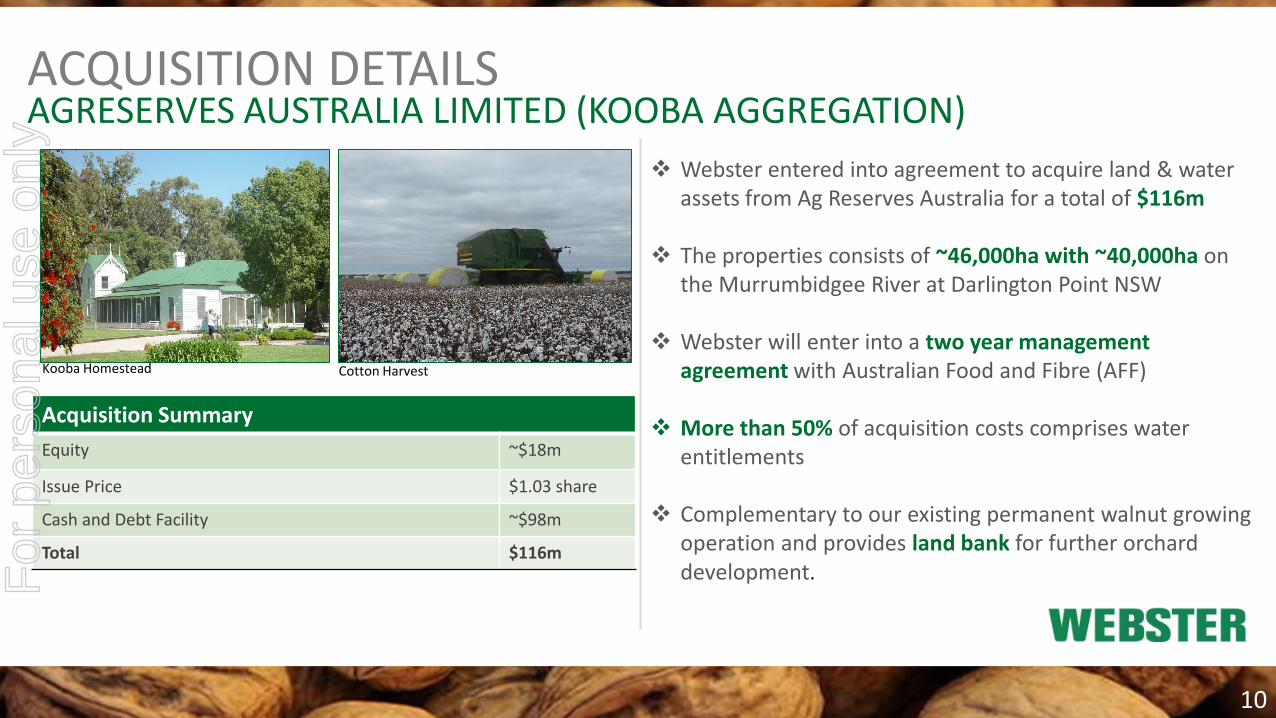
ACQUISITION DETAILS AGRESERVES AUSTRALIA LIMITED (KOOBA AGGREGATION)
Acquisition Summary
Equity ~$18m
Issue Price $1.03 share
Cash and Debt Facility ~$98m
Total $116m
Webster entered into agreement to acquire land & water assets from Ag Reserves Australia for a total of $116m
The properties consists of ~46,000ha with ~40,000ha on the Murrumbidgee River at Darlington Point NSW
Webster will enter into a two year management agreement with Australian Food and Fibre (AFF)
More than 50% of acquisition costs comprises water entitlements
Complementary to our existing permanent walnut growing operation and provides land bank for further orchard development.
Kooba Homestead Cotton Harvest
10
For
per
sona
l use
onl
y
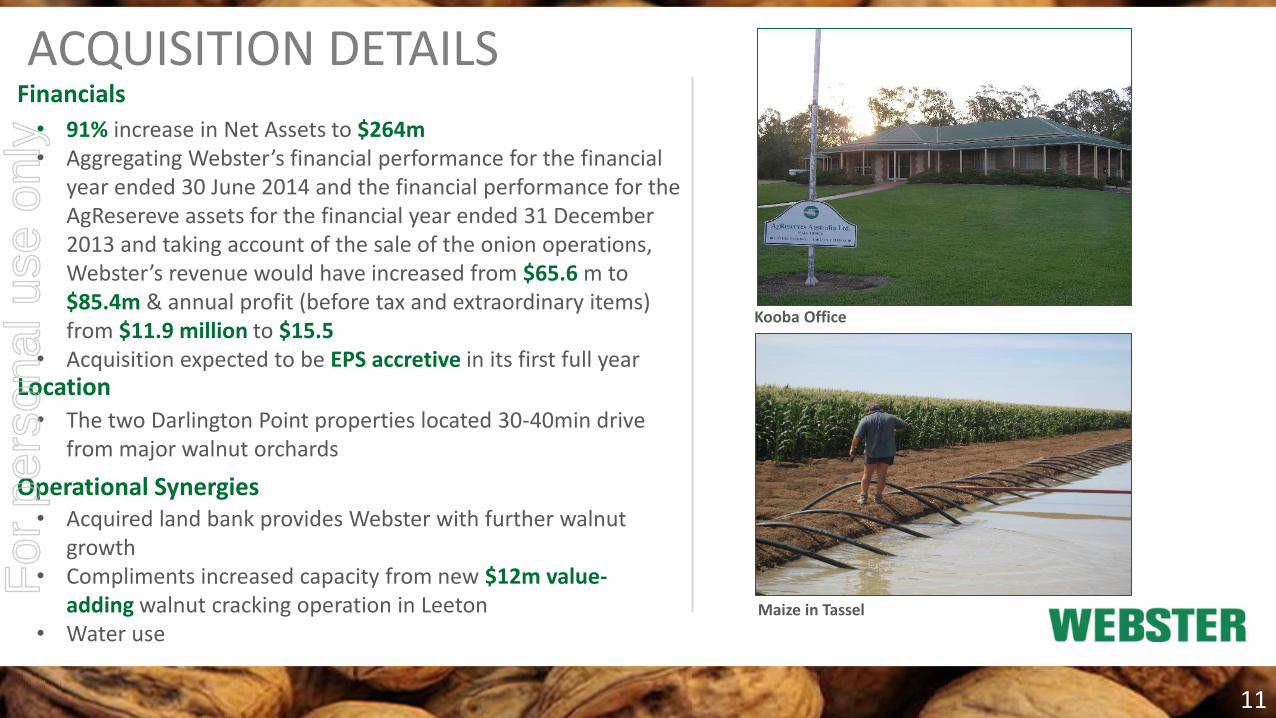
ACQUISITION DETAILS
Location • The two Darlington Point properties located 30-40min drive
from major walnut orchards
Financials
• 91% increase in Net Assets to $264m • Aggregating Webster’s financial performance for the financial
year ended 30 June 2014 and the financial performance for the AgResereve assets for the financial year ended 31 December 2013 and taking account of the sale of the onion operations, Webster’s revenue would have increased from $65.6 m to $85.4m & annual profit (before tax and extraordinary items) from $11.9 million to $15.5
• Acquisition expected to be EPS accretive in its first full year
Operational Synergies • Acquired land bank provides Webster with further walnut
growth • Compliments increased capacity from new $12m value-
adding walnut cracking operation in Leeton • Water use
11
Kooba Office
Maize in Tassel
For
per
sona
l use
onl
y
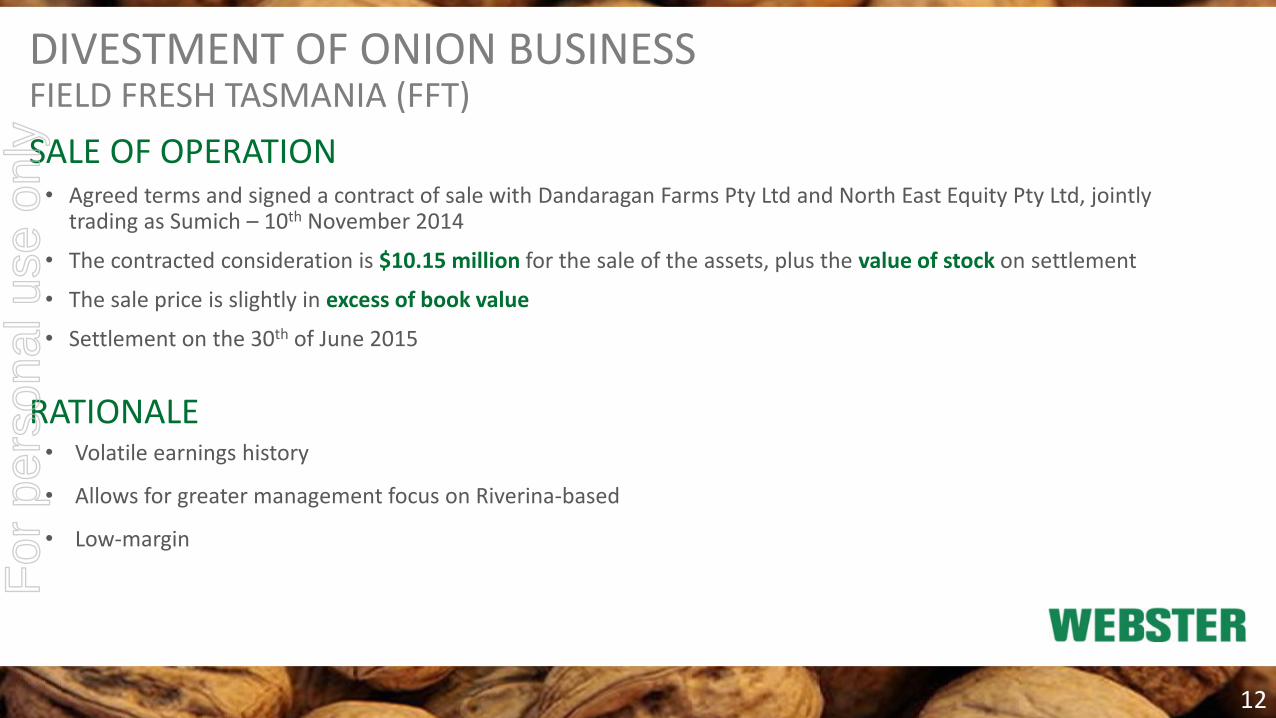
DIVESTMENT OF ONION BUSINESS FIELD FRESH TASMANIA (FFT)
SALE OF OPERATION • Agreed terms and signed a contract of sale with Dandaragan Farms Pty Ltd and North East Equity Pty Ltd, jointly
trading as Sumich – 10th November 2014
• The contracted consideration is $10.15 million for the sale of the assets, plus the value of stock on settlement
• The sale price is slightly in excess of book value
• Settlement on the 30th of June 2015
RATIONALE • Volatile earnings history
• Allows for greater management focus on Riverina-based
• Low-margin
12
For
per
sona
l use
onl
y
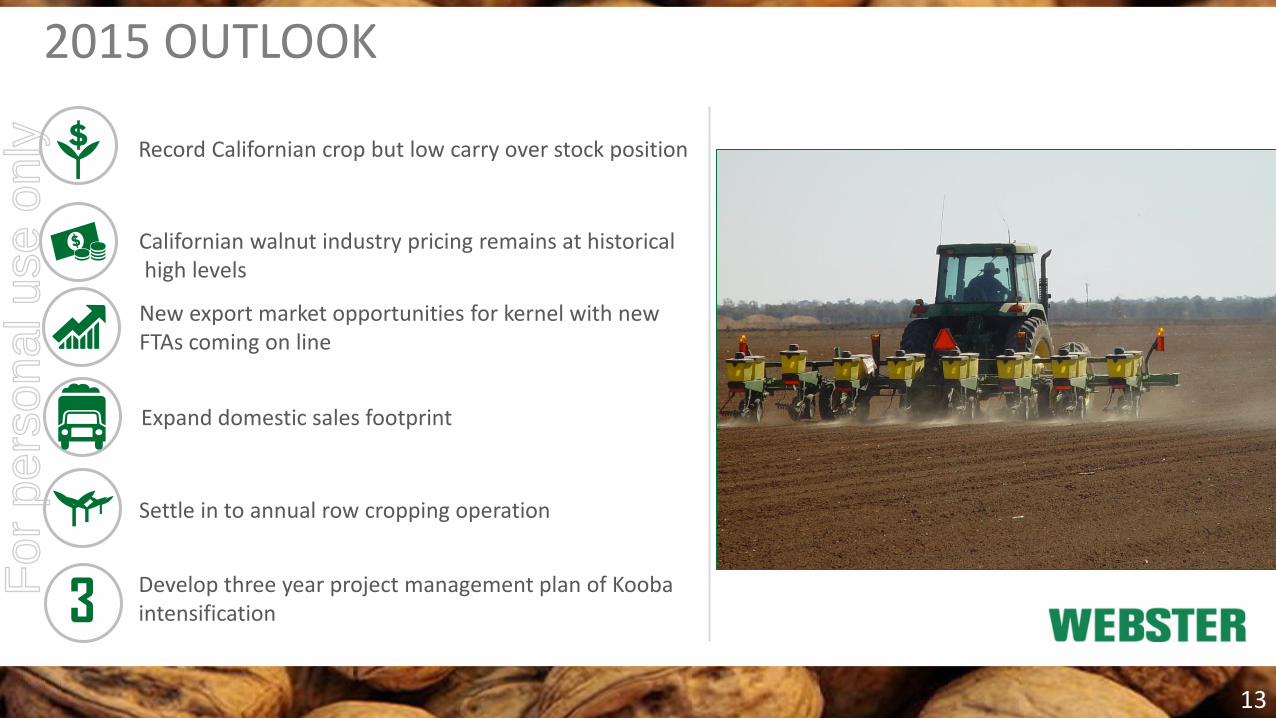
Record Californian crop but low carry over stock position
New export market opportunities for kernel with new FTAs coming on line
2015 OUTLOOK
Californian walnut industry pricing remains at historical high levels
Expand domestic sales footprint
Settle in to annual row cropping operation
Develop three year project management plan of Kooba intensification 3
13
For
per
sona
l use
onl
y
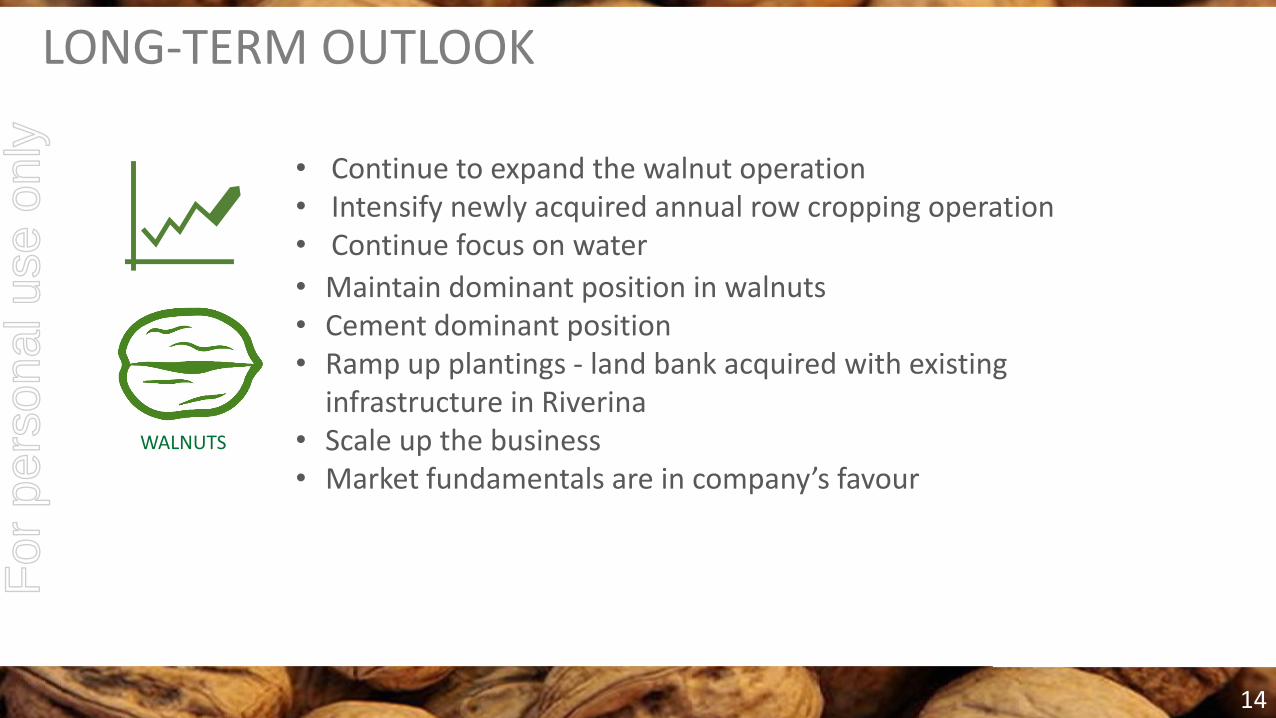
LONG-TERM OUTLOOK
• Maintain dominant position in walnuts • Cement dominant position • Ramp up plantings - land bank acquired with existing
infrastructure in Riverina • Scale up the business • Market fundamentals are in company’s favour
• Continue to expand the walnut operation • Intensify newly acquired annual row cropping operation • Continue focus on water
WALNUTS
14
For
per
sona
l use
onl
y

APPENDIX
15
For
per
sona
l use
onl
y
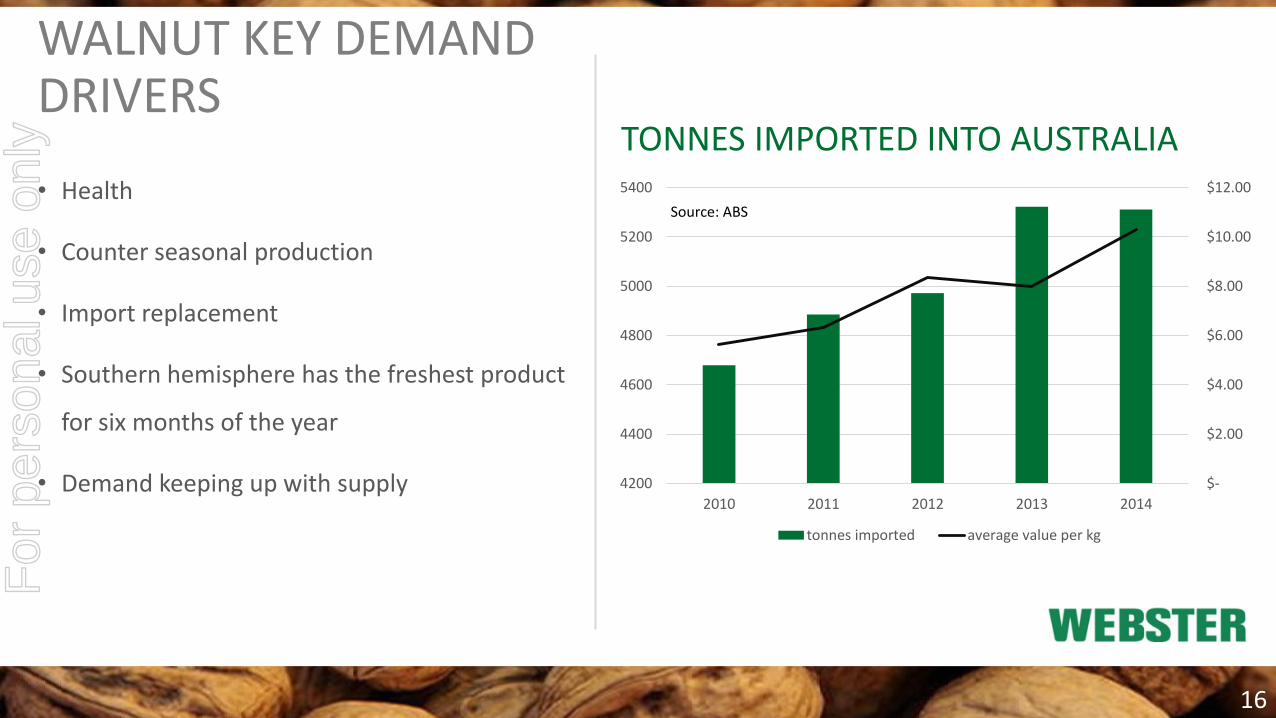
• Health
• Counter seasonal production
• Import replacement
• Southern hemisphere has the freshest product
for six months of the year
• Demand keeping up with supply
$-
$2.00
$4.00
$6.00
$8.00
$10.00
$12.00
4200
4400
4600
4800
5000
5200
5400
2010 2011 2012 2013 2014
tonnes imported average value per kg
TONNES IMPORTED INTO AUSTRALIA
WALNUT KEY DEMAND DRIVERS
16
Source: ABS
For
per
sona
l use
onl
y
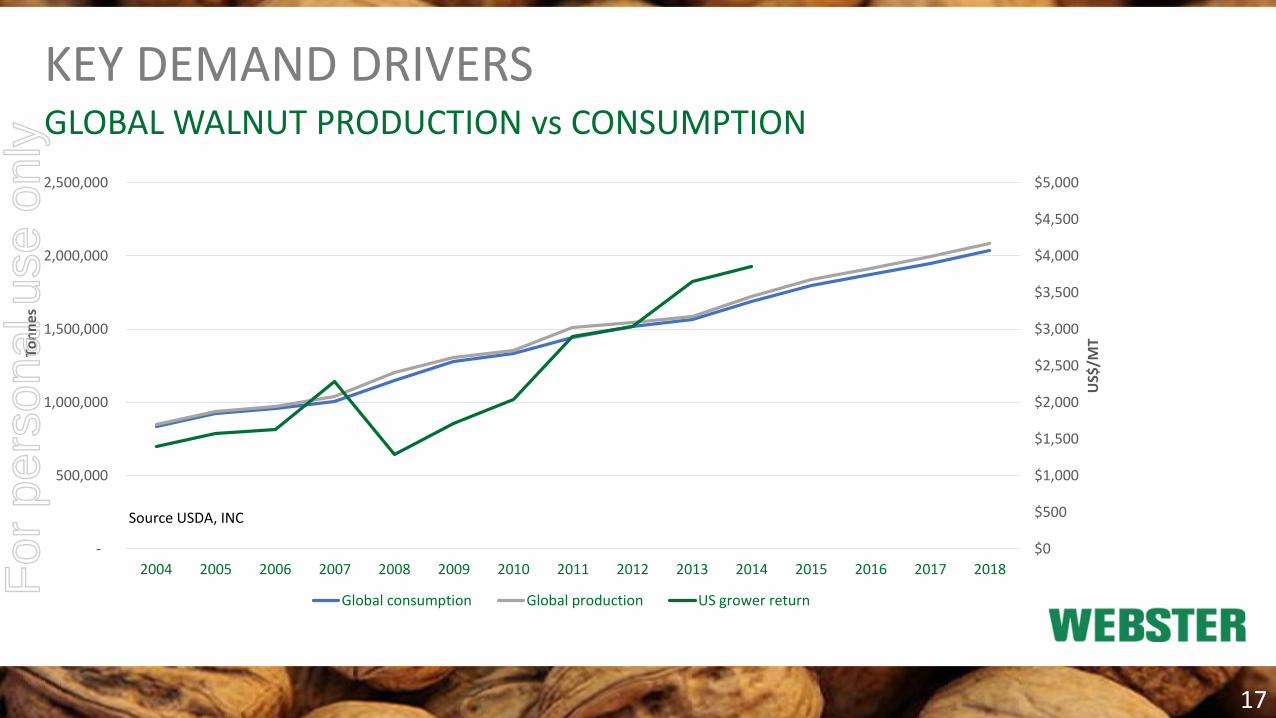
KEY DEMAND DRIVERS
$0
$500
$1,000
$1,500
$2,000
$2,500
$3,000
$3,500
$4,000
$4,500
$5,000
-
500,000
1,000,000
1,500,000
2,000,000
2,500,000
2004 2005 2006 2007 2008 2009 2010 2011 2012 2013 2014 2015 2016 2017 2018
US$
/MT
Ton
nes
Global consumption Global production US grower return
GLOBAL WALNUT PRODUCTION vs CONSUMPTION
17
Source USDA, INC
For
per
sona
l use
onl
y

WALNUTS AUSTRALIA
• Largest vertically integrated walnut business in southern hemisphere
• Owns and/or operates 2,200 ha of orchards in NSW & Tasmania
• Produce approx. 90% of the Australian walnut crop
• Existing orchards, incl. Avondale West orchard- estimated production: ~16,000t (in-shell) at maturity in 2025
• 3 revenue streams: Owned orchards, Managed investment income & Management fees
• Southern Hemisphere counter seasonal marketing position – freshest walnuts for six months of the year.
Leeton Site
SUMMARY OF OPERATION
18
For
per
sona
l use
onl
y
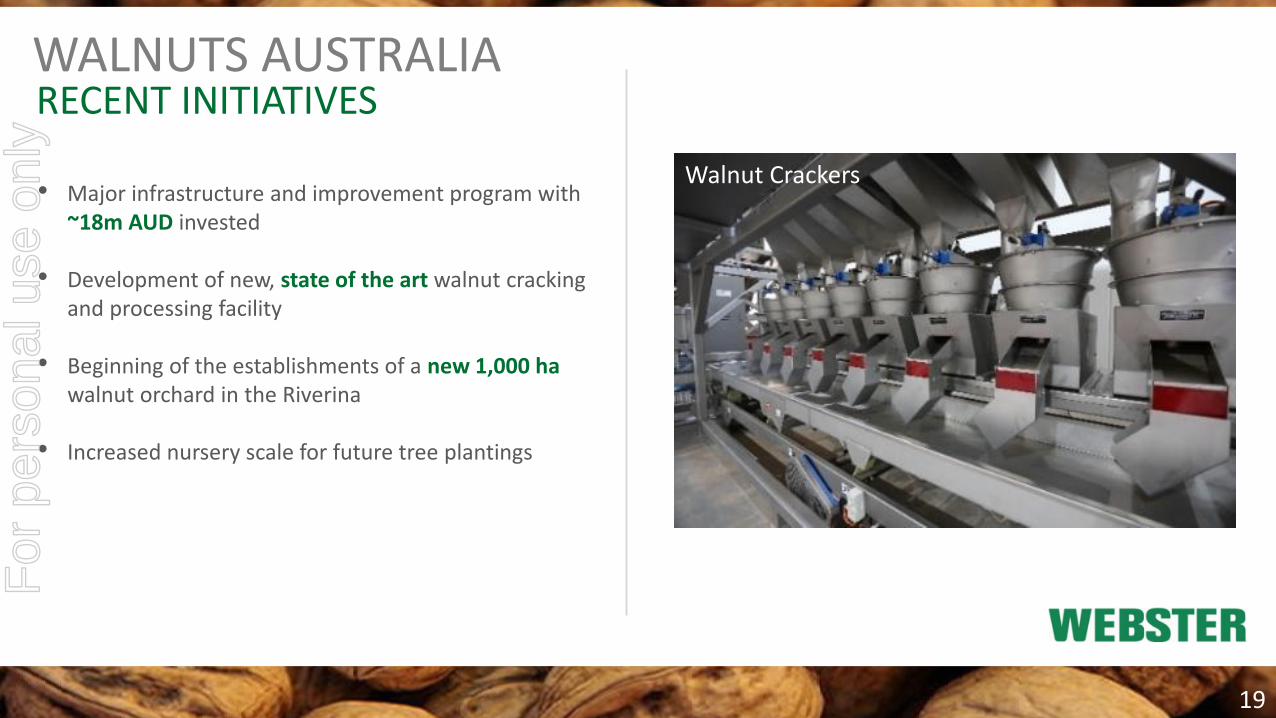
RECENT INITIATIVES
Walnut Crackers • Major infrastructure and improvement program with
~18m AUD invested
• Development of new, state of the art walnut cracking and processing facility
• Beginning of the establishments of a new 1,000 ha walnut orchard in the Riverina
• Increased nursery scale for future tree plantings
WALNUTS AUSTRALIA
19
For
per
sona
l use
onl
y
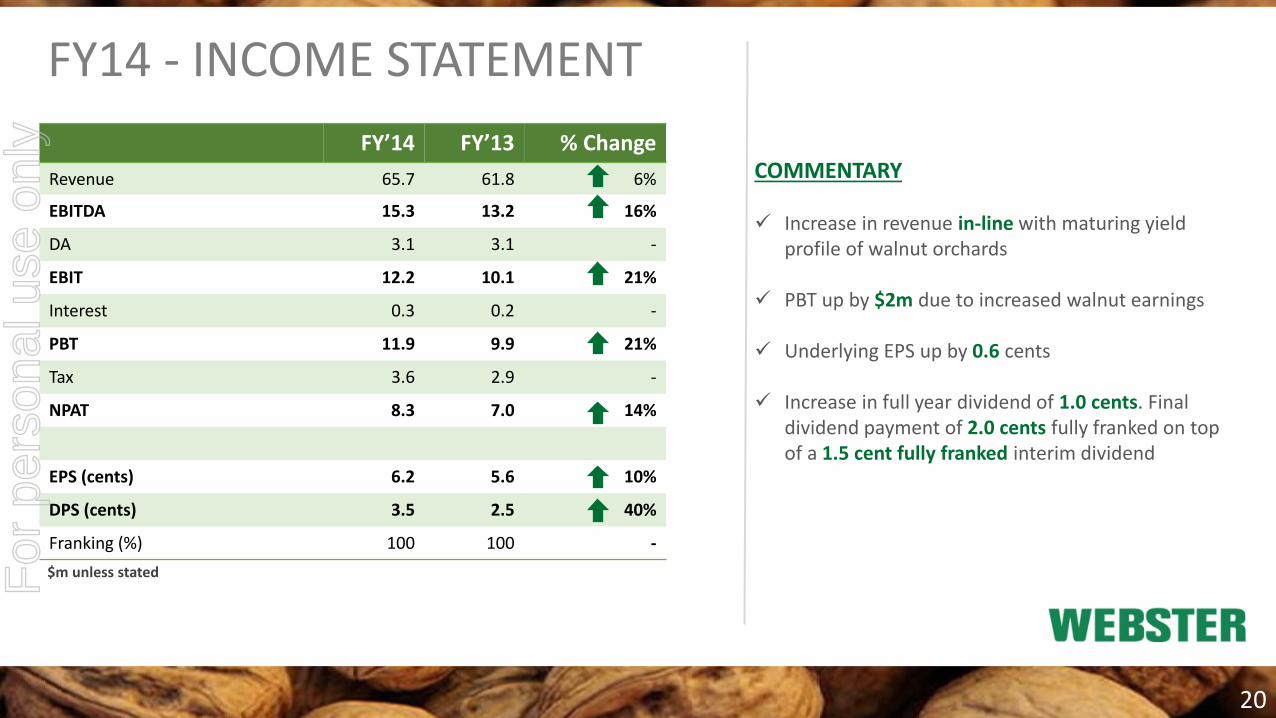
FY14 - INCOME STATEMENT
FY’14 FY’13 % Change
Revenue 65.7 61.8 6%
EBITDA 15.3 13.2 16%
DA 3.1 3.1 -
EBIT 12.2 10.1 21%
Interest 0.3 0.2 -
PBT 11.9 9.9 21%
Tax 3.6 2.9 -
NPAT 8.3 7.0 14%
EPS (cents) 6.2 5.6 10%
DPS (cents) 3.5 2.5 40%
Franking (%) 100 100 -
$m unless stated
COMMENTARY Increase in revenue in-line with maturing yield
profile of walnut orchards
PBT up by $2m due to increased walnut earnings
Underlying EPS up by 0.6 cents
Increase in full year dividend of 1.0 cents. Final dividend payment of 2.0 cents fully franked on top of a 1.5 cent fully franked interim dividend
20
For
per
sona
l use
onl
y
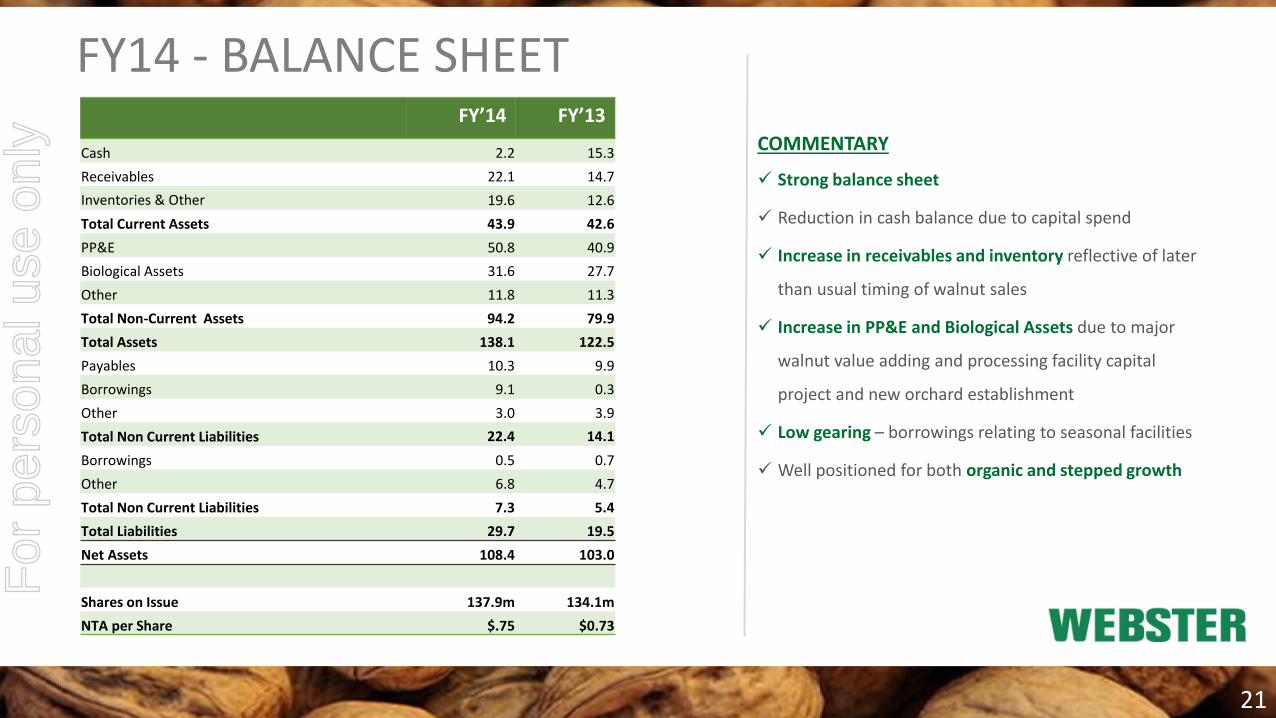
FY14 - BALANCE SHEET FY’14 FY’13
Cash 2.2 15.3
Receivables 22.1 14.7
Inventories & Other 19.6 12.6
Total Current Assets 43.9 42.6
PP&E 50.8 40.9
Biological Assets 31.6 27.7
Other 11.8 11.3
Total Non-Current Assets 94.2 79.9
Total Assets 138.1 122.5
Payables 10.3 9.9
Borrowings 9.1 0.3
Other 3.0 3.9
Total Non Current Liabilities 22.4 14.1
Borrowings 0.5 0.7
Other 6.8 4.7
Total Non Current Liabilities 7.3 5.4
Total Liabilities 29.7 19.5
Net Assets 108.4 103.0
Shares on Issue 137.9m 134.1m
NTA per Share $.75 $0.73
COMMENTARY
Strong balance sheet
Reduction in cash balance due to capital spend
Increase in receivables and inventory reflective of later
than usual timing of walnut sales
Increase in PP&E and Biological Assets due to major
walnut value adding and processing facility capital
project and new orchard establishment
Low gearing – borrowings relating to seasonal facilities
Well positioned for both organic and stepped growth
21
For
per
sona
l use
onl
y
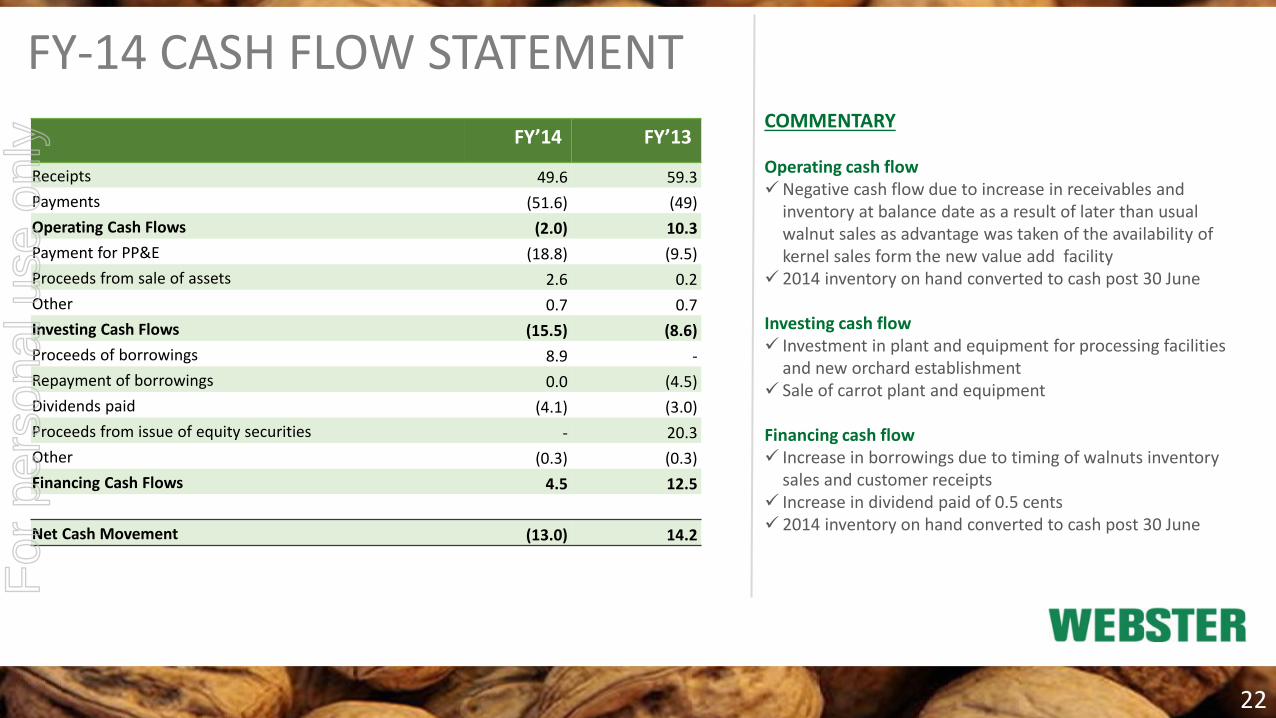
FY-14 CASH FLOW STATEMENT
FY’14 FY’13
Receipts 49.6 59.3
Payments (51.6) (49)
Operating Cash Flows (2.0) 10.3
Payment for PP&E (18.8) (9.5)
Proceeds from sale of assets 2.6 0.2
Other 0.7 0.7
Investing Cash Flows (15.5) (8.6)
Proceeds of borrowings 8.9 -
Repayment of borrowings 0.0 (4.5)
Dividends paid (4.1) (3.0)
Proceeds from issue of equity securities - 20.3
Other (0.3) (0.3)
Financing Cash Flows 4.5 12.5
Net Cash Movement (13.0) 14.2
COMMENTARY Operating cash flow Negative cash flow due to increase in receivables and
inventory at balance date as a result of later than usual walnut sales as advantage was taken of the availability of kernel sales form the new value add facility
2014 inventory on hand converted to cash post 30 June Investing cash flow Investment in plant and equipment for processing facilities
and new orchard establishment Sale of carrot plant and equipment Financing cash flow Increase in borrowings due to timing of walnuts inventory
sales and customer receipts Increase in dividend paid of 0.5 cents 2014 inventory on hand converted to cash post 30 June
22
For
per
sona
l use
onl
y
W E B S T E R G R O U P John Hosken – CEO
www.websterltd.com.au
23
For
per
sona
l use
onl
y


