For personal use only - ASX2016/10/18 · For personal use only Adventuredome Theme Park, Las...
96
For personal use only
Transcript of For personal use only - ASX2016/10/18 · For personal use only Adventuredome Theme Park, Las...

For
per
sona
l use
onl
y

© Nearmap Ltd 2016
2016 NearmapLimited AnnualReportABN 37 083 702 907
For
per
sona
l use
onl
y

For
per
sona
l use
onl
y

Image (above and cover): Sydney Opera House, Sydney, New South Wales, Australia – May 2016 Scan the code to see this location change over time.
For
per
sona
l use
onl
y

5
Chairman’s Letter 6CEO’s Report 9 Directors’ Report 26Auditor’s Declaration 48Consolidated Statement of Comprehensive Income 54Consolidated Statement of Financial Position 55Consolidated Statement of Changes in Equity 56Consolidated Statement of Cash Flows 57Notes to the Consolidated Financial Statements 58Directors’ Declaration 88Independent Auditor’s Report 89Shareholder Information 91Corporate Information 93
2016 Annual Report
Contents
Image (opposite page and cover): Sydney Opera House, Sydney, New South Wales, Australia – May 2016
5 2016 Annual Report
For
per
sona
l use
onl
y

6 Chairman's Letter
Chairman’s Letter
Dear Shareholders
It is a pleasure to present the Nearmap 2016 Annual Report, my fi rst as Chairman.
The 2016 fi nancial year has positioned Nearmap for further growth, with achievement on our three key priorities – accelerated growth in the Australian business, foundations for success in the United States and enhanced technology leadership.
The Australian business demonstrated accelerated growth in fi nancial year 2016 with revenue of $29.7M up 26% and gross profi t of $26.9M up 30% from the prior year. The investment in the Australian business, through enhanced sales and marketing capability and an experienced local management team, is driving this growth. We are selling our solutions into a growing Australian market so that in addition to high customer retention rates, we continue to see increased value of our product to existing customers plus strong growth in new customers.
Our international expansion into the United States has made signifi cant progress. Following from our fi rst commercial sales in the latter half of fi nancial year 2015, the US business generated revenue of $1M in fi nancial year 2016. A dedicated leadership team encompassing our sales, marketing and fi eld operations functions is in place and we have built the foundations for strong growth in fi nancial year 2017.
We also enhanced our technology leadership through continued investment in new technology and product development. While others in the industry just deliver camera systems, or do surveys, or produce image processing software or deliver maps as a one-off, Nearmap provides solutions which encompass that whole value chain. In addition, during fi nancial year 2016 we have signifi cantly enhanced the value of our product with a high effi ciency capture system and enhanced processing software that delivers richer 3D data to our customers.
Our balance sheet remains strong with no debt and a healthy cash balance of $12.2M as at year end. Our growth in Australia and effective management of our balance sheet has allowed us to fund the US expansion internally.
Details on our performance for the year, including the CEO’s Report and full set of fi nancial results, can be found in the sections following and I encourage you to read them.
In conclusion, I would like to thank our CEO, Rob Newman, together with his executive team of Gerhard Beukes, Paul Lapstun, Leah Rankin, John Biviano and Patrick Quigley for their hard work and achievements to date. We enter the new fi nancial year confi dent that Nearmap is well positioned for continued growth.
I would also like to thank my fellow Directors and our staff for their contributions and commitment to Nearmap. In particular, I would like to thank Ross Norgard, from whom I took over as Chair in March 2016 and who remains on the Board with his many years of experience in building the Nearmap business. I would like to welcome Ian Morris to the Board who joined in January 2016. Ian brings considerable U.S. and subscription business experience to the team.
I look forward to an exciting year ahead.
Peter JamesChairman
Sydney10 October 2016
Mr Peter JamesNon-Executive Chairman
Image: Adventuredome Theme Park, Las Vegas, Nevada, United States – February 2016
6 Chairman’s Letter6 Chairman's Letter
Chairman’s Letter
Dear Shareholders
It is a pleasure to present the Nearmap 2016 Annual Report, my fi rst as Chairman.
The 2016 fi nancial year has positioned Nearmap for further growth, with achievement on our three key priorities – accelerated growth in the Australian business, foundations for success in the United States and enhanced technology leadership.
The Australian business demonstrated accelerated growth in fi nancial year 2016 with revenue of $29.7M up 26% and gross profi t of $26.9M up 30% from the prior year. The investment in the Australian business, through enhanced sales and marketing capability and an experienced local management team, is driving this growth. We are selling our solutions into a growing Australian market so that in addition to high customer retention rates, we continue to see increased value of our product to existing customers plus strong growth in new customers.
Our international expansion into the United States has made signifi cant progress. Following from our fi rst commercial sales in the latter half of fi nancial year 2015, the US business generated revenue of $1M in fi nancial year 2016. A dedicated leadership team encompassing our sales, marketing and fi eld operations functions is in place and we have built the foundations for strong growth in fi nancial year 2017.
We also enhanced our technology leadership through continued investment in new technology and product development. While others in the industry just deliver camera systems, or do surveys, or produce image processing software or deliver maps as a one-off, Nearmap provides solutions which encompass that whole value chain. In addition, during fi nancial year 2016 we have signifi cantly enhanced the value of our product with a high effi ciency capture system and enhanced processing software that delivers richer 3D data to our customers.
Our balance sheet remains strong with no debt and a healthy cash balance of $12.2M as at year end. Our growth in Australia and effective management of our balance sheet has allowed us to fund the US expansion internally.
Details on our performance for the year, including the CEO’s Report and full set of fi nancial results, can be found in the sections following and I encourage you to read them.
In conclusion, I would like to thank our CEO, Rob Newman, together with his executive team of Gerhard Beukes, Paul Lapstun, Leah Rankin, John Biviano and Patrick Quigley for their hard work and achievements to date. We enter the new fi nancial year confi dent that Nearmap is well positioned for continued growth.
I would also like to thank my fellow Directors and our staff for their contributions and commitment to Nearmap. In particular, I would like to thank Ross Norgard, from whom I took over as Chair in March 2016 and who remains on the Board with his many years of experience in building the Nearmap business. I would like to welcome Ian Morris to the Board who joined in January 2016. Ian brings considerable U.S. and subscription business experience to the team.
I look forward to an exciting year ahead.
Peter JamesChairman
Sydney10 October 2016
Mr Peter JamesNon-Executive Chairman
Image: Adventuredome Theme Park, Las Vegas, Nevada, United States – February 2016
6 Chairman's Letter
Chairman’s Letter
Dear Shareholders
It is a pleasure to present the Nearmap 2016 Annual Report, my fi rst as Chairman.
The 2016 fi nancial year has positioned Nearmap for further growth, with achievement on our three key priorities – accelerated growth in the Australian business, foundations for success in the United States and enhanced technology leadership.
The Australian business demonstrated accelerated growth in fi nancial year 2016 with revenue of $29.7M up 26% and gross profi t of $26.9M up 30% from the prior year. The investment in the Australian business, through enhanced sales and marketing capability and an experienced local management team, is driving this growth. We are selling our solutions into a growing Australian market so that in addition to high customer retention rates, we continue to see increased value of our product to existing customers plus strong growth in new customers.
Our international expansion into the United States has made signifi cant progress. Following from our fi rst commercial sales in the latter half of fi nancial year 2015, the US business generated revenue of $1M in fi nancial year 2016. A dedicated leadership team encompassing our sales, marketing and fi eld operations functions is in place and we have built the foundations for strong growth in fi nancial year 2017.
We also enhanced our technology leadership through continued investment in new technology and product development. While others in the industry just deliver camera systems, or do surveys, or produce image processing software or deliver maps as a one-off, Nearmap provides solutions which encompass that whole value chain. In addition, during fi nancial year 2016 we have signifi cantly enhanced the value of our product with a high effi ciency capture system and enhanced processing software that delivers richer 3D data to our customers.
Our balance sheet remains strong with no debt and a healthy cash balance of $12.2M as at year end. Our growth in Australia and effective management of our balance sheet has allowed us to fund the US expansion internally.
Details on our performance for the year, including the CEO’s Report and full set of fi nancial results, can be found in the sections following and I encourage you to read them.
In conclusion, I would like to thank our CEO, Rob Newman, together with his executive team of Gerhard Beukes, Paul Lapstun, Leah Rankin, John Biviano and Patrick Quigley for their hard work and achievements to date. We enter the new fi nancial year confi dent that Nearmap is well positioned for continued growth.
I would also like to thank my fellow Directors and our staff for their contributions and commitment to Nearmap. In particular, I would like to thank Ross Norgard, from whom I took over as Chair in March 2016 and who remains on the Board with his many years of experience in building the Nearmap business. I would like to welcome Ian Morris to the Board who joined in January 2016. Ian brings considerable U.S. and subscription business experience to the team.
I look forward to an exciting year ahead.
Peter JamesChairman
Sydney10 October 2016
Mr Peter JamesNon-Executive Chairman
Image: Adventuredome Theme Park, Las Vegas, Nevada, United States – February 2016
For
per
sona
l use
onl
y

Adventuredome Theme Park, Las Vegas, Nevada, United States – February 2016
For
per
sona
l use
onl
y
Perth Stadium, Western Australia, Australia – July 2016 Scan the code to see this location change over time.
For
per
sona
l use
onl
y

9 CEO’s Report 9 CEO’s Report
CEO’s Report
Image: Perth Stadium, Western Australia, Australia – July 2016
The Australian operations demonstrate the value and success of our business model. We have seen accelerated growth in our Australian business. On all important metrics, such as revenue, annualised contract value (ACV), customer retention and customer numbers, that growth has been experienced across the entire Australian business. We have seen the increased value of our product result in growth not just in new customers, but also from increasing business with our existing customers, and not isolated to a particular type of customer or sector.
The fi rst stage of entry into the US market demonstrated the scope and potential. We have had early wins in this market, including from encumbent providers. We have also focussed on building the foundations to better address the market needs. This included putting local leadership in place, rebuilding our go-to-market strategy and broadening the capability of the product we deliver in that market. I am pleased to report that we delivered on all of this before the end of fi nancial year 2016. This has set up Nearmap for stronger growth in the US market.
Nearmap has also delivered on our third key priority; we have enhanced our technology and product leadership. Nearmap is unique in bringing together the complete value chain of capturing and delivering location content. This has enabled our disruptive business model, instant access via subscription to up to date aerial imagery. In fi nancial year 2016 we have signifi cantly enhanced the value of our product with a high effi ciency capture system and improved processing software that delivers richer data, such as 3D to our customers.
I am pleased to report that Nearmap delivered on its three key priorities for the 2016 fi nancial year. We have delivered accelerated growth in Australia, built the foundations for success in the US and enhanced our technology leadership. This has positioned Nearmap for continued growth as a disruptor in the global location content market.
Dr Rob NewmanManaging Director & CEO
9 CEO’s Report
CEO’s Report
Image: Perth Stadium, Western Australia, Australia – July 2016
The Australian operations demonstrate the value and success of our business model. We have seen accelerated growth in our Australian business. On all important metrics, such as revenue, annualised contract value (ACV), customer retention and customer numbers, that growth has been experienced across the entire Australian business. We have seen the increased value of our product result in growth not just in new customers, but also from increasing business with our existing customers, and not isolated to a particular type of customer or sector.
The fi rst stage of entry into the US market demonstrated the scope and potential. We have had early wins in this market, including from encumbent providers. We have also focussed on building the foundations to better address the market needs. This included putting local leadership in place, rebuilding our go-to-market strategy and broadening the capability of the product we deliver in that market. I am pleased to report that we delivered on all of this before the end of fi nancial year 2016. This has set up Nearmap for stronger growth in the US market.
Nearmap has also delivered on our third key priority; we have enhanced our technology and product leadership. Nearmap is unique in bringing together the complete value chain of capturing and delivering location content. This has enabled our disruptive business model, instant access via subscription to up to date aerial imagery. In fi nancial year 2016 we have signifi cantly enhanced the value of our product with a high effi ciency capture system and improved processing software that delivers richer data, such as 3D to our customers.
I am pleased to report that Nearmap delivered on its three key priorities for the 2016 fi nancial year. We have delivered accelerated growth in Australia, built the foundations for success in the US and enhanced our technology leadership. This has positioned Nearmap for continued growth as a disruptor in the global location content market.
Dr Rob NewmanManaging Director & CEO
For
per
sona
l use
onl
y

10 CEO’s Report
A Focus on Execution
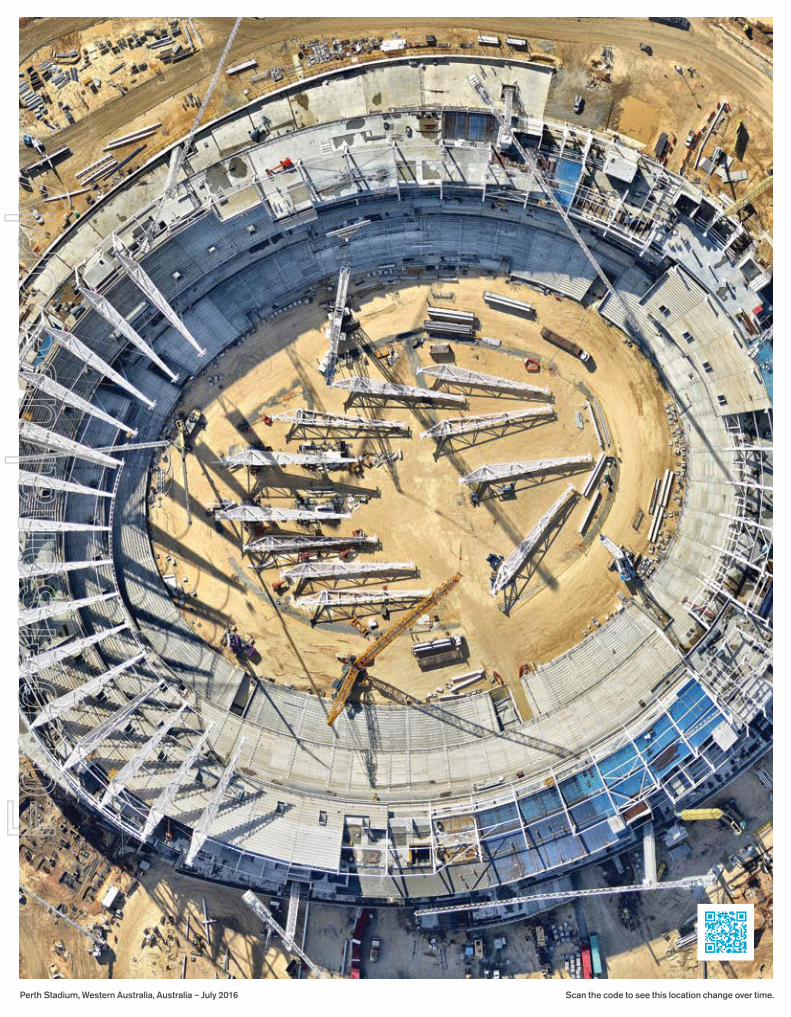
Image: City Beach, Western Australia, Australia – July 2016
Delivering these three priorities does not occur without an underlying effective business organisation. The Nearmap team is the foundation upon which we can achieve our goals. We now have over 120 employees in two countries who are working tirelessly to position us for continued growth. I would like to take this opportunity to thank them for their efforts during the year.
I would also like to thank my Executive team for the leadership and direction which they have provided. Since I commenced in the role as Managing Director & CEO, we have strengthened the executive team with key hires and promotions. It is a team that can scale with the growth of Nearmap.
Supporting all of this is a keen focus across the company on building shareholder value. Nearmap has a strong balance sheet, a track record of growth and demonstrated the operational leverage of our business model. We invest in initiatives that deliver top line growth, that enhance our industry leading position while being disciplined in cost management.
CEO’s Report
For
per
sona
l use
onl
y
11 CEO’s ReportScan the code to see this location change over time.City Beach, Western Australia, Australia – July 2016
For
per
sona
l use
onl
y

12 CEO’s Report
Delivering Accelerated Growth in Australia
– Grew our Australian ACV (Annualised Contract Value) portfolio 38% to $34.4M through a combination of adding new customers and strong upsells to existing customers.
– Added over 1,300 additional business customers, taking the total to 6,800 with over 50,000 active users of the Nearmap offering.
– Maintained our high customer retention rate through our unique offering and keen focus on understanding how our customers use our product.
– Continued to diversify our customer base across a broad range of industries, customer sizes and a wide variety of use cases.
– Based on understanding who uses our product and how it is used, we have identifi ed the addressable market for our current product is at least $250M per year in Australia.
– The portfolio lifetime value of the Australian customer base is $338M.
Image: Iluka, Western Australia, Australia – July 2016
CEO’s Report
For
per
sona
l use
onl
y

Scan the code to see this location change over time.Iluka, Western Australia, Australia – July 2016
For
per
sona
l use
onl
y

14 CEO’s Report
Image: Mile High Stadium, Denver, Colorado, United States – June 2016
Building the Foundations in the US
– Built an experienced local leadership team with skills in sales, marketing and geospatial technology.
– Rebuilt the marketing strategy with focussed, content-driven outbound campaigns.
– Captured fi rst oblique imagery and 3D data, an important requirement for the US market.
– Achieved an ACV portfolio of US$1.5M through a combination of renewals, upsells and adding new customers including key customer wins from competitors.
– Won new business as well as key customer wins from competitors.
– Built partnerships to enhance our customer reach with OmniEarth, Folsom Labs and RoofSnap.
CEO’s Report
For
per
sona
l use
onl
y

Scan the code to see this location change over time.Mile High Stadium, Denver, Colorado, United States – June 2016
For
per
sona
l use
onl
y

16 CEO’s Report
Image: Gold Coast, Queensland, Australia – August 2016
Enhancing our Technology Leadership
– Delivered industry leading 3D data which will open new uses of Nearmap’s location content.
– First commercial captures with HyperCamera2, which allow scaling for high effi ciency operation and large area captures.
– Proprietary processing software which delivers new content within days of capture was enhanced to allow extraction of 3D data.
– Built our internal systems to allow Nearmap to scale rapidly and globally.
– Unique business model: instant access via subscription to full content library.
– Our location content library has grown to over 800 Terabytes.
CEO’s Report
For
per
sona
l use
onl
y

Gold Coast, Queensland, Australia – August 2016
For
per
sona
l use
onl
y

18 18 CEO’s Report
Above: 2016 Nearmap Australia Team and 2016 Nearmap United States Team.Image right: Niagara Falls, New York, United States – April 2016.
World Class Team Committed to Success
– Experienced team of over 120 in Australia and the US with strong experience in subscription and cloud based businesses.
– Considerably strengthened executive team with key hires and promotions to provide stronger customer focus.
– Enhanced Board depth with the appointment of Peter James as Chairman and Ian Morris as US based Non-Executive Director.
– Established Nearmap core values and our company culture. We place the success of our people, our customers and our product at the core of our business.
CEO’s Report
For
per
sona
l use
onl
y

Scan the code to see this location change over time.Niagara Falls, New York, United States – April 2016.
For
per
sona
l use
onl
y

20 CEO’s Report
In Summary
The fi nancial year 2016 has been a transformational year for Nearmap. We have demonstrated the success of our business model and shown that we are a growth company with a long runway. We are already the leader in the Australian market and now a disruptor in the US market. We have built our team to allow us to scale and continued our investment in technology to extend our lead. In addition, we have started to build our fi rst strategic partnerships which will broaden our customer reach and add value to location content that we provide.
As we look forward we see the continued growth of Nearmap.Our business model and leadership in Australia is well established. We understand how our product is used and the value it provides and we see that we are early in the penetraton of our addressable market. A similar opportunity exists in the US. The market dynamics are different in the US, but we are a disruptor and based on our early successes we plan to drive strong growth in the US.
Looking to the long term we see the value of Nearmap’s offering increasing as we serve a number of rapidly emerging industries. Automation of tasks like driving, quoting, planning and auditing will rely on the accurate, up to date location data that Nearmap provides.
Dr Rob NewmanManaging Director & CEO10 October 2016
Image: Huntington Beach, California, United States – June 2016
CEO’s Report
For
per
sona
l use
onl
y

Scan the code to see this location change over time.Huntington Beach, California, United States – June 2016
For
per
sona
l use
onl
y

Residential Development, Azusa, California, United States – July 2014 Scan the code to see this location change over time.
For
per
sona
l use
onl
y

Residential Development, Azusa, California, United States – September 2014
For
per
sona
l use
onl
y

Residential Development, Azusa, California, United States – May 2015
For
per
sona
l use
onl
y

Residential Development, Azusa, California, United States – June 2016
For
per
sona
l use
onl
y

26 Directors’ Report
Directors’ Report
Your Directors submit their report on the consolidated entity consisting of Nearmap Ltd and the entities it controlled at the end of, or during, the year ended 30 June 2016.
DirectorsThe names and details of the Company’s Directors in offi ce during the fi nancial year and until the date of this report are as follows. Directors were in offi ce for this entire year unless otherwise stated.
Names, qualifi cations, experience, directorships and special responsibilities
Mr Peter James BA, FAICDNon-Executive Chairman (appointed 18 December 2015)
Peter has enjoyed a successful business career with a focus on building emerging technology, media and telecommunications companies.
Peter is a member of the Australian Computer Society, a Fellow of the Australian Institute of Company Directors and holds a Bachelor of Arts, Computer Science and Business Administration degree from the University of Canberra.
Previously amongst other roles, Peter was a long term director of iiNet where he chaired iiNet’s Strategy and Innovation Committee and was actively involved in the $1.5bn sale to TPG.Current ASX listed company directorshipsNearmap Ltd (since December 2015) – ChairmanMacquarie Telecom Ltd (ASX:MAQ) – ChairmanDroneshield Limited (ASX:DRO) – Chairman
Former ASX listed company directorships in the last 3 years:iiNet (ASX: IIN – de-listed 2015)
Special duties:Member of the Nomination and Remuneration CommitteeChair of the Audit and Risk Management Committee
Dr Rob Newman B.Eng(1st Hons), Ph.D.Managing Director & CEO
Rob was appointed as CEO of Nearmap on October 2015, after having been a Non-Executive Director of Nearmap (formerly ipernica) for almost 5 years.
He has established a unique track record as a successful Australian high technology entrepreneur in both Australia and Silicon Valley. He has twice founded and built businesses based on Australian technology, both times successfully entering overseas markets. These businesses combined have established market values of over $200M.
Rob is a trained engineer but has spent his career in marketing, business development and general management in Information Technology focusing on communications. Rob also spent ten years of his career as a venture capitalist co-founding Stone Ridge Ventures, and was previously an investment director for Foundation Capital. As a venture capitalist, Rob has extensive experience in identifying and helping grow companies with signifi cant commercial potential, especially those addressing overseas markets.
In the 1980's, Rob was the inventor and co-founder of QPSX Communications Pty Ltd. After founding the company, Rob provided the technical leadership and product strategy. Rob was instrumental in establishing QPSX as a worldwide standard for Metropolitan Area Networks and the company successfully sold products to Telecommunication Carriers in Australia, Europe, Asia and the US.
26 Directors’ Report
For
per
sona
l use
onl
y

27
Directors’ Report
Directors’ Report
Dr Newman has been recognised with a number of awards including the Bicentennial BHP Pursuit of Excellence Award (Youth Category) and Western Australian Young Achiever of the Year 1987.Current ASX listed company directorshipsNearmap Ltd (since February 2011)Pointerra Limited (ASX: 3DP) – Chairman
Former ASX listed company directorships in the last 3 yearsNone
Special dutiesNone
Mr Ross Norgard FCANon-Executive Director
In 1987, Ross became the founding Chairman of Nearmap Ltd.
Ross Norgard is a Fellow of the Institute of Chartered Accountants and former managing partner of Arthur Andersen and KMG Hungerfords and its successor fi rms in Perth, Western Australia. For over 30 years he has worked extensively in the fi elds of raising venture capital and the fi nancial reorganisation of businesses. He has held numerous positions on industry committees including past Chairman of the Western Australian Professional Standards Committee of the Institute of Chartered Accountants, a former member of the National Disciplinary Committee, former Chairman of the Friends of the Duke of Edinburgh's Award Scheme and a former member of the University of WA's Graduate School of management (MBA Program). Mr. Norgard was appointed Western Australia’s Honorary Consul-General to Finland.
Ross is also founding Chairman of Brockman Resources Ltd, now Non-Executive Director of ASX and Hong Kong listed Brockman Mining Ltd.Current ASX listed company directorshipsNearmap Ltd (since 1987)Brockman Mining Ltd (ASX:BCK)
Former ASX listed company directorships in the last 3 yearsAmmtec Ltd (ASX:AEC) (acquired by Australian Laboratory Services Pty Ltd)
Special dutiesMember of the Nominationand Remuneration CommitteeMember of the Audit and Risk Management Committee
Mr Ian Morris MBA Non-Executive Director (appointed 28 January 2016)
Ian has enjoyed a successful business career in the US technology sector. He brings this extensive and complementary experience to Nearmap at a time when the Company is accelerating its growth in the US.
Mr Morris served as the President and CEO of Market Leader for more than a decade, establishing the company as the leading provider of "software-as-a-service" solutions to the real estate industry. Under his leadership, Market Leader was ranked the 4th fastest growing technology company in North America, leading to a successful IPO in 2004 and the sale of the company to Trulia in 2013 for US$380 million.
From top to bottom: Mr Peter James Non-Executive ChairmanDr Rob Newman Managing Director & CEOMr Ross Norgard Non-Executive Director
27
From top to bottom: Mr Peter James Non-Executive Chairman Dr Rob Newman Managing Director & CEO Mr Ross Norgard Non-Executive Director
Directors’ Report
For
per
sona
l use
onl
y

28 Directors’ Report
Before joining Market Leader, Ian spent 7 years at Microsoft where he led a number of the company’s early online marketing efforts and later served as the General Manager of Microsoft HomeAdvisor.
Ian is a graduate of Bryant University, holds an MBA from Harvard Business School and serves as a strategic advisor and Board member with a number of leading technology companies. Current ASX listed company directorshipsNearmap Ltd (since January 2016)
Former ASX listed company directorships in the last 3 yearsNone
Special dutiesMember of the Nomination and Remuneration Committee
Mr Cliff RosenbergB.Bus.Sci., M.Sc. ManagementNon-Executive Director
Cliff Rosenberg is the Managing Director for LinkedIn South East Asia, Australia and New Zealand. LinkedIn is the world’s largest professional network with over 430 million members around the globe, of which over 8 million are in Australia.
In this role, Cliff’s focus is driving awareness and uptake of LinkedIn’s products, including talents solutions, marketing solutions and sales solutions. Since January 2010, Cliff has set up offi ces in Sydney, Melbourne and Perth, growing the local team to more than 250 staff, including sales, marketing and public relations personnel.
Cliff has a distinguished 20-year career in the digital space, both as an entrepreneur and executive. He was formerly the Managing Director of Yahoo! Australia and New Zealand where he was responsible for all aspects of the local operation for more than three years. He was a Non-Executive Director of Australia’s leading online restaurant booking platform, dimmi.com.au, which was sold to Tripadvisor in early 2015.
Prior to joining Yahoo!, Cliff was the Founder and Managing Director of iTouch Australia and New Zealand, a leading wireless application service provider. He grew the Australian offi ce to one of the largest mobile content and application providers in Australia with key partnerships with companies such as Ninemsn, Yahoo!, Telstra and Vodafone. Previously, Cliff was head of corporate strategy for Vodafone Australasia and also served as an international management consultant with Gemini Consulting and Bain Consulting. He earned a Master of Science degree in Management as well as Bachelor’s degree of Business Science in Economics and Marketing.Current ASX listed company directorshipsNearmap Ltd (since July 2012)Pureprofi le Ltd (ASX:PPL) Afterpay Ltd (ASX:AFY)
Former ASX listed company directorships in the last 3 yearsNone
Special dutiesChair of the Nomination and Remuneration CommitteeMember of the Audit and Risk Management Committee
From top to bottom: Mr Ian Morris Non-Executive Director Mr Cliff Rosenberg Non-Executive Director
Directors’ Report
28
From top to bottom: Mr Ian Morris Non-Executive Director Mr Cliff Rosenberg Non-Executive Director
Directors’ Report
For
per
sona
l use
onl
y

29 Directors’ Report
From top to bottom: Mr Ian Morris Non-Executive Director Mr Cliff Rosenberg Non-Executive Director
Corporate structureNearmap Ltd is a company limited by shares incorporated and domiciled in Australia.
Nature of operations and principal activitiesThe principal activity of the consolidated entity during the course of the fi nancial year was online aerial photomapping via its 100% owned subsidiaries Nearmap Australia Pty Ltd and Nearmap US Inc.
Business modelNearmap is an innovative online PhotoMap content provider that creates high quality current and changing maps. The Company generates revenues through licensing its content to a broad range of customers such as government agencies, the commercial sector and small to medium enterprises.
Nearmap’s breakthrough technology has been designed to fully automate the process of creating a high defi nition PhotoMap of large areas such as cities quickly and in a cost effective fashion. The technology enables PhotoMaps to be updated more frequently than other providers, which can be months, if not years out of date.
Nearmap’s strategy is to effectively monetise all of its content by providing convenient access to the content via desktop and mobile platforms, and through subscription models and value add products supported by e-commerce facilities.
The pivotal features underpinning the success of the Nearmap business model are:
– the frequency with which this data is updated;
– the clarity (resolution) of the PhotoMaps; and
– the availability of previous surveys on the same platform, allowing users to track changes at locations over time.
Consolidated resultThe consolidated entity’s result after provision for income tax was a loss of $7.1m (2015: loss of $0.8m).
Review and results of operationsFor the year ended 30 June 2016, Nearmap reported total revenue of $31.3m, up 20% on corresponding prior year revenue of $26.1m, underpinned by continued customerretention and growth in the customer base.
Nearmap’s balance sheet remains strong with no debt and a strong cash balance. During the year ended 30 June 2016, Nearmap invested in sales and marketing in the Australian business, the US expansion, and the HyperCamera2 system. Our cash balance remains strong at $12.2m at 30 June 2016.
Cash receipts from customers for the year were $37.3m compared to $26.9m for the previous year, an increase of $10.4m (39%).
DividendsNo dividends have been paid or proposed in respect of the current year (2015: nil).
Environmental regulation and performanceThe current activities of Nearmap are not subject to any signifi cant environmental regulation. However, the Board believes that Nearmap has adequate systems in place to manage its environmental obligations and is not aware of any breach of those environmental requirements as they apply to Nearmap.
Directors’ Report
Directors interests in the shares and options of the Company As at the date of this report, the interests of the Directors in the shares and options of Nearmap Ltd were:
Ordinary shares Options over ordinary sharesP James 190,000 2,500,000R Norgard 50,076,295 -R Newman 5,000,000 3,000,000C Rosenberg 2,901,000 1,500,000I Morris - 1,500,000
29 Directors’ Report
For
per
sona
l use
onl
y

30 Directors’ Report
Signifi cant changes in the state of affairsa) In August 2015, two US patents
for next-generation aerial camera systems were granted, with several more US patents pending. Progress continues to be made on the HyperCamera2 aerial camera system, which is designed to capture multi-directional oblique views at very high capture effi ciencies.
b) On 15 October 2015, Dr Rob Newman was appointed Managing Director and Chief Executive Offi cer of Nearmap while Mr Gerhard Beukes was promoted to Chief Operating Offi cer. Mr Beukes continues in his role of Chief Financial Offi cer.
c) On 18 December 2015, the Company appointed Mr Peter James as Deputy Chair and Non-Executive Director of the Company. Peter is an independent director under the Company’s defi nition of independence and is a member of the Nomination and Remuneration Committee and the Audit and Risk Management Committee.
d) On 7 December 2015, Nearmap announced the signing of a major contract with an existing customer, which increased its annual contract value to $1.47m. This contract demonstrated Nearmap’s successful business model of working in partnership with customers to grow wider and deeper adoption of Nearmap’s product, adding more value to its customers’ business.
e) On 28 January 2016, Nearmap appointed Mr Ian Morris as a Non-Executive Director of the Company. Ian is an independent director under the Company’s defi nition of independence and is a member of the Nomination and Remuneration Committee.
f) On 18 March 2016, Nearmap appointed Mr Peter James as the new Chair of the Company. The previous Chair, Mr Ross Norgard, remains on the Board as a Non-Executive Director.
g) On 31 May 2016, Nearmap announced that it had signed a signifi cant new one year subscription contract with an existing customer, one of Australia’s largest digital infrastructure companies. The new contract has an annual value of $1.1m and is the second in excess of $1m executed by Nearmap in FY16.
h) On 23 June 2016, Nearmap announced a new strategic partnership with OmniEarth, the US based leader in the Earth observation and geoanalysis industry, for nationwide high-resolution aerial imagery.
Signifi cant events subsequent to balance dateThere were no matters or circumstances specifi c to the Group that have arisen since 30 June 2016 that have signifi cantly affected or may signifi cantly affect:
– the Group’s operations in future fi nancial years; or
– the results of those operations in future fi nancial years; or
– the Group’s state of affairs in future fi nancial years.
Prospects for future yearsThe Directors believe that the business strategies put in place will ensure that the Group continues on its growth trajectory in the foreseeable future. Nearmap is primed to continue generating value to its shareholders in future years, subject to a stable macro-economic environment. The Group will continue to seek new opportunities to build scale and to broaden its customer base.
The Group faces a number of risks, including availability and cost of funds, which may impact on its ability to achieve its revenue targets.
Indemnifi cation and insurance of DirectorsDuring the fi nancial year, the Group paid a premium to insure the Directors and offi cers of the Group. The liabilities insured are legal costs that may be incurred in defending civil or criminal proceedings that may be brought against the offi cers in their capacity as offi cers of entities in the Group, and any other payments arising from liabilities incurred by the offi cers in connection with such proceedings. This does not include such liabilities that arise from conduct involving a wilful breach of duty by the offi cers or the improper use by the offi cers of their position or of information to gain advantage for themselves or someone else or to cause detriment to the Company. It is not possible to apportion the premium between amounts relating to the insurance against legal costs and those relating to other liabilities.
Directors’ Report
30 Directors’ Report
For
per
sona
l use
onl
y

31 Directors’ Report
Share optionsAs at 30 June 2016 there were 37,445,000 unissued ordinary shares under options. Refer to note 6 of the fi nancial statements for further details of the employee options outstanding.
Rounding of amountsThe Group is of a kind referred to in ASIC Corporations (Rounding in Financial/Directors’ Reports) Instrument 2016/191 and in accordance with that instrument, amounts in the consolidated fi nancial report and Directors’ Report have been rounded off to the nearest thousand dollars, unless otherwise stated.
Directors’ meetingsThe number of meetings of Directors (including meetings of committees of Directors) held during the fi nancial year and the number of meetings attended by each Director was as follows:
Nomination and Full Board Audit and Risk Remuneration Meetings Committee Meetings Committee Meetings A B A B A BP James1 4 4 1 1 2 2R Norgard 8 8 2 2 2 2R Newman2 8 7 1 1 - -C Rosenberg 8 7 2 2 2 2I Morris3 4 4 - - 2 2S Crowther4 1 1 - - - -
1 Appointed as Director 18 December 2015.2 Mr. Newman stepped down from the Audit and Risk Committee and the Nomination and Remuneration Committee upon his appointment into an executive role on 15 October 2015.3 Appointed as Director 28 January 2016.4 Ceased as Director 15 October 2015.
A Number of meetings held during the time the Director held offi ce and the Director was eligible to attend.B Number of meetings attended.
Directors’ Report
31 Directors’ Report
For
per
sona
l use
onl
y

32 Directors’ Report
This report outlines the remuneration arrangements in place for Directors and key management personnel of Nearmap Ltd (the Company) and the consolidated entity (the Group).
The Remuneration Report is set out under the following main headings:
A. Principles used to determine the nature and amount of remuneration;
B. Details of remuneration;
C. Employment contracts;
D. Share based compensation;
E. Transactions of key management personnel;
F. Additional information; and
G. Shares under option.
The information provided in this Remuneration Report has been audited as required by section 308(3C) of the Corporations Act 2001.
A. Principles used to determine the nature and amount of remunerationRemuneration philosophyThe performance of the Company depends upon the quality of its Directors and executives. To prosper, the Company must attract, motivate and retain highly skilled Directors and executives.
To this end, the Company embodies the following principles in its remuneration framework:
– Provide competitive rewards to attract high calibre executives;
– Link executive rewards to shareholder value; and
– Establish appropriate, demanding performance hurdles in relation to variable executive remuneration.
Nomination and Remuneration CommitteeThe Nomination and Remuneration Committee of the Board of Directors of the Company is responsible for determining and reviewing compensation arrangements for the Directors, the Managing Director (MD) and the senior management team and ensuring that the Board continues to operate within the established guidelines, including when necessary, selecting candidates for the position of Director.
The Nomination and Remuneration Committee assesses the appropriateness of the nature and amount of remuneration of Directors and key management personnel on a periodic basis by reference to relevant employment market conditions with the overall objective of ensuring maximum stakeholder benefi t from the retention of a high quality Board and executive team.
The amount of aggregate remuneration sought to be approved by shareholders and the manner in which it is apportioned amongst Directors is reviewed annually.
i) Services from remuneration consultants
The Board periodically reviews the level of fees paid to Non-Executive Directors, including seeking external advice. A review was undertaken during FY15 with the assistance of PwC. No change was made to fees, as the current level of fees is deemed appropriate.
Remuneration structureIn accordance with best practice corporate governance, the structure of Non-Executive Director and key management personnel remuneration is separate and distinct.
Non-Executive Director remuneration
Objective The Board seeks to set aggregate remuneration at a level which provides the Company with the ability to attract and retain Directors of the highest calibre, whilst incurring a cost which is acceptable to shareholders.
Structure The Constitution and the ASX Listing Rules specify that the aggregate remuneration of Non-Executive Directors shall be determined from time to time by a general meeting. An amount not exceeding the amount determined is then divided between the Directors as agreed. The latest determination was at the Annual General Meeting (AGM) held on 30 November 2015 when shareholders approved an aggregate remuneration of $500,000 per year.
Directors’ ReportRemuneration Report (Audited)
32 Directors’ Report
For
per
sona
l use
onl
y

33 Directors’ Report
A. Principles used to determine the nature and amount of remuneration (cont.)Remuneration structure (cont.)
Voting and comments made at the Company’s 2015 Annual General Meeting
The Company received 16.69% “no” votes on its Remuneration Report for the 2015 fi nancial year. The Company did not receive any specifi c feedback at the AGM or throughout the year on its remuneration practices.
Each Director receives a fee for being a Director of the Company. A further fee is paid where additional time commitment is required like that being required by the Chairman of the Company.
Key management personnel and Executive Director remuneration
Objective The Company aims to reward executives with a level and mix of remuneration commensurate with their position and responsibilities within the Company and so as to:
– reward executives and individual performance against key performance indicators;
– align the interests of executives with those of shareholders;
– link reward with the strategic goals and performance of the Group; and
– ensure total remuneration is competitive by market standards.
Structure Remuneration typically consists of the following key elements:
– Fixed Remuneration– Variable Remuneration– Short Term Incentive (STI); and– Long Term Incentive (LTI).
The proportion of fi xed remuneration and variable remuneration (potential short term and long term incentives) is established for each key management personnel by the Nomination and Remuneration Committee.
Fixed RemunerationObjective The level of fi xed remuneration is set so as to provide a base level of remuneration which is both appropriate to the position and is competitive in the market.
Fixed remuneration is reviewed annually by the Nomination and Remuneration Committee and the process consists of a review of individual performance, relevant comparative remuneration in the market and internal and, where appropriate, external advice on policies and practices.
The Board determined that no increase would be made to the fi xed remuneration for the Managing Director and all other key management Personnel in the 2016 fi nancial year as the current level of remuneration was considered appropriate.
Structure Senior executives are given the opportunity to receive their fi xed (primary) remuneration in a variety of forms including cash and fringe benefi ts such as motor vehicles and expense payment plans. It is intended that the manner of payment chosen will be optimal for the recipient without creating undue cost for the Company.
Variable Remuneration — Short Term Incentive (STI)
Objective The objective of the STI program is to link the achievement of the Company’s operational targets with the remuneration received by the employees charged with meeting those targets. The total potential STI where available is set at a level so as to provide suffi cient incentive to employees to achieve the operational targets and such that the cost to the Company is reasonable in the circumstances.
Structure Actual STI payments granted to each employee depend on the extent to which specifi c operating targets set are met. The operational targets consist of a number of Key Performance Indicators (KPIs) covering both fi nancial and non-fi nancial measures of performance. Typically included are measures such as contribution to net profi t after tax, customer management and leadership/team contribution.
Directors’ ReportRemuneration Report (Audited)
33 Directors’ Report
For
per
sona
l use
onl
y

34 Directors’ Report
Directors’ ReportRemuneration Report (Audited)
A. Principles used to determine the nature and amount of remuneration (cont.)
Remuneration structure (cont.)
On an annual basis, after consideration of performance against KPIs, an overall performance rating for the Group and each individual’s performance is made and is taken into account when determining the amount, if any, of the short term incentive pool to be allocated to each employee. The aggregate of annual STI payments available for employees across the Group is subject to the approval of the Nomination and Remuneration Committee. Payments made are usually delivered as a cash bonus. However, STI payments are subject to discretion by the Board based on performance at the end of the year.
Variable Remuneration – Long Term Incentive (LTI)
Objective The objective of the LTI plan is to reward employees in a manner which aligns this element of remuneration with the creation of shareholder wealth.
Australian employeesOptions are granted with a strike price of at least 143% of the share price prevailing at the time of the grant. Executives are therefore required to achieve a fi xed increase in share price of more than 43% before any value attracts to the individual.
The options have a 4 year term with the following service condition structures:
– service vesting condition of 1 year for 50% of each tranche granted and 2 years for the second 50% tranche, or;
– service vesting condition of 1 year for 33% of each tranche granted, 2 years for 33% of the next tranche and 3 years for the remaining 34%.
There are no performance related vesting conditions. The Board believes that this is a challenging fi xed target in share price over the option term and is therefore an appropriate mechanism to align company performance with that of the individual.
An employee loan scheme arrangement exists should an employee elect to apply for a loan on exercise of options, which may be granted subject to Nomination and Remuneration Committee discretion.
United States employeesOptions are granted with a strike price of the share price prevailing at the time of the grant.
The options have a 5 year term and a service vesting condition of 1 year for 25% of each tranche granted and then in equal tranches at 3 monthly intervals to 4 years for the remaining 75%. There are no performance related vesting conditions. The Board believes that this structure is necessary to attract and retain high calibre executives to deliver the Group’s strategy in the United States market. The Board ensures the alignment of company performance with that of the individual through the STI program as documented above.
Structure LTI grants to employees are delivered in the form of options and the amount is determined by the Nomination and Remuneration Committee having regard to:
– the seniority of the relevant Eligible Person and the position the Eligible Person occupies within the Company;
– the length of service of the Eligible Person with the Group;
– the record of employment of the Eligible Person with the Group;
– the potential contribution of the Eligible Person to the growth of the Group;
– the extent (if any) of the existing participation of the Eligible Person (or any Permitted Nominee in relation to that Eligible Person) in the Plan; and
– any other matters which the Board considers relevant.
.
34 Directors’ Report
For
per
sona
l use
onl
y

35 35 Directors’ Report
70,000
60,000
50,000
40,000
30,000
20,000
10,000
0
30/06/2012 31/12/2012 30/06/2013 31/12/2013 30/06/2014 31/12/2014 30/06/2015 31/12/2015 30/06/2016
0.9
0.8
0.7
0.6
0.5
0.4
0.3
0.2
0.1
0
A. Principles used to determine the nature and amount of remuneration (cont.)Remuneration structure (cont.)
Group performanceThe overall level of executive reward takes into account the nature of the technology commercialisation business and realistic timeframes for generating profi ts. In particular, executive rewards recognise the commercialisation of the Nearmap business and future shareholder wealth contained therein and progress in unlocking the value created to date. Executive performance of the Group has been reviewed over the past 5 years taking into account future shareholder wealth and profi t performance.
In considering the Group’s performance and benefi ts for shareholder wealth, the Nomination and Remuneration Committee has given regard to the following indices in respect of the current fi nancial year over the last 5 fi nancial years.
2016 2015 2014 2013 2012 $’000 $’000 $’000 $’000 $’000Revenue $31,289 $26,124 $20,069 $12,766 $6,106EBITDA (earnings before interest, tax, depreciation and amortisation)1 $632 $944 $3,384 $752 ($5,941)Change in share price ($0.18) $0.16 $0.17 $0.22 ($0.03)
1 EBITDA also excludes R&D tax rebates, foreign currency differences and impairment adjustments.
The graph below shows Nearmap’s closing share price since 1 July 2012 and the relative performance against the ASX All Ordinaries.
Directors’ ReportRemuneration Report (Audited)
NEA AORD
Directors’ Report
For
per
sona
l use
onl
y

36 Directors’ Report
B. Details of remunerationDirectorsThe following persons were Directors of the Company during the fi nancial year:
P James Non-Executive Chairman (appointed as Deputy Chairman on 18 December 2015, appointed Chairman on 18 March 2016)R Norgard Non-Executive Director (resigned as Non-Executive Chairman on 18 March 2016)S Crowther Chief Executive Offi cer (ceased 15 October 2015)R Newman Chief Executive Offi cer (appointed as Chief Executive Offi cer on 15 October 2015, previously Non-Executive Director)C Rosenberg Non-Executive DirectorI Morris Non-Executive Director (appointed 28 January 2016)
Other key management personnelThe following persons also had authority and responsibility for planning, directing and controlling the activities of the Group, directly or indirectly, during the fi nancial year:
G Beukes Chief Financial Offi cer and Chief Operating Offi cerP Lapstun Chief Technology Offi cerP Peterson Senior Vice President of Product and Engineering (resigned 29 December 2015)L Rankin Vice President of Product and Engineering (promoted to VP of Product and Engineering on 1 January 2016)J Biviano Senior Vice President and General Manager Australia (became a key management personnel on 1 July 2015)P Quigley Senior Vice President and General Manager North America (appointed on 31 January 2016)
Directors’ ReportRemuneration Report (Audited)
36 Directors’ Report
For
per
sona
l use
onl
y

37 Directors’ Report
B. Details of remuneration (cont.)Details of the remuneration of the Directors and the key management personnel (as defi ned in AASB 124 Related Party Disclosures):
Non-Executive Directors P James3 2016 44,140 - - - 4,193 85,918 134,251 -R Norgard4 2016 64,057 - - - 8,025 - 72,082 -R Norgard 2015 91,324 - - - 8,676 - 100,000 -C Rosenberg 2016 63,926 - - - 6,074 60,699 130,699 -C Rosenberg 2015 51,750 - - - 4,916 3,858 60,524 -I Morris5 2016 31,963 - - - 3,037 59,072 94,072 -
Subtotal Non-Executive Directors 2016 204,086 - - - 21,329 205,689 431,104 2015 143,074 - - - 13,592 3,858 160,524
Executive Directors R Newman6 2016 356,971 42,896 184,080 133 19,308 121,399 724,787 25%R Newman 2015 56,668 - - - - 3,858 60,526 - Former Executive Directors S Crowther7 2016 485,642 116,034 - - 6,841 - 608,517 -S Crowther 2015 435,718 63,787 140,000 15,064 21,162 727,303 1,403,034 10%
1 AASB 2 accounting value determined at grant date, recognised over related vesting periods, plus any incremental benefi t to key management personnel as the result of the grant of a limited recourse loan per the employee loan scheme as disclosed in note 6(i) per the fi nancial statements. 2 Non-monetary benefi ts include the cost to the Company of providing vehicle, living away from home benefi ts and accommodation.3 Mr James was appointed as Non-Executive Deputy Chairman on 18 December 2015, and was subsequently appointed as Non-Executive Chairman on 18 March 2016.4 Mr Norgard resigned as Non-Executive Chairman on 18 March 2016.5 Mr Morris was appointed as Non-Executive Director on 28 January 2016.6 Mr Newman was appointed as Chief Executive Offi cer on 15 October 2015. Prior to that appointment, he was a Non-Executive Director of the Company.7 Mr Crowther ceased employment on 15 October 2015.8 Includes annual leave.
Salary& Fees8
NonMonetary2
CashBonus
Long Service
Leave
Postemployment
benefi ts
Share-based
Paymentoptions1 Total
Percentage performance
related
Long-termShort-term
Directors’ ReportRemuneration Report (Audited)
37 Directors’ Report
For
per
sona
l use
onl
y

38 38 Directors’ Report
Directors’ ReportRemuneration Report (Audited)
Other key management personnel (Group) G Beukes3 2016 281,767 - 112,500 7,437 19,308 351,184 772,196 15%G Beukes 2015 241,263 - 100,000 2,975 22,267 562,380 928,885 11%P Lapstun 2016 280,210 - 150,000 3,046 19,308 351,507 804,071 19%P Lapstun 2015 247,552 - 100,000 1,281 22,425 417,346 788,604 13%L Rankin4 2016 193,479 - 76,650 129 18,335 44,370 332,963 23%L Rankin 2015 113,653 - 20,000 42 12,667 11,725 158,087 13%J Biviano 2016 325,889 - 130,966 170 19,308 269,913 746,246 18%J Biviano 2015 102,471 - 123,308 38 7,290 88,768 321,875 38%P Quigley5 2016 137,737 - 81,942 - 14,405 87,778 321,862 25%
Sub-total other key management personnel 2016 1,219,082 - 552,058 10,782 90,664 1,104,752 2,977,113 2015 704,939 - 343,308 4,336 64,649 1,080,219 2,197,451 Former key management personnel (Group) P Peterson6 2016 187,098 - - - 9,654 76,647 273,399 -P Peterson 2015 254,218 - 100,000 1,553 22,583 365,440 743,794 13%
Total Directors and key management personnel 2016 2,452,879 158,930 736,138 10,915 147,796 1,508,487 5,014,920 2015 1,594,617 63,787 583,308 20,953 121,986 2,180,678 4,565,329
1 AASB 2 accounting value determined at grant date, recognised over related vesting periods, plus any incremental benefi t to key management personnel as the result of the grant of a limited recourse loan per the employee loan scheme as disclosed in note 6(i) per the fi nancial statements. 2 Non-monetary benefi ts include the cost to the Company of providing vehicle, living away from home benefi ts and accommodation.3 Mr Beukes was appointed as Chief Operating Offi cer on 15 October 2015. He remains the Chief Financial Offi cer of the Company.4 Ms Rankin was promoted to VP of Engineering and Product on 1 January 2016.5 Mr Quigley joined the Company as Senior Vice President and General Manager North America on 31 January 2016.6 Mr Peterson resigned on 29 December 2015.7 Includes annual leave.
Salary& Fees7
NonMonetary2
CashBonus
Long Service
Leave
Postemployment
benefi ts
Share-based
Paymentoptions1 Total
Percentage performance
related
Long-termShort-term
B. Details of remuneration (cont.)
Directors’ Report
For
per
sona
l use
onl
y
39 39 Directors’ Report
Directors’ ReportRemuneration Report (Audited)
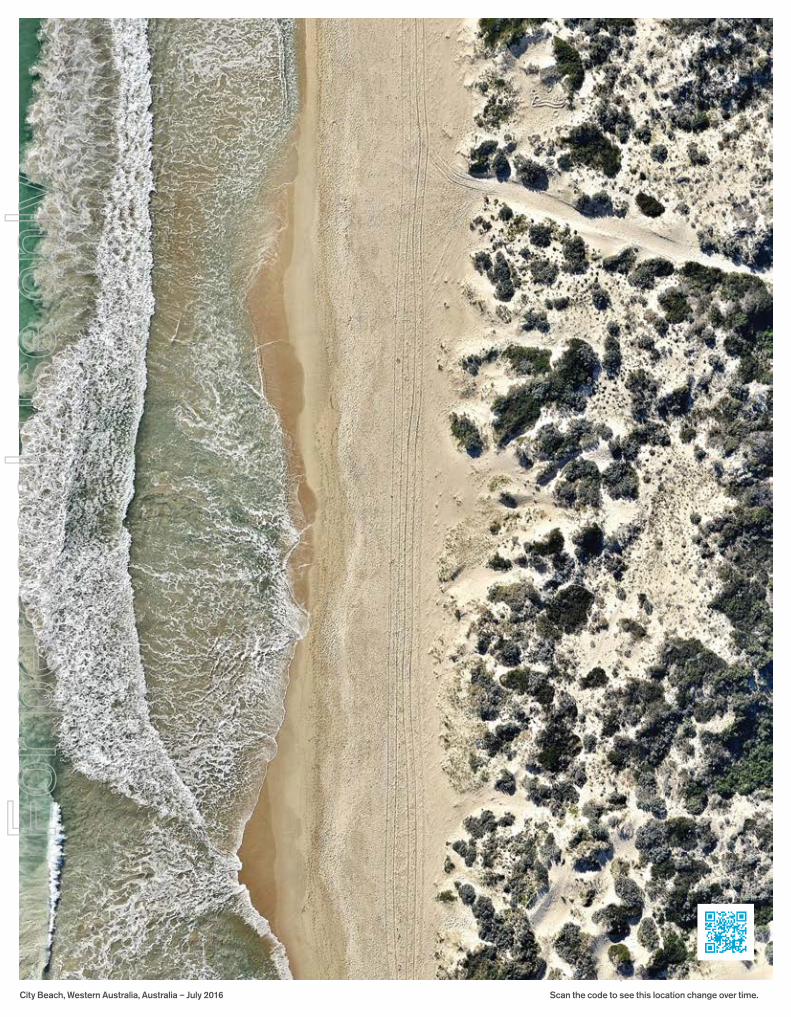
Fixed remuneration Salaries and benefi ts LTI1 At risk – STIName 2016 2016 2016Non-Executive Directors P James 36% 64% -R Norgard 100% - -C Rosenberg 54% 46% -I Morris 37% 63% - Former Executive Director S Crowther 100% - -
Executive Director R Newman 58% 17% 25% Other key management personnelG Beukes 40% 45% 15%P Lapstun 38% 44% 19%L Rankin 64% 13% 23%J Biviano 46% 36% 18%P Quigley 47% 27% 25%
Former other key management personnel P Peterson 72% 28% -
1 LTI awards have service related vesting conditions. See Section A for further details on the remuneration structure of Directors and key management personnel.
B. Details of remuneration (cont.)
Directors’ Report
For
per
sona
l use
onl
y

40 Directors’ Report
C. Employment contracts All executive employees and key management personnel are employed under contract. All executives have ongoing contracts and as such only have commencement dates and no expiry dates. Details of key management personnel and executives contracts as at 30 June are:
Name Notice period for termination at will Notice period for termination at causeR Newman 6 months 6 monthsG Beukes 4 months 4 monthsP Lapstun 4 months 4 monthsL Rankin 4 months 4 monthsJ Biviano 3 months 3 monthsP Quigley No notice period No notice period
– On resignation any unvested options are forfeited. Limited recourse loans (LRLs) are only granted to key management personnel in respect of vested options, therefore the loans are not subject to cancellation on resignation.
– The Company may terminate an employment agreement by providing the respective written notice period or provide payment in lieu of the notice period (based on the fi xed component of remuneration). On such termination by the Company, any LTI options that have vested, or will vest during the notice period will be required to be exercised within 180 days from termination date (unless agreed otherwise by the Company) or their options expiry date if earlier. LTI options that have not yet vested will be forfeited.
– The Company may terminate an employment contract at any time without notice if serious misconduct has occurred. Where termination with cause occurs, the employee is only entitled to that portion of remuneration which is fi xed, and only up to the date of termination. On termination with cause any unvested options will immediately be forfeited.
– If an employee ceases to be employed by the Company (including by way of resignation, retirement, dismissal, etc) and has an outstanding LRL, the employee may elect to have the Company sell the loan shares and apply the net proceeds of the sale in repayment of the loan or repay the outstanding amount on the loan. This determination must generally be made within 1 month of the date of ceased employment.
– There are no formal contracts between the Company and Non-Executive Directors in relation to remuneration other than the letter of appointment that stipulates the remuneration as at the commencement date.
Directors’ ReportRemuneration Report (Audited)
40 Directors’ Report
For
per
sona
l use
onl
y

41 41 Directors’ Report
D. Share based compensationOptionsA share option incentive scheme has been established whereby Directors and certain employees of the Group may be issued with options over the ordinary shares of the Company. The options, which are usually issued for nil consideration at an exercise price calculated with reference to prevailing market prices and a 43% premium thereon are issued in accordance with performance guidelines established by the Directors of the Company. The options are issued for terms of up to 4 years and are exercisable on various dates (usually in 2 or 3 equal annual tranches when vested) within 4 years from the issue date.
The options only vest under certain conditions, principally centred on the employee still being employed, or the Director still engaged, at the time of vesting (that is, once the service has been satisfi ed). The options cannot be transferred without the approval of the Company’s Board and are not quoted on the ASX. As a result plan participants may not enter into any transaction designed to remove the “at risk” aspect of an option before it is exercised.
Options were issued to Directors and key management personnel during the year ended 30 June 2016, refer to the table below and note 6 per the fi nancial statements for details.
Limited recourse loans (LRL)Nearmap’s Employee Share Option Plan includes an Employee Loan Scheme that permits Nearmap to grant fi nancial assistance to employees by way of LRLs to enable them to exercise options and acquire shares. Interest on the loans is payable by key management personnel at loan maturity and accrues daily. During the year the shareholders resolved to allow the Company to determine the rate of interest applicable to LRLs (currently the cash rate set by the Reserve Bank of Australia). Previously this was set at a statutory interest rate. Loans are repayable three years after the issue date subject to the total share value being greater that the loan’s principal plus accrued interest. The date of alteration was 30 November 2015, and the market price of the underlying equity on that date was $0.37. There were no other changes to the terms of the grant prior to and after the modifi cation.
Beukes Gerhard 1,000,000 9 Dec 2013 7 Dec 2013 0.0896 0.0862 0.0344 0.0349Lapstun Paul 2,500,000 8 Mar 2014 8 Mar 2017 0.1787 0.1705 0.0407 0.0421Lapstun Paul 2,500,000 8 Mar 2015 17 Apr 2015 0.1776 0.1637 0.0720 0.0746Beukes Gerhard 750,000 19 Dec 2013 27 Mar 2015 0.4955 0.4764 0.0259 0.0278Beukes Gerhard 750,000 19 Dec 2013 27 Mar 2015 0.5153 0.4803 0.0259 0.0278Beukes Gerhard 750,000 4 Apr 2014 17 Apr 2015 0.6310 0.6004 0.0331 0.0367Beukes Gerhard 750,000 4 Apr 2015 17 Apr 2015 0.6273 0.5767 0.0666 0.0708Beukes Gerhard 1,000,000 9 Dec 2013 7 Dec 2013 0.0896 0.0862 0.0338 0.0343
Employee Surname
Employee First Name
No. ofOptions
GrantDate
Maturation Date
Exercise Price Pre Modifi cation
Exercise Price Post Modifi cation
Pre Modifi cation Fair Value
Post Modifi cation Fair Value
Directors’ ReportRemuneration Report (Audited)
Directors’ Report
For
per
sona
l use
onl
y

42 Directors’ Report
D. Share based compensation (cont.)Compensation optionsEach option entitles the holder to subscribe for one fully paid ordinary share in the entity at an exercise price determined at a 43% premium to the market price of the shares on the date of grant. When an individual is granted a LRL to exercise their option, the effect is to extend the life of the original option. The exercise price includes interest accrued.
Exercise Price per share (options)/ Value per Current Value of Cancelled Option/ price exercised Granted Vested Unvested Exercised or expired Share at per share during the during the during the at balance during the during the Grant Date1 (loans)2 Vesting Expiry period3
30 June 2016 Number period period date period period Grant Date $ $ Date Date $
Directors P James - Options 833,333 100% - 100% - - Mar 16 0.1125 0.55 Mar 17 Mar 20 -- Options 833,333 100% - 100% - - Mar 16 0.1125 0.55 Mar 18 Mar 20 -- Options 833,334 100% - 100% - - Mar 16 0.1125 0.55 Mar 19 Mar 20 - R Newman - Options 1,000,000 100% - 100% - - Nov 15 0.1135 0.56 Nov 16 Nov 19 -- Options 1,000,000 100% - 100% - - Nov 15 0.1135 0.56 Nov 17 Nov 19 -- Options 1,000,000 100% - 100% - - Nov 15 0.1135 0.56 Nov 18 Nov 19 - C Rosenberg - Options 500,000 100% - 100% - - Nov 15 0.1135 0.56 Nov 16 Nov 19 -- Options 500,000 100% - 100% - - Nov 15 0.1135 0.56 Nov 17 Nov 19 -- Options 500,000 100% - 100% - - Nov 15 0.1135 0.56 Nov 18 Nov 19 - I Morris - Options 500,000 100% - 100% - - Mar 16 0.1547 0.40 Mar 17 Mar 20 -- Options 500,000 100% - 100% - - Mar 16 0.1547 0.40 Mar 18 Mar 20 -- Options 500,000 100% - 100% - - Mar 16 0.1547 0.40 Mar 19 Mar 20 - Former Director S Crowther - Options 2,500,000 - - - - 2,500,000 Nov 13 0.2943 0.76 Nov 15 Nov 17 -- Options 2,500,000 - - - - 2,500,000 Nov 13 0.2943 0.76 Nov 16 Nov 17 -- Options 1,000,000 - - - - 1,000,000 Nov 14 0.2160 1.08 Nov 16 Nov 18 -- Options 1,000,000 - - - - 1,000,000 Nov 14 0.2160 1.08 Nov 17 Nov 18 -- LRL4 5,000,000 - - - 5,000,000 - Dec 14 0.0775 0.0792 Nov 13 Dec 17 396,179- LRL 5,000,000 - - - 5,000,000 - Nov 13 0.0805 0.0838 Nov 14 Nov 16 419,021
1 AASB 2 accounting value determined at grant date as disclosed in note 6(i) per the fi nancial statements.2 Current price of LRLs determined based on the loan principal plus accrued interest divided by the number of shares exercised.3 Value determined based on the share price at exercise date less exercise price.4 Mr Crowther repaid his loans prior to the interest rate change.
Directors’ ReportRemuneration Report (Audited)
42 42 Directors’ Report
D. Share based compensation (cont.)Compensation optionsEach option entitles the holder to subscribe for one fully paid ordinary share in the entity at an exercise price determined at a 43% premium to the market price of the shares on the date of grant. When an individual is granted a LRL to exercise their option, the effect is to extend the life of the original option. The exercise price includes interest accrued.
Exercise Price per share (options)/ Value per Current Value of Cancelled Option/ price exercised Granted Vested Unvested Exercised or expired Share at per share during the during the during the at balance during the during the Grant Date1 (loans)2 Vesting Expiry period3
30 June 2016 Number period period date period period Grant Date $ $ Date Date $
Directors P James - Options 833,333 100% - 100% - - Mar 16 0.1125 0.55 Mar 17 Mar 20 -- Options 833,333 100% - 100% - - Mar 16 0.1125 0.55 Mar 18 Mar 20 -- Options 833,334 100% - 100% - - Mar 16 0.1125 0.55 Mar 19 Mar 20 - R Newman - Options 1,000,000 100% - 100% - - Nov 15 0.1135 0.56 Nov 16 Nov 19 -- Options 1,000,000 100% - 100% - - Nov 15 0.1135 0.56 Nov 17 Nov 19 -- Options 1,000,000 100% - 100% - - Nov 15 0.1135 0.56 Nov 18 Nov 19 - C Rosenberg - Options 500,000 100% - 100% - - Nov 15 0.1135 0.56 Nov 16 Nov 19 -- Options 500,000 100% - 100% - - Nov 15 0.1135 0.56 Nov 17 Nov 19 -- Options 500,000 100% - 100% - - Nov 15 0.1135 0.56 Nov 18 Nov 19 - I Morris - Options 500,000 100% - 100% - - Mar 16 0.1547 0.40 Mar 17 Mar 20 -- Options 500,000 100% - 100% - - Mar 16 0.1547 0.40 Mar 18 Mar 20 -- Options 500,000 100% - 100% - - Mar 16 0.1547 0.40 Mar 19 Mar 20 - Former Director S Crowther - Options 2,500,000 - - - - 2,500,000 Nov 13 0.2943 0.76 Nov 15 Nov 17 -- Options 2,500,000 - - - - 2,500,000 Nov 13 0.2943 0.76 Nov 16 Nov 17 -- Options 1,000,000 - - - - 1,000,000 Nov 14 0.2160 1.08 Nov 16 Nov 18 -- Options 1,000,000 - - - - 1,000,000 Nov 14 0.2160 1.08 Nov 17 Nov 18 -- LRL4 5,000,000 - - - 5,000,000 - Dec 14 0.0775 0.0792 Nov 13 Dec 17 396,179- LRL 5,000,000 - - - 5,000,000 - Nov 13 0.0805 0.0838 Nov 14 Nov 16 419,021
1 AASB 2 accounting value determined at grant date as disclosed in note 6(i) per the fi nancial statements.2 Current price of LRLs determined based on the loan principal plus accrued interest divided by the number of shares exercised.3 Value determined based on the share price at exercise date less exercise price.4 Mr Crowther repaid his loans prior to the interest rate change.
Directors’ ReportRemuneration Report (Audited)
42 Directors’ Report
D. Share based compensation (cont.)Compensation optionsEach option entitles the holder to subscribe for one fully paid ordinary share in the entity at an exercise price determined at a 43% premium to the market price of the shares on the date of grant. When an individual is granted a LRL to exercise their option, the effect is to extend the life of the original option. The exercise price includes interest accrued.
Exercise Price per share (options)/ Value per Current Value of Cancelled Option/ price exercised Granted Vested Unvested Exercised or expired Share at per share during the during the during the at balance during the during the Grant Date1 (loans)2 Vesting Expiry period3
30 June 2016 Number period period date period period Grant Date $ $ Date Date $
Directors P James - Options 833,333 100% - 100% - - Mar 16 0.1125 0.55 Mar 17 Mar 20 -- Options 833,333 100% - 100% - - Mar 16 0.1125 0.55 Mar 18 Mar 20 -- Options 833,334 100% - 100% - - Mar 16 0.1125 0.55 Mar 19 Mar 20 - R Newman - Options 1,000,000 100% - 100% - - Nov 15 0.1135 0.56 Nov 16 Nov 19 -- Options 1,000,000 100% - 100% - - Nov 15 0.1135 0.56 Nov 17 Nov 19 -- Options 1,000,000 100% - 100% - - Nov 15 0.1135 0.56 Nov 18 Nov 19 - C Rosenberg - Options 500,000 100% - 100% - - Nov 15 0.1135 0.56 Nov 16 Nov 19 -- Options 500,000 100% - 100% - - Nov 15 0.1135 0.56 Nov 17 Nov 19 -- Options 500,000 100% - 100% - - Nov 15 0.1135 0.56 Nov 18 Nov 19 - I Morris - Options 500,000 100% - 100% - - Mar 16 0.1547 0.40 Mar 17 Mar 20 -- Options 500,000 100% - 100% - - Mar 16 0.1547 0.40 Mar 18 Mar 20 -- Options 500,000 100% - 100% - - Mar 16 0.1547 0.40 Mar 19 Mar 20 - Former Director S Crowther - Options 2,500,000 - - - - 2,500,000 Nov 13 0.2943 0.76 Nov 15 Nov 17 -- Options 2,500,000 - - - - 2,500,000 Nov 13 0.2943 0.76 Nov 16 Nov 17 -- Options 1,000,000 - - - - 1,000,000 Nov 14 0.2160 1.08 Nov 16 Nov 18 -- Options 1,000,000 - - - - 1,000,000 Nov 14 0.2160 1.08 Nov 17 Nov 18 -- LRL4 5,000,000 - - - 5,000,000 - Dec 14 0.0775 0.0792 Nov 13 Dec 17 396,179- LRL 5,000,000 - - - 5,000,000 - Nov 13 0.0805 0.0838 Nov 14 Nov 16 419,021
1 AASB 2 accounting value determined at grant date as disclosed in note 6(i) per the fi nancial statements.2 Current price of LRLs determined based on the loan principal plus accrued interest divided by the number of shares exercised.3 Value determined based on the share price at exercise date less exercise price.4 Mr Crowther repaid his loans prior to the interest rate change.
Directors’ ReportRemuneration Report (Audited)
Directors’ Report
For
per
sona
l use
onl
y

43 Directors’ Report
D. Share based compensation (cont.)Compensation options (cont.) Exercise Price per share (options)/ Value per Current Value of Cancelled Option/ price exercised Granted Vested Unvested Exercised or expired Share at per share during the during the during the at balance during the during the Grant Date1 (loans)2 Vesting Expiry period3
30 June 2016 Number period period date period period Grant Date $ $ Date Date $
Other key management personnel G Beukes - Options 1,250,000 - 1,250,000 - - - Nov 13 0.2943 0.76 Nov 15 Nov 17 -- Options 1,250,000 - - 100% - - Nov 13 0.2943 0.76 Nov 16 Nov 17 -- Options 500,000 - - 100% - - Nov 14 0.2160 1.08 Nov 16 Nov 18 -- Options 500,000 - - 100% - - Nov 14 0.2160 1.08 Nov 17 Nov 18 -- Options 500,000 100% - 100% - - Nov 15 0.1157 0.56 Nov 16 Nov 19 -- Options 500,000 100% - 100% - - Nov 15 0.1157 0.56 Nov 17 Nov 19 -- Options 500,000 100% - 100% - - Nov 15 0.1157 0.56 Nov 18 Nov 19 -- LRL 1,000,000 - - - - - Dec 13 - 0.0805 Dec 13 Dec 16 -- LRL 750,000 - - - - - Apr 15 0.0425 0.4197 Dec 13 Apr 18 -- LRL 750,000 - - - - - Apr 15 0.0425 0.4197 Jun 14 Apr 18 -- LRL 750,000 - - - - - Apr 15 0.0419 0.5359 Apr 14 Apr 18 -- LRL 750,000 - - - - - Apr 15 0.0419 0.5359 Apr 15 Apr 18 -- LRL 1,000,000 - - - - - Mar 15 - 0.0761 Dec 14 Dec 18 - P Lapstun - Options 1,250,000 - 1,250,000 - - - Nov 13 0.2943 0.76 Nov 15 Nov 17 -- Options 1,250,000 - - 100% - - Nov 13 0.2943 0.76 Nov 16 Nov 17 -- Options 500,000 - - 100% - - Nov 14 0.2160 1.08 Nov 16 Nov 18 -- Options 500,000 - - 100% - - Nov 14 0.2160 1.08 Nov 17 Nov 18 -- Options 500,000 100% - 100% - - Nov 15 0.1157 0.56 Nov 16 Nov 19 -- Options 500,000 100% - 100% - - Nov 15 0.1157 0.56 Nov 17 Nov 19 -- Options 500,000 100% - 100% - - Nov 15 0.1157 0.56 Nov 18 Nov 19 -- LRL 2,500,000 - - - (2,500,000) - Mar 14 - 0.1611 Mar 14 Mar 17 416,231- LRL 2,500,000 - - - - - Mar 15 0.0070 0.1526 Mar 15 Mar 18 - L Rankin - Options 150,000 - - 100% - - Dec 14 0.1608 0.85 Dec 16 Dec 18 -- Options 150,000 - - 100% - - Dec 14 0.1608 0.85 Dec 17 Dec 18 -- Options 83,333 100% - 100% - - Nov 15 0.1157 0.56 Nov 16 Nov 19 -- Options 83,333 100% - 100% - - Nov 15 0.1157 0.56 Nov 17 Nov 19 -- Options 83,334 100% - 100% - - Nov 15 0.1157 0.56 Nov 18 Nov 19 -- Options 333,333 100% - 100% - - May 16 0.1532 0.68 May 17 May 20 -- Options 333,333 100% - 100% - - May 16 0.1532 0.68 May 18 May 20 -- Options 333,333 100% - 100% - - May 16 0.1532 0.68 May 19 May 20 -
1 AASB 2 accounting value determined at grant date as disclosed in note 6(i) per the fi nancial statements.2 Current price of LRLs determined based on the loan principal plus accrued interest divided by the number of shares exercised.3 Value determined based on the share price at exercise date less exercise price.
Directors’ ReportRemuneration Report (Audited)
43 43 Directors’ Report
D. Share based compensation (cont.)Compensation options (cont.) Exercise Price per share (options)/ Value per Current Value of Cancelled Option/ price exercised Granted Vested Unvested Exercised or expired Share at per share during the during the during the at balance during the during the Grant Date1 (loans)2 Vesting Expiry period3
30 June 2016 Number period period date period period Grant Date $ $ Date Date $
Other key management personnel G Beukes - Options 1,250,000 - 1,250,000 - - - Nov 13 0.2943 0.76 Nov 15 Nov 17 -- Options 1,250,000 - - 100% - - Nov 13 0.2943 0.76 Nov 16 Nov 17 -- Options 500,000 - - 100% - - Nov 14 0.2160 1.08 Nov 16 Nov 18 -- Options 500,000 - - 100% - - Nov 14 0.2160 1.08 Nov 17 Nov 18 -- Options 500,000 100% - 100% - - Nov 15 0.1157 0.56 Nov 16 Nov 19 -- Options 500,000 100% - 100% - - Nov 15 0.1157 0.56 Nov 17 Nov 19 -- Options 500,000 100% - 100% - - Nov 15 0.1157 0.56 Nov 18 Nov 19 -- LRL 1,000,000 - - - - - Dec 13 - 0.0805 Dec 13 Dec 16 -- LRL 750,000 - - - - - Apr 15 0.0425 0.4197 Dec 13 Apr 18 -- LRL 750,000 - - - - - Apr 15 0.0425 0.4197 Jun 14 Apr 18 -- LRL 750,000 - - - - - Apr 15 0.0419 0.5359 Apr 14 Apr 18 -- LRL 750,000 - - - - - Apr 15 0.0419 0.5359 Apr 15 Apr 18 -- LRL 1,000,000 - - - - - Mar 15 - 0.0761 Dec 14 Dec 18 - P Lapstun - Options 1,250,000 - 1,250,000 - - - Nov 13 0.2943 0.76 Nov 15 Nov 17 -- Options 1,250,000 - - 100% - - Nov 13 0.2943 0.76 Nov 16 Nov 17 -- Options 500,000 - - 100% - - Nov 14 0.2160 1.08 Nov 16 Nov 18 -- Options 500,000 - - 100% - - Nov 14 0.2160 1.08 Nov 17 Nov 18 -- Options 500,000 100% - 100% - - Nov 15 0.1157 0.56 Nov 16 Nov 19 -- Options 500,000 100% - 100% - - Nov 15 0.1157 0.56 Nov 17 Nov 19 -- Options 500,000 100% - 100% - - Nov 15 0.1157 0.56 Nov 18 Nov 19 -- LRL 2,500,000 - - - (2,500,000) - Mar 14 - 0.1611 Mar 14 Mar 17 416,231- LRL 2,500,000 - - - - - Mar 15 0.0070 0.1526 Mar 15 Mar 18 - L Rankin - Options 150,000 - - 100% - - Dec 14 0.1608 0.85 Dec 16 Dec 18 -- Options 150,000 - - 100% - - Dec 14 0.1608 0.85 Dec 17 Dec 18 -- Options 83,333 100% - 100% - - Nov 15 0.1157 0.56 Nov 16 Nov 19 -- Options 83,333 100% - 100% - - Nov 15 0.1157 0.56 Nov 17 Nov 19 -- Options 83,334 100% - 100% - - Nov 15 0.1157 0.56 Nov 18 Nov 19 -- Options 333,333 100% - 100% - - May 16 0.1532 0.68 May 17 May 20 -- Options 333,333 100% - 100% - - May 16 0.1532 0.68 May 18 May 20 -- Options 333,333 100% - 100% - - May 16 0.1532 0.68 May 19 May 20 -
1 AASB 2 accounting value determined at grant date as disclosed in note 6(i) per the fi nancial statements.2 Current price of LRLs determined based on the loan principal plus accrued interest divided by the number of shares exercised.3 Value determined based on the share price at exercise date less exercise price.
Directors’ ReportRemuneration Report (Audited)
43 Directors’ Report
D. Share based compensation (cont.)Compensation options (cont.) Exercise Price per share (options)/ Value per Current Value of Cancelled Option/ price exercised Granted Vested Unvested Exercised or expired Share at per share during the during the during the at balance during the during the Grant Date1 (loans)2 Vesting Expiry period3
30 June 2016 Number period period date period period Grant Date $ $ Date Date $
Other key management personnel G Beukes - Options 1,250,000 - 1,250,000 - - - Nov 13 0.2943 0.76 Nov 15 Nov 17 -- Options 1,250,000 - - 100% - - Nov 13 0.2943 0.76 Nov 16 Nov 17 -- Options 500,000 - - 100% - - Nov 14 0.2160 1.08 Nov 16 Nov 18 -- Options 500,000 - - 100% - - Nov 14 0.2160 1.08 Nov 17 Nov 18 -- Options 500,000 100% - 100% - - Nov 15 0.1157 0.56 Nov 16 Nov 19 -- Options 500,000 100% - 100% - - Nov 15 0.1157 0.56 Nov 17 Nov 19 -- Options 500,000 100% - 100% - - Nov 15 0.1157 0.56 Nov 18 Nov 19 -- LRL 1,000,000 - - - - - Dec 13 - 0.0805 Dec 13 Dec 16 -- LRL 750,000 - - - - - Apr 15 0.0425 0.4197 Dec 13 Apr 18 -- LRL 750,000 - - - - - Apr 15 0.0425 0.4197 Jun 14 Apr 18 -- LRL 750,000 - - - - - Apr 15 0.0419 0.5359 Apr 14 Apr 18 -- LRL 750,000 - - - - - Apr 15 0.0419 0.5359 Apr 15 Apr 18 -- LRL 1,000,000 - - - - - Mar 15 - 0.0761 Dec 14 Dec 18 - P Lapstun - Options 1,250,000 - 1,250,000 - - - Nov 13 0.2943 0.76 Nov 15 Nov 17 -- Options 1,250,000 - - 100% - - Nov 13 0.2943 0.76 Nov 16 Nov 17 -- Options 500,000 - - 100% - - Nov 14 0.2160 1.08 Nov 16 Nov 18 -- Options 500,000 - - 100% - - Nov 14 0.2160 1.08 Nov 17 Nov 18 -- Options 500,000 100% - 100% - - Nov 15 0.1157 0.56 Nov 16 Nov 19 -- Options 500,000 100% - 100% - - Nov 15 0.1157 0.56 Nov 17 Nov 19 -- Options 500,000 100% - 100% - - Nov 15 0.1157 0.56 Nov 18 Nov 19 -- LRL 2,500,000 - - - (2,500,000) - Mar 14 - 0.1611 Mar 14 Mar 17 416,231- LRL 2,500,000 - - - - - Mar 15 0.0070 0.1526 Mar 15 Mar 18 - L Rankin - Options 150,000 - - 100% - - Dec 14 0.1608 0.85 Dec 16 Dec 18 -- Options 150,000 - - 100% - - Dec 14 0.1608 0.85 Dec 17 Dec 18 -- Options 83,333 100% - 100% - - Nov 15 0.1157 0.56 Nov 16 Nov 19 -- Options 83,333 100% - 100% - - Nov 15 0.1157 0.56 Nov 17 Nov 19 -- Options 83,334 100% - 100% - - Nov 15 0.1157 0.56 Nov 18 Nov 19 -- Options 333,333 100% - 100% - - May 16 0.1532 0.68 May 17 May 20 -- Options 333,333 100% - 100% - - May 16 0.1532 0.68 May 18 May 20 -- Options 333,333 100% - 100% - - May 16 0.1532 0.68 May 19 May 20 -
1 AASB 2 accounting value determined at grant date as disclosed in note 6(i) per the fi nancial statements.2 Current price of LRLs determined based on the loan principal plus accrued interest divided by the number of shares exercised.3 Value determined based on the share price at exercise date less exercise price.
Directors’ ReportRemuneration Report (Audited)
Directors’ Report
For
per
sona
l use
onl
y

44 Directors’ Report
D. Share based compensation (cont.)Compensation options (cont.) Exercise Price per share (options)/ Value per Current Value of Cancelled Option/ price exercised Granted Vested Unvested Exercised or expired Share at per share during the during the during the at balance during the during the Grant Date1 (loans)2 Vesting Expiry period3
30 June 2016 Number period period date period period Grant Date $ $ Date Date $
Other key management personnel J Biviano - Options 1,000,000 - - 100% - - Mar 15 0.1453 0.79 Mar 16 Mar 19 -- Options 1,000,000 - - 100% - - Mar 15 0.1453 0.79 Mar 17 Mar 19 -- Options 1,000,000 - - 100% - - Mar 15 0.1453 0.79 Mar 18 Mar 19 -- Options 500,000 100% - 100% - - Nov 15 0.1157 0.56 Nov 16 Nov 19 -- Options 500,000 100% - 100% - - Nov 15 0.1157 0.56 Nov 17 Nov 19 -- Options 500,000 100% - 100% - - Nov 15 0.1157 0.56 Nov 18 Nov 19 - P Quigley - Options 375,000 100% - 100% - - Feb 16 0.1480 0.39 Feb 17 Jan 21 -- Options 93,750 100% - 100% - - Feb 16 0.1480 0.39 May 17 Jan 21 -- Options 93,750 100% - 100% - - Feb 16 0.1480 0.39 Aug 17 Jan 21 -- Options 93,750 100% - 100% - - Feb 16 0.1480 0.39 Nov 17 Jan 21 -- Options 375,000 100% - 100% - - Feb 16 0.1480 0.39 Nov 17 Nov 21 -- Options 93,750 100% - 100% - - Feb 16 0.1480 0.39 Feb 18 Jan 21 -- Options 93,750 100% - 100% - - Feb 16 0.1480 0.39 Feb 18 Nov 21 -- Options 93,750 100% - 100% - - Feb 16 0.1480 0.39 May 18 Jan 21 -- Options 93,750 100% - 100% - - Feb 16 0.1480 0.39 May 18 Nov 21 -- Options 93,750 100% - 100% - - Feb 16 0.1480 0.39 Aug 18 Jan 21 -- Options 93,750 100% - 100% - - Feb 16 0.1480 0.39 Aug 18 Nov 21 -- Options 93,750 100% - 100% - - Feb 16 0.1480 0.39 Nov 18 Jan 21 -- Options 93,750 100% - 100% - - Feb 16 0.1480 0.39 Nov 18 Nov 21 -- Options 93,750 100% - 100% - - Feb 16 0.1480 0.39 Feb 19 Jan 21 -- Options 93,750 100% - 100% - - Feb 16 0.1480 0.39 Feb 19 Nov 21 -- Options 93,750 100% - 100% - - Feb 16 0.1480 0.39 May 19 Jan 21 -- Options 93,750 100% - 100% - - Feb 16 0.1480 0.39 May 19 Nov 21 -- Options 93,750 100% - 100% - - Feb 16 0.1480 0.39 Aug 19 Jan 21 -- Options 93,750 100% - 100% - - Feb 16 0.1480 0.39 Aug 19 Nov 21 -- Options 93,750 100% - 100% - - Feb 16 0.1480 0.39 Nov 19 Jan 21 -- Options 93,750 100% - 100% - - Feb 16 0.1480 0.39 Nov 19 Nov 21 -- Options 93,750 100% - 100% - - Feb 16 0.1480 0.39 Feb 20 Jan 21 -- Options 93,750 100% - 100% - - Feb 16 0.1480 0.39 Feb 20 Nov 21 -- Options 93,750 100% - 100% - - Feb 16 0.1480 0.39 May 20 Nov 21 -- Options 93,750 100% - 100% - - Feb 16 0.1480 0.39 Aug 20 Nov 21 -- Options 93,750 100% - 100% - - Feb 16 0.1480 0.39 Nov 20 Nov 21 -
Former other key management personnel P Peterson - Options 1,250,000 - - - - 100% Nov 13 0.2943 0.76 Nov 15 Nov 17 -- Options 1,250,000 - - - - 100% Nov 13 0.2943 0.76 Nov 16 Nov 17 -- Options 500,000 - - - - 100% Nov 14 0.2160 1.08 Nov 16 Nov 18 -- Options 500,000 - - - - 100% Nov 14 0.2160 1.08 Nov 17 Nov 18 -
1 AASB 2 accounting value determined at grant date as disclosed in note 6(i) per the fi nancial statements.2 Current price of LRLs determined based on the loan principal plus accrued interest divided by the number of shares exercised.3 Value determined based on the share price at exercise date less exercise price.
Directors’ ReportRemuneration Report (Audited)
44
44 Directors’ Report
D. Share based compensation (cont.)Compensation options (cont.) Exercise Price per share (options)/ Value per Current Value of Cancelled Option/ price exercised Granted Vested Unvested Exercised or expired Share at per share during the during the during the at balance during the during the Grant Date1 (loans)2 Vesting Expiry period3
30 June 2016 Number period period date period period Grant Date $ $ Date Date $
Other key management personnel J Biviano - Options 1,000,000 - - 100% - - Mar 15 0.1453 0.79 Mar 16 Mar 19 -- Options 1,000,000 - - 100% - - Mar 15 0.1453 0.79 Mar 17 Mar 19 -- Options 1,000,000 - - 100% - - Mar 15 0.1453 0.79 Mar 18 Mar 19 -- Options 500,000 100% - 100% - - Nov 15 0.1157 0.56 Nov 16 Nov 19 -- Options 500,000 100% - 100% - - Nov 15 0.1157 0.56 Nov 17 Nov 19 -- Options 500,000 100% - 100% - - Nov 15 0.1157 0.56 Nov 18 Nov 19 - P Quigley - Options 375,000 100% - 100% - - Feb 16 0.1480 0.39 Feb 17 Jan 21 -- Options 93,750 100% - 100% - - Feb 16 0.1480 0.39 May 17 Jan 21 -- Options 93,750 100% - 100% - - Feb 16 0.1480 0.39 Aug 17 Jan 21 -- Options 93,750 100% - 100% - - Feb 16 0.1480 0.39 Nov 17 Jan 21 -- Options 375,000 100% - 100% - - Feb 16 0.1480 0.39 Nov 17 Nov 21 -- Options 93,750 100% - 100% - - Feb 16 0.1480 0.39 Feb 18 Jan 21 -- Options 93,750 100% - 100% - - Feb 16 0.1480 0.39 Feb 18 Nov 21 -- Options 93,750 100% - 100% - - Feb 16 0.1480 0.39 May 18 Jan 21 -- Options 93,750 100% - 100% - - Feb 16 0.1480 0.39 May 18 Nov 21 -- Options 93,750 100% - 100% - - Feb 16 0.1480 0.39 Aug 18 Jan 21 -- Options 93,750 100% - 100% - - Feb 16 0.1480 0.39 Aug 18 Nov 21 -- Options 93,750 100% - 100% - - Feb 16 0.1480 0.39 Nov 18 Jan 21 -- Options 93,750 100% - 100% - - Feb 16 0.1480 0.39 Nov 18 Nov 21 -- Options 93,750 100% - 100% - - Feb 16 0.1480 0.39 Feb 19 Jan 21 -- Options 93,750 100% - 100% - - Feb 16 0.1480 0.39 Feb 19 Nov 21 -- Options 93,750 100% - 100% - - Feb 16 0.1480 0.39 May 19 Jan 21 -- Options 93,750 100% - 100% - - Feb 16 0.1480 0.39 May 19 Nov 21 -- Options 93,750 100% - 100% - - Feb 16 0.1480 0.39 Aug 19 Jan 21 -- Options 93,750 100% - 100% - - Feb 16 0.1480 0.39 Aug 19 Nov 21 -- Options 93,750 100% - 100% - - Feb 16 0.1480 0.39 Nov 19 Jan 21 -- Options 93,750 100% - 100% - - Feb 16 0.1480 0.39 Nov 19 Nov 21 -- Options 93,750 100% - 100% - - Feb 16 0.1480 0.39 Feb 20 Jan 21 -- Options 93,750 100% - 100% - - Feb 16 0.1480 0.39 Feb 20 Nov 21 -- Options 93,750 100% - 100% - - Feb 16 0.1480 0.39 May 20 Nov 21 -- Options 93,750 100% - 100% - - Feb 16 0.1480 0.39 Aug 20 Nov 21 -- Options 93,750 100% - 100% - - Feb 16 0.1480 0.39 Nov 20 Nov 21 -
Former other key management personnel P Peterson - Options 1,250,000 - - - - 100% Nov 13 0.2943 0.76 Nov 15 Nov 17 -- Options 1,250,000 - - - - 100% Nov 13 0.2943 0.76 Nov 16 Nov 17 -- Options 500,000 - - - - 100% Nov 14 0.2160 1.08 Nov 16 Nov 18 -- Options 500,000 - - - - 100% Nov 14 0.2160 1.08 Nov 17 Nov 18 -
1 AASB 2 accounting value determined at grant date as disclosed in note 6(i) per the fi nancial statements.2 Current price of LRLs determined based on the loan principal plus accrued interest divided by the number of shares exercised.3 Value determined based on the share price at exercise date less exercise price.
Directors’ ReportRemuneration Report (Audited)
Directors’ Report
For
per
sona
l use
onl
y

45 Directors’ Report
D. Share based compensation (cont.)Modifi cation of terms of share-based payment transactionsA modifi cation of terms of share-based payment transactions occurred when the Board accepted key management personnel’s loan request to exercise fully vested options under the Employee Loan Scheme through a LRL in lieu of cash payment of the exercise price. See details below for share-based payment transactions which have been modifi ed in this way during the reporting period. Refer to Section E “Financial assistance under the employee share option plan” for further details in respect of the terms of the loans granted to these key management personnel.
E. Transactions of key management personnel Shares held in the Company
Balance at Exercise of Net Other Balance Balance held 30 June 2016 1 July 2015 Options Change 30 June 2016 nominallyDirectorsP James - - 190,000 190,000 190,000R Norgard 50,076,295 - - 50,076,295 50,036,295R Newman 4,000,000 - 1,000,000 5,000,000 5,000,000C Rosenberg 2,775,000 - 126,000 2,901,000 2,901,000I Morris - - - - -
Former Directors S Crowther1 10,000,000 - - n/a n/a
Other key management personnelG Beukes 5,755,000 - - 5,755,000 3,255,000P Lapstun 5,000,000 - (500,000) 4,500,000 4,500,000L Rankin - - - - -J Biviano - - - - -P Quigley - - - - -
1 Mr Crowther ceased his employment on 15 October 2015. At the date of cessation of employment, Mr Crowther held 10,000,000 Nearmap shares.
Directors’ ReportRemuneration Report (Audited)
45 Directors’ Report
For
per
sona
l use
onl
y

46 46 Directors’ Report
Directors’ ReportRemuneration Report (Audited)
E. Transactions of key management personnel (cont.)Loan options held in the Company Balance at Exercise of Net Other Balance Balance held 30 June 2016 1 July 2015 LRL Change1 30 June 2016 nominallyFormer DirectorsS Crowther2 10,000,000 (10,000,000) - n/a n/a Other key management personnelG Beukes 5,000,000 - - 5,000,000 5,000,000P Lapstun 5,000,000 - (2,500,000) 2,500,000 2,500,000 1 Includes expired options, cancellations and other acquisitions, transfers and disposals.2 Mr Crowther ceased his employment on 15 October 2015. As at the date of cessation of employment, Mr Crowther held 10,000,000 LRLs over 10,000,000 Nearmap shares.
Financial assistance under the Employee Share Option PlanLRLs advanced to key management personnel during the year ended 30 June 2016 amounted to $2,317,500 (30 June 2015: $3,067,500). Interest on the loans during the period has been accrued at rates of between 1.75% and 5.65%.
F. Additional informationThe Company has applied fair value measurement provisions of AASB 2 Share-based Payment for all options and LRLs granted to Directors and employees. The fair value of such grants is being amortised and disclosed as part of Director and employee remuneration on a straight-line basis over the vesting period. Options granted as part of Director and employee remuneration have been valued using the Black-Scholes Option Pricing Model, which takes account of factors including the option exercise price, the current level and volatility of the underlying share price, the risk-free interest rate, expected dividends on the underlying share, current market price of the underlying share and the expected life of the option. LRLs have also been valued using the Black-Scholes Option Pricing Model.
Refer to note 6(i) per the fi nancial statements for details of share based payments and all new options granted to all employees during the year ended 30 June 2016.
Directors’ Report
For
per
sona
l use
onl
y

47 Directors’ Report
G. Shares under optionUnissued ordinary shares of the Company under option at the date of this report are as follows:
Date options granted Expiry date Strike price of options Number under option8 April 2013 9 April 2017 $0.172 500,00012 April 2013 15 April 2017 $0.179 300,00022 July 2013 25 July 2017 $0.444 200,00030 September 2013 2 October 2017 $0.544 700,00021 November 2013 21 November 2017 $0.761 5,000,00024 February 2014 24 February 2018 $0.730 2,250,00021 November 2014 21 November 2018 $1.080 2,000,0008 December 2014 11 December 2018 $0.850 2,650,0006 March 2015 6 March 2019 $0.790 3,000,0007 July 2015 7 July 2015 $0.790 300,00030 November 2015 30 November 2019 $0.560 12,145,00030 November 2015 30 November 2020 $0.400 400,0001 February 2016 31 January 2021 $0.390 1,500,0001 February 2016 30 November 2021 $0.390 1,500,00018 March 2016 18 March 2020 $0.395 1,500,00018 March 2016 18 March 2020 $0.551 2,500,00020 May 2016 20 May 2020 $0.680 1,000,000 37,445,000
This is the end of the audited Remuneration Report.
Lead Auditor’s Independence DeclarationThe Lead Auditor’s Independence Declaration is set out on page 48 and forms part of the Directors’ Report for the fi nancial year ended 30 June 2016.
Signed in accordance with a resolution of the Directors.
On behalf of the Board
Dr R NewmanManaging Director & CEO23 August 2016
Directors’ ReportRemuneration Report (Audited)
47 Directors’ Report
For
per
sona
l use
onl
y

48 Auditor’s Declaration48 Auditor's Declaration
Lead Auditor’s Independence Declarati on under secti on 307Cof the Corporati ons Act 2001
To: the Directors of Nearmap Ltd
I declare that, to the best of my knowledge and belief, in relation to the audit for the fi nancial year ended 30 June 2016 there have been:
i) no contraventions of the auditor independence requirements as set out in the Corporations Act 2001 in relation to the audit; and
ii) no contraventions of any applicable code of professional conduct in relation to the audit.
KPMG
Trent DuvallPartner
Sydney
23 August 2016
Image: Southern California Logistics Airport, Victorville, California, United States – July 2016
KPMG, an Australian partnership and a member fi rm of the KPMG network of independent member fi rms affi liated with KPMG International Cooperative (“KPMG International”), a Swiss entity.
Liability limited by a scheme approved under Profession Standards Legislation.
For
per
sona
l use
onl
y

Image: Manly Vale, NSW – October 2014 49 Southern California Logistics Airport, Victorville, California, United States – July 2016
For
per
sona
l use
onl
y

50 Las Vegas, Nevada, United States – May 2016
For
per
sona
l use
onl
y

For
per
sona
l use
onl
y

Hope Valley, Western Australia, Australia – May 2016 Scan the code to see this location change over time.
For
per
sona
l use
onl
y

For
per
sona
l use
onl
y

54 Financial Report
Consolidated Notes 2016 2015 $’000 $’000Revenue 4 30,882 23,702Other income 4 407 2,422Total revenue 31,289 26,124 Expenses Employee benefi ts expense 6 (20,303) (15,357)Amortisation and depreciation (5,642) (3,137)Net foreign exchange differences (90) 398Other operational expenses 5 (9,947) (7,401)Total expenses (35,982) (25,497) (Loss) / profi t before tax (4,693) 627Income tax expense 7 (2,442) (1,416)Loss after tax (7,135) (789)
Other comprehensive income Exchange differences on translation of foreign operations 1 (205)Unrealised loss on cash fl ow hedges (31) (57) Total comprehensive loss attributable to members of the Company (7,165) (1,051) Loss per share attributable to the ordinary equity holders of the Company Basic loss per share (cents per share) 14 (2.01) (0.24)Diluted loss per share (cents per share) 14 (2.01) (0.24)
Consolidated Statement of Comprehensive Income for the year ended 30 June 2016
The above Consolidated Statement of Comprehensive Income should be read in conjunction with the accompanying notes.
54 Financial Report
For
per
sona
l use
onl
y

55 Financial Report
Consolidated 2016 2015Current assets Notes $’000 $’000Cash and cash equivalents 13 12,189 17,169Trade receivables 9 4,273 4,316Other current receivables 1,774 3,540Total current assets 18,236 25,025 Non-current assets Plant and equipment 12 6,167 4,381Intangible assets 11 17,240 11,266Deferred tax assets 7 2,624 4,697Total non-current assets 26,031 20,344
Total assets 44,267 45,369 Current liabilities Trade and other payables 1,339 1,620Unearned income 4 18,908 15,726Employee benefi ts 1,731 1,779Other current liabilities 1,005 1,069Current tax liabilities 123 -Total current liabilities 23,106 20,194 Non-current liabilities Deferred tax liabilities 7 2,525 2,411Employee benefi ts 143 184Total non-current liabilities 2,668 2,595 Total liabilities 25,774 22,789 Net assets 18,493 22,580 Equity Contributed equity 8 28,779 27,621Reserves 10,365 8,475Profi ts reserve 7,078 7,078Accumulated losses (27,729) (20,594)Total equity 18,493 22,580
Consolidated Statement of Financial Position as at 30 June 2016
The above Consolidated Statement of Financial Position should be read in conjunction with the accompanying notes.
55 Financial Report
For
per
sona
l use
onl
y

56 Financial Report
Share Based Contributed Accumulated Profi ts Payment Other Total Equity Losses Reserve Reserve Reserves EquityConsolidated $’000 $’000 $’000 $’000 $’000 $’000At 1 July 2015 27,621 (20,594) 7,078 8,737 (262) 22,580Loss for the year - (7,135) - - - (7,135)Other comprehensive income: Changes in fair value of cash fl ow hedges - - - - (31) (31)Exchange differences on translationof foreign operations - - - - 1 1Total comprehensive income for the year - (7,135) - - (30) (7,165)Transactions with owners of the Company: Loan share options exercised 1,139 - - - - 1,139Share options exercised 19 - - - - 19Share-based payment transactions - - - 1,920 - 1,920At 30 June 2016 28,779 (27,729) 7,078 10,657 (292) 18,493
Consolidated At 1 July 2014 27,113 (19,805) 7,078 6,119 - 20,505Loss for the year - (789) - - - (789)Other comprehensive income: Changes in fair value of cash fl ow hedges - - - - (57) (57)Exchange differences on translationof foreign operations - - - - (205) (205)Total comprehensive income for the year - (789) - - (262) (1,051)Transactions with owners of the Company: Share options exercised 508 - - - - 508Share-based payment transactions - - - 2,618 - 2,618At 30 June 2015 27,621 (20,594) 7,078 8,737 (262) 22,580
Consolidated Statement of Changes in Equity for the year ended 30 June 2016
The above Consolidated Statement of Changes in Equity should be read in conjunction with the accompanying notes.
56 Financial Report
For
per
sona
l use
onl
y

57 Financial Report
Consolidated Statement of Cash Flows for the year ended 30 June 2016
The above Consolidated Statement of Cash Flows should be read in conjunction with the accompanying notes.
Consolidated Notes 2016 2015Cash fl ows from operating activities $’000 $’000Receipts from customers 37,286 26,876Payments to suppliers and employees1 (38,703) (26,947)Interest received 454 545Other receipts - 76R&D refund received 1,828 -Income taxes received / (paid) 420 (420)Net cash from operating activities 13 1,285 130
Cash fl ows from investing activities Purchase of plant and equipment (3,035) (3,164)Payments for development costs (4,427) (3,935)Proceeds from sale of plant and equipment 72 11Net cash used in investing activities (7,390) (7,088) Cash fl ows from fi nancing activities Proceeds from exercise of share options 19 508Proceeds from exercise of loans share options 1,139 -Transfers to non cash trust deposits (112) -Net cash from fi nancing activities 1,046 508 Net decrease in cash and cash equivalents (5,059) (6,450)Cash and cash equivalents at beginning of year 17,169 23,347Effect of movement in exchange rates on cash held 79 272Cash and cash equivalents at end of year 13 12,189 17,169
1 Includes capture costs in Australia and the US of $1,964,000 and $5,350,000 respectively (2015: $2,091,000, $2,932,000).
57 Financial Report
For
per
sona
l use
onl
y

58 Financial Report
Notes to the Consolidated Financial Statements for the year ended 30 June 2016
1. Reporting entityNearmap Ltd (the ‘Company’) is a company limited by shares incorporated in Australia whose shares are publicly traded on the Australian Securities Exchange.
The Company’s registered offi ce is at Level 6, 6–8 Underwood Street Sydney NSW 2000. These consolidated fi nancial statements as at 30 June 2016 comprise the Company and its subsidiaries (collectively referred as the ‘Group’ and individually ‘Group entities’).
The Group is a for-profi t entity and the nature of the operations and principal activities of the Group are described in the Directors’ Report. The Group is primarily involved in the provision of online PhotoMap content via its 100% owned subsidiaries Nearmap Australia Pty Ltd and Nearmap US Inc.
The consolidated fi nancial statements for the year ended 30 June 2016 were authorised for issue in accordance with a resolution of the Directors on 23 August 2016.
2. Signifi cant accounting policiesSignifi cant accounting policies have been moved next to the respective note disclosure. Other relevant policies are in this section.
The notes include information which is required to understand the fi nancial statements and is material and relevant to the operations, fi nancial position and performance of the Group. The notes are organised into the following sections:
A. Basis ofpreparation
1. Reporting entity
2. Signifi cantaccounting policies
3. Other confi rmations
C. Capitalstructure & fi nancialrisk management
8. Contributed equity
9. Financial instruments– fair value and risk management
10. Dividends paid on ordinary shares
B. Key fi nancial results
4. Segment results & revenue
5. Other operationalexpenses
6. Personnel expenses
7. Income tax
D. Investing activities
11. Intangibles
12. Plant and equipment
13. Cash fl ow statement
E. Other
14. Earning per share
15. Expenditure commitments
16. Parent entity information
17. Group entities
18. Auditor’s remuneration
A. Basis of preparation
In this section: This section sets out the basis upon which the Group’s fi nancial statements are prepared as a whole. Specifi c accounting policies are described in their respective notes to the fi nancial statements. This section also shows information on new accounting standards, amendments and interpretations, and whether they are effective in 2016 or later years. We explain how these changes are expected to impact the fi nancial position and performance of the Group.
The Group’s current liabilities exceeded its current assets as at 30 June 2016 by $4,870,000 including a current liability for unearned income of $18,908,000. Unearned income includes income received in advance which has been deferred in the statement of fi nancial position until service is performed. The preliminary fi nal report has been prepared on a going concern basis, based on the Group’s cash fl ows for the current year and estimated profi ts and cash fl ows for future year.
58 Financial Report
For
per
sona
l use
onl
y

59 Financial Report
2. Signifi cant accounting policies (cont.)
a) Basis of accounting
The consolidated fi nancial statements are general purpose fi nancial statements which have been prepared in accordance with Australian Accounting Standards (AASBs) adopted by the Australian Accounting Standards Board (AASB) and the Corporations Act 2001. The consolidated fi nancial statements also comply with International Financial Reporting Standards (IFRS) as issued by the International Accounting Standards Board (IASB). The consolidated fi nancial statements have been prepared on a historical cost basis, except for the revaluation of certain fi nancial instruments. Cost is based on the fair values of the consideration given in exchange for assets.
All amounts are presented in Australian dollars, unless otherwise noted.
The Group is of a kind referred to in ASIC Corporations (Rounding in fi nancial/Directors’ Reports) Instrument 2016/191 and in accordance with that instrument, amounts in the consolidated fi nancial report and Directors’ Report have been rounded off to the nearest thousand dollars, unless otherwise stated.
Certain comparative amounts have been reclassifi ed to conform with current year presentation.
b) Changes in accounting policies and new standards and interpretations not yet adopted
A number of new standards, amendments to standards and interpretations are effective for annual periods beginning after 1 July 2016, and have not been applied in preparing these consolidated fi nancial statements. None of these are expected to have a signifi cant effect on the consolidated fi nancial statements of the Group, except for AASB 9 Financial Instruments, AASB15 Revenue from Contracts with Customers, and AASB 16 Leases, which become mandatory for the Group’s 2019, 2019 and 2020 consolidated fi nancial statements respectively and could change the classifi cation and measurement of fi nancial instruments, revenue recognition and lease recognition. The Group does not plan to adopt these standards early and the extent of the impact has not been determined.
c) Basis of consolidation
The fi nancial statements of subsidiaries are prepared for the same reporting period as the parent company, using consistent accounting policies.
In preparing the consolidated fi nancial statements, all intercompany balances and transactions, income and expenses and profi t and losses resulting from intra-group transactions have been eliminated.
Subsidiaries are entities controlled by the Company. The Company controls an entity when it is exposed to, or has rights to, variable returns from its involvement with the entity and has the ability to affect those returns through its power over the entity. The fi nancial statements of subsidiaries are included in the consolidated fi nancial statements from the date that control commences until the date that control ceases.
When the Company ceases to have control, joint control or signifi cant infl uence, any retained interest in the entity is remeasured to its fair value with the change in carrying amount recognised in profi t or loss. The fair value is the initial carrying amount for the purposes of subsequently accounting for the retained interest as an associate, jointly controlled entity or fi nancial asset. In addition, any amounts previously recognised in other comprehensive income in respect of that entity are accounted for as if the Company had directly disposed of the related assets or liabilities. This may mean that amounts previously recognised in other comprehensive income are reclassifi ed to profi t or loss.
A. Basis of preparation
Notes to the Consolidated Financial Statements for the year ended 30 June 2016
59 Financial Report
For
per
sona
l use
onl
y

60 Financial Report
Notes to the Consolidated Financial Statements for the year ended 30 June 2016
2. Signifi cant accounting policies (cont.)d) Signifi cant accounting judgements, estimates and assumptions
The carrying amount of certain assets and liabilities are often determined based on estimates and assumptions of future events. The key judgments and estimates which are material to the fi nancial report are found in the following notes:
– Note 6(i): Share-based payments– Note 7: Income tax– Note 11: Intangibles
e) Foreign currencies
i) Foreign currency transactionsBoth the functional and presentation currency of the Company and its Australian subsidiaries is Australian dollars (A$). Each entity in the Group determines its own functional currency and items included in the fi nancial statements of each entity are measured using that functional currency.
Transactions in foreign currencies are initially recorded in the functional currency at the exchange rates ruling at the date of the transaction. Monetary assets and liabilities denominated in foreign currencies are translated into the functional currency at the exchange rate at the reporting date.
Non-monetary items measured at fair value in a foreign currency are translated using the exchange rates at the date when the fair value was determined. Non-monetary items that are measured in terms of historical cost in a foreign currency are translated using the exchange rate as at the date of the initial transaction.
Foreign currency differences are generally recognised in profi t or loss. However, foreign currency differences arising from the translation of the following item is recognised in OCI:
– qualifying cash fl ow hedges to the extent that the hedges are effective.
ii) Foreign operationsThe assets and liabilities of foreign operations are translated into Australian dollars at the exchange rates at the reporting date. The income and expenses of foreign operations are translated into Australian dollars at the exchange rates at the dates of the transactions. Foreign currency differences are recognised in OCI and accumulated in the translation reserve.
3. Other confi rmationsContingent liabilitiesAs at 30 June 2016, the Directors are not aware of any contingent liabilities in relation to the Company or the Group.
Subsequent eventsThere were no matters or circumstances specifi c to the Company or the Group that have arisen since 30 June 2016 that have signifi cantly affected or may signifi cantly affect:
– the Company or Group’s operations in future years;
– the results of those operations in future fi nancial years; or
– the Company or Group’s state of affairs in future fi nancial years.
Related partiesOther than the loans granted under the employee loan scheme as disclosed in note 6 per the fi nancial statements, there have been no sales, purchases or other transactions with related parties during the year ended 30 June 2016 (year ended 30 June 2015: nil).
A. Basis of preparation
60 Financial Report
For
per
sona
l use
onl
y
61 Financial Report
4. Segment results and revenueThis note provides results by operating segment for the year ended 30 June 2016. Operating segments are reported in a manner that is consistent with the internal reporting provided to the Chief Operating Decision Maker. The Chief Operating Decision Maker has been identifi ed as the Nearmap Board who ultimately makes strategic decisions. This note also provides additional information on revenue, including types of revenue and the respective recognition criteria.
i) Segment reportingAn overview of the new operating segments is provided below:
Cost of revenue are all the costs directly attributable to the ongoing delivery of the subscription product, including amortisation of capture costs and technology costs.
Sales and marketing costs include direct in-country costs.
General and administration costs for the Corporate segment represent all operating expenses and product design and uncapitalised development expenses.
The assets and liabilities of the Group are reported and reviewed by the Chief Operating Decision Maker in total and not allocated by operating segment. Therefore, operating segment assets and liabilities are not disclosed.
Notes to the Consolidated Financial Statements for the year ended 30 June 2016
Segment InformationAustralia Responsible for all sales and marketing efforts in Australia. United States Responsible for all sales and marketing efforts in the United States. Corporate Holds all the IP and product “know-how” which allows Nearmap to deliver its product offering, being online aerial photomapping. The segment facilitates the day to day survey operations globally.
B. Key fi nancial results
In this section: This section explains the results and performance of Nearmap Ltd and provides additional information about those individual line items in the fi nancial statements that the Directors consider most relevant in the context of the operations of the entity, including:
a) Accounting policies that are relevant for understanding the items recognised in the fi nancial statements; and
b) Analysis of the Group’s result for the year by reference to key areas, including: segment results and revenue, operational expenses, personnel costs including share-based payments and income tax.
61 Financial Report
For
per
sona
l use
onl
y

62 Financial Report
4. Segment results and revenue (cont.)i) Segment reporting (cont.)
Australia United States Corporate TotalYear ended 30 June 2016 $’000 $’000 $’000 $’000Total revenue 29,746 1,002 541 31,289Cost of revenue1 (2,828) (3,036) - (5,864)Gross Profi t 26,918 (2,034) 541 25,425Sales & marketing (7,774) (5,755) - (13,529)General & administration (2,693) (4,151) (6,660) (13,504)Segment contribution 16,451 (11,940) (6,119) (1,608)Amortisation & depreciation2 (2,995)FX Loss (90)Income tax expense (2,442)Loss after tax (7,135)
Australia United States Corporate TotalYear ended 30 June 2015 $’000 $’000 $’000 $’000Total revenue 23,615 11 2,498 26,124Cost of revenue1 (2,891) (1,322) - (4,213)Gross Profi t 20,724 (1,311) 2,498 21,911Sales & marketing (5,875) (1,997) - (7,872)General & administration (2,774) (3,342) (5,549) (11,665)Segment contribution 12,075 (6,650) (3,051) 2,374Amortisation & depreciation2 (2,145)FX Gain 398Income tax expense (1,416)Loss after tax (789)
1 Includes amortisation of capitalised capture costs2 Includes amortisation and depreciation of business combinations and global assets
B. Key fi nancial results
Notes to the Consolidated Financial Statements for the year ended 30 June 2016
62 Financial Report
For
per
sona
l use
onl
y

63 Financial Report
4. Segment results and revenue (cont.)
Accounting policy – revenue recognition and measurementRevenue is recognised to the extent that it is probable that the economic benefi ts will fl ow to the Group and the revenue can be reliably measured. The following specifi c revenue recognition criteria must also be met before revenue is recognised:
Subscription revenueSubscription revenue is recognised over the life of the contract in line with when the signifi cant risks and rewards of ownership have been transferred to the customer, recovery of the consideration is probable, and the amount of revenue can be measured reliably. The timing of the transfer of risks and rewards varies depending on the individual terms of the subscription agreement.
On-demand revenueOn-demand revenue is recognised in accordance with the percentage of completion method. The stage of completion is measured by reference to percentage area captured to date as a percentage of the total estimated capture area for each contract.
Royalty incomeRoyalty income is earned through third parties who sell Nearmap imagery on behalf of the Group. It is recognised when the contract of sale between the parties have been signed.
Grant incomeGrant income is the New South Wales payroll grant of $134,000 received from Offi ce of State Revenue. It is recognised when incremental headcounts are hired for new jobs created.
Interest incomeInterest income is recognised as interest accrues using the effective interest method.
Unearned revenuePrepaid amounts received from customers in advance are deferred to the relevant future subscription agreement periods. Unearned revenue comprises photo mapping subscription license service fees charged, the revenue for which is primarily recognised in the profi t or loss over the subscription period. Unearned revenue at 30 June 2016 was $18,908,000 (2015: $15,726,000).
ii) Total revenue
B. Key fi nancial results
Notes to the Consolidated Financial Statements for the year ended 30 June 2016
Consolidated 2016 2015 $’000 $’000Subscription revenue 30,592 23,432On-demand revenue 75 194Royalty income 81 -Grant income 134 76 30,882 23,702Interest income 407 594R&D tax credit - 1,828 407 2,422Total revenue 31,289 26,124
63 Financial Report
For
per
sona
l use
onl
y

64 Financial Report
B. Key fi nancial results
Notes to the Consolidated Financial Statements for the year ended 30 June 2016
5. Other operational expenses
6. Personnel expenses
Personnel disclosures include information on i) share-based payments, ii) employee benefi ts expense and iii) key management personnel.
i) Share-based paymentsAn Employee Share Option Plan has been established whereby Directors and certain employees of the consolidated entity may be issued with options over the ordinary shares of the Company. The options, which are usually issued for nil consideration at an exercise price calculated with reference to prevailing market prices, are issued in accordance with terms established by the Directors of the Company.
The options are generally issued for 4 years and are exercisable on various dates (usually in 2 or 3 equal annual tranches when vested) within 4 years from the issue date. The options cannot be transferred without the approval of the Company’s Board and are not quoted on the ASX.
Nearmap’s Employee Share Option Plan also includes an Employee Loan Scheme that permits Nearmap to grant fi nancial assistance to employees by way of LRLs to enable them to exercise options and acquire shares.
Consolidated 2016 2015 $’000 $’000Servicing and processing costs 1,790 1,241Operating lease expenses 917 452Travel and offi ce costs 1,560 1,836Audit, consulting and legal fees 1,652 1,896Insurance costs 304 232Marketing costs 1,532 410Subscription costs 1,128 655All other operating expenses 1,064 679 9,947 7,401
64 Financial Report
For
per
sona
l use
onl
y

65 Financial Report
B. Key fi nancial results
Notes to the Consolidated Financial Statements for the year ended 30 June 2016
6. Personnel expenses (cont.)i) Share-based payments (cont.)
Key estimatesand judgmentsThe Group estimates the fair value of equity-settled transactions (share options and LRLs at the date at which they are granted. The fair value is determined using the Black-Scholes model and includes assumptions in the following areas: risk free rate, volatility and estimated service periods. The expected life of the options is based on historical data and not necessarily indicative of exercise patters than may occur. The expected volatility refl ects the assumption that the historical volatility is indicative of future trends, which may also not necessarily be actual outcome. No other features of options granted were incorporated into the measurement of fair value. There are no voting or dividend rights attached to the options.
Accounting policy -recognition and measurementof share-based payments In valuing equity-settled transactions, no account is taken of any performance conditions, other than conditions linked to the price of the shares of the Company (‘market conditions’) if applicable.
The fair value of equity-settled transactions is recognised, together with the corresponding increase in equity, over the period in which the performance conditions are fulfi lled, ending on the date on which the relevant employees become fully entitled to the award (‘vesting period’).
The cumulative expense recognised for equity-settled transactions at each reporting date until vesting date refl ects (i) the extent to which the vesting period has expired and (ii) the Group’s best estimate of the number of equity instruments that will ultimately vest.
The profi t or loss charge or credit for a period represents the movement in cumulative expense recognised at the beginning and end of that period.
No expense is recognised for awards that do not ultimately vest, except for awards where vesting is only conditional upon a market condition.
A modifi cation of terms of share-based payment transactions occurs when the Board accepts a loan request submitted by an employee of the Group to exercise fully vested options under the Employee Loan Scheme through a LRL in lieu of cash payment of the exercise price. Since the terms of an equity-settled award are modifi ed, as a minimum an expense is recognised as if the terms had not been modifi ed. In addition, an expense is recognised for any modifi cation that increases the total fair value of the share-based payment arrangement, or is otherwise benefi cial to the employee, as measured at the date of modifi cation.
If an equity-settled award is cancelled, it is treated as if it had vested on the date of cancellation, and any expense not yet recognised for the award is recognised immediately. However, if a new award is substituted for the cancelled award and designated as a replacement award on the date that it is granted, the cancelled and new award are treated as if they were a modifi cation of the original award, as described in the previous paragraph.
The dilutive effect, if any, of outstanding options is refl ected as additional share dilution in the computation of earnings per share.
65 Financial Report
For
per
sona
l use
onl
y

66 Financial Report
B. Key fi nancial results
Notes to the Consolidated Financial Statements for the year ended 30 June 2016
Grant date Expiry date
Exercise price2
$
Number of options /
LRLs granted
Fair value at grant date
$
Expected price volatility
%
Risk free interest rate
%Expected life
(years)
30 June 2015
21 Nov 2014 21 Nov 2018 1.08 5,000,000 0.2160 60 2.77 2.75
1 Dec 2014 1 Dec 2017 0.09 5,000,000 0.5934 75 2.35 3
10 Mar 2015 10 Mar 2018 0.18 2,500,000 0.3792 75 1.96 3
27 Mar 2015 27 Mar 2018 0.09 1,000,000 0.4839 75 1.78 3
17 Apr 2015 17 Apr 2018 0.49 1,500,000 0.2980 75 1.79 3
17 Apr 2015 17 Apr 2018 0.63 1,500,000 0.2628 75 1.79 3
30 June 2016
30 Nov 2015 30 Nov 2019 0.56 4,500,000 0.1135 53 2.19 3.5
30 Nov 2015 30 Nov 2019 0.56 4,750,000 0.1157 53 2.19 3.5
31 Jan 2016 31 Jan 2021 0.39 3,000,000 0.1486 53 1.89 3.5
18 Mar 2016 18 Mar 2020 0.40 1,500,000 0.1547 53 1.89 3.5
18 Mar 2016 18 Mar 2020 0.551 2,500,000 0.1125 53 2.05 3.5
20 May 2016 20 May 2020 0.68 1,000,000 0.1532 58 1.73 3.5
1 These relate to grants of LRLs to key management personnel under the Employee Loan Scheme. 2 The exercise price of LRLs is determined based on the loan principal plus accrued interest divided by the number of shares exercised.
6. Personnel expenses (cont.)
i) Share-based payments (cont.)
Expenses arising from share-based payment transactions during the year was $1,920,000 (2015: $2,618,000).
The following table lists the options and LRLs granted and the inputs to the model used to measure their fair value for the years ended 30 June 2016 and 30 June 2015 to key management personnel:
Model inputs to share option and LRL grants 30 June 2016 (key management personnel)
66 Financial Report
For
per
sona
l use
onl
y

67 Financial Report
Grant date Expiry date
Exercise price2
$
Number of options /
LRLs granted
Fair value at grant date
$
Expected price volatility
%
Risk free interest rate
%Expected life
(years)
30 June 2015
11 Dec 2014 11 Dec 2018 0.85 4,050,000 0.1608 57 2.77 2.75
23 Dec 2014 23 Dec 2017 0.08 400,000 0.5734 75 2.25 3
6 Mar 2015 6 Mar 2019 0.79 3,000,000 0.1453 56 1.98 2.75
6 Mar 2015 6 Mar 2020 0.56 2,710,000 0.2037 56 1.98 2.75
24 Jun 2015 24 Jun 2018 0.09 200,000 0.5435 75 2.06 3
30 June 2016
7 Jul 2015 30 Jun 2019 0.79 700,000 0.1631 54 2.08 3.5
30 Nov 2015 30 Nov 2019 0.56 3,295,000 0.1157 53 2.19 3.5
30 Nov 2015 30 Nov 2020 0.40 400,000 0.1553 53 2.19 3.5
1 These relate to grants of LRLs to key management personnel under the Employee Loan Scheme. 2 The exercise price of LRLs is determined based on the loan principal plus accrued interest divided by the number of shares exercised.
B. Key fi nancial results
Notes to the Consolidated Financial Statements for the year ended 30 June 2016
6. Personnel expenses (cont.)
i) Share-based payments (cont.)
The following table lists the options and LRLs granted and the inputs to the model used to measure their fair value for the years ended 30 June 2016 and 30 June 2015 to other executives:
Model inputs to share option and LRL grants 30 June 2016 (Other Executives)
The following table lists the roll-forward in number of options for the years ended 30 June 2016 and 30 June 2015 for key management personnel and other executives combined:
Reconciliation of options issued under Employee Share Option Plan 30 June 2016
Balance at 1 July Granted Forfeited Exercised
Balance 30 June
Vested & exercisable30 June 2015
Total number of options 35,750,000 14,760,000 (1,805,000) (18,150,000) 30,555,000 1,950,000
Weighted average price $ 0.37 0.86 0.6 0.14 0.79 0.32
30 June 2016
Total number of options 30,555,000 21,645,000 (14,005,000) (750,000) 37,445,000 6,025,000
Weighted average price $ 0.79 0.53 0.57 0.14 0.64 0.69
67 Financial Report
For
per
sona
l use
onl
y

68 Financial Report
6. Personnel expenses (cont.)i) Share-based payments (cont.)
LRLs advanced to key management personnel LRLs advanced to key management personnel during the year ended 30 June 2016 amounted to $2,317,000 (30 June 2015: $3,068,000). Loans are interest bearing and interest accrues daily. Interest on the loans during the period has been accrued at rates of between 1.75% and 5.65%. Loans are repayable three years after the issue date subject to the total share value being greater than the loan’s principal plus accrued interest. No loans to key management personnel were repaid during the year.
Details in relation to key management personnel, including remuneration paid, are included in the Remuneration Report section of the Director’s Report.
LRLs advanced to other executivesLRLs advanced to other executives during the year ended 30 June 2016 amounted to $86,000 (30 June 2015: $45,000). Loans are interest bearing and interest accrues daily. Interest on the loans during the period has been accrued at rates of between 1.75% and 5.65%. Loans are repayable four years after the issue date subject to the total share value being greater than the loan’s principal plus accrued interest. No loans to other executives were repaid during the year.
B. Key fi nancial results
Notes to the Consolidated Financial Statements for the year ended 30 June 2016
Consolidated 2016 2015ii) Employee benefi ts expense $’000 $’000Share based payment expense 1,920 2,618Defi ned contribution plan expense 1,044 779Other employee benefi ts expenses 17,339 11,960 20,303 15,357
Consolidated 2016 2015iii) Key management personnel disclosures $’000 $’0001
Short-term employee benefi ts 2,612 1,658Short-term employee bonus 736 583Long-term employee benefi ts 11 21Post-employment benefi ts 148 122Share-based payments 1,508 2,181 5,015 4,565
1 Mr J Biviano and Ms L Rankin became key management personnel in the current year. The comparatives have been amended to include their respective remuneration in the prior year.
68 Financial Report
For
per
sona
l use
onl
y

69 Financial Report
7. Income tax
Key estimates and judgmentsDeferred taxPursuant to AASB 112 Income Taxes, the Company has assessed its best estimate of the probability that future taxable profi ts will be available against which the Group can utilise its unused tax losses and deductible temporary differences in future periods.
Accounting policy -recognition and measurementof income taxResearch and development tax incentiveThe Group accounts for the benefi t of refundable research and development tax incentives as government grant income, which is recognised when there is reasonable assurance that the Group will comply with the conditions that attach to the incentive and that it will be received. The income is recognised in Other Income on a systematic basis over the periods in which the Group recognises the related research and development expense. The Group accounts for any non-refundable research and development tax credits as an income tax benefi t.
Income taxCurrent tax assets and liabilities for the current and prior periods are measured at the amount expected to be recovered from or paid to the taxation authorities. The tax rates and tax laws used to compute the amount are those that are enacted or substantively enacted at the reporting date.
Deferred income tax is provided on all temporary differences at the reporting date between the tax bases of assets and liabilities and their carrying amounts for fi nancial reporting purposes.
Deferred income tax liabilities are recognised for all taxable temporary differences:
– except where the deferred income tax liability arises from the initial recognition of goodwill or of an asset or liability in a transaction that is not a business combination and, at the time of the transaction, affects neither the accounting profi t nor taxable profi t or loss; and
– in respect of taxable temporary differences associated with investments in subsidiaries, associates and interests in joint ventures, except where the timing of the reversal of the temporary differences can be controlled and it is probable that the temporary differences will not reverse in the foreseeable future.
Deferred income tax assets are recognised for all deductible temporary differences, carry-forward of unused tax assets and unused tax losses, to the extent that it is probable that taxable profi t will be available against which the deductible temporary differences, and the carry-forward of unused tax assets and unused tax losses can be utilised:
– except where the deferred income tax asset relating to the deductible temporary difference arises from the initial recognition of an asset or liability in a transaction that is not a business combination and, at the time of the transaction, affects neither the accounting profi t nor taxable profi t or loss; and
– in respect of deductible temporary differences associated with investments in subsidiaries, associates and interests in joint ventures, deferred tax assets are only recognised to the extent that it is probable that the temporary differences will reverse in the foreseeable future and taxable profi t will be available against which the temporary differences can be utilised.
B. Key fi nancial results
Notes to the Consolidated Financial Statements for the year ended 30 June 2016
69 Financial Report
For
per
sona
l use
onl
y

70 Financial Report
7. Income tax (cont.)
Accounting policy -recognition and measurementof income tax (cont.)
Income tax (cont.)
The carrying amount of deferred income tax assets is reviewed at each reporting date and reduced to the extent that it is no longer probable that suffi cient taxable profi t will be available to allow all or part of the deferred income tax asset to be utilised. Unrecognised deferred income tax assets are reassessed at each reporting date and are recognised to the extent that it has become probable that future taxable profi t will allow the deferred tax asset to be recovered.
Deferred income tax assets and liabilities are measured at the tax rates that are expected to apply to the year when the asset is realised or the liability is settled, based on tax rates (and tax laws) that have been enacted or substantively enacted at the reporting date.
Deferred tax assets and deferred tax liabilities are offset only if a legally enforceable right exists to set off current tax assets against current tax liabilities and the deferred tax assets and liabilities relate to the same taxable entity and the same taxation authority.
Income taxes relating to items recognised directly in equity are recognised in equity and not in the profi t and loss.
Tax consolidationThe Company and its wholly-owned Australian controlled entities have implemented the tax consolidation legislation. The head entity, Nearmap Ltd, and the controlled entities in the tax consolidated Group account for their own current and deferred tax amounts. These tax amounts are measured as if each entity in the tax consolidated Group continues to be a standalone taxpayer in its own right. In addition to its own current and deferred tax amounts, the Company also recognises the current tax liabilities (or assets) and the deferred tax assets arising from unused tax losses and unused tax credits assumed from controlled entities in the tax consolidated Group.
B. Key fi nancial results
Notes to the Consolidated Financial Statements for the year ended 30 June 2016
70 Financial Report
For
per
sona
l use
onl
y
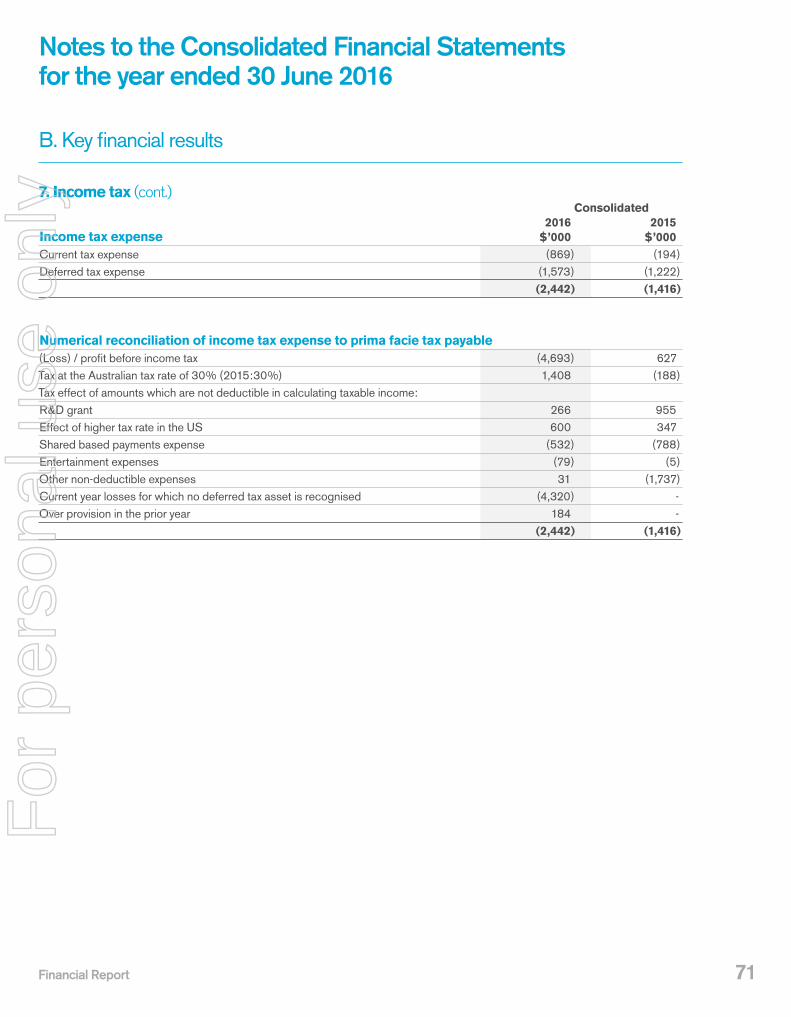
71 Financial Report
7. Income tax (cont.) Consolidated 2016 2015Income tax expense $’000 $’000Current tax expense (869) (194)Deferred tax expense (1,573) (1,222) (2,442) (1,416)
Numerical reconciliation of income tax expense to prima facie tax payable (Loss) / profi t before income tax (4,693) 627Tax at the Australian tax rate of 30% (2015:30%) 1,408 (188)Tax effect of amounts which are not deductible in calculating taxable income: R&D grant 266 955Effect of higher tax rate in the US 600 347Shared based payments expense (532) (788)Entertainment expenses (79) (5)Other non-deductible expenses 31 (1,737)Current year losses for which no deferred tax asset is recognised (4,320) -Over provision in the prior year 184 - (2,442) (1,416)
B. Key fi nancial results
Notes to the Consolidated Financial Statements for the year ended 30 June 2016
71 Financial Report
For
per
sona
l use
onl
y

72 Financial Report
7. Income tax (cont.)
Deferred tax balances
2016 R&D credits carry forward - 2,102 (743) 1,359 - 1,359Tax losses 4,300 (1,875) (468) 1,957 1,957 -- Unearned revenue 39 - 388 427 427 --Provisions and other accruals 341 240 168 749 255 494Plant and equipment (52) (2) 836 782 (15) 797Intangible assets (2,359) (1,947) (838) (5,144) - (5,144)Other - 18 22 40 - 40Derivative instruments 17 - 21 38 - 38Unrealised foreign exchange loss - (109) - (109) - (109)Net tax assets/(liabilities) 2,286 (1,573) (614) 99 2,624 (2,525)
2015 Tax losses - 4,597 (297) 4,300 4,300 --Unearned revenue 4,020 (3,983) 2 39 39 --Provisions and other accruals 285 51 5 341 341 --Plant and equipment (57) (1,888) 1,893 (52) - (52)Intangible assets (464) - (1,895) (2,359) - (2,359)Prepayments (2) 1 1 - - --Derivative instruments - - 17 17 17 --Net tax assets/(liabilities) 3,782 (1,222) (274) 2,286 4,697 (2,411)
Balance 1 July$’000
Recognised in the
statement of profi t or loss
$’000
Change in recognised
amount$’000
Balance 30 June
$’000Assets
$’000Liabilities
$’000
B. Key fi nancial results
Notes to the Consolidated Financial Statements for the year ended 30 June 2016
72 Financial Report
For
per
sona
l use
onl
y

73 Financial Report
8. Contributed equityOrdinary shares are classifi ed as equity. Incremental costs directly attributable to the issue of new shares or options are shown in equity as a deduction, net of tax, from the proceeds. Details in relation to share option movements and the share incentive scheme are contained in note 6.
In this section: This section outlines how Nearmap manages its capital structure and discusses the Group’s exposure to various fi nancial risks and how the Group manages these risks.
Capital Risk ManagementThe Group’s objective in managing capital is to safeguard its ability to continue as a going concern, so it can continue to commercialise intellectual property with the ultimate objective of providing returns to shareholders whilst maintaining an optimal capital structure to reduce the cost of capital. In order to maintain or adjust the capital structure the Company may issue new shares, sell assets, consider joint ventures and may return capital in some form to shareholders.
2016 2015 Number Number Movement in shares on issue of shares $'000 of shares $'000Balance at the beginning of the year 355,496,101 27,621 337,346,101 27,113Issue of shares during the year - - - -Issued from exercise of share options 250,000 19 6,050,000 508Issued from exercise of loans share options 500,000 - 12,100,000 -Repayment of loans - 1,139 - -Balance at the end of the year 356,246,101 28,779 355,496,101 27,621
Terms and conditions of contributed equity Ordinary shares: Ordinary shares have the right to receive dividends as declared and in the event of winding up of the Company, to participate in the proceeds from the sale of all surplus assets in proportion to the number of and amounts paid up on the shares held.
C. Capital structure and fi nancial risk management
Notes to the Consolidated Financial Statements for the year ended 30 June 2016
73 Financial Report
For
per
sona
l use
onl
y

74 Financial Report
9. Financial instruments – fair value and risk management
Accounting policy – fi nancialinstruments carried at fair valueThe fair value of fi nancial assets and fi nancial liabilities must be estimated for recognition and measurement or for disclosure purposes. The fair value of these instruments is categorised into different levels of the fair value hierarchy based on the inputs used in the valuation techniques as follows:
Level 1: quoted prices (unadjusted) in active markets for identical assets or liabilities that the Group can assess at the measurement date.
Level 2: inputs other than quoted prices included within Level 1 that are observable for the asset or liability, either directly (as prices) or indirectly (derived from prices).
Level 3: inputs for the asset or liability that are not based on observable market data (unobservable inputs).
The Group recognises transfers between levels of the fair value hierarchy as of the end of the reporting period which the transfer has occurred.
Accounting policy – derivative fi nancial instrumentsand hedge accountingThe Group holds derivative fi nancial instruments to hedge its foreign currency risk exposures. These derivative instruments are designated as cash fl ow hedging instruments. The effective portion of changes in the fair value of the derivative is recognised in OCI and accumulated in the hedging reserve. Any ineffective portion of changes in the fair value of the derivatives is immediately recognised in profi t or loss. The amount accumulated in equity is retained in OCI and reclassifi ed to profi t or loss in the same period or periods during which the hedged item affects profi t or loss.
The Group’s principal fi nancial instruments comprise cash, short-term deposits and derivatives. The Group is primarily exposed to the following risks arising from fi nancial instruments:
– Market risk, particularly in relation to foreign currencies (see 9(ii));
– Credit risk (see 9(iii)).
This note provides information about the Group’s exposure to the above risks and its objectives, policies and processes for measuring and managing those risks.
i) Risk management frameworkThe Company’s Board of Directors has overall responsibility for the establishment and oversight of the Group’s risk management framework. The Board of Directors have established the Audit and Risk Management Committee which is responsible for developing and monitoring the Group’s risk management policies.
The Group’s risk management policies are established to identify and analyse the risks faced by the Group, to set appropriate risk limits and controls and to monitor risks and adherence to limits. Risk management policies are reviewed regularly to refl ect changes in the market and the Group’s activities.
C. Capital structure and fi nancial risk management
Notes to the Consolidated Financial Statements for the year ended 30 June 2016
74 Financial Report
For
per
sona
l use
onl
y

75 Financial Report
9. Financial instruments – fair value and risk management (cont.)ii) Market riskMarket risk is the risk that changes in market prices – such as foreign exchange rates and interest rates – will affect the Group’s income or the value of its holdings of fi nancial instruments. The Group uses derivatives to manage market risk related to foreign currencies. All such transactions are carried out within the guidelines of the Group’s risk management policies.
Currency riskThe Group’s functional currency is the Australian dollar (AUD) and it is exposed to currency risk on payments denominated in the United States dollar (USD). The Group uses forward exchange contracts to hedge its currency risk, all of which have a maturity of less than six months from the reporting date. The currency risk relating to payments denominated in USD have been fully hedged, with the forward exchange contracts maturing on the same dates that the forecast payments are expected to occur. These contracts are designated as cash fl ow hedges.
In respect of other monetary assets and liabilities denominated in foreign currencies, the Group’s policy is to ensure the net exposure is kept to an acceptable level by buying or selling foreign currencies at spot rates when necessary.
Exposure to foreign currency riskThe summary quantitative data about the Group’s exposure to foreign currency risk is as follows:
Consolidated 2016 2015 US$’000 US$’000Cash and cash equivalents 1,960 2,110Receivables and other assets 288 344Payables and other liabilities 851 980Gross exposure 3,099 3,434
The following signifi cant exchange rates applied during the year:
Average rate Year end spot rate 2016 2015 2016 2015USD 0.7283 0.8382 0.7426 0.7680
C. Capital structure and fi nancial risk management
Notes to the Consolidated Financial Statements for the year ended 30 June 2016
75 Financial Report
For
per
sona
l use
onl
y

76 Financial Report
9. Financial instruments – fair value and risk management (cont.)ii) Market risk (cont.)
Sensitivity analysisA 10 percent strengthening or weakening of the Australian to US dollar exchange rate would have increased / (decreased) the net assets denominated in foreign currencies by the following amounts:
Consolidated 2016 2015 $’000 $’00010% (171) (174)-10% 209 213
Interest rate riskThe Group is exposed to changes in interest rates as it relates to the Company’s short-term deposits. The Company monitors changes in interest rates regularly to ensure the best possible return on deposits. Changes to interest rates in this context are not considered a signifi cant fi nancial risk.
iii) Credit riskCredit risk is the risk of fi nancial loss to the Group if a customer or counterparty to a fi nancial instrument fails to meet its contractual obligations, and arises principally from the Group’s receivables from customers and forward exchange contracts. The Group trades primarily with recognised, creditworthy third parties.
Trade and other receivablesThe Group’s exposure to credit risk is infl uenced mainly by the individual characteristics of each customer. Receivable balances are monitored on an ongoing basis, with the result that the Group’s exposure to bad debts is not signifi cant.
Consolidated 2016 2015Ageing profi le of trade receivables $’000 $’000Current 4,119 4,20231 to 60 days overdue 33 91Over 61 days overdue 68 16Over 90 days overdue 225 19Impairment loss (172) (12) 4,273 4,316
C. Capital structure and fi nancial risk management
Notes to the Consolidated Financial Statements for the year ended 30 June 2016
76 Financial Report
For
per
sona
l use
onl
y

77 Financial Report
9. Financial instruments – fair value and risk management (cont.)iii) Credit risk (cont.)
Cash and cash equivalentsThe Group held cash and cash equivalents with bank and fi nancial institution counterparties which are rated BBB or above based on Standards & Poors ratings.
DerivativesThe forward exchange contracts are entered into with bank institutions which are rated BBB or above based on Standard & Poor ratings and are authorised in accordance with our Foreign Exchange Risk Management Policy.
The carrying amount of the Group’s fi nancial assets represents maximum credit exposure and is as follows:
Consolidated 2016 2015 $’000 $’000Cash and cash equivalents 12,189 17,169Trade receivables 4,273 4,316Prepayments and other receivables 1,774 3,540
Accounting policy – trade and other receivablesTrade receivables are recognised initially at fair value and subsequently measured at amortised cost using the effective interest method, less provision for impairment. Trade receivables are generally due for settlement within 7–60 days. The Group has no reliance on any major customers.
Debts which are known to be uncollectible are written off by reducing the carrying amount directly. An allowance account for impairment is used when there is objective evidence that the Group will not be able to collect all amounts due according to the original terms (such as signifi cant fi nancial diffi culties of the debtor, probability of bankruptcy, etc). The amount of the impairment loss is recognised in profi t or loss within other expenses.
When a trade receivable for which an impairment allowance has been recognised becomes uncollectible in a subsequent period, it is written off against the allowance account. Subsequent recoveries of amounts previously written off are credited against other expenses in the income statement.
Liquidity Risk Liquidity risk is the risk that the Group will encounter diffi culty in meeting the obligations associated with its fi nancial liabilities that are settled by delivering cash or another fi nancial asset. The Group’s objective is to maintain a balance between continuity of funding and fl exibility through the use of its cash and funding requirements. The Group continually monitors forecast and actual cash fl ows and the maturity profi les of assets and liabilities to manage its liquidity risk.
Notes to the Consolidated Financial Statements for the year ended 30 June 2016
C. Capital structure and fi nancial risk management
77 Financial Report
For
per
sona
l use
onl
y
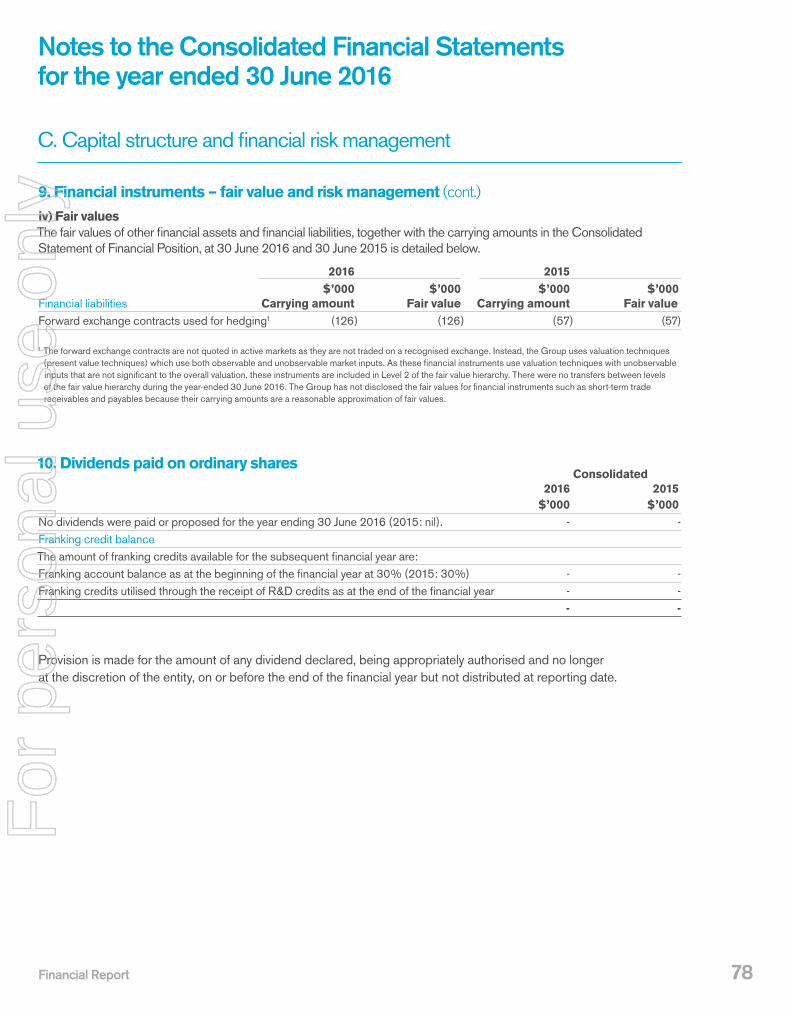
78 Financial Report
9. Financial instruments – fair value and risk management (cont.)
iv) Fair values The fair values of other fi nancial assets and fi nancial liabilities, together with the carrying amounts in the Consolidated Statement of Financial Position, at 30 June 2016 and 30 June 2015 is detailed below.
2016 2015 $’000 $’000 $’000 $’000Financial liabilities Carrying amount Fair value Carrying amount Fair valueForward exchange contracts used for hedging1 (126) (126) (57) (57)
1 The forward exchange contracts are not quoted in active markets as they are not traded on a recognised exchange. Instead, the Group uses valuation techniques (present value techniques) which use both observable and unobservable market inputs. As these fi nancial instruments use valuation techniques with unobservable inputs that are not signifi cant to the overall valuation, these instruments are included in Level 2 of the fair value hierarchy. There were no transfers between levels of the fair value hierarchy during the year-ended 30 June 2016. The Group has not disclosed the fair values for fi nancial instruments such as short-term trade receivables and payables because their carrying amounts are a reasonable approximation of fair values.
10. Dividends paid on ordinary shares Consolidated 2016 2015 $’000 $’000No dividends were paid or proposed for the year ending 30 June 2016 (2015: nil). - - Franking credit balance The amount of franking credits available for the subsequent fi nancial year are: Franking account balance as at the beginning of the fi nancial year at 30% (2015: 30%) - -Franking credits utilised through the receipt of R&D credits as at the end of the fi nancial year - - - -
Provision is made for the amount of any dividend declared, being appropriately authorised and no longer at the discretion of the entity, on or before the end of the fi nancial year but not distributed at reporting date.
C. Capital structure and fi nancial risk management
Notes to the Consolidated Financial Statements for the year ended 30 June 2016
78 Financial Report
For
per
sona
l use
onl
y

79 Financial Report
11. Intangibles
Key estimates and judgmentsCapture costsPursuant to AASB 138 Intangible Assets, the Company has assessed its best estimate of the probability that the expected future economic benefi ts attributable to the Group’s digital imagery will fl ow to the entity. As a result, capture costs directly attributable and necessary to create and upload digital imagery online have been recognised as an intangible asset. Capture costs capitalised are being amortised over a period of 5 years. Amortisation of capture costs has been included within ‘depreciation and amortisation expenses’ in the Consolidated Statement of Comprehensive Income.
Impairment of assetsThe Group assesses impairment at each reporting date by evaluation of conditions specifi c to the Group that may lead to impairment of assets. Where an impairment trigger exists, the recoverable amount of the asset is determined. Value-in-use calculations performed in assessing recoverable amounts incorporate a number of key estimates, including forecasting of profi ts, cash fl ows, and discount rates.
Accounting policy -impairment of assetsThe Group assesses at each reporting period whether there is an indication that an asset (other than goodwill or intangibles with indefi nite useful life) may be impaired. If any such indication exists, or when annual impairment testing for an asset is required, the Group makes an estimate of the asset’s recoverable amount. An asset’s recoverable amount is the higher of its fair value less costs to sell and its value in use and is determined for an individual asset, unless the asset does not generate cash infl ows that are largely independent of those from other assets or groups of assets and the assets value in use cannot be estimated to be close to its fair value. In such cases the asset is tested for impairment as part of the cash generating unit to which it belongs. When the carrying amount of an asset or cash generating unit exceeds its recoverable amount, the asset or cash generating unit is considered impaired and is written down to its recoverable amount.
In assessing value in use, the estimated future cash fl ows are discounted to their present value using a pre-tax discount rate that refl ects current market assessments of the time value of money and the risks specifi c to the asset.
Impairment losses relating to continuing operations are recognised in those expense categories consistent with the function of the impaired asset unless the asset is carried at revalued amount (in which case the impairment loss is treated as a revaluation decrease).
An assessment is also made at each reporting date as to whether there is any indication that previously recognised impairment losses may no longer exist or may have decreased. If such indication exists, the recoverable amount is estimated. A previously recognised impairment loss is reversed only if there has been a change in estimate used to determine the asset’s recoverable amount since the last impairment loss was recognised. If that is the case, the carrying amount of the asset is increased to its recoverable amount.
That increased amount cannot exceed the carrying amount that would have been determined, net of depreciation, had no impairment loss been recognised in the asset in prior years. Such reversal is recognised in profi t or loss unless the asset is carried at revalued amount, in which case the reversal is treated as revaluation increase. After such a reversal the depreciation charge is adjusted in future periods to allocate the asset’s revised carrying amount, less any residual value, on a systematic basis over its remaining useful life.
D. Investing activities
In this section: This section outlines Nearmap’s investment in intangible assets and property, plant and equipment as well as a broader discussion on the entity’s cash fl ows.
Notes to the Consolidated Financial Statements for the year ended 30 June 2016
79 Financial Report
For
per
sona
l use
onl
y

80 Financial Report
Notes to the Consolidated Financial Statements for the year ended 30 June 2016
11. Intangibles (cont.)
Accounting policy -recognition and measurementof intangiblesResearch and development costsIntangible assets acquired separately are capitalised at cost and those arising from a business combination are capitalised at fair value as at the date of acquisition. Following initial recognition, the cost model is applied to the class of intangible assets.
The amortisation period and method for intangible assets are reviewed at least annually to determine if the useful lives should be changed. Where there is an expectation that the period or method does not match the consumption of the economic benefi ts embedded within the asset, the useful life of the asset will be amended to refl ect this change.
Intangible assets are tested for impairment where an indicator of impairment exists, and in the case of intangibles under development impairment is tested annually or at each reporting period where an indicator exists, at the cash-generating unit level.
Gains or losses arising from de-recognition of an intangible asset are measured as the difference between the net disposal proceeds and the carrying amount of the asset and are recognised in the profi t or loss when the asset is derecognised.
Research costs and costs that do not meet the defi nition of development costs for the purpose of the standard are expensed as incurred. An intangible asset arising from development expenditure on an internal project is recognised only when the Group can demonstrate the technical feasibility of completing the intangible asset so that it will be available for use or sale, its intention to complete and its ability to use or sell the asset, how the asset will generate future economic benefi ts, the availability of resources to complete the development and the ability to measure reliably the expenditure attributable to the intangible asset during its development. Following the initial recognition of the development expenditure, the cost model is applied requiring the asset to be carried at cost less any accumulated amortisation and accumulated impairment losses. Any expenditure so capitalised is amortised over the period of expected benefi t from the related project.
The carrying value of an intangible asset arising from development expenditure is tested for impairment annually when the asset is not yet available for use or more frequently when an indication of impairment rises during the reporting period.
A summary of the amortisation applied to the Group's intangible assets is as follows:
Development costs, patents, capture costs and licences
Useful lives Finite (generally for a period of 5–20 years).
Amortisation method used Amortised over the period of expected future benefi t. The expected useful life is reviewed annually.
Internally generated or acquired and internally generated.
Impairment testing Annually as at 30 June for assets not yet available for use and more frequently when an indication of impairment exists.
The patents and licences have been granted or are expected to be granted for a minimum of 20 years by the relevant government agency with the option of renewal without signifi cant cost at the end of this period provided that the Group meets certain predetermined targets. Accordingly, the patents and licences have been determined to have fi nite useful lives.
D. Investing activities
80 Financial Report
For
per
sona
l use
onl
y

81 Financial Report
Notes to the Consolidated Financial Statements for the year ended 30 June 2016
11. Intangibles (cont.)
GoodwillGoodwill acquired in a business combination is initially measured at cost being the excess of the cost of the business combination over the Group’s interest in the net fair value of the acquiree’s identifi able assets, liabilities and contingent liabilities. Goodwill is reviewed for impairment annually or more frequently if events or changes in circumstances indicate the carrying value may be impaired.
All goodwill acquired through business combinations has been allocated to the nearmap.com cash generating unit. The recoverable amount of the nearmap.com cash generating unit has been determined based on a value-in-use calculation using cash fl ow projections based on Board approved budgets and a 4 year forecast period approved by senior management. No impairment was recognised at 30 June 2016 (2015: nil).
Goodwill$’000
Development costs$’000
Capture costs$’000
Other$’000
Total$’000
Reconciliation of carrying amount as at 30 June 2016
Balance at the beginning of the year 135 5,358 5,125 648 11,266
Additions - 3,872 7,135 555 11,562
Amortisation - (2,825) (1,913) (363) (5,101)
Transfers to Plant and equipment (at net book value) - (526) 32 7 (487)
Closing balance at the end of the year 135 5,879 10,379 847 17,240
At 30 June 2016
Cost 135 13,783 13,018 1,408 28,344
Accumulated amortisation - (7,904) (2,639) (561) (11,104)
Closing net book amount 135 5,879 10,379 847 17,240
Reconciliation of carrying amount as at 30 June 2015
Balance at the beginning of the year 135 4,166 745 222 5,268
Additions - 3,431 5,023 591 9,045
Amortisation - (2,239) (643) (165) (3,047)
Closing balance at the end of the year 135 5,358 5,125 648 11,266
At 30 June 2015
Cost 135 13,480 5,862 853 20,330
Accumulated amortisation - (8,122) (737) (205) (9,064)
Closing net book amount 135 5,358 5,125 648 11,266
D. Investing activities
81 Financial Report
For
per
sona
l use
onl
y

82 Financial Report
Notes to the Consolidated Financial Statements for the year ended 30 June 2016
12. Plant and equipment
Accounting policy – plant and equipmentPlant and equipment is stated at cost less accumulated depreciation and any accumulated impairment losses. Such cost includes the cost of replacing parts that are eligible for capitalisation when the cost of replacing the parts is incurred.
Depreciation is calculated over the estimated useful life of the assets, between 2 and 10 years, on a straight line basis.
The assets’ residual values, useful lives and depreciation methods are reviewed, and adjusted if appropriate, at each fi nancial year end.
i) De-recognition and disposalAn item of plant and equipment is derecognised upon disposal or when no future economic benefi ts are expected from its use or disposal.
Any gain or loss arising on derecognition of the asset (calculated as the difference between the net disposal proceeds and the carrying amount of the asset) is included in profi t or loss in the year the asset is derecognised.
Offi ce equipment Camera & furniture systems TotalReconciliation of carrying amount as at 30 June 2016 $’000 $’000 $’000Balance at the beginning of the year 519 3,862 4,381Additions 665 2,390 3,055Disposals - (114) (114)Depreciation (380) (1,262) (1,642)Transfers from Intangible assets (at net book value) 20 467 487Closing balance at the end of the year 824 5,343 6,167 At 30 June 2016 Cost 1,844 10,872 12,716Accumulated depreciation (1,020) (5,529) (6,549)Closing net book amount 824 5,343 6,167 Reconciliation of carrying amount as at 30 June 2015 Balance at the beginning of the year 233 1,169 1,402Additions 470 3,129 3,599Disposals (10) - (10)Depreciation (174) (436) (610)Closing balance at the end of the year 519 3,862 4,381 At 30 June 2015 Cost 922 5,101 6,023Accumulated depreciation (403) (1,239) (1,642)Closing net book amount 519 3,862 4,381
D. Investing activities
82 Financial Report
For
per
sona
l use
onl
y

83 Financial Report
Notes to the Consolidated Financial Statements for the year ended 30 June 2016
13. Cash fl ow statementCash and short-term deposits in the Consolidated Statement of Financial Position comprise cash at bank and in hand and short-term deposits with an original maturity of three months or less. For the purposes of the Statement of Cash Flow, cash and cash equivalents consist of cash and cash equivalents as defi ned above, net of outstanding bank overdrafts. Cash at banks and short term deposits earn interest at fl oating rates based on daily bank deposit rates.
The Company had no fi nancing facilities as of 30 June 2016 (2015: nil).
Consolidated 2016 2015Reconciliation of the net loss to the net cash fl ows from operations $’000 $’000Loss after tax (7,135) (789) Adjustment for non-cash items Amortisation and depreciation 6,747 3,658Capitalised amortisation and depreciation (1,105) (522)Net unrealised exchange differences 10 (480)Share based payment expense 1,920 2,618Loss on disposal of non-current assets 42 - Changes in assets and liabilities Payables and other current liabilities 2,806 2,710Receivables 1,809 (4,561)Provision for employee benefi ts (89) 1,023Other non-current assets (6,030) (5,023)Income tax 2,310 1,496Net cash from operating activities 1,285 130 Reconciliation of cash Cash equivalents comprises Cash at bank and on hand 5,319 4,665Short term deposits at call 6,870 12,504 12,189 17,169
D. Investing activities
83 Financial Report
For
per
sona
l use
onl
y

84 Financial Report
Notes to the Consolidated Financial Statements for the year ended 30 June 2016
Consolidated 2016 2015 $’000 $’000Net loss attributable to ordinary equity holders (7,135) (789)Net loss used in calculating diluted earnings per share (7,135) (789)
Number of Number of shares sharesWeighted average number of ordinary shares on issue used in the calculation of basic profi t per share 355,572,813 330,667,744Weighted average number of ordinary shares on issue used in the calculation of diluted profi t per share 355,572,813 330,667,744 Earnings per share attributable to the ordinary equity shareholders of the Company: Basic loss per share (cents per share) (2.01) (0.24)Diluted loss per share (cents per share) (2.01) (0.24)
The options granted to employees are considered to be ordinary shares and are included in the determination of diluted earnings per share to the extent to which they are dilutive.
There have been no other conversions to, calls of, or subscriptions for ordinary shares or issues of potential ordinary shares since the reporting date and before the completion of these fi nancial statements.
In this section: This section provides information on items which require disclosure to comply with Australian Accounting Standards and other regulatory pronouncements however are not considered critical in understanding the fi nancial performance or position of the Group.
14. Earnings per shareBasic earnings per share is calculated as net profi t/loss attributable to shareholders, adjusted to exclude costs of servicing equity (other than dividends), divided by the weighted average number of ordinary shares, adjusted for any bonus element.
Diluted earnings per share is calculated as net profi t attributable to shareholders, adjusted for:
– costs of servicing equity (other than dividends);
– the after tax effect of dividends and interest associated with dilutive potential ordinary shares that have been recognised as expenses; and
– other non-discretionary changes in revenues or expenses during the period that would result from the dilution of potential ordinary shares, divided by the weighted average number of ordinary shares and dilutive potential ordinary shares, adjusted for any bonus element.
E. Other
84 Financial Report
For
per
sona
l use
onl
y
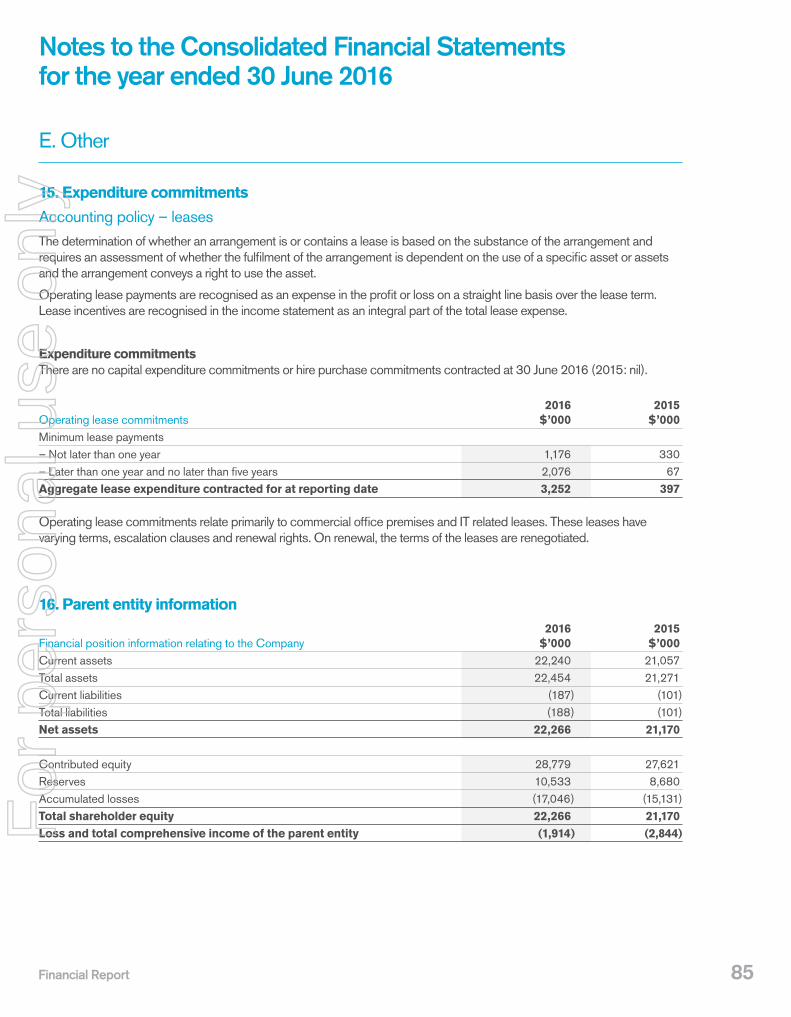
85 85 Financial Report
Notes to the Consolidated Financial Statements for the year ended 30 June 2016
15. Expenditure commitments
Accounting policy – leasesThe determination of whether an arrangement is or contains a lease is based on the substance of the arrangement and requires an assessment of whether the fulfi lment of the arrangement is dependent on the use of a specifi c asset or assets and the arrangement conveys a right to use the asset.
Operating lease payments are recognised as an expense in the profi t or loss on a straight line basis over the lease term. Lease incentives are recognised in the income statement as an integral part of the total lease expense.
Expenditure commitments There are no capital expenditure commitments or hire purchase commitments contracted at 30 June 2016 (2015: nil).
2016 2015Operating lease commitments $’000 $’000Minimum lease payments – Not later than one year 1,176 330– Later than one year and no later than fi ve years 2,076 67Aggregate lease expenditure contracted for at reporting date 3,252 397
Operating lease commitments relate primarily to commercial offi ce premises and IT related leases. These leases have varying terms, escalation clauses and renewal rights. On renewal, the terms of the leases are renegotiated.
16. Parent entity information 2016 2015Financial position information relating to the Company $’000 $’000Current assets 22,240 21,057Total assets 22,454 21,271Current liabilities (187) (101)Total liabilities (188) (101)Net assets 22,266 21,170 Contributed equity 28,779 27,621Reserves 10,533 8,680Accumulated losses (17,046) (15,131)Total shareholder equity 22,266 21,170Loss and total comprehensive income of the parent entity (1,914) (2,844)
E. Other
Financial Report
For
per
sona
l use
onl
y

86 Financial Report
Notes to the Consolidated Financial Statements for the year ended 30 June 2016
16. Parent entity information (cont.)Information relating to the CompanyThe parent entity has not entered into any guarantees with its subsidiaries.
Details of the contingent liabilities of the Group are contained in note 3. There are no contingent liabilities of the parent entity.
Details of the contractual commitments of the Group are contained in note 15. There are no contractual commitments of the parent entity.
Wholly owned Group transactionsLoans made by the Company to and from wholly-owned subsidiaries are repayable on demand and unsecured. No interest is charged on the loans (2015: nil).
2016 2015Loans to wholly-owned subsidiaries $’000 $’000Beginning of the year 8,380 961Loans advanced 7,583 7,770Loan repayments (534) (351)End of the year 15,429 8,380
17. Group entitiesThe consolidated fi nancial statements incorporate the assets, liabilities of the following subsidiaries in accordance with the accounting policy described in note 2:
Equity holding Country of 2016 2015 Name of entity incorporation % %QPSX Communications Pty Ltd Australia 100 100Nearmap Australia Pty Ltd Australia 100 100IPR 8 Pty Ltd Australia 100 100Ipernica Ventures Pty Ltd Australia 100 100Ipernica Holdings Pty Ltd Australia 100 100Nearmap USA Pty Ltd Australia 100 100Nearmap Aerospace Inc. United States 100 100Nearmap US, Inc. United States 100 100Nearmap Remote Sensing US, Inc. United States 100 -
E. Other
86 Financial Report
For
per
sona
l use
onl
y

87 87 Financial Report
18. Auditor remunerationDuring the year, the following fees were paid or payable for services provided by the auditor of the Company and its related practices: Consolidated 2016 2015Audit services paid to KPMG $’000 $’000– an audit or review of the fi nancial statements of the entity 92 81Remuneration paid to KPMG for audit services 92 81 Non-audit services paid to KPMG – other assurance matters for the entity and any other entity in the consolidated Group 18 -– taxation advisory for the entity and any other entity in the consolidated Group 89 79– other advisory for the entity and any other entity in the consolidated Group 54 48Remuneration paid to KPMG for non-audit services 161 127
E. Other
Notes to the Consolidated Financial Statements for the year ended 30 June 2016
Financial Report
For
per
sona
l use
onl
y

88 Directors' Declaration
In accordance with a resolution of the Directors of the Company, I state that:
In the opinion of the Directors:
a) the fi nancial statements and notes of the consolidated entity are in accordance with the Corporations Act 2001, including:
i) giving a true and fair view of the consolidated entity’s fi nancial position as at 30 June 2016 and of its performance for the year ended on that date; and
ii) complying with Accounting Standards and Corporations Regulations 2001 and other mandatory professional reporting standards; and
b) the Company has included in the notes to the fi nancial statements an explicit and unreserved statement of compliance with International Financial Reporting Standards;
c) there are reasonable grounds to believe that the Company will be able to pay its debts as and when they become due and payable; and
d) the remuneration disclosures set out in the Directors’ Report (as part of audited Remuneration Report) for the year ended 30 June 2016, comply with section 300A of the Corporations Act 2001.
This declaration has been made after receiving the declarations required to be made to the Directors in accordance with sections 295A of the Corporations Act 2001 for the fi nancial period ending 30 June 2016.
On behalf of the Board
Dr R NewmanManaging Director & CEO
Sydney23 August 2016
Directors’ Declaration
88 Directors’ Declaration
For
per
sona
l use
onl
y

89 Independent Auditor’s Report 89 Independent Auditor's Report
Independent Auditor’s Report to the members of Nearmap Ltd
Report on the fi nancial report
We have audited the accompanying fi nancial report of Nearmap Ltd (the Company), which comprises the consolidated statement of fi nancial position as at 30 June 2016, and consolidated statement of comprehensive income, consolidated statement of changes in equity and consolidated statement of cash fl ows for the year ended on that date, notes 1 to 18 comprising a summary of signifi cant accounting policies and other explanatory information and the Directors’ declaration of the Group comprising the Company and the entities it controlled at the year’s end or from time to time during the fi nancial year.
Directors’ responsibility for the fi nancial report
The Directors of the Company are responsible for the preparation of the fi nancial report that gives a true and fair view in accordance with Australian Accounting Standards and the Corporations Act 2001 and for such internal control as the Directors determine is necessary to enable the preparation of the fi nancial report that is free from material misstatement whether due to fraud or error. In note 2(a), the Directors also state, in accordance with Australian Accounting Standard AASB 101 Presentation of Financial Statements, that the fi nancial statements of the Group comply with International Financial Reporting Standards.
Auditor’s responsibility
Our responsibility is to express an opinion on the fi nancial report based on our audit. We conducted our audit in accordance with Australian Auditing Standards. These Auditing Standards require that we comply with relevant ethical requirements relating to audit engagements and plan and perform the audit to obtain reasonable assurance whether the fi nancial report is free from material misstatement.
An audit involves performing procedures to obtain audit evidence about the amounts and disclosures in the fi nancial report. The procedures selected depend on the auditor’s judgement, including the assessment of the risks of material misstatement of the fi nancial report, whether due to fraud or error. In making those risk assessments, the auditor considers internal control relevant to the entity’s preparation of the fi nancial report that gives a true and fair view in order to design audit procedures that are appropriate in the circumstances, but not for the purpose of expressing an opinion on the effectiveness of the entity’s internal control. An audit also includes evaluating the appropriateness of accounting policies used and the reasonableness of accounting estimates made by the Directors, as well as evaluating the overall presentation of the fi nancial report.
We performed the procedures to assess whether in all material respects the fi nancial report presents fairly, in accordance with the Corporations Act 2001 and Australian Accounting Standards, a true and fair view which is consistent with our understanding of the Group’s fi nancial position and of its performance.
We believe that the audit evidence we have obtained is suffi cient and appropriate to provide a basis for our audit opinion.
Independence
In conducting our audit, we have complied with the independence requirements of the Corporations Act 2001.
KPMG, an Australian partnership and a member fi rm of the KPMG network of independent member fi rms affi liated with KPMG International Cooperative (“KPMG International”), a Swiss entity.
Liability limited by a scheme approved under Profession Standards Legislation.
For
per
sona
l use
onl
y

90
Auditor’s opinion
In our opinion:
a) the fi nancial report of the Group is in accordance with the Corporations Act 2001, including:
i) giving a true and fair view of the Group’s fi nancial position as at 30 June 2016 and of its performance for the year ended on that date; and
ii) complying with Australian Accounting Standards and the Corporations Regulations 2001.
b) the fi nancial report also complies with International Financial Reporting Standards as disclosed in note 2(a).
Report on the Remuneration Report
We have audited the Remuneration Report included in pages 32 to 47 of the Directors’ Report for the year ended 30 June 2016. The Directors of the Company are responsible for the preparation and presentation of the Remuneration Report in accordance with Section 300A of the Corporations Act 2001. Our responsibility is to express an opinion on the Remuneration Report, based on our audit conducted in accordance with auditing standards.
Auditor’s opinion
In our opinion, the Remuneration Report of Nearmap Ltd for the year ended 30 June 2016, complies with Section 300A of the Corporations Act 2001.
KPMG
Trent DuvallPartner
Sydney23 August 2016
Independent Auditor's Report 90 Independent Auditor’s Report
For
per
sona
l use
onl
y

Shareholder Information 91 91
Shareholder Information
Additional information required by the Australian Securities Exchange and not shown elsewhere in this report is as follows. The information is current as at 8 September 2016.
a) Distribution of ordinary sharesThe number of shareholders, by size of holding, are:
Range Number of holders Number of shares1–1,000 532 387,8691,001–5,000 2,589 7,470,0205,001–10,000 1,599 13,053,94110,001–100,000 2,368 74,623,375100,001 and over 322 261,010,896Total 7,410 356,546,101
The number of shareholders holding less than a marketable parcel of ordinary shares is: 263 121,012
b) Distribution of unquoted optionsESOP options exercisable at a range of prices between $0.39 and $1.08 expiring on various dates between 25 July 2017 and 30 November 2021.
Range Number of holders Number of options1–1,000 - -1,001–5,000 - -5,001–10,000 - -10,001–100,000 12 695,000100,001 and over 32 34,975,000Total 44 35,670,000
Shareholder Information
For
per
sona
l use
onl
y

92 92
Shareholder Information
c) Twenty largest shareholdersThe names of the twenty largest registered holders of quoted ordinary shares are:
Name Number of shares Percentage of shares1 National Nominees Limited 42,446,172 11.902 Longfellow Nominees Pty Ltd <Aeolus A/C> 38,155,167 10.703 JP Morgan Nominees Australia Limited 23,369,666 6.554 Longfellow Nominees Pty Ltd <Norgard Super Fund A/C> 11,881,128 3.335 RBC Investor Services Australia Nominees Pty Limited <VFA A/C> 6,165,364 1.736 Citicorp Nominees Pty Limited 4,505,981 1.267 BNP Paribas Noms Pty Ltd <DRP> 4,351,500 1.228 Mr Jason Mak 3,850,941 1.089 Mr Graham Griffi ths 3,397,179 0.9510 Oxidex Pty Ltd <Oxidex A/C> 3,250,000 0.9111 Venture Skills Pty Ltd <The Newman Family A/C> 3,145,000 0.8812 ABN Amro Clearing Sydney Nominees Pty Ltd <Custodian A/C> 3,062,205 0.8613 HSBC Custody Nominees (Australia) Limited <Oasis Cliffro A/C> 2,901,000 0.8114 Mr Paul Arthur Peterson 2,639,796 0.7415 HSBC Custody Nominees (Australia) Limited 2,619,995 0.7316 Australian Executor Trustees Limited <No 1 Account> 2,575,914 0.7217 Mr Simon Benedict Crowther & Mrs Fiona Kyla Crowther <Wisebuddha A/C> 2,500,000 0.7018 Mrs Alison Farrelly 2,380,019 0.6719 Roan Industries Pty Limited <Robinson Super Fund A/C> 2,055,664 0.5820 Doctors Own Pty Ltd <The Amboise Investment A/C> 2,000,098 0.56Total 167,252,789 46.91
d) Substantial ShareholdersThe names of substantial shareholders who have notifi ed the Company in accordance with section 671B of the Corporations Act 2001 are:
Name Number of shares Percentage of shares1. Ross Norgard1 50,076,295 14.381 As provided to the Company on 29 December 2014.
e) Voting rightsAll ordinary shares carry one vote per share without restriction. No voting rights are attached to options.
f) Securities Exchange QuotationThe Company’s ordinary shares are listed on the Australian Securities Exchange (Code: NEA). The Home Exchange is Perth.
g) Corporate Governance StatementThe Company’s Corporate Governance Statement for the 2016 fi nancial year can be accessed at:http://static.nearmap.com/investors/governance/statement/Corporate_Governance_Statement.pdf
Shareholder InformationShareholder Information
For
per
sona
l use
onl
y

93 93
Nearmap LtdABN 37 083 702 907
DirectorsPeter James (Non-Executive Chairman)Rob Newman (Managing Director & CEO)Ross Norgard (Non-Executive Director)Ian Morris (Non-Executive Director)Cliff Rosenberg (Non-Executive Director)
Company SecretaryShannon Coates
Registered Offi ceLevel 6, 6–8 Underwood StreetSydney NSW 2000
Websitewww.nearmap.com
SolicitorsDLA Piper
BankersCommonwealth Bank of AustraliaWells Fargo
Share RegisterComputershare Registry Services Pty LtdLevel 11, 172 St Georges’ TerracePerth WA 6000
AuditorsKPMG AustraliaTower ThreeInternational Towers Sydney 300 Barangaroo Avenue Sydney NSW 2000
Corporate Information
Corporate InformationCorporate Information
For
per
sona
l use
onl
y

Space X & Tesla Design Studios, Hawthorne, California, United States – June 2016Space X & Tesla Design Studios, Hawthorne, California, United States – June 2016
For
per
sona
l use
onl
y

Designed by Martin & Vic Printed by Optima Press
For
per
sona
l use
onl
y

nearmap.com
For
per
sona
l use
onl
y