Operation and maintenance water treatment plants, reuse, desalination

July 2017
How Proven Successes
Drive Future Growth
+ =
For
per
sona
l use
onl
y

DISCLAIMER (1/2)
This presentation has been prepared by Emefcy Group Limited (ASX: EMC) (“EMC” or the “Company”) in order to provide a
high level overview of the potential business combination of the Company and RWL Water LLC ("RWL Water").
This presentation should not be considered as an offer or invitation to subscribe for or purchase any shares in EMC or as an
inducement to make an offer or invitation to subscribe for or purchase any shares in EMC. No agreement to subscribe for
securities in the EMC will be entered into on the basis of this presentation or any information, opinions or conclusions
expressed in the course of this presentation.
This presentation is not a prospectus, product disclosure document or other offering document under Australian law or under
the law of any other jurisdiction. It has been prepared for information purposes only and does not constitute an offer or
invitation to apply for any securities, including in any jurisdiction where, or to any person to whom, such an offer or invitation
would be unlawful.
Certain information in this presentation has been obtained from publicly available information about RWL Water or from
representatives of RWL Water. While steps have been taken to review that information, no representation or warranty,
expressed or implied, is made as to its fairness, accuracy, correctness, completeness or adequacy. Certain market and
industry data used in connection with this presentation is based on research, surveys or studies conducted by third parties,
including industry or general publications. Neither the Company nor its representatives have independently verified any such
market or industry data or industry or general publications.
2
For
per
sona
l use
onl
y

DISCLAIMER (2/2)
This presentation may contain forward-looking statements which are identified by words such as ‘may’, ‘could’, ‘believes’,
‘estimates’, ‘targets’, ‘expects’, or ‘intends’ and other similar words that involve risks and uncertainties. These statements are
based on an assessment of past and present economic and operating conditions, and on a number of assumptions regarding
future events and actions that, as at the date of this presentation, are expected to take place. Such forward-looking
statements are not guarantees of future performance and involve known and unknown risks, uncertainties, assumptions and
other important factors many of which are beyond the control of the Company, its Directors and management. Although the
Company believes that the expectations reflected in and the assumptions underlying the forward looking statements included
in this presentation are reasonable, readers are cautioned not to place undue reliance on them, as the Company cannot give
any assurance that the results, performance or achievements covered by the forward-looking statements will actually occur.
To the maximum extent permitted by law, the Company and its professional advisors and their related bodies corporate,
affiliates and each of their respective directors, officers, management, employees, advisers and agents and any other person
involved in the preparation of this presentation disclaim all liability and responsibility (including without limitation and liability
arising from fault or negligence) for any direct or indirect loss or damage which may arise or be suffered through use of or
reliance on anything contained in, or omitted from, this presentation. Neither the Company nor its advisors have any
responsibility or obligation to update this presentation or inform the reader of any matter arising or coming to their notice after
the date of this presentation document which may affect any matter referred to in the presentation. Readers should make
their own independent assessment of the information and take their own independent professional advice in relation to the
information and any proposed action to be taken on the basis of the information.
3
For
per
sona
l use
onl
y

SUMMARY
Key factorsdesigned to accelerate Fluence’s
global success
Technology & compelling economics drive fast growth in decentralized water and wastewater treatment markets globally
Fluence anticipates this trend by delivering smart packaged plants: extensive customer benefits, faster time to order, earlier revenue recognition, maximizes margins
Clear path to higher margins via in-house innovation: MABR and more
Delivering these as packaged solutions leverages proven past experience
Manage growth by tracking key success metrics
4
For
per
sona
l use
onl
y

BRIEF BUSINESS UPDATE: ON OR AHEAD OF TARGET
Emefcy
• Wuxi demo plant – Testing completed, await data finalization then we submit report to them
• Jinzi demo plant – Commissioned & operational
• CGGC demo plant – Commissioned & operational
• Sinorichen demo plant – Installation started on Jul 4, commissioning to complete this week
• Signed ninth China partner Jiangsu Welle Environmental Company Ltd which has projects for 5,000 m3/day of wastewater treatment capacity in Anhui province; demo anticipated to be commissioned in September & lead directly to commercial contracts
• Six more China partnerships in discussion
• Further commercial contracts in negotiation in US and China
• Stanford – still negotiating contract terms (currently only MOU)
• Addis Ababa plant modules shipped
• China plant in transit now to Changzhou from Israel
• China team now 17 strong in 3 locations
RWL Water
• Packaged plant orders are currently ahead of forecast
Combined Company
• 83% of 2017 forecast revenue of US$90M already secured under backlog and revenue
5
Also see Reuters TV report on Fluence’s China activities: Http://reut.rs/2uLOBZs
For
per
sona
l use
onl
y

DECENTRALIZED SOLUTIONS ARE THE FUTURE
“Desire for greater cost control, system flexibility and higher
speed of deployment are driving a shift away from infrastructure-
heavy centralised systems towards decentralised and pre-
engineered treatment solutions… in rural areas,… in new urban
residential developments across Asia and Africa,… and in the
industrial market.”“The Global Water Market in 2018”
Global Water Intelligence
FLUENCE IS FOCUSED ON DELIVERING
INNOVATIVE AND PROFITABLE
DECENTRALIZED WATER AND WASTEWATER
TREATMENT SOLUTIONS
6
For
per
sona
l use
onl
y

FLUENCE’S TARGET MARKETS ARE GROWING RAPIDLY
5.55.1
2.7
9.18.4
4.4
MunicipalWastewater
IndustrialWastewater
Drinking water
2016 2021
Sources: MarketsandMarkets Analysis, Global Water Intelligence, company estimates
2016 2020
Wastewater reuse Desalination
New capex on
desalination and reuse
equipment (US$ Billions)
5.8
9.5
Cumulative new capex on
desalination and reuse
plants, 2017-22
(US$ Billions)
China &Taiwan
MiddleEast &Africa
USA EU/ CAsia
29.928.6
15.6
9.1
7
Smart Packaged Plants: Global market
size grows from US$13.3B in 2016 to
US$21.8B in 2021 (US$ Billions)
For
per
sona
l use
onl
y

PRIMARY GOALS
8
PROFITABILITY VISIBILITY DOMINANCE
Achieve sustained EBITDA profitability on quarterly basis during calendar year 2019 by maintaining revenue
growth rate, increasing gross margins &
minimizing opex growth
Improve revenue visibility via increased recurring
revenue
Become the dominant global player in
decentralized water and wastewater treatment solutions through our offering of innovative
water, wastewater and waste-to-energy
treatment technologies
For
per
sona
l use
onl
y

FLUENCE’S STRATEGY TO ACHIEVE ITS GOALS
Focus on key regions
• Focus on China – potentially fastest path to sales growth via product (modules) &
packaged systems sales
• Build momentum in other key geographies including North America, Latin America &
Rest of the world
Accelerate time to revenue
• Seek customers requiring immediate solutions, leveraging Fluence’s proven ability to
deploy solutions fast
• Implement standardized solutions – minimum engineering time
• Establish MABR as preferred solution & expand channels to market
• Establish and expand manufacturing capability of Fluence facility in China to meet
global demand
Minimize customeracquisition cost
• Seek customers & partners in municipal and industrial segments with repeat sales
potential
Maximize gross margin
• Deliver pipeline of innovation from Products & Innovation business – MABR now, then
SUBRE and much more.
• Maximize product and solution-level price/performance advantage
Maximize operating margin
• Deliver standardized packaged solutions to minimize in-house variable engineering
costs
Maximize revenue visibility
• Seek Build-Operate-Transfer (BOT), water Reuse as a Service (RaaS) or lease projects
with profitable recurring revenue streams, smart operation and after sales service
9
For
per
sona
l use
onl
y

FULL-CUSTOM VERSUS SMART PACKAGED PLANTS
Easy planning &
proposal stage:
1-2 months
Intensive civil works:
>30% of project cost,
6-9 months
Lengthy installation &
commissioning:
6-9 months
Custom Plant:
• 18-27 months from start to
finish
• Long-term = High capex, fixed
location
• High per-plant engineering
costs
• Capture less project revenue
• Requires onsite staffing
Smart Packaged Plant:
• 6-9 months from start to finish
• Near-term = Just-in-time capex,
mobile plant
• Approx 35% lower capex, 30%
lower opex
• Minimizes per-plant
engineering costs
• Captures more project revenue
• Remote, unattended operation
Minimal civil works:
Half of custom plant,
1-2 months
Fast installation &
commissioning:
1-2 months
Complex, lengthy planning &
proposal stage:
6-9 months
10
✓
For
per
sona
l use
onl
y

SMART PACKAGED PLANTS ARE A WIN-WIN FOR
FLUENCE & CUSTOMERS
Option Impact on Customer Impact on Fluence
Fully custom-
engineered
plant
✓ Maximum flexibility
Longest path from order to operation
Maximum civil works
Maximum onsite engineering work & costs
High capex from long-term planning
Often hard, slow & costly to upgrade
Requires onsite staffing
Very slow path from pipeline to
booking, and booking to revenue
Often compete with bigger players
Capture less value per project
Incur maximum SG&A costs to
service customer
Smart
packaged
plant
✓ Fastest path from order to operation
✓ Minimizes civil works
✓ Minimizes onsite engineering work &
costs
✓ Just-in-time capex
✓ Improved end-to-end quality control
✓ Easy, quick & cost-effective upgrades
✓ No, or limited, onsite staff needed
✓ Portability makes interim lease viable
✓ Accelerates project from pipeline to
booking, and booking to revenue
✓ Captures maximum revenue per
project
✓ Minimizes SG&A costs to service
customer
✓ Competition is local or less focused
✓ Easiest path to repeat sales: new
orders and upgrades
11
For
per
sona
l use
onl
y
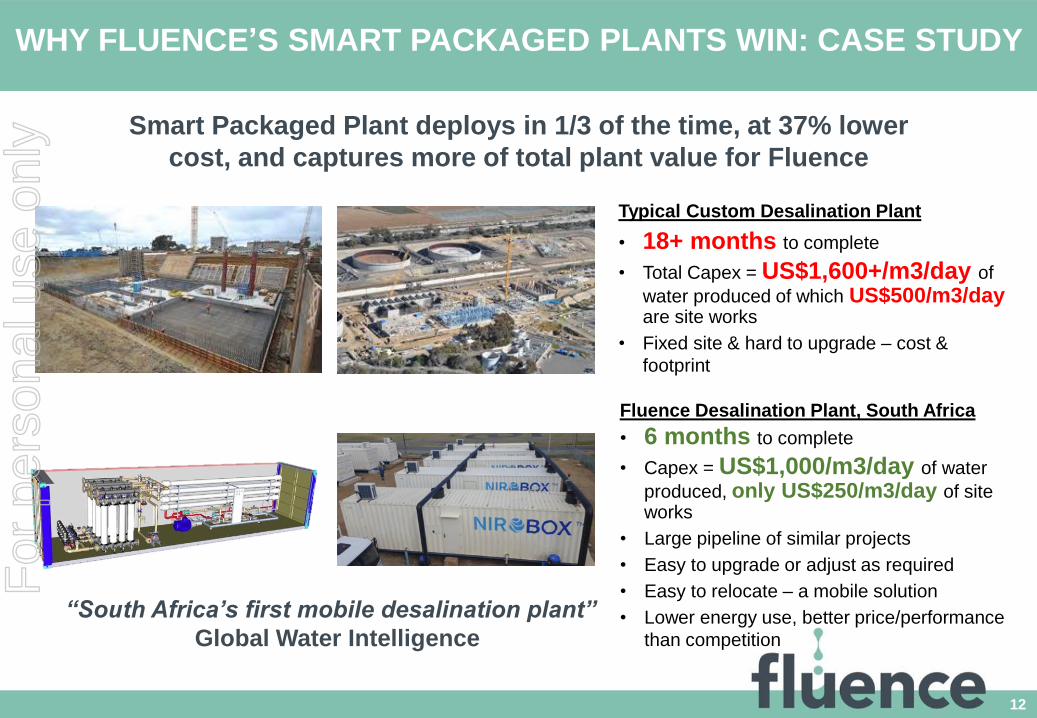
WHY FLUENCE’S SMART PACKAGED PLANTS WIN: CASE STUDY
Typical Custom Desalination Plant
• 18+ months to complete
• Total Capex = US$1,600+/m3/day of
water produced of which US$500/m3/dayare site works
• Fixed site & hard to upgrade – cost &
footprint
Fluence Desalination Plant, South Africa
• 6 months to complete
• Capex = US$1,000/m3/day of water
produced, only US$250/m3/day of site works
• Large pipeline of similar projects
• Easy to upgrade or adjust as required
• Easy to relocate – a mobile solution
• Lower energy use, better price/performance
than competition
“South Africa’s first mobile desalination plant”
Global Water Intelligence
Smart Packaged Plant deploys in 1/3 of the time, at 37% lower
cost, and captures more of total plant value for Fluence
12
For
per
sona
l use
onl
y

HOW SMART PACKAGED PLANTS ACCELERATE
CHINA SUCCESS
13
Nirobox:
Packaged
desalination plant
designed & built
by Fluence,
deploying globally
since 2015
Containerized
MABR plant:
Packaged
wastewater
treatment plant
designed & built
by Fluence for
Chinese and
other partners
Packaged plant expertise helps speed rollout
of MABR in China:
• Locally made MABR modules reach sites fast
• Packaged solutions minimize engineering per plant,
allow handling of bulk orders
• Minimal civil works accelerates commissioning
• Smart operation avoids need for onsite staff
• Energy savings minimize customer opex, increase IRR
For
per
sona
l use
onl
y

HOW SMART PACKAGED PLANTS ACCELERATE RAAS
RaaS (Reuse-as-a-Service) incorporating MABR technology can save resorts ~30% in water-related opex (10% of revenues)
Low-energy RaaS helps office campuses meet sustainability goals
Resorts and office campuses want to minimize disruption from civil works
Neighborhood-friendly systems are required
Modular systems can be upgraded and relocated
Smart Packaged Plants easier to permit, perceived as less risky to adopt
14
For
per
sona
l use
onl
y

FLUENCE’S INNOVATION COMBINED WITH SMART
PACKAGED PLANTS IMPROVES MARGIN UPLIFT
• MABR saves up to 90% of aeration energy in wastewater treatment –
potentially halving plant opex: capex also lower at target plant sizes
• Innovative process modeling increases throughput
• SUBRE – Enables retrofit of existing plants of any size to either meet
stricter nitrogen discharge requirements or increase plant capacity without
new infrastructure, all while saving energy– a new US$2 billion/year market
• Fluence’s innovation pipeline contains many breakthrough innovations to
sustain differentiation
• Smart Packaged Plants save customers civil works cost and capture some
of the savings, lifting margins
• China manufacturing lowers costs
15
For
per
sona
l use
onl
y

STRONG EXPERIENCE MITIGATING COUNTRY &
CUSTOMER RISK
Country
RiskSituation Risk Mitigation Strategy
Examples Of
Successes
Low • Investment Grade
• Hard Currency ($/Euro’s)
• Low Inflation
• Strong Legal/Contractual
Framework
• $/Euro denominated contracts
• Index-linked protection
• Stay cash flow positive as delivered
• Bank LC’s cover customer credit risk
US, Europe,
Israel
Medium • Generally Non-
Investment Grade
• Some currency volatility
risk
• Potential for higher
inflation levels
• Developing
Legal/Contractual
Framework
• $/Euro denominated/tied contracts
• Index-linked protection
• Stay cash flow positive as delivered
• International bank LC’s cover country &
customer risks
• Smart Packaged Plant minimizes local
execution
• If BOT, financing tied to revenue
denomination
China, Argentina,
Colombia, Brazil,
Peru, Mexico,
South Africa
High • As above but higher
currency, legal, and
political volatility
• As above but require $/Euro cash on
deposit in acceptable geography
Venezuela,
Egypt,
Afghanistan, Iraq
16
For
per
sona
l use
onl
y

<US$5m Equity (<12.5%)>US$5m Equity (>12.5%)
HOW A TYPICAL BOT* CONTRACT WORKS
Water Utility
( Offtaker)
Special Purpose Entity
(SPE)
20 - 30 year Offtake Agreement
(mainly take-or-pay)
Non-Recourse Financing
Fixed Term
Libor + Spread
US$30m
(75%)
Fluence
>50% Equity
Local Partner
<50% Equity
O&M Agreement
100% Fluence or JV
with Local Partner
~8-10% of
Project
Value/year
17
Example: US$40M project
Fluence receives:
1. Full equipment gross margin on project construction
2. +15% Risk Adjusted IRR on invested equity over the life of the Offtake
Agreement
3. Ongoing share of profits on any O&M Agreement fees
*Build Own/Operate Transfer
For
per
sona
l use
onl
y

FLUENCE METRICS TO INDICATE SUCCESS
Pipeline • Breakout by type of opportunity once meaningful
Bookings • Breakout by type and region
• Pipeline conversion rates versus industry norms
Backlog • Breakout by type & region, & when due as revenue
Revenue
• RWL Water CY 2017 target is US$90M, noting revenues as part
of Fluence will commence from 14 July 2017.
• Publish 2018 target in early 2018
Gross margin as
% of revenue
• Gross margin improvement anticipated for 2017
• Publish target for Q4 calendar 2018 in early 2018
Recurring revenue as
% of revenue• Small now but start reporting when meaningful
Repeat customers • Report anecdotally
Other metrics • Will announce strategic contracts & those beyond forecast
18
For
per
sona
l use
onl
y

FLUENCE KPI’S
US$ millions 20151 20161 2017 YTD1,2
Total Bookings 57.1 71.2 55.6
Revenue 54.9 61.7 20.1
Year End Backlog 70.1 63.7 82.9
Gross Margin % 7.1% 16.9% TBD
19
2017 YTD revenue & backlog falling in 2017 = US$74.7M
83% of US$90M CY2017 guidance
Footnotes:
1. RWL Water revenue shown for each period. Officially reported 2017 revenue for Fluence will only include RWL
Water revenue from July 14 2017 till Dec 31 2017. RWL Water - full year revenue will only be reported as a
footnote.
2. PDVSA project booking and backlog excluded.
For
per
sona
l use
onl
y

KEY METRICS: SMART PACKAGED PLANT REVENUE GROWTH
• Smart Packaged Plants
go from pipeline to
bookings to revenue
much faster than custom
projects
• Smart Packaged Plants
require less engineering
& opex to deliver
20
2015 2016 2017E
Custom projects & other Packaged plants
$6M
$56M
$28M
$62M$1M
$54M
$90M
$62M
All US$
$55M
For
per
sona
l use
onl
y

PLANNED MIGRATION TO PROFITABILITY
2H CY 2017:Sustain Revenue Growth
Invest in products, channels, and capacity
• Strengthen strategic relationships in China
• Invest in product development of MABR Gen 3, SUBRE
• Focus on achieving US$90M in CY 2017 revenues
• Invest in production capability in Argentina and China
• Integrate organization and financial/IT systems
2018:Sustain revenue growthIncrease gross margin %
Increase recurring revenue %
• Build China commercial order book for 2018-19
• Build sales pipeline for MABR products outside China
• Ramp up production in China to meet global demand
• Lift gross margin % by increasing sale of next-gen products and
Smart Packaged Plant sales
• Lift recurring revenue % through BOT & RaaS projects
• Complete integration
2019:Sustain revenue growth
Attain EBITDA profitability• Aim to attain & sustain EBITDA profitability on a quarterly basis
21
For
per
sona
l use
onl
y

SUMMARY
Key factorsdesigned to accelerate Fluence’s
global success
Technology & compelling economics drive fast growth in decentralized water and wastewater treatment markets globally
Fluence anticipates this trend by delivering smart packaged plants: extensive customer benefits, faster time to order, earlier revenue recognition, maximizes margins
Clear path to higher margins via in-house innovation: MABR and more
Delivering these as packaged solutions leverages proven past experience
Manage growth by tracking key success metrics
22
For
per
sona
l use
onl
y

KEY CONTACTS
Richard Irving
Emefcy Group Limited
Executive Chairman
+1 408 382 9790
Henry Charrabé
RWL Water
President & CEO, Global Operations
+1 212 572 3766
23
For further detail please see “Emefcy RWL Binding Agreement Investor
Presentation” released on May 26 2017 and available on website
For
per
sona
l use
onl
y

Appendices
- Financials
24
For
per
sona
l use
onl
y

RWL WATER FINANCIALS
25
US$'000 CY15 (Audited) CY16 (Audited) CY17 Forecast
Revenue 54,879 60,932 90,0001
Cost of sales (50,986) (49,307)
Gross profit 3,893 11,625
Gross profit margin % 7.1% 19.1%
Selling, general and administrative expenses (41,471) (28,740)
EBITDA (37,578) (17,115)
Amortisation and depreciation (2,296) (1,624)
Impairment of goodwill and intangibles (1,264) -
Finance income 12,467 13,239
Foreign exchange gain / (loss) 1,095 (6,765)
Other income, net 3,095 9
Loss before tax (24,482) (12,257)
Income tax (expense) / refund (177) (2,773)
Loss after tax (24,658) (15,030)
Net (loss) gain attributable to non-controlling interest 756 (202)
Net loss attributable to RWL Water Group (25,414) (14,828)
RWL Water is expected to generate US$90m in revenue in CY17 and is anticipated to improve gross
margins as it continues to sell higher margin products
1 = Officially reported 2017 revenue for Fluence will only include RWL Water revenue from July 14 2017 till Dec 31 2017.
RWL Water - full year revenue will only be reported as a footnote.
For
per
sona
l use
onl
y

FLUENCE PRO FORMA BALANCE SHEET
26
US$
Emefcy Group Limited
(IFRS)
31 December 2016 -
Audited
RWL Water LLC (US
GAAP)
31 December 2016 -
Audited
Adjustments Pro-forma Consolidated
balance sheet (IFRS)
Assets
Cash and cash equivalents 22,870,848 10,867,809 - 33,738,657
Short term investments / deposits 114,706 50,952,155 - 51,066,861
Trade and other receivables 761,982 12,456,864 - 13,218,846
Costs and estimated earnings in excess of
billings on contracts-in-progress - 5,992,757 - 5,992,757
Inventories 452,454 4,348,014 - 4,800,468
Prepayments 205,023 6,796,294 - 7,001,317
Property, plant and equipment 1,039,460 2,012,359 - 3,051,819
Goodwill and Intangible assets 2,133,548 6,479,240 58,040,717 66,653,505
Other assets 18,761 960,065 1,076,000 2,054,826
Total assets 27,596,782 100,865,557 59,116,717 187,579,056
Liabilities
Trade and other payables 2,410,020 11,637,164 1,417,115 15,464,299
Billings in excess of costs and estimated
earnings on contracts-in-progress - 819,649 - 819,649
Short term borrowings and current
maturities of long term debt - 1,217,694 - 1,217,694
Notes payable to related parties - 482,076 - 482,076
Deferred revenue - 36,104,019 - 36,104,019
Provisions 123,113 38,019,596 - 38,142,709
Other financial liabilities 1,000,000 1,285,044 3,842,011 6,127,055
Total Liabilities 3,533,133 89,565,242 5,259,126 98,357,501
Total equity 24,063,649 11,300,315 53,857,591 89,221,555Notes on the next page
For
per
sona
l use
onl
y

FLUENCE PRO FORMA BALANCE SHEET (continued)
27
Notes:
The December 31, 2016 consolidated balance sheet pro-forma is based on the combined balance sheets of Emefcy, audited and accounted in accordance with IFRS (Column A) and RWL, audited and
accounted in accordance with US GAAP (Column B), as if the merger closed as of that date. No changes were made to any of these balance sheets except presenting all equity components in a single
Financial Statement Line Item (FSLI).
Since the Emefcy accounts are audited and accounted in accordance with IFRS and the RWL accounts are audited and accounted in accordance with US GAAP, Emefcy used an experienced external
consultant to support preparation of the adjustments to the RWL accounts (Column C).
The accounting for the PDVSA contract treated the ARS/Dollar exchange rate from a $95 million deposit as an integral component of the project economics. The experienced external consultant
supporting the IFRS adjustment procedure suggested an alternative accounting treatments but that alternative treatment was ultimately dismissed after extensive discussion between management,
auditors and the experienced external consultant. Depending on the future assessment by the Company’s auditors that alternative approach could possibly be accepted but any change would not
impact the underlying merits of the project’s economic value.
In preparing the adjustments to IFRS, Emefcy used the following procedures and assumptions which have been agreed to by RWL's corporate finance team. No verification was made by the
experienced external consultant to any underlying data used.
1. The procedures performed did not include any auditing or review procedures, in accordance with auditing or review standards, respectively; if such additional procedures were performed,
other matters, with potential significant impact on the Pro Forma Information, might be identified.
2. The identified potential material GAAP differences, detailed below, does not represent a full list of IFRS vs US GAAP differences, as might be identified upon a complete conversion of RWLs
financial statement to IFRS.
3. A materiality threshold of $1.8 million was used (per FSLI). Such threshold was based on approximately 3% of RWL's 2016 revenues. All identified differences below $1.8 million are not
reflected in the consolidated balance sheet pro-forma.
4. RWL's FSLIs, post the adjustments in Column C, are presented at their book values, as no Purchase Price Allocation was performed. As such, the December 31, 2016 consolidated balance
sheet pro-forma (Column D) does not include any Fair Value mark ups, nor any potential additional intangible assets, which might have been identified as part of such Purchase Price
Allocation.
5. The additional shares to be issued by Emefcy as part of this transaction was valued based on Emefcy's share price at December 31, 2016 of $0.66 per share. The number of such additional
shares which is included in Pro Forma Information is 100.5 million.
6. The Pro Forma Information does not include any potential adjustments for tax implications which might result from the Proposed Transactions.
7. The Pro Forma Information does not include any adjustments for potential differences in accounting policies accounted by RWL and Emefcy.
8. The Pro Forma information does not include the proposed placement of $20 million to the Seller, which is subject to shareholders approval
The "Adjustments" column (Column C) includes the following types of adjustments:
1. US GAAP vs. IFRS differences identified with regard to the Call and PUT options related to the purchase of the minority interests, as part of the acquisitions by RWL of RWL Argentina and
RWL Italy.
2. Estimated merger related and share issuance costs.
3. Conversion of certain liabilities which will be satisfied by the Owner of RWL into equity in RWL.
4. Since no Purchase Price Allocation was performed, any difference between the RWL's book values and the Merger's consideration related to new shares which are to be issued, was
included in the Goodwill FSLI.For
per
sona
l use
onl
y

FLUENCE PRO FORMA BALANCE SHEET (continued)
28
Notes on RWL Water LLC's Balance Sheet:
Short term investments / deposits
During 2015, RWL Water Argentina received the Argentine peso (ARS) equivalent of US$95.5 million as an upfront payment on a contract with a customer in Venezuela. Certain transaction and bank
fees, as well as taxes, were deducted from this advance, ultimately leaving the ARS equivalent of US$92.7 million as the net advance payment. The money has been invested in short-term instruments
at various interest rates to preserve the USD value of the advance payment, and the majority of RWL Water’s short-term investment balance at 12/31/16 relates to the money remaining from this
advance payment.
Deferred revenue
The deferred revenue balance at December 31, 2016 primarily relates to RWL Water Argentina’s contract with the customer in Venezuela. Approximately US$35.2 million of the US$36.1 million year-
end deferred revenue balance relates to this contract, and it represents the remaining work to be delivered from the original advance payment.
Provisions
Provisions at 12/31/2016 include a contingency for risks and uncertainties related to the project in Venezuela. Although RWL Water Argentina still expects to achieve the original margin negotiated in
the contract, there are certain risks associated with the contract, primarily the dire economic and political situation in Venezuela and the risk of further devaluation of the Argentine peso, that prompted
RWL Water management to book a contingency to reduce the expected margin on this project.
For
per
sona
l use
onl
y