For personal use only · 2015-05-18 · ERM Power is an Australian energy company that operates...
16
Tuesday, 19 May 2015 PRESENTATION TO BROKER CONFERENCES ERM Power Limited (ASX: EPW) Managing Director and CEO Jon Stretch will be speaking at the JP Morgan Utilities Forum in Melbourne today. A copy of his presentation follows. He will deliver the same presentation to the Goldman Sachs Sixth Annual Small and Mid-Cap Conference in Sydney tomorrow. Peter Jans Group General Counsel & Company Secretary ERM Power Limited For further information Garry West Corporate Communications and Investor Relations Manager Phone: +61 7 3020 5165 Mobile: +61 457 140 650 Email: [email protected] About ERM Power ERM Power is an Australian energy company that operates electricity sales and electricity generation businesses. Trading as ERM Business Energy and founded in 1980, we have grown to become the 4th largest electricity retailer in Australia with operations in every state and the Australian Capital Territory. We are also licensed to sell electricity in several markets in the United States. We have equity interests in 497 megawatts of low emission, gas fired peaking power stations in Western Australia and Queensland, both of which we operate. www.ermpower.com.au For personal use only
Transcript of For personal use only · 2015-05-18 · ERM Power is an Australian energy company that operates...

Tuesday, 19 May 2015
PRESENTATION TO BROKER CONFERENCES
ERM Power Limited (ASX: EPW) Managing Director and CEO Jon Stretch will be speaking at the JP Morgan Utilities Forum in Melbourne today. A copy of his presentation follows. He will deliver the same presentation to the Goldman Sachs Sixth Annual Small and Mid-Cap Conference in Sydney tomorrow.
Peter Jans Group General Counsel & Company Secretary ERM Power Limited
For further information
Garry West Corporate Communications and Investor Relations Manager Phone: +61 7 3020 5165 Mobile: +61 457 140 650 Email: [email protected]
About ERM Power
ERM Power is an Australian energy company that operates electricity sales and electricity generation businesses. Trading as ERM Business Energy and founded in 1980, we have grown to become the 4th largest electricity retailer in Australia with operations in every state and the Australian Capital Territory. We are also licensed to sell electricity in several markets in the United States. We have equity interests in 497 megawatts of low emission, gas fired peaking power stations in Western Australia and Queensland, both of which we operate.
www.ermpower.com.au
For
per
sona
l use
onl
y
JP MORGAN UTILITIES FORUM
Jon Stretch, Managing Director and CEO 19 May 2015
For
per
sona
l use
onl
y

Disclaimer
This presentation contains certain forward-looking statements with respect to the financial condition, results of operations and business of ERM Power Limited (ERM Power) and certain plans and objectives of the management of ERM Power.
Such forward-looking statements involve both known and unknown risks, uncertainties, assumptions and other important factors which are beyond the control of ERM Power and could cause the actual outcomes to be materially different from the events or results expressed or implied by such statements.
None of ERM Power, its officers, advisers or any other person makes any representation, assurance or guarantee as to the accuracy or likelihood of fulfilment of any forward-looking statements or any outcomes expressed or implied by any forward-looking statements.
The information contained in this presentation does not take into account investors investment objectives, financial situation or particular needs. Before making an investment decision, investors should consider their own needs and situation and, if necessary, seek professional advice.
To the maximum extent permitted by law, none of ERM Power, its directors, employees or agents, nor any other person accepts any liability for any loss arising from the use of this presentation or its contents or otherwise arising out of, or in connection with it.
Non-IFRS information
This document may contain certain non-IFRS financial measures and other defined financial terms.
The directors believe the presentation of certain non-IFRS financial measures is useful for the users of this document as they reflect the underlying financial performance of the business. The non-IFRS financial measures include but are not limited to:
EBITDAIF - Earnings before interest, tax, depreciation, amortisation, impairment, net fair value gains/losses on financial instruments designated at fair value through profit and loss and gains/losses on onerous contracts. EBITDAIF includes any profit or loss from associates.
Underlying EBITDAIF - EBITDAIF excluding significant items.
Underlying profit or Underlying NPAT - Statutory net profit after tax attributable to equity holders of the Company after excluding the after tax effect of unrealised marked to market changes in the fair value of financial instruments, impairment, gains/losses on onerous contracts and other significant items. Underlying NPAT includes any profit or loss from associates.
During the period the Group changed the definition of underlying NPAT to exclude significant items. In prior periods these items were shown as adjusting items to underlying earnings measures. The change was made to reflect how financial information is reported to senior management and the managing director.
All reference to $ is a reference to Australian dollars unless otherwise stated. Individual items, totals and percentages are rounded to the nearest appropriate number or decimal. Some totals may not add down the page due to rounding of individual components.
2
IMPORTANT NOTICE - DISCLAIMER F
or p
erso
nal u
se o
nly

BUSINESS OVERVIEW
For
per
sona
l use
onl
y

ERM Power is an Australian energy company that operates electricity generation and electricity sales businesses.
Trading as ERM Business Energy, we have grown to become the 4th largest electricity retailer in Australia with operations in every state and the Australian Capital Territory.
We also sell electricity in several markets in the United States.
We have equity interests in 497 megawatts of low emission, gas fired peaking power stations in Western Australia and Queensland, both of which we operate.
ASX: EPW
Revenue >$2 billion
Market capitalisation ~$600m
>5,700 shareholders
– Founder 31%
– Balance a mix of institutional and retail investors
4
COMPANY SNAPSHOT 35 YEAR TRACK RECORD
For
per
sona
l use
onl
y
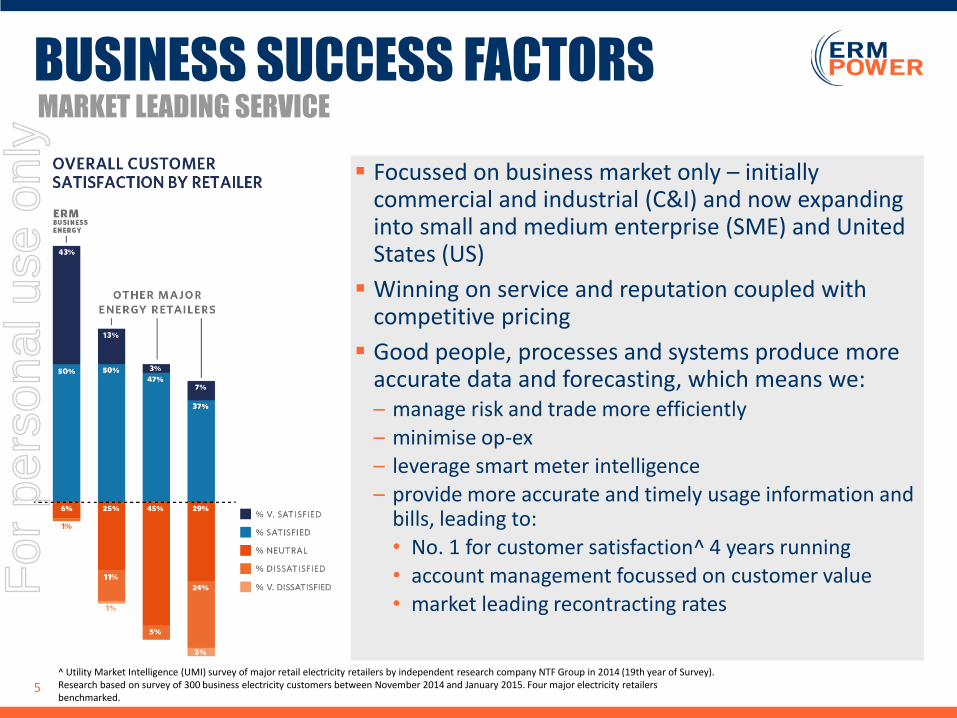
Focussed on business market only – initially commercial and industrial (C&I) and now expanding into small and medium enterprise (SME) and United States (US)
Winning on service and reputation coupled with competitive pricing
Good people, processes and systems produce more accurate data and forecasting, which means we: – manage risk and trade more efficiently
– minimise op-ex
– leverage smart meter intelligence
– provide more accurate and timely usage information and bills, leading to:
• No. 1 for customer satisfaction^ 4 years running
• account management focussed on customer value
• market leading recontracting rates
5
BUSINESS SUCCESS FACTORS MARKET LEADING SERVICE
^ Utility Market Intelligence (UMI) survey of major retail electricity retailers by independent research company NTF Group in 2014 (19th year of Survey). Research based on survey of 300 business electricity customers between November 2014 and January 2015. Four major electricity retailers benchmarked.
For
per
sona
l use
onl
y
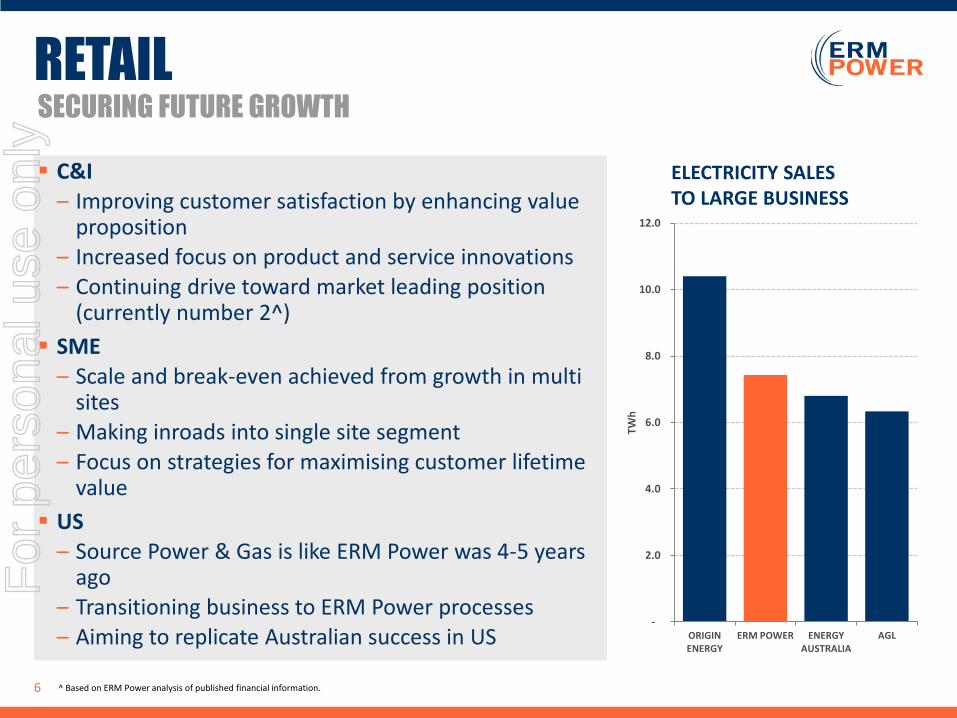
C&I – Improving customer satisfaction by enhancing value
proposition – Increased focus on product and service innovations – Continuing drive toward market leading position
(currently number 2^)
SME – Scale and break-even achieved from growth in multi
sites – Making inroads into single site segment – Focus on strategies for maximising customer lifetime
value
US – Source Power & Gas is like ERM Power was 4-5 years
ago – Transitioning business to ERM Power processes – Aiming to replicate Australian success in US
ELECTRICITY SALES TO LARGE BUSINESS
6
RETAIL SECURING FUTURE GROWTH
^ Based on ERM Power analysis of published financial information.
-
2.0
4.0
6.0
8.0
10.0
12.0
ORIGIN ENERGY
ERM POWER ENERGY AUSTRALIA
AGL TW
h
For
per
sona
l use
onl
y

100% ownership of Oakey Power Station (332 MW gas and diesel-fired peaker) in Queensland, operating merchant and contracting internally to retail business and externally to third parties
50% ownership of Neerabup Power Station (330 MW gas-fired peaker) in Western Australia, contracted to 2029
GENERATION
7
QUALITY ASSETS
Oakey Power Station
For
per
sona
l use
onl
y

– Compound annual growth rate of 40% in revenue over last four financial years
– Customer oriented business model
• Price competitively with efficient processes and ‘big data’ ->
• Accurate and timely usage and billing information ->
• Industry leading customer satisfaction ->
• Industry leading customer re-contracting/retention
– Build on successful proposition in Commercial and Industrial in Australia
• Extend to SME in Australia
• Extend to US
8
SUMMARY CONTINUE TO DRIVE LONG TERM PROFITABLE GROWTH
¹ Refer page 2 of presentation for definitions
For
per
sona
l use
onl
y

FINANCIAL RESULTS
For
per
sona
l use
onl
y
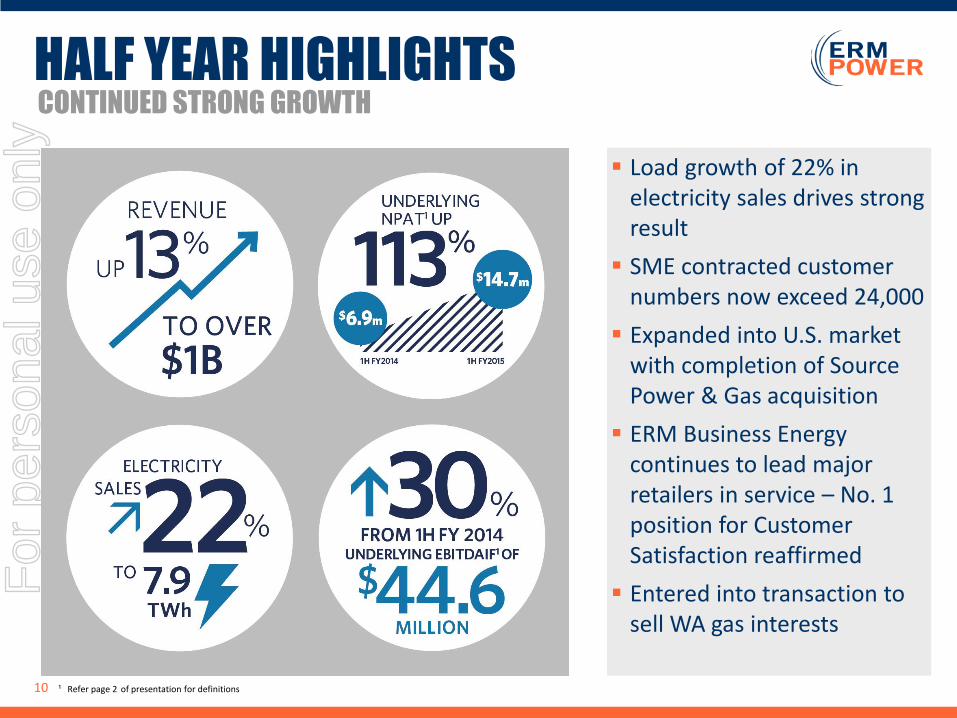
Load growth of 22% in electricity sales drives strong result
SME contracted customer numbers now exceed 24,000
Expanded into U.S. market with completion of Source Power & Gas acquisition
ERM Business Energy continues to lead major retailers in service – No. 1 position for Customer Satisfaction reaffirmed
Entered into transaction to sell WA gas interests
10
HALF YEAR HIGHLIGHTS CONTINUED STRONG GROWTH
¹ Refer page 2 of presentation for definitions
For
per
sona
l use
onl
y

Underlying EBITDAIF ¹ growth higher than
revenue growth due to removal of
carbon tax
Underlying NPAT ¹ result driven by 22%
growth in retail electricity sales volumes
and increased margins
As part of restructure of gas assets, a
$3m impairment charge taken reflects
the expected sale price
Statutory operating cash flow high due to
favourable working capital movements.
Excluding these movements, operating
cash flow up $10.1m from prior half.
FY2015 HALF YEAR FINANCIALS
11
GROWTH IN REVENUE, EARNINGS AND CASH FLOW
¹ Refer page 2 of presentation for definitions
$m unless otherwise stated 1H FY 2015
1H FY 2014
% Change
Revenue and other income 1,099.1 970.1 +13%
Underlying EBITDAIF1 44.6 34.4 +30%
Underlying NPAT1 14.7 6.9 +113%
Underlying earnings per share (cents)
6.1 3.2 +91%
Interim Dividend (cents per
share) fully franked
6.0 6.0 -
Operating cash flow before changes in working capital
41.1 31.0 +33%
Operating cash flow before changes in working capital (cents per share)
17.1 14.3 +20%
For
per
sona
l use
onl
y

Gross margins per MWh and sales volumes increased during the period
Further gross margin improvements expected over full year
Operating costs fell on a per unit basis as both C&I and SME operations continued to build scale
12
ENERGY RETAILING ELECTRICITY SALES VOLUMES GREW STRONGLY
$m unless otherwise stated 1H FY 2015 1H FY 2014 % improvement
Electricity sales volume (TWh) 7.9 6.5 +22%
Gross margin $ per MWh 4.06 3.60 +13%
Operating costs $ per MWh (1.37) (1.65) +17%
Revenue excluding interest income
1,052.4 928.5 +13%
Underlying EBITDAIF1 23.1 14.1 +64%
Collection rate 99.90% 99.96% (-0.06%)
Forward contracted sales (TWh)
29 24 +21%
¹ Refer page 2 of presentation for definitions
For
per
sona
l use
onl
y

Customer growth demonstrates continuing ERM Business Energy value and competitiveness
SME currently operating in Vic, NSW, ACT, SA and Tas
ERM Business Energy continues to lead major retailers in service – ranked No. 1 for Customer Satisfaction for 4th consecutive year^
13
ENERGY RETAILING CUSTOMER ACQUISITION CONTINUES RETAIL GROWTH TRAJECTORY
(Billed customers) (Contracted customers)
* National Meter Identifiers – unique identifiers for sites that can choose a retail supplier. A customer may have more than one site and more than one NMI. ^ Utility Market Intelligence (UMI) survey of major retail electricity retailers by independent research company NTF Group in 2014 (19th year of Survey). Research based on survey of 300 business electricity customers between November 2014 and January 2015. Four major electricity retailers benchmarked.
For
per
sona
l use
onl
y

Increased revenue and underlying EBITDAIF ¹ as a result of additional energy sales from Neerabup
Oakey now operating merchant and contracting internally to retail business and externally to third parties
GENERATION
14
CONSISTENT PERFORMANCE
$m unless otherwise stated
1H FY 2015
1H FY 2014
% change
Revenue 39.6 36.3 +9%
Underlying EBITDAIF1 26.3 24.7 +6%
¹ Refer page 2 of presentation for definitions
For
per
sona
l use
onl
y

Garry West Corporate Communications & Investor Relations Manager 0457 140 650 [email protected]
FOR MORE INFORMATION
ermpower.com.au
For
per
sona
l use
onl
y


![[PPT]PowerPoint Presentation - Event Schedule & Agenda …schd.ws/hosted_files/2016agripspring/97/Joint ERM... · Web viewOutline ERM Frameworks Why CIS is Involved in ERM CIS ERM](https://static.fdocuments.in/doc/165x107/5ac13a447f8b9a4e7c8cc305/pptpowerpoint-presentation-event-schedule-agenda-schdwshostedfiles2016agripspring97joint.jpg)