For personal use only - ASX · 2. Homewares = furniture and household goods such as kitchen and...
58
November 30, 2016 Level 10 / 271 Collins St For personal use only
Transcript of For personal use only - ASX · 2. Homewares = furniture and household goods such as kitchen and...

November 30, 2016
Level 10 / 271 Collins St
For
per
sona
l use
onl
y

2By Skye Ryan-Evans
D E S E R T H E A T
2
For
per
sona
l use
onl
y

For
per
sona
l use
onl
y

AGENDA
5
2:05 – 2:10 Introduction [Lloyd Heinrich]
2:10 – 2:25 The fundamentals [Martin Hosking]
2:25 – 2:45 Artists and Content [Barry Newstead]
2:45 – 3:00 Q&A
3:00 – 3:15 The customer [Nick Kenn]
3.15 – 3:30 Fulfillers [Rob Baumert]
3:30 – 4:00 Product Showcase [Vicki Stirling]
4:00 – 4:20 Break & Q&A
4:20 – 4:40 Financial foundations [Chris Nunn]
4:40 – 5:00 The future [Martin Hosking & Barry Newstead]
5:00 – Close Q&A then light refreshments
For
per
sona
l use
onl
y

PRESENTING TODAY
6
BARRY NEWSTEAD
Chief Operating Officer
MARTIN HOSKING
Chief Executive Officer
CHRIS NUNN
Chief Financial Officer
ROB BAUMERT
Chief Fullfilment &
Analytics Officer
VICKI STIRLING
GM Products
NICK KENN
GM Marketplace Growth
LLOYD HEINRICH
GM Strategy & IRFor
per
sona
l use
onl
y

Presented by: Martin Hosking
1
7
B U I L D I N G A H I G H G R O W T H ,
S U S T A I N A B L E A N D D I V E R S I F I E D
M A R K E T P L A C E
For
per
sona
l use
onl
y

$1 $4 $4 $6
$16
$34
$59
$88
$143
$0
$20
$40
$60
$80
$100
$120
$140
$160
FY08 FY09 FY10 FY11 FY12 FY13 FY14 FY15 FY16
$A
UD
Mill
ion
s
GTV1 by Fiscal Year
8
1 0 Y E A R S O F S T R O N G G R O W T H
1. GTV (Gross Transaction Value) = Total receipts from customers less fraud, refunds and chargebacks. Source: Redbubble internal data
For
per
sona
l use
onl
y

9
S T R O N G O R G A N I C G R O W T H D R I V E N B Y U N I Q U E C O N T E N T I N T H E M A R K E T P L A C E
Redbubble continues to attract ever
M O R E A R T I S T Sto the platform
Growth in artist numbers leads to
M O R E C O N T E N T
available for sale
This attracts M O R E
C U S T O M E R S looking for creative
designs
With L O W C U S T O M E R
A C Q U I S I T I O N C O S T S ,
many customers come through free sources
49% 53% 69% 5.5 centsCAGR of Selling Artists
FY2012-FY2016 CAGR of Works Sold
FY2012-FY2016 CAGR of Customer
NumbersFY2012-FY2016
Per $ of GTVFY2016
This growth in content means
increasing D I V E R S I T Y & R E L E V A N C E
73%Of sales from works that sold 50 times or
less (FY2016)
Source: Redbubble internal data
For
per
sona
l use
onl
y

T H E C O N T E N T & F U L F I L M E N T M O D E L I S U N I Q U E LY S C A L A B L E
10
CONTENT ENDURES CREATING:
• New products • New geographies
• An increasing content library• Recurring revenues
CONTENT IS RE-PURPOSABLE FOR:
THIRD PARTY FULFILMENT ENABLES:
DIGITAL IMAGE
61 PRODUCTS15 FULFILLERS
• Scaling• Scope extensions• With quality protections
For
per
sona
l use
onl
y

0%
10%
20%
30%
40%
50%
60%
70%
80%
90%
100%
$0.00 $0.05 $0.10 $0.15 $0.20 $0.25 $0.30 $0.35 $0.40
Yo
Y G
row
th R
ate
PenetrationRedbubble sales per Capita ($AUD)
YoY Product Sales Growth FY2016
11
Japan
Germany Switzerland United States
United Kingdom
Australia
Canada
France
Italy
Spain
Singapore
Sweden
Norway
Ireland
New Zealand
DenmarkFinland
Austria
Belgium
Netherlands
Source: Redbubble internal data. Population source: Wikipedia
Share of GTV
S A L E S A R E G L O B A L LY D I V E R S I F I E D W I T H S T R O N G G R O W T H I N A L L M A R K E T S
For
per
sona
l use
onl
y

121. Redbubble analysis of the total market of customers seeking creative expression on lifestyle products (apparel, electronic accessories, homewares and stationery)2. Homewares = furniture and household goods such as kitchen and bathroom accessories, textile furnishings, office supplies and stationarySources: eMarketer, McKinsey and Company, ATKearney, Redbubble analysis
12
10
42
64
0
10
20
30
40
50
60
70
US/UK/Au Europe ROW Total
Mar
ket
Siz
e (
US
$B
)
Estimated addressable market1
Global online market:
Apparel = US$81B
Homewares2 = US$131B
Both of these large online markets expected to
grow at between 10 and 14% per annum through
to 2020
S U S TA I N A B L E G R O W T H N O T S U BJ E C T T O A M A R K E T C E I L I N GE S T I M A T E D A D D R E S S A B L E M A R K E T I N E X C E S S O F U S $ 6 0 B I L L I O N
$22BExisting markets
For
per
sona
l use
onl
y

REDBUBBLE IS CREATING THE WORLD’S
LARGEST MARKETPLACE FOR INDEPENDENT ARTISTS,
BRINGING MORE CREATIVITY
INTO THE WORLD
13
For
per
sona
l use
onl
y

Presented by: Barry Newstead
14
B U I L D I N G A H I G H G R O W T H ,
S U S T A I N A B L E A N D D I V E R S I F I E D
M A R K E T P L A C E
For
per
sona
l use
onl
y

16
A RT I ST C OMMUNI TY
Source: 2016 artists survey
For
per
sona
l use
onl
y

31
44
62
95
154
0
20
40
60
80
100
120
140
160
180
FY12 FY13 FY14 FY15 FY16
Nu
mb
er
of
Art
ists
(,0
00
)
Selling Artists by Fiscal Year
17Source: Redbubble internal dataDeleted artists have been expunged, join date is defined as date of upload of first work
A R T I S T G R O W T H A C O R E D R I V E R O F M A R K E T P L A C E S U C C E S S
Total Artists with Sales
For
per
sona
l use
onl
y

18
Artist Cohort
25% of Sales
27% of Sales
33% of Sales
31% of Sales
35% of Sales
0
20
40
60
80
100
120
140
160
FY12 FY13 FY14 FY15 FY16
# o
f A
rtis
ts (
,00
0)
Selling Artists by Cohort
2008 2009 2010 2011 2012 2013 2014 2015 2016
31K
44K
62K
95K
154K
Source: Redbubble internal data
> 6 0 % O F S A L E S E A C H Y E A R C O M E F R O M A R T I S T S A L R E A D Y O N T H E P L AT F O R M
For
per
sona
l use
onl
y

4% 4% 5%
12% 11% 12%
29% 32% 33%
33% 33% 34%
22% 20% 17%
0%
10%
20%
30%
40%
50%
60%
70%
80%
90%
100%
<$100 $100 -$1200 >$1200
% o
f T
ota
l
Annualised Artists Earnings at RB
Artists by Source Acquisition Channel
Social media
Referrals
Search (e.g. Google)
Blogs
Other
Source: 2016 artists survey- Question Prompt: “How did you first find out about Redbubble?” 19
A R T I S T A C Q U I S I T I O N I S E N T I R E LY F R O M F R E E S O U R C E S
For
per
sona
l use
onl
y

A R T I S T S VA L U E F O R A D I V E R S E R A N G E O F F E AT U R E S
20
62%
34%
28% 28%
21% 21% 20%16%
12%
7%
0%
10%
20%
30%
40%
50%
60%
70%
Range of products
Ability to set my own
price
Uploader functionality
Volume of sales
Look and feel of the
site
Increase my audience
Online portfolio
Additional exposure
The community
Customer service
Main Reason Artists Use Redbubble
% o
f R
esp
on
de
nts
Source: 2016 artists survey- Question Prompt: “What are the main reasons you use Redbubble?”
For
per
sona
l use
onl
y

Presented by: Barry Newstead
21
B U I L D I N G A H I G H G R O W T H ,
S U S T A I N A B L E A N D D I V E R S I F I E D
M A R K E T P L A C E
For
per
sona
l use
onl
y

0.51
0.90
1.47
2.12
3.75
0.21 0.320.48
0.69
1.16
0.0
0.5
1.0
1.5
2.0
2.5
3.0
3.5
4.0
FY12 FY13 FY14 FY15 FY16
#
(Mill
ion
s)
22Source: Redbubble internal dataA Product is a combination of physical product and artist work, a work is simply a single artist image
H U G E C O N T E N T L I B R A R Y & P R O D U C T S M E A N S I S N O T R E L I A N T O N “ H I T S ”7 3 % O F S A L E S C O M E F R O M C O N T E N T T H A T H A S < 5 0 S A L E S ( F Y 2 0 1 6 )
Millions of unique items sold
Millions of unique works sold
Increasing leverage as new products increase diversity
More than200 Billionavailable
More than10 Millionavailable
For
per
sona
l use
onl
y

23
• Redbubble shares objective of third party content owners of not wanting infringing content sold via the marketplace - policies and procedures support this
• A team of 7 content administrators respond to requests in a timely manner
• Continual focus on compliance with regulatory obligations and regularly review/adjust operations in light of regulatory changes
• Given the open nature of the RB marketplace, IP laws are a particular area of focus and Redbubble engages reputable IP-focused outside counsel
• Redbubble provides artists information and communicates regarding content management policies and procedures
• Seeks feedback from artists to understand their challenges, needs for support on IP issues
• Takes action to address repeat IP infringers
• IP laws around the world are evolving and Redbubble is a participant in these policy discussions
• Works with agencies globally on IP policy related issues.
• Participate on the board of the Australian Digital Alliance as an active participant in copyright policy reform
• Redbubble handles virtually all of our communications with third party content owners administratively without need for escalation
C L O S E A T T E N T I O N
T O I P R E G U L A T O R Y
O B L I G A T I O N S
C O L L A B O R A T I O N
W I T H T H I R D P A R T Y
C O N T E N T O W N E R S
A R T I S T
E N G A G E M E N T
P O L I C Y
A D V O C A C Y
R E S U L T S T O D A T E
C O N T E N T M A N A G E M E N T A P P R O A C H S E E K S C O L L A B O R AT I V E R E L AT I O N S T O M I T I G AT E L E G A L R I S K A N D K E E P A N O P E N D O O R F O R F U T U R E P A R T N E R S H I P S
• From all interactions for 9 years, only 5 have led to litigation and insurance is available for these cases (2 cases were reported as part of IPO disclosure, others haven’t warranted reporting)
• Redbubble receives regular feedback from content owners that we have a favorable reputation for our amicable approach (some have sent us gifts)F
or p
erso
nal u
se o
nly

54%
37%
39%
39%
43%
$0
$20
$40
$60
$80
$100
$120
$140
FY12 FY13 FY14 FY15 FY16
Pro
du
ct
Re
ven
ue
($
AU
D M
illio
ns)
Product Revenue by Work Vintage
2008 2009 2010 2011 2012 2013 2014 2015 2016
24
Work Upload Year
Source: Redbubble internal dataProduct Revenue does not include any shipping revenue
~ 6 0 % O F S A L E S I N A N Y Y E A R C O M E F R O M C O N T E N T A L R E A D Y O N T H E P L AT F O R M
57% of works that sold in 2016 were already on the platform at the start of the year
For
per
sona
l use
onl
y

C O N T E N T P E R S I S T S A N D S E L L S O V E R L O N G P E R I O D S O F T I M E
25
Our Secret Harbor
by Aimee Stewart, USAUpload June 2009 Last sold: 3 Aug
Perhaps the Dreams are of Soulmates
by Cameron Gray, AUUpload: July 2010 Last sold: 28 Nov
The Fox and the Forest
by Nic Squirrell, UKUpload: Feb 2010 Last sold: 24 Oct
Caffeine Powers…Activate!
by Nathan Davis, AUUpload Feb 2012 Last sold 28 Nov
Stress Less
by cabinsupplyco, NZUpload Sep 2016 Last sold 28 Nov
Skulls are for Pussies
by harebrained, USAUpload: Feb 2012 Last sold: 28 NovF
or p
erso
nal u
se o
nly

26
For
per
sona
l use
onl
y

Presented by: Nick Kenn
27
B U I L D I N G A H I G H G R O W T H ,
S U S T A I N A B L E A N D D I V E R S I F I E D
M A R K E T P L A C E
For
per
sona
l use
onl
y

$0
$20
$40
$60
$80
$100
$120
$140
$160
FY12 FY13 FY14 FY15 FY16
$A
UD
Mill
ion
s
Gross Transaction Value
Repeat GTV
First Time GTV
29Source: Redbubble internal data
LA R G E A ND G R OWI NG C USTOME R BASES T R E N G T H W I T H N E W & R E P E A T C U S T O M E R S
Growth RateFY2012-FY2016
89% CAGR(over 5 years)
66% CAGR(Over 5 years)
For
per
sona
l use
onl
y

30
C U S T O M E R B A S E I S D I V E R S E W I T H A C L E A R VA L U E P R O P O S I T I O N :
Source: customer surveys
For
per
sona
l use
onl
y

31
0%
10%
20%
30%
40%
50%
60%
70%
80%
90%
100%
FY13 FY14 FY15 FY16 Q1 FY17
Product Sales Distribution Over Time
Wall Art
Homewares
Accessories/Other
Garments
I N C R E A S I N G LY D I V E R S I F I E D P R O D U C T M I X S U P P O R T S S U S TA I N A B L E G R O W T H
$34M $88M$59M $143MTotal GTV: $36M*
* Q1 results only, not full fiscal year
For
per
sona
l use
onl
y

59 59 59
62
64
6768 68
50
55
60
65
70
75
Q2 FY15 Q3 FY15 Q4 FY15 Q1 FY16 Q2 FY16 Q3 FY16 Q4 FY16 Q1 FY17
NP
S S
co
re
32Source: Redbubble internal data
C USTOME R SAT I SFACT I ON I S I NC R EASI NG
Localizationof AU / UK / EU stickers
Sales Weighted NPS for Top 10 Countries
Localization of EU/UK Tees
For
per
sona
l use
onl
y

-
5
10
15
20
25
Q3 FY15 Q4 FY15 Q1 FY16 Q2 FY16 Q3 FY16 Q4 FY16
Mill
ion
s o
f V
isit
s
Visits by Device
Desktop Mobile
33Source: Redbubble internal data
S T R O N G G R O W T H F R O M M O B I L E V I S I T SS H O W S S U C C E S S F U L T R A N S I T I O N T O M O B I L E - F I R S T W O R L D
For
per
sona
l use
onl
y

34
Paid3
(31.5%)Other Free
(9.2%)Email(6.3%)
Direct2
(14.0%)Organic Search1
(39.0%)
Sales by source (FY16)
1. Organic Search = traffic to the site originating from search click through that we do not pay for 2. Direct = Traffic from people coming directly to the RB homepage 3. Paid = Traffic to the site from sources we pay for (Google ads, Facebook ads etc.)Source: Redbubble internal data
G R O W S S T R O N G LY W I T H L O W C U S T O M E R A C Q U I S I T I O N C O S T S
O R G A N I C G R O W T H F U E L S S A L E S
W I T H A L L C H A N N E L S P R O F I T A B L E O N F I R S T P U R C H A S E
3 1 . 5 % - Paid 6 8 . 5 % - Free
For
per
sona
l use
onl
y

35
$0.00
$0.05
$0.10
$0.15
$0.20
$0.25
$0.30
$0.35
$0.40
$0.45
$0.50
Q3 FY15 Q4 FY15 Q1 FY16 Q2 FY16 Q3 FY16 Q4 FY16
Profit per Visitor
Paid Unpaid
Source: Redbubble internal data (since reliable records available)
Paid spend effectiveness
being driven by data
driven marketing
yielding:
• Efficient targeting
• Improved relevance
U N PA I D PA I D C H A N N E L S D E L I V E R I N GE Q U I VA L E N T V I S I T O R P R O F I TA B I L I T Y
For
per
sona
l use
onl
y

Presented by: Rob Baumert
36
B U I L D I N G A H I G H G R O W T H ,
S U S T A I N A B L E A N D D I V E R S I F I E D
M A R K E T P L A C E
For
per
sona
l use
onl
y
37
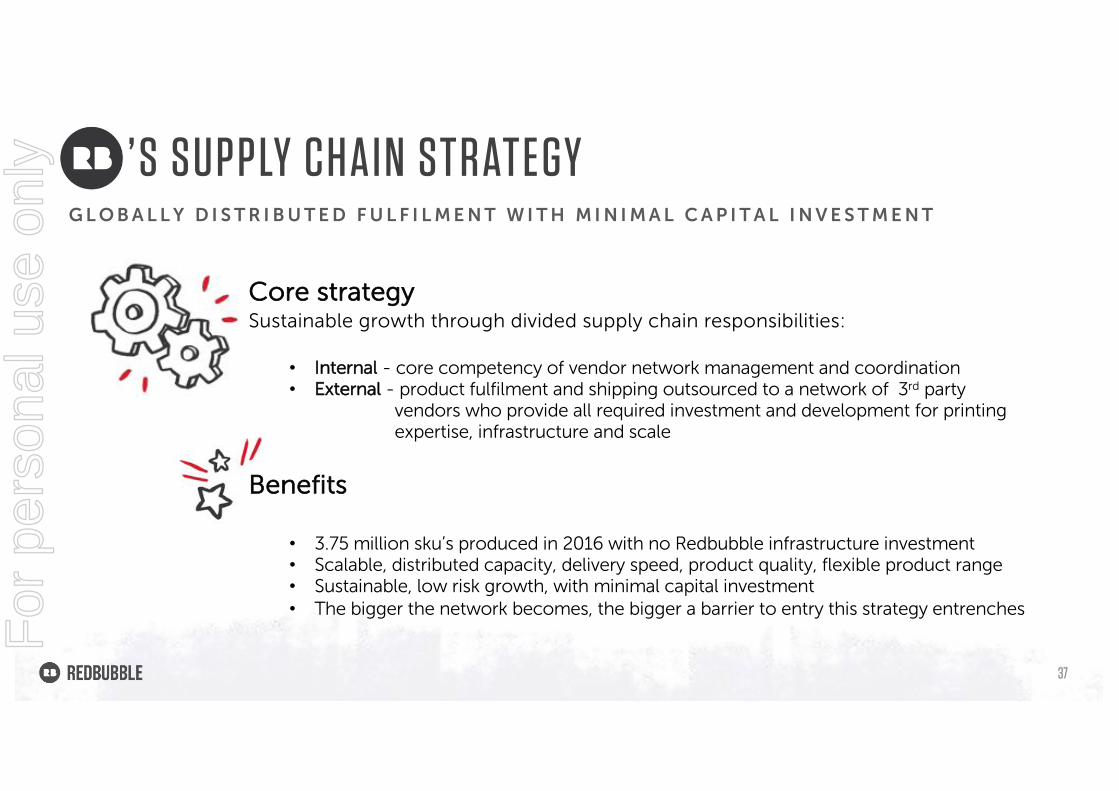
Core strategySustainable growth through divided supply chain responsibilities:
• Internal - core competency of vendor network management and coordination• External - product fulfilment and shipping outsourced to a network of 3rd party
vendors who provide all required investment and development for printing expertise, infrastructure and scale
Benefits
• 3.75 million sku’s produced in 2016 with no Redbubble infrastructure investment• Scalable, distributed capacity, delivery speed, product quality, flexible product range• Sustainable, low risk growth, with minimal capital investment• The bigger the network becomes, the bigger a barrier to entry this strategy entrenches
’ S SUPPLY CHAI N STRATE GYG L O B A L L Y D I S T R I B U T E D F U L F I L M E N T W I T H M I N I M A L C A P I T A L I N V E S T M E N T
For
per
sona
l use
onl
y

3 35 5 5
7 79
1113
15
7
12 12
19 19
2527
35
48
5761
0
10
20
30
40
50
60
70
Number of Fulfillers and Products
Fulfillers Products
38
T H E G L O B A L S U P P LY C H A I N H A S G R O W NA N D D I V E R S I F I E D R A P I D LY O V E R T I M E
In 23 facilities
Jun 2007 Jun 2008 Jun 2009 Jun 2010 Jun 2011 Jun 2012 Jun 2013 Jun 2014 Jun 2015 Nov 16Jun 2016
Defensible supplier position
Scalable platform nimble product extension
Extremely capital efficient
Source: Redbubble internal data
For
per
sona
l use
onl
y

39
F U L F I L L E R E X PA N S I O N O V E R T I M E
June 2012
F U L F I L L E R S
7
25P R O D U C T S
Source: Redbubble internal data
For
per
sona
l use
onl
y

43
F U L F I L L E R E X PA N S I O N O V E R T I M E
NOV 2016
F U L F I L L E R S
15
61P R O D U C T S
Source: Redbubble internal data
For
per
sona
l use
onl
y

44Source: Redbubble internal data
Localisation of production has R E D U C E D G L O B A L A V E R A G E D E L I V E R Y T I M E by a full day in the last 12 months.
Localisation of garment printing in the US means <2 day delivery for 80% of the country.
L O C A L I Z AT I O N D E L I V E R S S P E E D ,S P E E D D E L I V E R S C U S T O M E R S AT I S FA C T I O N
Transit days
1 day
2 days
3 days
Localising garment printing in Australiacut shipping time F R O M 9 D A Y S T O 3 D A Y S and delivered a 2 0 P O I N T N P S I M P R O V E M E N T .
Localisation also yields I M P R O V E D M A R G I N S via the reduction in shipping charges.
For
per
sona
l use
onl
y

Presented by: Vicki Stirling
46
B U I L D I N G A H I G H G R O W T H ,
S U S T A I N A B L E A N D D I V E R S I F I E D
M A R K E T P L A C E
For
per
sona
l use
onl
y

47
Meet the needs
Keep it simple
Make it unique
For
per
sona
l use
onl
y

48
Respecting the art
Quality and style
Commercial products
For
per
sona
l use
onl
y

49
Commercially Viable
Long lifecycle
Shared vision
For
per
sona
l use
onl
y

50
For
per
sona
l use
onl
y

51
For
per
sona
l use
onl
y

Presented by: Chris Nunn
52
B U I L D I N G A H I G H G R O W T H ,
S U S T A I N A B L E A N D D I V E R S I F I E D
M A R K E T P L A C E
For
per
sona
l use
onl
y

60
E Q U I V A L E N T T O 3 W E E K S O F S A L E S I N H A N D A T A N Y O N E T I M E
Inflows
Days
Outflows
$100GTV
0 1 - 2
- $3.60PAYMENT
PLATFORM
$96.40
1 - 3
PRODUCT SHIPPED &
REVENUE EARNED1
7
- $14.90ARTIST
30
- $49.60FULFILLERS
85 - 90
- $4.50TAX
CASH GENERATED
BEFORE
OPERATING EXPENSES
OPE R AT E S WI T H A POSI T I VE CASH CYC L E
$27.40
1. Revenue earned is GTV less artist margin and tax (i.e.. $80.60 on $100 GTV)
Source: Redbubble internal data (per FY2016 results)
For
per
sona
l use
onl
y

61
o Initial growth using negative working capital - minimal external capital
o Capital constrained in FY2014 delivered profitability but….
o New capital raised in FY2015 and FY2016 to drive accelerated growth and…..
o Growth in FY2017 and beyond on capital raised in FY2015 and FY2016 but….
o …particularly on internally generated cash flows
C A P I TA L R A I S E D I N F Y 2 0 1 5 & F Y 2 0 1 6 A N D I N T E R N A L LYG E N E R AT E D C A S H D R I V I N G G R O W T H I N F Y 2 0 1 7 A N D B E Y O N D
-$0.2 -$0.5 -$0.9
$6.3
$13.5
$0.8
-10.0
0.0
10.0
20.0
30.0
40.0
50.0
60.0
FY12 FY13 FY14 FY15 FY16 Forecast FY17
AU
D
$M
Capital utilised (i.e. net cash outflow) Gross Profit
Source: Redbubble internal data
For
per
sona
l use
onl
y

Spend to deliver FY16 Gross Profit (64%)
$39.0 $26.5
$7.7
$4.8
$6.1
Gross Profit Operating expenses Paid marketing Underlying Profit Expended Growth investment
Capitalised Growth investment
AUD $M
62
Spend to generate future growth
(36%)
Source: Redbubble internal data
C A S H S P E N D I N F Y 2 0 1 6 I N V E S T E D F O R T H E F U T U R EB U T A L S O D E L I V E R E D U N D E R LY I N G P R O F I T
Total FY2016Cash spend
$53.4M$13.1
O P E R A T I N G L E V E R A G E T O C O N T I N U E I N F Y 2 0 1 7 A N D B E Y O N D
For
per
sona
l use
onl
y

63Source: Redbubble IPO prospectus and internal data
o Early months show small EBITDA losses
o Strong cash inflows through Thanksgiving and Christmas followed by outflows in Jan/Feb to artists, suppliers, tax, etc.
o Forecasting close to cash flow neutral for FY2017 moving into positive in FY2018
o No debt
S T R O N G F O R E C A S T C A S H B A L A N C E W I T H S E A S O N A L VA R I A B I L I T Y
10.0
15.0
20.0
25.0
30.0
35.0
40.0
45.0
50.0
55.0
60.0
Closing FY16
Jul-16 Aug-16 Sep-16 Oct-16 Nov-16 Dec-16 Jan-17 Feb-17 Mar-17 Apr-17 May-17 Jun-17
AU
D $
M
IPO Forecast Cash Balance (month end)
For
per
sona
l use
onl
y

64
D I V E R S I F I C AT I O N O F C U R R E N C Y E X P O S U R E P R O V I D E S S I G N I F I C A N T N AT U R A L H E D G E
o Biggest impact on Revenue from USD volatility but hedged by cost incurred in USD
o Revenue and cost imbalance in GBP, EUR and CAD
o Recently localised production in Europe (Netherlands) and Canada to increase natural hedge at Gross Profit level
o Operating expenses in US, UK and Europe provide further hedge at the EBITDA level0.0
5.0
10.0
15.0
20.0
25.0
Revenue Costs Revenue Costs Revenue Costs Revenue Costs Rev Costs
USD GBP AUD EUR CAD
AU
D $
M
FY2017 YTD Distribution of Revenue & Costs by currency
Revenue COGS Opex
Share of Total 67.9%
Share of Total
67.8 %
11.9%
7.2% 6.7%
19.2%
9.4%5.7%
4.2%0.1%
Source: Redbubble internal data
For
per
sona
l use
onl
y

65
o USA – Comprising largely Marketing, Customer Service, Legal and Content teams
o Australia – Comprising largely Web Development & Product, Physical Product,Executive, Finance and People and Culture teams
1 9 8 E M P L O Y E E S , ~ 5 0 % O N G R O W T H
Executive, P&C and Other, 14%
Web Development,
Physical Product and
New Markets, 49%
Marketing, 9%Customer
Experience, 10%
Supply Chain & Logistics, 5%
Finance and Legal &
Content, 13%
Working at…..
USA, 32%Australia, 61%
UK/Europe, 7%
Working in…..
Source: Redbubble internal data
For
per
sona
l use
onl
y

Presented by:
Martin Hosking & Barry Newstead
66
B U I L D I N G A H I G H G R O W T H ,
S U S T A I N A B L E A N D D I V E R S I F I E D
M A R K E T P L A C E
For
per
sona
l use
onl
y

67
D E E P E N R E L A T I O N S H I P S with our customers
Leverage
M O B I L E S T R E N G T Hto enrich experiences
LaunchN E W P R O D U C T S
and extendR E A C H I N N E W
M A R K E T S
EfficientG L O B A L
A C Q U I S I T I O Nof new customers & artists
ExpandC O N T E N T P A R T N E R S H I P Swith creators
T H E ME S F OR 2 01 7S T A Y F O C U S E D O N S T R E N G T H E N I N G M A R K E T P L A C E D Y N A M I C S
For
per
sona
l use
onl
y

68
For
per
sona
l use
onl
y

77
Diverse and enduring content/artists:
• 73% (FY2016) of sales from works that sold 50 times or less
• 3.75 SKUs sold in 2016• 56% of sales from works that are >6
months old
Leading global marketplace:
• 93% of sales outside Australia• Customers in 208 countries• Artists in 238 countries• 15 fulfillers in 24 locations
Capital efficient from outsourcing:
• Manufacturing outsourced• Negative working capital• Low customer and artist
acquisition costs• Strong balance sheet
POS I TI ONE D FOR LONG-TE RM GROWTH…
SUSTAINABLE LOW RISK FINANCIALLY STRONG
For
per
sona
l use
onl
y

78
For
per
sona
l use
onl
y

79
For
per
sona
l use
onl
y

The material herein is a presentation of non-specific background information about the Company’s current activities. It is information given in summary form and does not purport to be complete. Investors or potential investors should seek their own independent advice. This material is not intended to be relied upon as advice to investors or potential investors and does not take into account the investment objectives, financial situation or needs of a particular investor. These should be considered when deciding if a particular investment is appropriate.
80
D I SCLAI ME R
For
per
sona
l use
onl
y