for multiphase fl ow metering with accurate void fraction ...
11
NUKLEONIKA 2019;64(1):1929 doi: 10.2478/nuka-2019-0003 ORIGINAL PAPER Introduction A multiphase flow meter is a single standing device or a combination of various tools, which quanti- fies the volumetric flow rates of water, oil, and gas phases separately in a multiphase fluid stream. In a multiphase fluid pipeline, the pattern of flow is unknown; practically, we must deal with an indis- tinctive pattern of a three-phase flow with varying volumetric fractions of the phases [1, 2]. Measuring the multiphase flow by means of phase separation is not always feasible [3]. Gamma densitometry is a helpful method in this context; however, as the fluid flow regime becomes intermittent or annular, the measurement accuracy falls considerably. Tra- Design and simulation of a multienergy gamma ray absorptiometry system for multiphase flow metering with accurate void fraction and water-liquid ratio approximation Omid Khayat, Hossein Afarideh O. Khayat, H. Afarideh Department of Energy Engineering and Physics Amirkabir University of Technology 424 Hafez Ave., 15875-4413, Tehran, Iran E-mail: [email protected] Received: 6 June 2018 Accepted: 14 December 2018 Abstract. Multiphase flow meters are used to measure the water-liquid ratio (WLR) and void fraction in a mul- tiphase fluid stream pipeline. In the present study, a system of multiphase flow measurement has been designed by application of three thallium-doped sodium iodide scintillators and a radioactive source of 133 Ba simulated by Monte Carlo N-particle (MCNP) transport code. In order to capture radiations passing across the pipe, two direct detectors have been installed on opposite sides of the radioactive source. Another detector has been placed perpendicular to the transmission beam emitted from the 133 Ba source to receive radiations scattered from the fluid flow. Simulation was done by the MCNP code for different volumetric fractions of water, oil, and gas phases for two types of flow regimes, namely, homogeneous and annular; training and validation data have been provided for the artificial neural network (ANN) to develop a computation model for pattern recognition. Depending on applications of the neural system, several structures of ANNs are used in the current paper to model the flow measurement relations, while the detector outputs are considered as the input parameters of the neural networks. The first, second, and third structures benefit from two, three, and five multilayer perceptron neural networks, respectively. Increasing the number of ANNs makes the system more complicated and decreases the available data; however, it increases the accuracy of estimation of WLR and gas void fraction. According to the results, the maximum relative difference was observed in the scattering detector. It was clear that transmission detectors would demonstrate the difference between the flow regimes as well. It is necessary to note that the error calculated by the MCNP simulator is <0.5% for the direct detectors (TR1 and TR2). Due to the difference between the data of the two flow regimes and the errors of data in the simulation codes of the MCNP, it was possible to separate these flow regimes. The effect of changing WLR on the efficiency for a constant void fraction confirms a considerable variance in the results of annular and homogeneous flows occurring in the scattering detector. There is a similar trend for the void fraction; hence, one can easily distinguish changes in efficiency due to the WLR. Analysis of the simulation results revealed that in the proposed structure of the multiphase flow meter and the computation model used for simulation, the two flow regimes are simply distinguishable. Keywords: multiphase flow measurement • void fraction • water-liquid ratio • flow regime • MCNP • artificial neural network © 2019 O. Khayat & H. Afarideh. This is an open access article distributed under the Creative Com- mons Attribution-NonCommercial-NoDerivatives 3.0 License (CC BY-NC-ND 3.0).
Transcript of for multiphase fl ow metering with accurate void fraction ...
NUKLEONIKA 2019;64(1):1929doi: 10.2478/nuka-2019-0003 ORIGINAL PAPER
Introduction
A multiphase fl ow meter is a single standing device or a combination of various tools, which quanti-fi es the volumetric fl ow rates of water, oil, and gas phases separately in a multiphase fl uid stream. In a multiphase fl uid pipeline, the pattern of fl ow is unknown; practically, we must deal with an indis-tinctive pattern of a three-phase fl ow with varying volumetric fractions of the phases [1, 2]. Measuring the multiphase fl ow by means of phase separation is not always feasible [3]. Gamma densitometry is a helpful method in this context; however, as the fl uid fl ow regime becomes intermittent or annular, the measurement accuracy falls considerably. Tra-
Design and simulation of a multienergy gamma ray absorptiometry system for multiphase fl ow metering with accurate void fraction and water-liquid ratio approximation
Omid Khayat, Hossein Afarideh
O. Khayat, H. Afarideh Department of Energy Engineering and Physics Amirkabir University of Technology 424 Hafez Ave., 15875-4413, Tehran, Iran E-mail: [email protected]
Received: 6 June 2018 Accepted: 14 December 2018
Abstract. Multiphase fl ow meters are used to measure the water-liquid ratio (WLR) and void fraction in a mul-tiphase fl uid stream pipeline. In the present study, a system of multiphase fl ow measurement has been designed by application of three thallium-doped sodium iodide scintillators and a radioactive source of 133Ba simulated by Monte Carlo N-particle (MCNP) transport code. In order to capture radiations passing across the pipe, two direct detectors have been installed on opposite sides of the radioactive source. Another detector has been placed perpendicular to the transmission beam emitted from the 133Ba source to receive radiations scattered from the fl uid fl ow. Simulation was done by the MCNP code for different volumetric fractions of water, oil, and gas phases for two types of fl ow regimes, namely, homogeneous and annular; training and validation data have been provided for the artifi cial neural network (ANN) to develop a computation model for pattern recognition. Depending on applications of the neural system, several structures of ANNs are used in the current paper to model the fl ow measurement relations, while the detector outputs are considered as the input parameters of the neural networks. The fi rst, second, and third structures benefi t from two, three, and fi ve multilayer perceptron neural networks, respectively. Increasing the number of ANNs makes the system more complicated and decreases the available data; however, it increases the accuracy of estimation of WLR and gas void fraction. According to the results, the maximum relative difference was observed in the scattering detector. It was clear that transmission detectors would demonstrate the difference between the fl ow regimes as well. It is necessary to note that the error calculated by the MCNP simulator is <0.5% for the direct detectors (TR1 and TR2). Due to the difference between the data of the two fl ow regimes and the errors of data in the simulation codes of the MCNP, it was possible to separate these fl ow regimes. The effect of changing WLR on the effi ciency for a constant void fraction confi rms a considerable variance in the results of annular and homogeneous fl ows occurring in the scattering detector. There is a similar trend for the void fraction; hence, one can easily distinguish changes in effi ciency due to the WLR. Analysis of the simulation results revealed that in the proposed structure of the multiphase fl ow meter and the computation model used for simulation, the two fl ow regimes are simply distinguishable.
Keywords: multiphase fl ow measurement • void fraction • water-liquid ratio • fl ow regime • MCNP • artifi cial neural network
© 2019 O. Khayat & H. Afarideh. This is an open access article distributed under the Creative Com-mons Attribution-NonCommercial-NoDerivatives 3.0 License (CC BY-NC-ND 3.0).
20 O. Khayat, H. Afarideh
ditional gamma densitometry includes inserting a detector opposite a high-energy source (cesium) to measure the volumetric fractions. Furthermore, it is necessary to use double- or multiple-energy sources, which requires sensitive detectors. Another method described involves installing multiple detec-tors opposite the source so that volumetric fractions of the phases and the fl ow regime are evaluated by measuring the attenuation rates at each individual detector. This is done by placing a collimator oppo-site the source and the detectors so that they only capture the attenuated energies, not the dispersed ones. The main phenomena occurring during gamma attenuation are the photoelectric and Compton ef-fects. The Compton effect is a function of the fl uid density, and the photoelectric phenomenon, which is dominant at lower energy levels, strongly depends on the atomic number of the material, so that gamma ray attenuation is exponentially proportional to four or fi ve times the atomic number of the material; hence, as water salinity increases, chlorine – with its high atomic number – intensifi es the attenuation rate and leads to signifi cant errors in estimations.
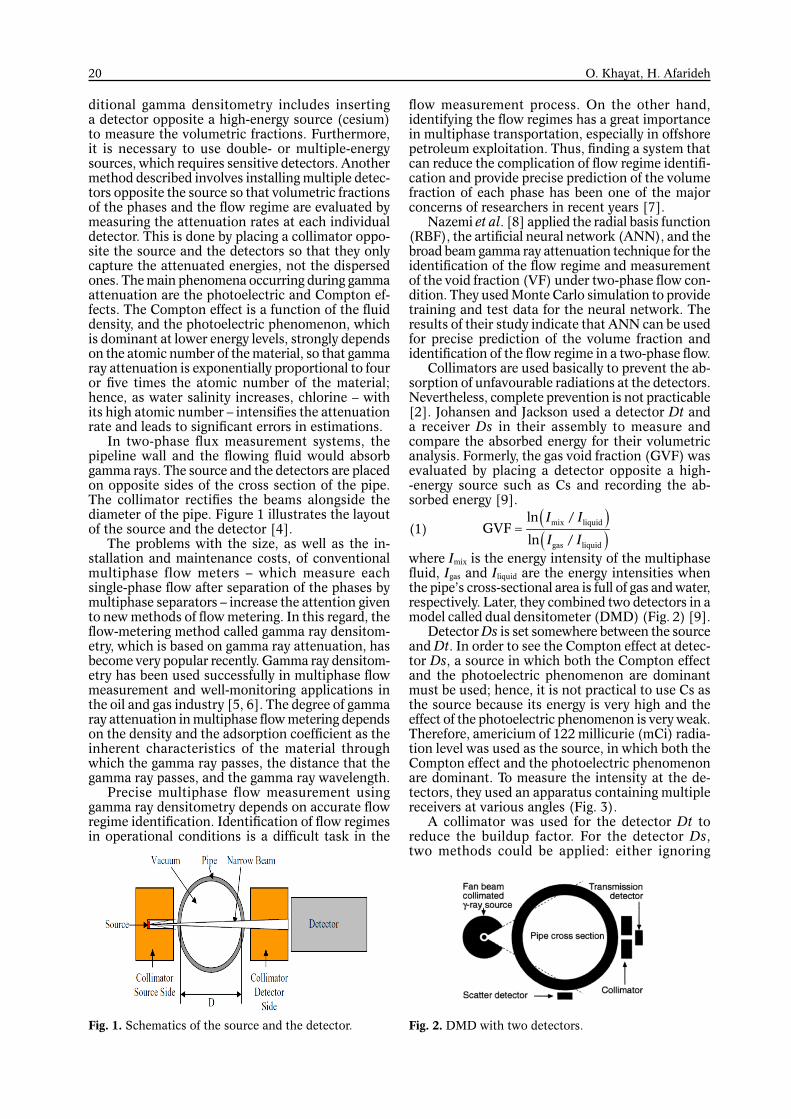
In two-phase fl ux measurement systems, the pipeline wall and the fl owing fl uid would absorb gamma rays. The source and the detectors are placed on opposite sides of the cross section of the pipe. The collimator rectifi es the beams alongside the diameter of the pipe. Figure 1 illustrates the layout of the source and the detector [4].
The problems with the size, as well as the in-stallation and maintenance costs, of conventional multiphase flow meters – which measure each single-phase fl ow after separation of the phases by multiphase separators – increase the attention given to new methods of fl ow metering. In this regard, the fl ow-metering method called gamma ray densitom-etry, which is based on gamma ray attenuation, has become very popular recently. Gamma ray densitom-etry has been used successfully in multiphase fl ow measurement and well-monitoring applications in the oil and gas industry [5, 6]. The degree of gamma ray attenuation in multiphase fl ow metering depends on the density and the adsorption coeffi cient as the inherent characteristics of the material through which the gamma ray passes, the distance that the gamma ray passes, and the gamma ray wavelength.
Precise multiphase flow measurement using gamma ray densitometry depends on accurate fl ow regime identifi cation. Identifi cation of fl ow regimes in operational conditions is a diffi cult task in the
fl ow measurement process. On the other hand, identifying the fl ow regimes has a great importance in multiphase transportation, especially in offshore petroleum exploitation. Thus, fi nding a system that can reduce the complication of fl ow regime identifi -cation and provide precise prediction of the volume fraction of each phase has been one of the major concerns of researchers in recent years [7].
Nazemi et al. [8] applied the radial basis function (RBF), the artifi cial neural network (ANN), and the broad beam gamma ray attenuation technique for the identifi cation of the fl ow regime and measurement of the void fraction (VF) under two-phase fl ow con-dition. They used Monte Carlo simulation to provide training and test data for the neural network. The results of their study indicate that ANN can be used for precise prediction of the volume fraction and identifi cation of the fl ow regime in a two-phase fl ow.
Collimators are used basically to prevent the ab-sorption of unfavourable radiations at the detectors. Nevertheless, complete prevention is not practicable [2]. Johansen and Jackson used a detector Dt and a receiver Ds in their assembly to measure and compare the absorbed energy for their volumetric analysis. Formerly, the gas void fraction (GVF) was evaluated by placing a detector opposite a high--energy source such as Cs and recording the ab-sorbed energy [9].
(1)
where Imix is the energy intensity of the multiphase fl uid, Igas and Iliquid are the energy intensities when the pipe’s cross-sectional area is full of gas and water, respectively. Later, they combined two detectors in a model called dual densitometer (DMD) (Fig. 2) [9].
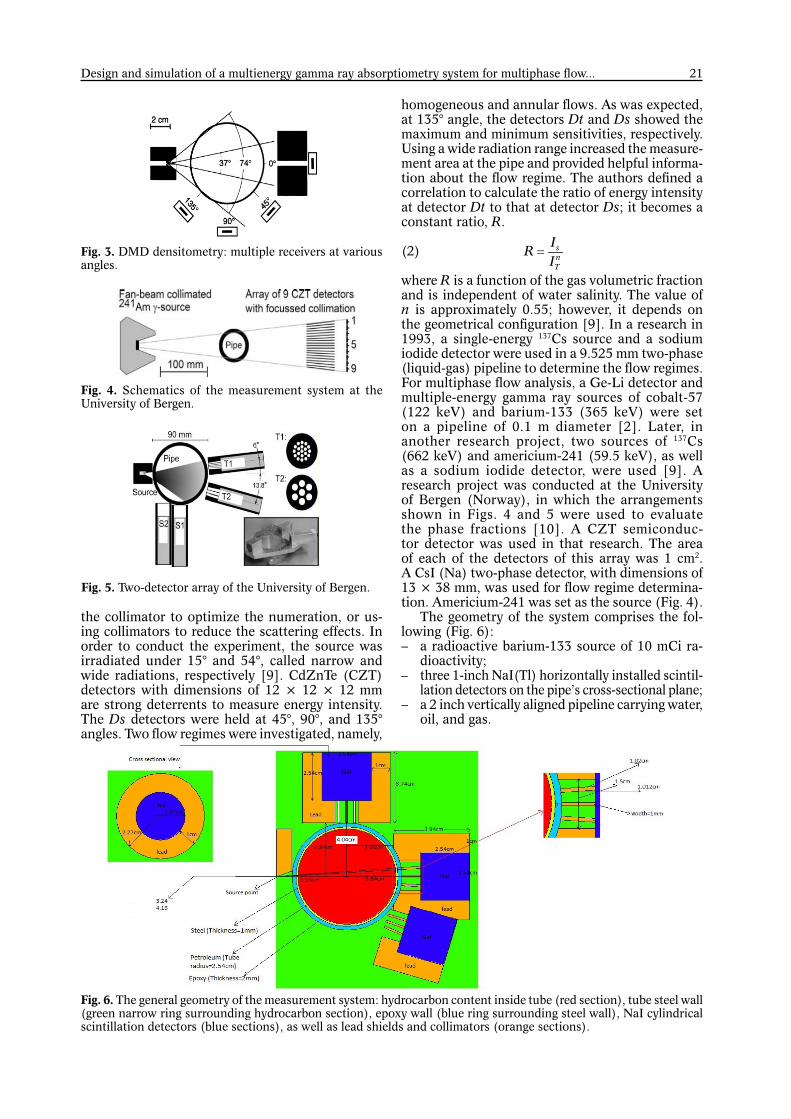
Detector Ds is set somewhere between the source and Dt. In order to see the Compton effect at detec-tor Ds, a source in which both the Compton effect and the photoelectric phenomenon are dominant must be used; hence, it is not practical to use Cs as the source because its energy is very high and the effect of the photoelectric phenomenon is very weak. Therefore, americium of 122 millicurie (mCi) radia-tion level was used as the source, in which both the Compton effect and the photoelectric phenomenon are dominant. To measure the intensity at the de-tectors, they used an apparatus containing multiple receivers at various angles (Fig. 3).
A collimator was used for the detector Dt to reduce the buildup factor. For the detector Ds, two methods could be applied: either ignoring
Fig. 1. Schematics of the source and the detector. Fig. 2. DMD with two detectors.
mix liquid
gas liquid
ln /GVF
ln /
I I
I I
21Design and simulation of a multienergy gamma ray absorptiometry system for multiphase fl ow...
the collimator to optimize the numeration, or us-ing collimators to reduce the scattering effects. In order to conduct the experiment, the source was irradiated under 15° and 54°, called narrow and wide radiations, respectively [9]. CdZnTe (CZT) detectors with dimensions of 12 × 12 × 12 mm are strong deterrents to measure energy intensity. The Ds detectors were held at 45°, 90°, and 135° angles. Two fl ow regimes were investigated, namely,
homogeneous and annular fl ows. As was expected, at 135° angle, the detectors Dt and Ds showed the maximum and minimum sensitivities, respectively. Using a wide radiation range increased the measure-ment area at the pipe and provided helpful informa-tion about the fl ow regime. The authors defi ned a correlation to calculate the ratio of energy intensity at detector Dt to that at detector Ds; it becomes a constant ratio, R.
(2)
where R is a function of the gas volumetric fraction and is independent of water salinity. The value of n is approximately 0.55; however, it depends on the geometrical confi guration [9]. In a research in 1993, a single-energy 137Cs source and a sodium iodide detector were used in a 9.525 mm two-phase (liquid-gas) pipeline to determine the fl ow regimes. For multiphase fl ow analysis, a Ge-Li detector and multiple-energy gamma ray sources of cobalt-57 (122 keV) and barium-133 (365 keV) were set on a pipeline of 0.1 m diameter [2]. Later, in another research project, two sources of 137Cs
(662 keV) and americium-241 (59.5 keV), as well as a sodium iodide detector, were used [9]. A research project was conducted at the University of Bergen (Norway), in which the arrangements shown in Figs. 4 and 5 were used to evaluate the phase fractions [10]. A CZT semiconduc-tor detector was used in that research. The area of each of the detectors of this array was 1 cm2. A CsI (Na) two-phase detector, with dimensions of 13 × 38 mm, was used for fl ow regime determina-tion. Americium-241 was set as the source (Fig. 4).
The geometry of the system comprises the fol-lowing (Fig. 6): – a radioactive barium-133 source of 10 mCi ra-
dioactivity; – three 1-inch NaI(Tl) horizontally installed scintil-
lation detectors on the pipe’s cross-sectional plane; – a 2 inch vertically aligned pipeline carrying water,
oil, and gas.
snT
IR
IFig. 3. DMD densitometry: multiple receivers at various
angles.
Fig. 4. Schematics of the measurement system at the University of Bergen.
Fig. 6. The general geometry of the measurement system: hydrocarbon content inside tube (red section), tube steel wall (green narrow ring surrounding hydrocarbon section), epoxy wall (blue ring surrounding steel wall), NaI cylindrical scintillation detectors (blue sections), as well as lead shields and collimators (orange sections).
Fig. 5. Two-detector array of the University of Bergen.
22 O. Khayat, H. Afarideh
Materials and methods
Conventional fl ow patterns
In the present project, two conventional fl ow pat-terns, namely, homogeneous and annular fl ows, were simulated. Densities of water, oil, and gas were assumed to be 1.1, 0.85, and 0.05 g/cm3. The gas phase was CH4, and water was pure H2O. The constitutive elements of the oil phase were hydrogen, carbon, oxygen, nitrogen, and sulphur. – Homogeneous pattern: the three phases (water,
oil, and gas) were mixed homogeneously. – Annular pattern: the gas was assumed to be the
carrier phase passing axially through the middle of the pipeline. Oil and water formed a homoge-neous thin fi lm around the perimeter of the pipe, surrounding the gas phase.
Estimation of fl ow type and the WLR fraction using ANNs
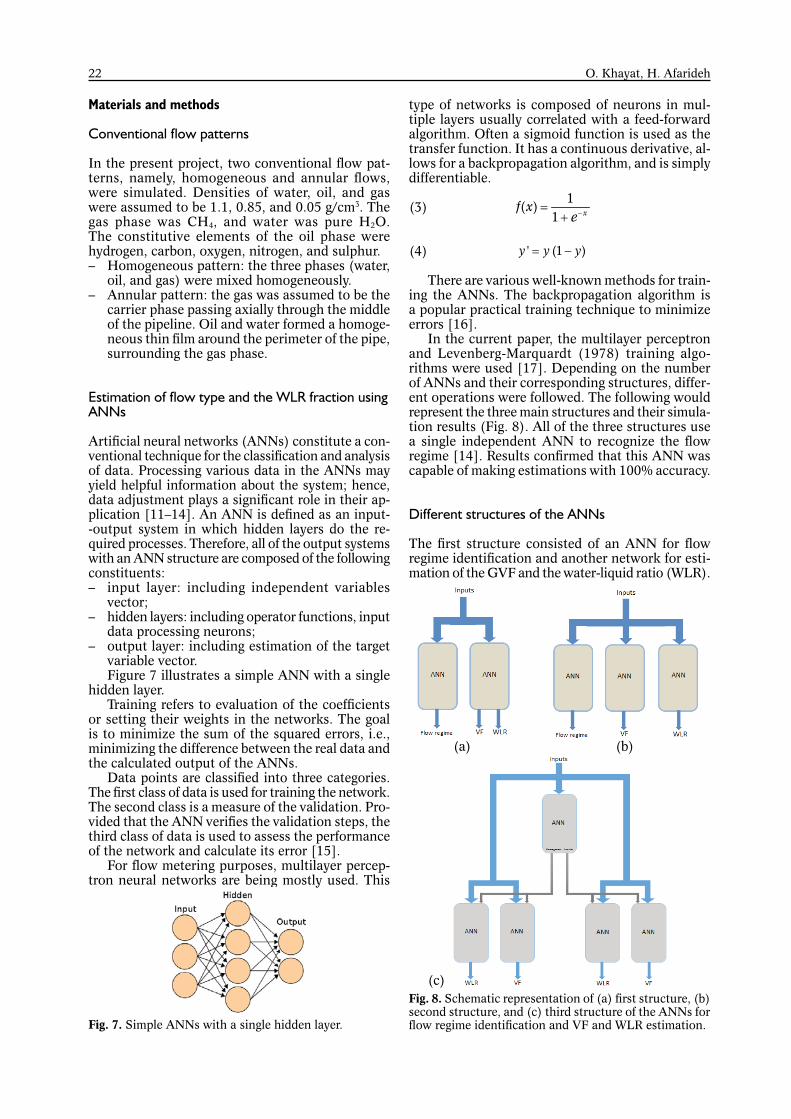
Artifi cial neural networks (ANNs) constitute a con-ventional technique for the classifi cation and analysis of data. Processing various data in the ANNs may yield helpful information about the system; hence, data adjustment plays a signifi cant role in their ap-plication [11–14]. An ANN is defi ned as an input--output system in which hidden layers do the re-quired processes. Therefore, all of the output systems with an ANN structure are composed of the following constituents: – input layer: including independent variables
vector; – hidden layers: including operator functions, input
data processing neurons; – output layer: including estimation of the target
variable vector. Figure 7 illustrates a simple ANN with a single
hidden layer. Training refers to evaluation of the coeffi cients
or setting their weights in the networks. The goal is to minimize the sum of the squared errors, i.e., minimizing the difference between the real data and the calculated output of the ANNs.
Data p oints are classifi ed into three categories. The fi rst class of data is used for training the network. The second class is a measure of the validation. Pro-vided that the ANN verifi es the validation steps, the third class of data is used to assess the performance of the network and calculate its error [15].
For fl ow metering purposes, multilayer percep-tron neural networks are being mostly used. This
type of networks is composed of neurons in mul-tiple layers usually correlated with a feed-forward algorithm. Often a sigmoid function is used as the transfer function. It has a continuous derivative, al-lows for a backpropagation algorithm, and is simply differentiable.
(3)
(4)
There are various well-known methods for train-ing the ANNs. The backpropagation algorithm is a popular practical training technique to minimize errors [16].
In the current paper, the multilayer perceptron and Levenberg-Marquardt (1978) training algo-rithms were used [17]. Depending on the number of ANNs and their corresponding structures, differ-ent operations were followed. The following would represent the three main structures and their simula-tion results (Fig. 8). All of the three structures use a single independent ANN to recognize the fl ow regime [14]. Results confi rmed that this ANN was capable of making estimations with 100% accuracy.
Different structures of the ANNs
The fi rst structure consisted of an ANN for fl ow regime identifi cation and another network for esti-mation of the GVF and the water-liquid ratio (WLR).
g
Fig. 7. Simple ANNs with a single hidden layer.
1( )1 xf x
e
' (1 )y y y
Fig. 8. Schematic representation of (a) fi rst structure, (b) second structure, and (c) third structure of the ANNs for fl ow regime identifi cation and VF and WLR estimation.
(a) (b)
(c)
23Design and simulation of a multienergy gamma ray absorptiometry system for multiphase fl ow...
The second structure was made up of an ANN for determination of the fl ow regime, a network for estimation of the GVF, and another one for evalu-ation of WLR.
The third structure consisted of five ANNs. One for fl ow regime recognition; then, for each of the fl ow regimes, there were two ANNs for evalua-tion of the VF and WLR, respectively.
There were 209 data points generated by the Monte Carlo N-particle (MCNP) transport simula-tor software. In the fi rst structure, 147 data points (70%) were used for training the ANNs and 31 (15%) for validation purpose to avoid overfi tting. Further, 31 data points (15%) were used for evaluation of the network performance and calculation of errors. For the other structures, 167 data points (80%) were taken for training and 21 (10%) for validation to avoid over-fi tting problems. Finally, 21 data points (10%) were used to analyse the results and fi nd the estimation errors. It is important to note that patterns contain-ing only one material (e.g., 100% air) were removed from the training set because they represent the same fl ow regime and might expose the ANNs to deviation.
Inputs to the ANNs w ere the following: 1. The number of counts at the fi rst detector (TR1)
for four different ranges of energy. 2. The number of counts at the second detector
(TR2) for four different ranges of energy. 3. The total number of counts at the scattering
detector (total SCA). Outputs of the ANNs were as follows:
1. For the ANN th at recognizes the fl ow regime, the output could be either zero or one.
2. For ANNs that evaluate the VF and WLR, the outputs are equal to the estimates of the target value for the corresponding input data. Overall, nine inputs are given to each of the
networks. The outputs of the ANNs for fl ow regime identifi cation are simply a single digit: either ‘1’ if the fl ow is annular, or ‘0’ if the fl ow is homogeneous.
Mean squared error (MSE) and/or root mean squared error (RMSE) was used to evaluate the simulation accuracy of the networks.
(5)
(6)
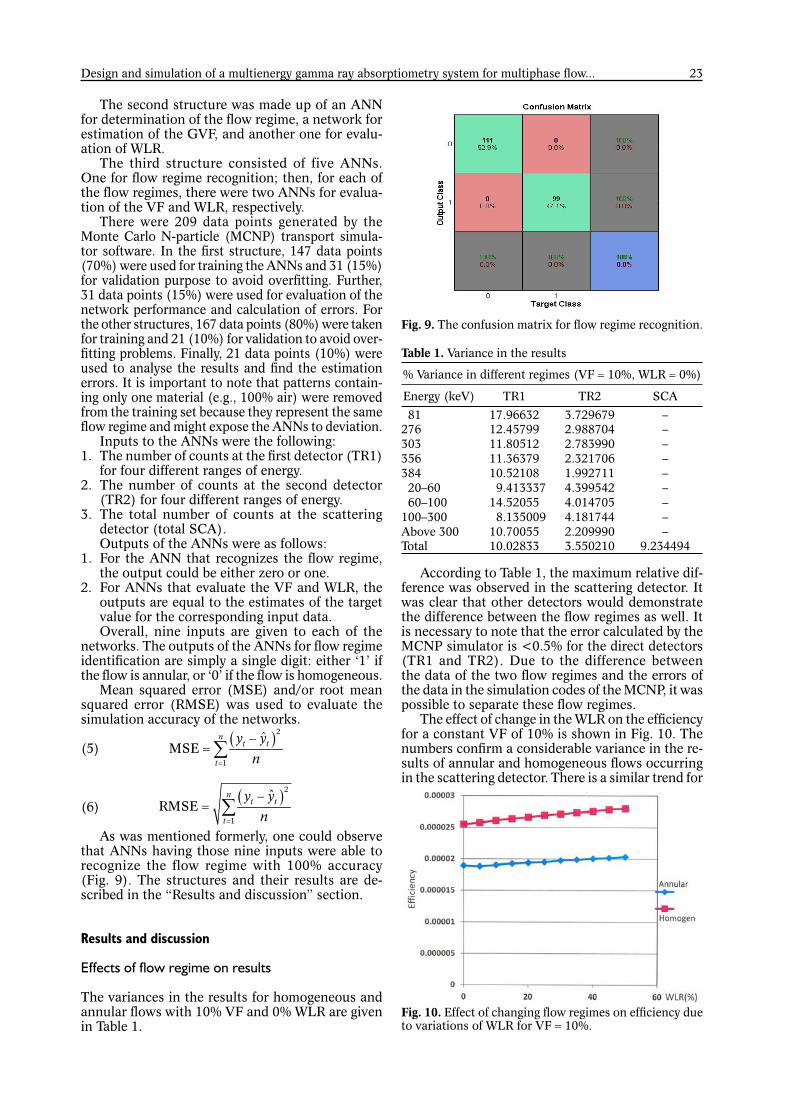
As was mentioned formerly, one could observe that ANNs having those nine inputs were able to recognize the flow regime with 100% accuracy (Fig. 9). The structures and their results are de-scribed in the “Results and discussion” section.
Results and discussion
Effects of fl ow regime on results
The variances in the results for homogeneous and annular fl ows with 10% VF and 0% WLR are given in Table 1.
According to Table 1, the maximum relative dif-ference was observed in the scattering detector. It was clear that other detectors would demonstrate the difference between the fl ow regimes as well. It is necessary to note that the error calculated by the MCNP simulator is <0.5% for the direct detectors (TR1 and TR2). Due to the difference between the data of the two fl ow regimes and the errors of the data in the simulation codes of the MCNP, it was possible to separate these fl ow regimes.
The effect of change in the WLR on the effi ciency for a constant VF of 10% is shown in Fig. 10. The numbers confi rm a considerable variance in the re-sults of annular and homogeneous fl ows occurring in the scattering detector. There is a similar trend for
2
1
ˆMSE
nt t
t
y yn
2
1
ˆRMSE
nt t
t
y yn
Fig. 9. The confusion matrix for fl ow regime recognition.
Table 1. Variance in the results
% Variance in different regimes (VF 10%, WLR 0%)
Energy (keV) TR1 TR2 SCA 81 17.96632 3.729679 –276 12.45799 2.988704 –303 11.80512 2.783990 –356 11.36379 2.321706 –384 10.52108 1.992711 – 20–60 9.413337 4.399542 – 60–100 14.52055 4.014705 –100–300 8.135009 4.181744 –Above 300 10.70055 2.209990 –Total 10.02833 3.550210 9.234494
Fig. 10. Effect of changing fl ow regimes on effi ciency due to variations of WLR for VF 10%.
24 O. Khayat, H. Afarideh
other VFs; hence, one can easily distinguish changes in effi ciency due to the WLR.
Analysis of the simulation results revealed that the two fl ow regimes are simply detectable. Furthera-more, there is a considerable variance in the results, which simplifi es fl ow regime recognition.
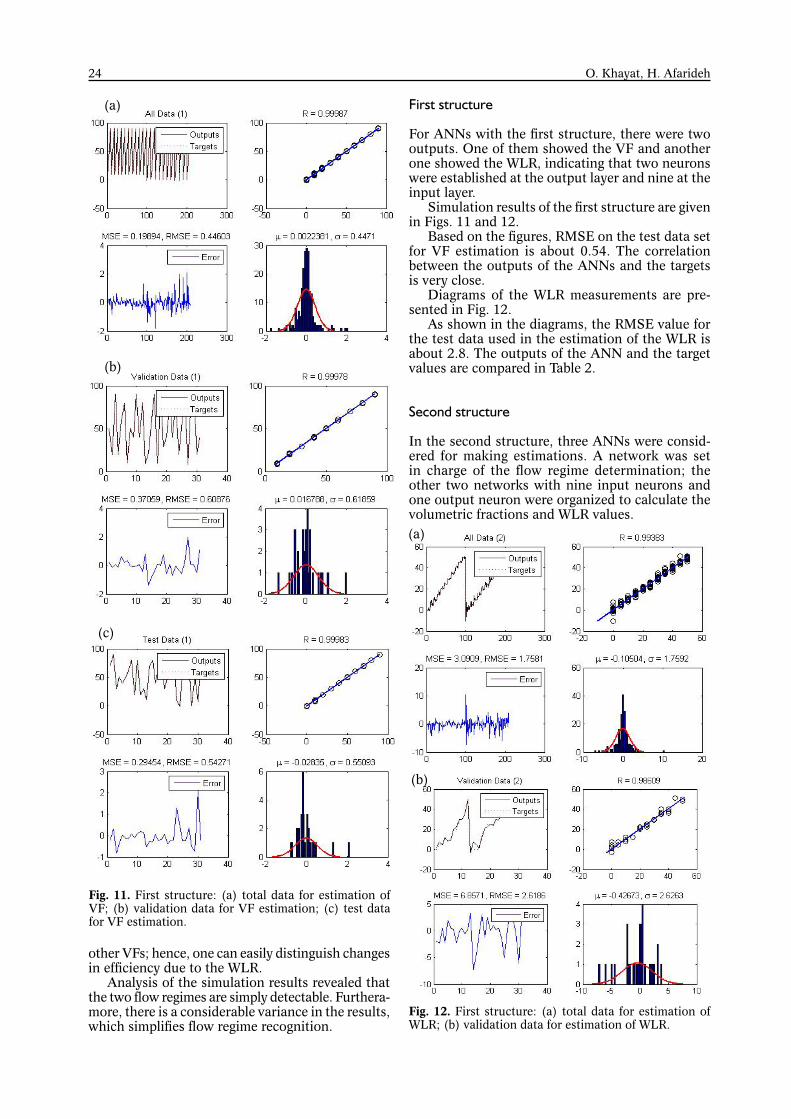
First structure
For ANNs with the fi rst structure, there were two outputs. One of them showed the VF and another one showed the WLR, indicating that two neurons were established at the output layer and nine at the input layer.
Simulation results of the fi rst structure are given in Figs. 11 and 12.
Based on the fi gures, RMSE on the test data set for VF estimation is about 0.54. The correlation between the outputs of the ANNs and the targets is very close.
Diagrams of the WLR measurements are pre-sented in Fig. 12.
As shown in the diagrams, the RMSE value for the test data used in the estimation of the WLR is about 2.8. The outputs of the ANN and the target values are compared in Table 2.
Second structure
In the second structure, three ANNs were consid-ered for making estimations. A network was set in charge of the fl ow regime determination; the other two networks with nine input neurons and one output neuron were organized to calculate the volumetric fractions and WLR values.
Fig. 12. First structure: (a) total data for estimation of WLR; (b) validation data for estimation of WLR.
(b)
Fig. 11. First structure: (a) total data for estimation of VF; (b) validation data for VF estimation; (c) test data for VF estimation.
(a)
(b)
(c)
(a)
25Design and simulation of a multienergy gamma ray absorptiometry system for multiphase fl ow...
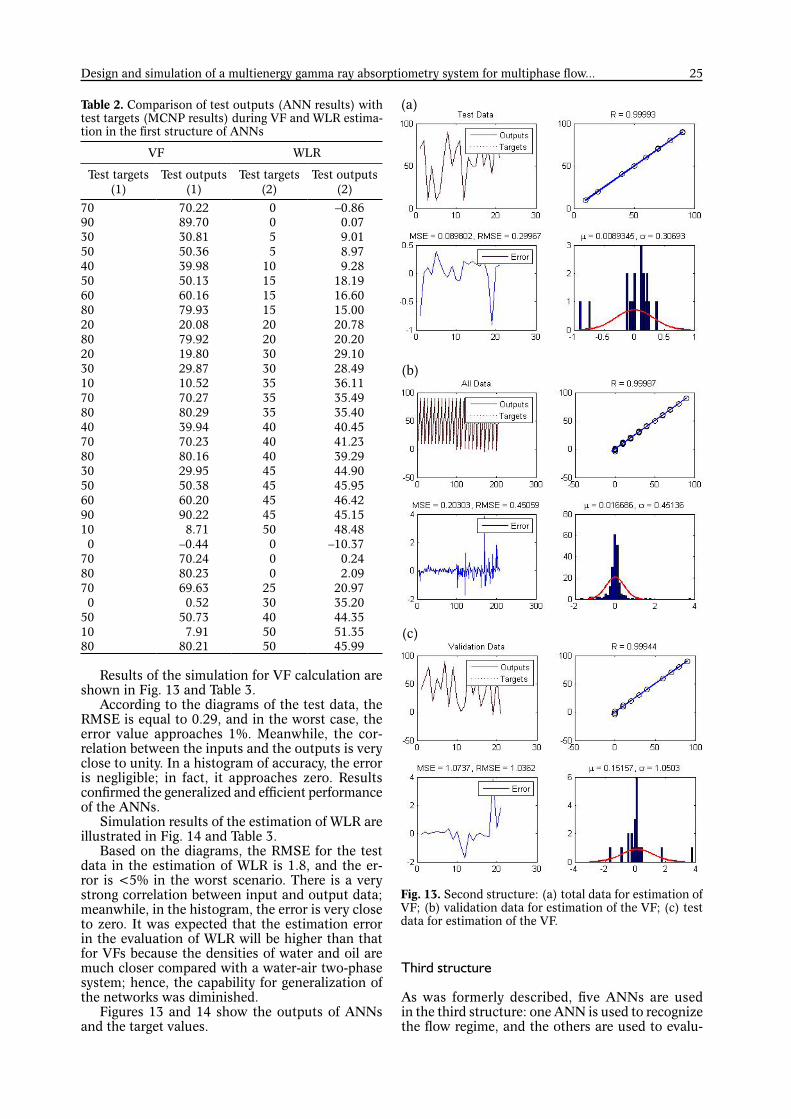
Results of the simulation for VF calculation are shown in Fig. 13 and Table 3.
According to the diagrams of the test data, the RMSE is equal to 0.29, and in the worst case, the error value approaches 1%. Meanwhile, the cor-relation between the inputs and the outputs is very close to unity. In a histogram of accuracy, the error is negligible; in fact, it approaches zero. Results confi rmed the generalized and effi cient performance of the ANNs.
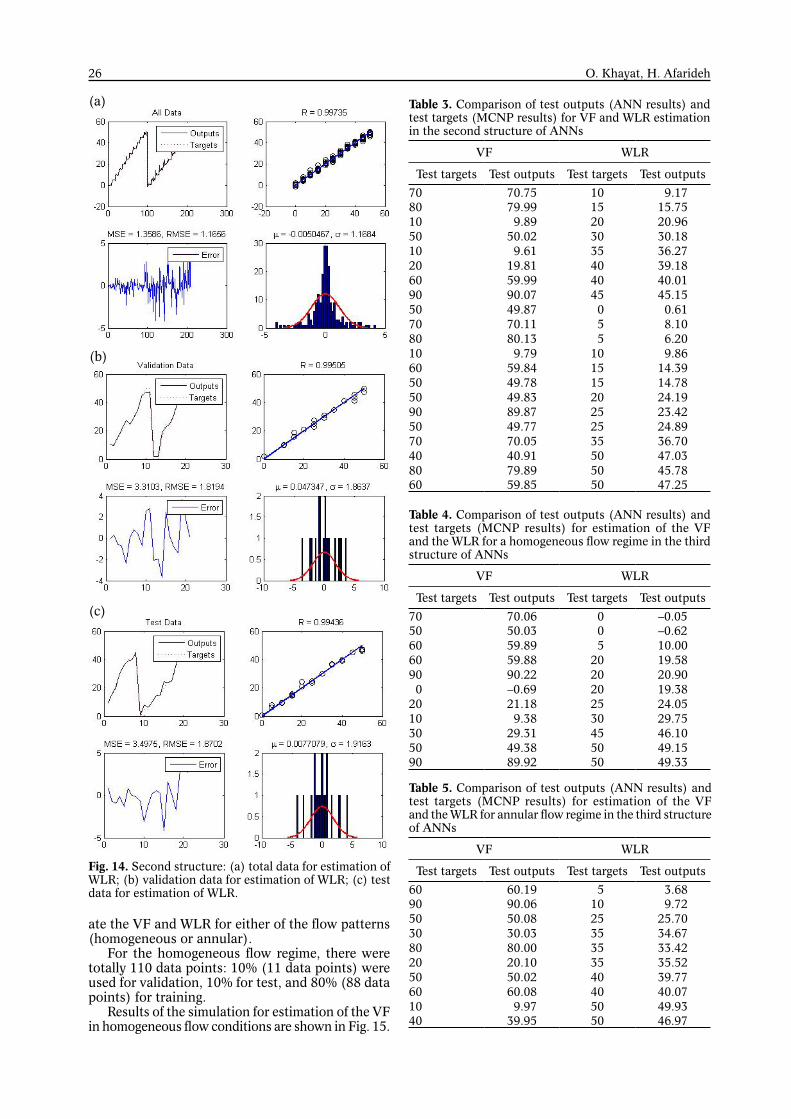
Simulation results of the estimation of WLR are illustrated in Fig. 14 and Table 3.
Based on the diagrams, the RMSE for the test data in the estimation of WLR is 1.8, and the er-ror is <5% in the worst scenario. There is a very strong correlation between input and output data; meanwhile, in the histogram, the error is very close to zero. It was expected that the estimation error in the evaluation of WLR will be higher than that for VFs because the densities of water and oil are much closer compared with a water-air two-phase system; hence, the capability for generalization of the networks was diminished.
Figures 13 and 14 show the outputs of ANNs and the target values.
Third structure
As was formerly described, fi ve ANNs are used in the third structure: one ANN is used to recognize the fl ow regime, and the others are used to evalu-
Table 2. Comparison of test outputs (ANN results) with test targets (MCNP results) during VF and WLR estima-tion in the fi rst structure of ANNs
WLRVF
Test outputs (2)
Test targets (2)
Test outputs (1)
Test targets (1)
–0.86 070.2270 0.07 089.7090 9.01 530.8130 8.97 550.3650 9.281039.9840
18.191550.135016.601560.166015.001579.938020.782020.082020.202079.928029.103019.802028.493029.873036.113510.521035.493570.277035.403580.298040.454039.944041.234070.237039.294080.168044.904529.953045.954550.385046.424560.206045.154590.229048.4850 8.7110
–10.37 0–0.44 0 0.24 070.2470 2.09 080.2380
20.972569.637035.2030 0.52 044.354050.735051.3550 7.911045.995080.2180
Fig. 13. Second structure: (a) total data for estimation of VF; (b) validation data for estimation of the VF; (c) test data for estimation of the VF.
(a)
(b)
(c)
26 O. Khayat, H. Afarideh
ate the VF and WLR for either of the fl ow patterns (homogeneous or annular).
For the homogeneous fl ow regime, there were totally 110 data points: 10% (11 data points) were used for validation, 10% for test, and 80% (88 data points) for training.
Results of the simulation for estimation of the VF in homogeneous fl ow conditions are shown in Fig. 15.
(a)
(b)
(c)
Fig. 14 . Second structure: (a) total data for estimation of WLR; (b) validation data for estimation of WLR; (c) test data for estimation of WLR.
Table 3. Comparison of test outputs (ANN results) and test targets (MCNP results) for VF and WLR estimation in the second structure of ANNs
WLRVF
Test outputsTest targetsTest outputsTest targets 9.171070.757015.751579.998020.9620 9.891030.183050.025036.2735 9.611039.184019.812040.014059.996045.154590.0790 0.61 049.8750 8.10 570.1170 6.20 580.1380 9.8610 9.791014.391559.846014.781549.785024.192049.835023.422589.879024.892549.775036.703570.057047.035040.914045.785079.898047.255059.8560
Table 4. Comparison of test outputs (ANN results) and test targets (MCNP results) for estimation of the VF and the WLR for a homogeneous fl ow regime in the third structure of ANNs
WLRVF
Test outputsTest targetsTest outputsTest targets–0.05 070.0670–0.62 050.035010.00 559.896019.582059.886020.902090.229019.3820–0.69 024.052521.182029.7530 9.381046.104529.313049.155049.385049.335089.9290
Table 5. Comparison of test outputs (ANN results) and test targets (MCNP results) for estimation of the VF and the WLR for annular fl ow regime in the third structure of ANNs
WLRVF
Test outputsTest targetsTest outputsTest targets 3.68 560.1960 9.721090.069025.702550.085034.673530.033033.423580.008035.523520.102039.774050.025040.074060.086049.9350 9.971046.975039.9540
27Design and simulation of a multienergy gamma ray absorptiometry system for multiphase fl ow...
According to the diagrams, the RMSE for the test data is about 0.54; the total error would be 1.5 in the worst conditions. As was described formerly, an independent ANN is set to estimate the WLR in the system.
Based on the fi gures, the RMSE of the test data is 1.65; the error would be not >5 in the worst case. Table 4 demonstrates the test outputs and the target outputs.
As was described formerly, two independent ANNs were organized to estimate the VF and the WLR. There were a total of 99 data points; 10% (10 inputs) were taken for validation, 10% for the test, and 80% (79 data) for training.
Results of the simulation for annular fl ow are shown in Fig. 16.
According to the diagrams, the RMSE for test data in annular fl ow is 0.08. The correlation between outputs and targets is very close to one. The error approaches 2.0 for the worst case.
Results of the simulation for estimation of the WLR in annular fl ow are shown in Fig. 16.
According to the fi gures, the RMSE of the test data for estimation of the WLR in annular fl ow is 1.2; the error is <3% in the worst scenario. The histogram of accuracy illustrates that the error is very much close to zero over a wide range of data. The results are given in Table 5.
Conclusion
The values of WLR and VF are key parameters in multiphase fl ow meters. Designing and manufactur-ing a multiphase fl ow meter requires complex com-putation models to measure these parameters from among a set of parameters obtained from measure-ment sensors and gages. Nuclear multiphase fl ow meters are the most effi cient types of fl ow meters utilized in petroleum industries for oil/water/gas fl ows. A system of multiphase fl ow measurement was designed by application of three thallium-doped sodium iodide scintillators and a radioactive source of 133Ba installed on a plane spanning the cross sec-tion of a vertically aligned pipe carrying the three phases of oil, water, and gas. The proposed setup was simulated using the MCNP code. Transmission and scattering detectors gather data from the irra-diation of the cross section of a pipe for different volumetric fractions of water, oil, and gas phases for the two most commonly occurring types of fl ow regimes, namely, homogeneous and annular; different structures of ANNs were developed to receive detector data as input parameters and give the fl ow regime, VF, and WLR as outputs. The mul-tilayer perceptron neural network was selected to be trained by the Levenberg-Marquardt algorithm due to its effi ciency.
The results showed that increasing the number of ANNs makes the system more complicated and
Fig. 15. Third structure/homogeneous fl ow regime: (a) validation data for estimation of the VF; (b) test data for esti-mation of the VFs; (c) validation data for estimation of WLR; (d) test data for estimation of WLR.
(a)
(c)
(b)
(d)
28 O. Khayat, H. Afarideh
decreases the available data; however, this increases the accuracy of estimation of the WLR and the GVF (see Table 6). According to the results, the maximum relative difference was observed in the scattering detector. It was clear that transmission detectors would demonstrate the difference between the fl ow regimes as well. It is necessary to note that the er-ror calculated by the MCNP simulator is <0.5% for the direct detectors (TR1 and TR2). Due to the difference between the data of the two fl ow regimes and the errors of data in the simulation codes of the MCNP, it was possible to separate these fl ow regimes. The effect of changing WLR on the ef-fi ciency for a constant VF confi rms a considerable variance in the results for annular and homogeneous fl ows occurring in the scattering detector. There is a similar trend for the VF; hence, one can easily dis-tinguish the changes in effi ciency due to the WLR. Analysis of the simulation results revealed that in the proposed structure of the multiphase fl ow meter
and the computation model used for simulation, the two fl ow regimes are simply distinguishable.
Since the available data are limited, we would have fewer data points to train each network, which, in fact, is harmful to the training process and affects the generalization capability of the system. Although the fi rst structure provided lower accuracy, it gener-ally was more reliable. It was trained by much more variant data. Other structures benefi ted from extra layers to reduce relative errors, but it led to the lack of training data, and hence, the generalization capability decreased. Each of the structures should be used depending on the application.
References
1. Scheers, A. M. (2000). An oil/water/gas composition meter based on multiple energy gamma ray absorption (MEGRA) measurement. ETDEWEB ID:20061564.
Fig. 16. Third structure/annular fl ow regime: (a) validation data for estimation of VFs; (b) test data for estimation of VFs; (c) validation data for estimation of WLR; (d) tes t data for estimation of WLR.
(a)
(c)
Table 6. Comparison of errors in the three proposed structures of ANNs
WLRVFANNs structure
2.800.54First structure1.870.29Second structure
AnnularHomogeneousAnnularHomogeneousThird structure 1.21.60.080.54
(b)
(d)
29Design and simulation of a multienergy gamma ray absorptiometry system for multiphase fl ow...
2. Holstad, M. B. (2004). Gamma-ray scatter methods applied to industrial measurement systems. Un-published Ph.D. thesis, Department of Physics and Technology, University of Bergen, Norway.
3. Scheers, A., & Letton, W. (1996). An oil/water/gas composition meter based on multiple energy gamma ray absorption (MEGRA) measurement. In Proceed-ings of 14th North Sea Flow Measurement Workshop.
4. Blaney, S. (2008). Gamma radiation methods for clamp-on multiphase fl ow metering. Unpublished PhD thesis, Cranfi eld University.
5. Salgado, C., Brandao, L. E. B., Conti, C. C., & Salga-do, W. L. (2016). Density prediction for petroleum and derivatives by gamma-ray attenuation and artifi cial neural networks. Appl. Radiat. Isot., 116, 143–149.
6. AL-Qutami, T. A., Ibrahim, R., Ismail, I., & Ishak, M. A. (2018). Virtual multiphase fl ow metering us-ing diverse neural network ensemble and adaptive simulated annealing. Expert Syst. Appl., 93, 72–85.
7. Roshani, G., Nazemi, E., & Roshani, M. (2017). Flow regime independent volume fraction estimation in three-phase fl ows using dual-energy broad beam tech-nique and artifi cial neural network. Neural Comput. Appl., 28(Suppl. 1), 1265–1274.
8. Nazemi, E., Roshani, G. H., Feghhi, S. A. H., Seta-yeshi, S., Eftekhari Zadeh, E., & Fatehi, A. (2016). Optimization of a method for identifying the fl ow regime and measuring void fraction in a broad beam gamma-ray attenuation technique. Int. J. Hydrog. Energy, 41(18), 7438–7444.
9. Johansen, G., & Jackson, P. (2000). Salinity indepen-dent measurement of gas volume fraction in oil/gas/water pipe fl ows. Appl. Radiat. Isot., 53(4), 595–601.
10. Johansen, G. A., & Tjugum, S. -A. (2007). Fluid composition analysis by multiple gamma-ray beam
and modality measurements. In 25th International North Sea Flow Measurement Workshop, Citeseer.
11. Åbro, E., Khoryakov, V. A., Johansen, G. A., & Koc-bach, L. (1999). Determination of void fraction and fl ow regime using a neural network trained on simu-lated data based on gamma-ray densitometry. Meas. Sci. Technol., 10(7), 619–630.
12. Roshani, G. H., Feghhi, S. A. H., & Setayeshi, S. (2015). Dual-modality and dual-energy gamma ray densitometry of petroleum products using an artifi cial neural network. Radiat. Meas., 82, 154–162.
13. Salgado, C. M., Brandão, L. E., Pereira, C. M., & Salgado, W. L. (2014). Salinity independent volume fraction prediction in annular and stratifi ed (water-gas-oil) multiphase fl ows using artifi cial neural net-works. Prog. Nucl. Energy, 76, 17–23.
14. Salgado, C. M., Pereira, C. M., Schirru, R., & Brandão, L. E. (2010). Flow regime identifi cation and volume fraction prediction in multiphase fl ows by means of gamma-ray attenuation and artifi cial neural networks. Prog. Nucl. Energy, 52(6), 555–562.
15. Srinivasan, Ravichandran, Chan, Vidhya, & Ramak-irishnan, Krishnan. (2002). Exponentiated backprop-agation algorithm for multilayer feedforward neural networks. In Proceedings of the 9th International Conference on Neural Information Processing, pp. 227–331.
16. Kamarthi, S. V., & Pittner, S. (1999). Accelerating neural network training using weight extrapolation. Neural Netw., 12(9), 1285–1299.
17. More, J. J. (1978). The Levenberg-Marquardt algo-rithm: Implementation and theory. In G. A. Watson (Ed.), Numerical analysis. (Lecture Notes in Math-ematics, Vol. 630). Berlin, Heidelberg: Springer.