For Kavitha Mam
132
A STUDY ON EFFECTIVENESS OF EMPLOYEE MOTIVATIONAL TECHNIQUES WITH SPECIAL REEFRENCE TO KANDAGIRI SPINNING MILLS LTD, UNIT-I, UDAYAPATTI, SALEM. Submitted to periyar university, Salem in partial fulfillment of the requirements for the award of the degree of MASTER OF BUSINESS ADMINISTRATION Submitted by S.PARTHIBAN (REGD.NO 07BIA1390) Under the guidance of Ms.L.KAVITHA, MBA SEMESTER IV APRIL, 2009 VYSYA INSTITUTE OF MANAGEMENT STUDIES VYSYA COLLEGE ACCREDITED WITH FIVE STAR STATUS “A” GRADE BY NACC (Affiliated to Periyar University)
description
finance
Transcript of For Kavitha Mam

A STUDY ON EFFECTIVENESS OF EMPLOYEE MOTIVATIONAL TECHNIQUES WITH SPECIAL REEFRENCE
TO KANDAGIRI SPINNING MILLS LTD, UNIT-I, UDAYAPATTI, SALEM.
Submitted to periyar university, Salem in partial fulfillment
of the requirements for the award of the degree of
MASTER OF BUSINESS ADMINISTRATION
Submitted by
S.PARTHIBAN
(REGD.NO 07BIA1390)
Under the guidance of
Ms.L.KAVITHA, MBA
SEMESTER IV
APRIL, 2009
VYSYA INSTITUTE OF MANAGEMENT STUDIES
VYSYA COLLEGE
ACCREDITED WITH FIVE STAR STATUS “A” GRADE BY NACC
(Affiliated to Periyar University)
Salem-636103
VYSYA INSTITUTE OF MANAGEMENT STUDIES
VYSYA COLLEGE
ACCREDITED WITH FIVE STAR STATUS “A” GRADE BY NACC
(Affiliated to Periyar University)
Salem-636103
CERTIFICATE
This is to certify that this project work entitled “A study on effectiveness of employee
motivational techniques with special reference to kandagiri spinning mills
limited, unit-I, udayapatti, Salem.” is a bonafide record of S.PARTHIBAN REGD.No
07BIA1390 Submitted to periyar university, Salem in partial fulfillment of the requirements for
the award of the degree of MASTER OF BUSINESS ADMINISTRATION, Periyar University, Salem
during the academic year 2008-09.
Signature of Faculty Guide Signature of Principal
Submitted for the university examination (Viva-Voce) held on _____________
Signature of the Internal Examiner Signature of the External Examiner
Place:
Date:
DECLARATION
I, S.PARTHIBAN (07BIA1390) pursuing MBA programme in Vysya Institute Of
Management studies, Salem here by declare that the project work entitled “A study on
effectiveness of employee motivational techniques with special reference to
kandagiri spinning mills limited, unit-I, udayapatti, Salem.” Submitted to Periyar
University, Salem in partial fulfillment of the requirements for the award of the degree of
master of business administration is a bonafide work done by me under the guidance of Ms.
L.KAVITHA , MBA in vysya college of arts and science, Salem and Lecturer in visual institute of
management studies, Salem to the best of my knowledge, the work reported there in does not
form part of any other thesis or work on the basis of which a degree or award was conferred on
an earlier occasion
Place: Signature of the Researcher
Date:
ACKNOWLEDGEMENT
I wish to first thank and praise Almighty god for countless blessing that he showered
upon to complete this study.
I extend my indebtedness to the benevolent Management
Dr. Mr. J. RAJENDARA PRASAD, Correspondent & Secretary, Mr. P.
VENKATESEN, M.SC., PGDCA, Principal and Dr. N. GNANASABAPATHY M.B.A, AMIMA, PHD.,
Director and Mrs. S. PALLAVI, M.B.A, M.Phil, Head of the Department and Mrs. N. SUDHA,
Controller of the examination for providing me an opportunity to undertake this project work.
I sincerely thank to Ms. L.KAVITHA, MBA the in Vysya College of arts and science, Salem
and Lecturer in Vysya institute of management studies, Salem the words are inadequate to
express my sincere thanks to my guide.
I also thank all faculty members of Department of Master of Business Administration
and express my gratitude to Mr.G.VAITHIYANATHAN, ASST.MANAGER (HRD), for the support
and guidance in the kandagiri spinning mills ltd, udayapatti, Salem.
Finally, I thank my beloved parents, and friends for their wholehearted moral support to
accomplish this study.
I take this opportunity to thank my PARENTS, FRIENDS, LECTURES and WELL WISHERS
for giving encouragement and help either directly or indirectly in finishing this course.
S.PARTHIBAN
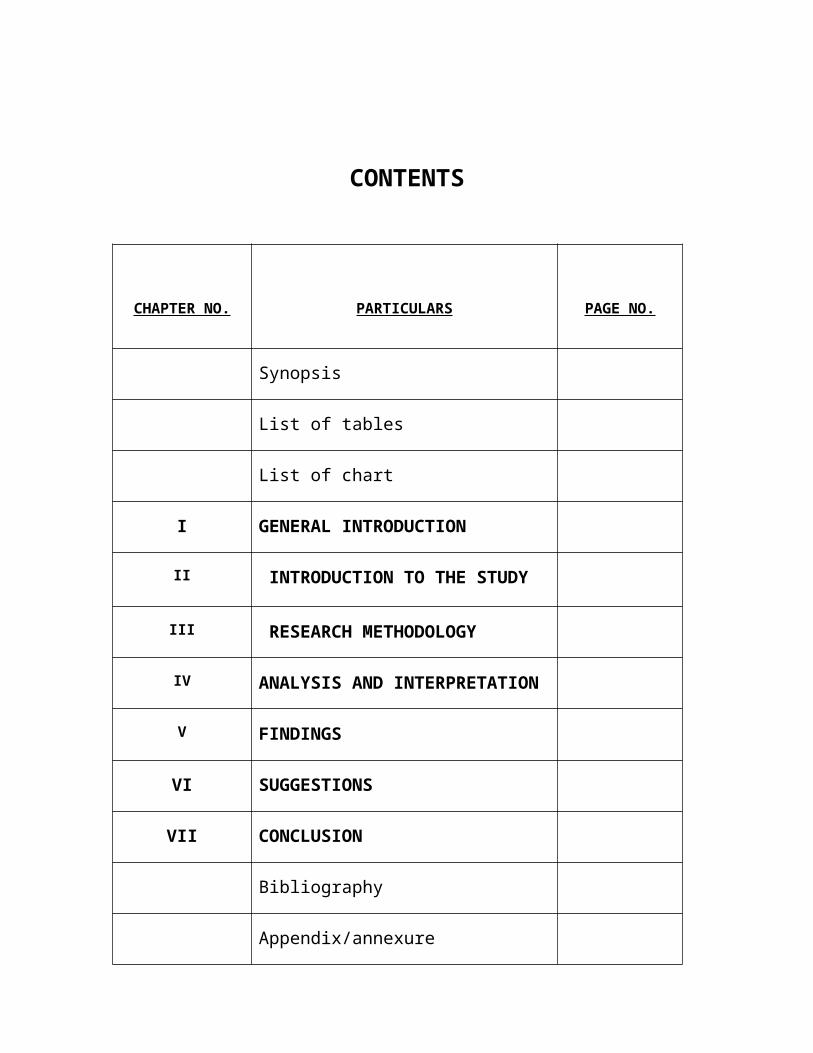
CONTENTS
CHAPTER NO. PARTICULARS PAGE NO.
Synopsis
List of tables
List of chart
I GENERAL INTRODUCTION
II INTRODUCTION TO THE STUDY
III RESEARCH METHODOLOGY
IV ANALYSIS AND INTERPRETATION
V FINDINGS
VI SUGGESTIONS
VII CONCLUSION
Bibliography
Appendix/annexure
SYNOPSIS

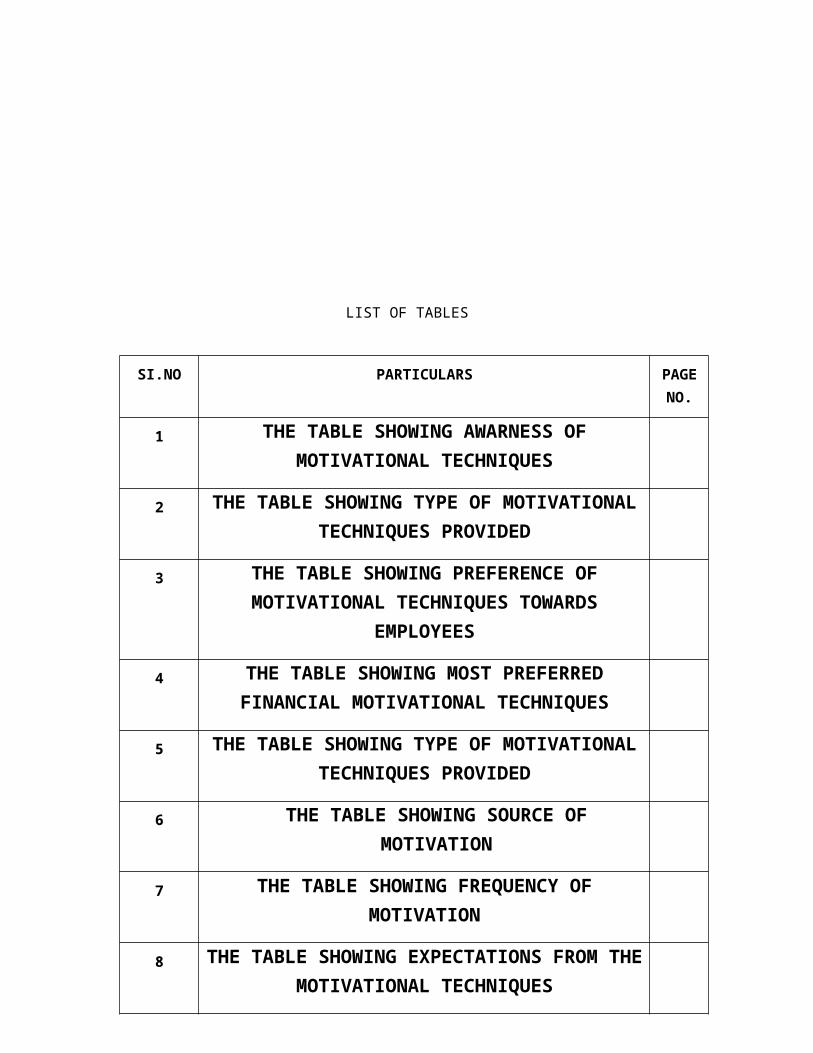
LIST OF TABLES
SI.NO PARTICULARS PAGE NO.
1 THE TABLE SHOWING AWARNESS OF MOTIVATIONAL TECHNIQUES
2 THE TABLE SHOWING TYPE OF MOTIVATIONAL TECHNIQUES PROVIDED
3 THE TABLE SHOWING PREFERENCE OF MOTIVATIONAL TECHNIQUES TOWARDS EMPLOYEES
4 THE TABLE SHOWING MOST PREFERRED FINANCIAL MOTIVATIONAL TECHNIQUES
5 THE TABLE SHOWING TYPE OF MOTIVATIONAL TECHNIQUES PROVIDED
6 THE TABLE SHOWING SOURCE OF MOTIVATION
7 THE TABLE SHOWING FREQUENCY OF MOTIVATION
8 THE TABLE SHOWING EXPECTATIONS FROM THE MOTIVATIONAL TECHNIQUES
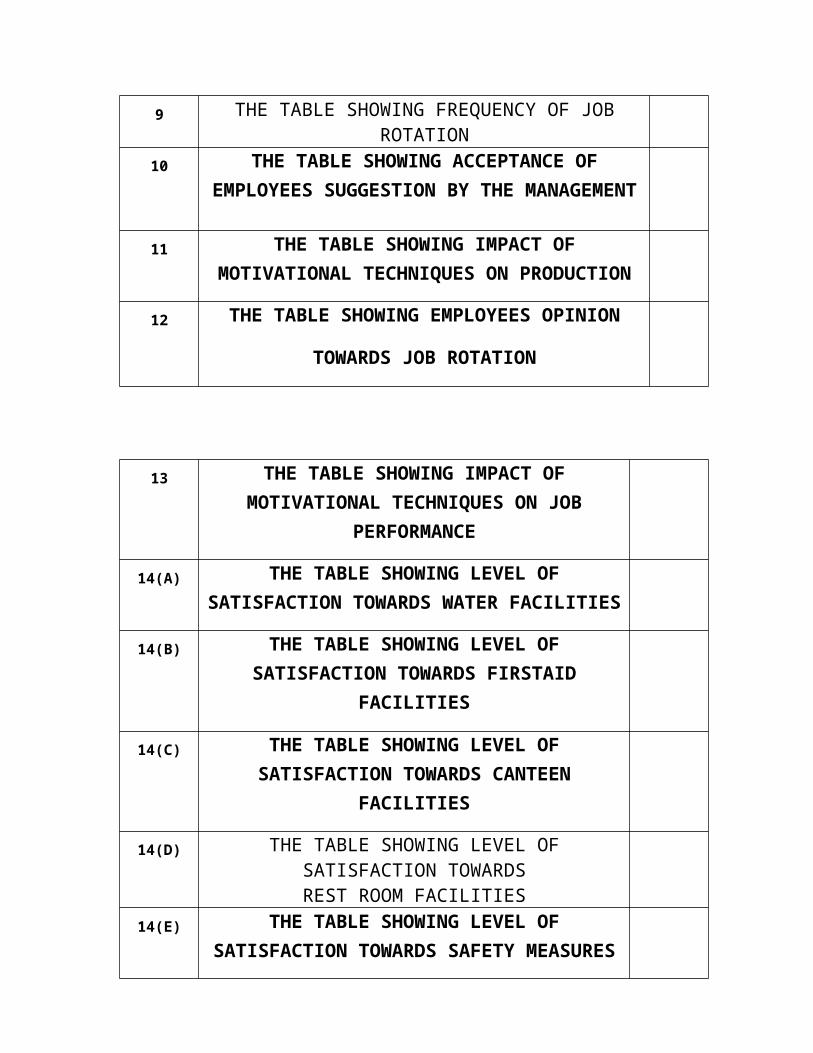
9 THE TABLE SHOWING FREQUENCY OF JOB ROTATION
10 THE TABLE SHOWING ACCEPTANCE OF EMPLOYEES SUGGESTION BY THE MANAGEMENT
11 THE TABLE SHOWING IMPACT OF MOTIVATIONAL TECHNIQUES ON PRODUCTION
12 THE TABLE SHOWING EMPLOYEES OPINION
TOWARDS JOB ROTATION
13 THE TABLE SHOWING IMPACT OF MOTIVATIONAL TECHNIQUES ON JOB PERFORMANCE
14(A) THE TABLE SHOWING LEVEL OF SATISFACTION TOWARDS WATER FACILITIES
14(B) THE TABLE SHOWING LEVEL OF SATISFACTION TOWARDS FIRSTAID FACILITIES
14(C) THE TABLE SHOWING LEVEL OF SATISFACTION TOWARDS CANTEEN FACILITIES
14(D) THE TABLE SHOWING LEVEL OF SATISFACTION TOWARDS
REST ROOM FACILITIES
14(E) THE TABLE SHOWING LEVEL OF SATISFACTION TOWARDS SAFETY MEASURES
15(A) THE TABLE SHOWING LEVEL OF SATISFACTION TOWARDS PROMOTION
15(B) THE TABLE SHOWING LEVEL OF SATISFACTION TOWARDS INCREMENT
15(C) THE TABLE SHOWING LEVEL OF SATISFACTION TOWARDS BONUS
16 THE TABLE SHOWING EFFECTIVENESS OF MOTIVATIONAL TECHNIQUES
17
THE TABLE SHOWING SUFFICIENCY OF MOTIVATIONAL TECHNIQUES
18 THE TABLE SHOWING OPINION REGARDING DEFICIENCY OF MOTIVATIONAL TECHNIQUES
19 THE TABLE SHOWING SUPERIORS RELATIONSHIP WITH THE EMPLOYEES
20 THE TABLE SHOWING OPINION REGARDING JOB DIRECTION GIVEN
21 THE TABLE SHOWING OPINION ABOUT THE SHIFT
22 THE TABLE SHOWING FAIRABILITY REGARDING MOTIVATIONAL TECHNIQUES
23 THE TABLE SHOWING EMPLOYEES SUGGESTIONS TOWARDS MOTIVATIONAL TECHNIQUES
LIST OF CHARTS
SI.NO PARTICULARS PAGE NO.
1 THE CHART SHOWING AWARNESS OF MOTIVATIONAL TECHNIQUES
2 THE CHART SHOWING TYPE OF MOTIVATIONAL TECHNIQUES PROVIDED
3 THE CHART SHOWING PREFERENCE OF MOTIVATIONAL TECHNIQUES TOWARDS
EMPLOYEES
4 THE CHART SHOWING MOST PREFERRED FINANCIAL MOTIVATIONAL TECHNIQUES
5 THE CHART SHOWING MOST PREFERRED NON-FINANCIAL MOTIVATIONAL TECHNIQUES
6 THE CHART SHOWING SOURCE OF MOTIVATION
7 THE CHART SHOWING FREQUENCY OF MOTIVATION
8 THE CHART SHOWING EXPECTATIONS FROM THE MOTIVATIONAL TECHNIQUES
9 THE CHART SHOWING FREQUENCY OF JOB ROTATION
10 THE TABLE SHOWING EMPLOYEES OPINION
TOWARDS JOB ROTATION
11 THE CHART SHOWING ACCEPTANCE OF EMPLOYEES SUGGESTION BY THE MANAGEMENT
12(A) THE CHART SHOWING IMPACT OF MOTIVATIONAL TECHNIQUES ON
PRODUCTION
12(B) THE CHART SHOWING IMPACT OF MOTIVATIONAL TECHNIQUES ON
PRODUCTION
13 THE CHART SHOWING IMPACT OF MOTIVATIONAL TECHNIQUES ON JOB
PERFORMANCE
14 (A) THE CHART SHOWING LEVEL OF SATISFACTION TOWARDS WATER FACILITIES
14 (B) THE CHART SHOWING LEVEL OF SATISFACTION TOWARDS FIRSTAID
FACILITIES
14(C) THE CHART SHOWING LEVEL OF SATISFACTION TOWARDS CANTEEN
FACILITIES
14(D) THE CHART SHOWING LEVEL OF SATISFACTION TOWARDS
REST ROOM FACILITIES
14(E) THE CHART SHOWING LEVEL OF SATISFACTION TOWARDS SAFETY
MEASURES
15(A) THE CHART SHOWING LEVEL OF SATISFACTION TOWARDS PROMOTION
15(B) THE CHART SHOWING LEVEL OF SATISFACTION TOWARDS INCREMENT
15(C) THE CHART SHOWING LEVEL OF SATISFACTION TOWARDS BONUS
16 THE CHART SHOWING EFFECTIVENESS OF MOTIVATIONAL TECHNIQUES
17 THE CHART SHOWING SUFFICIENCY OF MOTIVATIONAL TECHNIQUES
18(A) THE CHART SHOWING OPINION REGARDING DEFICIENCY OF
MOTIVATIONAL TECHNIQUES
18(B) THE CHART SHOWING OPINION REGARDING DEFICIENCY OF MOTIVATIONAL TECHNIQUES
19 THE TABLE SHOWING SUPERIORS RELATIONSHIP WITH THE EMPLOYEES
20 THE CHART SHOWING OPINION REGARDING JOB DIRECTION GIVEN
21 THE CHART SHOWING OPINION ABOUT THE SHIFT TIME
22 THE CHART SHOWING FAIRABILITY REGARDING MOTIVATIONAL
TECHNIQUES
23 THE CHART SHOWING EMPLOYEES SUGGESTIONS TOWARDS
MOTIVATIONAL TECHNIQUES
GENERAL INTRODUCTION
CHAPTER I
GENERAL INTRODUCTION
The textile industry occupies a unique place in our country. One of the earliest to come into
existence in India, it accounts for 14% of the total Industrial production, contributes to nearly
30% of the total exports and is the second largest employment generator after agriculture.
Textile Industry is providing one of the most basic needs of people and the holds importance;
maintaining sustained growth for improving quality of life. It has a unique position as a self-
reliant industry, from the production of raw materials to the delivery of finished products, with
substantial value-addition at each stage of processing; it is a major contribution to the country's
economy. Its vast potential for creation of employment opportunities in the agricultural,
industrial, organized and decentralized sectors & rural and urban areas, particularly for women
and the disadvantaged is noteworthy.
Although the development of textile sector was earlier taking place in terms of general policies,
in recognition of the importance of this sector, for the first time a separate Policy Statement was
made in 1985 in regard to development of textile sector. The textile policy of 2000 aims at
achieving the target of textile and apparel exports of US $ 50 billion by 2010 of which the share
of garments will be US $ 25 billion. The main markets for Indian textiles and apparels are USA,
UAE, UK, Germany, France, Italy, Russia, Canada, Bangladesh and Japan.
CURRENT SCENERIO
The industry expects investment of Rs.140, 000 crore in this sector in the post-MFA phase. A
Vision 2010 for textiles formulated by the government after intensive interaction with the
industry and Export Promotion Councils to capitalize on the upbeat mood aims to increase
India's share in world's textile trade from the current 4% to 8% by 2010 and to achieve export
value of US $ 50 billion by 2010 Vision 2010 for textiles envisages growth in Indian textile
economy from the current US $ 37 billion to $ 85 billion by 2010; creation of 12 million new jobs
in the textile sector; and modernization and consolidation for creating a globally competitive
textile industry.
There will be opportunities as well as challenges for the Indian textile industry in the post-MFA
era. But India has natural advantages which can be capitalized on strong raw material base -
cotton, man-made fibers, jute, silk; large production capacity (spinning - 21% of world capacity
and weaving - 33% of world capacity but of low technology);
The elimination of quota restriction will open the way for the most competitive developing
countries to develop stronger clusters of textile expertise, enabling them to handle all stages of
the production chain from growing natural fibers to producing finished clothing, The OECD
paper says that while low wages can still give developing countries a competitive edge in world
markets, time factors now play a far more crucial role in determining international
competitiveness. Countries that aspire to maintain an export-led strategy in textiles and clothing
need to complement their cluster of expertise in manufacturing by developing their expertise in
the higher value-added service segments of the supply chain such as design, sourcing or retail
distribution.
ABOUT THE COMPANY
KANDAGIRI SPINNING MILLS LIMITED was incorporated in 1976 by
Sarvashri. S. P.Rathanam S.P.Sambandam, S. P. Rajendran and K. R. Manicka
Mudaliar who had been doyers in textile business at Salem. Due to their
strenuous efforts over decades, the company has flowered into a major industrial
concern presently boasting of a total spindleage of 50,588 and 336 OE rotors in
two units, first at Udayapatti, Salem (25,100 spindles) and another at
Seshanchavadi (25,488 spindles).there has been a continuous expansion and
modernization at these units.
The company presently is headed by Sri. R. Selvarajan, s/o. Sri. S. P.
Ratnam, Founder. He has four decades of experience in yarn trade /
manufacturing. The Joint Managing Director
Sri. S. Vijayashankar, a management graduate, son of Sri. R. Selvarajan. They are
very much involved in running the company successfully with a closely knit team
of qualified youthful and skilful team of technical and other managers and
workforce. Importance is given to adherence to quality systems and schedules.
Customer requirements awareness is indicated to the good root level workers.
The Company went for Public Issue in January 1995 as a Premium Issue
which was a roaring success; it was over subscribed 9 times. The Company’s paid
up share capital consists of 38, 49,250 shares of Rs. 10/- each. The Company’s
shares are listed in Mumbai, Chennai and Coimbatore Stock Exchanges.
As stated earlier Kandagiri Spinning Mills Limited is a significant member of the
Sambandam Group of Companies. It strives for excellence in every sphere of its
activities. Quality, best service, customer friendly and steady development are its
policies. The Company is committed to corporate governance in fulfilling its quest
for achieving significant growth with profits. The award of ISO 9001:2000 & EMS
14001:2004 Accreditation to the company is a fitting testimony in this regard.
Type of organization:
It is a public limited company. It went for Public Issue in January 1995 as a
Premium Issue.
Nature of business:
It is engaged fully in cotton and yarn business.
Goal:
Striving for excellence in every sphere of company’s activities.
Quality policy:
We are manufacturing 100% cotton yarn with highest standards
Meeting with International 5% to 25% User Statistics.
Strictly adopting BIAS for preparing mixing.
Following Manual contamination collection for controlling contaminants.
Having well equipped liter machines in our testing lab accelerated with
NABL Certification for Fiber to yarn testing.
Good quality:
Best at saving the cost and time of the customer.
Best service:
Customer friendly in fulfilling their requirements.
Steady development:
Up gradation in technology and diversification for value addition.
Chairman & Managing Directors:
Mr. R. Selvarajan
Joint Managing Directors:
Mr. S. Vijayshankar
Promoter:
Sri. S. P. Sambandam
Address of Regd. Office
Kandagiri Spinning Mills Ltd.,
Unit-I,
Udayapatti,
Salem – 636 140
Details about branches:
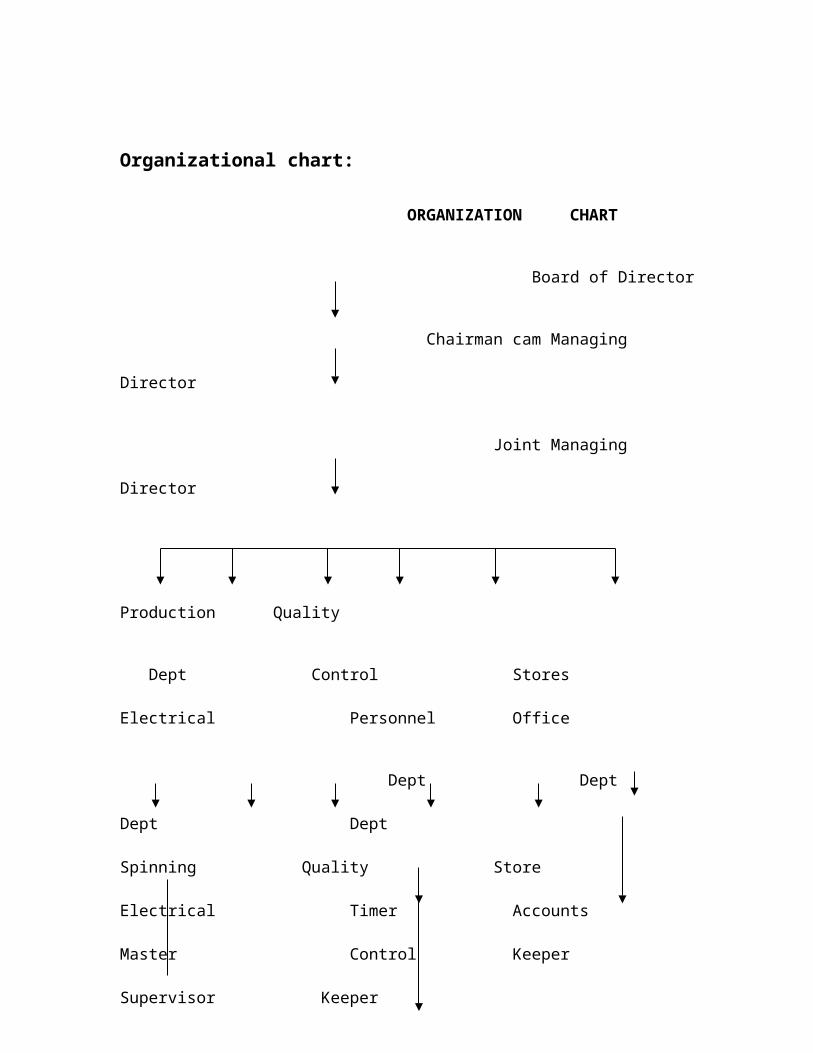
Organizational chart:
ORGANIZATION CHART
Board of Director
Chairman cam Managing Director
Joint Managing Director
Production Quality
Dept Control Stores Electrical Personnel Office
Dept Dept Dept Dept
Spinning Quality Store Electrical Timer Accounts
Master Control Keeper Supervisor Keeper
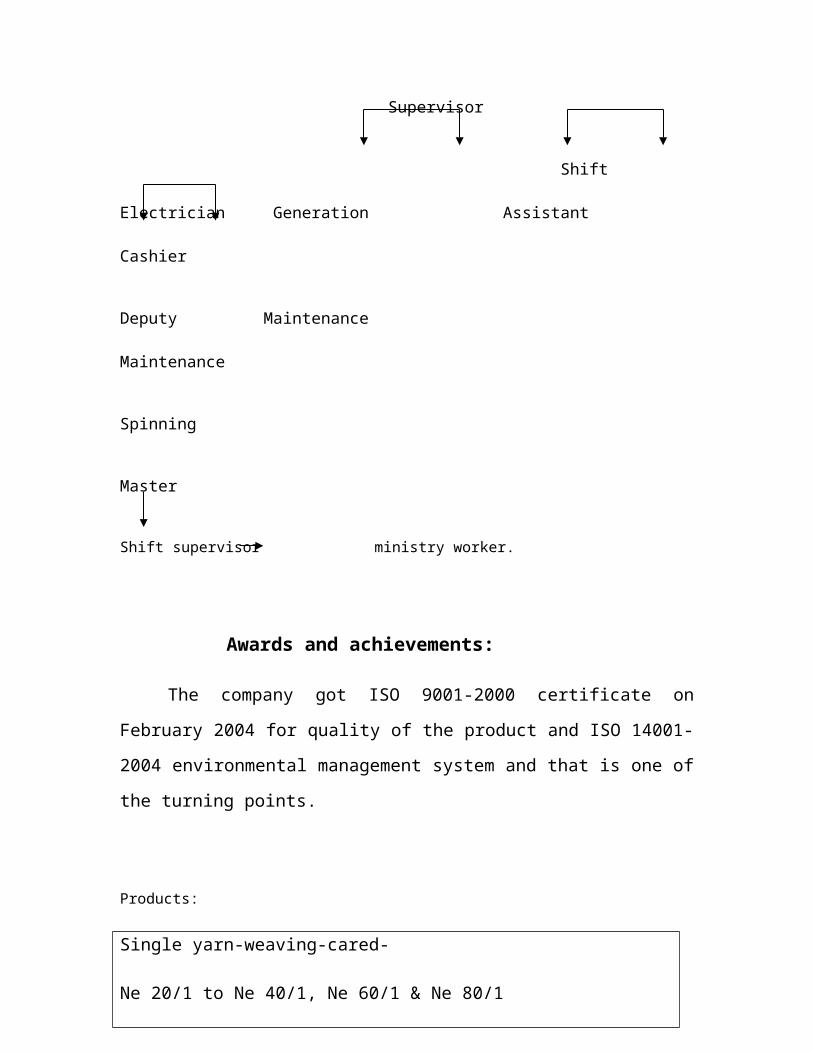
Supervisor
Shift Electrician Generation Assistant Cashier
Deputy Maintenance Maintenance
Spinning
Master
Shift supervisor ministry worker.
Awards and achievements:
The company got ISO 9001-2000 certificate on February 2004 for quality of
the product and ISO 14001-2004 environmental management system and that is
one of the turning points.
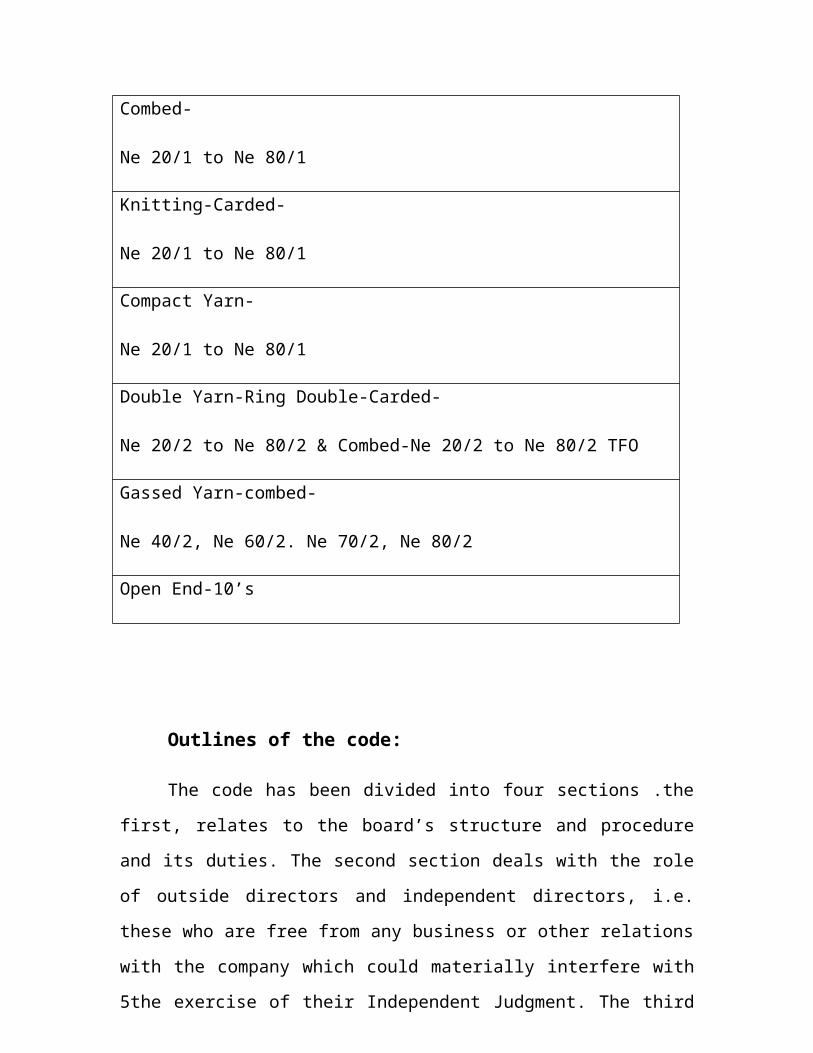
Products:
Single yarn-weaving-cared-
Ne 20/1 to Ne 40/1, Ne 60/1 & Ne 80/1
Combed-
Ne 20/1 to Ne 80/1
Knitting-Carded-
Ne 20/1 to Ne 80/1
Compact Yarn-
Ne 20/1 to Ne 80/1
Double Yarn-Ring Double-Carded-
Ne 20/2 to Ne 80/2 & Combed-Ne 20/2 to Ne 80/2 TFO
Gassed Yarn-combed-
Ne 40/2, Ne 60/2. Ne 70/2, Ne 80/2
Open End-10’s
Outlines of the code:
The code has been divided into four sections .the first, relates to the
board’s structure and procedure and its duties. The second section deals with the
role of outside directors and independent directors, i.e. these who are free from
any business or other relations with the company which could materially
interfere with 5the exercise of their Independent Judgment. The third covers the
executive directors their remuneration and important questions of financial
reporting and financial control such as effectiveness of the Internal Control.
THEORETICAL BACKGROUND
Motivation is one of the most important factors affecting human behavior.
Motivation not only affects other cognitive factors like perception and
learning but also affects the total performance of on individual in
organization setting. This is the reason why managers Attach great
importance to motivation in the organization. In fact, likert has called
motivation as the core of management.
Definition:
Scott:
“Motivation means a process of stimulating people to action to accomplish
desired goals”.
Fred luthons: “Motivation is a process that starts with a
physiological or psychological efficiency or need that activates behaviors or drive
that is aimed at a goal or incentive”.
Flippo: “Motivation is the process of attempting to influence others
to do you will through the possibilities of gain reward”.
Meaning:
Motivating originally comes from the Latin word mover, which means to
move. It is derived from the word motive. Motivation refers to goal directed
behavior.
Nature of motivation:

1. A social animal (a man) has number of wants so motivation is an unending
process.
2. Effective performance requires proper motivation; proper motivation is
possible only through proper analysis of the psychology of workers.
3. An individual is motivated full and not partly because motivation is related
to psychology.
4. Motivation can be done through financial and non-financial way.
5. If a man does not have his basic need satisfied, he may be frustrated and
he can never be motivated.
6. The management ide4ntify the goals of individual and it can persuade
them to work by directions.
7. The person’s self image plays an important role in motivation.
8. Motivation can be positive or negative.
9. and job satisfaction are different:
a. Motivations are goal oriented.
b. A Job satisfaction is out come of job.
Importance of motivation:
1. Maximum utilization of factors of production.
2. Motivation creates willingness to work.
3. Schemes like financial incentives reduce absenteeism.
4. Motivation has both financial and non-financial incentive schemes which
reduce labour turnover.
5. Motivational factors not only retain the existing employees also attract the
availability of right person from outside.
6. Motivation builds good labour relations.
7. It increases the efficiency and output.
8. Motivation scheme promotes closer rapport between enterprise and
workers this leads to sense of belonging.
9. Efficiency and output are increased through co-operation which is
obtained from motivation.
10. Organizational goals are achieved quickly through motivation.
11. Motivation helps in improvement upon skills and knowledge.
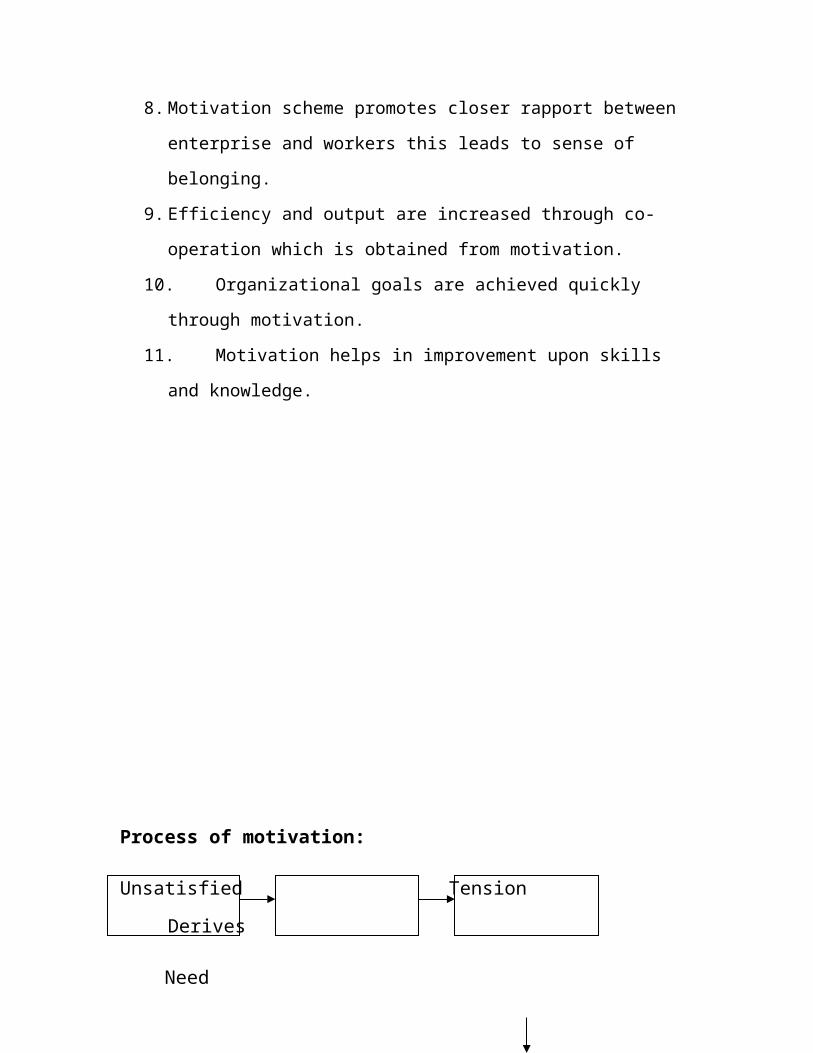
Process of motivation:
Unsatisfied Tension Derives
Need
Search
Behavior
Satisfied
Behavior
Reduction of
Tension
An unsatisfied need creates tension that stimulates drives within the individual.
These drives generate a search behavior to find particular goals that if attained,
will satisfy the need and lead to the reduction of tension.
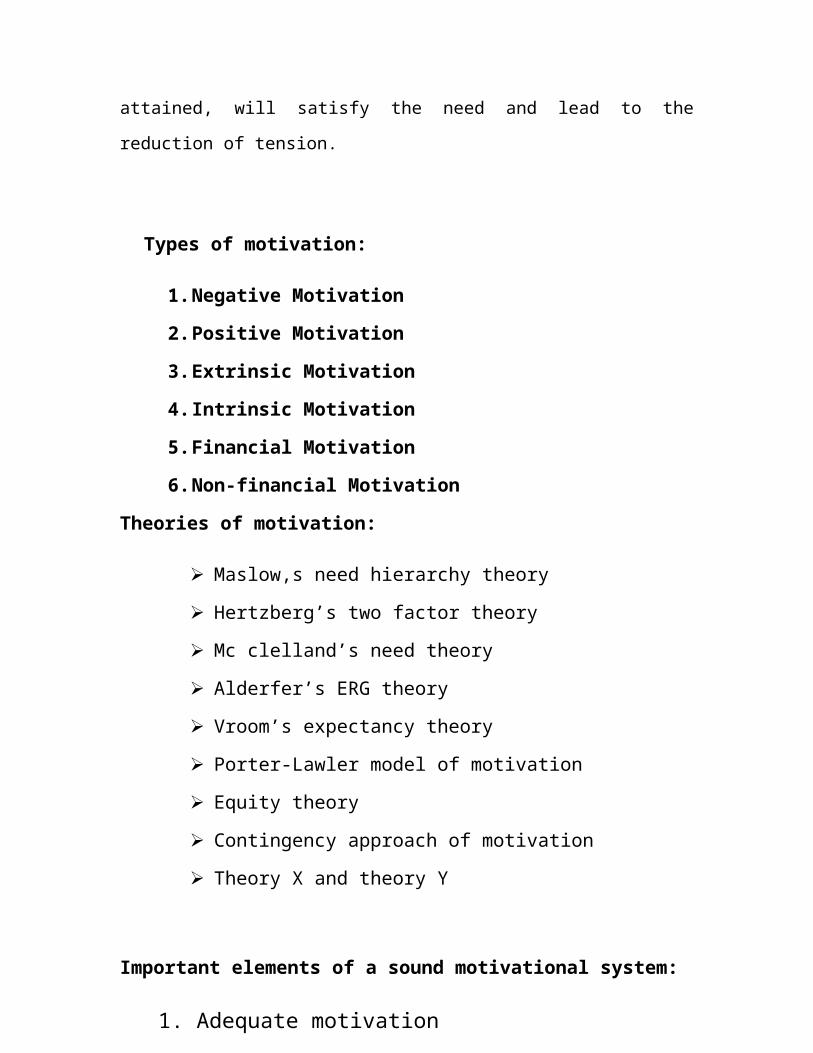
Types of motivation:
1. Negative Motivation
2. Positive Motivation
3. Extrinsic Motivation
4. Intrinsic Motivation
5. Financial Motivation
6. Non-financial Motivation
Theories of motivation:
Maslow,s need hierarchy theory
Hertzberg’s two factor theory
Mc clelland’s need theory
Alderfer’s ERG theory
Vroom’s expectancy theory
Porter-Lawler model of motivation
Equity theory
Contingency approach of motivation
Theory X and theory Y
Important elements of a sound motivational system:
1. Adequate motivation
2. Analysis of motivation
3. Simplicity in motivation system
4. Uneven motivation
CHAPTER –II
INTRODUCTION TO THE STUDY

TITLE OF THE STUDY
A study on effectiveness of employee motivational techniques with
special reference to kandagiri spinning mills ltd, unit –I, Udayapatti, Salem.
OBJECTIVES OF THE STUDY
1. To find out the awareness about the motivational techniques.
2. To find out the existing motivational techniques in the organisation.
3. To ascertain the impact of motivational techniques with performance of employees.
4. To find out the level of satisfaction regarding the motivational techniques.
5. To find out the problems with motivational techniques and suggest solutions
for it.
SCOPE OF THE STUDY
The study helps the management to evaluate the existing motivational techniques.
The study helps the respondent to convey the feelings regarding motivational
techniques to the management.
It also helps the society in general regarding the determinates of motivation to people
at work.
The study helps the researcher to find out the best motivational techniques and to apply
the management concepts effectively.
It will be also helpful to those who using to make a research on this topic as a good
reference.
LIMITATIONS OF THE STUDY
The project was conducted only among the employees.
The study was spread over a period of 50 days.
The respondent may be biased while answering the questions. so, the sample result
cannot be applied to the population in whole
The drawbacks of the statistical tools used in the study applies to the study also.
CHAPTER – III
RESEARCH METHODOLOGY

Research methodology describes the overall information about that how the study is to
be conducted.
GEOGRAPHICAL AREA COVERED
The study has been conducted in Salem city only.
PERIOD OF STUDY
The duration of the study is from December 2008 to February 2009.
RESEARCH DESIGN
The research design is a structured plan prepared before undertaking the experiment.
The design will explain the manner in which research is done. Descriptive design is used in this
study.
DESCRIPTIVE RESEARCH DESIGN
In a descriptive study an accurate description of a situation on an association between
variables will be emphasized. It determines who, what, where and how of a topic, descriptive
study may employ any of all the methods of the data collection as interview questionnaire,
observations etc…
SAMPLING DESIGN
Sampling is an essential part of all scientific procedures. Before deciding the method of
data collection of data, the researcher has to decide whether he want to collect data from every
hit of the universe or whether he will use only a portion of the universe.
POPULATION
The population selected for the study is the existing 250 employees of organisation.
SAMPLE UNIT
The sample unit are the existing employees of the organisation.
SAMPLE SIZE
The sample size of the project is 120 respondents.
SAMPLING PROCEDURE / METHODS
Sample procedure indicates how the sample is selected from the universe. The
researcher has adopted the non-probability sampling convenience methods. In this sampling the
choice of the sample is left completely to the convenience of the interviewer.
RESEARCH INSTRUMENT
A questionnaire cum interview schedule method was used to collect the data
METHOD OF DATA COLLECTION
PRIMARY DATA
Primary data are the data, which is collected freshly or newly for a reticular pear pose.
Here the data is collected freshly from the customers using questionnaire methods.
SECONDARY DATA
A data, which has been governed earlier for some other purpose, are the secondary
data. The researcher has used secondary data from the following sources.
1. Books and magazines.
2. Company profile & website.
RESEARCH INSTRUMENT
1. MULTIPLE CHOICE QUESTIONS
It is very easy and convenient for the respondents to answer. It offers three or
more choices.
2. DICHOTOMOUS QUESTIONS
Here the respondents have to choose between two clear-cut alternatives like yes or
no.
3.RATING METHOD QUESTIONS
Here the respondents have to rate the questions as per their
opinion regarding that particular question.
TOOLS FOR ANALYSIS
The analysis for the study is done on the basis of the data collection through a
questionnaire. The data collected were in the form of questionnaire nature. For abstracting the
meaningful information from the data collected from the following tools were used.
1. Simple percentage method.
2. Bar diagram.
3. Chi-square test.
4. Anova table.
1. SIMPLE PERCENTAGE METHOD
One of the tools used for analyzing the data is percentage method. Percentage refers to a
special kind of ration, which is used to describe the relationship percentage reduces everything
to a common base and there by allows meaningful comparison to be made.
Number of respondents.
Percentage = ---------------------------------- X 100
Total number of respondents.
2. BAR DIAGRAM:
Using bar chart the collected data are clearly plotted and
Well defined.
3. CHI-SQUARE TEST
Chi-square test (Pronounced as Chi- square) is one of the simplest and most widely used
statistical tool. The symbol χ2 is the Greek letter chi. the test was first used by Karl Pearson in
the year 1990.the quality chi-square describes the magnitude of the discrepancy between
theory and observation.
The χ2 is thus calculated as follows
Σ (Oi – Ei) ²
χ2 = ------------------- ~ (R-1) (c-1)
Ei
Oi = observed frequency
Ei = Expected frequency
R = Row
C = Column
The χ2 test has the following steps
1)State the null hypothesis and calculate the numbers in each category.
2)Determine the level of significance the researcher is prepared to take.
3)Calculate chi-square by using the formula.
4)Find the critical value of χ2 against the number of degrees of freedom for the specified
level of significance.
5) Compare the calculated value of χ2 with the tabulated value and determine the region
of reflection.
4. ANOVA TABLE
The analysis of variance frequently referred by ANOVA. It is specially designed to determine whether the means of more than two quantitative populations are equal. ANOVA was developed by R.A.Fisher in 1920’s.
TECHNIQUES OF ONE WAY CLASSIFICATION
(The data are classified according to only one criterion)
Ho: µ1 = µ2 = µ3 …………..= µ
H1: µ1 ‘‘‘µ2 ……. ‘‘‘µқ all the means are not equal.
1. Calculate variance between the samples
The variance between the samples measures is the differences between the samples mean of each group and the overall mean weighted by the number of observations in each group.
2. Calculate variance within the samples
The variance within the samples measures those inter-samples difference due to chance only. It is denoted by SSE. The variance within the samples measures variability around the means o each group. since the variability is not affected by group of differences it can be considered a measure of the random variation of values within a group.
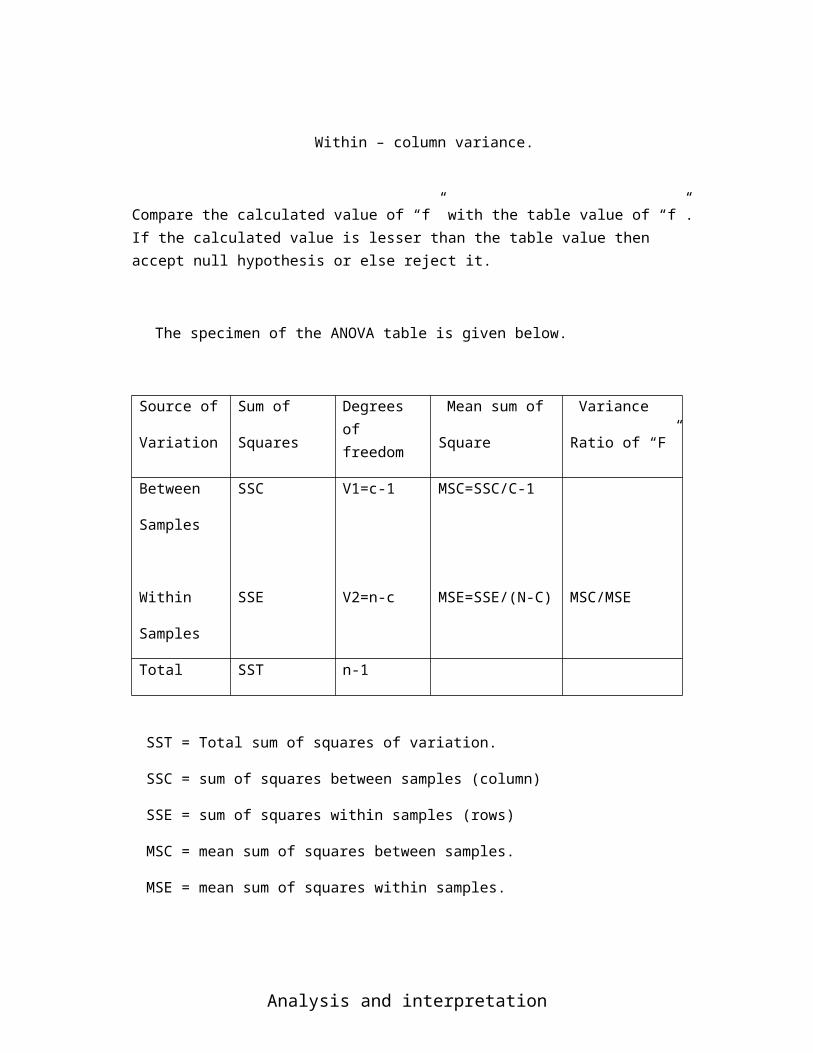
3. Calculate the ‘f’ ratio
Between – column variance
f = ________________________
Within – column variance.
Compare the calculated value of “f” with the table value of “f”. If the calculated value is lesser than the table value then accept null hypothesis or else reject it.
The specimen of the ANOVA table is given below.
Source of
Variation
Sum of
Squares
Degrees of freedom
Mean sum of
Square
Variance
Ratio of “F”
Between
Samples
Within
Samples
SSC
SSE
V1=c-1
V2=n-c
MSC=SSC/C-1
MSE=SSE/(N-C) MSC/MSE
Total SST n-1
SST = Total sum of squares of variation.
SSC = sum of squares between samples (column)
SSE = sum of squares within samples (rows)
MSC = mean sum of squares between samples.
MSE = mean sum of squares within samples.
Analysis and interpretation
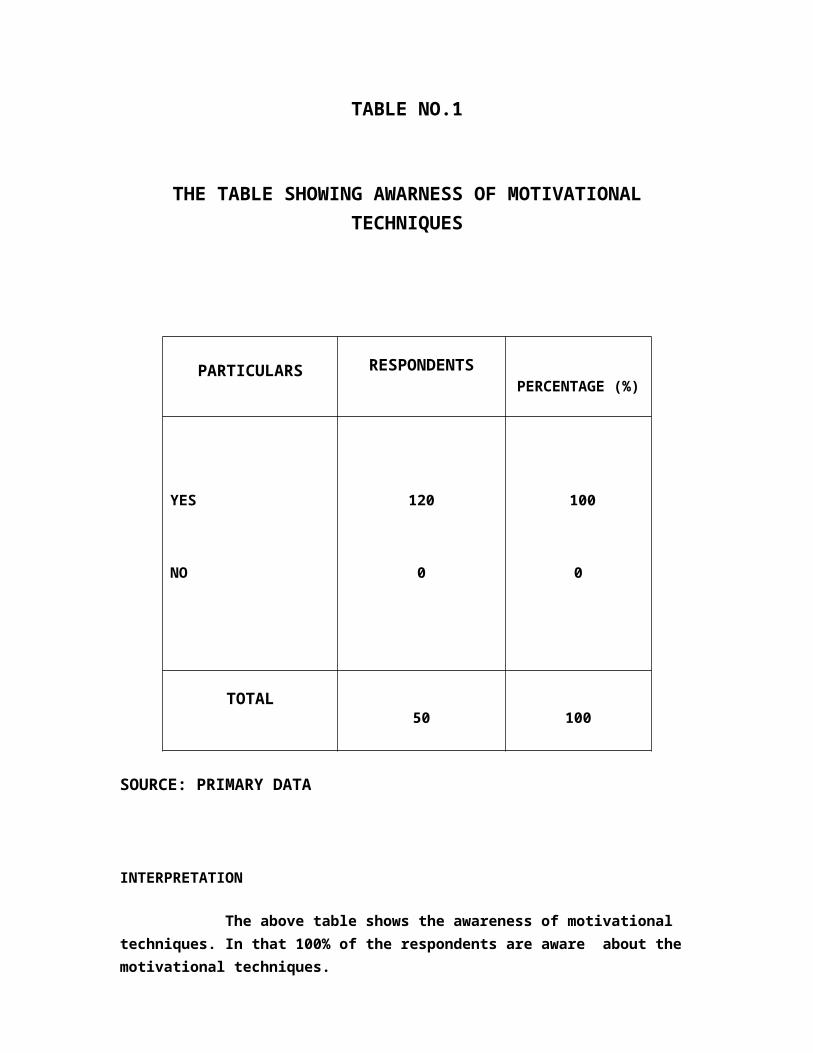
TABLE NO.1
THE TABLE SHOWING AWARNESS OF MOTIVATIONAL TECHNIQUES
PARTICULARS RESPONDENTSPERCENTAGE (%)
YES
NO
120
0
100
0
TOTAL50 100
SOURCE: PRIMARY DATA
INTERPRETATION
The above table shows the awareness of motivational techniques. In that 100% of the respondents are aware about the motivational techniques.
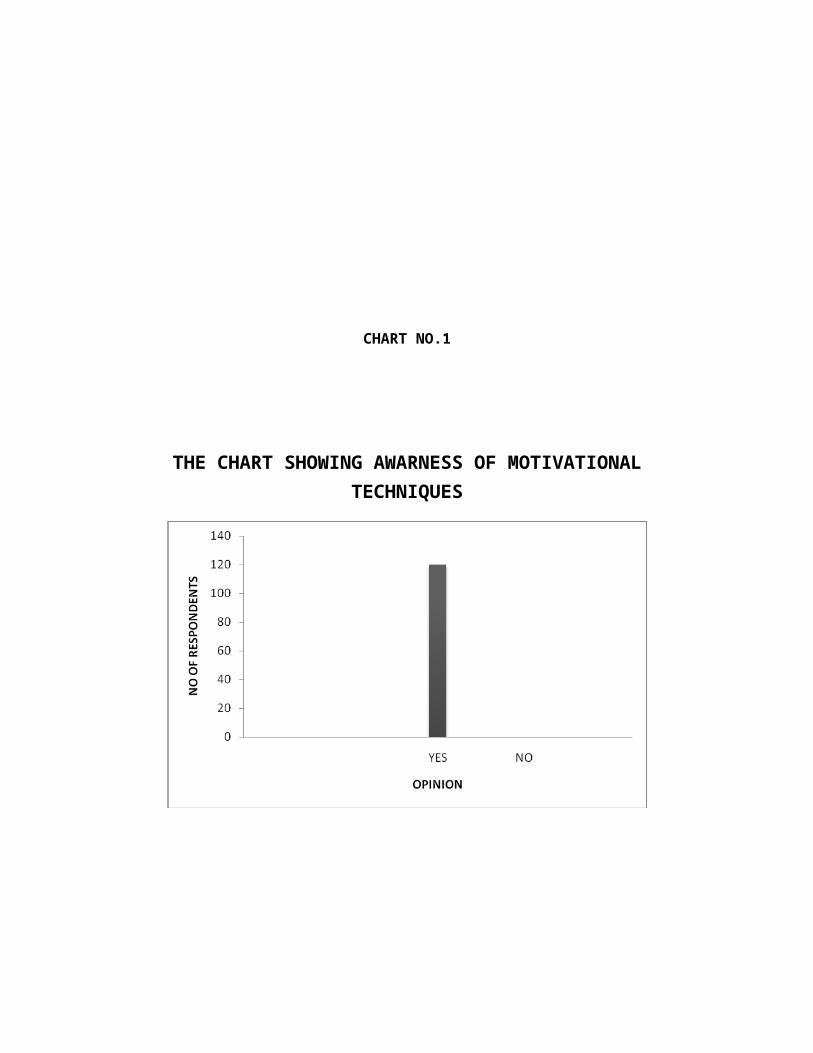
CHART NO.1
THE CHART SHOWING AWARNESS OF MOTIVATIONAL TECHNIQUES
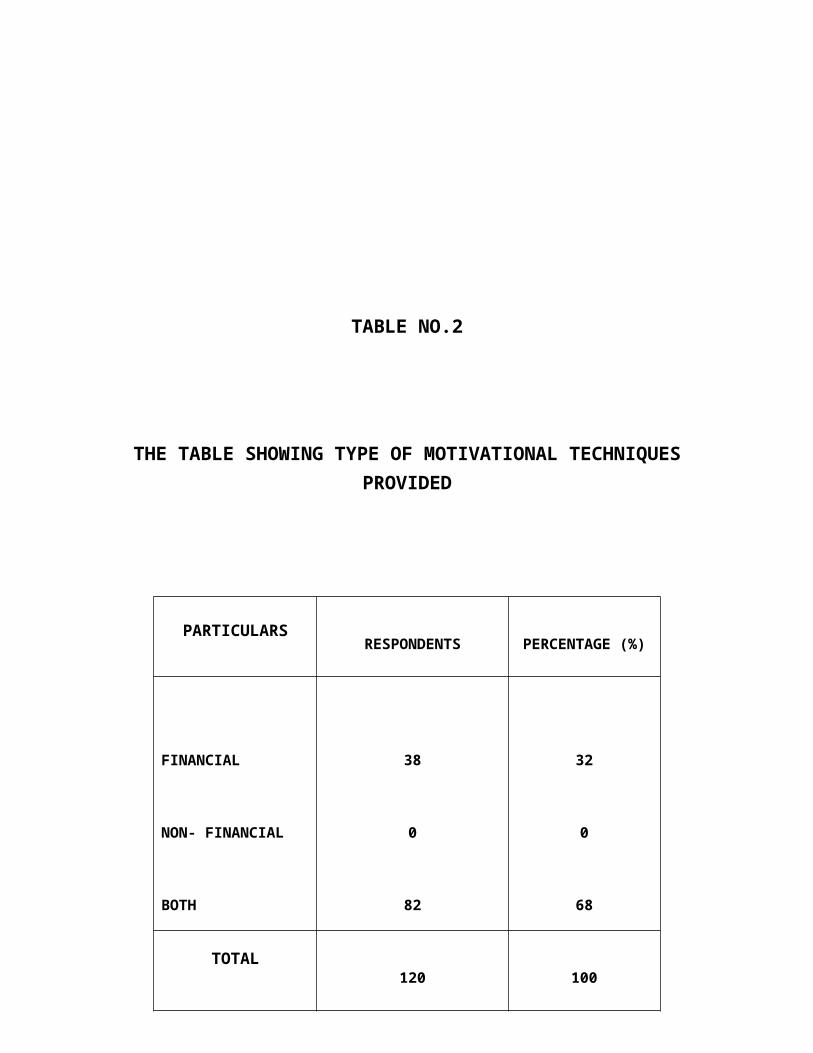
TABLE NO.2
THE TABLE SHOWING TYPE OF MOTIVATIONAL TECHNIQUES PROVIDED
PARTICULARSRESPONDENTS PERCENTAGE (%)
FINANCIAL
NON- FINANCIAL
BOTH
38
0
82
32
0
68
TOTAL120 100
SOURCE: PRIMARY DATA
INTERPRETATION
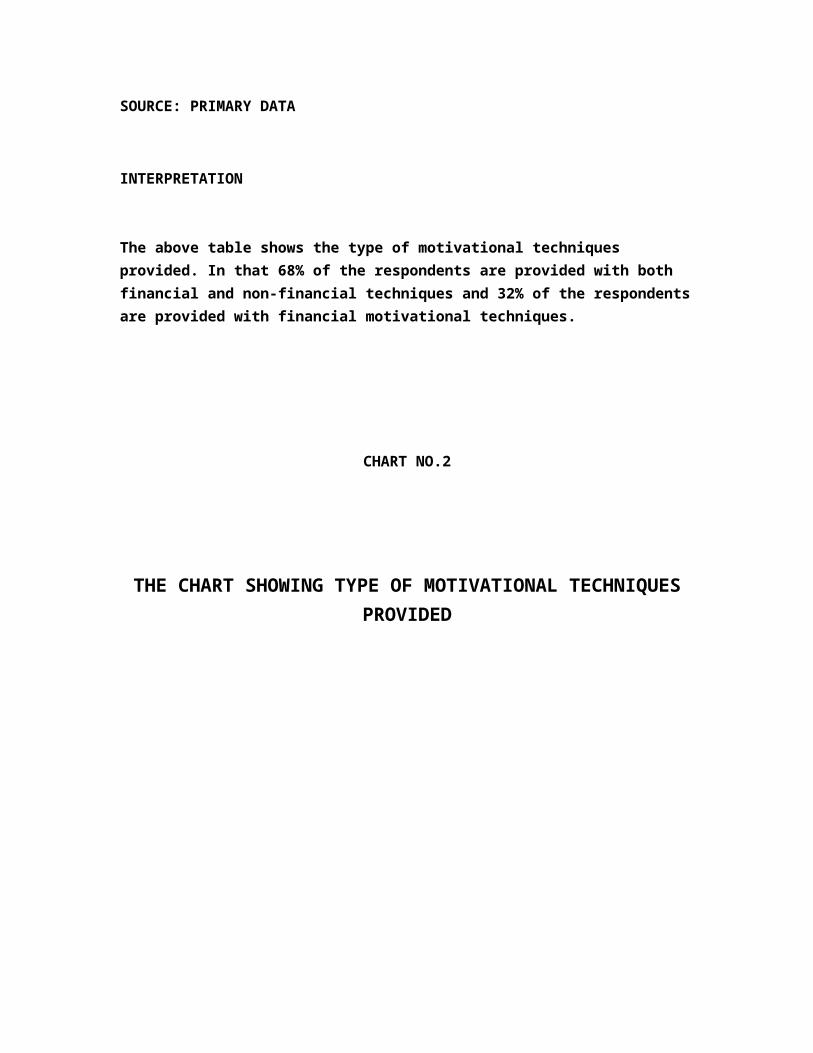
The above table shows the type of motivational techniques provided. In that 68% of the respondents are provided with both financial and non-financial techniques and 32% of the respondents are provided with financial motivational techniques.
CHART NO.2
THE CHART SHOWING TYPE OF MOTIVATIONAL TECHNIQUES PROVIDED
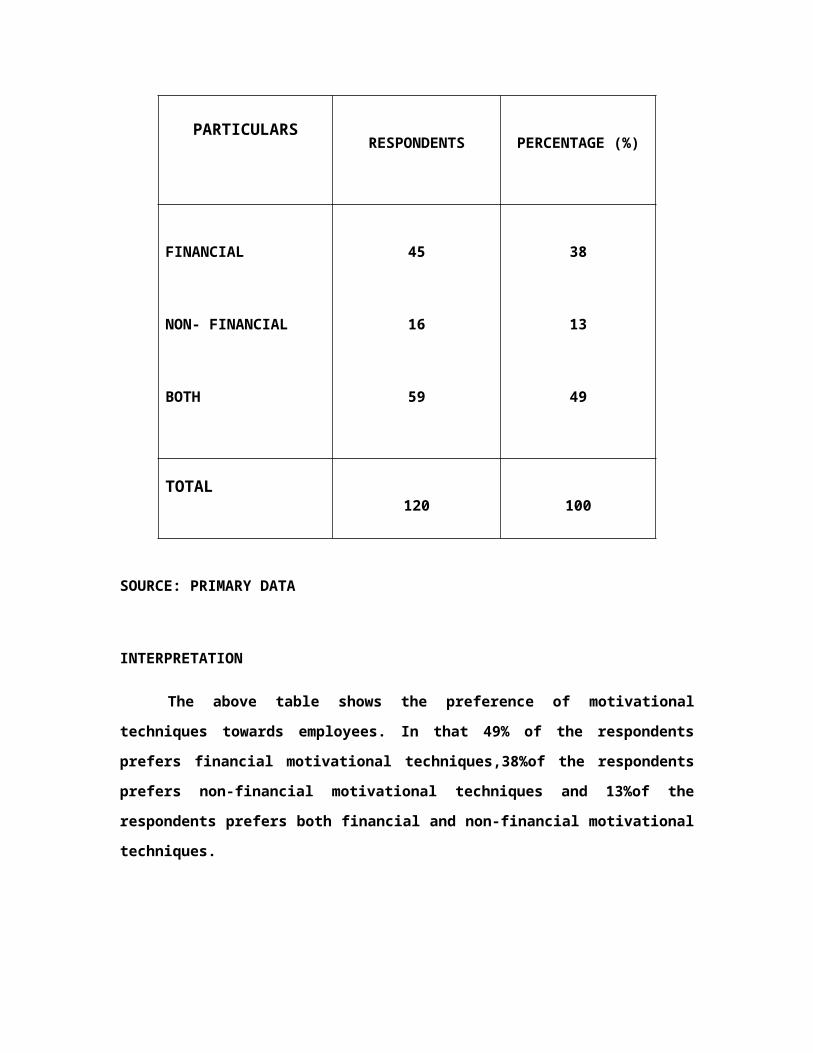
TABLE NO. 3
THE TABLE SHOWING PREFERENCE OF MOTIVATIONAL TECHNIQUES TOWARDS EMPLOYEES
PARTICULARSRESPONDENTS PERCENTAGE (%)
FINANCIAL
NON- FINANCIAL
BOTH
45
16
59
38
13
49
TOTAL120 100
SOURCE: PRIMARY DATA
INTERPRETATION
The above table shows the preference of motivational techniques towards employees.
In that 49% of the respondents prefers financial motivational techniques,38%of the
respondents prefers non-financial motivational techniques and 13%of the respondents prefers
both financial and non-financial motivational techniques.
CHART NO.3
THE CHART SHOWING PREFERENCE OF MOTIVATIONAL TECHNIQUES TOWARDS EMPLOYEES
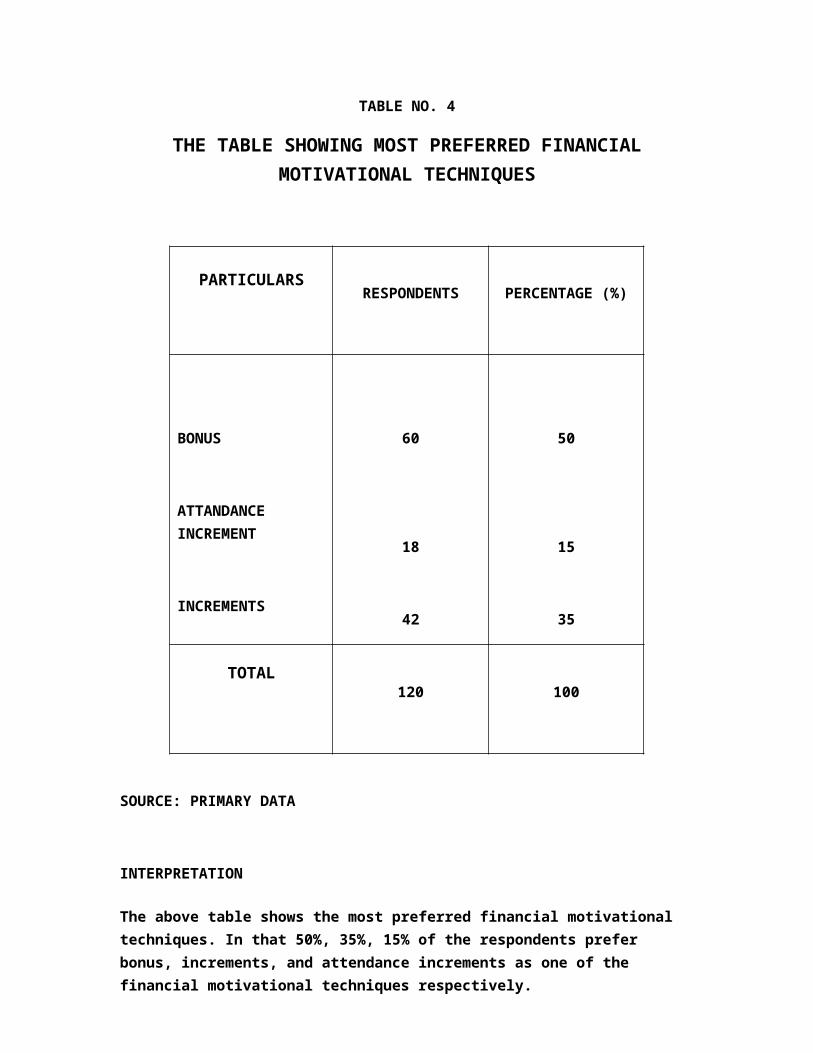
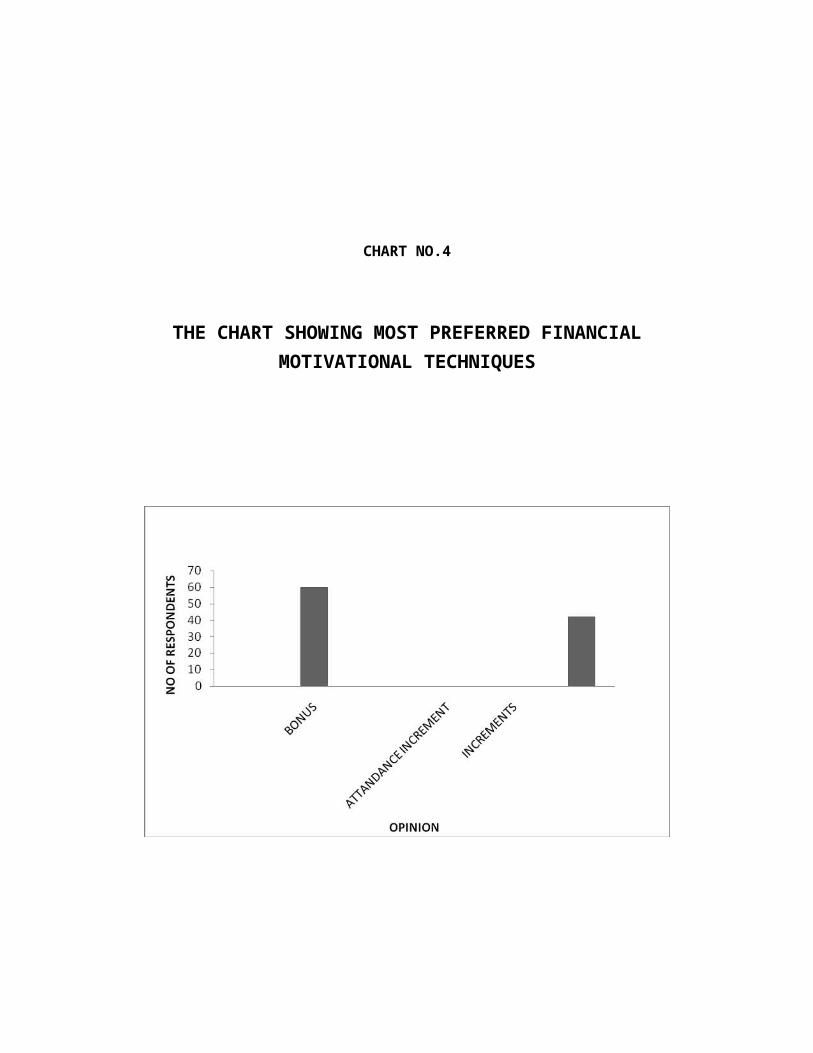
TABLE NO. 4
THE TABLE SHOWING MOST PREFERRED FINANCIAL MOTIVATIONAL TECHNIQUES

PARTICULARSRESPONDENTS PERCENTAGE (%)
BONUS
ATTANDANCE INCREMENT
INCREMENTS
60
18
42
50
15
35
TOTAL120 100
SOURCE: PRIMARY DATA
INTERPRETATION
The above table shows the most preferred financial motivational techniques. In that 50%, 35%, 15% of the respondents prefer bonus, increments, and attendance increments as one of the financial motivational techniques respectively.
CHART NO.4
THE CHART SHOWING MOST PREFERRED FINANCIAL MOTIVATIONAL TECHNIQUES
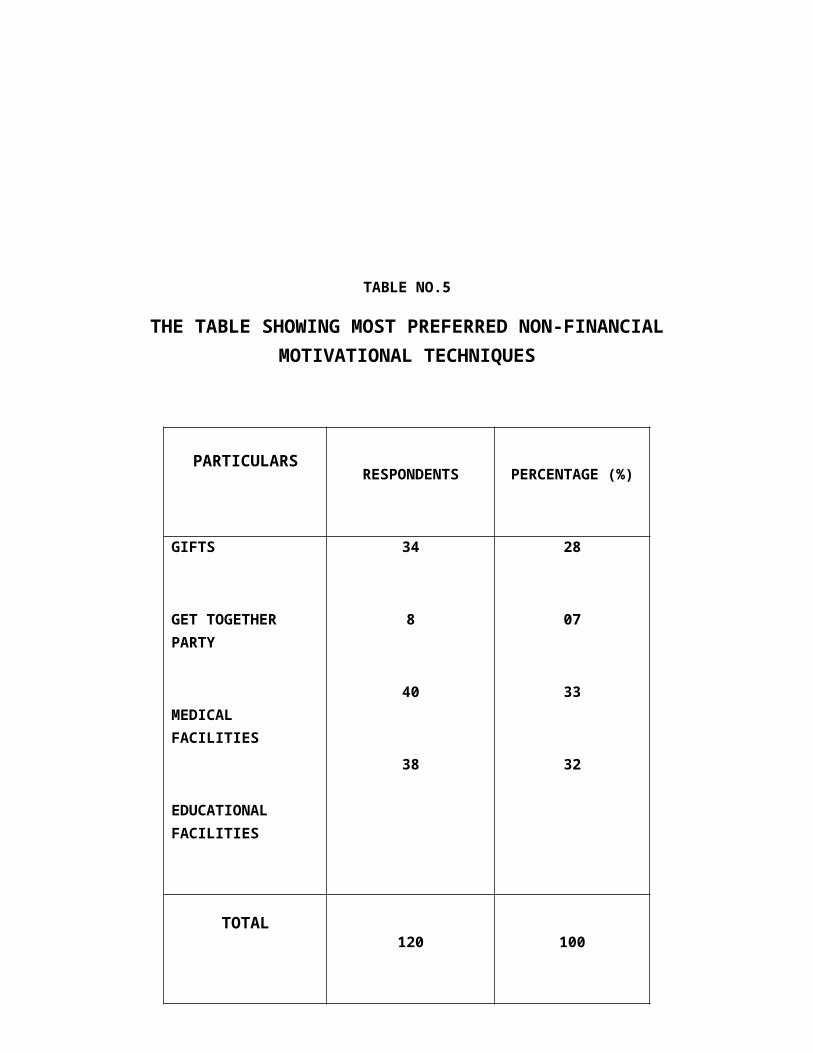
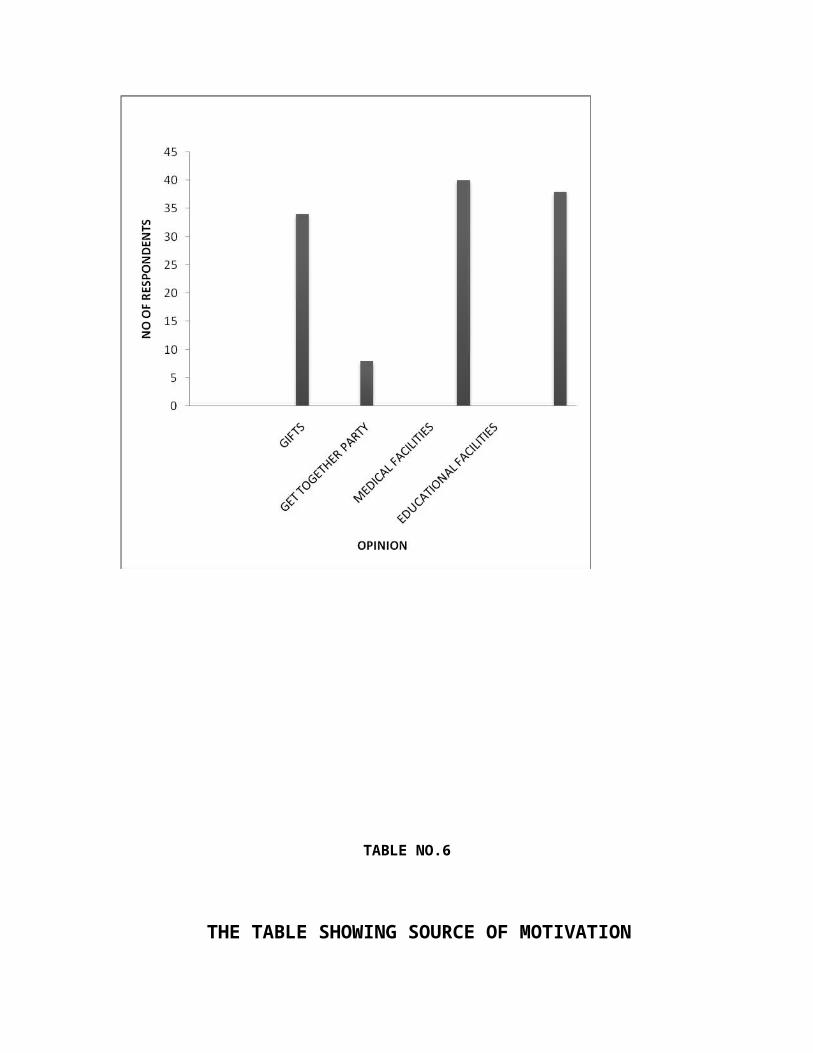
TABLE NO.5
THE TABLE SHOWING MOST PREFERRED NON-FINANCIAL MOTIVATIONAL TECHNIQUES
PARTICULARSRESPONDENTS PERCENTAGE (%)
GIFTS
GET TOGETHER PARTY
MEDICAL FACILITIES
EDUCATIONAL FACILITIES
34
8
40
38
28
07
33
32
TOTAL120 100
SOURCE: PRIMARY DATA
INTERPRETATION
The above table shows the most preferred non-financial motivational techniques. In that 33%, 32%, 28%, 07% of the respondents prefer medical facilities, educational facilities, gifts, get together party as one of the non-financial motivational techniques respectively.
CHART NO.5
THE CHART SHOWING MOST PREFERRED NON-FINANCIAL MOTIVATIONAL TECHNIQUES
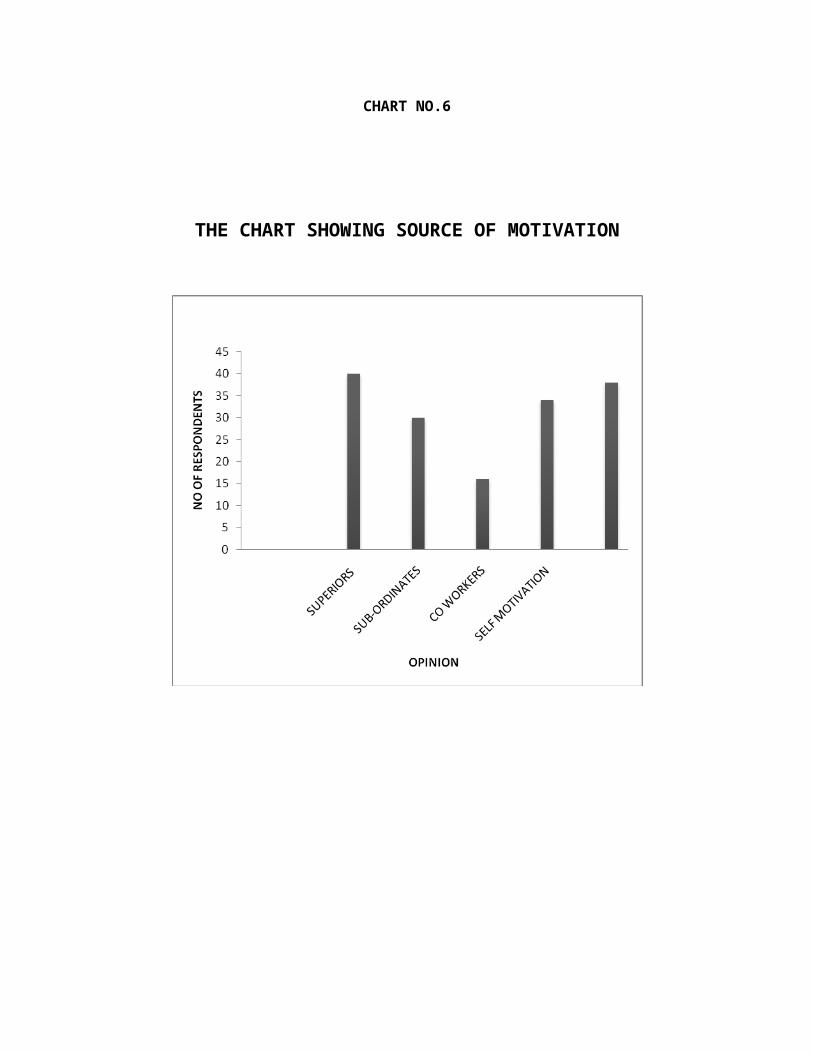
TABLE NO.6
THE TABLE SHOWING SOURCE OF MOTIVATION
PARTICULARSRESPONDENTS PERCENTAGE (%)
SUPERIORS
SUB-ORDINATES
CO WORKERS
SELF MOTIVATION
40
30
16
34
33
25
14
28
TOTAL120 100
SOURCE: PRIMARY DATA
INTERPRETATION
The above table shows the source o motivation. In that 33%, 28%, 25%, 14% of the
respondents are motivated by the superiors, self motivation, sub-ordinates, and co workers
respectively.
CHART NO.6
THE CHART SHOWING SOURCE OF MOTIVATION
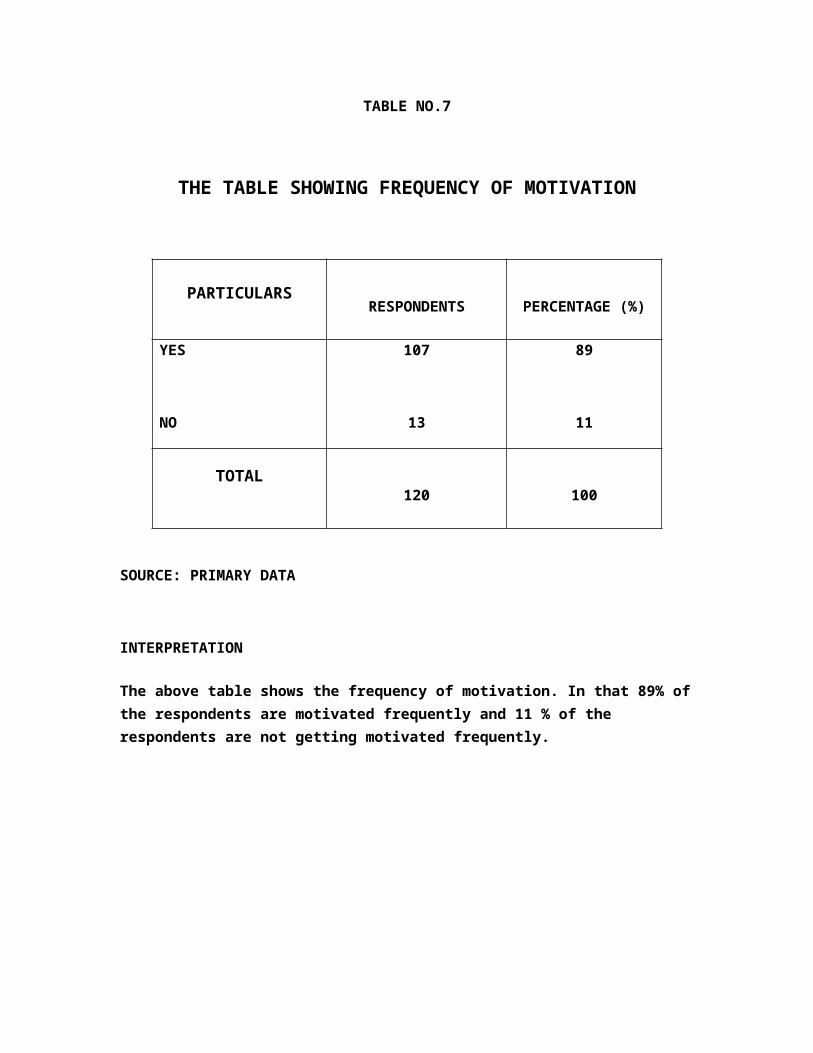
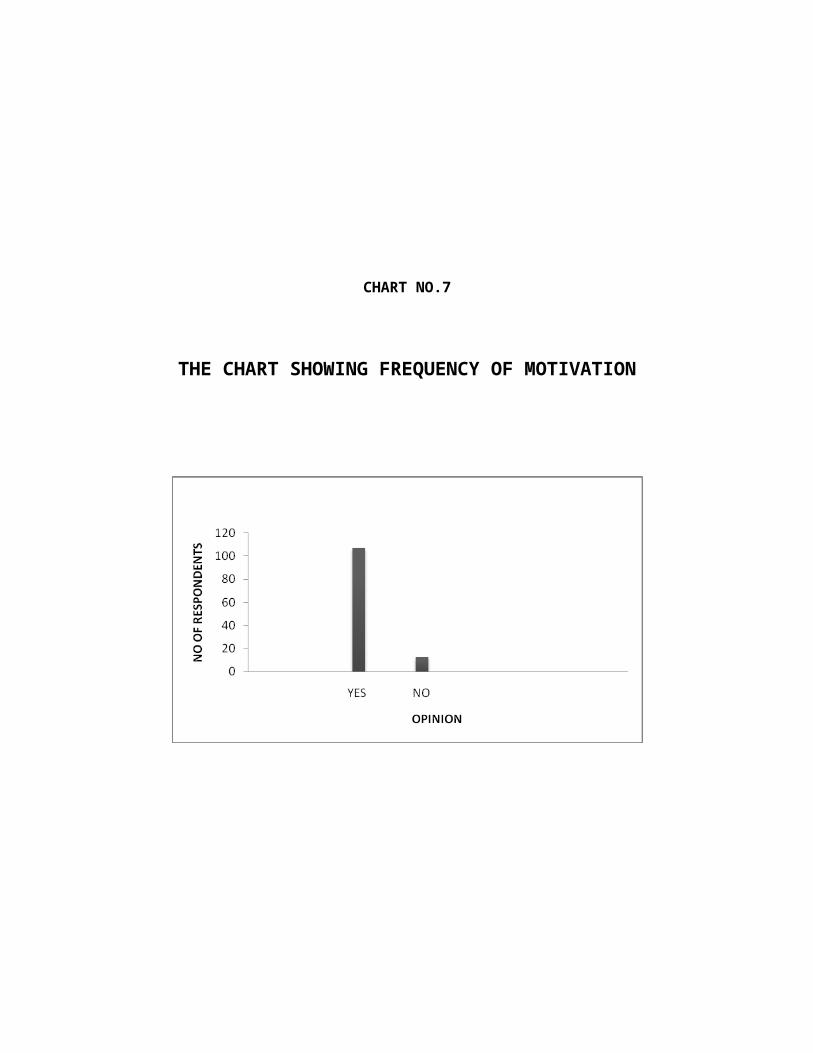
TABLE NO.7
THE TABLE SHOWING FREQUENCY OF MOTIVATION
PARTICULARSRESPONDENTS PERCENTAGE (%)
YES
NO
107
13
89
11
TOTAL120 100
SOURCE: PRIMARY DATA
INTERPRETATION
The above table shows the frequency of motivation. In that 89% of the respondents are motivated frequently and 11 % of the respondents are not getting motivated frequently.
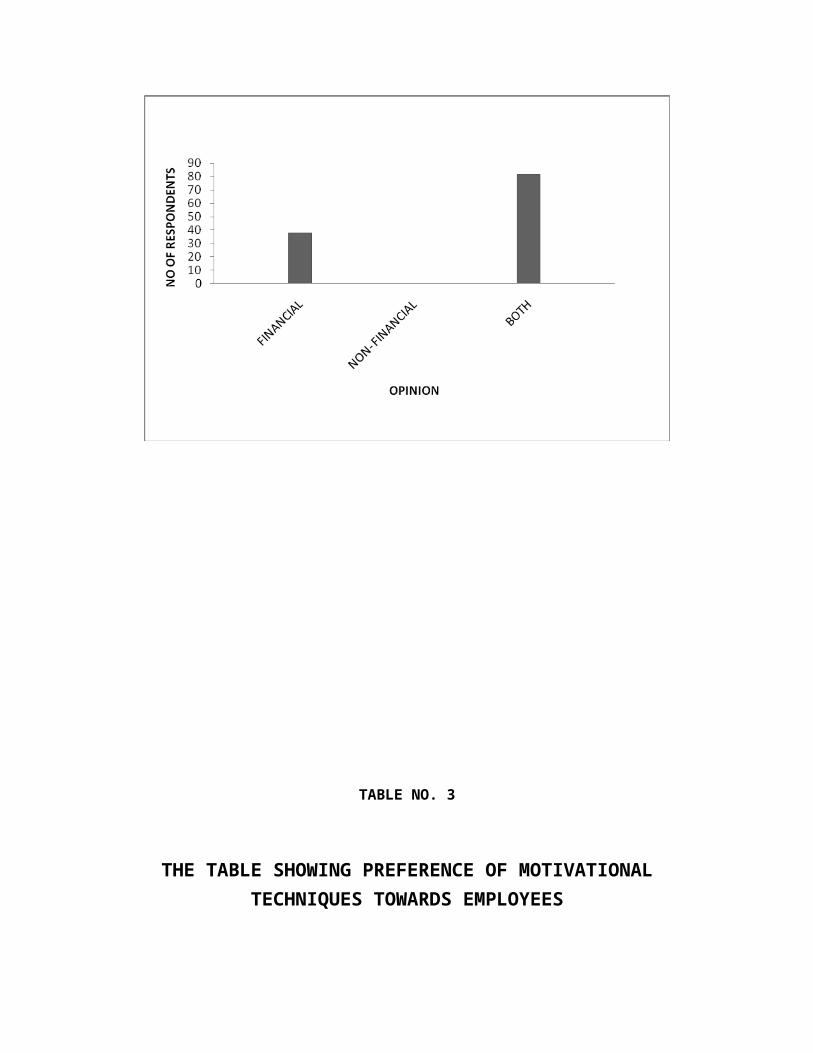
CHART NO.7
THE CHART SHOWING FREQUENCY OF MOTIVATION
TABLE NO.8
THE TABLE SHOWING EXPECTATIONS FROM THE MOTIVATIONAL TECHNIQUES
PARTICULARSRESPONDENTS PERCENTAGE (%)
FINANCIAL BENEFIT
DEVELOP THE KNOWLEDGE & SKILL
INCREASE HOPE & CONFIDENCE
56
44
20
47
37
16
TOTAL120 100
SOURCE: PRIMARY DATA
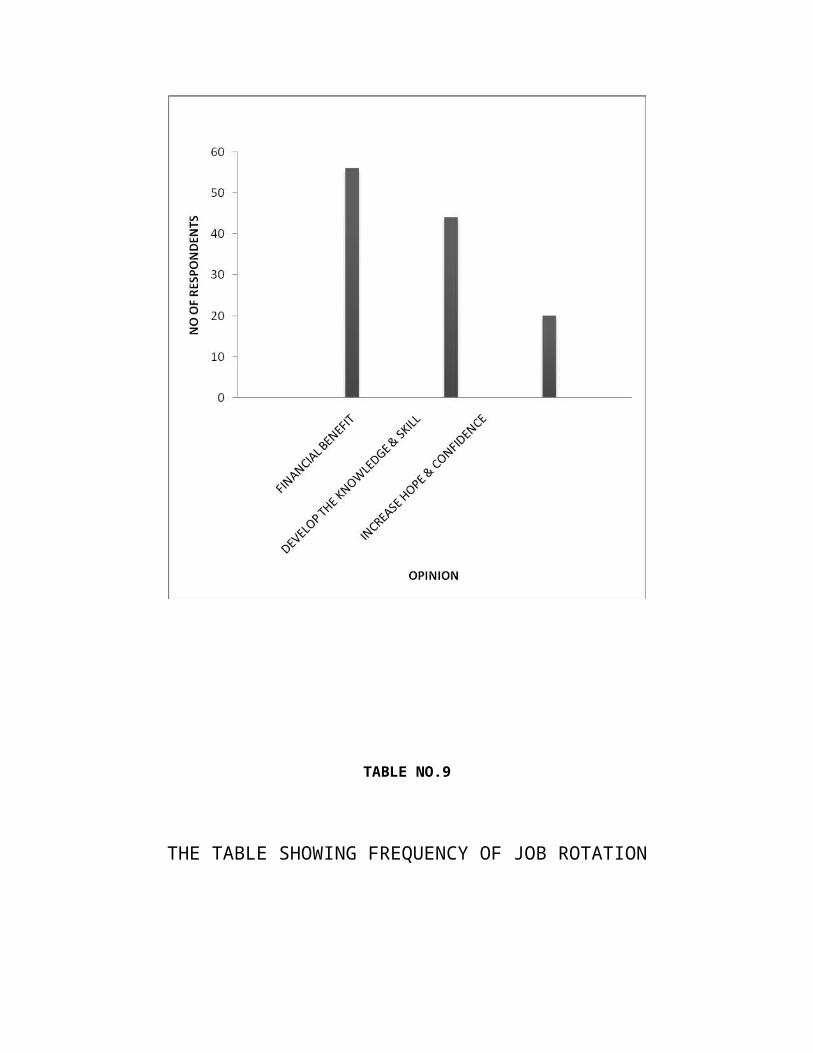
INTERPRETATION
The above table shows the expectations from motivational techniques. In that 47%, 37%, 16% o the respondents expect financial benefit, develop the knowledge and skill, increase hope & confidence respectively.
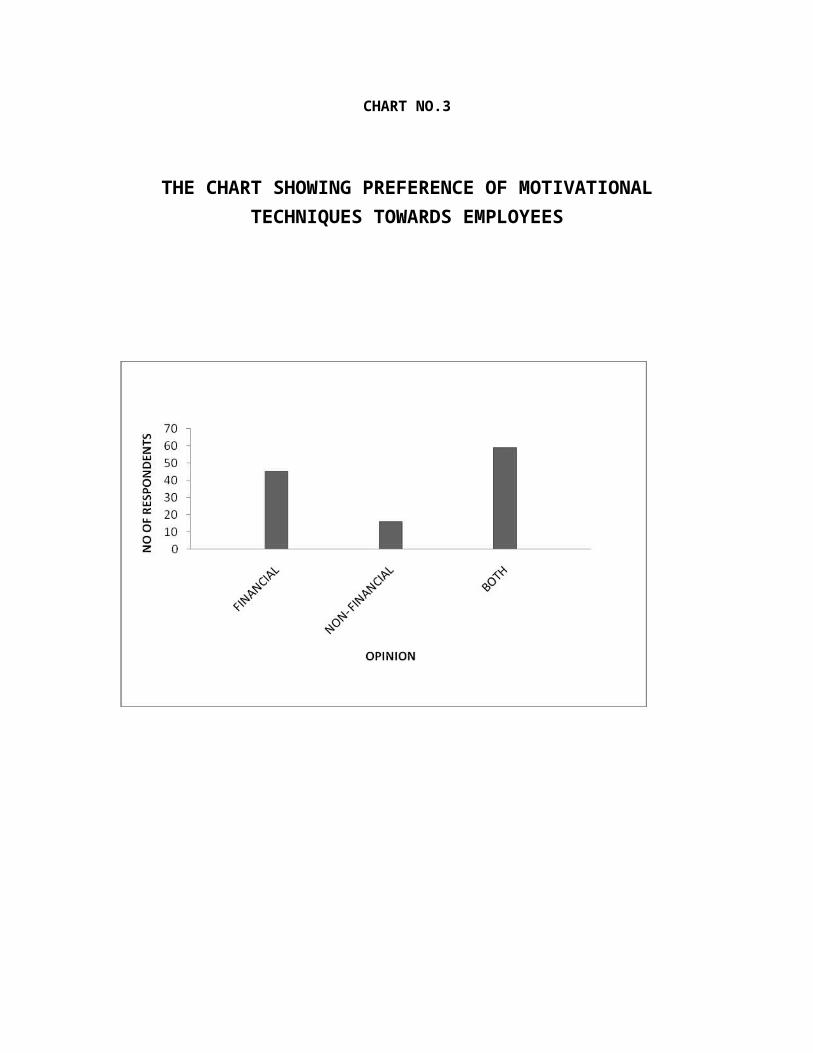
CHART NO.8
THE CHART SHOWING EXPECTATIONS FROM THE MOTIVATIONAL TECHNIQUES
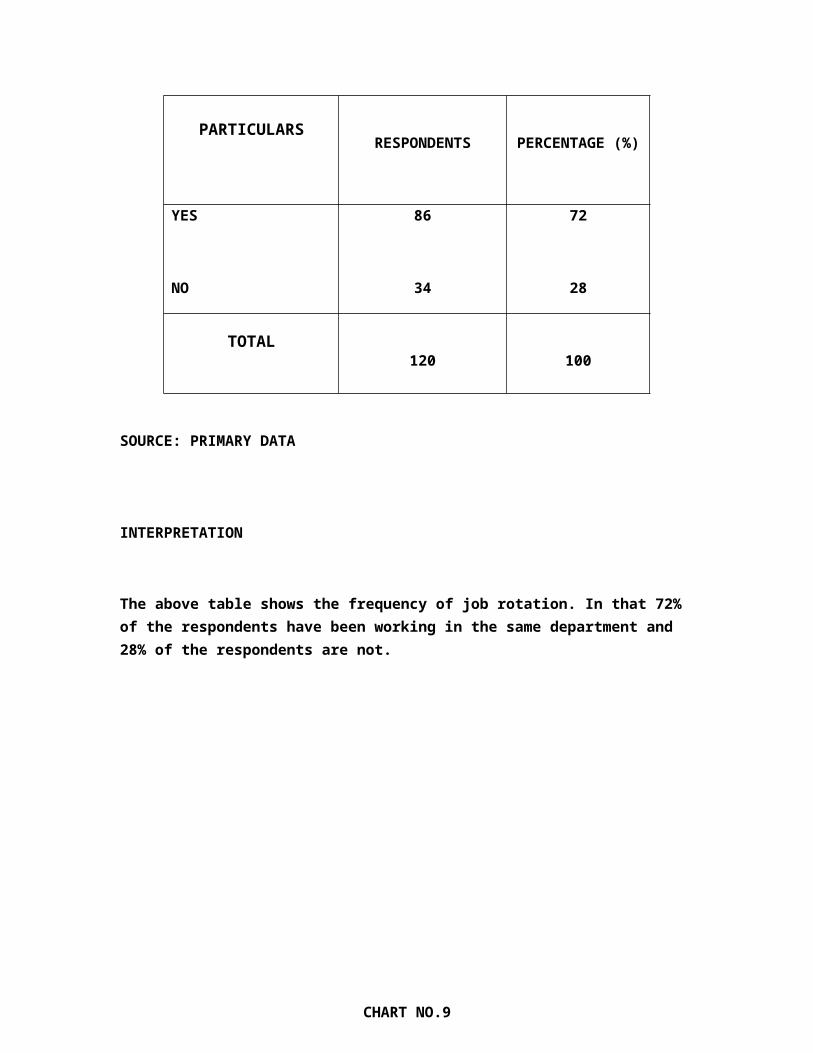
TABLE NO.9
THE TABLE SHOWING FREQUENCY OF JOB ROTATION
PARTICULARSRESPONDENTS PERCENTAGE (%)
YES
NO
86
34
72
28
TOTAL120 100
SOURCE: PRIMARY DATA
INTERPRETATION
The above table shows the frequency of job rotation. In that 72% of the respondents have been working in the same department and 28% of the respondents are not.
CHART NO.9
THE CHART SHOWING FREQUENCY OF JOB ROTATION
TABLE NO.10
THE TABLE SHOWING EMPLOYEES OPINION
TOWARDS JOB ROTATION
PARTICULARSRESPONDENTS PERCENTAGE (%)
YES
NO
36
84
30
70
TOTAL120 100
SOURCE: PRIMARY DATA
INTERPRETATION
The above table shows the employee opinion towards job rotation. In that 70% of the respondents like job rotation while 30% of the respondents are not.
CHART NO.10
THE CHART SHOWING EMPLOYEES OPINION
TOWARDS JOB ROTATION
TABLE NO.11
THE TABLE SHOWING ACCEPTANCE OF EMPLOYEES SUGGESTION BY THE MANAGEMENT
PARTICULARSRESPONDENTS PERCENTAGE (%)
YES
NO
88
32
73
27
TOTAL120 100
SOURCE: PRIMARY DATA
INTERPRETATION
The above table shows the acceptance of the employees’ suggestion by the management. In
that 73% of the respondents agree that the company accepts their suggestions while 27% of
the respondents do not.
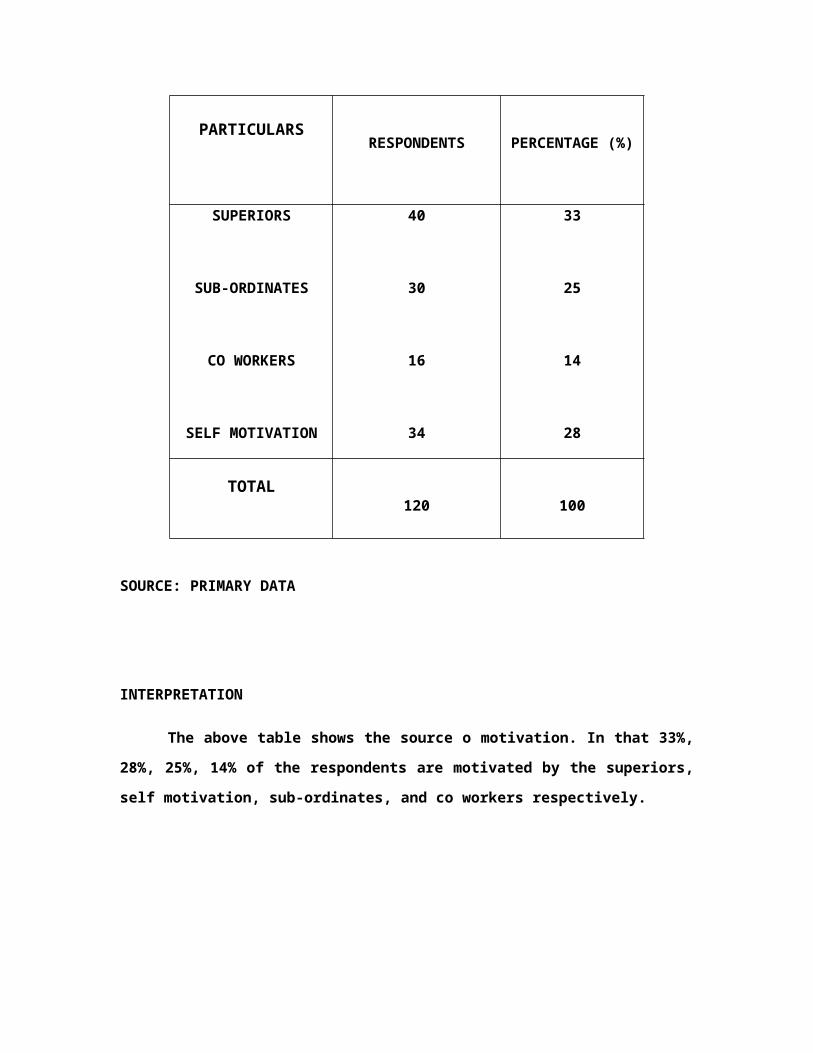
CHART NO.11
THE CHART SHOWING ACCEPTANCE OF EMPLOYEES SUGGESTION BY THE MANAGEMENT
TABLE NO.12
THE TABLE SHOWING IMPACT OF MOTIVATIONAL TECHNIQUES ON PRODUCTION
PARTICULARSRESPONDENTS PERCENTAGE (%)
YES
NO
78
42
65
35
TOTAL120 100
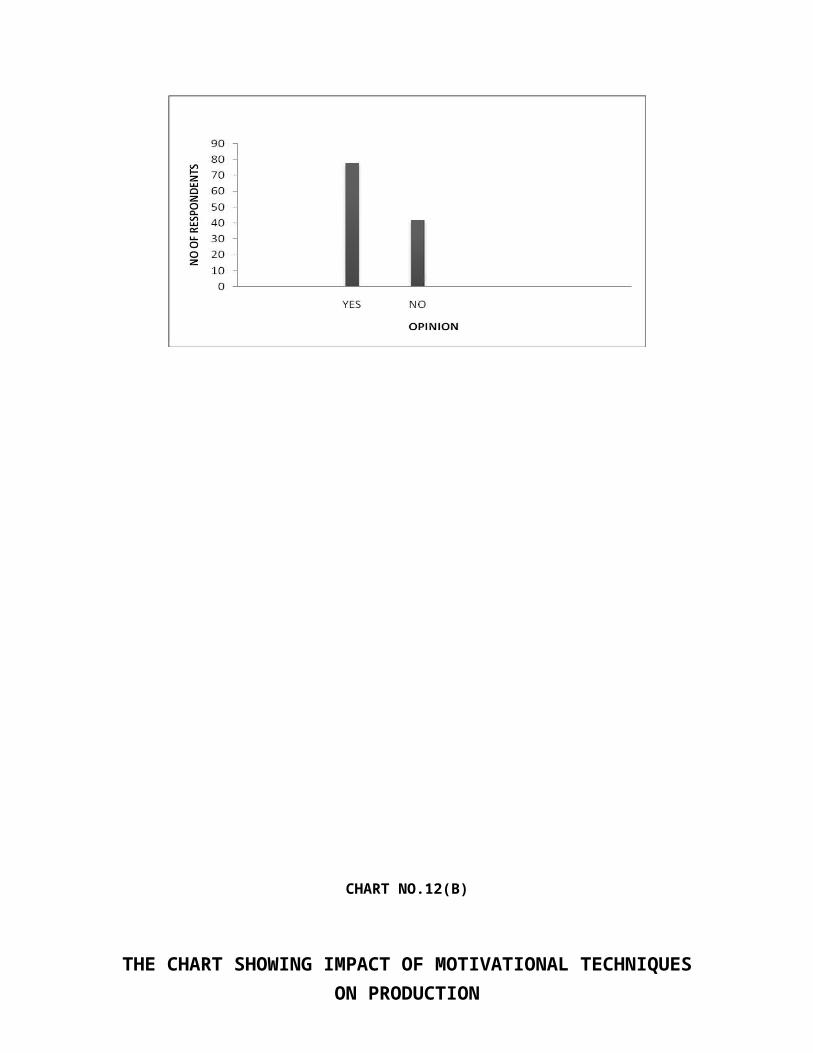
HIGH
MODERATE
LOW
32
28
18
41
36
23
TOTAL41 100
SOURCE: PRIMARY DATA
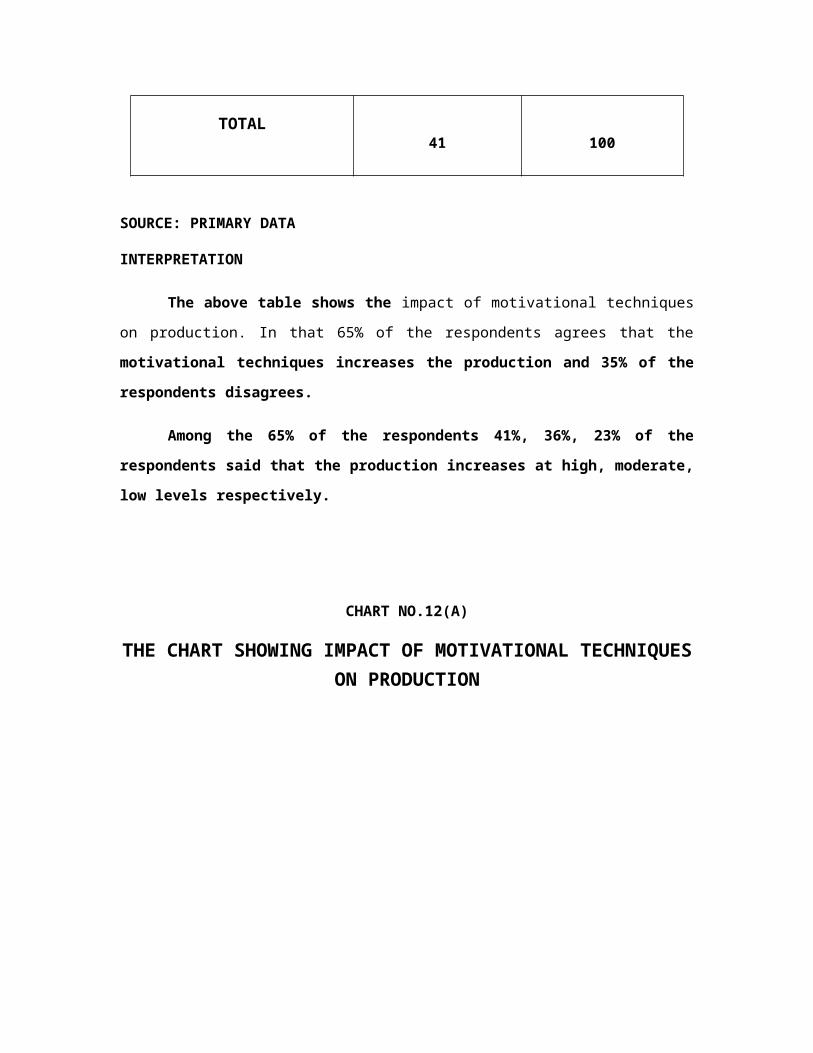
INTERPRETATION
The above table shows the impact of motivational techniques on production. In that
65% of the respondents agrees that the motivational techniques increases the production and
35% of the respondents disagrees.
Among the 65% of the respondents 41%, 36%, 23% of the respondents said that the
production increases at high, moderate, low levels respectively.
CHART NO.12(A)
THE CHART SHOWING IMPACT OF MOTIVATIONAL TECHNIQUES ON PRODUCTION
CHART NO.12(B)
THE CHART SHOWING IMPACT OF MOTIVATIONAL TECHNIQUES ON PRODUCTION
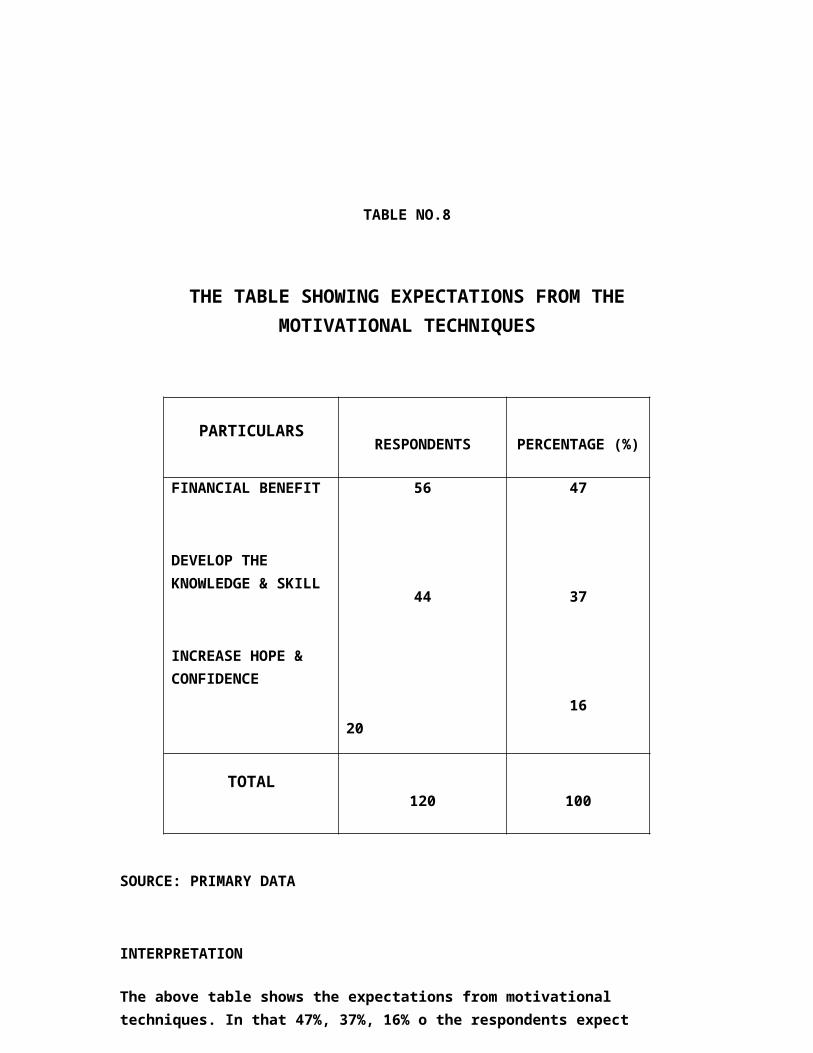
TABLE NO.13
THE TABLE SHOWING IMPACT OF MOTIVATIONAL TECHNIQUES ON JOB PERFORMANCE
PARTICULARSRESPONDENTS PERCENTAGE (%)
HIGHLY IMPROVED
MODERATELY IMPROVED
LESS IMPROVED
54
48
20
45
40
15
TOTAL120 100
SOURCE: PRIMARY DATA
INTERPRETATION
The above table shows the impact of motivational techniques on job performance. In
that 45%, 40%, 15% of the respondents agree that the performance increases at the rate of
high, moderate, less level respectively after adopting level of satisfaction toward.
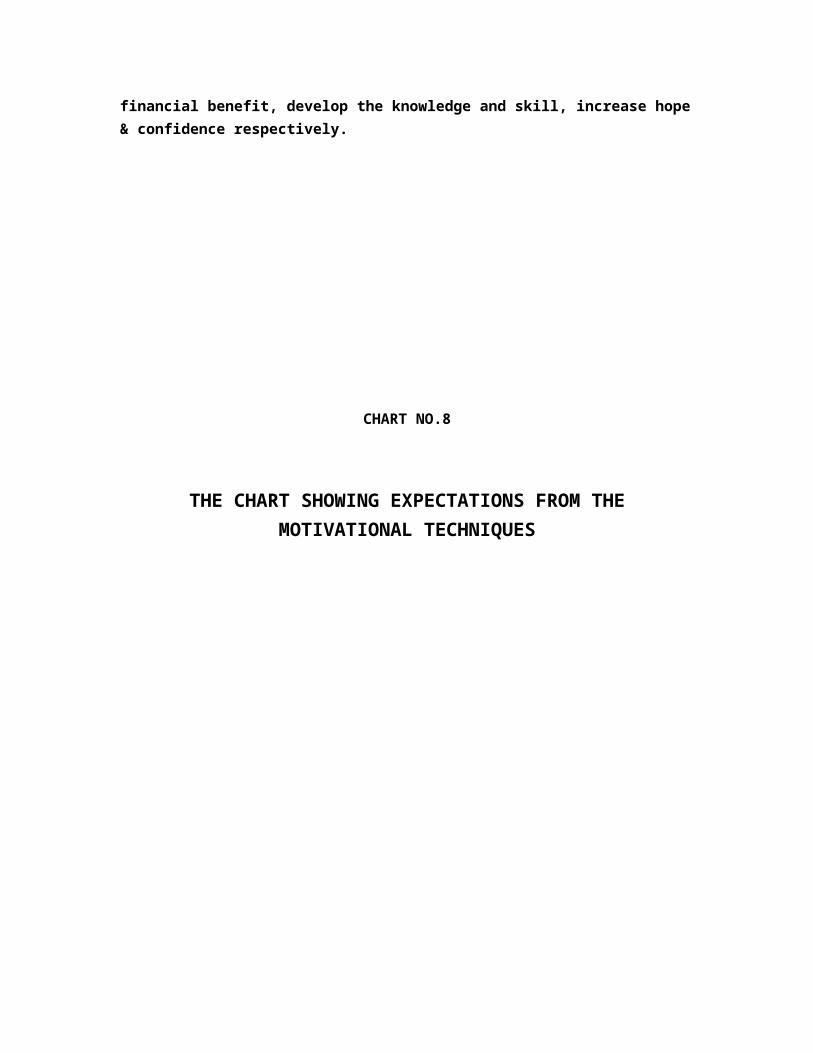
CHART NO.13
THE CHART SHOWING IMPACT OF MOTIVATIONAL TECHNIQUES ON JOB PERFORMANCE
TABLE NO.14(A)
THE TABLE SHOWING LEVEL OF SATISFACTION TOWARDS WATER FACILITIES
PARTICULARSRESPONDENTS PERCENTAGE (%)
VERY HIGH
HIGH
MEDIUM
LOW
VERY LOW
72
48
0
0
0
60
40
0
0
0
TOTAL120 100
SOURCE: PRIMARY DATA
INTERPRETATION
The above table shows the level of satisfaction towards the water facilities. In that 60%, 40% of the respondents satisfied with very high, high levels respectively.
CHART NO.14(A)
THE CHART SHOWING LEVEL OF SATISFACTION TOWARDS WATER FACILITIES
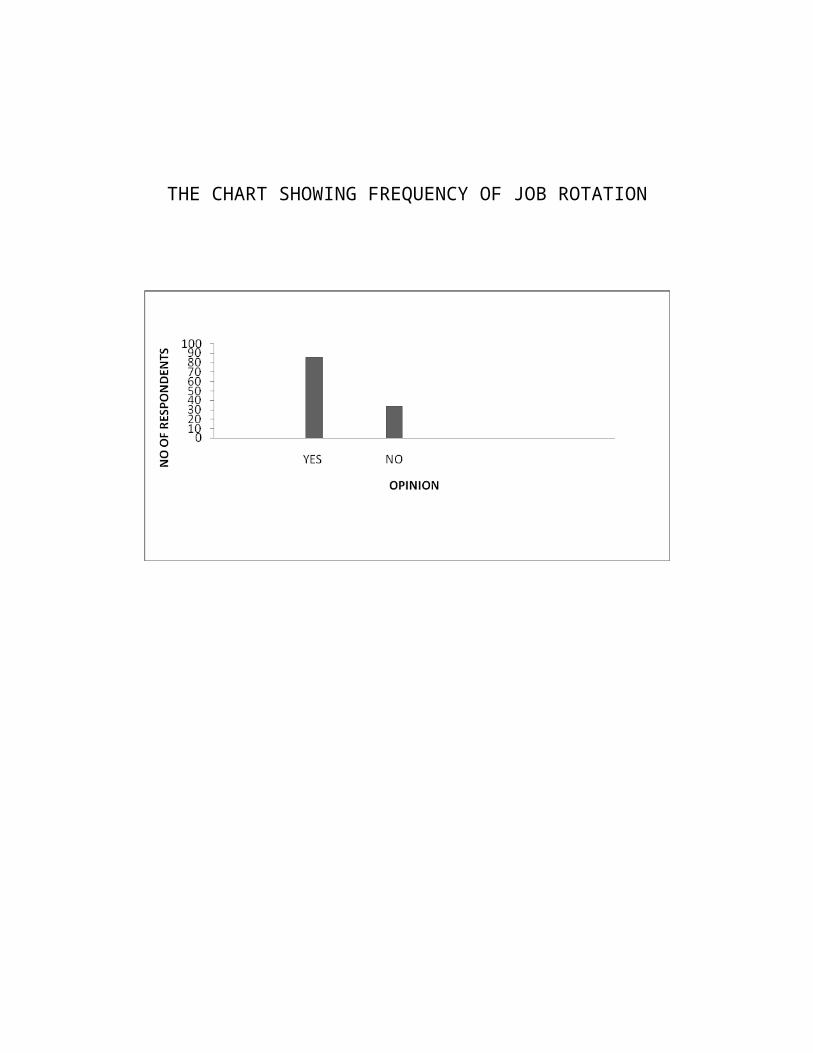
TABLE NO.14 (B)
THE TABLE SHOWING LEVEL OF SATISFACTION TOWARDS FIRSTAID FACILITIES
PARTICULARSRESPONDENTS PERCENTAGE (%)
VERY HIGH
HIGH
MEDIUM
LOW
VERY LOW
52
41
27
0
0
42
34
23
0
0
TOTAL120 100
SOURCE: PRIMARY DATA
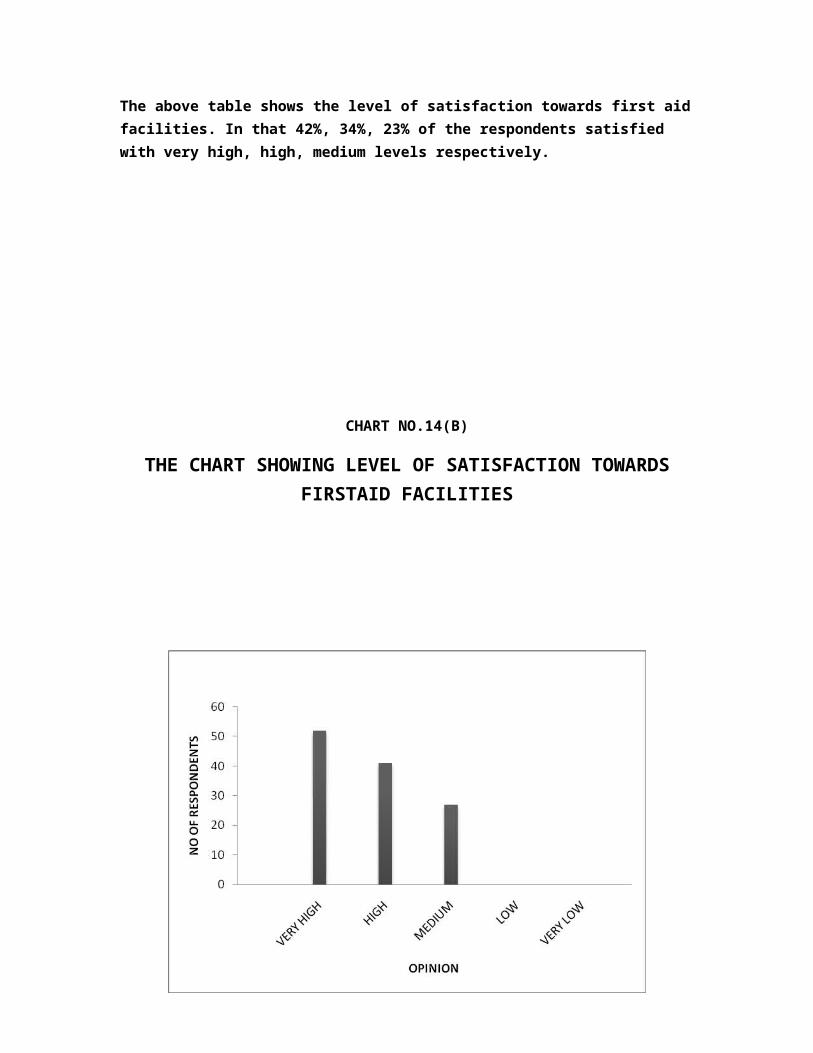
INTERPRETATION
The above table shows the level of satisfaction towards first aid facilities. In that 42%, 34%, 23% of the respondents satisfied with very high, high, medium levels respectively.
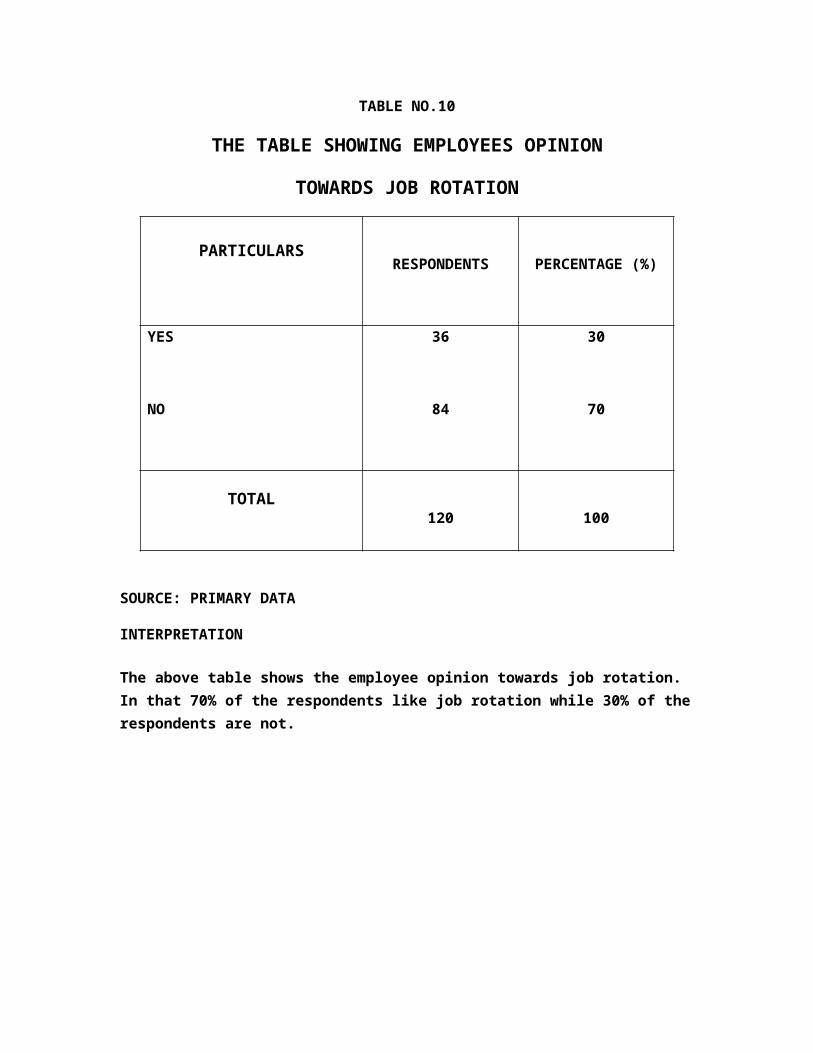
CHART NO.14(B)
THE CHART SHOWING LEVEL OF SATISFACTION TOWARDS FIRSTAID FACILITIES
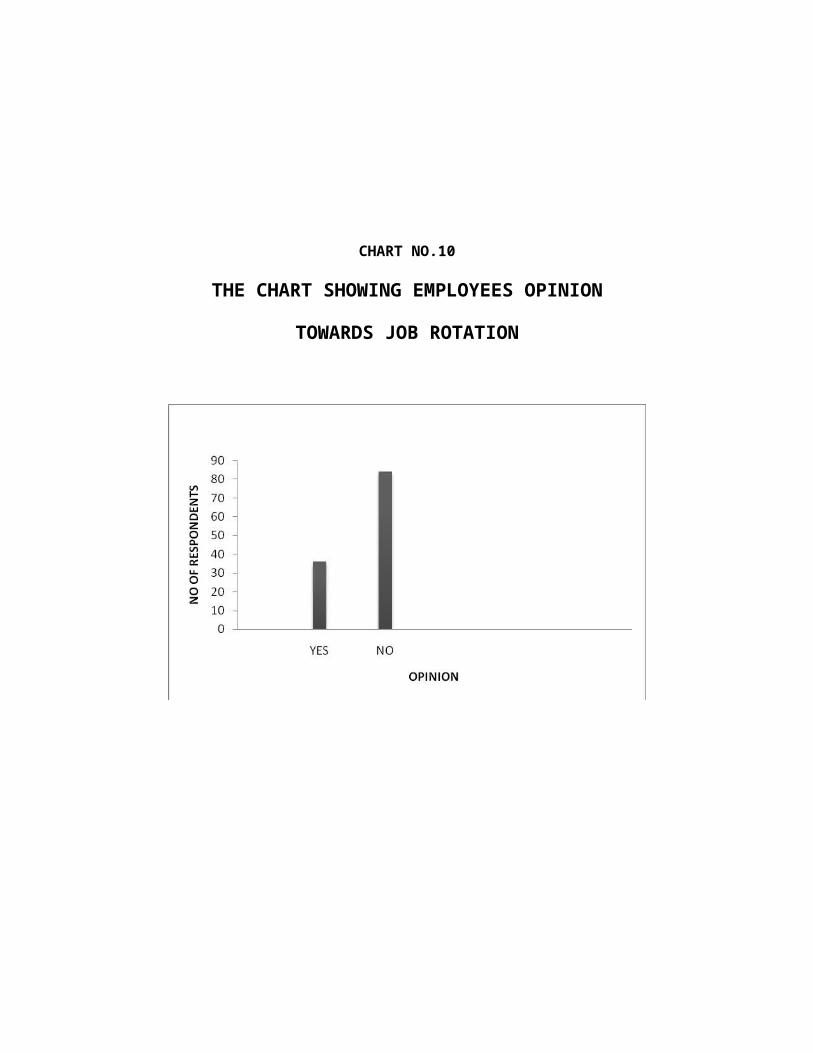
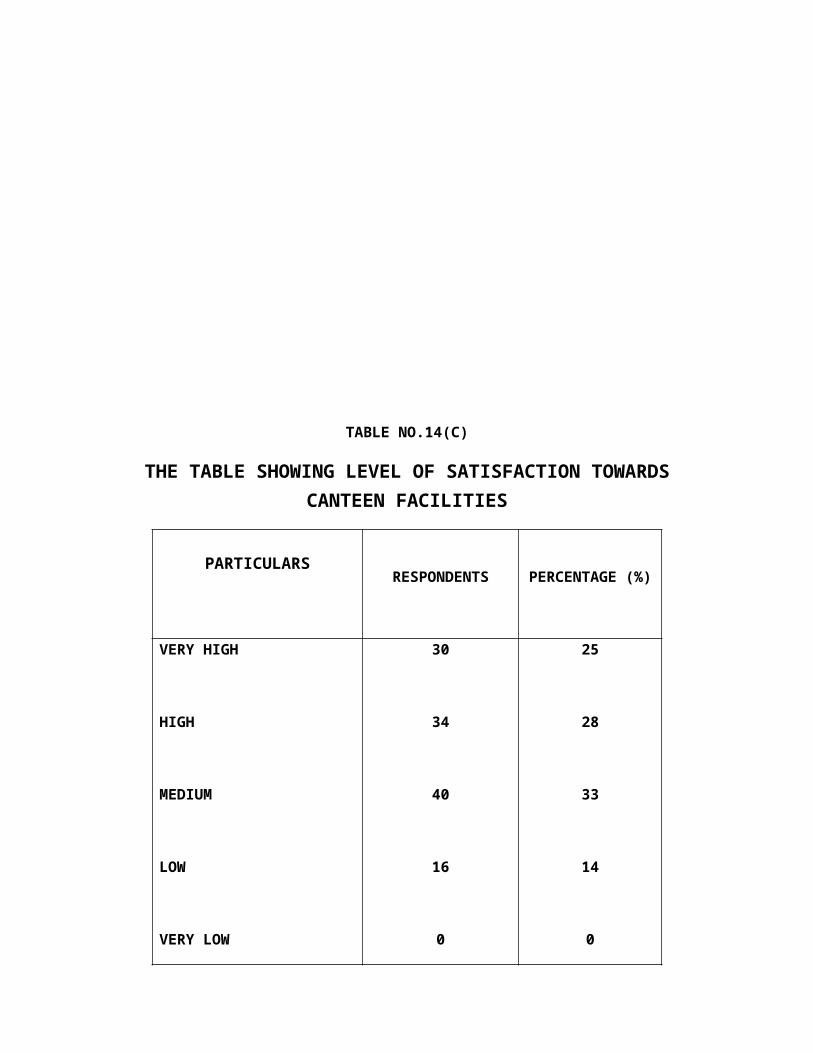
TABLE NO.14(C)
THE TABLE SHOWING LEVEL OF SATISFACTION TOWARDS CANTEEN FACILITIES
PARTICULARSRESPONDENTS PERCENTAGE (%)
VERY HIGH
HIGH
MEDIUM
LOW
VERY LOW
30
34
40
16
0
25
28
33
14
0
TOTAL120 100
INTERPRETATION
The above table shows the level of satisfaction towards canteen facilities. In that 33%, 28%, 25%, 14% of the respondents satisfied with medium, high, very high, low levels respectively.
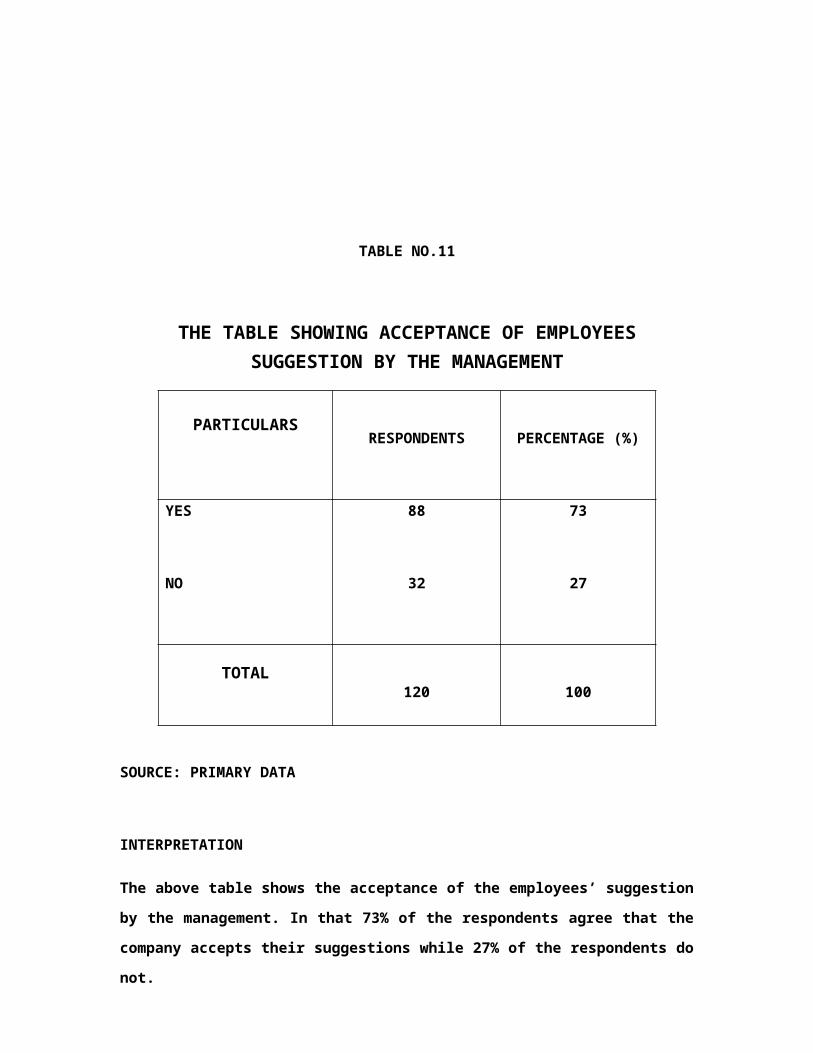
CHART NO.14(C)
THE CHART SHOWING LEVEL OF SATISFACTION TOWARDS CANTEEN FACILITIES
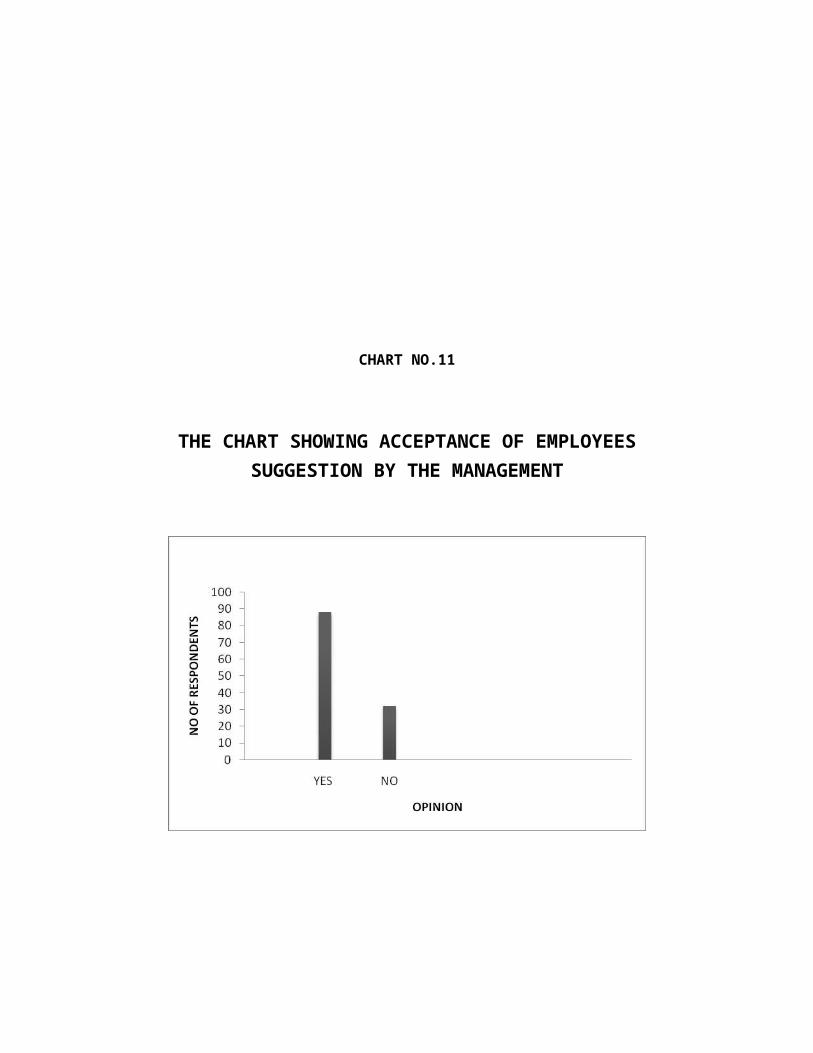
TABLE NO.14 (D)
THE TABLE SHOWING LEVEL OF SATISFACTION TOWARDS REST ROOM FACILITIES
PARTICULARSRESPONDENTS PERCENTAGE (%)
VERY HIGH
HIGH
MEDIUM
LOW
VERY LOW
58
42
20
0
0
48
35
17
0
0
TOTAL120 100
SOURCE: PRIMARY DATA
INTERPRETATION
The above table shows the level of satisfaction towards rest room facilities. In that 48%, 35%, 17% of the respondents satisfied with very high, high, medium levels respectively.
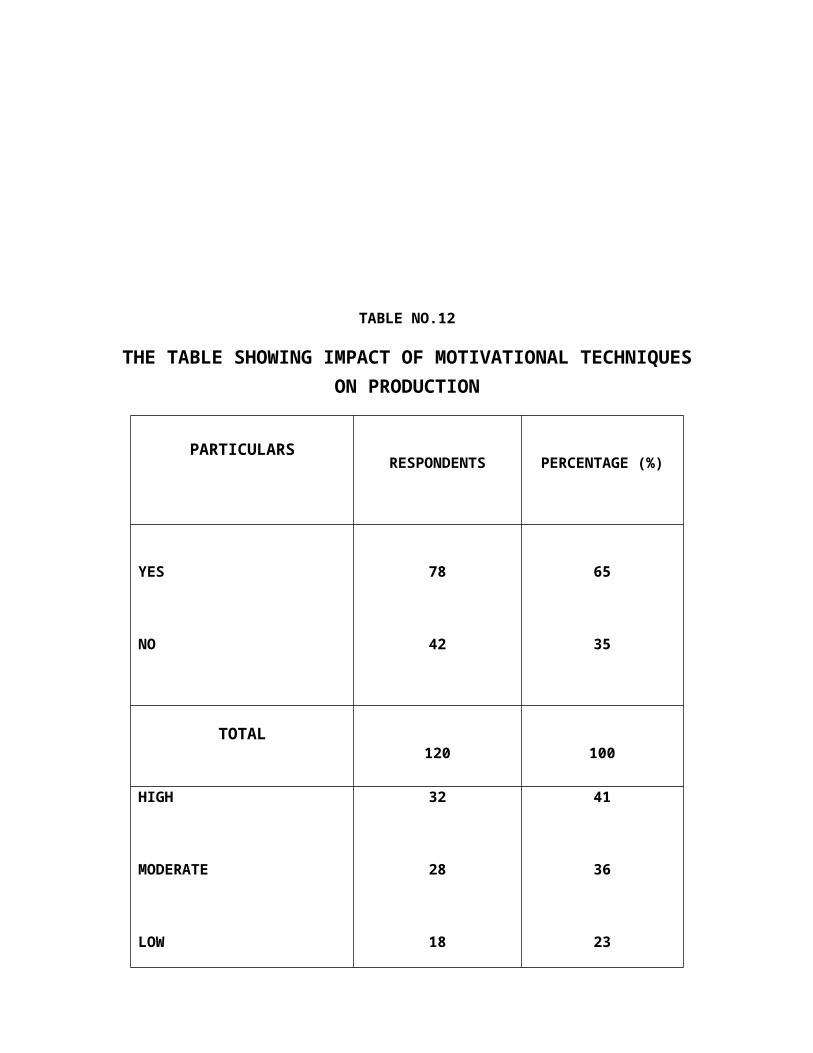
CHART NO.14(D)
THE CHART SHOWING LEVEL OF SATISFACTION TOWARDS REST ROOM FACILITIES
TABLE NO.14(E)
THE TABLE SHOWING LEVEL OF SATISFACTION TOWARDS SAFETY MEASURES
PARTICULARSRESPONDENTS PERCENTAGE (%)
VERY HIGH
HIGH
MEDIUM
LOW
VERY LOW
64
44
12
0
0
53
37
10
0
0
TOTAL120 100
SOURCE: PRIMARY DATA
INTERPRETATION
The above table shows the level of satisfaction towards safety measures. In that 53%, 37%, 10% of the respondents satisfied with very high, high, medium levels respectively.
CHART NO.14(E)
THE CHART SHOWING LEVEL OF SATISFACTION TOWARDS SAFETY MEASURES
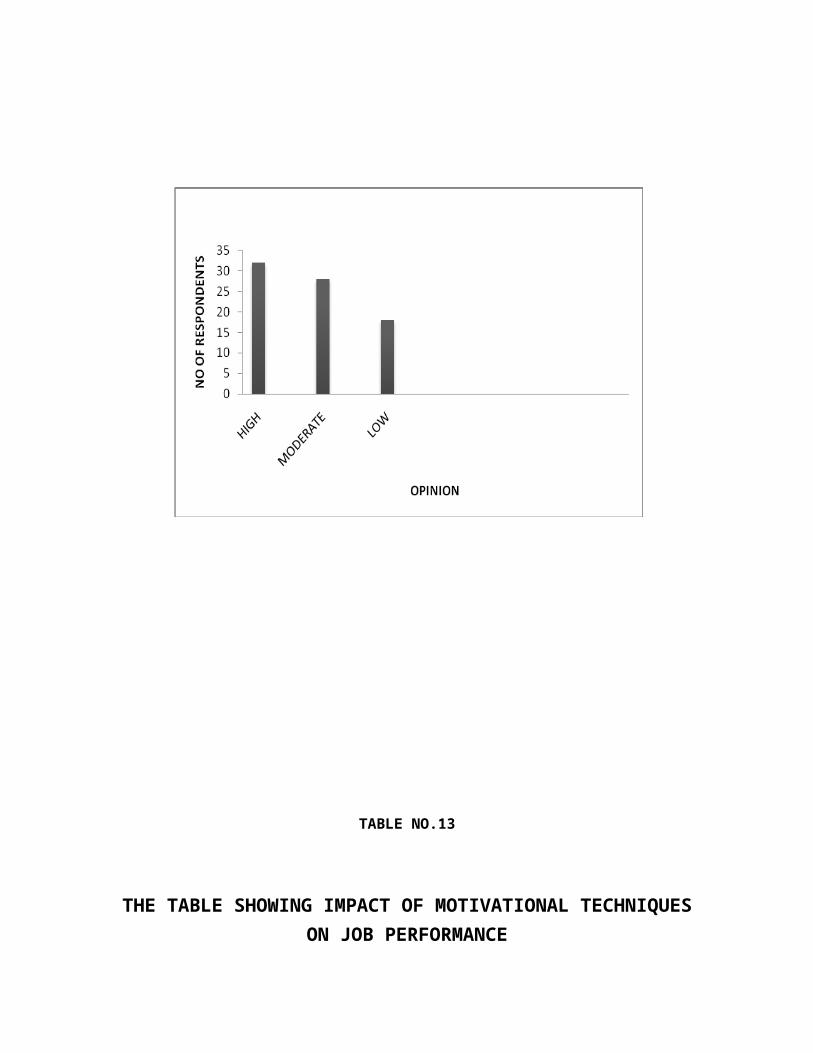
TABLE NO.15(A)
THE TABLE SHOWING LEVEL OF SATISFACTION TOWARDS PROMOTION
PARTICULARSRESPONDENTS PERCENTAGE (%)
VERY HIGH
HIGH
MEDIUM
LOW
VERY LOW
0
58
40
22
0
0
49
33
18
0
TOTAL120 100
SOURCE: PRIMARY DATA
INTERPRETATION
The above table shows the level of satisfaction towards promotion. In that 49%, 33%, 18% of the respondents satisfied with high, medium, low levels respectively.
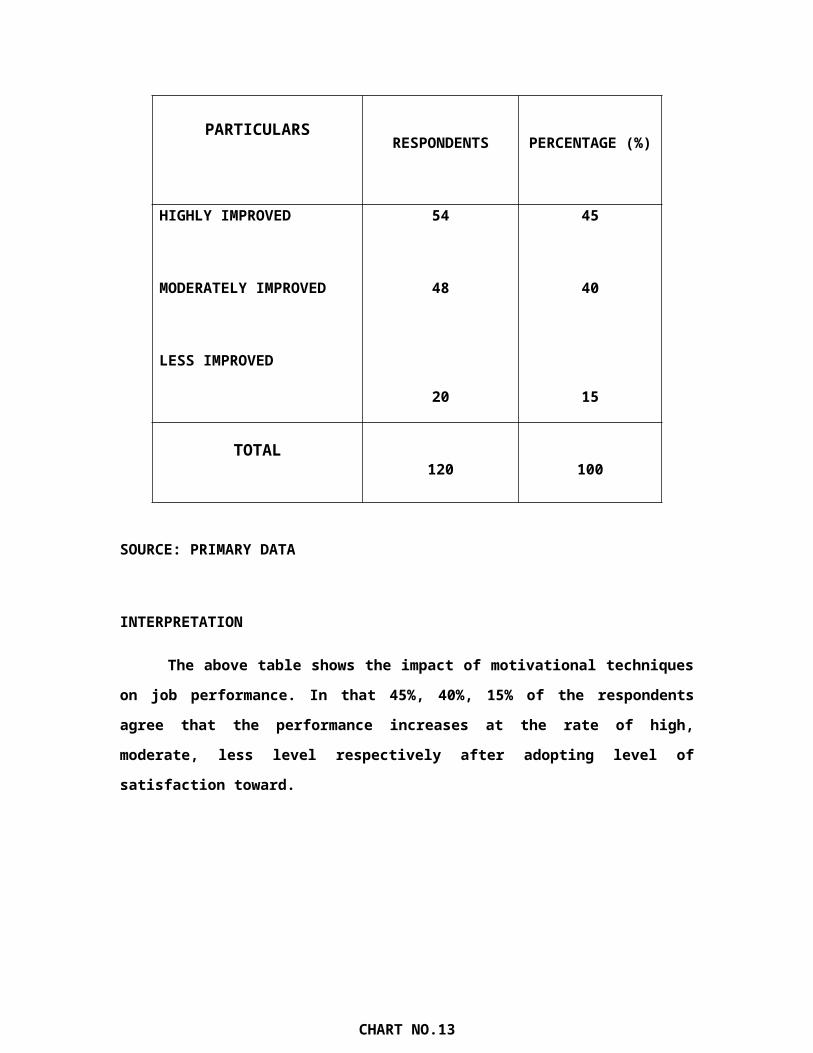
CHART NO.15(A)
THE CHART SHOWING LEVEL OF SATISFACTION TOWARDS PROMOTION
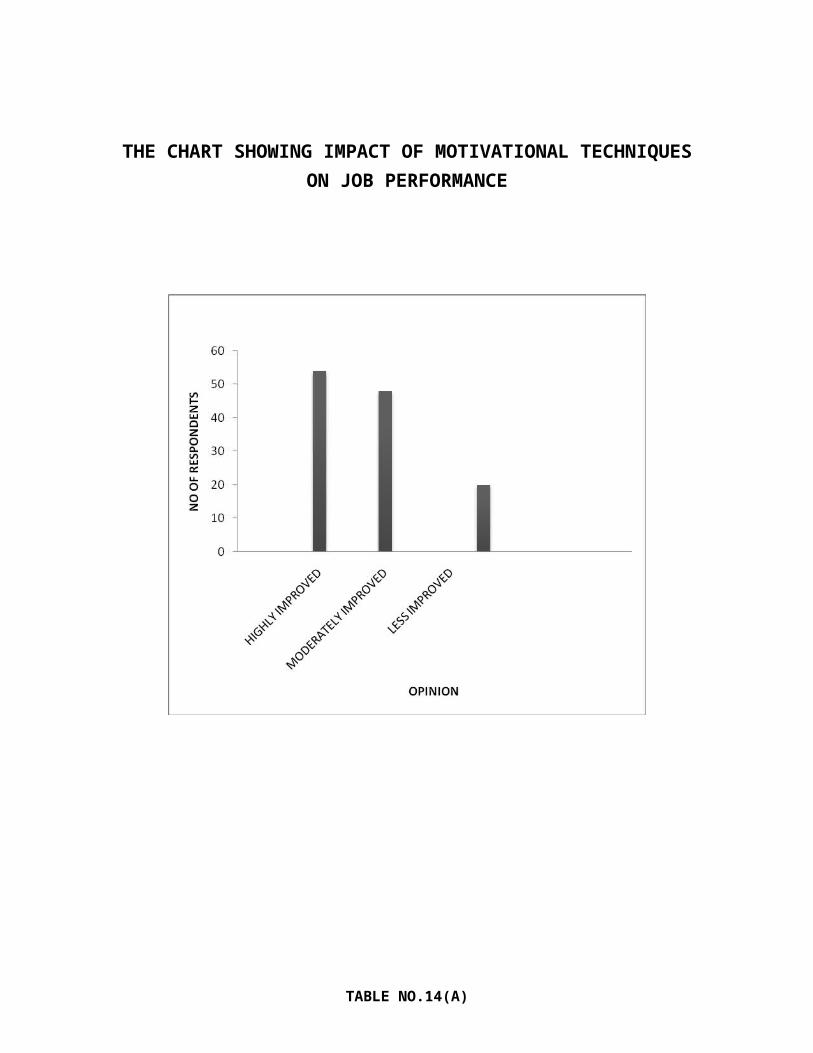
TABLE NO.15(B)
THE TABLE SHOWING LEVEL OF SATISFACTION TOWARDS INCREMENT
PARTICULARSRESPONDENTS PERCENTAGE (%)
VERY HIGH
HIGH
MEDIUM
LOW
VERY LOW
0
62
36
22
0
0
52
30
18
0
TOTAL120 100
SOURCE: PRIMARY DATA
INTERPRETATION
The above table shows the level of satisfaction towards increment. In that 52%, 30%, 18% of the respondents satisfied with high, medium, low levels respectively.
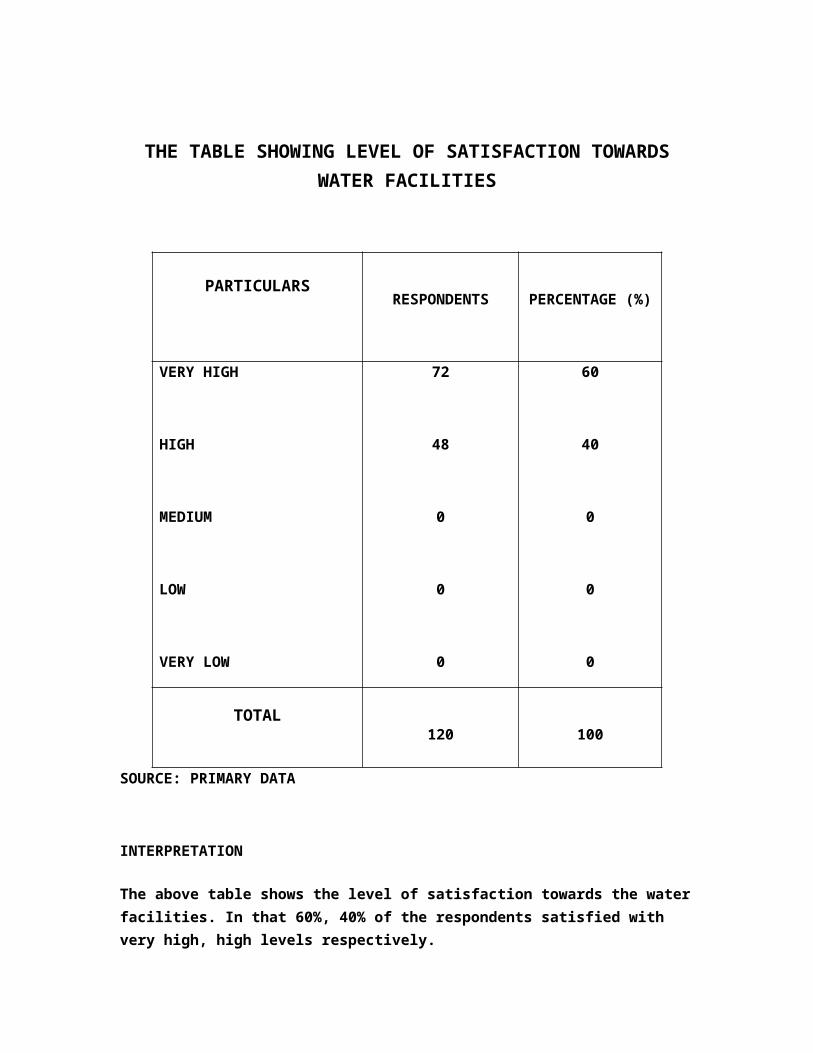
CHART NO.15(B)
THE CHART SHOWING LEVEL OF SATISFACTION TOWARDS INCREMENT
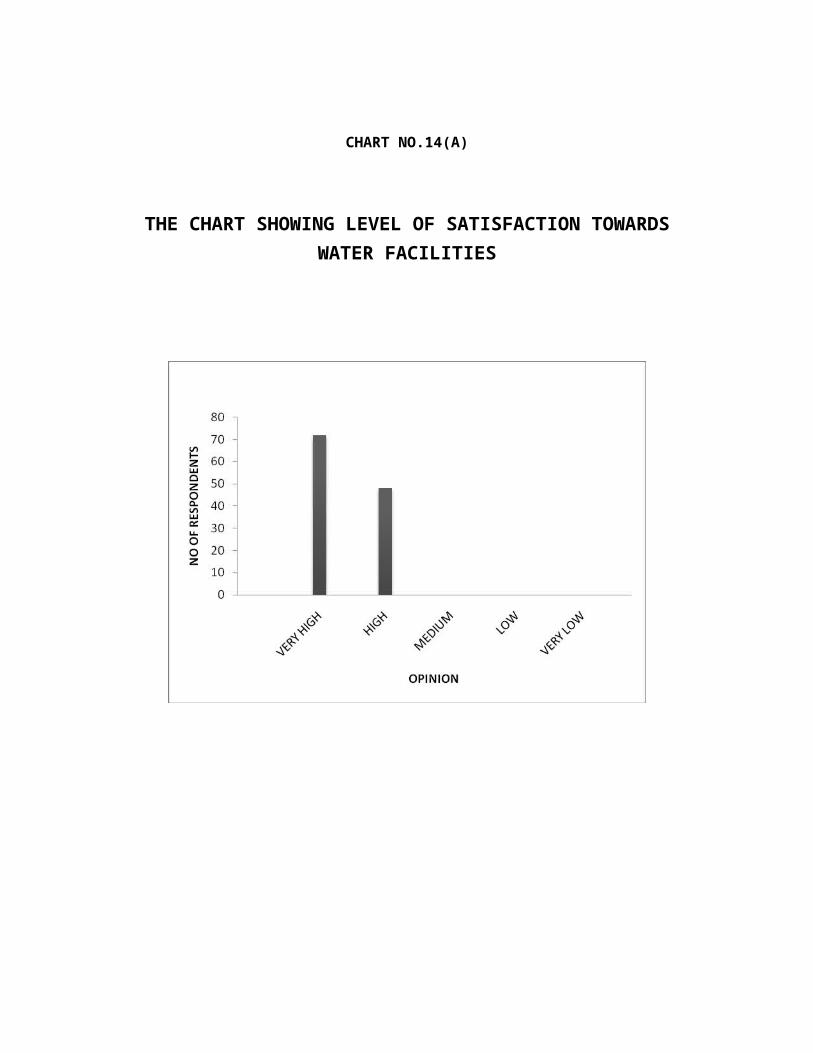
TABLE NO.15(C)
THE TABLE SHOWING LEVEL OF SATISFACTION TOWARDS BONUS
PARTICULARSRESPONDENTS PERCENTAGE (%)
VERY HIGH
HIGH
MEDIUM
LOW
VERY LOW
0
28
64
28
0
0
23
53
24
0
TOTAL120 100
SOURCE: PRIMARY DATA
INTERPRETATION
The above table shows the level of satisfaction towards bonus. In that 53%, 24%, 23% of the respondents satisfied with medium, low, high levels respectively.
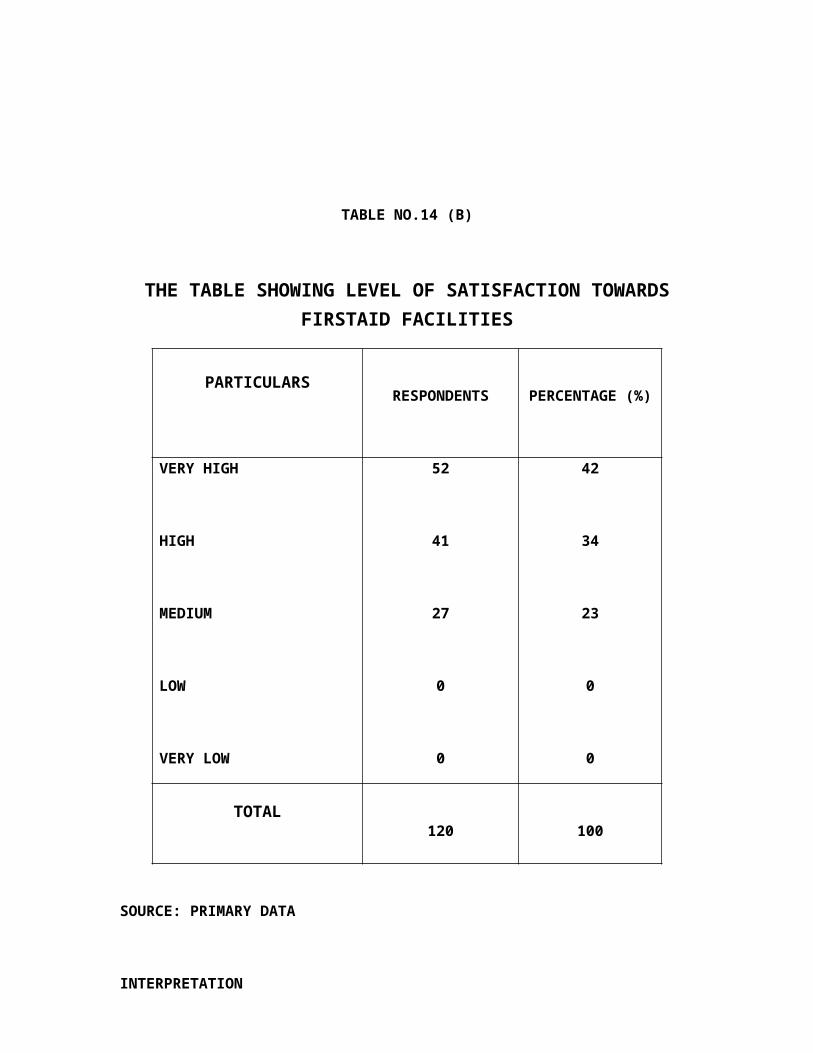
CHART NO.(15)
THE CHART SHOWING LEVEL OF SATISFACTION TOWARDS BONUS
TABLE NO.16
THE TABLE SHOWING EFFECTIVENESS OF MOTIVATIONAL TECHNIQUES
PARTICULARSRESPONDENTS PERCENTAGE (%)
HIGHLY EFFECTIVE
EFFECTIVE
LESS EFFECTIVE
42
58
20
35
48
17
TOTAL120 100
SOURCE: PRIMARY DATA
INTERPRETATION
The above table shows the level of satisfaction towards effectiveness of motivational techniques. In that 48%, 35%, 17% of the respondents said that the motivational techniques provided are effective, highly effective and less effective respectively.
CHART NO.16
THE CHART SHOWING EFFECTIVENESS OF MOTIVATIONAL TECHNIQUES
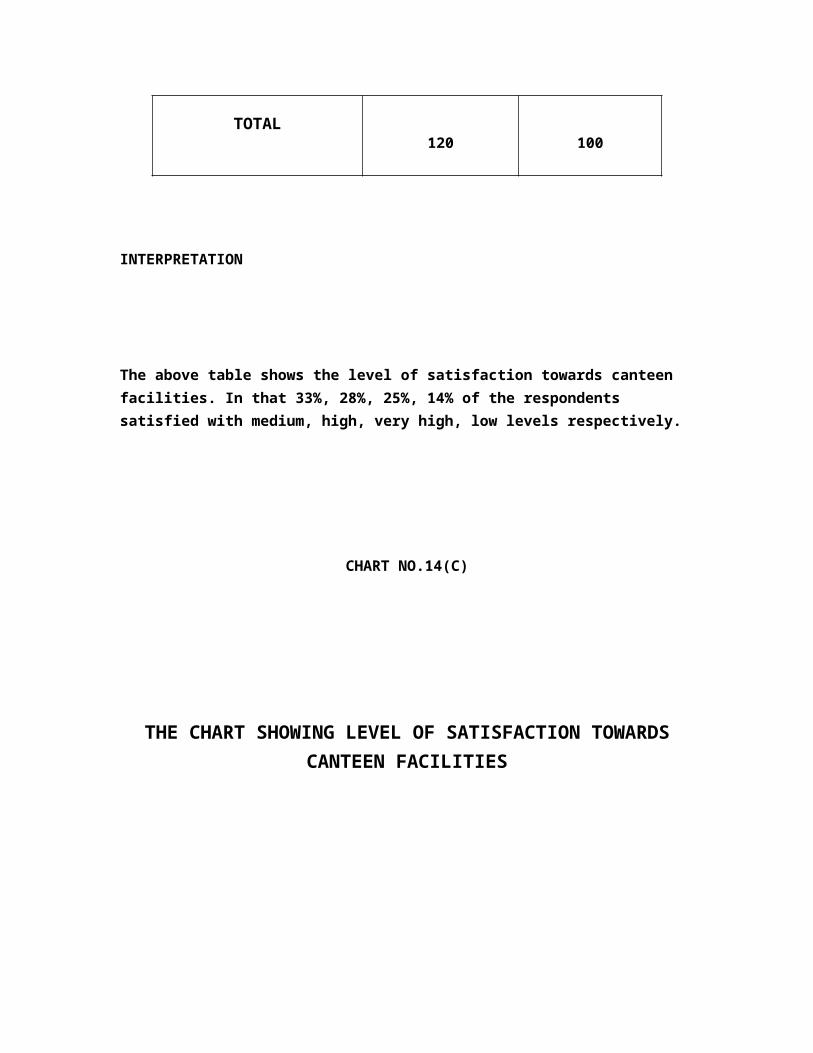
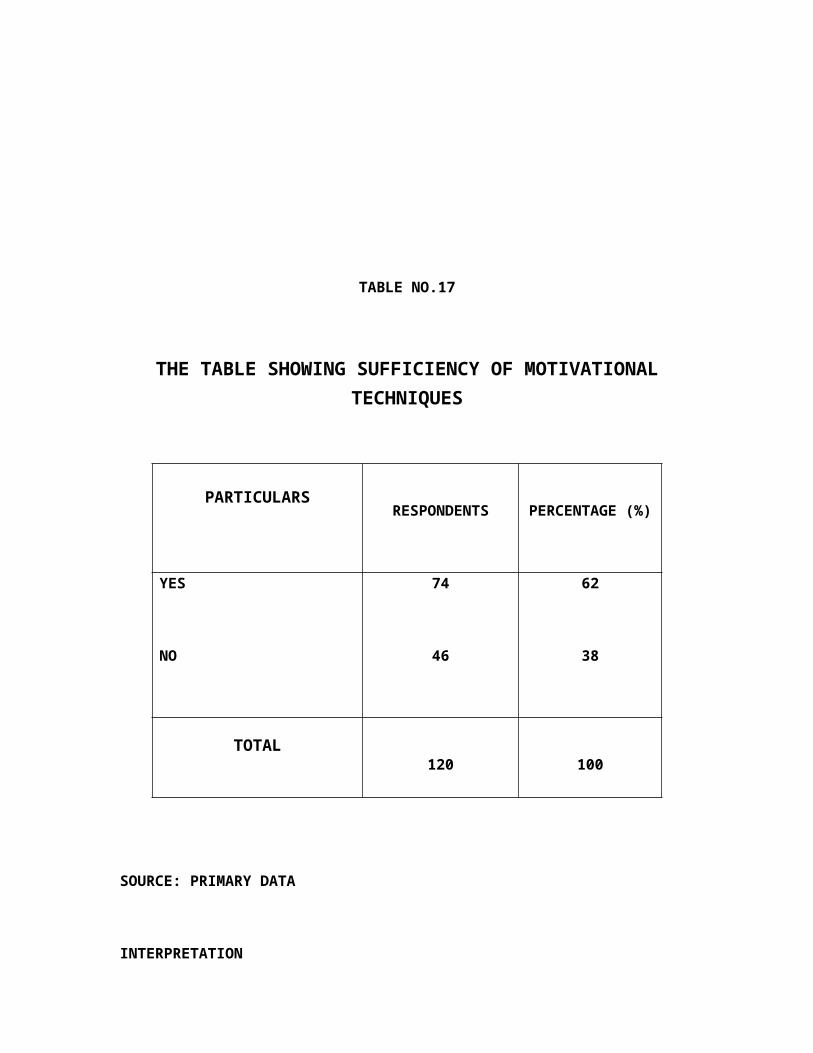
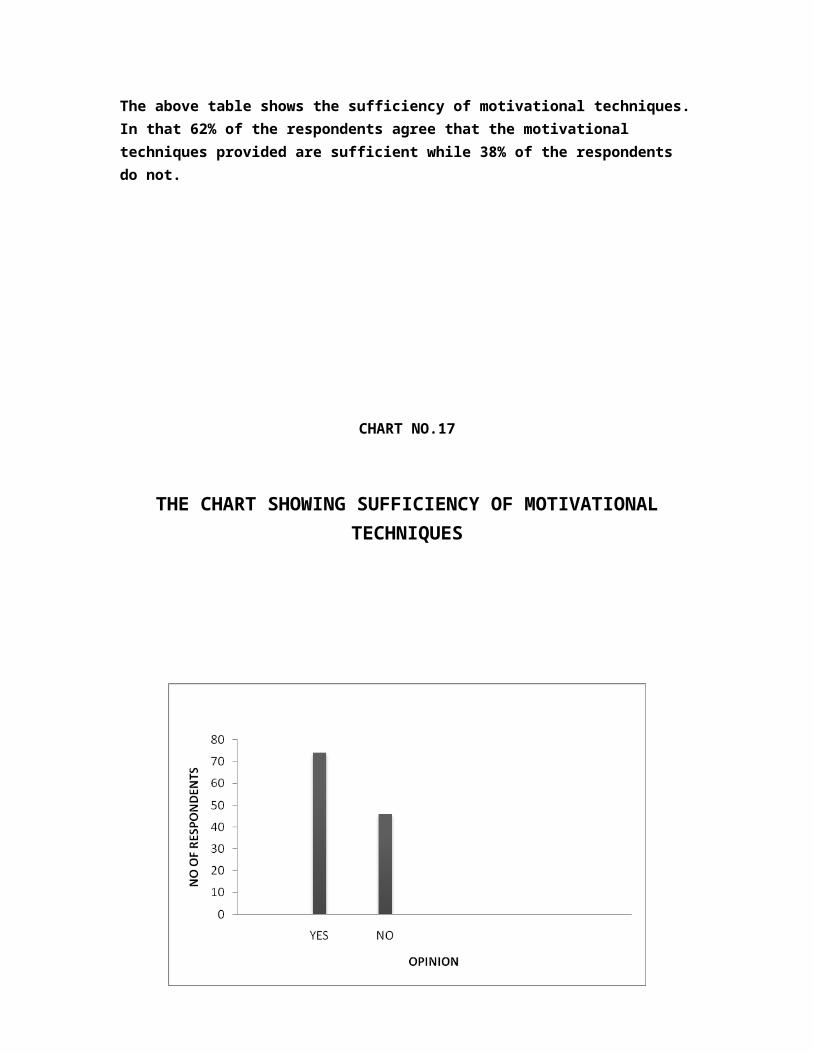
TABLE NO.17
THE TABLE SHOWING SUFFICIENCY OF MOTIVATIONAL TECHNIQUES
PARTICULARSRESPONDENTS PERCENTAGE (%)
YES
NO
74
46
62
38
TOTAL120 100
SOURCE: PRIMARY DATA
INTERPRETATION
The above table shows the sufficiency of motivational techniques. In that 62% of the respondents agree that the motivational techniques provided are sufficient while 38% of the respondents do not.
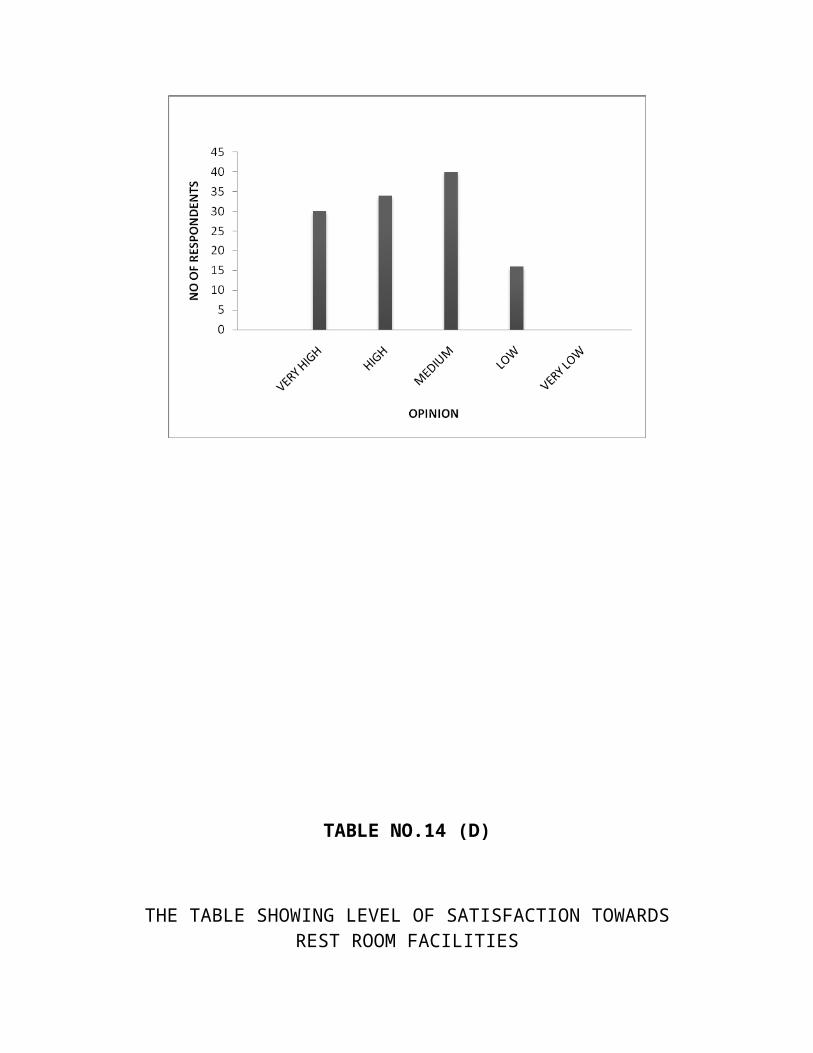
CHART NO.17
THE CHART SHOWING SUFFICIENCY OF MOTIVATIONAL TECHNIQUES
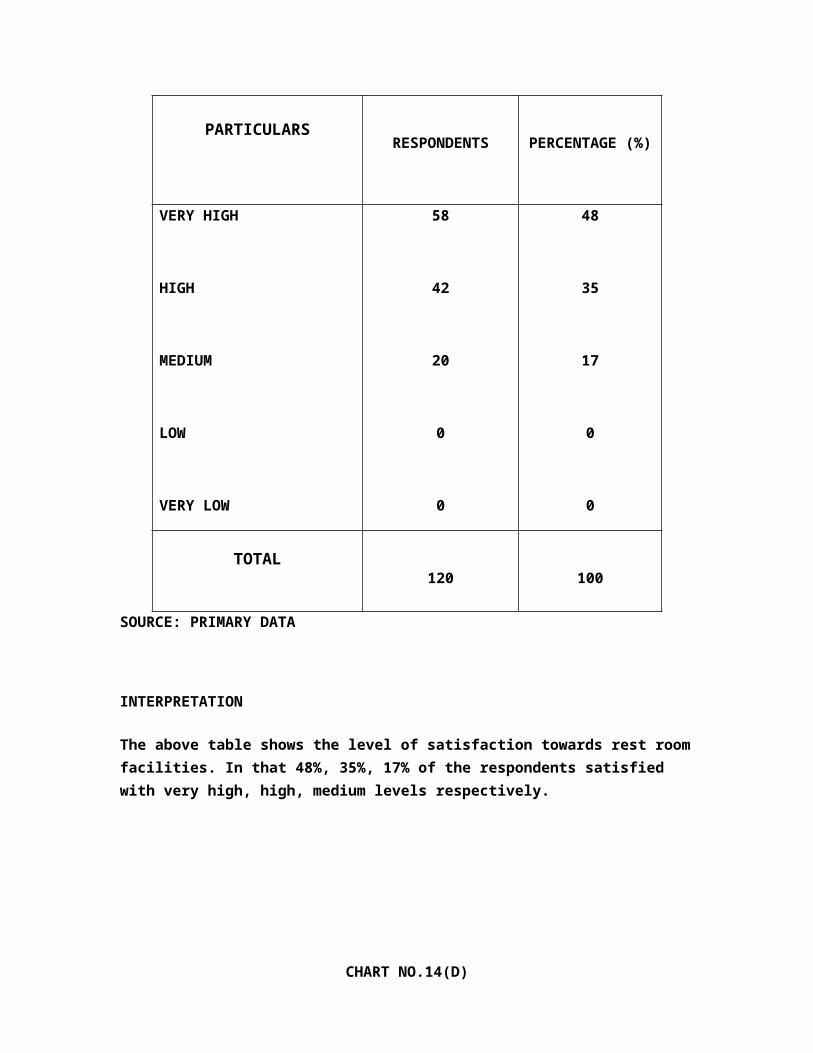
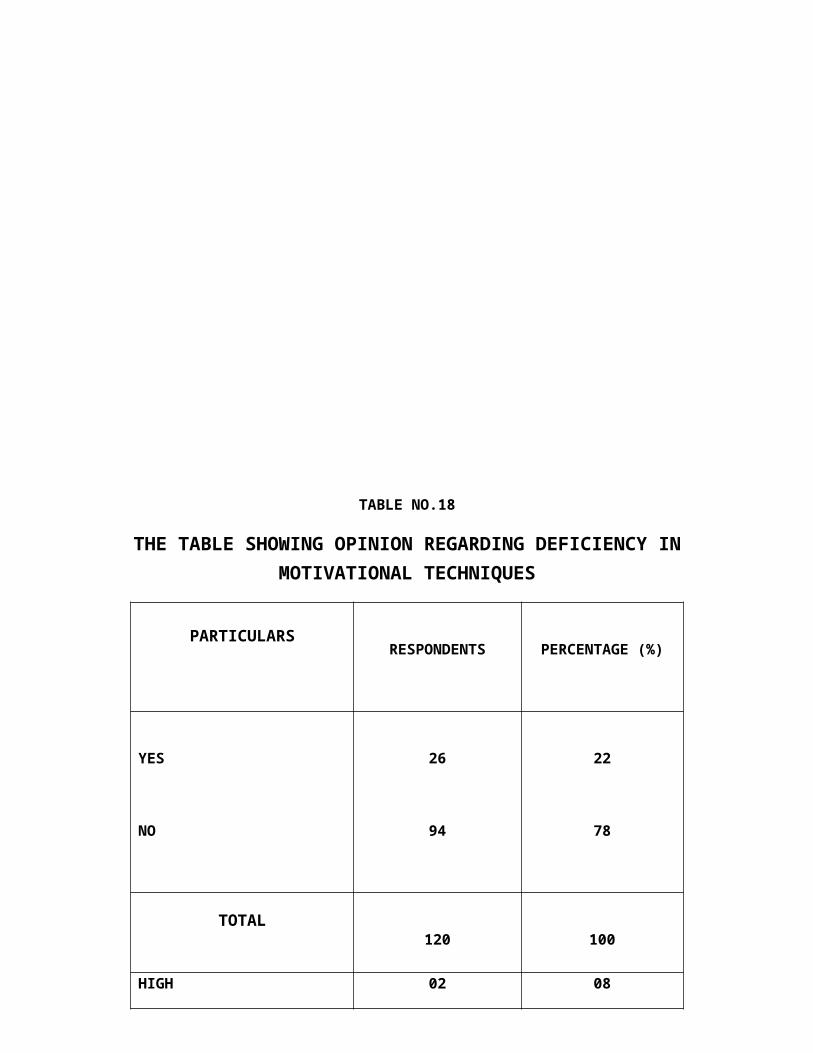
TABLE NO.18
THE TABLE SHOWING OPINION REGARDING DEFICIENCY IN MOTIVATIONAL TECHNIQUES
PARTICULARSRESPONDENTS PERCENTAGE (%)
YES
NO
26
94
22
78
TOTAL120 100
HIGH
MODERATE
LOW
02
04
20
08
15
77
TOTAL
SOURCE: PRIMARY DATA
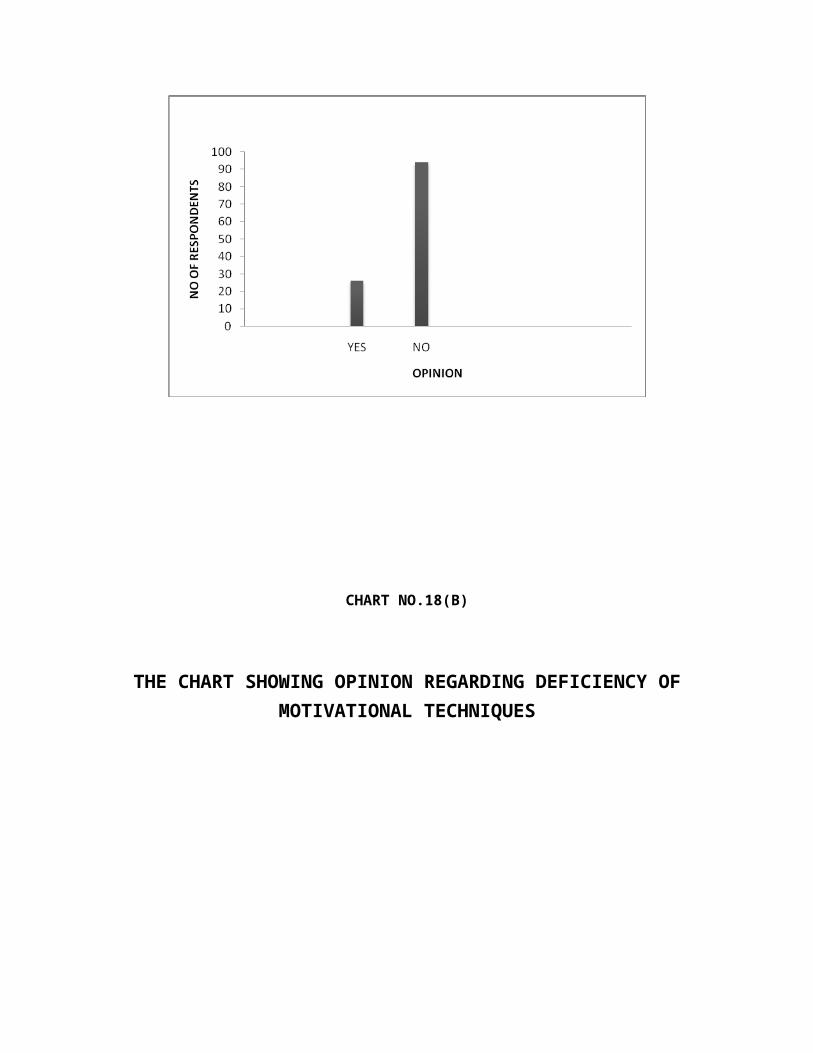
INTERPRETATION
The above table shows the opinion regarding deficiency in motivational techniques. In that 78% o f the respondents says that there is deficiency with the existing motivational techniques, while 22% of the respondents are does not.
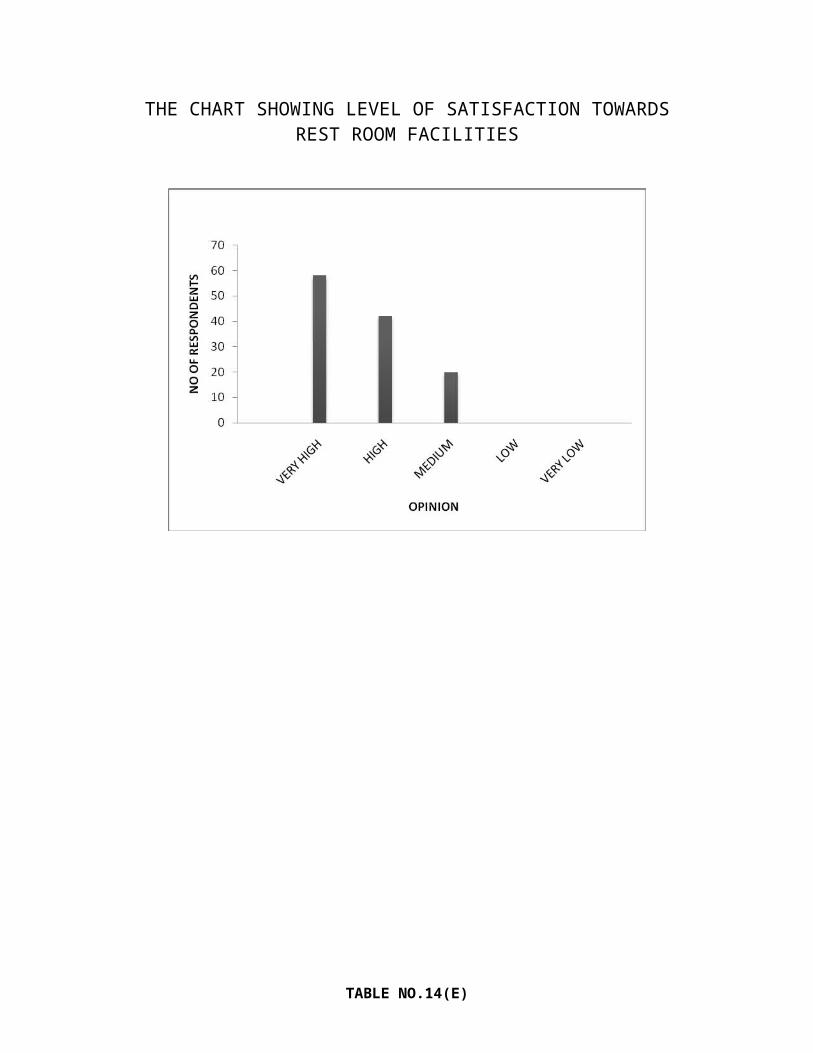
CHART NO.18(A)
THE CHART SHOWING OPINION REGARDING DEFICIENCY OF MOTIVATIONAL TECHNIQUES
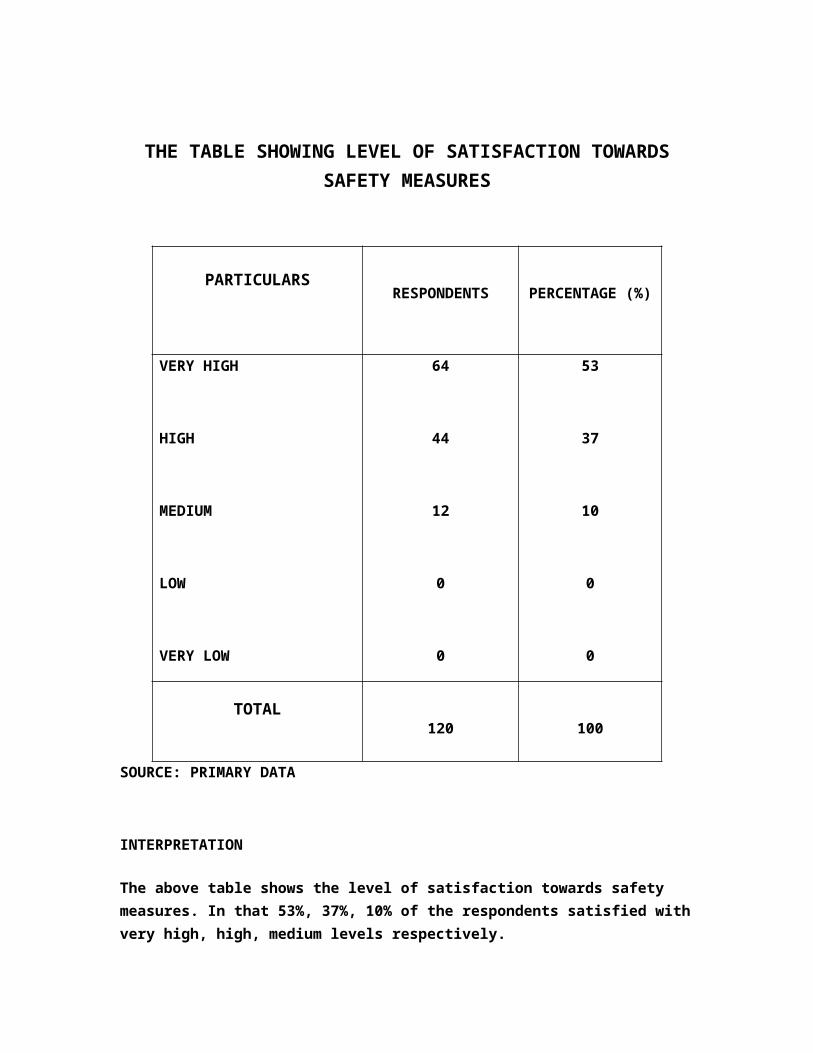
CHART NO.18(B)
THE CHART SHOWING OPINION REGARDING DEFICIENCY OF MOTIVATIONAL TECHNIQUES
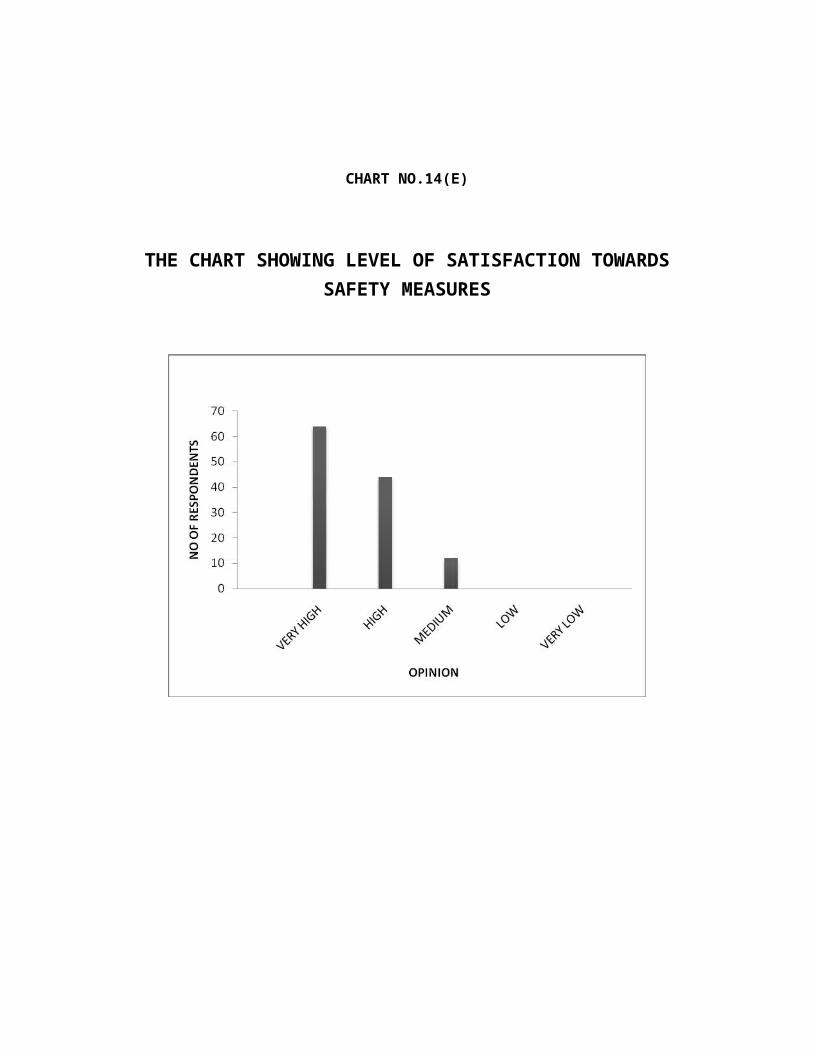
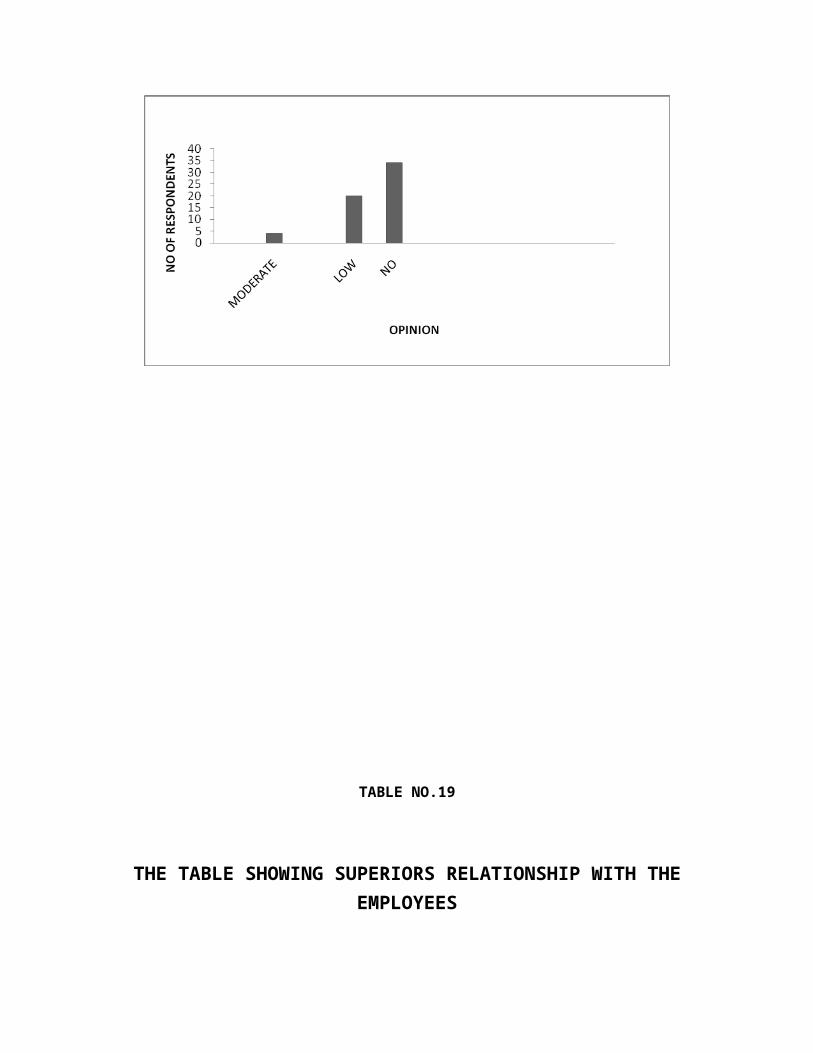
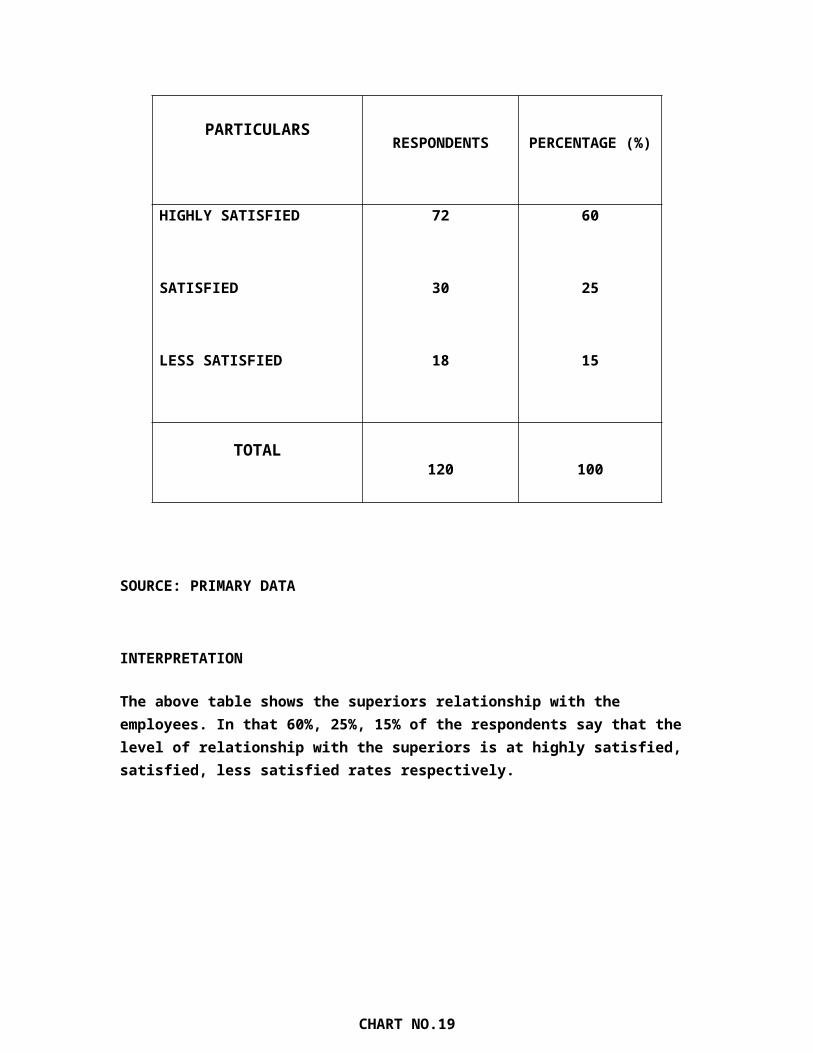
TABLE NO.19
THE TABLE SHOWING SUPERIORS RELATIONSHIP WITH THE EMPLOYEES
PARTICULARSRESPONDENTS PERCENTAGE (%)
HIGHLY SATISFIED
SATISFIED
LESS SATISFIED
72
30
18
60
25
15
TOTAL120 100
SOURCE: PRIMARY DATA
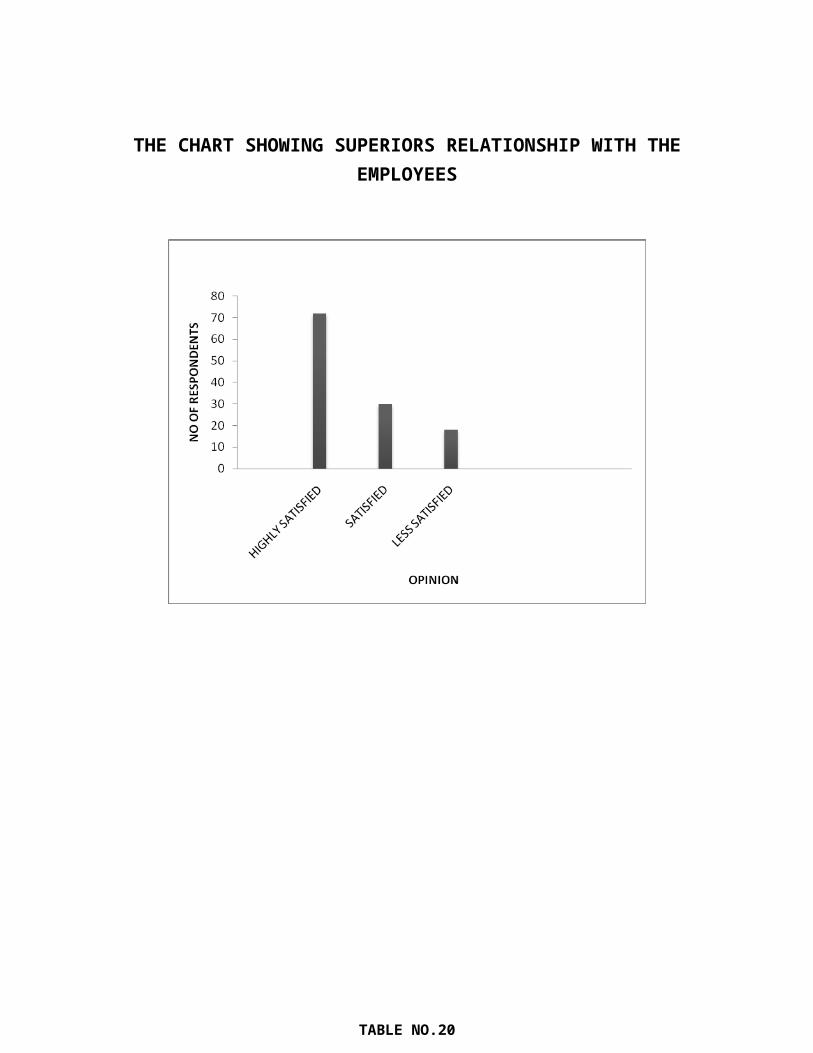
INTERPRETATION
The above table shows the superiors relationship with the employees. In that 60%, 25%, 15% of the respondents say that the level of relationship with the superiors is at highly satisfied, satisfied, less satisfied rates respectively.
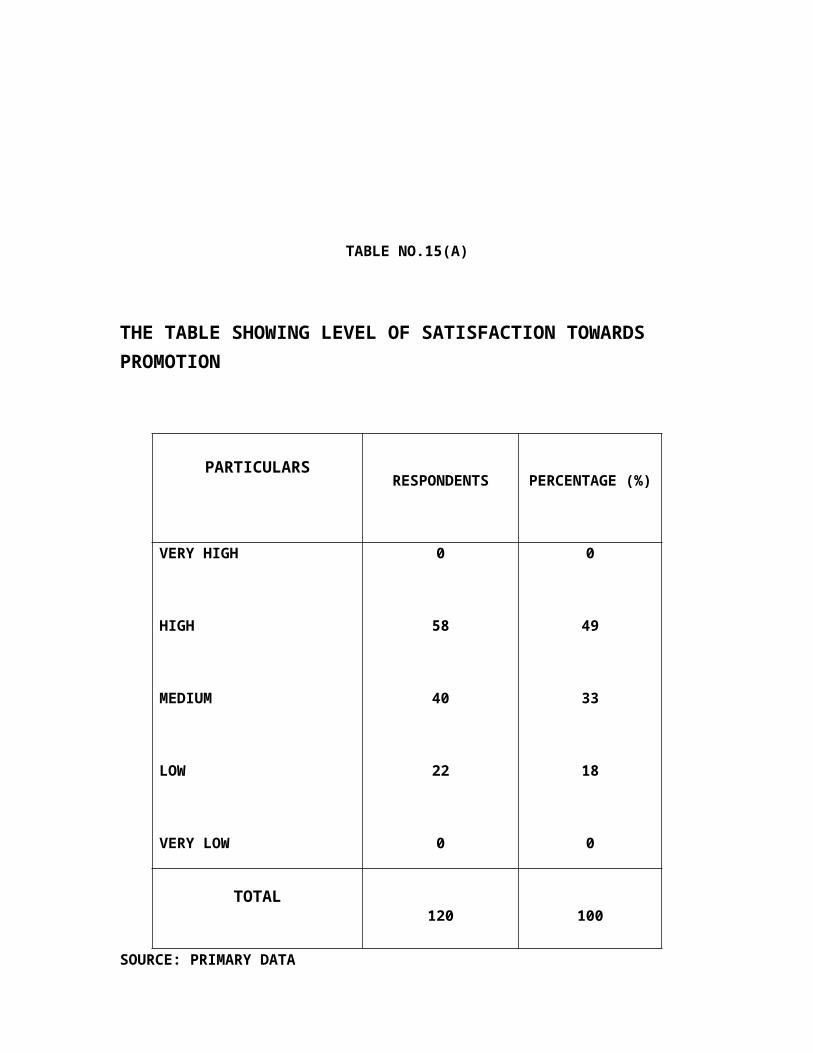
CHART NO.19
THE CHART SHOWING SUPERIORS RELATIONSHIP WITH THE EMPLOYEES
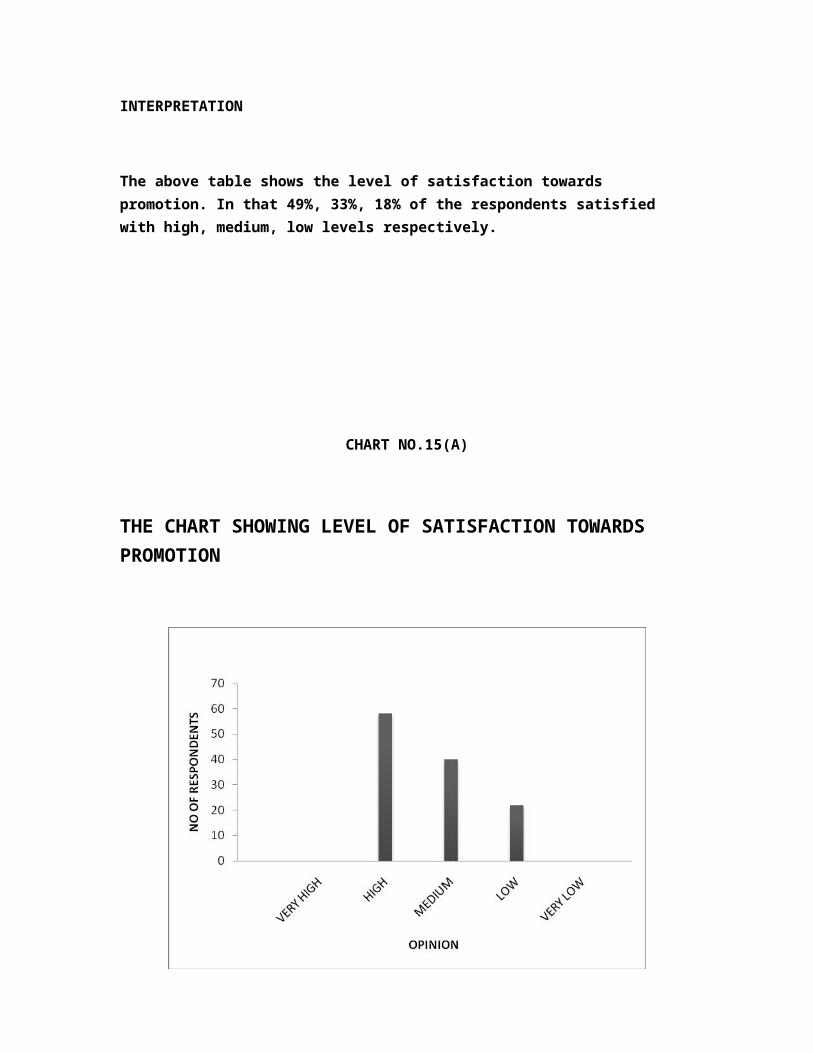
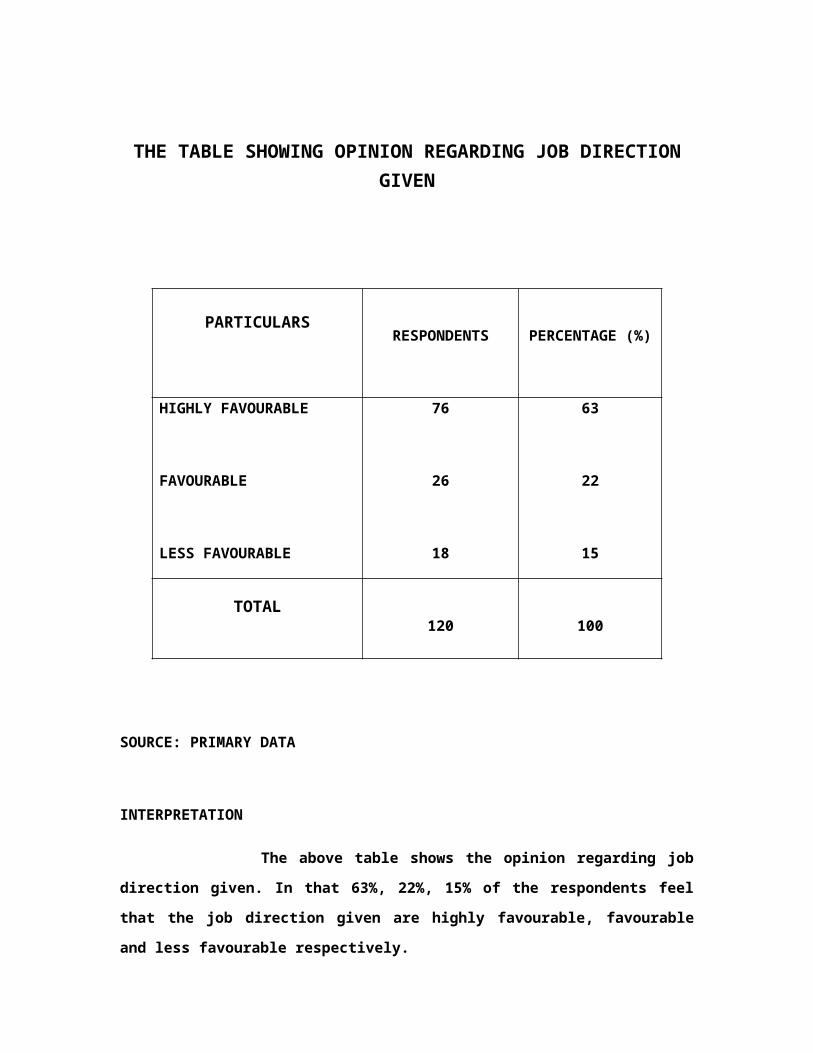
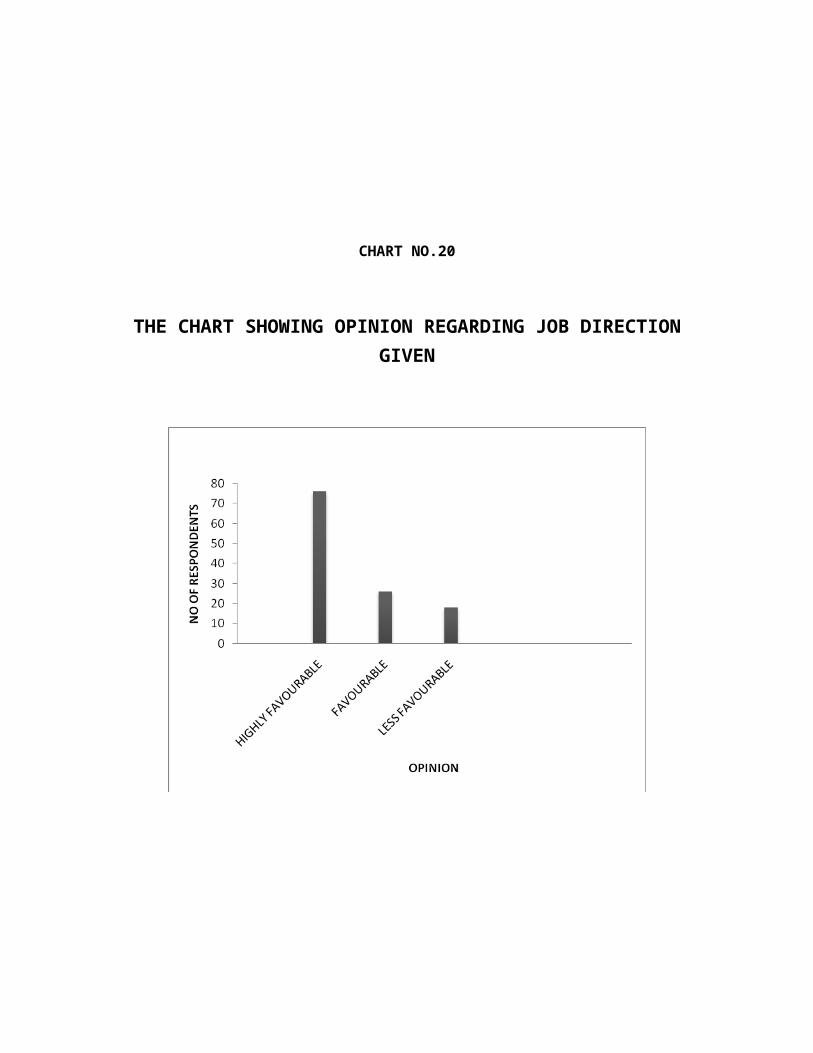
TABLE NO.20
THE TABLE SHOWING OPINION REGARDING JOB DIRECTION GIVEN
PARTICULARSRESPONDENTS PERCENTAGE (%)
HIGHLY FAVOURABLE
FAVOURABLE
LESS FAVOURABLE
76
26
18
63
22
15
TOTAL120 100
SOURCE: PRIMARY DATA
INTERPRETATION
The above table shows the opinion regarding job direction given. In that 63%, 22%, 15%
of the respondents feel that the job direction given are highly favourable, favourable and less
favourable respectively.
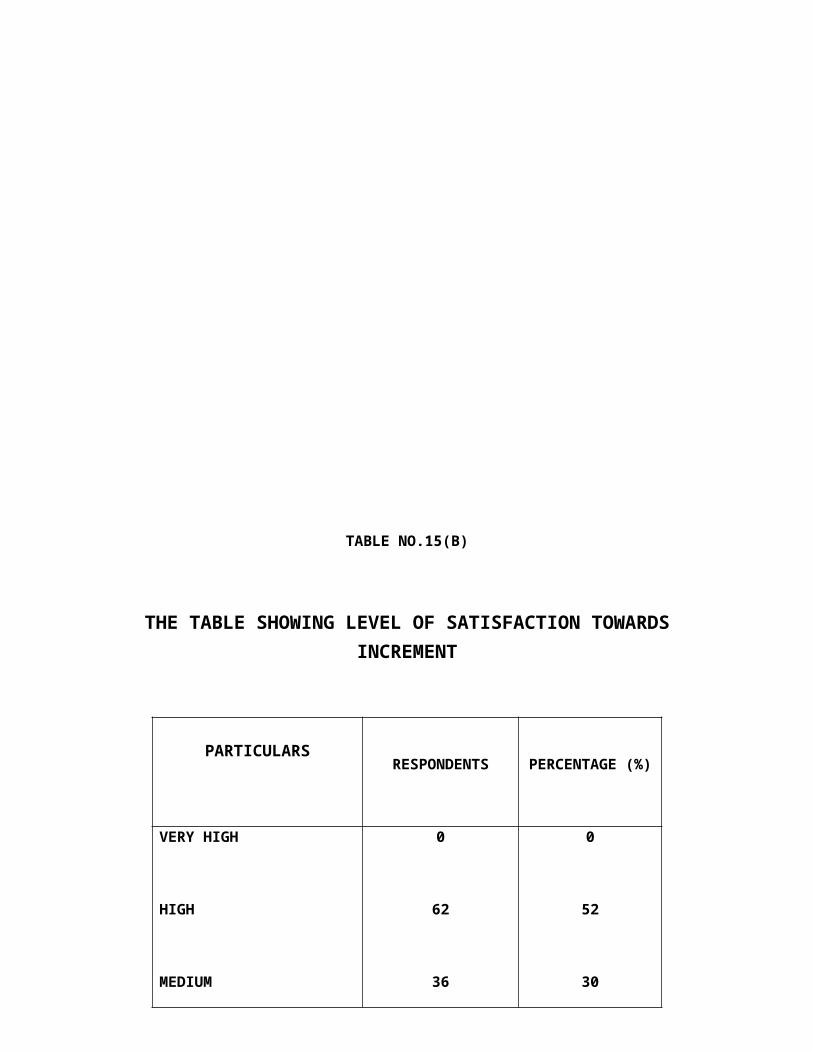
CHART NO.20
THE CHART SHOWING OPINION REGARDING JOB DIRECTION GIVEN
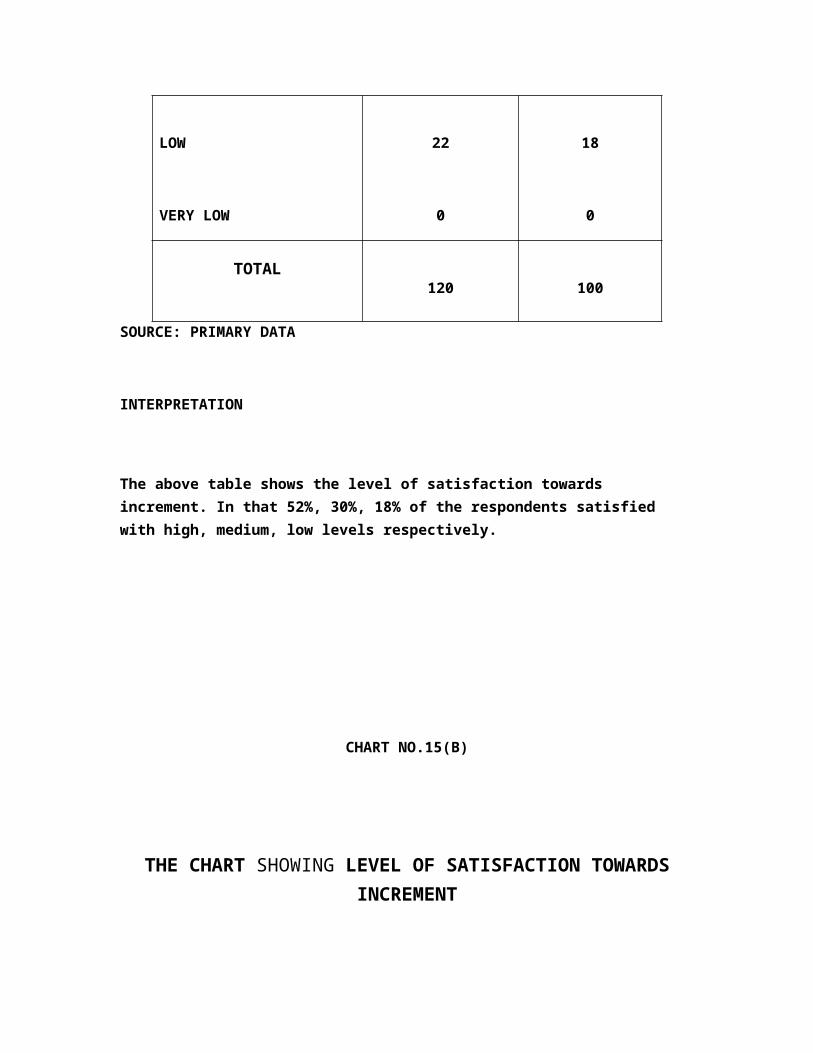
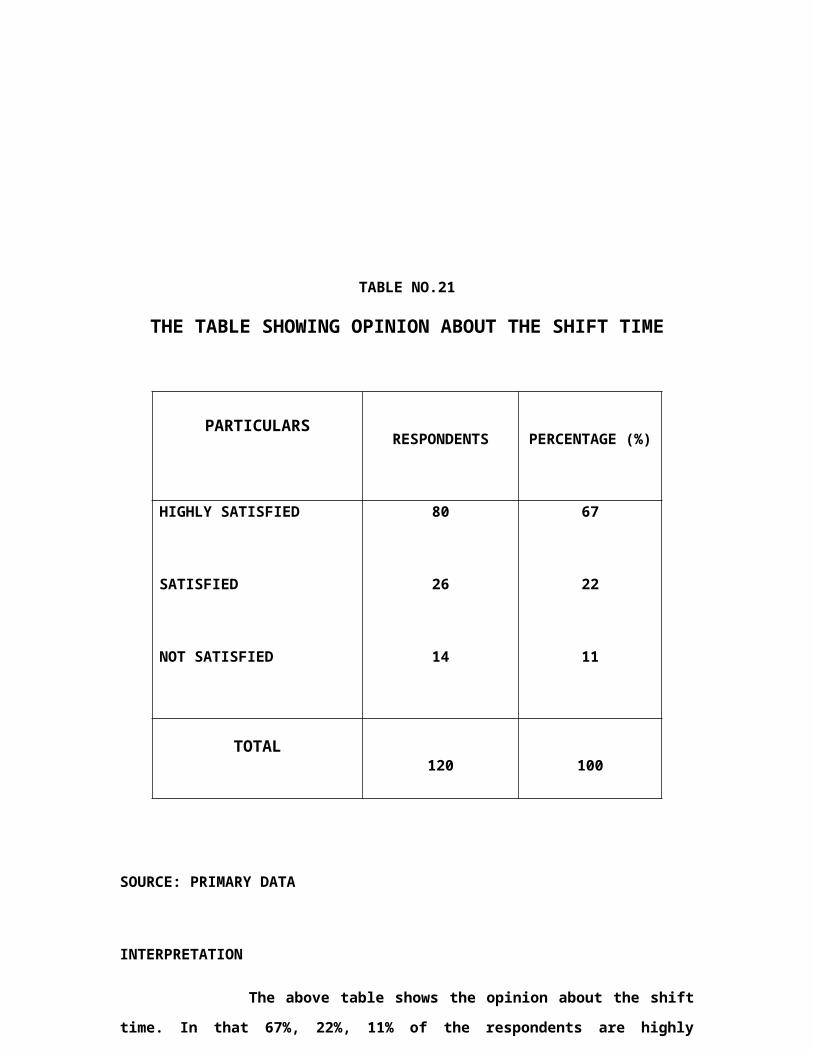
TABLE NO.21
THE TABLE SHOWING OPINION ABOUT THE SHIFT TIME
PARTICULARSRESPONDENTS PERCENTAGE (%)
HIGHLY SATISFIED
SATISFIED
NOT SATISFIED
80
26
14
67
22
11
TOTAL120 100
SOURCE: PRIMARY DATA
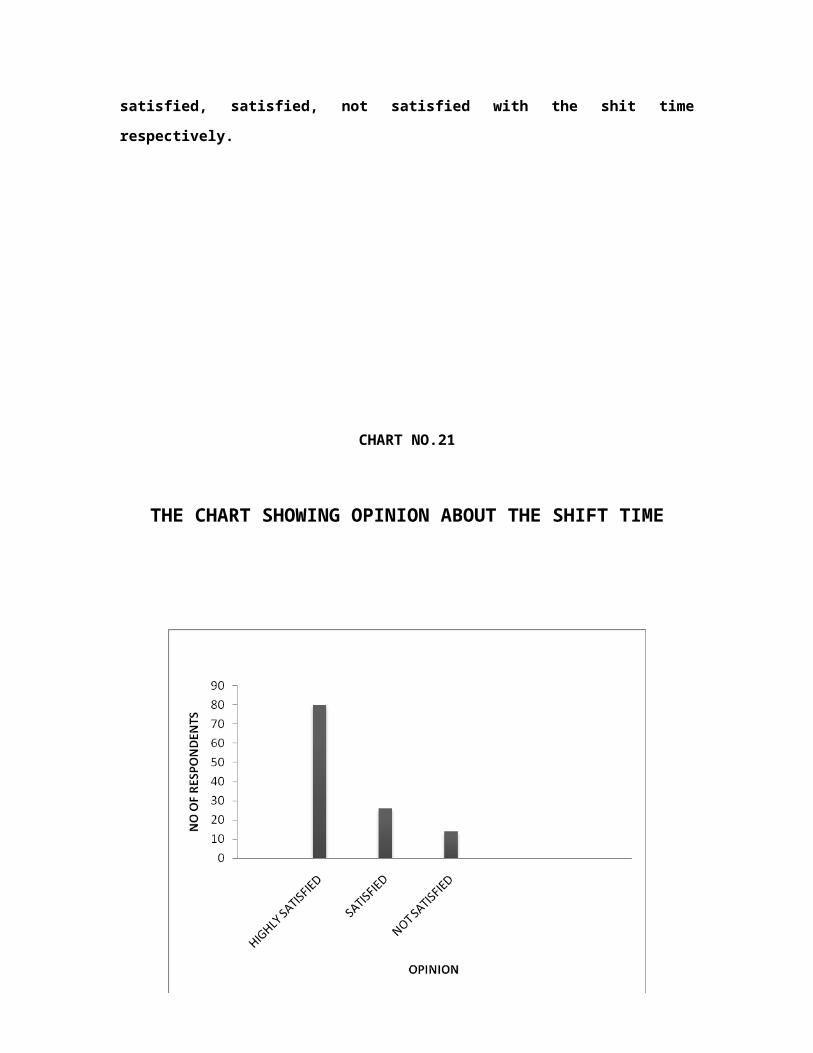
INTERPRETATION
The above table shows the opinion about the shift time. In that 67%, 22%, 11% of the
respondents are highly satisfied, satisfied, not satisfied with the shit time respectively.
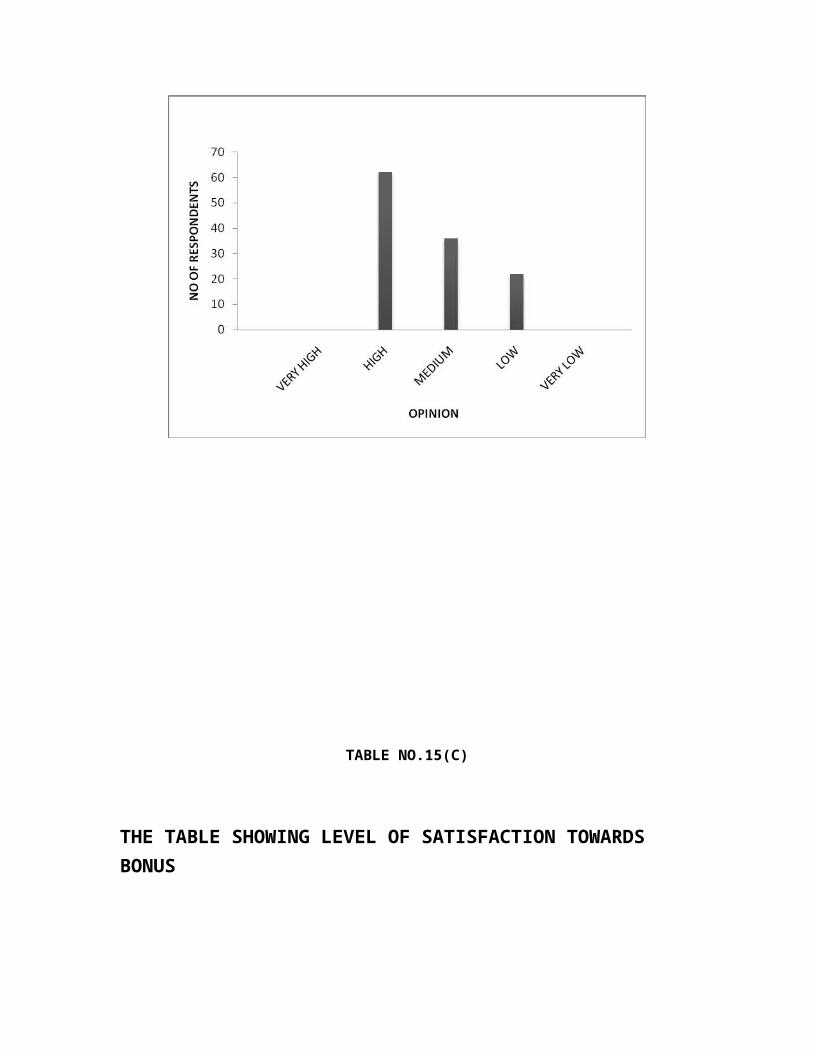
CHART NO.21
THE CHART SHOWING OPINION ABOUT THE SHIFT TIME
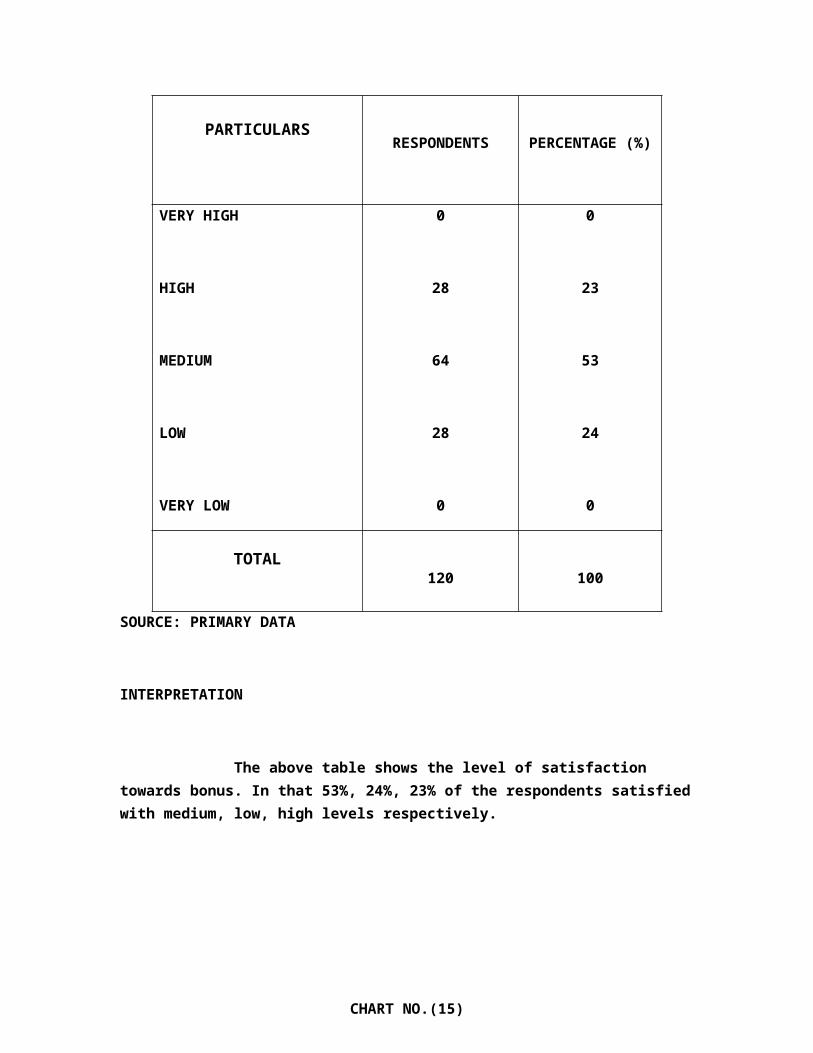
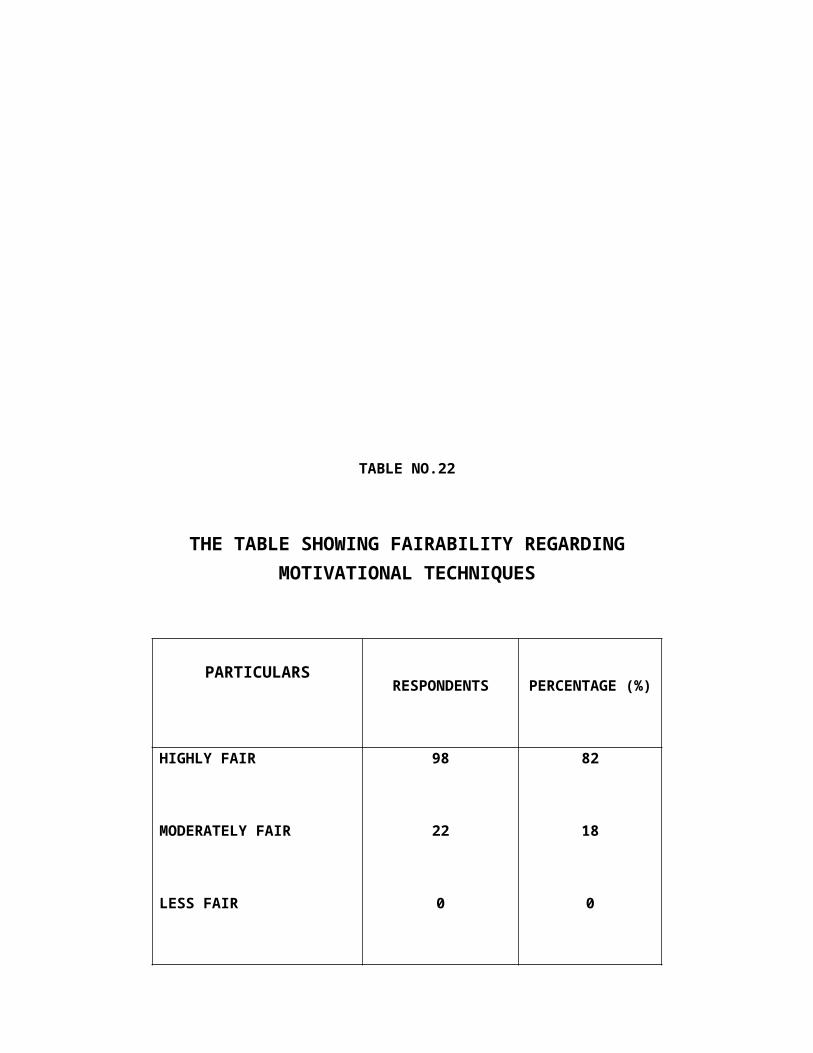
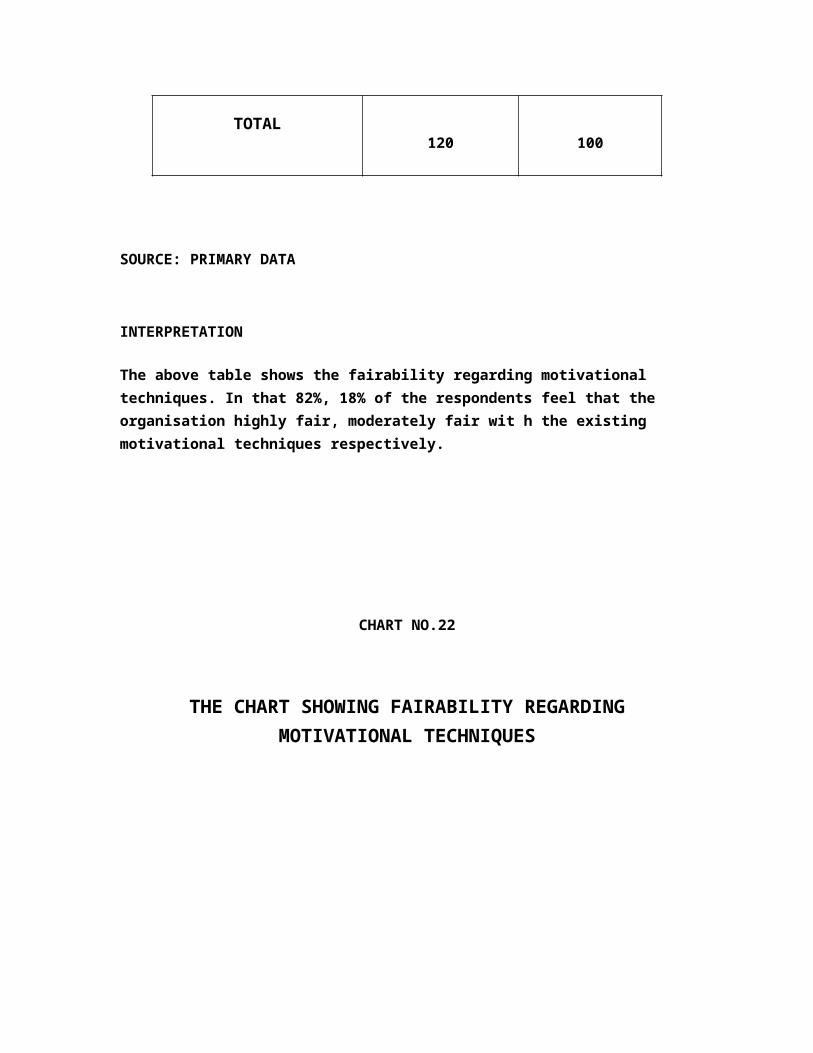
TABLE NO.22
THE TABLE SHOWING FAIRABILITY REGARDING MOTIVATIONAL TECHNIQUES
PARTICULARSRESPONDENTS PERCENTAGE (%)
HIGHLY FAIR
MODERATELY FAIR
LESS FAIR
98
22
0
82
18
0
TOTAL120 100
SOURCE: PRIMARY DATA
INTERPRETATION
The above table shows the fairability regarding motivational techniques. In that 82%, 18% of the respondents feel that the organisation highly fair, moderately fair wit h the existing motivational techniques respectively.
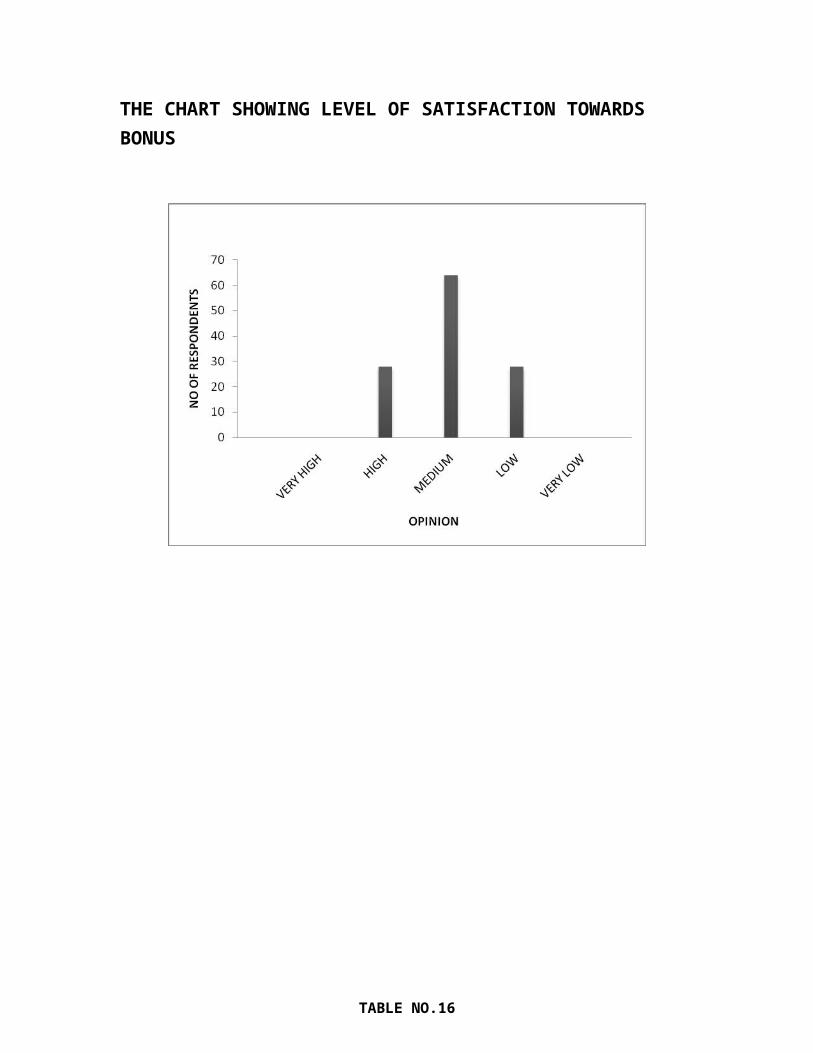
CHART NO.22
THE CHART SHOWING FAIRABILITY REGARDING MOTIVATIONAL TECHNIQUES
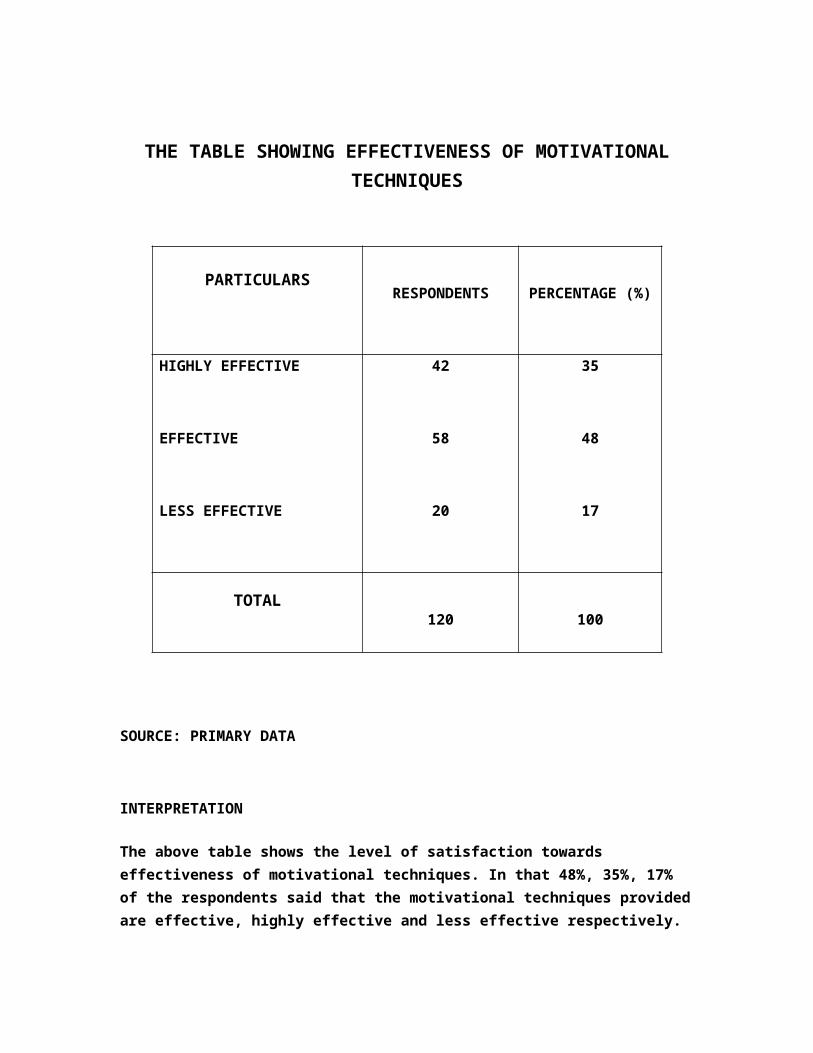
TABLE NO.23
THE TABLE SHOWING EMPLOYEES SUGGESTIONS TOWARDS MOTIVATIONAL TECHNIQUES
PARTICULARSRESPONDENTS PERCENTAGE (%)
FINANCIAL
NON- FINANCIAL
BOTH
36
22
62
30
18
52
TOTAL120 100
SOURCE: PRIMARY DATA
INTERPRETATION
The above table shows the employee suggestion towards motivational techniques. In that 52%, 30%, 18% o f the respondents suggest financial & non- financial, financial, non-financial motivational techniques respectively.

CHART NO.23
THE CHART SHOWING EMPLOYEES SUGGESTIONS TOWARDS MOTIVATIONAL TECHNIQUES
χ² TABLE
Effectiveness of motivational techniques provided
Kind of motivational
Technique suggest to
the organization
Ho:
There is no significance difference between the effectiveness of motivational techniques provided and the kind of motivational technique suggest to the organization.
H1:
There is a significance difference between the effectiveness of motivational techniques provided and the kind of motivational technique suggest to the organization.
Observed table
Factors Highly
Effective
Effective Less
Effective
Financial 19 13 10
Non-financial
12 15 09
Both 20 14 08
19 13 10 42
12 15 09 36
20 14 08 42
51 42 27 120
Expected frequency = Row total x Column total
Grand total
E (19) = 42x51/120 = 17.8
E (13) = 42x42/120 = 14.7
E (10) = 42x27/120 = 9.40
E (12) = 36x51/120 = 15.3
E (15) = 36x42/120 = 12.6
E (09) = 36x27/120 = 8.10
E (20) = 42x51/120 = 17.8
E (14) = 42x42/120 = 14.7
E (08) = 42x27/120 = 9.40
Expected table
17.8 14.7 9.40
15.3 12.6 8.10
17.8 14.7 9.40
χ² TABLE
O E O-E (O-E)² (O-E)² / E
19 17.8 1.2 1.44 0.0809
13 14.7 -1.7 2.89 0.1966
10 9.4 0.6 0.36 0.0383
12 15.3 -3.3 10.89 0.7118
15 12.6 2.4 5.76 0.4571
09 8.1 0.9 0.81 0.0900
20 2.2 4.81 0.2702
14 -0.7 0.49 0.0333
08 -1.4 1.96 0.2085
Total =2.0867
DEGREES OF FREEDOM:
= (r-1) x c-1)
= (3-1) x (3-1)
= 2x2
= 4
χ² table value for 5% at 4 degrees of freedom = 9.488
χ² calculated value < χ² table value
So, we accept Ho.
CONCLUSION:
There is no significance difference between the effectiveness of motivational techniques . Provided and the kind of motivational technique suggest to the organization.
ANOVA TABLE
H0¹:
There is no significance difference between the satisfaction levels.
H1¹:
There is a significance difference between the satisfaction levels.
H0²:
There is no significance difference between the factors.
H1²:
There is a significance difference between the factors.
LEVEL OF SATISFACTION
FINANCIAL
FACTORS
Calculation table:
FACTOR VERY HIGH
HIGH MEDIUM LOW VERY LOW
WATER
FACILITY
72 48 00 00 00
FIRSTAID
FACILITY
42 36 22 00 00
CANTEEN
FACILITY
30 40 34 16 00
RESTROOM
FACILITY
58 42 20 00 00
SAFETY
MEASURES
64 44 12 00 00
Calculations:
G = 600, N = 15
Correction Factor (CF) = G²/N = 600²/15 = 24,000
Total Sum of Squares (TSS) = ∑ Xij² - CF = 26,648-24,000 = 2,648
Sum of Square between Blocks (SSB) = ∑Ti²/ni – CF = 25,200-24,000 = 1,200
Sum of Square between Errors (SSE) = TSS – SSB = 2,648 – 1,200 = 1,448.
ANOVA table:
72 48 00 00 00 120 7200 7488
42 36 22 00 00 120 4800 3544
30 40 34 16 00 120 3600 3912
58 42 20 00 00 120 4800 5528
64 44 12 00 00 120 4800 6176
TOTAL 600 25200 26648
F calculated value (for row) < F table value (for row)
So, we accept H0.
F calculated value (for column) < F table value ( for column)
So, we accept H0.
CONCLUSION:
There is no significance difference between the satisfaction levels, and
There is no significance difference between the factors.
FINDINGS
Source of variation
Sum of
squares
Degrees of freedom
Mean sum of
Square
F calculated
Value
F table value
( for 5 %)
Between
Samples
1200 5-1=4 300 2.07 3.48
Error 1448 14-4=10 144.8
Total 2648 15-1=14
100% of the respondents are aware about the motivational techniques.
68% of the respondents are provided with both financial and non-financial motivational techniques.
49% of the respondents prefer financial motivational techniques.
50 % of the respondents prefers bonus as one of the financial motivational techniques.
33 % of the respondents prefer medical facilities as one of the non-financial motivational techniques.
33 % of the respondents are motivated by the superiors.
89 % of the respondents are getting motivated frequently.
47 % of the respondents expect financial benefits as one way of motivational techniques.
72 % of the respondents prefer to work in the same department.
70% of the respondents do not like job rotation.
73 % of the respondents agree that the company accepts their suggestions.
65 % of the respondents agree that the motivational techniques increase the production. In that 41% of the respondents said that the production increases at the rate of high.
45 % of the respondents agree that the performance increased at the rate of high after adopting motivational techniques.
60% of the respondents are satisfied at the rate of very high regarding water facilities.
42 % of the respondents are satisfied at the rate of very high regarding first aid facilities.
33% of the respondents are satisfied at the rate of medium regarding canteen facilities.
48 % of the respondents are satisfied at the rate of very high regarding rest room facilities.
53 % of the respondents are satisfied at the rate of very high regarding safety measures.
49 % of the respondents are satisfied at the rate of high regarding promotion facilities.
52 % of the respondents are satisfied at the rate of high regarding increment facilities.
53 % of the respondents are satisfied at the rate of medium regarding bonus facilities.
48% of the respondents said that the motivational techniques provided are effective.
62% of the respondents agree that the motivational techniques provided are sufficient.
78% of the respondents say that there is no deficiency with the existing motivational techniques.
60% of the respondents are highly satisfied with the level of superior’s relationship.
63% of the respondents are feeling that the job direction given is highly favorable.
67% of the respondents are feels that highly satisfied with the shift time.
82% of the respondents are feels that the organization highly fair with the motivational techniques.
52% of the respondents are suggesting both the financial and non-financial motivational techniques to the organization.
SUEEESTIONS:
1. The company should increase the bonus level. Because large number of respondents prefers bonus as the best way of financial motivation.
2. The company should concentrate on employees self motivational aspects.
3. The company has to see the motivational techniques they offer have the greater impact on job performance.
4. The company should liberalize the canteen system and should also consider offering canteen facilities to the night shift.
5. The company should try and modify the financial and non-financial motivational techniques as per the expectations of the employees as well as beneficial to the organization.
6. The company should explain to the employees about the benefits of job rotation.
7. The company has been using off the date motivational techniques, thus the company should implement effective and on to date motivational techniques.
BIBILIOGRAPHY
Organizational behaviour – L.M. Prasad – sultan chand & sons
Research methodology – C.R. Kothari – new age international publishers
Marketing management – Kotler & Keller – prentice hall India
Research methods – Tamilnadu open university
Human resource management – P. Subharao, V S P Rao – konark publishers (p) ltd
www.yahoo.com
www.kamdagirimills.com
PROJECT QUESTIONNAIRE
TITLE:
A study on effectiveness of motivational techniques with special reference to kandagiri spinning mills limited, unit –I, Salem.
QUESTIONNAIRE:
Respondent details:
Name : Department:
Age : 20-30 / 31-40 / 41-50 / >50 Designation:
Gender: M / F.M Experience :< 1year / 1-3 / 3-5/>5years
1) Are you aware about the motivational techniques followed by the organisation?
a) Yes [ ] b) No [ ]
2) What are the motivational techniques being adopted by the organisation?
a) Financial [ ] b) Non-financial [ ] c) Both [ ]
3) What kind of motivational techniques do you like the most?
a) Financial [ ] b) Non-financial [ ] c) Both [ ]
4) Which of the financial motivational techniques attracts you the most?
a) Bonus [ ] b) Attendance incentives [ ] c) Increments [ ]
5) Which of the Non-financial motivational techniques attracts you the most?
a) Gifts [ ] b) Get together party [ ] c) Medical facilities [ ] . d) Educational facilities [ ]
6) Who usually motivates you?
a) Superiors [ ] b) Sub-ordinates [ ] c) Co-workers [ ] d) Self-motivation [ ]
7) Do the company motivate you frequently?
a) Yes [ ] b) No [ ]
8) Normally what do you expect from the motivational techniques?
a) Financial benefit [ ] b) Develop the knowledge &skill [ ] c) Increases the hope & confidence [ ]
9) Have you been working in the same department from the beginning?
a) Yes [ ] b) No [ ]
10) Do you like job rotation?
a) Yes [ ] b) No [ ]
11) Do the company ask/accept any suggestions from you?
a) Yes [ ] b) No [ ]
12) Do you think the motivational techniques increases the productivity?
a) Yes [ ] b) No [ ]
If yes, describe the level
a) High [ ] b) Moderate [ ] c) Low [ ]
13) To what extent your performance improved after adopting motivational techniques?
a) Highly Improved [ ] b) Moderately Improved [ ] c) Improved [ ]
14) Rate the following factors based on your level of satisfaction
Factor/Rate Very high High Medium Low Very low
Water facilities
First aid facilities
Canteen facilities
Restroom facilities
Safety measures
15) Rate the following factors based on your level of satisfaction
Factor/Rate Very high High Medium Low Very low
Promotion
Increment
Bonus
16) Can you say that the motivational techniques provided are effective?
a) Highly effective [ ] b) effective [ ] c) Less effective [ ]
17) Can you say that the motivational techniques provided in your organisation are . Sufficient
a) Yes [ ] b) No [ ]
18) Do you think there is any deficiency with the existing motivational techniques?
a) Yes [ ] b) No [ ]
If yes, describe the level
a) High [ ] b) Moderate [ ] c) Low [ ]
19) Can you describe your relationship with the superiors?
a) Highly satisfied [ ] b) Satisfied [ ] c) Less satisfied [ ]
20) Do you think the job direction given is favourable?
a) Highly favourable [ ] b) Favourable [ ] c) Less favourable [ ]
21) Are you satisfied with the shift timing in your organisation?
a) Highly satisfied [ ] b) Satisfied [ ] c) Not satisfied [ ]
22) Do you think the organisation fair with the motivational techniques?
a) Highly fair [ ] b) Moderately fair [ ] c) fair [ ]
23) What kind of motivational techniques would you suggest to your organisation?
a) Financial [ ] b) Non-financial [ ] c) Both [ ]
24) What are your expectations regarding motivational techniques