Public Works Contract for CIVIL ENGINEERING WORKS designed ...

Attachments B.10 – F.2
Attachment B.10 - Proof of Funding (Page 1 – 2) Technical Scoping Report 2011 (Page 3 – 18) WWTP Improvement Programme Timeframe (Page 19)
Attachment C.1a - Operational Information Drawing – C1 WWTP Schematic
Attachment C.1.1 - Storm Water Overflows - Assessment Attachment C.1.2 - Pumping Stations Attachment C.2 - Outfall Design and Construction Attachment D.1 - Influent Monitoring Data, 2012 Attachment E.2 - Programme for Environmental Monitoring Attachment E.4a - Final Effluent Monitoring @ SW1, 2012 Attachment E.4b - Compliance with Monitoring Requirements and Treatment
Standards Attachment F.1 - Assessment of Impact on Receiving Surface or Ground
Water Attachment F.2 - Tabular Data on Drinking Water Abstraction Point(s)
For
insp
ectio
n pur
pose
s only
.
Conse
nt of
copy
right
owne
r req
uired
for a
ny ot
her u
se.
EPA Export 25-04-2013:23:32:12

∙ Contract 4 (M&E Works) W 3,749,000
∙ Network (M3 Interface Works) W 1,060,000
Meath Grouped Towns & Villages Sewerage ∙ Contract 2 (Wastewater Treatment
Scheme1 Plant - DBO) S 30,801,000
∙ Contract 3 (Networks) S 10,245,000
∙ Contract 4 (Networks) S 13,306,000
Navan Mid-Meath Water Supply Scheme ∙ Contract 2 (Network & Reservoirs
- Carn Hill) W 13,741,000
∙ Contract 3 (Network - Southern Ring) W 6,373,000
∙ Network (M3 Interface Works) W 2,684,000
∙ Networks (Civil Works - N51) W 1,297,000
Offaly
Edenderry Sewerage Scheme ∙ Contract 1 Sewers & Watermains S 1,876,000
South Dublin
Boherboy Water Supply Scheme ∙ Contract 2 (Civil Works) W 34,553,000
∙ Contract 3 (M&E Works) W 1,152,000
Lucan Sewerage Scheme (SLI) ∙ Civil Works (Tobermaclugg
Stream Upgrade) S 7,711,000
Wicklow
Arklow Water Supply Scheme Phase 3 ∙ Contract 1A (Wellfield Development) W 1,942,000
∙ Contract 1B (Woodenbridge
Collection Main) W 751,000
∙ Contract 1C (Woodenbridge
Pumping Station) W 745,000
West Wicklow Water Supply Scheme Phase 1 ∙ Contract 2 (M&E Works - Blessington) W 1,380,000
Wicklow Sewerage Scheme ∙ Wastewater Treatment Plant - DBO S 24,409,000
Wicklow Town Water Supply Scheme ∙ Contract 3 (Network - Port Access W 5,887,000
and Town Relief Road)
TOTAL 477,640,000
1 Athboy, Donore, Duleek, Kilmainhamwood, Moynalty, Rathcairn, Rathmolyon and Summerhill
CONTRACTS TO START 2010 – 2012
Dublin City
North City Water Supply Scheme ∙ Network (Arterial Watermain)
Phases 1 & 2 W 6,900,000
North Docklands Sewerage Scheme ∙ Contract 1 (Spencer Dock
Pumping Station) S 6,430,000
∙ Contract 2 (Spencer Dock to
Ringsend Rising Main) S 3,619,000
∙ Contract 3 (River Liffey Services) S 3,708,000
∙ Contract 4 (Network Upgrade) S 9,463,000
20
Scheme Name Contract Name W/S Estimated
Cost €
Water Services Investment Programme 2010-2012Attachment B10 Lower Liffey Valley Regional Sewerage Scheme
1 of 19
For
insp
ectio
n pur
pose
s only
.
Conse
nt of
copy
right
owne
r req
uired
for a
ny ot
her u
se.
EPA Export 25-04-2013:23:32:12
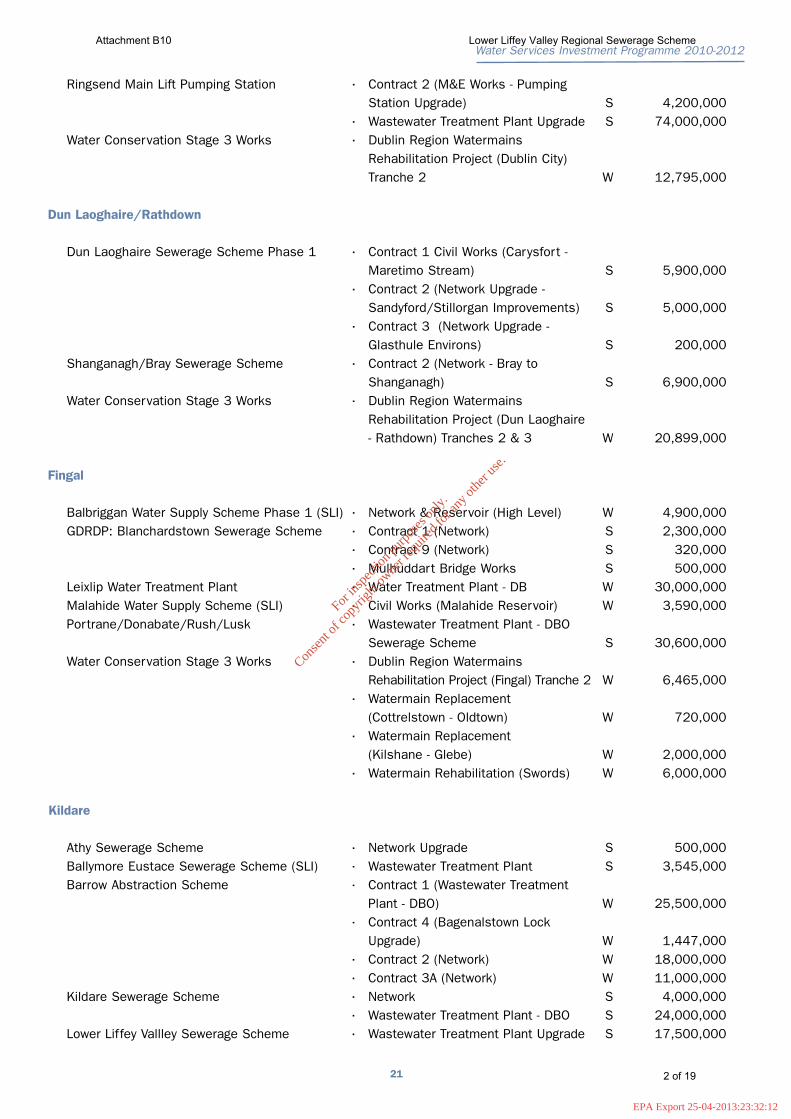
Ringsend Main Lift Pumping Station ∙ Contract 2 (M&E Works - Pumping
Station Upgrade) S 4,200,000
∙ Wastewater Treatment Plant Upgrade S 74,000,000
Water Conservation Stage 3 Works ∙ Dublin Region Watermains
Rehabilitation Project (Dublin City)
Tranche 2 W 12,795,000
Dun Laoghaire/Rathdown
Dun Laoghaire Sewerage Scheme Phase 1 ∙ Contract 1 Civil Works (Carysfort -
Maretimo Stream) S 5,900,000
∙ Contract 2 (Network Upgrade -
Sandyford/Stillorgan Improvements) S 5,000,000
∙ Contract 3 (Network Upgrade -
Glasthule Environs) S 200,000
Shanganagh/Bray Sewerage Scheme ∙ Contract 2 (Network - Bray to
Shanganagh) S 6,900,000
Water Conservation Stage 3 Works ∙ Dublin Region Watermains
Rehabilitation Project (Dun Laoghaire
- Rathdown) Tranches 2 & 3 W 20,899,000
Fingal
Balbriggan Water Supply Scheme Phase 1 (SLI) ∙ Network & Reservoir (High Level) W 4,900,000
GDRDP: Blanchardstown Sewerage Scheme ∙ Contract 1 (Network) S 2,300,000
∙ Contract 9 (Network) S 320,000
∙ Mulhuddart Bridge Works S 500,000
Leixlip Water Treatment Plant ∙ Water Treatment Plant - DB W 30,000,000
Malahide Water Supply Scheme (SLI) ∙ Civil Works (Malahide Reservoir) W 3,590,000
Portrane/Donabate/Rush/Lusk ∙ Wastewater Treatment Plant - DBO
Sewerage Scheme S 30,600,000
Water Conservation Stage 3 Works ∙ Dublin Region Watermains
Rehabilitation Project (Fingal) Tranche 2 W 6,465,000
∙ Watermain Replacement
(Cottrelstown - Oldtown) W 720,000
∙ Watermain Replacement
(Kilshane - Glebe) W 2,000,000
∙ Watermain Rehabilitation (Swords) W 6,000,000
Kildare
Athy Sewerage Scheme ∙ Network Upgrade S 500,000
Ballymore Eustace Sewerage Scheme (SLI) ∙ Wastewater Treatment Plant S 3,545,000
Barrow Abstraction Scheme ∙ Contract 1 (Wastewater Treatment
Plant - DBO) W 25,500,000
∙ Contract 4 (Bagenalstown Lock
Upgrade) W 1,447,000
∙ Contract 2 (Network) W 18,000,000
∙ Contract 3A (Network) W 11,000,000
Kildare Sewerage Scheme ∙ Network S 4,000,000
∙ Wastewater Treatment Plant - DBO S 24,000,000
Lower Liffey Vallley Sewerage Scheme ∙ Wastewater Treatment Plant Upgrade S 17,500,000
21
Water Services Investment Programme 2010-2012Attachment B10 Lower Liffey Valley Regional Sewerage Scheme
2 of 19
For
insp
ectio
n pur
pose
s only
.
Conse
nt of
copy
right
owne
r req
uired
for a
ny ot
her u
se.
EPA Export 25-04-2013:23:32:12

Attachment B10 Lower Liffey Valley Regional Sewerage Scheme
3 of 19
For
insp
ectio
n pur
pose
s only
.
Conse
nt of
copy
right
owne
r req
uired
for a
ny ot
her u
se.
EPA Export 25-04-2013:23:32:12

Attachment B10 Lower Liffey Valley Regional Sewerage Scheme
4 of 19
For
insp
ectio
n pur
pose
s only
.
Conse
nt of
copy
right
owne
r req
uired
for a
ny ot
her u
se.
EPA Export 25-04-2013:23:32:12

Attachment B10 Lower Liffey Valley Regional Sewerage Scheme
5 of 19
For
insp
ectio
n pur
pose
s only
.
Conse
nt of
copy
right
owne
r req
uired
for a
ny ot
her u
se.
EPA Export 25-04-2013:23:32:12

Attachment B10 Lower Liffey Valley Regional Sewerage Scheme
6 of 19
For
insp
ectio
n pur
pose
s only
.
Conse
nt of
copy
right
owne
r req
uired
for a
ny ot
her u
se.
EPA Export 25-04-2013:23:32:12

Attachment B10 Lower Liffey Valley Regional Sewerage Scheme
7 of 19
For
insp
ectio
n pur
pose
s only
.
Conse
nt of
copy
right
owne
r req
uired
for a
ny ot
her u
se.
EPA Export 25-04-2013:23:32:12

Attachment B10 Lower Liffey Valley Regional Sewerage Scheme
8 of 19
For
insp
ectio
n pur
pose
s only
.
Conse
nt of
copy
right
owne
r req
uired
for a
ny ot
her u
se.
EPA Export 25-04-2013:23:32:12

Attachment B10 Lower Liffey Valley Regional Sewerage Scheme
9 of 19
For
insp
ectio
n pur
pose
s only
.
Conse
nt of
copy
right
owne
r req
uired
for a
ny ot
her u
se.
EPA Export 25-04-2013:23:32:12

Attachment B10 Lower Liffey Valley Regional Sewerage Scheme
10 of 19
For
insp
ectio
n pur
pose
s only
.
Conse
nt of
copy
right
owne
r req
uired
for a
ny ot
her u
se.
EPA Export 25-04-2013:23:32:12

Attachment B10 Lower Liffey Valley Regional Sewerage Scheme
11 of 19
For
insp
ectio
n pur
pose
s only
.
Conse
nt of
copy
right
owne
r req
uired
for a
ny ot
her u
se.
EPA Export 25-04-2013:23:32:12

Attachment B10 Lower Liffey Valley Regional Sewerage Scheme
12 of 19
For
insp
ectio
n pur
pose
s only
.
Conse
nt of
copy
right
owne
r req
uired
for a
ny ot
her u
se.
EPA Export 25-04-2013:23:32:13

Attachment B10 Lower Liffey Valley Regional Sewerage Scheme
13 of 19
For
insp
ectio
n pur
pose
s only
.
Conse
nt of
copy
right
owne
r req
uired
for a
ny ot
her u
se.
EPA Export 25-04-2013:23:32:13

Attachment B10 Lower Liffey Valley Regional Sewerage Scheme
14 of 19
For
insp
ectio
n pur
pose
s only
.
Conse
nt of
copy
right
owne
r req
uired
for a
ny ot
her u
se.
EPA Export 25-04-2013:23:32:13

Attachment B10 Lower Liffey Valley Regional Sewerage Scheme
15 of 19
For
insp
ectio
n pur
pose
s only
.
Conse
nt of
copy
right
owne
r req
uired
for a
ny ot
her u
se.
EPA Export 25-04-2013:23:32:13

Attachment B10 Lower Liffey Valley Regional Sewerage Scheme
16 of 19
For
insp
ectio
n pur
pose
s only
.
Conse
nt of
copy
right
owne
r req
uired
for a
ny ot
her u
se.
EPA Export 25-04-2013:23:32:13

Attachment B10 Lower Liffey Valley Regional Sewerage Scheme
17 of 19
For
insp
ectio
n pur
pose
s only
.
Conse
nt of
copy
right
owne
r req
uired
for a
ny ot
her u
se.
EPA Export 25-04-2013:23:32:13

Attachment B10 Lower Liffey Valley Regional Sewerage Scheme
18 of 19
For
insp
ectio
n pur
pose
s only
.
Conse
nt of
copy
right
owne
r req
uired
for a
ny ot
her u
se.
EPA Export 25-04-2013:23:32:13

ID Task Name Start Finish
1 Commencement Wed 12/01/11 Wed 12/01/11
2 Review of Works requirements Wed 12/01/11 Fri 21/01/11
3 Review by KCC Mon 24/01/11 Fri 28/01/11
4 Finalise contract scope Mon 31/01/11 Fri 04/02/11
5 Agree to proceed with prequal and tender docs KCC/ DEHLG Mon 07/02/11 Fri 05/08/11
6 Prequalification (if required) Mon 18/07/11 Fri 11/11/11
7 Prepare prequalification docments Mon 18/07/11 Fri 05/08/11
8 Approval of prequalification documents Mon 08/08/11 Fri 26/08/11
9 Advertise Contract Fri 26/08/11 Fri 26/08/11
10 Prequalification period Mon 29/08/11 Thu 06/10/11
11 Summary report on prequalification submissions Fri 07/10/11 Fri 04/11/11
12 Shortlist tenderers Mon 07/11/11 Fri 11/11/11
13 Preliminary contracts Mon 28/02/11 Fri 20/05/11
14 Flow and load survey tender & award Mon 28/02/11 Fri 25/03/11
15 Flow and load survey Mon 28/03/11 Fri 20/05/11
16 Ground survey tender and award Mon 14/03/11 Fri 08/04/11
17 Ground survey Mon 11/04/11 Fri 06/05/11
18 Tender Process Mon 08/08/11 Fri 22/03/13
19 Modify tender documents Mon 08/08/11 Fri 09/09/11
20 Tender document approval Mon 12/09/11 Fri 20/04/12
21 Finalise tender documents Mon 23/04/12 Mon 21/05/12
22 Tender period Tue 22/05/12 Fri 31/08/12
23 Report on tenders Mon 03/09/12 Fri 21/12/12
24 Issue Alcatel letters Mon 24/12/12 Fri 04/01/13
25 Standstill Period Mon 07/01/13 Wed 06/02/13
26 Approval of report on tenders Mon 24/12/12 Fri 08/02/13
27 Contract signing Mon 11/02/13 Fri 22/03/13
28 Construction Commencement Mon 25/03/13 Mon 25/03/13
29 Section 1 Construction Tue 26/03/13 Mon 30/12/13
30 Detailed design Tue 26/03/13 Mon 17/06/13
31 Site setup, fencing etc Tue 26/03/13 Mon 22/04/13
32 Construction of balancing tank Tue 09/04/13 Mon 15/07/13
33 Inlet PS and rising main Tue 23/04/13 Mon 12/08/13
34 Inlet works upgrade Tue 21/05/13 Mon 12/08/13
35 Diversion of inlet sewers and commissioning of balancing tank Tue 13/08/13 Mon 26/08/13
36 Construction of new primary treatment unit Tue 02/07/13 Mon 21/10/13
37 Upgrade of existing primary settlement tanks Tue 22/10/13 Mon 16/12/13
38 Diversion of flows to new PST and new FDC Tue 17/12/13 Mon 30/12/13
39 Provision of new of tertiary filter Tue 02/07/13 Mon 21/10/13
40 Modifications to 2 No. existing settlement tanks Tue 22/10/13 Mon 02/12/13
41 Commissioning of works for additional flows Tue 03/12/13 Mon 16/12/13
42 Completion of Section 1 Mon 16/12/13 Mon 16/12/13
43 Section 2 Construction Tue 24/09/13 Mon 19/05/14
44 New process tanks for plant expansion Tue 24/09/13 Mon 27/01/14
45 Draindown and upgrade of final settlment tanks Tue 24/09/13 Mon 04/11/13
46 Refurbishment of tertiary filters Tue 24/09/13 Mon 18/11/13
47 Aeration tank modifications / anoxic zones Tue 22/10/13 Mon 10/02/14
48 Modifications to sludge returrn/waste / recirculation Tue 14/01/14 Mon 10/03/14
49 Modifications to phosphorus removal system Tue 25/02/14 Mon 24/03/14
50 Modifications to existing site pipework and FDC's Tue 17/12/13 Mon 10/03/14
51 Expansion of sludge treatment capacity Tue 24/09/13 Mon 16/12/13
52 Modifications to control system Tue 11/02/14 Mon 21/04/14
53 Commissioning and testing of Upgrade works Tue 25/03/14 Mon 19/05/14
54 Completion of Section 2 Works Mon 19/05/14 Mon 19/05/14
55 Section 3 Construction Tue 17/12/13 Mon 19/01/15
56 New primary settlement unit Tue 20/05/14 Mon 22/09/14
57 New/modified process tanks for plant expansion Tue 23/09/14 Mon 03/11/14
58 Expansion of sludge treatment capacity Tue 17/12/13 Mon 10/02/14
59 Modifications to existing site pipework and FDC's Tue 11/03/14 Mon 05/05/14
60 Modifications to control system Tue 04/11/14 Mon 29/12/14
61 Commissioning and initial testing of expanded works Tue 02/12/14 Mon 19/01/15
62 Completion of Section 3 Works Mon 19/01/15 Mon 19/01/15
63 Section 4 Construction Tue 04/11/14 Mon 15/06/15
64 Construction of administration and control building Tue 04/11/14 Mon 23/02/15
65 Construction of workshop building Tue 27/01/15 Mon 20/04/15
66 Leachate/imported sludge acceptance facilities Tue 04/11/14 Mon 09/02/15
67 Upgrade to odour control system Tue 04/11/14 Mon 26/01/15
68 Covers for process tanks Tue 04/11/14 Mon 15/12/14
69 Modifications to control system Tue 30/12/14 Mon 26/01/15
70 Landscaping, site roads etc. Tue 10/03/15 Mon 04/05/15
71 Commissioning and testing complete works Tue 05/05/15 Mon 15/06/15
72 Completion of Section 4 Works Mon 15/06/15 Mon 15/06/15
73 Commencement of process proving (Section 5) Mon 15/06/15 Mon 15/06/15
12/01
26/08
25/03
16/12
19/05
19/01
15/06
15/06
Dec Jan Feb Mar Apr May Jun Jul Aug Sep Oct Nov Dec Jan Feb Mar Apr May Jun Jul Aug Sep Oct Nov Dec Jan Feb Mar Apr May Jun Jul Aug Sep Oct Nov Dec Jan Feb Mar Apr May Jun Jul Aug Sep Oct Nov Dec Jan Feb Mar Apr May Jun Jul Aug SQtr 1, 2011 Qtr 2, 2011 Qtr 3, 2011 Qtr 4, 2011 Qtr 1, 2012 Qtr 2, 2012 Qtr 3, 2012 Qtr 4, 2012 Qtr 1, 2013 Qtr 2, 2013 Qtr 3, 2013 Qtr 4, 2013 Qtr 1, 2014 Qtr 2, 2014 Qtr 3, 2014 Qtr 4, 2014 Qtr 1, 2015 Qtr 2, 2015 Qtr 3, 2015
Critical
Critical Split
Task
Split
Milestone
Summary
Inactive Milestone
Inactive Summary
Manual Task
Duration-only
Manual Summary Rollup
Manual Summary
Start-only
Finish-only
External Tasks
External Milestone
Progress
Lower Liffey Valley SS -WWTW Upgrade - Outline Contract Programme
Page 1
Project: Lower Liffey Valley WWTP Upgrade
Attachment B10 Lower Liffey Valley Regional Sewerage Scheme
19 of 19
For
insp
ectio
n pur
pose
s only
.
Conse
nt of
copy
right
owne
r req
uired
for a
ny ot
her u
se.
EPA Export 25-04-2013:23:32:13

ATTACHMENT C.1a Operational Information Requirements The existing Leixlip Wastewater Treatment Plant is divided into two separate treatment streams – (a) Main Stream and (b) Intel Stream (a) Main Stream The Main Stream treats waste from the entire catchment including Straffan, Leixlip, Celbridge, Kilcock and Maynooth. This part of the plant has a design pe of 45,000 and the process may be divided as follows: (1) Inlet Works/Preliminary Treatment (a) Screening Effluent from the Leixlip Main Drainage System initially passes through a stone collection chamber. This chamber consists of a rectangular shaped tank where stones and additional large items settle out. Between the stone trap and the Main Inlet screens is the storm overflow weir, which is addressed later. The Main Inlet screens, three 6mm aperture J&A Hi-Flow screens, operate in a duty/standby mode with normally two screens in duty and one on standby. In the event of one screen failure the standby will be brought into operation. In the event of two screens failing, depending on influent flow, some wastewater may overflow the storm weir. Should all three screens fail then the screens will quickly become blocked and all the wastewater from the catchment will overflow the storm weir. The failure of any of the three inlet screens will activate a 24-hour dial out alarm. (b) Main Inlet Pumps Following screening the wastewater enters pump station (PS) 1. PS1 has three pumps in a duty/assist/standby arrangement. In the event of the failure of one of the pumps the standby will be activated. Two of the three pumps have a capacity of 191 to 238 l/sec each, while the standby has a capacity of 369 to 409 l/sec. If two pumps fail wastewater will backup and overflow the storm weir, the volume overflowing, if any, will be vary depending on rainfall conditions. During dry weather one pump is generally sufficient to pump all the wastewater. The failure of any of the three inlet pumps will activate a 24-hour dial out alarm.
Attachment C.1a Lower Liffey Valley Regional Sewerage Scheme
1 of 6
For
insp
ectio
n pur
pose
s only
.
Conse
nt of
copy
right
owne
r req
uired
for a
ny ot
her u
se.
EPA Export 25-04-2013:23:32:13

(c) Grit Removal The wastewater is pumped from PS1 into the grit trap. Failure of the grit trap will result in its diversion by gravity to the next stage and no direct discharge to the aqueous environment will occur. (d) Flow Splitting After grit removal the influent wastewater is split with the bulk continuing on to the Main Plant Primary treatment stage and a contributory diverted to the Intel Stream. The split ratio is dictated by penstocks on both lines. This area operates by gravity so there will be no direct discharge to the aqueous environment. (2) Primary Treatment After preliminary treatment the wastewater passes through the two primary settlement tanks. The wastewater at this stage is basically allowed to settle thereby reducing the load on the next treatment stage. These tanks have a combined capacity of 3,196 m3. Failure in these tanks will result in the wastewater bypassing by gravity to the next stage thereby not allowing any direct discharge to the aqueous environment. (3) Secondary Treatment The primary supernatant enters Flow Distribution Chamber (FDC) 6 where it mixes with Returned Activated Sludge (RAS) prior to entering the two aeration tanks. This transfer to the aeration basins is achieved by gravity thereby not allowing any direct discharge to the aqueous environment. (a) Aeration zone The primary supernatant and RAS are aerated in two surface activated aeration tanks, two aerators per tank. The dissolved oxygen is maintained at 1.0 ppm O2 with Mixed Liquor Suspended Solids (MLSS) of approximately 2,400 mg/l. Ferric sulphate is added post aeration to allow phosphorous precipitation in the final settlement tanks. The MLSS exits the aeration tanks by gravity thereby not allowing any direct discharge to the aqueous environment. (b) Final settlement The Main Plant utilises three final settlement tanks as the final stage of treatment. After aeration the MLSS travels by gravity to PS5. From there the final settlement tanks A1 and A2 are gravity fed while final settlement tank A3 is pumped. The pumps supplying A3 operate on a duty/standby arrangement. Failure of both these pumps will result in all the MLSS going to settlement tanks A1 and A2. After final settlement the effluent flows by gravity, mixing with the filtered Intel effluent, to the single final effluent outfall at SW1-P.
Attachment C.1a Lower Liffey Valley Regional Sewerage Scheme
2 of 6
For
insp
ectio
n pur
pose
s only
.
Conse
nt of
copy
right
owne
r req
uired
for a
ny ot
her u
se.
EPA Export 25-04-2013:23:32:13

(c) Return activated sludge RAS from the final settlement tanks is returned by gravity to PS8 where it is pumped into FDC 6 and mixed with the primary supernatant. This pump station operates with two pumps in a duty/assist mode. Generally one pump is sufficient in PS8 however if both pumps were to malfunction sludge would built up in the settlement tanks eventually overflowing via the plant outfall, SW1-P. The failure of either of the two pumps will activate a 24-hour dial out alarm. (b) Intel Stream The Intel Stream treats wastewater from the Intel Ireland facility in Leixlip, their process and domestic contributions, and a contribution from the main catchment. The Intel facility typically discharges 7,000 to 8,000 m3/day with the catchment contribution adding an additional 4,000 to 7,000 m3/day. This part of the waste water treatment plant has a design pe of 35,000 and the process may be divided as follows: (1) Preliminary Treatment (a) Screening The Intel screening equipment comprises a J&A rotating bar interceptor screen followed by a J&A Beltafine Screen, 6mm aperture; both designed for a maximum flow of 270 l/sec. As only one screen is available a manually operated non-screened by pass channel is available. Screen failure accompanied by not manually opening the by-pass will result in wastewater overflowing the storm weir. Failure of the screen will activate an automatic dial out alarm. (b) Inlet pumps Following screening the inlet flow is pumped to the selector tank by means of three submersible pumps. Each pump is designed to pump a flow of 135 l/sec against a head of 9.7m. These pumps operate in a duty/assist/standby arrangement. Failure of two or more pumps will result in wastewater overflowing the storm weir. Failure of any of these three pumps will activate a 24-hour dial out alarm.
Attachment C.1a Lower Liffey Valley Regional Sewerage Scheme
3 of 6
For
insp
ectio
n pur
pose
s only
.
Conse
nt of
copy
right
owne
r req
uired
for a
ny ot
her u
se.
EPA Export 25-04-2013:23:32:13

(2) Aeration Zone (a) Selector tank Wastewater is initially pumped to a selector tank located directly upstream of the aeration basins. Raw wastewater and RAS mix in this anoxic tank thereby optimising conditions with a view to avoidance of bulking sludge problems in the aeration tanks. Wastewater exits the tank by gravity thereby failure here will not allow direct discharge to the aqueous environment. (c) Aeration basins Two aeration basins are utilised and the are designed as a plug flow system. An anoxic zone, for denitrification, is incorporated on the inlet side of the aeration basins. Fine bubble diffusion is used to maintain dissolved oxygen of approximately 2 ppm O2 and the MLSS is typically 3,500 mg/l. Ferric sulphate is added post aeration to facilitate precipitation of phosphate in the final settlement tanks. MLSS exits the basins by gravity so any failure would not result in a direct discharge to the aqueous environment. (d) Final Settlement Two final settlement tanks are in use. In normal operation flow from the aeration basins gravitates to FDC 3 where it is split equally between the two final settlement tanks. Following settlement the supernatant flows by gravity to the rapid gravity filter units. Thereby any failure here would not result in a direct discharge to the aqueous environment. (e) Activated sludge pumping RAS is returned to the selector tank from the settlement tanks by three return pumps located in PS10. These pumps operate in a two duty one standby mode. Failure of one of these pumps will result in the standby coming into operation. Failure of two or more of these pumps would eventually result in the loss of settled sludge from the settlement tanks. This sludge would flow by gravity to the tertiary filters. Failure of any of these three pumps will activate a 24-hour dial out alarm. (3) Tertiary (Rapid Gravity Filter Units) The treated secondary effluent from the settlement tanks flows by gravity to four tertiary filters. The filters provide final polishing of the treated wastewater before it combines with the treated wastewater from the Main Plant and is discharged to the Liffey at SW1-P. Failure or overloading of the filter units will lead to them being
Attachment C.1a Lower Liffey Valley Regional Sewerage Scheme
4 of 6
For
insp
ectio
n pur
pose
s only
.
Conse
nt of
copy
right
owne
r req
uired
for a
ny ot
her u
se.
EPA Export 25-04-2013:23:32:13

bypassed by gravity. The unfiltered wastewater will still combine with the Main Plant final effluent before discharge at SW1-P. (c) Storm Water Discharge As outlined above mechanical failure up and including both sets of inlet pumps and/or storm flow conditions will result in the loss of untreated wastewater to the storm water units. Storm water from both preliminary units’ travel by a shared pipe to PS3 where it is pumped into the storm tank. (1) PS3 PS3 consists of a submersible pump sump in which two submersible pumps are installed. Both pumps are capable of pumping 142 l/s at a head of 9.5m and operate in a duty/assist arrangement. The sump also contains a 300mm diameter overflow which discharges direct to the Liffey via SW2. Failure of both these pumps will result in the bypassing of the storm tank via this overflow. (2) Storm water holding tank The storm water holding tank has a storage capacity of 1,200m3 and is constructed in a rectangular shape giving an internal length of 30m thereby optimising sludge settling time. Settled sewage exits the tank by gravity and enters the Liffey at SW2. When conditions are favourable, i.e. storm flows from the catchment reduce, the tank is emptied via PS7 back to the Main Inlet. This is an automatic return which is activated when the forward flow from PS1 falls below a predetermined level. The SWO system, which discharges at SW2, does not comply with the definition of a storm water overflow. Currently the inlet works have a combined forward pumping capacity of 3DWF while the storm tank provides one hours storage of DWF. (d) Emergency Generator The site is equipped with an 1100kVA standby generator, which will automatically power up in the event of a failure in the incoming electricity supply. (e) Emergency Outfall The emergency outfall, SWP-PE, shown on Drawing Leixlip C1 is actually the outfall that was used during the last expansion of the plant, late 1990’s. Its value as an emergency outfall is minimal, as it should only come into service if the plant outfall, SW1-P, becomes physically blocked through for example its structural collapse.
Attachment C.1a Lower Liffey Valley Regional Sewerage Scheme
5 of 6
For
insp
ectio
n pur
pose
s only
.
Conse
nt of
copy
right
owne
r req
uired
for a
ny ot
her u
se.
EPA Export 25-04-2013:23:32:13

(f) On-site Laboratory Leixlip wastewater treatment plant has an on-site laboratory, which provides process monitoring and regulatory required effluent analysis. Monitoring routinely carried out relevant to this application is presented in the table below.
Parameter Analytical Method CBOD5 DO probe and 5 day incubation COD Digestion and spectrophometry Total Nitrogen Digestion and colorimetry Total Phosphorous Digestion and colorimetry Nitrate Colorimetry Nitrite Colorimetry Ammonia Nessler colorimetry pH pH meter Suspended solids Gravimetric Fluoride Colorimetry The site laboratory participates in the EPA Intercalibration Programme for BOD, COD and Suspended Solids. Summary Mechanical failure in both preliminary units, up to and including both sets of inlet pumps, may result in an overflow at the storm overflow weirs. Depending on the nature of the failure and duration wastewater may enter the aqueous environment via SW2. Any failure after the preliminary units may, depending on the nature of the failure, result in the discharge of partially treated wastewater/sludge via SW1-P. Critical areas are monitored and failure will activate a 24-hour dial out alarm system. The plant has a standby generator which will automatically start in the event of the incoming electricity failing.
Attachment C.1a Lower Liffey Valley Regional Sewerage Scheme
6 of 6
For
insp
ectio
n pur
pose
s only
.
Conse
nt of
copy
right
owne
r req
uired
for a
ny ot
her u
se.
EPA Export 25-04-2013:23:32:13

Kildare County Council
Water Services Section
Tel: 045-980362, Fax: 045-980359
Aras Chill Dara, Devoy Park, Naas, Co. Kildare, Ireland.
PROJECT:
DRAWING:
FILE NAME:
Scale:
Date:
Drawn by:
Checked:
Revision:
REVISIONS
For
insp
ectio
n pur
pose
s only
.
Conse
nt of
copy
right
owne
r req
uired
for a
ny ot
her u
se.
EPA Export 25-04-2013:23:32:13

Comhairle Chondae Chill Dara
Lower Liffey Valley Regional Sewerage Scheme
Storm Water Overflow Assessment
December 2010
TOBIN CONSULTING ENGINEERS
Attachment C.1.1 Lower Liffey Valley Regional Sewerage Scheme
For
insp
ectio
n pur
pose
s only
.
Conse
nt of
copy
right
owne
r req
uired
for a
ny ot
her u
se.
EPA Export 25-04-2013:23:32:13

Template rep 003
DCO 0084
REPORT
PROJECT: Lower Liffey Valley Regional Sewerage
Scheme
CLIENT: Kildare County Council
Áras Chill Dara,
Devoy Park,
Naas,
Co Kildare.
COMPANY: TOBIN Consulting Engineers
Block 10- 4
Blanchardstown Corporate Park
Dublin 15
www.tobin.ie
Attachment C.1.1 Lower Liffey Valley Regional Sewerage Scheme
For
insp
ectio
n pur
pose
s only
.
Conse
nt of
copy
right
owne
r req
uired
for a
ny ot
her u
se.
EPA Export 25-04-2013:23:32:13

Lower Liffey Valley Regional Sewerage Scheme – Storm Water Overflow Assessment
2135 i Rev B
DOCUMENT AMENDMENT RECORD
Client: Kildare County Council
Project: Lower Liffey Valley Regional Sewerage Scheme
Title: Storm Water Overflow Assessment
PROJECT NUMBER: 2135 DOCUMENT REF: 2135 SWO
Assessment-Rev B
B Issue For Client GW 20.12.10 DC 20.12.10 COK 20.12.10
Revision Description & Rationale Originated Date Checked Date Authorised Date
TOBIN Consulting Engineers
Attachment C.1.1 Lower Liffey Valley Regional Sewerage Scheme
For
insp
ectio
n pur
pose
s only
.
Conse
nt of
copy
right
owne
r req
uired
for a
ny ot
her u
se.
EPA Export 25-04-2013:23:32:13

Lower Liffey Valley Regional Sewerage Scheme – Storm Water Overflow Assessment
2135 ii Rev B
TABLE OF CONTENTS
1 INTRODUCTION ...............................................................................1
2 EXECUTIVE SUMMARY ...................................................................1
3 STORM WATER OVERFLOW NO. 2 (SWO 2) .................................1
3.1 LOCATION – STORM WATER OVERFLOW NO. 2 ...................................... 1
3.2 CHARACTERISTICS OF OVERFLOW – SWO 2 .......................................... 1
3.3 STRUCTURAL DESCRIPTION – SWO 2 ...................................................... 2
3.4 VISUAL OR AESTHETIC IMPACT – SWO 2................................................. 3
3.5 CONCLUSIONS AND RECOMMENDATIONS – SWO 2............................... 4
4 STORM WATER OVERFLOW NO. 3 (SWO 3) .................................4
4.1 LOCATION – STORM WATER OVERFLOW NO. 3 ...................................... 4
4.2 CHARACTERISTICS OF OVERFLOW – SWO 3 .......................................... 4
4.3 STRUCTURAL DESCRIPTION – SWO 3 ...................................................... 6
4.4 VISUAL OR AESTHETIC IMPACT – SWO 3................................................. 6
4.5 NEW PUMPING STATION FOR KILCOCK TOWN ....................................... 7
4.6 CONCLUSIONS AND RECOMMENDATIONS – SWO 3............................... 8
5 STORM WATER OVERFLOW NO. 4 (SWO 4) .................................8
5.1 LOCATION – STORM WATER OVERFLOW NO. 4 ...................................... 8
5.2 CHARACTERISTICS OF OVERFLOW – SWO 4 .......................................... 8
5.3 STRUCTURAL DESCRIPTION – SWO 4 .................................................... 10
5.4 VISUAL OR AESTHETIC IMPACT – SWO 4............................................... 10
Attachment C.1.1 Lower Liffey Valley Regional Sewerage Scheme
For
insp
ectio
n pur
pose
s only
.
Conse
nt of
copy
right
owne
r req
uired
for a
ny ot
her u
se.
EPA Export 25-04-2013:23:32:13

Lower Liffey Valley Regional Sewerage Scheme – Storm Water Overflow Assessment
2135 iii Rev B
5.5 CONCLUSIONS AND RECOMMENDATIONS – SWO 4............................. 11
6 STORM WATER OVERFLOW NO. 5 (SWO 5) ...............................11
6.1 LOCATION – STORM WATER OVERFLOW NO. 5 .................................... 11
6.2 CHARACTERISTICS OF OVERFLOW – SWO 5 ........................................ 11
6.3 STRUCTURAL DESCRIPTION – SWO 5 .................................................... 12
6.4 VISUAL OR AESTHETIC IMPACT – SWO 5............................................... 12
6.5 CONCLUSIONS AND RECOMMENDATIONS – SWO 5............................. 13
7 STORM WATER OVERFLOW NO. 6 (SWO 6) ...............................13
7.1 LOCATION – STORM WATER OVERFLOW NO. 6 .................................... 13
7.2 CHARACTERISTICS OF OVERFLOW – SWO 6 ........................................ 14
7.3 STRUCTURAL DESCRIPTION – SWO 6 .................................................... 15
7.4 VISUAL OR AESTHETIC IMPACT – SWO 6............................................... 15
7.5 CONCLUSIONS AND RECOMMENDATIONS – SWO 6............................. 16
8 STORM WATER OVERFLOWS NO. 7 (SWO 7) AND 8 (SWO 8)...16
8.1 LOCATION – STORM WATER OVERFLOWS NO. 7 AND 8 ...................... 16
8.2 CHARACTERISTICS OF OVERFLOW – SWO 7 ........................................ 17
8.3 STRUCTURAL DESCRIPTION – SWO 7 AND SWO 8 ............................... 19
8.4 VISUAL OR AESTHETIC IMPACT – SWO 7 AND SWO 8.......................... 19
8.5 CONCLUSIONS AND RECOMMENDATIONS – SWO 7 AND SWO 8........ 20
9 STORM WATER OVERFLOW NO. 9 (SWO 9) ...............................20
Attachment C.1.1 Lower Liffey Valley Regional Sewerage Scheme
For
insp
ectio
n pur
pose
s only
.
Conse
nt of
copy
right
owne
r req
uired
for a
ny ot
her u
se.
EPA Export 25-04-2013:23:32:13

Lower Liffey Valley Regional Sewerage Scheme – Storm Water Overflow Assessment
2135 iv Rev B
9.1 LOCATION – STORM WATER OVERFLOW NO. 9 .................................... 20
9.2 CHARACTERISTICS OF OVERFLOW – SWO 9 ........................................ 21
9.3 STRUCTURAL DESCRIPTION – SWO 9 .................................................... 22
9.4 VISUAL OR AESTHETIC IMPACT – SWO 9............................................... 22
9.5 CONCLUSIONS AND RECOMMENDATIONS – SWO 9............................. 22
10 STORM WATER OVERFLOWS NO. 10 AND 11 (SWO 10, 11)...23
10.1 LOCATION – STORM WATER OVERFLOWS NO. 10 AND 11 ............... 23
10.2 CHARACTERISTICS OF OVERFLOW – SWO 10 AND 11...................... 23
10.3 STRUCTURAL DESCRIPTION – SWO 10 AND 11 ................................. 25
10.4 VISUAL OR AESTHETIC IMPACT – SWO 10 AND 11 ............................ 25
10.5 CONCLUSIONS AND RECOMMENDATIONS – SWO 10 AND 11 .......... 26
11 STORM WATER OVERFLOW NO. 12 (SWO 12).........................27
11.1 LOCATION – STORM WATER OVERFLOW NO. 12 ............................... 27
11.2 CHARACTERISTICS OF OVERFLOW – SWO 12 ................................... 27
11.3 STRUCTURAL DESCRIPTION – SWO 12............................................... 28
11.4 VISUAL OR AESTHETIC IMPACT – SWO 12.......................................... 28
11.5 CONCLUSIONS AND RECOMMENDATIONS – SWO 12 ....................... 29
12 STORM WATER OVERFLOW NO. 13 (SWO 13).........................29
12.1 LOCATION – STORM WATER OVERFLOW NO. 13 ............................... 29
12.2 CHARACTERISTICS OF OVERFLOW – SWO 13 ................................... 29
Attachment C.1.1 Lower Liffey Valley Regional Sewerage Scheme
For
insp
ectio
n pur
pose
s only
.
Conse
nt of
copy
right
owne
r req
uired
for a
ny ot
her u
se.
EPA Export 25-04-2013:23:32:13

Lower Liffey Valley Regional Sewerage Scheme – Storm Water Overflow Assessment
2135 v Rev B
12.3 STRUCTURAL DESCRIPTION – SWO 13............................................... 31
12.4 VISUAL OR AESTHETIC IMPACT – SWO 13.......................................... 31
12.5 CONCLUSIONS AND RECOMMENDATIONS – SWO 13 ....................... 32
13 STORM WATER OVERFLOW NO. 14 (SWO 14).........................32
13.1 LOCATION – STORM WATER OVERFLOW NO. 14 ............................... 32
13.2 CHARACTERISTICS OF OVERFLOW – SWO 14 ................................... 33
13.3 STRUCTURAL DESCRIPTION – SWO 14............................................... 34
13.4 VISUAL OR AESTHETIC IMPACT – SWO 14.......................................... 34
13.5 CONCLUSIONS AND RECOMMENDATIONS – SWO 14 ....................... 35
14 STORM WATER OVERFLOW NO. 15 (SWO 15).........................36
14.1 LOCATION – STORM WATER OVERFLOW NO. 15 ............................... 36
14.2 CHARACTERISTICS OF OVERFLOW – SWO 15 ................................... 36
14.3 STRUCTURAL DESCRIPTION – SWO 15............................................... 37
14.4 VISUAL OR AESTHETIC IMPACT – SWO 15.......................................... 37
14.5 CONCLUSIONS AND RECOMMENDATIONS – SWO 15 ....................... 39
Attachment C.1.1 Lower Liffey Valley Regional Sewerage Scheme
For
insp
ectio
n pur
pose
s only
.
Conse
nt of
copy
right
owne
r req
uired
for a
ny ot
her u
se.
EPA Export 25-04-2013:23:32:13

Lower Liffey Valley Regional Sewerage Scheme – Storm Water Overflow Assessment
2135 vi Rev B
APPENDIX 1 - DRAWINGS
Drawing no. 1 SWO 2 – general location
Drawing no. 2 SWO 3 – general location
Drawing no. 3 SWO 4 – general location
Drawing no. 4 SWO 5 – general location
Drawing no. 5 SWO 6 – general location
Drawing no. 6 SWO 7 and 8 – general location
Drawing no. 7 SWO 9 – general location
Drawing no. 8 SWO 10 and 11– general location
Drawing no. 9 SWO 12 – general location
Drawing no. 10 SWO 13 – general location
Drawing no. 11 SWO 14 – general location
Drawing no. 12 SWO 15 – general location
Attachment C.1.1 Lower Liffey Valley Regional Sewerage Scheme
For
insp
ectio
n pur
pose
s only
.
Conse
nt of
copy
right
owne
r req
uired
for a
ny ot
her u
se.
EPA Export 25-04-2013:23:32:13

Lower Liffey Valley Regional Sewerage Scheme – Storm Water Overflow Assessment
2135 1 Rev B
1 INTRODUCTION
Kildare County Council have commissioned TOBIN Consulting Engineers to carry out investigation for
identification and assessment of storm water overflows in Lower Liffey Valley sewerage network, in
accordance with the requirements as set out in Urban Waste Water Treatment Directive (91/271/EEC)
– Procedures and Criteria in relation to Storm Water Overflows (Department of Environment, Heritage
and Local Government - DOEHLG; 1995).
The surface water overflows are located on combined sewer network serving Lower Liffey Valley
Sewerage Scheme agglomeration (Leixlip, Celbridge, Maynooth, Kilcock and Straffan, Co. Kildare).
2 EXECUTIVE SUMMARY
14 of the existing Storm Water Overflow (SWO) structures and working conditions have been assessed
based on the existing available hydraulic data and on-site visual inspection. 7 of the assessed
overflows (SWO number 4, 6, 9, 10, 11, 12, 14) have meet DOEHLG requirements. Minor upgrade
works have been recommended for three overflow structures from this group (SWO number 9, 10 and
11).
7 remaining overflows (SWO number 2, 3, 5, 7, 8, 13, 15) have not meet the requirements and require
upgrade or other preventive actions to protect the receiving waters from excessive and unnecessary
sewage discharges. Three overflow structures from this group (SWO number 5, 7 and 8) have recently
became unnecessary and could be sealed off. SWO number 3 will be shortly replaced by a new
structure, built to DOEHLG requirements. It is recommended that detailed analysis using rainfall model
data will be undertaken in cases where DOEHLG conditions have not been met, to determine the exact
target parameters and define the best improvement solutions before any works commence on site.
3 STORM WATER OVERFLOW NO. 2 (SWO 2)
3.1 LOCATION – STORM WATER OVERFLOW NO. 2
The assessed storm water overflow number 2 (SWO 2) is located at Leixlip Waste Water Treatment
Plant (WWTP), southeast of Leixlip town, in Saint Catherine’s Park. The general location of the overflow
point is shown on Drawing no. 1.
3.2 CHARACTERISTICS OF OVERFLOW – SWO 2
The general characteristics of SWO 2 are compiled in the Table below.
SWO number (as per Waste Water Discharge Licence application)
2
Location Leixlip WWTP
Grid reference of overflow point (6E, 6N) – as surveyed on site
301542, 235824
Attachment C.1.1 Lower Liffey Valley Regional Sewerage Scheme
For
insp
ectio
n pur
pose
s only
.
Conse
nt of
copy
right
owne
r req
uired
for a
ny ot
her u
se.
EPA Export 25-04-2013:23:32:13

Lower Liffey Valley Regional Sewerage Scheme – Storm Water Overflow Assessment
2135 2 Rev B
Technical description High level overflow pipe from storm water holding tank. 700mm diameter underground concrete pipe to precast concrete outfall chamber. Outfall from chamber located under water.
Description of operation Overflow operates when storm water holding tank at WWTP is full. The overflow discharges to the river.
Name of receiving waters River Liffey
River basin district Eastern RBD
Designation of receiving waters
Non sensitive
Dry weather flow rate in receiving waters
2.0m3 x sec-1
Maximum volume emitted (up to 5 year storm)
1,142m3 (theoretical volume, calculated for critical storm using 20-year time series rainfall data)
56,298m3 (actual monthly volume, measured by flow meter in November 2009)
SWO Control Type High level overflow pipe from storm water holding tank
Type of Flow Meter at SWO Ultrasonic, linked with SCADA system at WWTP
SWO event notification Not available
SWO 2 overflows from storm water holding tank to River Liffey. The capacity of the tank is 1,200m³. In
the event that storm water holding tank is exhausted, settled storm water can overflow via 700mm
diameter high level pipe, through outfall manhole chamber located on River Liffey bank. Overflow to the
river is located below water level and is not visible from the river bank. The overflow does not operate in
dry weather flow conditions, as observed during site visit on 9th of December 2010.
There is an ultrasonic flow meter located on overflow pipe. The readings from flow meter are recorded
on monthly basis. The recorded data show that there were 13 storm water spillage events through
SWO 2 in the last 22 months, with spillage volumes ranging from 56,298m3 to 1,229m3 per month.
3.3 STRUCTURAL DESCRIPTION – SWO 2
The storm water holding tank is a reinforced concrete enclosed overground structure. Overflow from the
tank is a high level pipe. The overflow to the river is an underground concrete pipe 700mm diameter
and concrete precast chamber. All visible elements of assessed SWO are in good structural conditions,
with no noticeable structural defects. The outfall is however located under water and it is not possible to
assess its structural condition without underwater examination. No flow problems resulting in backflow,
outflow restrictions or any other issues have been reported by WWTP staff.
Attachment C.1.1 Lower Liffey Valley Regional Sewerage Scheme
For
insp
ectio
n pur
pose
s only
.
Conse
nt of
copy
right
owne
r req
uired
for a
ny ot
her u
se.
EPA Export 25-04-2013:23:32:13

Lower Liffey Valley Regional Sewerage Scheme – Storm Water Overflow Assessment
2135 3 Rev B
3.4 VISUAL OR AESTHETIC IMPACT – SWO 2
The assessed overflow is located in the area outside of public access. The outfall point of SWO is
hidden under water and is not visible from the river banks. The SWO does not cause visual or aesthetic
impact on surrounding environment. The elements of SWO 2 are shown in Figures 1 and 2.
Fig. 1 SWO 2: outfall chamber visible from river bank
Fig. 2 SWO 2: storm water holding tank
Attachment C.1.1 Lower Liffey Valley Regional Sewerage Scheme
For
insp
ectio
n pur
pose
s only
.
Conse
nt of
copy
right
owne
r req
uired
for a
ny ot
her u
se.
EPA Export 25-04-2013:23:32:13

Lower Liffey Valley Regional Sewerage Scheme – Storm Water Overflow Assessment
2135 4 Rev B
3.5 CONCLUSIONS AND RECOMMENDATIONS – SWO 2
Records indicate that there have been significant overflow events at SWO 2 in the past and that SWO
2 does not meet DOEHLG requirements in terms of discharge frequency. The majority of the recent
overflow events occurred in 2009, which has been recorded as an extremely wet period. It is clear that
the overflow events are as a result of storm water in the foul sewerage network. This has been
recognized in the past and efforts are underway to reduce the volume of storm water entering the
system.
As part of the Lower Liffey Valley Sewerage Scheme, a network rehabilitation contract was completed
in 2010. The works involved the rehabilitation of a significant amount of the network. It is envisaged
that this will reduce the frequency of overflow events at SWO 2. Coupled with this, further investigative
works are also planned to identify sources of storm water in other areas of the network, with following
rehabilitation works, if necessary.
In addition to the above, as part of the upgrading of the Leixlip WWTP, it is intended to provide a large
balancing tank, with the capacity of 4,170m3. All flows entering the Leixlip WWTP will be discharged to
the balancing tank. The tank will balance peak rates from diurnal flow variations and also provide
additional storm water storage for the rainfall events. These measures will allow SWO 2 to meet the
DOEHLG criteria, based on theoretical flow rate calculation results.
4 STORM WATER OVERFLOW NO. 3 (SWO 3)
4.1 LOCATION – STORM WATER OVERFLOW NO. 3
The assessed storm water overflow number 3 (SWO 3) is located at Rye River Walk in Kilcock. The
overflow is associated with existing pumping station. The existing pumping station and overflow will be
shortly decommissioned and replaced with new pumping station and overflow. The general locations of
existing and future pumping stations and overflow points are shown on Drawing no. 2.
4.2 CHARACTERISTICS OF OVERFLOW – SWO 3
The general characteristics of SWO 3 are compiled in the Table below.
SWO number (as per Waste Water Discharge Licence application)
3
Location Kilcock pumping station (Rye River Walk)
Grid reference of overflow point (6E, 6N) – as surveyed on site
288871, 239578
Technical description High level overflow pipe from pump sump linked with storm water holding tank. 375mm diameter underground concrete pipe with flap valve at outfall.
Attachment C.1.1 Lower Liffey Valley Regional Sewerage Scheme
For
insp
ectio
n pur
pose
s only
.
Conse
nt of
copy
right
owne
r req
uired
for a
ny ot
her u
se.
EPA Export 25-04-2013:23:32:13

Lower Liffey Valley Regional Sewerage Scheme – Storm Water Overflow Assessment
2135 5 Rev B
Description of operation Overflow operates when pump sump and storm water storage tank at Pumping Station are full. The overflow discharges to the river.
Name of receiving waters Rye Water
River basin district Eastern RBD
Designation of receiving waters
Non sensitive
Dry weather flow rate in receiving waters
0.05m3 x sec-1
Maximum volume emitted (up to 5 year storm)
149.2m3 (theoretical volume, calculated for critical 5 year return period storm with 1 hour duration)
256.9m3 (theoretical volume, calculated for critical 5 year return period storm with 6 hour duration)
SWO Control Type High level overflow pipe from pump sump (linked with storm water holding tank)
Type of Flow Meter at SWO Not available
SWO event notification Not available
SWO 3 overflows to Rye Water from pump sump linked with storm water holding tank. In the event that
storm water holding tank and pump sump is exhausted, water can overflow via 375mm diameter high
level pipe. The outfall point is located on Rye Water river bank, above water level. There is a flap valve
on the overflow pipe, at outfall to the river. The overflow does not operate in dry weather flow
conditions, as observed during site visit on 8th of December 2010.
Theoretical analysis was carried out of the existing storm water storage capacity at Kilcock pumping
station. The results show that spillage would occur for every 2 and 5 year storm return period of
durations ranging from 30 minutes to 12 hours. The overflow for 5 year storm return period of 1 hour
duration (design rainfall event used to determine the size of storm water holding tank, as required by
DOEHLG), has been calculated as 149.2m3. The highest overflow volume has been calculated for 5
year storm return period of 6 hours duration (256.9m3). The calculation results show that the existing
volume of storm water holding tank is inadequate, and the spillage events are very frequent.
The existing Kilcock Pumping Station pumps the wastewater from Kilcock onwards to Maynooth by
means of two pumps discharging through a 250mm diameter rising main of 3,450m length. Since the
existing pumps were installed wear and tear has significantly reduced their discharge capacity. The
current pumping capacity and storage capacity is inadequate to deal with both the flow rates and
volumes of combined foul and storm water flows.
Attachment C.1.1 Lower Liffey Valley Regional Sewerage Scheme
For
insp
ectio
n pur
pose
s only
.
Conse
nt of
copy
right
owne
r req
uired
for a
ny ot
her u
se.
EPA Export 25-04-2013:23:32:13

Lower Liffey Valley Regional Sewerage Scheme – Storm Water Overflow Assessment
2135 6 Rev B
4.3 STRUCTURAL DESCRIPTION – SWO 3
The pump sump and storm water holding tank are reinforced concrete enclosed underground
structures. Overflow from the pump sump is a high level pipe. The overflow to the river is an
underground concrete pipe 375mm diameter. All visible elements of assessed SWO are in good
structural conditions, with no noticeable structural defects.
4.4 VISUAL OR AESTHETIC IMPACT – SWO 3
The outfall point of SWO is located on the river bank and is visible from the adjacent land across Rye
Water river. The adjacent area is however outside of frequent public access, and overflow events do
not cause significant visual or aesthetic impact on surrounding environment. The SWO 3 is shown in
Figures 3 and 4.
Fig. 3 SWO 3 – outfall with flap valve, located on Rye Water river bank
Fig. 4 SWO 4 and old pumping station, visible from opposite river bank
Attachment C.1.1 Lower Liffey Valley Regional Sewerage Scheme
For
insp
ectio
n pur
pose
s only
.
Conse
nt of
copy
right
owne
r req
uired
for a
ny ot
her u
se.
EPA Export 25-04-2013:23:32:13

Lower Liffey Valley Regional Sewerage Scheme – Storm Water Overflow Assessment
2135 7 Rev B
4.5 NEW PUMPING STATION FOR KILCOCK TOWN
The existing pumping station will be soon abandoned and replaced with newly constructed facility, with
increased pumping and storm water holding capacity. The new pumping station will be fitted with stand-
by power generator to make the station fully operational during power outage incidents, and telemetry
system to remotely notify the maintenance personnel about any recorded failures of the pumping
equipment. The station has been constructed in the western outskirts of the town. It is expected to
decommission the old station and begin the operations at new facility in early 2011.
New pumping station and outfall are shown in Figures 5 and 6.
Fig. 5 New Kilcock Pumping Station
Attachment C.1.1 Lower Liffey Valley Regional Sewerage Scheme
For
insp
ectio
n pur
pose
s only
.
Conse
nt of
copy
right
owne
r req
uired
for a
ny ot
her u
se.
EPA Export 25-04-2013:23:32:13

Lower Liffey Valley Regional Sewerage Scheme – Storm Water Overflow Assessment
2135 8 Rev B
Fig. 6 Storm water overflow to Rye Water at new Kilcock Pumping Station
4.6 CONCLUSIONS AND RECOMMENDATIONS – SWO 3
The existing SWO 3 operates very frequently and its activation level is below DOEHLG requirements.
The whole old station will be decommissioned and abandoned in the following months, therefore any
improvements of the existing storm water overflow characteristics would not be economically justified.
The new pumping station has been constructed with 450m3 storm water holding tank, which will prevent
overflows to the Rye Water river from rainfall events with a frequency of up to 1 in 5 years. The SWO
parameters at the new station meet DOEHLG requirements.
5 STORM WATER OVERFLOW NO. 4 (SWO 4)
5.1 LOCATION – STORM WATER OVERFLOW NO. 4
The assessed storm water overflow number 4 (SWO 4) is from Maynooth Pumping Station, located
northeast of Maynooth town, on Old Dunboyne Road. SWO 4 discharges to Rye Water river, at
Maynooth Fisheries grounds. The general location of the overflow point is shown on Drawing no. 3.
5.2 CHARACTERISTICS OF OVERFLOW – SWO 4
The general characteristics of SWO 4 are compiled in the Table below.
SWO number (as per Waste Water Discharge Licence application)
4
Location Fisheries grounds, Old Dunboyne Road
Grid reference of overflow point (6E, 6N) – as surveyed on site
294466, 238712
Attachment C.1.1 Lower Liffey Valley Regional Sewerage Scheme
For
insp
ectio
n pur
pose
s only
.
Conse
nt of
copy
right
owne
r req
uired
for a
ny ot
her u
se.
EPA Export 25-04-2013:23:32:13

Lower Liffey Valley Regional Sewerage Scheme – Storm Water Overflow Assessment
2135 9 Rev B
Technical description High level overflow pipe from storm water holding tank. 450mm diameter underground concrete pipe. Reinforced concrete headwall at outfall to the river.
Description of operation Overflow operates when storm water holding tank at Pumping Station is full. The overflow discharges to the river.
Name of receiving waters Rye Water
River basin district Eastern RBD
Designation of receiving waters
SAC 001398
Dry weather flow rate in receiving waters
0.05m3 x sec-1
Maximum volume emitted (up to 5 year storm)
No overflow for critical storm events with up to 1 in 5 years frequency (modelling results)
SWO Control Type High level pipe overflow from storm water holding tank
Type of Flow Meter at SWO Not available
SWO event notification Not available
SWO 4 overflows to Rye Water from storm water holding tank. In the event that storm water holding
tank is exhausted, water can overflow via 450mm diameter high level pipe. The outfall point is located
at Maynooth Fisheries grounds, on Rye Water river bank, above water level. The overflow is located
downstream of water extraction point for fish ponds. There is a grating on the overflow pipe, at outfall to
the river. The overflow does not operate in dry weather flow conditions, as observed during site visit on
8th of December 2010.
The minimum overflow setting is determined by ‘Formula A’, which takes into account the dry weather
flow, the population and the industrial effluent. ‘Formula A’ for the overflow at the Main Maynooth
Pumping Station is calculated at 16,262m³/d or 0.188m³/s. ‘Formula A’ therefore sets the minimum flow
which must be either discharged by the pumps at Maynooth onwards to Leixlip or to be stored within
the system before overflows take place. Until recently the pumping and storage capacity at Maynooth
Pumping Station was only approximately 50% of that required by the ‘Formula A’ calculation. The
pumps and overflow settings were inadequate to meet the DOEHLG criteria. That resulted in frequent
storm water overflow incidents.
The Maynooth Pumping Station has been recently significantly upgraded, with construction works
commissioned in October 2010. The construction of a new pumping facility and emergency storm water
holding tank resulted in sufficient protection to the adjoining watercourses from storm water overflows.
The station has been also equipped with stand-by power generator and telemetry system.
Attachment C.1.1 Lower Liffey Valley Regional Sewerage Scheme
For
insp
ectio
n pur
pose
s only
.
Conse
nt of
copy
right
owne
r req
uired
for a
ny ot
her u
se.
EPA Export 25-04-2013:23:32:13

Lower Liffey Valley Regional Sewerage Scheme – Storm Water Overflow Assessment
2135 10 Rev B
The storm water holding capacity has been determined by rainfall event analysis. The largest volume
projected to be overflowed has been calculated as 2,599m³, during Time Series Rainfall Event No. 22.
This has been additionally increased by safety factor of 10%. The capacity of the existing new storm
water holding tank is 2,850m³.
5.3 STRUCTURAL DESCRIPTION – SWO 4
The storm water holding tank is an underground reinforced concrete enclosed structure. Overflow from
the tank is a high level concrete pipe. The overflow to the river is an underground concrete pipe 450mm
diameter, with reinforced concrete headwall structure at outfall point. All visible elements of assessed
SWO are in good structural conditions, with no noticeable structural defects.
5.4 VISUAL OR AESTHETIC IMPACT – SWO 4
The outfall point of SWO is located on the river bank and is visible from close distance. The adjacent
area is however outside of frequent public access, and overflow events do not cause significant visual
or aesthetic impact on surrounding environment.
The SWO 4 is shown in Figures 7 and 8.
Fig. 7 SWO 4 – grating at outfall to the river
Attachment C.1.1 Lower Liffey Valley Regional Sewerage Scheme
For
insp
ectio
n pur
pose
s only
.
Conse
nt of
copy
right
owne
r req
uired
for a
ny ot
her u
se.
EPA Export 25-04-2013:23:32:13

Lower Liffey Valley Regional Sewerage Scheme – Storm Water Overflow Assessment
2135 11 Rev B
Fig. 8 SWO 4 – headwall structure at outfall to the river
5.5 CONCLUSIONS AND RECOMMENDATIONS – SWO 4
The existing SWO 4 meets DOEHLG requirements. The new pumping station has been constructed
with 2,850m3 storm water holding tank, which will prevent overflows to the Rye Water river from
rainfall events with a frequency of up to 1 in 5 years.
6 STORM WATER OVERFLOW NO. 5 (SWO 5)
6.1 LOCATION – STORM WATER OVERFLOW NO. 5
The assessed storm water overflow number 5 (SWO 5) is located at Maynooth Castle grounds, in
Maynooth town centre. The general location of the overflow point is shown on Drawing no. 4.
6.2 CHARACTERISTICS OF OVERFLOW – SWO 5
The general characteristics of SWO 5 are compiled in the Table below.
SWO number (as per Waste Water Discharge Licence application)
5
Location Maynooth Castle, Maynooth
Grid reference of overflow point (6E, 6N) – as surveyed on site
293643, 237676
Technical description 225mm ductile iron overflow pipe from foul sewer manhole chamber. Outfall to the stream, above water level.
Description of operation Overflow operates when inflow to the chamber exceeds maximum capacity of the downstream pipeline. The overflow
Attachment C.1.1 Lower Liffey Valley Regional Sewerage Scheme
For
insp
ectio
n pur
pose
s only
.
Conse
nt of
copy
right
owne
r req
uired
for a
ny ot
her u
se.
EPA Export 25-04-2013:23:32:13

Lower Liffey Valley Regional Sewerage Scheme – Storm Water Overflow Assessment
2135 12 Rev B
discharges to the stream.
Name of receiving waters Lyreen Stream, tributary to Rye Water
River basin district Eastern RBD
Designation of receiving waters
Non sensitive
Dry weather flow rate in receiving waters
0.05m3 x sec-1 (Rye Water)
Maximum volume emitted (up to 5 year storm)
Not available
SWO Control Type High level overflow pipe from open channel in manhole chamber.
Type of Flow Meter at SWO Not available
SWO event notification Not available
SWO 5 overflows to Lyreen Stream from foul sewer manhole chamber. In the event that the capacity of
downstream part of network is exhausted, water can overflow via 225mm diameter pipe. This overflow
is in fact an emergency outfall to the stream. There is no storm water storage capacity at overflow
chamber. The chamber with overflow is located at Maynooth Castle grounds. The outfall point is located
behind Castle’s wall, at the stream bank, above water level. The overflow does not operate in dry
weather flow conditions, as observed during site visit on 8th of December 2010.
Until recently the spillage incidents through SWO 5 were very frequent. The results of theoretical
analysis determined spillage for every 2 year storm return period of durations ranging from 30 minutes
to 12 hours. The overflow volume varied from 104m3 to 229 m3. The capacity of downstream section of
the network was by far inadequate and the DOEHLG criterion (‘Formula A’) was not meet.
The situation has changed when the new trunk line on Parson Street and Leinster Street was built.
Most of the flow from Castle Grounds pipeline has been diverted to the new trunk line. The flow rate in
the Castle Grounds has been greatly reduced, and no overflow incidents through SWO 5 have been
reported since then.
6.3 STRUCTURAL DESCRIPTION – SWO 5
The overflow is a high level ductile iron pipe from concrete chamber. The section at Castle grounds is
underground. The final section is an overground pipe, with concrete block outfall point. All visible
elements of assessed SWO are in good structural conditions, with no noticeable structural defects.
6.4 VISUAL OR AESTHETIC IMPACT – SWO 5
The outfall point of SWO is located on the stream bank and is highly visible. The overflow incidents
cause significant aesthetic impact on surrounding environment. The outfall is located in the town center,
Attachment C.1.1 Lower Liffey Valley Regional Sewerage Scheme
For
insp
ectio
n pur
pose
s only
.
Conse
nt of
copy
right
owne
r req
uired
for a
ny ot
her u
se.
EPA Export 25-04-2013:23:32:13

Lower Liffey Valley Regional Sewerage Scheme – Storm Water Overflow Assessment
2135 13 Rev B
with nearby college entrance and town amenities. When it operates, raw sewage is visible from the
bridge and adjacent properties located across the stream.
The SWO 5 is shown in Figure 9.
Fig. 9. SWO 5 – outfall to Lyreen Stream (open pipe at the bottom)
6.5 CONCLUSIONS AND RECOMMENDATIONS – SWO 5
Until recently the existing SWO 5 has been operating on frequent basis and DOEHLG ‘Formula A’
criterion has not been met. Any overflow incidents through SWO 5 cause significant aesthetic impact on
surrounding environment. As the majority of flow from Castle Grounds pipeline has been recently
diverted to the new trunk line, the overflow structure could be probably abandoned and sealed off. In
case that Local Authority would wish to maintain the overflow at current location, it is recommended to
reconstruct it and locate the outflow pipe under water level, to hide it from public view. In the event that
overflow function will be retained, the existing overflow chamber should be examined, to determine if
any improvement measures are necessary. Any action should be confirmed by detailed analysis using
rainfall model data, to define the best solution.
7 STORM WATER OVERFLOW NO. 6 (SWO 6)
7.1 LOCATION – STORM WATER OVERFLOW NO. 6
The assessed storm water overflow number 6 (SWO 6) is located at Celbridge Main Pumping station, at
Castletown, east of Celbridge town. The general location of the overflow point is shown on Drawing no.
5.
Attachment C.1.1 Lower Liffey Valley Regional Sewerage Scheme
For
insp
ectio
n pur
pose
s only
.
Conse
nt of
copy
right
owne
r req
uired
for a
ny ot
her u
se.
EPA Export 25-04-2013:23:32:13

Lower Liffey Valley Regional Sewerage Scheme – Storm Water Overflow Assessment
2135 14 Rev B
7.2 CHARACTERISTICS OF OVERFLOW – SWO 6
The general characteristics of SWO 6 are compiled in the Table below.
SWO number (as per Waste Water Discharge Licence application)
6
Location Celbridge Main Pumping Station, Castletown, Celbridge
Grid reference of overflow point (6E, 6N) – as surveyed on site
297989, 233620
Technical description High level overflow pipe from storm water holding tank. 300mm diameter underground ductile iron pipe. Steel grating at outfall to the river.
Description of operation Overflow operates when storm water holding tank at Pumping Station is full. The overflow discharges to the river.
Name of receiving waters River Liffey
River basin district Eastern RBD
Designation of receiving waters
Sensitive
Dry weather flow rate in receiving waters
2.4m3 x sec-1
Maximum volume emitted (up to 5 year storm)
No overflow for critical storm events with up to 1 in 5 years frequency (modelling results)
SWO Control Type High level pipe overflow from storm water holding tank
Type of Flow Meter at SWO Not available
SWO event notification Not available
SWO 6 overflows to River Liffey from storm water holding tank. In the event that storm water holding
tank is exhausted, water can overflow via 300mm diameter high level pipe. The outfall point is located
on River Liffey bank, above water level. There is a grating on the overflow pipe, at outfall to the river.
There were numerous incidents of uncontrolled discharge through SWO 6 in the past, due to pumping
equipment failures. This has been however resolved following the recent pumping station upgrade, to
meet DOEHLG criteria. The increase of sewage pumping and storm water holding capacity provided
appropriate protection to the adjoining watercourses from storm water overflows. The capacity of two
newly constructed storm water holding tanks has been determined by rainfall event analysis. The new
Attachment C.1.1 Lower Liffey Valley Regional Sewerage Scheme
For
insp
ectio
n pur
pose
s only
.
Conse
nt of
copy
right
owne
r req
uired
for a
ny ot
her u
se.
EPA Export 25-04-2013:23:32:13

Lower Liffey Valley Regional Sewerage Scheme – Storm Water Overflow Assessment
2135 15 Rev B
storm water holding structures will prevent overflows to the receiving waters from rainfall events with a
frequency of up to 1 in 5 years.
The existing available storage capacity, including two new storage tanks, wet well and inlet channel, is
471m3. The overall storage capacity will be shortly additionally increased to 732m3, by adoption of dry
and wet wells, making previously part of the old pumping station.
The pumping station is equipped with stand-by power generator and telemetry system.
The SWO 6 does not operate in dry weather flow conditions, as observed during site visit on 8th of
December 2010.
7.3 STRUCTURAL DESCRIPTION – SWO 6
The overflow is a high level ductile iron pipe from storm water holding tank. The outfall point is located
on the river bank and covered by boulders. There is a steel grating at the outfall point. All visible
elements of assessed SWO are in good structural conditions, with no noticeable structural defects.
7.4 VISUAL OR AESTHETIC IMPACT – SWO 6
The outfall point of SWO is located on the river bank and is visible from close distance. The overflow
does not cause significant aesthetic impact on surrounding environment, however when it operates,
storm water could be visible from the adjacent river walk.
The SWO 6 is shown in Figures 10 and 11.
Fig. 10 SWO 6 – outfall from open pipe to River Liffey
Attachment C.1.1 Lower Liffey Valley Regional Sewerage Scheme
For
insp
ectio
n pur
pose
s only
.
Conse
nt of
copy
right
owne
r req
uired
for a
ny ot
her u
se.
EPA Export 25-04-2013:23:32:13

Lower Liffey Valley Regional Sewerage Scheme – Storm Water Overflow Assessment
2135 16 Rev B
Fig. 11 SWO 6 – grating at outfall
7.5 CONCLUSIONS AND RECOMMENDATIONS – SWO 6
The existing SWO 6 meets DOEHLG requirements. The pumping capacity and storm water holding
tank have been recently upgraded, to meet ‘Formula A’ criterion. Storm water holding tank capacity has
been increased to 471m3. The implemented measures will prevent overflows to River Liffey from rainfall
events with a frequency of up to 1 in 5 years. The storage capacity will be shortly additionally increased
by 261m3, to total capacity of 732m3, which will provide supplementary safety factor and further protect
the receiving waters from sewage discharges. Although overflow incidents could be visible from the
adjacent river walk, they will be rare enough to not to cause significant visual impact on surrounding
environment.
8 STORM WATER OVERFLOWS NO. 7 (SWO 7) AND 8 (SWO 8)
8.1 LOCATION – STORM WATER OVERFLOWS NO. 7 AND 8
The assessed storm water overflows number 7 (SWO 7) and 8 (SWO 8) are located on Castle Slip
Road, at Castletown, in eastern part of Celbridge town. The general location of the overflow points is
shown on Drawing no. 6.
Attachment C.1.1 Lower Liffey Valley Regional Sewerage Scheme
For
insp
ectio
n pur
pose
s only
.
Conse
nt of
copy
right
owne
r req
uired
for a
ny ot
her u
se.
EPA Export 25-04-2013:23:32:13

Lower Liffey Valley Regional Sewerage Scheme – Storm Water Overflow Assessment
2135 17 Rev B
8.2 CHARACTERISTICS OF OVERFLOW – SWO 7
The general characteristics of SWO 7 are compiled in the Table below.
SWO number (as per Waste Water Discharge Licence application)
7
Location Castletown Gate Slip, Castletown, Celbridge
Grid reference of overflow point (6E, 6N)
297585, 233309
Technical description 300mm concrete overflow pipe from foul sewer manhole chamber. Outfall to the river. .
Description of operation Overflow operates when inflow to the sewer backs up (surcharge of downstream section). The overflow discharges to the river.
Name of receiving waters River Liffey
River basin district Eastern RBD
Designation of receiving waters
Sensitive
Dry weather flow rate in receiving waters
2.4m3 x sec-1
Maximum volume emitted (up to 5 year storm)
Not available
SWO Control Type High level overflow from manhole chamber
Type of Flow Meter at SWO Not available
SWO event notification Not available
The general characteristics of SWO 8 are compiled in the Table below.
SWO number (as per Waste Water Discharge Licence application)
8
Location Castletown Gate Slip, Castletown, Celbridge
Grid reference of overflow point (6E, 6N)
297584, 233306
Technical description 450mm concrete overflow pipe from foul sewer manhole chamber. Outfall to the river. .
Attachment C.1.1 Lower Liffey Valley Regional Sewerage Scheme
For
insp
ectio
n pur
pose
s only
.
Conse
nt of
copy
right
owne
r req
uired
for a
ny ot
her u
se.
EPA Export 25-04-2013:23:32:13

Lower Liffey Valley Regional Sewerage Scheme – Storm Water Overflow Assessment
2135 18 Rev B
chamber. Outfall to the river. .
Description of operation Overflow operates when inflow to the sewer backs up (surcharge of downstream section). The overflow discharges to the river.
Name of receiving waters River Liffey
River basin district Eastern RBD
Designation of receiving waters
Sensitive
Dry weather flow rate in receiving waters
2.4m3 x sec-1
Maximum volume emitted (up to 5 year storm)
Not available
SWO Control Type High level overflow from manhole chamber
Type of Flow Meter at SWO Not available
SWO event notification Not available
SWO 7 and SWO 8 at Castletown Gate Slip overflow to River Liffey from sewer manhole chambers. In
the event that the capacity of downstream part of network is exhausted, water can overflow via 300mm
diameter (SWO 7) or 450mm diameter (SWO 8) high level pipes. These overflows are in fact
emergency outfalls to the river. The overflows do not operate in dry weather flow conditions, as
observed during site visit on 8th of December 2010.
Until recently the spillage incidents through SWO 7 and SWO 8 were very frequent. This was most
likely related to network surcharge caused by insufficient pumping and storage capacity at Main
Celbridge Pumping Station (Castletown), located approximately 500m downstream of SWO 7 and 8
locations.
Another reported incidents at Castletown Gate Slip have been related to uncontrolled overflows through
manhole lid of chamber number 5304, located at the bottom of the road. The character of these
incidents suggests that they were caused by surcharge of downstream section of the network and
insufficient pumping and holding capacity at Castletown Pumping Station.
The risk of surcharge and back up from downstream pipelines has been reduced, thanks to the upgrade
works completed recently at Castletown Pumping Station. The increase of sewage pumping and storm
water holding capacity provided adequate protection to the adjoining watercourses from uncontrolled
storm water and emergency overflows. The new characteristics of the Pumping Station will prevent
overflows to the receiving waters from rainfall events with a frequency of up to 1 in 5 years.
Attachment C.1.1 Lower Liffey Valley Regional Sewerage Scheme
For
insp
ectio
n pur
pose
s only
.
Conse
nt of
copy
right
owne
r req
uired
for a
ny ot
her u
se.
EPA Export 25-04-2013:23:32:13

Lower Liffey Valley Regional Sewerage Scheme – Storm Water Overflow Assessment
2135 19 Rev B
No surcharge incidents through SWO 7 and SWO 8 have been observed since upgrade works have
been commissioned at the Pumping Station.
8.3 STRUCTURAL DESCRIPTION – SWO 7 AND SWO 8
The overflows are high level underground concrete pipes from sewer chambers. All visible elements of
assessed storm water overflows are in good structural conditions, with no noticeable structural defects.
8.4 VISUAL OR AESTHETIC IMPACT – SWO 7 AND SWO 8
The outfall points of SW Overflows are located on the river bank and are hidden from public view.
Overflow incidents through SWO outfalls do not cause aesthetic impact on surrounding environment.
The manhole 5304 is located on public road, and any overflow incident through its lid causes significant
visual and aesthetic impact, with raw sewage overflowing to the road surface.
The SWO 7 and SWO 8 points are shown in Figure 12. Manhole 5304 is shown in Figure 13.
Fig. 12. SWO 7 and SWO 8 – location of outfall points to River Liffey
Attachment C.1.1 Lower Liffey Valley Regional Sewerage Scheme
For
insp
ectio
n pur
pose
s only
.
Conse
nt of
copy
right
owne
r req
uired
for a
ny ot
her u
se.
EPA Export 25-04-2013:23:32:13

Lower Liffey Valley Regional Sewerage Scheme – Storm Water Overflow Assessment
2135 20 Rev B
Fig. 13. Manhole 5304
8.5 CONCLUSIONS AND RECOMMENDATIONS – SWO 7 AND SWO 8
Until recently the existing SWO 7 and 8 have been operating on frequent basis and DOEHLG ‘Formula
A’ criterion has not been met.
The recent upgrade works at the downstream Castletown Pumping Station most likely reduced the risk
of surcharge and overflow incidents in the discussed area. It is possible that the existing emergency
overflows SWO 7 and SWO 8 would not be needed any longer, and could be abandoned and sealed
off. Detailed analysis using rainfall model data should be undertaken to determine the possible
improvement solutions.
Overflow incidents through manhole 5304 cause significant aesthetic impact on surrounding
environment, by uncontrolled discharge of raw sewage to the public road. To prevent uncontrolled
discharge incidents at this location, the standard ductile iron lid should be replaced with sealed and
lockable lid.
9 STORM WATER OVERFLOW NO. 9 (SWO 9)
9.1 LOCATION – STORM WATER OVERFLOW NO. 9
The assessed storm water overflow number 9 (SWO 9) is from Primrose Hill Pumping Station. SWO 9
is located on Newtown Road, in Celbridge town center, and discharges to River Liffey. The general
location of the overflow point is shown on Drawing no. 7.
Attachment C.1.1 Lower Liffey Valley Regional Sewerage Scheme
For
insp
ectio
n pur
pose
s only
.
Conse
nt of
copy
right
owne
r req
uired
for a
ny ot
her u
se.
EPA Export 25-04-2013:23:32:13

Lower Liffey Valley Regional Sewerage Scheme – Storm Water Overflow Assessment
2135 21 Rev B
9.2 CHARACTERISTICS OF OVERFLOW – SWO 9
The general characteristics of SWO 9 are compiled in the Table below.
SWO number (as per Waste Water Discharge Licence application)
9
Location Newtown Road, Celbridge
Grid reference of overflow point (6E, 6N) – as surveyed on site
297379, 232913
Technical description High level overflow pipe from foul sewer manhole chamber. 300mm diameter underground concrete pipe. Outfall from the pipe at the retaining wall.
Description of operation Overflow operates when sewer backs up, as a result of insufficient pumping or storm water holding capacity at Primrose Hill Pumping Station. The overflow discharges to the river.
Name of receiving waters River Liffey
River basin district Eastern RBD
Designation of receiving waters
Sensitive
Dry weather flow rate in receiving waters
2.4m3 x sec-1
Maximum volume emitted (up to 5 year storm)
No overflow for critical storm events with up to 1 in 5 years frequency (modelling results)
SWO Control Type High level pipe overflow from foul sewer manhole chamber
Type of Flow Meter at SWO Not available
SWO event notification Not available
SWO 9 overflows to River Liffey from foul sewer line, as a result of surcharge and back up from
Primrose Hill Pumping Station, located approximately 80m downstream of SWO point. In the event that
storm water holding capacity or pumping capacity at the station is exhausted, water can overflow via
300mm diameter high level pipe from the main trunk line. The outfall point is located in the retaining
wall, on River Liffey bank, above water level. The overflow does not operate in dry weather flow
conditions, as observed during site visit on 8th of December 2010.
In view of the sensitivity of the River Liffey (the location of the pumping station is upstream of the water
intake works at Leixlip), the Primrose Hill Pumping Station has been recently upgraded. A new storm
Attachment C.1.1 Lower Liffey Valley Regional Sewerage Scheme
For
insp
ectio
n pur
pose
s only
.
Conse
nt of
copy
right
owne
r req
uired
for a
ny ot
her u
se.
EPA Export 25-04-2013:23:32:13

Lower Liffey Valley Regional Sewerage Scheme – Storm Water Overflow Assessment
2135 22 Rev B
water holding tank has been constructed. The existing storm water holding capacity is 289m³ (79m³ in
old tank and 210m³ in new tank), and provides 8 hours emergency storage. The tanks are underground
concrete enclosed structures, with high level overflows. The station has been also equipped with
stand-by power generator and telemetry system.
9.3 STRUCTURAL DESCRIPTION – SWO 9
The overflow is a high level concrete iron pipe from foul sewer line. The outfall point is located in the
retaining wall. The end of the pipe is open and there is no grating or flap valve at the outfall point. The
visible part of assessed SWO is in good structural condition, with no noticeable structural defects.
9.4 VISUAL OR AESTHETIC IMPACT – SWO 9
The outfall point of SWO is located above water level. It is visible from the adjacent foot bridge. The
overflow incidents cause significant visual and aesthetic impact on surrounding environment, as raw
sewage discharge from the pipe at high level is visible from the public space.
The SWO 9 is shown in Figure 14.
Fig. 14 SWO 9 – outfall to River Liffey
9.5 CONCLUSIONS AND RECOMMENDATIONS – SWO 9
The SWO 9 activation level meets DOEHLG requirements (‘Formula A’), however any overflow incident
causes significant visual and aesthetic impact on the surrounding environment. The outfall from the
overflow pipe is located 1 to 2m above water level, and is clearly visible from the adjacent footbridge.
Attachment C.1.1 Lower Liffey Valley Regional Sewerage Scheme
For
insp
ectio
n pur
pose
s only
.
Conse
nt of
copy
right
owne
r req
uired
for a
ny ot
her u
se.
EPA Export 25-04-2013:23:32:13

Lower Liffey Valley Regional Sewerage Scheme – Storm Water Overflow Assessment
2135 23 Rev B
There is no flap valve on the overflow pipe, which could also cause odour problems. It is recommended
to upgrade the SWO discharge point and hide the outfall from public view, possibly under water.
10 STORM WATER OVERFLOWS NO. 10 AND 11 (SWO 10, 11)
10.1 LOCATION – STORM WATER OVERFLOWS NO. 10 AND 11
The assessed storm water overflows number 10 (SWO 10) and 11 (SWO 11) are located at Ballyoulster
Pumping Station, on Dublin Road, east of Celbridge town. The general location of the overflow points is
shown on Drawing no. 8.
10.2 CHARACTERISTICS OF OVERFLOW – SWO 10 AND 11
The general characteristics of SWO 10 are compiled in the Table below.
SWO number (as per Waste Water Discharge Licence application)
10
Location Ballyoulster Pumping Station, Celbridge
Grid reference of overflow point (6E, 6N) – as surveyed on site
298651, 233374
Technical description High level overflow pipe from pump sump. 225mm diameter underground PVC pipe with open outfall to the stream.
Description of operation Overflow operates when pump sump is full. The overflow discharges to the stream.
Name of receiving waters Shinkeen Stream (tributary to River Liffey)
River basin district Eastern RBD
Designation of receiving waters
Sensitive
Dry weather flow rate in receiving waters
2.4m3 x sec-1 (River Liffey)
Maximum volume emitted (up to 5 year storm)
Not available
SWO Control Type High level overflow pipe from pump sump
Type of Flow Meter at SWO Not available
SWO event notification Not available
Attachment C.1.1 Lower Liffey Valley Regional Sewerage Scheme
For
insp
ectio
n pur
pose
s only
.
Conse
nt of
copy
right
owne
r req
uired
for a
ny ot
her u
se.
EPA Export 25-04-2013:23:32:13

Lower Liffey Valley Regional Sewerage Scheme – Storm Water Overflow Assessment
2135 24 Rev B
The general characteristics of SWO 11 are compiled in the Table below.
SWO number (as per Waste Water Discharge Licence application)
11
Location Ballyoulster Pumping Station, Celbridge
Grid reference of overflow point (6E, 6N) – as surveyed on site
298650, 233378
Technical description High level overflow pipe from manhole chamber. 150mm diameter underground PVC pipe with open outfall to the stream.
Description of operation Overflow operates when there is a blockage at the inflow to pump sump and the network is surcharged. The overflow discharges to the stream.
Name of receiving waters Shinkeen Stream (tributary to River Liffey)
River basin district Eastern RBD
Designation of receiving waters
Sensitive
Dry weather flow rate in receiving waters
2.4m3 x sec-1 (River Liffey)
Maximum volume emitted (up to 5 year storm)
Not available
SWO Control Type High level overflow pipe from manhole chamber
Type of Flow Meter at SWO Not available
SWO event notification Not available
SWO 10 overflows to Shinkeen Stream from the pump sump at the pumping station. In the event that
sump capacity is exhausted, water can overflow via 225mm diameter high level pipe. This can be
caused by excessive inflow to the pumping station or pumps failure. Outfall point is located on the
stream bank, in gabion retaining wall, approximately 1m above water level. There is no grating and no
flap valve on the overflow pipe at outfall to the stream. The overflow does not operate in dry weather
flow conditions, as observed during site visit on 8th of December 2010.
SWO 11 overflows to Shinkeen Stream from the manhole chamber located at the pumping station site,
immediately upstream of pump sump. In the event of blockage or surcharge at the inlet to the pump
sump, sewage can overflow via 150mm diameter high level pipe. Outfall point is located on the stream
bank, in gabion retaining wall, approximately 2m above water level. Outfall of SWO 11 is approximately
Attachment C.1.1 Lower Liffey Valley Regional Sewerage Scheme
For
insp
ectio
n pur
pose
s only
.
Conse
nt of
copy
right
owne
r req
uired
for a
ny ot
her u
se.
EPA Export 25-04-2013:23:32:13

Lower Liffey Valley Regional Sewerage Scheme – Storm Water Overflow Assessment
2135 25 Rev B
1m higher than outfall of SWO 10. This means overflow events through SWO 11 are not resulted by
pump sump overload. There is no grating and no flap valve on the overflow pipe, at outfall to the
stream. The overflow does not operate in dry weather flow conditions, as observed during site visit on
8th of December 2010.
The Ballyoulster Pumping Station is located on a small site adjacent to the Shinkeen Stream and
serves the Ballyoulster Housing Estate and the Industrial factory on Dublin Road. The available storm
water storage at the pumping station is limited to pump sump only. There is no information on how
frequently the overflow operates or associated spill volumes. There is also no emergency storage on
site. DOEHLG ‘Formula A’ at Ballyoulster Pumping Station is estimated at 0.008m³/s. Pumping capacity
is 0.01m³/s, and exceeds ‘Formula A’ value.
Because of the site restrictions it is not possible to construct inflow storage facilities to provide any
emergency retention capacity. The station however has been recently upgraded with telemetry system
and stand-by power generator on site, to come into play when there is a power outage. The upgrade
works have considerably reduced risk of uncontrolled overflow incidents through SWO 10.
10.3 STRUCTURAL DESCRIPTION – SWO 10 AND 11
The overflows are high level PVC open pipes, with outfalls in gabion retaining wall, at the stream bank.
All visible elements of assessed overflows are in good structural condition, with no noticeable structural
defects.
10.4 VISUAL OR AESTHETIC IMPACT – SWO 10 AND 11
The outfall points of SWO 10 and 11 are located above water level, and could be visible by pedestrians
from the Dublin Road bridge and from the property located across the stream from the pumping station.
Because of relative remoteness of the discussed area, the overflows do not cause significant aesthetic
impact on surrounding environment.
The SWO 10 and 11 are shown in Figure 15.
Attachment C.1.1 Lower Liffey Valley Regional Sewerage Scheme
For
insp
ectio
n pur
pose
s only
.
Conse
nt of
copy
right
owne
r req
uired
for a
ny ot
her u
se.
EPA Export 25-04-2013:23:32:13

Lower Liffey Valley Regional Sewerage Scheme – Storm Water Overflow Assessment
2135 26 Rev B
Fig. 15 SWO 11 (150mm pipe, foreground) and SWO 10 (225mm pipe, background)
10.5 CONCLUSIONS AND RECOMMENDATIONS – SWO 10 AND 11
The existing SWO 10 and 11 meet DOEHLG requirements in terms of ‘Formula A’ criterion. Pumping
capacity is over 10 times higher than 6 DWF inflow rate. Recent installation of telemetry system and
stand-by power generator on site significantly reduced the risk of unnecessary spillages. Large reserve
of pumping capacity means that pumps are adequate to handle most of rainfall events.
There is no emergency storage available at pumping station site. It is not possible to build the storage
within pumping station boundaries, because of very limited available area. In the future the storage tank
could be possibly built upstream of the pumping station. The most convenient place for underground
structure seems to be a green area at the entrance to Ballyoulster housing estate.
It is possible that SWO 11 could be abandoned and sealed off. As an overflow from foul sewer manhole
chamber, it increases the risk of pollution in the receiving waters, by likely uncontrolled discharge of raw
sewage. The discharge function of SWO 11 is in principle doubled by the function of SWO 10 –
overflow from the pump sump. Overflow from SWO 10 has also lesser impact on the quality of receiving
waters, as the water would be partly settled in the pump sump, before discharge to the stream. It is
recommended to carry out hydraulic calculations to confirm the proposed solution.
In any case it is recommended to install flap valves on the outflow pipes to the stream. This will greatly
reduce any possible odour emissions from the pipes.
Attachment C.1.1 Lower Liffey Valley Regional Sewerage Scheme
For
insp
ectio
n pur
pose
s only
.
Conse
nt of
copy
right
owne
r req
uired
for a
ny ot
her u
se.
EPA Export 25-04-2013:23:32:13

Lower Liffey Valley Regional Sewerage Scheme – Storm Water Overflow Assessment
2135 27 Rev B
11 STORM WATER OVERFLOW NO. 12 (SWO 12)
11.1 LOCATION – STORM WATER OVERFLOW NO. 12
The assessed storm water overflow number 12 (SWO 12) is located at Temple Mills Pumping Station,
Abbey Farm, in southern part of Celbridge town. The general location of the overflow point is shown on
Drawing no. 9.
11.2 CHARACTERISTICS OF OVERFLOW – SWO 12
The general characteristics of SWO 12 are compiled in the Table below.
SWO number (as per Waste Water Discharge Licence application)
12
Location Temple Mills Pumping Station, Abbey Farm, Celbridge
Grid reference of overflow point (6E, 6N) – as surveyed on site
296933, 232428
Technical description High level overflow pipe from pump sump. 300mm diameter underground ductile iron pipe. Flap valve at outfall to the river.
Description of operation Overflow operates when capacity of pump sump at the pumping station is exhausted. The overflow discharges to the river.
Name of receiving waters River Liffey
River basin district Eastern RBD
Designation of receiving waters
Sensitive
Dry weather flow rate in receiving waters
2.4m3 x sec-1
Maximum volume emitted (up to 5 year storm)
Not available
SWO Control Type High level pipe overflow from pump sump
Type of Flow Meter at SWO Not available
SWO event notification Not available
SWO 12 overflows to River Liffey from the pump sump at the pumping station. In the event that sump
capacity is exhausted, water can overflow via 300mm diameter high level pipe. This can be caused by
excessive inflow to the pumping station or pumps failure. Outfall point is located on the river bank,
Attachment C.1.1 Lower Liffey Valley Regional Sewerage Scheme
For
insp
ectio
n pur
pose
s only
.
Conse
nt of
copy
right
owne
r req
uired
for a
ny ot
her u
se.
EPA Export 25-04-2013:23:32:13

Lower Liffey Valley Regional Sewerage Scheme – Storm Water Overflow Assessment
2135 28 Rev B
above water level. There is a flap valve on the overflow pipe at outfall point. The overflow does not
operate in dry weather flow conditions, as observed during site visit on 9th of December 2010.
The Temple Mills Pumping Station is located on a small site on the banks of River Liffey, south of Clane
Road in Celbridge. The available storm water storage at the pumping station is limited to pump sump
only. There is no information on how frequently the overflow operates or associated spill volumes.
DOEHLG ‘Formula A’ at Temple Mills Pumping Station is estimated at 0.019m³/s. Pumping capacity is
0.03m³/s, and exceeds ‘Formula A’ value.
Because of the site restrictions it is not possible to construct sufficient emergency storage facilities to
store excessive inflow and flows during times of power outage. The station however has been recently
upgraded with telemetry system and stand-by power generator to come into play when there is a power
outage. These elements have considerably reduced risk of uncontrolled overflow incidents through
SWO 12.
11.3 STRUCTURAL DESCRIPTION – SWO 12
The overflow is a high level ductile iron pipe from pump sump. There is a flap valve at the outfall point.
All visible elements of assessed SWO are in good structural conditions, with no noticeable structural
defects.
11.4 VISUAL OR AESTHETIC IMPACT – SWO 12
The outfall point of SWO is located on the river bank and covered by greenery, in the area generally
inaccessible to public. The overflow does not cause aesthetic impact on surrounding environment.
The SWO 12 is shown in Figures 16 and 17.
Fig. 16 SWO 12 – flap valve at outfall pipe
Attachment C.1.1 Lower Liffey Valley Regional Sewerage Scheme
For
insp
ectio
n pur
pose
s only
.
Conse
nt of
copy
right
owne
r req
uired
for a
ny ot
her u
se.
EPA Export 25-04-2013:23:32:13

Lower Liffey Valley Regional Sewerage Scheme – Storm Water Overflow Assessment
2135 29 Rev B
Fig. 17 SWO 6 – outfall at pumping station site
11.5 CONCLUSIONS AND RECOMMENDATIONS – SWO 12
The existing SWO 12 meets DOEHLG requirements in terms of ‘Formula A’ condition. Pumping
capacity is over 50% higher than 6 DWF inflow rate. There is no emergency or storm water holding
storage available at pumping station site. It is not possible to build the storage within pumping station
boundaries, because of limited available area. Recent installation of stand-by power generator on site
eliminated the risk of unnecessary spillages in the event of power cut.
12 STORM WATER OVERFLOW NO. 13 (SWO 13)
12.1 LOCATION – STORM WATER OVERFLOW NO. 13
The assessed storm water overflow number 13 (SWO 13) is located at Mill Lane, in southeastern part
of Leixlip town. The general location of the overflow point is shown on Drawing no. 10.
12.2 CHARACTERISTICS OF OVERFLOW – SWO 13
The general characteristics of SWO 13 are compiled in the Table below.
SWO number (as per Waste Water Discharge Licence application)
13
Location Mill Lane, Leixlip
Attachment C.1.1 Lower Liffey Valley Regional Sewerage Scheme
For
insp
ectio
n pur
pose
s only
.
Conse
nt of
copy
right
owne
r req
uired
for a
ny ot
her u
se.
EPA Export 25-04-2013:23:32:13

Lower Liffey Valley Regional Sewerage Scheme – Storm Water Overflow Assessment
2135 30 Rev B
Grid reference of overflow point (6E, 6N)
301148, 235876
Technical description High level overflow pipe from foul sewer manhole chamber. 225mm diameter underground concrete pipe. Outfall from chamber located above water level. Flap valve at outfall
Description of operation Overflow operates when sewer backs up, as a result of insufficient capacity of downstream section of the network. The overflow discharges to the stream.
Name of receiving waters Silleachain Stream (tributary to River Liffey)
River basin district Eastern RBD
Designation of receiving waters
Non sensitive
Dry weather flow rate in receiving waters
2.0m3 x sec-1 (River Liffey)
Maximum volume emitted (up to 5 year storm)
Not available
SWO Control Type High level overflow pipe from foul sewer manhole chamber
Type of Flow Meter at SWO Not available
SWO event notification Not available
SWO 13 overflows from foul sewer manhole chamber located on 375mm pipeline, to Silleachain
Stream. In the event that the capacity of downstream part of network is exhausted, water can overflow
via 225mm diameter pipe. This overflow is in fact an emergency outfall to the stream. The chamber with
overflow is located on private property. Overflow to the stream is located in the public space, above
water level and is visible from the adjacent road and footpath. The overflow does not operate in dry
weather flow conditions, as observed during site visit on 9th of December 2010.
There is no information on how frequently the overflow operates or associated spill volumes. DOEHLG
‘Formula A’ of downstream section of 375mm diameter Mill Lane sewer is estimated at 0.06m³/s. The
maximum capacity of the downstream section of sewer is 0.072m³/s. The downstream sewer capacity
is greater than the ‘Formula A’ requirement. However the downstream capacity is influenced by the
inflow to the Leixlip WWTP as outlined below.
The 375mm diameter sewer from Mill Lane enters the Inlet of the Leixlip Wastewater Treatment Plant at
the same invert as the 750mm diameter main inlet sewer. The 375mm diameter sewer has a fall of
0.652m over a length of 366m, which means that if the 750mm diameter sewer is flowing close to full
bore then the 366m length of 375mm diameter sewer would be surcharged. The surcharging of the
Attachment C.1.1 Lower Liffey Valley Regional Sewerage Scheme
For
insp
ectio
n pur
pose
s only
.
Conse
nt of
copy
right
owne
r req
uired
for a
ny ot
her u
se.
EPA Export 25-04-2013:23:32:13

Lower Liffey Valley Regional Sewerage Scheme – Storm Water Overflow Assessment
2135 31 Rev B
375mm diameter sewer causes near stagnant flows, which results in deposition of silt at the low
velocities, as well as upstream overflows through SWO 13 on Mill Lane.
12.3 STRUCTURAL DESCRIPTION – SWO 13
Overflow from the manhole chamber is a high level 225mm diameter concrete pipe. The overflow to the
stream is located in a stone wall, at the stream bank, above water level. There is a flap valve at outflow
point. All visible elements of assessed SWO are in good structural conditions, with no noticeable
structural defects.
12.4 VISUAL OR AESTHETIC IMPACT – SWO 13
The outfall point of SWO 13 is located above water level and is visible from the adjacent footpath and
Mill Lane road. The overflow incidents cause significant visual and aesthetic impact on surrounding
environment, as raw sewage discharge is visible from the public space.
The SWO 13 is shown in Figures 18 and 19.
Fig. 18 SWO 13: flap valve at the outfall point.
Attachment C.1.1 Lower Liffey Valley Regional Sewerage Scheme
For
insp
ectio
n pur
pose
s only
.
Conse
nt of
copy
right
owne
r req
uired
for a
ny ot
her u
se.
EPA Export 25-04-2013:23:32:13

Lower Liffey Valley Regional Sewerage Scheme – Storm Water Overflow Assessment
2135 32 Rev B
Fig. 19 Silleachain Stream at Mill Lane. SWO 13 visible behind 750mm diameter crossing sewer, at the right.
12.5 CONCLUSIONS AND RECOMMENDATIONS – SWO 13
The existing SWO 13 does not meet DOEHLG requirements. While theoretical activation level meets
DOEHLG criterion and downstream sewer capacity is greater than the ‘Formula A’ requirement, other
influences result in overflows occurring below the ‘Formula A’ setting. The overflow incidents through
SWO 13 are caused mainly by insufficient velocity and surcharge of inlet to the downstream section of
375mm diameter pipeline, between Mill Street and Leixlip Waste Water Treatment Plant, located
approximately 380m downstream of SWO 13.
In order to prevent near stagnant flows in this sewer and overflows through SWO 13, the inlet to the
Leixlip Wastewater Treatment Plant should be reconstructed to allow a free discharge from the inlet
pipes. This work could form part of the contract for the Upgrading of the Leixlip Treatment Plat when a
new inlet balancing tank and pumping station would be constructed as per the recommendations of
other preliminary report studies. Detailed design and calculations must be carried out, to determine the
exact solutions and target parameters.
13 STORM WATER OVERFLOW NO. 14 (SWO 14)
13.1 LOCATION – STORM WATER OVERFLOW NO. 14
The assessed storm water overflow number 14 (SWO 14) is located at Straffan Pumping Station, east
of Straffan village. The general location of the overflow point is shown on Drawing no. 11.
Attachment C.1.1 Lower Liffey Valley Regional Sewerage Scheme
For
insp
ectio
n pur
pose
s only
.
Conse
nt of
copy
right
owne
r req
uired
for a
ny ot
her u
se.
EPA Export 25-04-2013:23:32:13

Lower Liffey Valley Regional Sewerage Scheme – Storm Water Overflow Assessment
2135 33 Rev B
13.2 CHARACTERISTICS OF OVERFLOW – SWO 14
The general characteristics of SWO 14 are compiled in the Table below.
SWO number (as per Waste Water Discharge Licence application)
14
Location Straffan Pumping Station, Lodgepark, Straffan
Grid reference of overflow point (6E, 6N) – as surveyed on site
292824, 229606
Technical description High level overflow pipe from storm water holding tank. 300mm diameter underground ductile iron pipe. Flap valve at outfall to the stream.
Description of operation Overflow operates when capacity of storm water holding tank at the pumping station is exhausted. The overflow discharges to the stream.
Name of receiving waters Liffey Water stream (tributary to River Liffey)
River basin district Eastern RBD
Designation of receiving waters
Sensitive
Dry weather flow rate in receiving waters
2.4m3 x sec-1 (River Liffey)
Maximum volume emitted (up to 5 year storm)
Not available
SWO Control Type High level pipe overflow from storm water holding tank
Type of Flow Meter at SWO Not available
SWO event notification Not available
SWO 14 overflows to Liffey Water stream from storm water holding tank at the pumping station. In the
event that storm tank capacity is exhausted, water can overflow via 300mm diameter high level pipe.
Outfall point is located on the stream bank, above water level. There is a flap valve on the overflow
pipe, at outfall to the stream. The overflow does not operate in dry weather flow conditions, as observed
during site visit on 9th of December 2010.
The storm water holding tank at pumping station has a storage capacity of 100m³. The storage system
provides protection to the water quality in the River Liffey in the event of high flows caused by heavy
rainfall, infiltration through sewer connection pipelines located in private property or temporary pump
failure at the pumping station. The provision of storage at Straffan also allows for temporary cessation
Attachment C.1.1 Lower Liffey Valley Regional Sewerage Scheme
For
insp
ectio
n pur
pose
s only
.
Conse
nt of
copy
right
owne
r req
uired
for a
ny ot
her u
se.
EPA Export 25-04-2013:23:32:13

Lower Liffey Valley Regional Sewerage Scheme – Storm Water Overflow Assessment
2135 34 Rev B
of pumping onwards to Celbridge, if there is a problem at the main pumping station at Castletown in
Celbridge, and there is a need to keep the available storage there for incoming flows from Celbridge
itself, so as to prevent unnecessary overflows to the River Liffey.
In order to check the adequacy of the existing storage capacity with respect to high flows caused by
heavy rainfall a series of rainfall events were used. A twenty year Time Series Rainfall was generated
for Straffan, based on daily rainfall records for the period 1979 to 1999 supplied by Met Eireann. The
model of the proposed Straffan Main Drainage System and Pumping Station was analysed under seven
selected critical storms from the Time Series data. The analysis shows that there would be no overflow
from the storage system during seven critical time series events. As a result, SWO frequency level
meets the DOEHLG criteria: no overflow incidents to the receiving waters from rainfall events with a
frequency of up to 1 in 5 years.
Because of the importance of water quality in the River Liffey for water abstraction at Leixlip, a
telemetry system and stand-by power generator have been provided at Straffan Pumping Station. In the
event of a prolonged power outage there is a facility to maintain the pumping station operational and
protect the river quality.
13.3 STRUCTURAL DESCRIPTION – SWO 14
The overflow is a high level ductile iron pipe from storm water holding tank. The outfall point is located
on the stream bank, in a concrete brick headwall. There is a flap valve at the outfall point. All visible
elements of assessed SWO are in good structural conditions, with no noticeable structural defects.
13.4 VISUAL OR AESTHETIC IMPACT – SWO 14
The outfall point of SWO is located on the stream bank and is partly covered by greenery. It is located
in the area generally inaccessible to public. The overflow incidents do not cause aesthetic impact on
surrounding environment, however water flow in the stream during dry weather is almost stagnant, as
observed during site visit. Any overflow incidents in dry weather can cause odour and local ground
pollution problems, as the overflow may not be sufficiently diluted with stream flow.
The SWO 14 is shown in Figures 20 and 21.
Attachment C.1.1 Lower Liffey Valley Regional Sewerage Scheme
For
insp
ectio
n pur
pose
s only
.
Conse
nt of
copy
right
owne
r req
uired
for a
ny ot
her u
se.
EPA Export 25-04-2013:23:32:13

Lower Liffey Valley Regional Sewerage Scheme – Storm Water Overflow Assessment
2135 35 Rev B
Fig. 20 SWO 14 – flap valve at outfall pipe
Fig. 21 SWO 14 – outfall and pumping station site
13.5 CONCLUSIONS AND RECOMMENDATIONS – SWO 14
The existing SWO 14 meet DOEHLG requirements in terms of activation frequency, and does not
cause visual and aesthetic impact on surrounding environment. There is very low flow velocity in the
Liffey Water stream, which could cause problems with dry weather discharges (no proper dilution with
Attachment C.1.1 Lower Liffey Valley Regional Sewerage Scheme
For
insp
ectio
n pur
pose
s only
.
Conse
nt of
copy
right
owne
r req
uired
for a
ny ot
her u
se.
EPA Export 25-04-2013:23:32:13

Lower Liffey Valley Regional Sewerage Scheme – Storm Water Overflow Assessment
2135 36 Rev B
stream waters). The station is however equipped with stand by power generator and telemetry system,
therefore risk of uncontrolled spillages is minimized.
14 STORM WATER OVERFLOW NO. 15 (SWO 15)
14.1 LOCATION – STORM WATER OVERFLOW NO. 15
The assessed storm water overflow number 15 (SWO 15) is located on Pound Street, in Leixlip town
centre. The general location of the overflow points is shown on Drawing no. 12. This overflow has not
been included in the original Waste Water Discharge License application from December 2007.
14.2 CHARACTERISTICS OF OVERFLOW – SWO 15
The general characteristics of SWO 15 are compiled in the Table below.
SWO number 15
Location Pound Street, Leixlip
Grid reference of overflow point (6E, 6N)
300413, 235863
Technical description High level overflow pipe from foul sewer manhole to storm culvert. Outfall located above water level, at river bank.
Description of operation Overflow operates when sewer backs up, as a result of insufficient capacity of downstream section of the network. The overflow discharges to the river.
Name of receiving waters Rye Water
River basin district Eastern RBD
Designation of receiving waters
Non sensitive
Dry weather flow rate in receiving waters
0.05m3 x sec-1 (Rye Water, approximate)
2.0m3 x sec-1 (River Liffey)
Maximum volume emitted (up to 5 year storm)
Not available
SWO Control Type High level overflow pipe from foul sewer manhole chamber
Type of Flow Meter at SWO Not available
SWO event notification Not available
SWO 15 overflows from foul sewer manhole chamber no. 4801, to the storm culvert and then to Rye
Water river. This overflow is in fact an emergency outfall to the river. It has been constructed after
Attachment C.1.1 Lower Liffey Valley Regional Sewerage Scheme
For
insp
ectio
n pur
pose
s only
.
Conse
nt of
copy
right
owne
r req
uired
for a
ny ot
her u
se.
EPA Export 25-04-2013:23:32:13

Lower Liffey Valley Regional Sewerage Scheme – Storm Water Overflow Assessment
2135 37 Rev B
numerous flooding incidents in the downstream part of the network, of which the most serious
happened in January 2009. After several days of snowfall followed by heavy rains, the manhole located
at the entrance to Leixlip Castle, immediately upstream of Rye Bridge, surcharged and flooded the
entrance to the Castle. Inspection chambers in the adjacent garden also surcharged causing extensive
flooding in the vicinity of the house. The flooding was mainly caused due to insufficient capacity of pipe
traversing the Rye Water river at Rye Bridge and inadequate capacity of the network downstream of
Pound Street.
The discussed overflow has been designed such that it only comes into operation during significant
storm events whereby the overspill will be significantly diluted with surface waters.
The outfall to the river is located in the public space, above water level and is visible from the footpath
along Rye Water. The overflow does not operate in dry weather flow conditions, as observed during site
visit on 9th of December 2010. There is no information on how frequently the overflow operates or
associated spill volumes.
14.3 STRUCTURAL DESCRIPTION – SWO 15
Overflow from the manhole chamber is a high level pipe, to the storm stone culvert. The overflow to the
river is located in a stone wall, at the river bank, above water level. There is no flap valve at outflow
point and no grating. All visible elements of assessed SWO are in good structural conditions, with no
noticeable structural defects.
14.4 VISUAL OR AESTHETIC IMPACT – SWO 15
The outfall point of SWO 15 is located above water level and is visible from the adjacent footpath, along
Rye Water river. The overflow incidents can cause some visual and aesthetic impact on surrounding
environment, however this overflow will come into operation only during heavy rainfall events, where
foul sewage spill will be significantly diluted with storm water.
The SWO 15 is shown in Figures 22 and 23.
Attachment C.1.1 Lower Liffey Valley Regional Sewerage Scheme
For
insp
ectio
n pur
pose
s only
.
Conse
nt of
copy
right
owne
r req
uired
for a
ny ot
her u
se.
EPA Export 25-04-2013:23:32:14

Lower Liffey Valley Regional Sewerage Scheme – Storm Water Overflow Assessment
2135 38 Rev B
Fig. 22 SWO 15: surface water culvert combined with foul sewer overflow
Fig. 23 SWO 15 to Rye Water, visible from the above footpath
Attachment C.1.1 Lower Liffey Valley Regional Sewerage Scheme
For
insp
ectio
n pur
pose
s only
.
Conse
nt of
copy
right
owne
r req
uired
for a
ny ot
her u
se.
EPA Export 25-04-2013:23:32:14

Lower Liffey Valley Regional Sewerage Scheme – Storm Water Overflow Assessment
2135 39 Rev B
14.5 CONCLUSIONS AND RECOMMENDATIONS – SWO 15
The SWO 15 does not meet the DOEHLG requirements in terms of ‘Formula A’ and activation level.
This overflow is however considered as a short-term interim solution, until upgrade of foul sewer pipe at
Rye Bridge, downstream of SWO 15.
It is recommended to carry out flow monitoring of the foul sewer network on Pound Street, to enable
calibration of a hydraulic model to ascertain the required size of sewer to transverse the Rye Water
river at Rye Bridge.
The long Term strategy should however be to endeavour to eliminate extensive surface water ingress
into the foul network. This would have the beneficial impact of increasing the capacity of the foul
network for sewerage loads in Pound Street and Main Street area. This will also indirectly improve the
efficiency and cost effectiveness of Leixlip Waste Water Treatment Plant. To ensure there is no repeat
occurrence of flooding incidents through foul sewer network, it is also recommended to carry out a
complex study of the foul network upstream of Leixlip Town centre, to identify and remove incorrect
surface water connections.
Attachment C.1.1 Lower Liffey Valley Regional Sewerage Scheme
For
insp
ectio
n pur
pose
s only
.
Conse
nt of
copy
right
owne
r req
uired
for a
ny ot
her u
se.
EPA Export 25-04-2013:23:32:14

Lower Liffey Valley Regional Sewerage Scheme – Storm Water Overflow Assessment
2135 40 Rev B
APPENDIX 1
DRAWINGS
Attachment C.1.1 Lower Liffey Valley Regional Sewerage Scheme
For
insp
ectio
n pur
pose
s only
.
Conse
nt of
copy
right
owne
r req
uired
for a
ny ot
her u
se.
EPA Export 25-04-2013:23:32:14

Attachment C.1.1 Lower Liffey Valley Regional Sewerage Scheme
For
insp
ectio
n pur
pose
s only
.
Conse
nt of
copy
right
owne
r req
uired
for a
ny ot
her u
se.
EPA Export 25-04-2013:23:32:14

Attachment C.1.1 Lower Liffey Valley Regional Sewerage Scheme
For
insp
ectio
n pur
pose
s only
.
Conse
nt of
copy
right
owne
r req
uired
for a
ny ot
her u
se.
EPA Export 25-04-2013:23:32:14

Attachment C.1.1 Lower Liffey Valley Regional Sewerage Scheme
For
insp
ectio
n pur
pose
s only
.
Conse
nt of
copy
right
owne
r req
uired
for a
ny ot
her u
se.
EPA Export 25-04-2013:23:32:14

Attachment C.1.1 Lower Liffey Valley Regional Sewerage Scheme
For
insp
ectio
n pur
pose
s only
.
Conse
nt of
copy
right
owne
r req
uired
for a
ny ot
her u
se.
EPA Export 25-04-2013:23:32:14

Attachment C.1.1 Lower Liffey Valley Regional Sewerage Scheme
For
insp
ectio
n pur
pose
s only
.
Conse
nt of
copy
right
owne
r req
uired
for a
ny ot
her u
se.
EPA Export 25-04-2013:23:32:14

Attachment C.1.1 Lower Liffey Valley Regional Sewerage Scheme
For
insp
ectio
n pur
pose
s only
.
Conse
nt of
copy
right
owne
r req
uired
for a
ny ot
her u
se.
EPA Export 25-04-2013:23:32:14

Attachment C.1.1 Lower Liffey Valley Regional Sewerage Scheme
For
insp
ectio
n pur
pose
s only
.
Conse
nt of
copy
right
owne
r req
uired
for a
ny ot
her u
se.
EPA Export 25-04-2013:23:32:14

Attachment C.1.1 Lower Liffey Valley Regional Sewerage Scheme
For
insp
ectio
n pur
pose
s only
.
Conse
nt of
copy
right
owne
r req
uired
for a
ny ot
her u
se.
EPA Export 25-04-2013:23:32:14

Attachment C.1.1 Lower Liffey Valley Regional Sewerage Scheme
For
insp
ectio
n pur
pose
s only
.
Conse
nt of
copy
right
owne
r req
uired
for a
ny ot
her u
se.
EPA Export 25-04-2013:23:32:14

Attachment C.1.1 Lower Liffey Valley Regional Sewerage Scheme
For
insp
ectio
n pur
pose
s only
.
Conse
nt of
copy
right
owne
r req
uired
for a
ny ot
her u
se.
EPA Export 25-04-2013:23:32:14

Attachment C.1.1 Lower Liffey Valley Regional Sewerage Scheme
For
insp
ectio
n pur
pose
s only
.
Conse
nt of
copy
right
owne
r req
uired
for a
ny ot
her u
se.
EPA Export 25-04-2013:23:32:14

Attachment C.1.1 Lower Liffey Valley Regional Sewerage Scheme
For
insp
ectio
n pur
pose
s only
.
Conse
nt of
copy
right
owne
r req
uired
for a
ny ot
her u
se.
EPA Export 25-04-2013:23:32:14

Pumping Station Pump Arrangement
Standby Generator
Avaiable Yes / No
Storage Capacity (m^3)
No of Emergency Overflows in 2012
Emergency Oveflow
Discharge Point
Kilcock Duty / Assist / Standby Yes 450 0 SW3
Maynooth Duty / Assist / Standby Yes 2850 4 SW4
Castletown Duty / Assist / Standby Yes 732 0 SW6
Primrose Hill Duty / Standby Yes 289 0 SW9
Ballyoulster Duty / Standby Yes 0 0 SW10
Temple Mills, Abbey Farm
Duty / Standby Yes 0 0 SW12
Straffan Duty / Standby Yes 100 0 SW14
Attachment C.1.2 Pumping Stations
Attachment C.1.2 Lower Liffey Valley Regional Sewerage Scheme
1 of 1
For
insp
ectio
n pur
pose
s only
.
Conse
nt of
copy
right
owne
r req
uired
for a
ny ot
her u
se.
EPA Export 25-04-2013:23:32:14

Reference Location Easting Northing Type Design Criteria Construction Detail Invert Level
SW1-P St Catherines Park, Leixlip 301633 235839 PrimaryOpen pipe -
constant discharge
Open pipe - 900mm concrete varies from
complete submergence to completely above
river level
Not Available
SW2 St Catherines Park, Leixlip 301546 235839 SWOOverflows when the associated
storm tank is full
Open pipe - 700mm concrete, completely
submerged at all times
Not Available
SW3 Kilcock Pumping Station 289638 239169 SWO
Overflows when pump sump and
storm water storage tank at pumping station
are full
375mm concrete pipe with flap valve, above
groundNot Available
SW4Fisheries Grounds, Old Dunboyne
Road, Maynooth294412 238713 SWO
Overflows when storm water
holding tank at pumping station
is full
450mm open concrete above river
levelNot Available
SW5 Maynooth Castle, Maynooth 293649 237671 SWO
Overflow operates if flow
exceeds the maximum
capacity of the downstream
pipeline
225mm ductile iron open pipe, above
water levelNot Available
Attachement C2 Outfall Design & Construction
Attachment C2 Lower Liffey Valley Regional Sewerage Scheme
1 of 3
For
insp
ectio
n pur
pose
s only
.
Conse
nt of
copy
right
owne
r req
uired
for a
ny ot
her u
se.
EPA Export 25-04-2013:23:32:14

SW6Celbridge Main Pumping Station,
Castletown, Celbridge297981 233615 SWO
Overflows when storm water
holding tank at pumping station
is full
300mm ductile iron open pipe, above
water levelNot Available
SW7Castletown Gate Slip, Castletown,
Celbridge297585 233309 SWO
Overflow operates if flow
exceeds the maximum
capacity of the downstream
pipeline
300mm open concrete pipe, above
water levelNot Available
SW8Castletown Gate Slip, Castletown,
Celbridge297584 233306 SWO
Overflow operates if flow
exceeds the maximum
capacity of the downstream
pipeline
450mm open concrete above river
levelNot Available
SW9 Newtown Road, Celbridge 297379 232911 SWO
Overflows when sewer backs up when pumping or storm water
holding capacity is exhausted
300mm open concrete pipe, above
water levelNot Available
SW10Ballyoulster Pumping Station,
Celbridge298650 233375 SWO
Overflows when pump sump is
full
225mm open pvc pipe, above water
levelNot Available
Attachment C2 Lower Liffey Valley Regional Sewerage Scheme
2 of 3
For
insp
ectio
n pur
pose
s only
.
Conse
nt of
copy
right
owne
r req
uired
for a
ny ot
her u
se.
EPA Export 25-04-2013:23:32:14

SW11Ballyoulster Pumping Station,
Celbridge298649 233370 SWO
Overflows if there is a
blockage at the inflow to the
pump sump and the network is
surcharged
150mm open pvc pipe, above water
levelNot Available
SW12Temple Mills Pumping Station, Abbey
Farm, Celbridge296936 232433 SWO
Overflow when capacity of
pump sump is exhausted
300mm ductile iron pipe with flap valve, above water level
Not Available
SW13 Mill Lane, Leixlip 301155 235871 SWO
Overflow when sewer backs up
as a result of insufficient capacity
225mm concrete pipe with flap valve, above
water levelNot Available
SW14Straffan Pumping Station, Lodgepark,
Straffan292834 229614 SWO
Overflow when capacity of storm water
storage tank at the pumping
station is exhausted
300mm ductile iron pipe with flap valve, above water level
Not Available
SW15 Pound Street, Leixlip 300413 235863 SWO
Overflow when sewer backs up
as a result of insufficient capacity
Above water level stone storm culvert
Not Available
SWP-PE St. Catherine's Park, Leixlip 301653 235836 EOOverflow if the downstream
sewer is blocked
900mm concrete pipe, below water
levelNot Available
Attachment C2 Lower Liffey Valley Regional Sewerage Scheme
3 of 3
For
insp
ectio
n pur
pose
s only
.
Conse
nt of
copy
right
owne
r req
uired
for a
ny ot
her u
se.
EPA Export 25-04-2013:23:32:14

Suspended Solids (mg/l)
COD (mg/l)
BOD (mg/l)
Total Nitrogen (mg/l N)
Total Phosphorous
(mg/l P)
Suspended Solids (mg/l)
COD (mg/l)
BOD (mg/l)
Total Nitrogen
(mg/l)
Total Phosphorous
(mg/l P)04/01/2012 398 736 nd 57 11.6 342 579 nd 39 7.311/01/2012 110 343 141 52 4 178 410 170 43 5.712/01/2012 242 583 290 70 4.1 138 334 183 41 2.418/01/2012 100 511 nd 74 5 178 394 nd 53 4.425/01/2012 118 316 nd 55 5.3 160 404 nd 46 401/02/2012 158 263 89 36 3.4 76 164 54 34 2.908/02/2012 92 246 nd 42 4.4 100 205 nd 23 3.709/02/2012 358 603 198 67 7 179 300 148 31 3.715/02/2012 68 227 126 43 4.9 276 384 234 45 6.322/02/2012 nd 289 nd 51 4.1 nd 136 nd 33 2.229/02/2012 220 676 nd 49 10.6 250 125 nd 18 408/03/2012 291 624 160 66 6.8 161 254 95 35 2.914/03/2012 422 659 225 70 9.8 244 409 154 52 3.621/03/2012 78 234 nd 40 4.7 70 124 nd 32 4.728/03/2012 294 607 171 42 8.2 62 151 68 35 304/04/2012 118 290 nd 48 6.6 78 185 nd 36 305/04/2012 430 731 290 66 5.5 228 445 150 44 3.611/04/2012 94 307 105 56 6.1 276 609 176 52 8.618/04/2012 112 314 95 58 6.1 248 447 155 65 6.925/04/2012 396 603 nd nd 10.7 296 560 nd nd 5.802/05/2012 264 367 111 40 6.1 50 110 24 24 1.803/05/2012 147 231 88 37 1.9 101 126 52 33 1.609/05/2012 76 196 nd 38 5 144 266 nd 33 3.916/05/2012 112 316 101 45 5.5 152 396 115 39 5.830/05/2012 236 527 nd 56 7.7 326 284 nd 33 9.231/05/2012 538 926 200 98 7.3 181 256 90 40 2.206/06/2012 68 197 84 39 4.4 318 409 198 43 9.320/06/2012 622 798 nd nd 11.7 206 321 nd nd 5.928/06/2012 434 516 100 76 5.9 41 95 34 34 1.6nd - not determined
Attachment D.1 - Influent Monitoring DataMain Plant Influent Data Intel Plant Influent Data
Date
Attachment D1 Lower Liffey Valley Regional Sewerage Scheme
1 of 2
For
insp
ectio
n pur
pose
s only
.
Conse
nt of
copy
right
owne
r req
uired
for a
ny ot
her u
se.
EPA Export 25-04-2013:23:32:14

Suspended Solids (mg/l)
COD (mg/l)
BOD (mg/l)
Total Nitrogen (mg/l N)
Total Phosphorous
(mg/l P)
Suspended Solids (mg/l)
COD (mg/l)
BOD (mg/l)
Total Nitrogen
(mg/l)
Total Phosphorous
(mg/l P)11/07/2012 nd 798 nd nd 11.7 nd 321 nd nd 5.918/07/2012 354 671 188 62 7.9 184 290 120 24 3.625/07/2012 706 1215 nd 80 14.8 60 106 nd 30 2.726/07/2012 192 502 260 63 2.6 49 160 105 25 1.101/08/2012 68 252 nd 59 4.1 150 196 nd 43 3.508/08/2012 nd 486 nd 52 9.9 nd 262 nd 33 3.815/08/2012 698 2229 914 100 14.7 364 716 242 52 822/08/2012 170 1013 574 96 4.9 62 330 169 nd 2.723/08/2012 324 1044 380 77 3 172 490 168 41 1.729/08/2012 386 634 nd 60 7.9 92 155 nd 31 3.805/09/2012 376 684 284 63 9.5 218 394 167 32 5.512/09/2012 118 296 128 44 5.6 230 464 196 50 7.520/09/2012 104 307 118 52 3.1 89 188 50 31 2.126/09/2012 72 311 167 31 2.9 198 246 92 43 4.103/10/2012 nd 378 nd 51 4.1 nd 285 nd 34 2.610/10/2012 76 654 272 64 6.5 102 477 180 32 4.417/10/2012 90 421 nd 51 4.5 28 289 nd 34 2.218/10/2012 53 191 70 31 1.4 52 206 62 29 124/10/2012 nd 932 594 98 3.7 nd 440 226 39 2.821/10/2012 108 274 nd 39 nd 86 133 nd 24 6.507/11/2012 360 691 385 45 10.1 194 335 116 30 5.314/11/2012 94 242 nd nd 4.7 116 272 nd nd 4.315/11/2012 102 330 80 43 0.5 128 274 49 34 0.521/11/2012 nd 408 nd 46 5.7 nd 374 nd 71 528/11/2012 64 220 107 30 3.5 132 124 105 23 3.205/12/2012 470 802 225 63 9.1 188 309 130 31 3.912/12/2012 126 693 238 59 9.2 74 310 148 32 5.313/12/2012 93 421 155 52 3.1 258 588 235 49 419/12/2012 270 308 nd 44 4 244 463 nd 32 5.6nd - not determined
Main Plant Influent Data Intel Plant Influent Data
Date
Attachment D1 Lower Liffey Valley Regional Sewerage Scheme
2 of 2
For
insp
ectio
n pur
pose
s only
.
Conse
nt of
copy
right
owne
r req
uired
for a
ny ot
her u
se.
EPA Export 25-04-2013:23:32:14

Attachment E2 Programme for Environmental Monitoring 1. Introduction The Sampling Plan for Leixlip Waste Water Treatment Plant is prepared to satisfy the monitoring requirements of WWDL Register Number D0004-01. This Plan indicates the minimum number of samples required to be taken, the type of samplers used and how samples should be taken. The samples are followed from point of sampling through to reporting. 2. Sampling Schedule 2(a) Influents Condition 4.16 of the WWDL sets out the minimum monthly influent monitoring. Table 1 Leixlip WWTP Influent Monitoring Plan
Parameter Influents Min No of Samples
BOD Yes 24 COD Yes 24 TSS Yes 24 Total P Yes 24 Total N Yes 24 2(b) Effluents Monitoring of the effluent at SW1 is performed as required by Schedule B.1 “Monitoring of Primary Waste Water Discharge” of the WWDL. Table 2 Leixlip WWTP Effluent Monitoring Plan
Parameter Monitoring Frequency
Analysis Method/Technique
Flow Continuous On-line flow meter with recorder
pH Weekly pH electrode/meter and recorder
BOD Fortnightly Standard Method COD Fortnightly Standard Method Suspended Solids Fortnightly Standard Method T Nitrogen Fortnightly Standard Method Nitrate (as N) Fortnightly Standard Method Nitrite (as N) Fortnightly Standard Method Oxidised Nitrogen (as N)
Fortnightly Standard Method
Attachment E2 Lower Liffey Valley Regional Sewerage Scheme
1 of 4
For
insp
ectio
n pur
pose
s only
.
Conse
nt of
copy
right
owne
r req
uired
for a
ny ot
her u
se.
EPA Export 25-04-2013:23:32:14

Ammonia (as N) Fortnightly Standard Method Total Phosphorus (as P)
Fortnightly Standard Method
Orthophosphate (as P)
Fortnightly Standard Method
Fluoride Fortnightly Standard Method Oils, Fats & Greases
Quarterly Standard Method
Mercury & its compounds
Quarterly Standard Method
Metals & Organic Compounds
Biannually Standard Method
Toxicity Annual As agreed by the EPA Visual Inspection Daily Sample & examine
for colour 2(c) River Water Sampling Receiving water monitoring is performed so as to comply with Schedule B.4 “Ambient Monitoring” of the WWDL. Upstream sampling point (designation – aSW1-Pu) E301537 N235828, upstream of the SWO, designation SW2. Downstream sampling point (designation – aSW1-Pd) E302295 N235179, just downstream of the weir in Lucan and therefore after the mixing zone. Table 3 Receiving Water Monitoring
Parameter Monitoring Frequency
Analysis Method/Technique
pH Ten samples/year pH electrode/meter BOD Ten samples/year Standard Method Orthophosphate (as P)
Ten samples/year Standard Method
Total Nitrogen (as N)
Ten samples/year Standard Method
Ammonia Ten samples/year Standard Method Fluoride Ten samples/year Standard Method Mercury & its Compounds
Ten samples/year Standard Method
Metals & Organic Compounds
Annually Standard Method
Visual Inspection Weekly Sample & examine for colour
Attachment E2 Lower Liffey Valley Regional Sewerage Scheme
2 of 4
For
insp
ectio
n pur
pose
s only
.
Conse
nt of
copy
right
owne
r req
uired
for a
ny ot
her u
se.
EPA Export 25-04-2013:23:32:14

3. Requirements for Sampling The use of composite samplers is essential to comply with Schedule B of the WWDL. A refrigerated flow proportional sampler is provided for the final combined effluent at SW1. This sampler has a six month service interval. Two refrigerated time proportional samplers are provided and used for influent samples – these samplers have a yearly service interval. Risk Assessment 30, Safety Manual, must be consulted prior to river sampling. River sampling locations are chosen based on validity of sample and safe access from the riverbank. The sampling location can not be altered with the agreement of the EPA. 4. Sampling Procedure 4(a) Introduction The objective of sampling is to collect a portion of material small enough in volume to be transported conveniently and handled in the laboratory while still accurately representing the material being sampled. This implies that the relative proportions or concentrations of all pertinent components will be the same in the samples as in the material being sampled, and that the sample will be handled in such a way that no significant changes in composition occur before the tests are made.
4(b) Sampling Procedure Consult the Leixlip WWTP Laboratory Methods Manuals to determine whether any special precautions should be taken when sampling for specific parameters. Therefore each point made below is for general samples, the Methods Manuals may require you to ignore certain points i.e. glass bottles used instead of plastic containers. The use of automatic samplers is essential, except in the case of surface water
samples. Samples are taken in plastic containers (1L or 2.5L). Containers are filled to the top to eliminate air/oxygen. When sampling, ensure that the material/sample is a homogenous mixture.
Samples from a composite sampler will need mixing before sampling. Samples must be transported to the laboratory in a cooler box. All samples must be labelled, indicating name of collector, date and time of
collection, place of collection. When sample is presented to the laboratory for analysis the sample is assigned a
number and sample details are logged in the laboratory logbook.
Attachment E2 Lower Liffey Valley Regional Sewerage Scheme
3 of 4
For
insp
ectio
n pur
pose
s only
.
Conse
nt of
copy
right
owne
r req
uired
for a
ny ot
her u
se.
EPA Export 25-04-2013:23:32:14

5. Analysis Methods As a minimum, the minimum number of samples, as set out in Schedule B.1 and B.4 of the WWDL, shall be analysed by a laboratory which satisfies Condition 4.1 and 4.2 of the WWDL. 6. Quality Control Reference should be made to the Leixlip WWTP Laboratory Methods Manual for all details pertaining to Quality Control protocol in the Leixlip WWTP Laboratory. 7. Result Recording/Reporting Procedures All samples entering Leixlip WWTP Laboratory are logged in the Sample
Logbook. This allocates a unique identifying number to the sample. Parameters have an associated result logbook in which the sample details and
results are recorded. Results for all the parameters are recorded on the appropriate result sheet. Written copy of results to be provided to Plant Manager and Plant Supervisor on a
daily basis. All results are inputted into Lab Works and the Performance Management System,
from which a printout of results should be made available as soon as practicable. 8. Laboratory Accreditation The Leixlip WWTP Laboratory is not an accredited laboratory but does participate in the EPA Intercalibration Scheme.
Attachment E2 Lower Liffey Valley Regional Sewerage Scheme
4 of 4
For
insp
ectio
n pur
pose
s only
.
Conse
nt of
copy
right
owne
r req
uired
for a
ny ot
her u
se.
EPA Export 25-04-2013:23:32:14
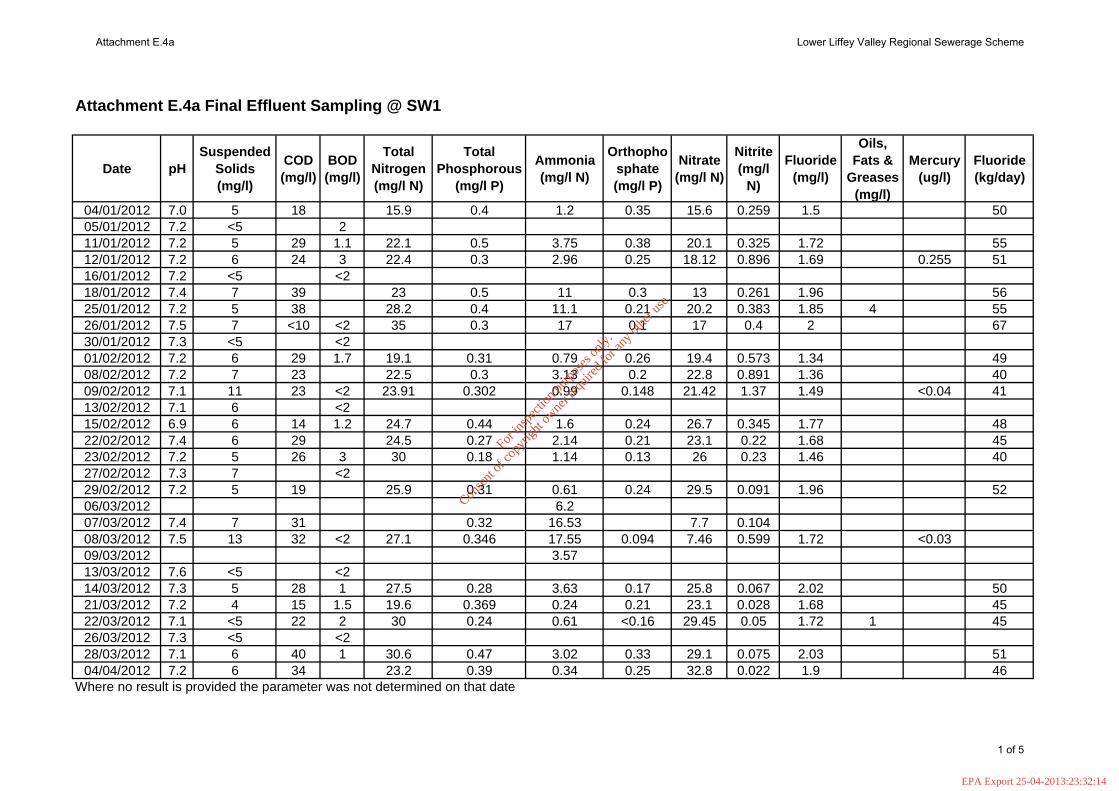
Date pHSuspended
Solids (mg/l)
COD (mg/l)
BOD (mg/l)
Total Nitrogen (mg/l N)
Total Phosphorous
(mg/l P)
Ammonia (mg/l N)
Orthophosphate (mg/l P)
Nitrate (mg/l N)
Nitrite (mg/l
N)
Fluoride (mg/l)
Oils, Fats &
Greases (mg/l)
Mercury (ug/l)
Fluoride (kg/day)
04/01/2012 7.0 5 18 15.9 0.4 1.2 0.35 15.6 0.259 1.5 5005/01/2012 7.2 <5 211/01/2012 7.2 5 29 1.1 22.1 0.5 3.75 0.38 20.1 0.325 1.72 5512/01/2012 7.2 6 24 3 22.4 0.3 2.96 0.25 18.12 0.896 1.69 0.255 5116/01/2012 7.2 <5 <218/01/2012 7.4 7 39 23 0.5 11 0.3 13 0.261 1.96 5625/01/2012 7.2 5 38 28.2 0.4 11.1 0.21 20.2 0.383 1.85 4 5526/01/2012 7.5 7 <10 <2 35 0.3 17 0.1 17 0.4 2 6730/01/2012 7.3 <5 <201/02/2012 7.2 6 29 1.7 19.1 0.31 0.79 0.26 19.4 0.573 1.34 4908/02/2012 7.2 7 23 22.5 0.3 3.13 0.2 22.8 0.891 1.36 4009/02/2012 7.1 11 23 <2 23.91 0.302 0.99 0.148 21.42 1.37 1.49 <0.04 4113/02/2012 7.1 6 <215/02/2012 6.9 6 14 1.2 24.7 0.44 1.6 0.24 26.7 0.345 1.77 4822/02/2012 7.4 6 29 24.5 0.27 2.14 0.21 23.1 0.22 1.68 4523/02/2012 7.2 5 26 3 30 0.18 1.14 0.13 26 0.23 1.46 4027/02/2012 7.3 7 <229/02/2012 7.2 5 19 25.9 0.31 0.61 0.24 29.5 0.091 1.96 5206/03/2012 6.207/03/2012 7.4 7 31 0.32 16.53 7.7 0.10408/03/2012 7.5 13 32 <2 27.1 0.346 17.55 0.094 7.46 0.599 1.72 <0.0309/03/2012 3.5713/03/2012 7.6 <5 <214/03/2012 7.3 5 28 1 27.5 0.28 3.63 0.17 25.8 0.067 2.02 5021/03/2012 7.2 4 15 1.5 19.6 0.369 0.24 0.21 23.1 0.028 1.68 4522/03/2012 7.1 <5 22 2 30 0.24 0.61 <0.16 29.45 0.05 1.72 1 4526/03/2012 7.3 <5 <228/03/2012 7.1 6 40 1 30.6 0.47 3.02 0.33 29.1 0.075 2.03 5104/04/2012 7.2 6 34 23.2 0.39 0.34 0.25 32.8 0.022 1.9 46
Attachment E.4a Final Effluent Sampling @ SW1
Where no result is provided the parameter was not determined on that date
Attachment E.4a Lower Liffey Valley Regional Sewerage Scheme
1 of 5
For
insp
ectio
n pur
pose
s only
.
Conse
nt of
copy
right
owne
r req
uired
for a
ny ot
her u
se.
EPA Export 25-04-2013:23:32:14

Date pHSuspended
Solids (mg/l)
COD (mg/l)
BOD (mg/l)
Total Nitrogen (mg/l N)
Total Phosphorous
(mg/l P)
Ammonia (mg/l N)
Orthophosphate (mg/l P)
Nitrate (mg/l N)
Nitrite (mg/l
N)
Fluoride (mg/l)
Oils, Fats &
Greases (mg/l)
Mercury (ug/l)
Fluoride (kg/day)
05/04/2012 7.2 11 27 <2 31.6 0.38 0.03 0.153 30.4 0.034 3.4 <0.03 8309/04/2012 7.3 <5 <211/04/2012 7.0 5 36 1 23.7 0.38 0.38 0.24 24.3 0.022 1.8 4718/04/2012 7.4 12 33 2.4 27.2 0.74 0.77 0.49 29.3 0.135 2 5519/04/2012 7.2 <5 21 <2 31 0.46 0.48 <0.16 29.6 0.13 1.3 3923/04/2012 7.3 <5 <225/04/2012 7.2 8 15 0.36 0.68 0.24 26 0.07 1.8 4502/05/2012 7.4 5 30 1 18.5 0.28 0.26 0.21 21.6 0.073 1.25 5303/05/2012 7.3 15 19 <2 24.85 0.228 0.06 0.104 22.56 0.052 0.84 <0.03 3508/05/2012 7.6 <5 <209/05/2012 7.3 6 22 16.3 0.25 0.14 0.18 20.4 0.025 1.46 4516/05/2012 7.0 5 17 0.9 27.1 0.27 0.31 0.23 30.7 0.129 1.12 3017/05/2012 7.4 <5 22 <2 30 0.21 0.04 <0.16 30.7 <0.03 1.18 4 3221/05/2012 7.5 6 <230/05/2012 7.4 6 18 25.3 0.21 0.21 0.11 23.8 0.026 1.74 4431/05/2012 7.1 9 21 <2 28.8 0.165 0.37 0.098 27.63 0.039 1.19 <0.03 3005/06/2012 7.5 <5 <206/06/2012 7.2 4 12 1 18 0.19 0.23 0.11 19.2 0.026 1.74 4814/06/2012 7.2 <5 24 3 29 <0.05 2.7 <0.16 24 0.1 1.3 2.7 3718/06/2012 7.2 <5 <220/06/2012 7.2 6 23 1 0.23 1.07 0.11 21 0.064 1.43 3928/06/2012 7.4 15 25 <2 30.15 0.217 5.19 0.17 23.82 0.169 1.5 <0.03 5202/07/2012 7.2 <5 <211/07/2012 7.0 19 25.7 0.25 1.43 0.1 23.6 0.097 1.12 3813/07/2012 7.2 7 11 2 29 0.09 3 <0.16 28 0.03 1.1 5 3416/07/2012 7.1 5 <218/07/2012 7.0 5 15 1.3 16.9 0.25 0.3 0.09 18.2 0.031 1.94 6925/07/2012 7.3 2 25 22 0.29 1.94 0.24 19.6 0.107 1.4 4726/07/2012 7.1 12 12 <2 18.25 0.182 1.19 0.105 12.02 0.625 0.83 <0.03 30
Where no result is provided the parameter was not monitored on that date
Attachment E.4a Lower Liffey Valley Regional Sewerage Scheme
2 of 5
For
insp
ectio
n pur
pose
s only
.
Conse
nt of
copy
right
owne
r req
uired
for a
ny ot
her u
se.
EPA Export 25-04-2013:23:32:14

Date pHSuspended
Solids (mg/l)
COD (mg/l)
BOD (mg/l)
Total Nitrogen (mg/l N)
Total Phosphorous
(mg/l P)
Ammonia (mg/l N)
Orthophosphate (mg/l P)
Nitrate (mg/l N)
Nitrite (mg/l
N)
Fluoride (mg/l)
Oils, Fats &
Greases (mg/l)
Mercury (ug/l)
Fluoride (kg/day)
01/08/2012 7.4 5 24 16.2 0.2 1.92 0.09 13.5 0.113 2.03 6108/08/2012 7.4 15 20.4 0.23 0.17 0.1 22.9 0.045 1.43 3610/08/2012 7.4 <5 26 <2 21 0.22 0.3 0.16 24 0.03 1.6 4113/08/2012 7.5 <5 <215/08/2012 7.5 4 35 1 18.9 0.24 2.45 0.2 16.7 0.278 1.73 4322/08/2012 7.4 5 19 1.4 8 0.19 1.42 0.15 4.5 0.498 1.79 4923/08/2012 7.1 2 8 <2 6.88 0.115 0.29 0.066 5.69 0.1 1.51 <0.03 3727/08/2012 7.3 <5 <229/08/2012 7.1 4 21 12.2 0.31 0.79 0.14 12.1 0.197 1.8 5905/09/2012 7.1 6 25 1.2 17.6 0.31 1.21 0.24 19.1 1.91 4706/09/2012 7.5 <5 10 2 19 0.2 3.9 0.15 2.4 0.2 1.6 2 3911/09/2012 7.0 <5 <212/09/2012 7.0 3 20 1.6 19.3 0.3 2.95 0.12 19.9 0.254 1.8 4320/09/2012 7.2 11 17 <2 19.4 0.26 0.65 0.096 19.28 0.121 0.68 <0.03 1624/09/2012 7.2 <5 <226/09/2012 7.4 5 20 1.5 12.5 0.18 1.65 0.14 11.8 0.09 1.04 4203/10/2012 23 15.2 0.21 1.67 16.2 0.145 1.39 4004/10/2012 7.5 <5 21 3 20 0.16 2.8 <0.16 13 0.03 1.2 4 3409/10/2012 7.2 6 <210/10/2012 7.2 4 25 1.2 17.8 0.21 0.64 0.09 20.6 0.07 1.31 3517/10/2012 7.5 6 35 15.2 0.27 11.89 0.13 6.3 0.111 1.28 4518/10/2012 7.5 11 31 <2 16.17 0.142 7.27 0.055 6.38 0.265 0.99 <0.03 4217/10/2012 1.4122/10/2012 7.4 <5 <224/10/2012 7.5 6 32 1.7 17.7 0.24 5.41 0.14 13.8 0.141 1.28 3631/10/2012 7.2 4 13 1 17.1 0.28 0.12 0.13 20.7 0.015 1.47 3701/11/2012 7.8 <5 14 <2 24 0.22 0.04 0.12 22 <0.03 1 4 2705/11/2012 7.1 <5 <207/11/2012 7.2 3 24 1 18.9 0.26 1.08 0.14 20.914/11/2012 7.4 5 20 0.28 1.45 0.14 20.6 0.164 1.64 46
Where no result is provided the parameter was not monitored on that date
Attachment E.4a Lower Liffey Valley Regional Sewerage Scheme
3 of 5
For
insp
ectio
n pur
pose
s only
.
Conse
nt of
copy
right
owne
r req
uired
for a
ny ot
her u
se.
EPA Export 25-04-2013:23:32:14

Date pHSuspended
Solids (mg/l)
COD (mg/l)
BOD (mg/l)
Total Nitrogen (mg/l N)
Total Phosphorous
(mg/l P)
Ammonia (mg/l N)
Orthophosphate (mg/l P)
Nitrate (mg/l N)
Nitrite (mg/l
N)
Fluoride (mg/l)
Oils, Fats &
Greases (mg/l)
Mercury (ug/l)
Fluoride (kg/day)
15/11/2012 7.1 6 15 <2 19.7 0.152 0.62 0.129 18.47 0.107 0.61 <0.04 1720/11/2012 7.0 <5 221/11/2012 7.4 28 20.6 0.31 2.32 0.21 20.8 0.182 1.54 4328/11/2012 7.6 6 18 1.6 13.5 0.2 0.24 0.12 11.6 0.041 0.84 3229/11/2012 7.4 7 31 <2 14 0.05 0.06 <0.16 12 <0.03 0.97 3203/12/2012 7.2 <5 <205/12/2012 7.4 6 27 0.7 20.7 0.17 0.71 0.09 19.6 0.111 1.22 3812/12/2012 7.3 7 18 1.4 23.1 0.22 0.49 0.09 21.8 0.165 1.07 3113/12/2012 7.1 10 34 2 21.26 0.312 0.41 0.05 19.9 0.241 0.1 <0.04 317/12/2012 7.2 <5 2519/12/2012 7.5 6 21 19.3 0.23 0.15 0.09 23 0.051 1.11 3127/12/2012 7.4 9 14 <2 12.4 0.226 0.16 0.076 11.12 0.116 1.09 <0.03 33
Where no result is provided the parameter was not monitored on that date
Attachment E.4a Lower Liffey Valley Regional Sewerage Scheme
4 of 5
For
insp
ectio
n pur
pose
s only
.
Conse
nt of
copy
right
owne
r req
uired
for a
ny ot
her u
se.
EPA Export 25-04-2013:23:32:14

DateArsenic
(ug/l)Atrazine
(ug/l)Chromium
(ug/l)Copper (ug/l)
Cyanide (ug/l)
Dichloromethane
(ug/l)
Lead (ug/l)
Nickel (ug/l)
Simazine (ug/l)
Toulene (ug/l)
Tributyltin (ug/l)
Xylene (ug/l)
Zinc (ug/l)
09/02/2012 0.445 <0.01 <0.28 <0.51 <5 <5.00 <0.12 2.541 <0.01 <0.54 <0.02 <0.73 7.36826/07/2012 0.225 <0.01 1.744 6.696 <5 <5.00 0.276 5.09 <0.01 <0.54 <0.02 <0.73 12.4413/12/2012 <0.18 <0.01 0.614 7.834 <5 <5.00 <0.12 5.537 <0.01 <0.54 <0.02 <0.73 20.63
DateBarium (ug/l)
Boron (ug/l)
Cadmium (ug/l)
Conductivity uscm
@20deg
DO (mg/l)
Hardness (mg/l
CaCO3)
Total Phenols
(ug/l)
Selenium(ug/l)
Sulphate (mg/l)
13/12/2012 11.24 91.47 <0.05 823 5.8 262 <0.10 <2.12 186.85
Attachment E.4a Lower Liffey Valley Regional Sewerage Scheme
5 of 5
For
insp
ectio
n pur
pose
s only
.
Conse
nt of
copy
right
owne
r req
uired
for a
ny ot
her u
se.
EPA Export 25-04-2013:23:32:14

Attachment E.4b Compliance with monitoring requirements and treatment standards Table E.4b(i) – Compliance with Monitoring Requirements & Treatment Standards as required by the WWDL (D0004-01)
pH
BOD (mg/l)
COD mg/lTSS
(mg/l) Ammonia (mg/l N)
Nitrate (mg/l N)
Nitrite (mg/l N)
Total P (mg/l)
Orthophosphate (mg/l P)
Fluoride (kg/d)
OFG's (mg/l)
WWDL ELV6.0-9.0
8 100 15 2.75 14.9 1 0.5 0.39 180 15
ELV with Condition 2
interpre. Included
6.0-9.0
16 200 37.5 3.3 17.9 1.2 0.6 0.47 180 18
Number of sample results
96 75 73 93 75 72 70 72 70 69 8
Number of samples
above WWDL ELV
0 0 0 0 16 55 1 1 1 0 0
Number of samples
above ELV with
Condition 2 interpretation included
0 0 0 0 10 51 1 1 1 0 0
Overall compliance
Pass Pass Pass Pass Fail Fail Fail Fail Fail Pass Pass
Attachment E.4b Lower Liffey Valley Regional Sewerage Scheme
1 of 2
For
insp
ectio
n pur
pose
s only
.
Conse
nt of
copy
right
owne
r req
uired
for a
ny ot
her u
se.
EPA Export 25-04-2013:23:32:14

Table E.4b(ii) – Compliance with Monitoring Requirements & Treatment Standards as required by the UWWT Regs
Parameter UWWT Regs Limit
Frequency / annum
required
Actual Number of Samples in
2012
Maximum Result in
2012
Overall Compliance
BOD (mg/l) 25 24 >24 3 Pass
COD (mg/l) 125 24 >24 40 Pass
TSS (mg/l) 35 24 >24 15 Pass
Total Phosphorous
(mg/l P) 2 24 >24 0.74 Pass
Attachment E.4b Lower Liffey Valley Regional Sewerage Scheme
2 of 2
For
insp
ectio
n pur
pose
s only
.
Conse
nt of
copy
right
owne
r req
uired
for a
ny ot
her u
se.
EPA Export 25-04-2013:23:32:14

Attachment F.1 Assessment of Impact on Receiving Surface or Ground Water
a) Existing Environment (a)1. Biological Water Quality In 2012 BEC Consultants Ltd carried out biological water quality monitoring for Kildare County Council upstream and downstream of SW1. A field survey was carried out on August 10th at three sites on the River Liffey, one downstream (D1) and two upstream (U1 and U2) of the discharge. Site D1 was located downstream of the Lucan weir located off the N4 motorway between Leixlip and Lucan. The sampling site was as close as practical to aSW1d, safe access and river bed conditions had to be considered. Site U1 was located directly upstream of the bridge in Leixlip, aSW1u was not suitable so the sampling site was moved upstream. Site U2 was located directly upstream of the bridge in Celbridge.
Table 1. Details of the survey sites.
Site code Irish Grid (10m
accuracy) Description
U2 29736 23291 Upstream of bridge in Celbridge U1 30080 23583 Upstream of bridge in Leixlip D1 30223 23528 Downstream of Lucan Weir
Biological water quality, as indicated by Q-values was the same at all three sites Q3, indicating moderately polluted, Class C water. This indicates a reduction in the water quality at Celbridge (U2) of the River Liffey when compared to the EPA data from the 2010 sampling period (EPA, 2012), which rated water quality at Celbridge as Q4, Leixlip as Q3 and downstream of Leixlip as Q3. Both Leixlip (U1) and downstream of Leixlip (Q3) remain the same. When compared with the survey carried by EcoServe in 2011, on behalf of Kildare County Council, it indicates that the water quality has deteriorated at U2 (was Q4 now Q3), and D1 (was Q3-4, now Q3) and stayed the same at U1 (Q3). The fact that water quality appears to have deteriorated at all three sample sites suggests the deterioration is linked to a wider catchment effect, possible related to the high levels of rainfall that occurred over the summer of 2012. (a)2. Physico-chemical conditions The following description of the existing environment is based on 2012 ambient monitoring submitted electronically as required in the Section F of this application. The pH upstream and downstream of SW1 was at all times compliant with the EQS for hard water – 6.0 <pH<9.0.
Attachment F.1 Lower Liffey Valley Regional Sewerage Scheme
1 of 51
For
insp
ectio
n pur
pose
s only
.
Conse
nt of
copy
right
owne
r req
uired
for a
ny ot
her u
se.
EPA Export 25-04-2013:23:32:14

BOD was compliant upstream and downstream with the required 95%ile High Status limit of <2.2mg/l. Upstream of SW1 the total ammonia was compliant with the Good Status <0.140mg/l N 95%ile. However the 95%ile downstream was >0.140mg/l N and therefore can not be classified as being of Good Status. Orthophosphate does not comply with EQS for Good Status 95%ile for MRP of <0.075mg/l P either upstream or downstream of SW1. Mercury, fluoride, arsenic, atrazine, chromium, copper, cyanide, dichloromethane, lead, nickel, simazine, toluene, xylenes, zinc, cadmium and total phenols all comply upstream and downstream with their EQS’s. Tributlytin was at all times below its limit of detection, 0.02 ug/l, upstream and downstream of SW1 and therefore no further comment can be made on its compliance with its EQS. There is no EQS for Total Oxidised Nitrogen (TON) but the Water Quality Management Plan (WQMP) for the Liffey Catchment set a 95%ile of 5mg/l N - upstream and downstream of SW1 complied with this limit. As per TON there is no EQS for suspended solids, barium, boron, selenium and sulphate but the all complied, upstream and downstream of SW1 with the WQMP for the Liffey Catchment. (a)3. Designations of Receiving Water Body The receiving water body for the Leixlip WWTP primary discharge (SW1) is the River Liffey. The River Liffey has no Natura 2000 designation at the primary discharge point. However, the River Liffey discharges to the South Dublin Bay and River Tolka Special Protection Area approximately 23km downstream of SW1. The River Liffey is designated as sensitive to phosphorous under the Urban Wastewater Treatment Regulations upstream and downstream of the primary discharge point. The River Basin Management Plan for the River Liffey classifies the receiving water at the discharge point as being of Moderate Quality with Good Status to be achieved by 2021. (a)4. Downstream Abstractions and Uses of Water There are no drinking water abstractions downstream of the Leixlip Waste Water Treatment Plant. There are no designated bathing waters in the River Liffey downstream of Leixlip Waste Water Treatment Plant. There are designated bathing waters in the Dublin Bay area. Due too the distance and high level of dilution and dispersion of discharges from
Attachment F.1 Lower Liffey Valley Regional Sewerage Scheme
2 of 51
For
insp
ectio
n pur
pose
s only
.
Conse
nt of
copy
right
owne
r req
uired
for a
ny ot
her u
se.
EPA Export 25-04-2013:23:32:14

the Leixlip Waste Water Treatment Plant, prior to potentially reaching any bathing water, any impact is negligible. The OPW in conjunction with local authorities in Kildare, Fingal, South Dublin and Dublin City prepared a Strategy Report for the Liffey Valley Park. The report reviewed the recreational, access, ecological and built heritage resources along the River Liffey from Ballymore Eustace to Islandbridge. The report identifies canoeing and rowing as the main uses of the River Liffey downstream of the Leixlip Waste Water Treatment Plant. (a)5. Ground Emissions from the Waste Water Treatment Plant There are no discharges to groundwater from Leixlip Waste Water Treatment Plant. (a)6. Flow Data Table 2. River Liffey and Rye Water Flow Data Monitoring Site
Easting Northing DWF (m3/sec) 95%ile (m3/sec)
River Liffey @ Powerstation, Leixlip
300600 235800 2.0 2.0
Rye Water @ Leixlip
300523 236434 0.05 0.09
Leixlip WWTP SW1
301633 235839 2.05 2.09
(a)7. Volumetric Contribution by Site Flow Table 3. Levels of Dilutions Available Leixlip WWTP
WWTP DWF (m3/sec)
Total DWF @ SW1 (effluent + river)
Level of Dilution
Effluent DWF % of River DWF
150,000 pe
0.561 2.61 1 in 4.7 22
Attachment F.1 Lower Liffey Valley Regional Sewerage Scheme
3 of 51
For
insp
ectio
n pur
pose
s only
.
Conse
nt of
copy
right
owne
r req
uired
for a
ny ot
her u
se.
EPA Export 25-04-2013:23:32:14

b) Predicted Impact of the 150,000 pe WWTP on the River Liffey Table 4. Impact on the River Liffey of the 150,000 pe plant based on existing receiving water
Parameter River Liffey Flow
(m3/sec)
Upstream @ aSW1u
WWTP DWF
(m3/sec)
Max Daily average @ SW1
Downstream Predicted
BOD (mg/l) 2.09 <2 0.561 6^* #VALUE! COD (mg/l) 2.09 8* 0.561 71^* 21.3400 TSS (mg/l) 2.09 12.7* 0.561 11^* 12.3449 Total N (mg/l N) 2.09 4.64 0.561 3.6595 Total P (mg/l P) 2.09 0.054* 0.561 0.36^* 0.1188 Total ammonia (mg/l N) 2.09 0.119* 0.561 0.62^* 0.2251 Orthophosphate (mg/l P) 10.7 0.035** 0.561 0.28^* 0.0472 Fluoride (mg/l) 2.05 0.17^ 0.561 3.7^*^ 0.9288 Sulphate (mg/l) 2.09 10.58^ 0.561 186.85^*^ 47.9000 Nitrate (mg/l N) 2.09 2.71* 0.561 10.6^* 4.3813 Nitrite (mg/l N) 2.09 0.034* 0.561 0.71^* 0.1771 Phenol (mg/l) 2.05 <lod 0.561 <0.10^*^ 0.0000 Atrazine (mg/l) 2.05 <lod 0.561 <0.01^*^ 0.0000 Dichloromethane (mg/l) 2.05 <lod 0.561 <5.00^*^ 0.0000 Simazine (mg/l) 2.05 <lod 0.561 <0.01^*^ 0.0000 Toulene (mg/l) 2.05 <lod 0.561 <0.54^*^ 0.0000 Tributylin (mg/l) 2.05 <lod 0.561 <0.02^*^ 0.0000 Xylene (mg/l) 2.05 <lod 0.561 <0.73^*^ 0.0000 Arsenic (mg/l) 2.05 0.0004^ 0.561 0.0004^*^ 0.0004 Chromium (mg/l) 2.05 0.0006^ 0.561 0.0074^*^ 0.0021 Copper (mg/l) 2.05 0.0025^ 0.561 0.0078^*^ 0.0036 Cyanide (mg/l) 2.05 <lod 0.561 <5^*^ 0.0000 Lead (mg/l) 2.05 0.0003^ 0.561 0.0003^*^ 0.0003 Nickel (mg/l) 2.05 0.0014^ 0.561 0.0055^*^ 0.0023 Zinc (mg/l) 2.05 0.0032^ 0.561 0.0206^*^ 0.0069 Boron (mg/l) 2.05 <lod 0.561 91.47^*^ 0.0000 Cadmium (mg/l) 2.05 <lod 0.561 <0.05^*^ 0.0000 Mercury (mg/l) 2.05 0 0.561 0.00026^*
^ 0.00005
Selenium (mg/l) 2.05 <lod 0.561 <2.12^*^ 0.0000 Barium (mg/l) 2.05 0.0222^ 0.561 0.0011^*^ 0.0177
*95%ile from 2012 monitoring **median from 2012 monitoring as required in Section G.2 of the Application Guidance Notes ^average from 2012 monitoring <lod – below limit of detection ^*design ^*^max from 2012 monitoring
The maximum level discharged at SW1 in 2012 was less than the EQS for inland surface waters for arsenic, atrazine, chromium, copper, cyanide, dichloromethane, lead, nickel, simazine, toluene, total xylene, zinc, cadmium and total phenols. Therefore the discharge from Leixlip Waste Water Treatment Plant can not impact on the EQS status for any of these substances.
Attachment F.1 Lower Liffey Valley Regional Sewerage Scheme
4 of 51
For
insp
ectio
n pur
pose
s only
.
Conse
nt of
copy
right
owne
r req
uired
for a
ny ot
her u
se.
EPA Export 25-04-2013:23:32:14

Mercury was on one occasion, 14 samples in total, detected in the final effluent at SW1. Mercury levels at aSW1u were at all times <0.03ug/l therefore, assuming no mercury in the receiving water, gives a predicted impact of 0.05ug/l Hg downstream at aSW1d – this complies with the AA-EQS and MAC-EQS. Fluoride has a predicted downstream level of 929ug/l. This is in excess of its EQS of 500ug/l. However as per the attached report “Report on Fluoride at Leixlip Waste Water Treatment Works and in the River Liffey” the quantity of measurable dissolved fluoride is considerably lower than the mathematically predicted value. The report attributes this to the high hardness level of the water and states that the fluoride has been progressively converted to a non-toxic non-biologically reversible form of fluoride (calcium fluoride) and therefore is of no environmental significance. It is highlighted that the calculation of the fluoride assimilative capacity in the River Liffey is not a straightforward one as the form of fluoride needs to be taken into account. This conclusion is supported by Kildare County Council monitoring – the maximum recorded downstream, since receipt of the WWDL, was 390ug/l on the 28th October 2009. Tributlytin was at all times below its limit of detection, 0.02ug/l, and therefore no further comment can be made on its predicted impact. There is no EQS for TON but the Water Quality Management Plan (WQMP) for the Liffey Catchment set a 95%ile of 5mg/l N – the predicted impact of 4.56mg/L N complies with this limit. As per TON there is no EQS for suspended solids, barium, boron, selenium and sulphate but the maximum daily average of all these parameters complied with the maximum river levels in the WQMP for the Liffey Catchment. 13 out of 14 results for BOD at aSW1u found <2mg/l. In order to predict the impact it is necessary to assume the 13 results found to be <2mg/l were 0.26mg/l (a notionally clean river) leaving the one remaining result at 3mg/l. The predicted impact at the design BOD of 6mg/l is therefore 2.2mg/l at aSW1d. 2.2mg/l complies with the High Status 95%ile limit. The impact on the receiving water of orthophosphate and ammonia calculates as non compliant with regard to their respective EQS’s. It is however inappropriate to impose too high standards on the discharge at SW1 because of the condition of the receiving water upstream of the Leixlip WWTP primary discharge point. Therefore it is appropriate in this case to take a notionally clean river approach. Using this approach orthophosphate will comply with the High Status EQS limit and total ammonia will comply with the Good Status 95%ile limit.
Attachment F.1 Lower Liffey Valley Regional Sewerage Scheme
5 of 51
For
insp
ectio
n pur
pose
s only
.
Conse
nt of
copy
right
owne
r req
uired
for a
ny ot
her u
se.
EPA Export 25-04-2013:23:32:14

Table 5. Impact on the River Liffey of the 150,000 pe plant based on a notionally clean river
Parameter River Liffey Flow
(m3/sec)
Upstream @ aSW1u
WWTP DWF
(m3/sec)
Max Daily average @ SW1
Downstream Predicted
BOD (mg/l) 2.09 1.2 0.561 6 2.2166 Orthophosphate (mg/l P) 10.7 0.005 0.561 0.28 0.0187 Total ammonia (mg/l N) 2.09 0.008 0.561 0.62 0.1376
c) Assimilative Capacity of the Receiving Water Table 6. Assimilative of the River Liffey based on the 150,000 pe WWTP
Parameter River Liffey Flow
(m3/sec)
Upstream @ aSW1u
WWTP DWF
(m3/sec)
Max allowed in
River Liffey @ aSW1d
Maximum Allowed in Effluent @
SW1
WAC kg/day
BOD (mg/l) 2.09 <2 0.561 2.6 #VALUE! #VALUE! COD (mg/l)^* 2.09 8* 0.561 TSS (mg/l) 2.09 12.7* 0.561 25 70.82 3432.84 Total N (mg/l N)^*
2.09 4.64 0.561
Total P (mg/l P)^*
2.09 0.054* 0.561
Total ammonia (mg/l N)
2.09 0.119* 0.561 0.14 0.218 10.58
Orthophosphate (mg/l P)
10.7 0.035** 0.561 0.035 0.035 1.70
Fluoride (mg/l) 2.05 0.17^ 0.561 0.5 1.71 82.68 Sulphate (mg/l) 2.09 10.58^ 0.561 200 905.68 43898.79 TON (mg/l) 2.09 2.744* 0.561 5 13.41 649.73 Phenol (mg/l) 2.05 <lod 0.561 0.008 0.0372 1.80 Atrazine (mg/l) 2.05 <lod 0.561 0.0006 0.0028 0.14 Dichloromethane (mg/l)
2.05 <lod 0.561 0.02 0.0931 4.51
Simazine (mg/l) 2.05 <lod 0.561 0.001 0.0047 0.23 Toulene (mg/l) 2.05 <lod 0.561 0.01 0.0465 2.26 Tributylin (mg/l) 2.05 <lod 0.561 0.0000002 0.0000 0.00 Xylene (mg/l) 2.05 <lod 0.561 0.01 0.0465 2.26 Arsenic (mg/l) 2.05 0.0004^ 0.561 0.025 0.1149 5.57 Chromium (mg/l) 2.05 0.0006^ 0.561 0.002 0.0071 0.34 Copper (mg/l) 2.05 0.0025^ 0.561 0.03 0.1305 6.32 Cyanide (mg/l) 2.05 <lod 0.561 0.01 0.0465 2.26 Lead (mg/l) 2.05 0.0003^ 0.561 0.0072 0.0324 1.57 Nickel (mg/l) 2.05 0.0014^ 0.561 0.02 0.0880 4.26 Zinc (mg/l) 2.05 0.0032^ 0.561 0.1 0.4537 21.99 Boron (mg/l) 2.05 <lod 0.561 2 9.3084 451.18 Cadmium (mg/l) 2.05 <lod 0.561 0.00008 0.0004 0.02 Mercury (mg/l) 2.05 0 0.561 0.00005 0.0002 0.01 Selenium (mg/l) 2.05 0.0024^ 0.561 0.01 0.0378 1.83 Barium (mg/l) 2.05 0.0222^ 0.561 1 4.5731 221.66
Attachment F.1 Lower Liffey Valley Regional Sewerage Scheme
6 of 51
For
insp
ectio
n pur
pose
s only
.
Conse
nt of
copy
right
owne
r req
uired
for a
ny ot
her u
se.
EPA Export 25-04-2013:23:32:14

*95%ile from 2012 monitoring **median from 2012 monitoring ^average from 2012 monitoring ^*no EQS or limit in WQMP Table 7. Assimilative Capacity of the River Liffey for the 150,000 pe plant based on a notionally clean river
Parameter River Liffey Flow
(m3/sec)
Upstream @ aSW1u
WWTP DWF
(m3/sec)
Max allowed in
River Liffey @ aSW1d
Maximum Allowed in Effluent @
SW1
WAC kg/day
BOD (mg/l) 2.09 1.2 0.561 2.6 7.81 378.82 Total ammonia (mg/l N)
2.09 0.008 0.561 0.14 0.63 30.62
Orthophosphate (mg/l P)
10.7 0.005 0.561 0.035 0.61 29.43
The emission limit values (ELV’s) set in the waste water discharge licence, D0004-01 May 2009, were set based on a daily flow of 34,560m3/day. The proposed flow has now been increased to 48,500m3/day to allow for an increase in the industrial flow rates. The final effluent concentrations based on an allowable effluent in terms of kg/day have consequently been reduced. The design limits used to assess the impact of the discharge in Tables 4 and 5 are 71.25% of the original ELV’s with no consideration for the assimilative capacity, this excludes the ammonia ELV which was based on the assimilative capacity and its EQS. The result being that some of the parameters proposed ELV’s are more onerous than they need be. Table 8. Impact on the River Liffey of the 150,000 pe plant when the proposed ELV’s in Table 4 and 5 are adjusted to reflect the available assimilative capacity or where appropriate “a notionally clean river”
Parameter River Liffey Flow
(m3/sec)
Upstream @ aSW1u
WWTP DWF
(m3/sec)
Proposed ELV @ SW1
Downstream Predicted
BOD (mg/l) 2.09 1.2 0.561 8 2.640 COD (mg/l) 2.09 8 0.561 100 27.479 TSS (mg/l) 2.09 12.7 0.561 15 13.192 Total ammonia (mg/l N) 2.09 0.008* 0.561 0.63 0.140 Orthophosphate (mg/l P) 10.7 0.005* 0.561 0.39 0.024 TON (mg/l N) 2.09 2.74 0.561 13.4 4.998
*a notionally clean river From Table 8 it can be seen that leaving the ELV’s for BOD and orthophosphate at the existing WWDL limits still allows for achieving Good Status at aSW1d. Suspended solids does not have an EQS but applying the WWDL ELV of 15mg/l results in aSW1d still being below the WQMP limit of 25mg/l.
Attachment F.1 Lower Liffey Valley Regional Sewerage Scheme
7 of 51
For
insp
ectio
n pur
pose
s only
.
Conse
nt of
copy
right
owne
r req
uired
for a
ny ot
her u
se.
EPA Export 25-04-2013:23:32:14

In order to achieve the TON WQMP limit of 5mg/l N the existing WWDL limit would have to be reduced from 15.9mg/l N to 13.4mg/l N but this is not as low as the more onerous than necessary proposed TON limit of 11.3mg/l N. Based on the assimilative calculations for this licence review the total ammonia proposed ELV should in fact be 0.63mg/l N.
d) Dangerous Substances Regulations S.I. No. 12 of 2001
Substances formally covered by the Dangerous Substances Regs. were discussed in Section b. Emissions of substances (defined in the Dangerous Substances Regs.) are not likely to impair the environment.
e) Appropriate Assessment Screening for an Appropriate Assessment was carried in 2012 and a report, Attachment B.6, was produced in June 2012. The conclusion of the assessment was that no significant impacts on Natura 2000 sites are predicted from the proposed works (alone or in combination with other projects or plans). Accordingly a Stage 2 Appropriate Assessment was deemed unnecessary.
Attachment F.1 Lower Liffey Valley Regional Sewerage Scheme
8 of 51
For
insp
ectio
n pur
pose
s only
.
Conse
nt of
copy
right
owne
r req
uired
for a
ny ot
her u
se.
EPA Export 25-04-2013:23:32:14

REPORT ON FLUORIDE AT LEIXLIP WWTW AND IN THE RIVER LIFFEY
Nicholas O'Dwyer Ltd.
June 2007
Attachment F.1 Lower Liffey Valley Regional Sewerage Scheme
9 of 51
For
insp
ectio
n pur
pose
s only
.
Conse
nt of
copy
right
owne
r req
uired
for a
ny ot
her u
se.
EPA Export 25-04-2013:23:32:14

NICHOLAS O'DWYER LTD.
REPORT ON FLUORIDE AT LEIXLIP AND IN THE RIVER LIFFEY Nicholas O’Dwyer Ltd., Consulting Engineers, Nutgrove Office Park, Nutgrove Avenue, Dublin 14. August 2007
Prepared by Approved by Issued by PROJECT NO. 20406
Initials Date Initials Date Initials Date
Revision Reason for Revision PMN 15/8/07 ND 15/8/07 ND 15/8/07
A
B
C
D
Attachment F.1 Lower Liffey Valley Regional Sewerage Scheme
10 of 51
For
insp
ectio
n pur
pose
s only
.
Conse
nt of
copy
right
owne
r req
uired
for a
ny ot
her u
se.
EPA Export 25-04-2013:23:32:14

CONTENTS
1. INTRODUCTION 1
2. MASS BALANCE OF FLUORIDE THROUGH LEIXLIP WWTW 3
2.1 Total Influent and Effluent Fluoride Loads 3
2.2 Fluoride removal at the Wastewater Treatment Plant. 5
3. FLUORIDE ASSIMILATIVE CAPACITY OF THE RIVER LIFFEY 7
3.1 Survey Measurements carried out in the River Liffey 7
3.2 Fluoride Assimilative Capacity Calculation 11
4. CONCLUSIONS AND RECOMMENDATIONS 14
Attachment F.1 Lower Liffey Valley Regional Sewerage Scheme
11 of 51
For
insp
ectio
n pur
pose
s only
.
Conse
nt of
copy
right
owne
r req
uired
for a
ny ot
her u
se.
EPA Export 25-04-2013:23:32:14

1. INTRODUCTION
Nicholas O’Dwyer Consulting Engineers were appointed on the 26th of April 2007 for the
● Contract administration of a Fluoride Flow and Load survey
● To determine a Mass Balance for Fluoride across the Leixlip Waste Water
Treatment Plant
● To assess the effect, if any, of fluoride emissions to the River Liffey
● To detail all of the above in a single report
A flow and load survey for fluoride was carried out by Nutrisolv Ltd. between 22nd and
30th May 2007 upstream and downstream of the Wastewater Treatment Works (WWTW)
at Leixlip and also upstream and downstream of the WWTW discharge location to the
River Liffey. Samples and flows were measured on a 24-hour composite basis from the
Intel plant effluent line, on three sewage lines entering the WWTW and on the combined
effluent from the WWTW as detailed in Appendix A. Grab samples were taken from the
Liffey just upstream (600m approx) of the WWTW effluent discharge point and also at
Lucan bridge approx 2.5km downstream of the WWTW effluent discharge point, well
after the mixing zone for WWTW effluent. Flow in the Liffey was also monitored courtesy
of the ESB.
Leixlip WWTW is a treatment plant with two main Streams:
The Intel Stream consisting of:
2No Aeration basins with Anoxic Zones
2No Clarifiers
Tertiary filtration
The Main Plant Stream consisting of:
2No. Primary Settlement Tanks
2No Aeration Basins
3No. Clarifiers
The Dewatering Facilities consist of:
4No. Digesters & associated gas CHP unit.
3No. Picket Fence Thickeners
Centrifuge Dewatering Plant
Attachment F.1 Lower Liffey Valley Regional Sewerage Scheme
12 of 51
For
insp
ectio
n pur
pose
s only
.
Conse
nt of
copy
right
owne
r req
uired
for a
ny ot
her u
se.
EPA Export 25-04-2013:23:32:14

Under normal operation wastewater from the Intel Factory is mixed with some domestic
wastewater at the Intel Stream. This is done because the effluent from the Intel Plant
has a low organic load and it is necessary to increase the wastewater strength with
Domestic wastewater to ensure effective and efficient treatment of the Intel Stream at
the WWTW. The main plant stream treats domestic wastewater only.
This report is concerned with:
1. Mass Balance of Fluoride Through Leixlip WWTW
2. Determine the effect, if any of the fluoride discharges from the WWTW on the
River Liffey
Attachment F.1 Lower Liffey Valley Regional Sewerage Scheme
13 of 51
For
insp
ectio
n pur
pose
s only
.
Conse
nt of
copy
right
owne
r req
uired
for a
ny ot
her u
se.
EPA Export 25-04-2013:23:32:14

2. MASS BALANCE OF FLUORIDE THROUGH LEIXLIP WWTW
2.1 Total Influent and Effluent Fluoride Loads
Wastewater comes to Leixlip WWTW through three lines, a 750mm Intel Line bringing
effluent from the Intel Facility with a small number of houses from Leixlip included,
through a 750mm Domestic Line collecting Wastewater from Leixlip, Clane, Straffan,
Celbridge and Maynooth and through a 380mm Domestic Line collecting Domestic
wastewater from Leixlip. At the Leixlip WWTW Inlet works there are no locations suitable
for a flow and load survey due to the high levels of flow so it was necessary to find
sampling locations in the town close to the plant. These locations are approx. 400m
upstream of the inlet works on and around Mill Lane
Fluoride was measured on a flow-proportional 24-hour composite basis with
corresponding flows at the:
Outlet from the balance tank at the Intel Facility
At the 750mm Intel Line
At the 750mm Domestic Line
At the 380mm Domestic Line as detailed below:
750 Intel Line Sampling Location
750mm & 380mm Domestic Line Sampling Locations
Time-proportional only sampling was carried out at the combined effluent from the
treatment plant as for Health and Safety reasons it was not possible to mount a flow
Attachment F.1 Lower Liffey Valley Regional Sewerage Scheme
14 of 51
For
insp
ectio
n pur
pose
s only
.
Conse
nt of
copy
right
owne
r req
uired
for a
ny ot
her u
se.
EPA Export 25-04-2013:23:32:14

meter on the combined effluent line. This was due to the high levels of flow which made
the installation of any flow meter impossible.
Flow measurement in the 750 Intel Line closely agrees with the flow measurements
taken at the outlet from the balance tank at the Intel Facility as detailed in Appendix A
page 5. The discrepancies are due to the small number of domestic houses in Leixlip that
connect into the 750mm Intel Line.
The values sampled, tested and recorded for each of the three lines detailed above were
added together to give the total Fluoride load to Leixlip WWTW, the effluent samples
were also tested and recorded and then multiplied by the total measured influent flow to
calculate the effluent Fluoride load from Leixlip WWTW. The results are detailed in the
table below:
Date Total
Measured
Influent Flow
m3/day
Influent
Fluoride
Load
Kg/day
Effluent
Concentration
mg/l
Effluent
Fluoride
Load
Kg/day
Effluent
Suspended
Solids Load
Kg/day
22-23.05.07 23148 67.9 3.1 71.8 92.6
23-24.05.07 24701 66.1 4.2 103.7 444.6
24-25.05.07 23170 64.7 3.3 76.5 69.5
25-26.05.07 22206 64.8 3.3 73.3 44.4
26-27.05.07 24136 70.6 3.8 91.7 48.3
27-28.05.07 22995 53.1 3.5 80.5 69.0
28-29.05.07 23621 62.9 3.4 80.3 47.2
29-30.05.07 22708 57.4 3.4 77.2 45.4
The following should be noted with respect to the Effluent Fluoride loads to the river:
1. Leixlip WWTW has a hydraulic capacity in excess of 20,500m3 (not including
Storm Tanks) this is equivalent to approximately 24hours hydraulic detention
time at the measured flows during the survey.
2. The Effluent Samples were taken on a time proportional basis and not a flow
proportional basis as was the case with all the influent samples. This may have
introduced small errors in the calculation of the effluent Fluoride Load.
3. There seems to be a correlation between a significant effluent suspended solids
load and a high Fluoride load see 23-24.05.07 above
4. The effluent load results take no account of the sludge age of the Intel stream of
the wastewater treatment plant. A sludge age of greater than 15 days is typical
for the Intel stream and could significantly effect how quickly fluoride leaves the
Attachment F.1 Lower Liffey Valley Regional Sewerage Scheme
15 of 51
For
insp
ectio
n pur
pose
s only
.
Conse
nt of
copy
right
owne
r req
uired
for a
ny ot
her u
se.
EPA Export 25-04-2013:23:32:14

WWTW, fluoride results from two samples taken of the sludge show
concentrations of 1600mg/kg and 1900mg/kg, thus it is clear that some fluoride
is being retained in the sludge in the aeration basin. Some of this fluoride will be
removed when this sludge is dewatered(as detailed in section 2.2). Because of
the sludge age it is possible that fluoride coming into the treatment plant may be
retained in the sludge for some time prior to being discharged to the river and
that the effluent Fluoride load results from this survey may reflect earlier higher
levels of Fluoride load to the plant than those recorded during the survey period.
5. There is also a foaming problem on the surface of the Aeration Basins in the Intel
stream. The source of this foaming has been described as both chemical and
biological and is currently under investigation by Kildare County Council. It is
possible that some fluoride is being retained in the foam and is also contributing
to effluent fluoride levels.
Quantities of Fluoride (measured outside the scope of this survey) have been found in
the sludge from the wastewater treatment plant at a level that would indicate that some
fluoride is being removed from the treatment plant. This is detailed in section 2.2.
2.2 Fluoride removal at the Wastewater Treatment Plant.
As part of the works required for the implementation for the Kildare Sludge Management
Plant composite samples of sludge were sampled at both Osberstown and at Leixlip
WWTW over a period of three weeks commencing November 2001. These composite
samples were taken as daily samples of digested and undigested sludge from both sites
and then each sample was dried to produce a composite dried sample for each week of
sampling.
A description of this work, the accompanying results, and the Sludge Arisings projection
for County Kildare (Taken from the Kildare County Council Sludge Management Plan) are
included in Appendix B. These results from 2001 are shown in the table below:
Osberstown
Undigested
Sludge
mg/kg
Osberstown
Digested
Sludge
mg/kg
Leixlip
Mixed
Sludge
Undigested
mg/kg
Leixlip
Mixed
Sludge
Digested
mg/kg
Sludge
Arisings
Leixlip 2001
Tonnes Dry
Solids/Annum
210 290 2900 3200 894
Attachment F.1 Lower Liffey Valley Regional Sewerage Scheme
16 of 51
For
insp
ectio
n pur
pose
s only
.
Conse
nt of
copy
right
owne
r req
uired
for a
ny ot
her u
se.
EPA Export 25-04-2013:23:32:14

Similarly two sludge samples taken from the aeration basin as part of this survey in
2007 also recorded significant levels of Fluoride as follows:
sample 1 sample 2
Leixlip Sludge samples 1600 mg/kg 1900 mg/kg
The Osberstown data is included to show that fluoride is removed with the sludge at
Leixlip at a level approximately 10 times higher than would be typically found. Based on
the figures for Digested Sludge (all Leixlip sludge is digested) and the sludge arisings for
Leixlip in 2001 the total fluoride removed at the treatment plant in 2001 was 2861kg
over the year or approximately 8kg of fluoride a day on average. As follows:
3200mg/kg = 3.2g/kg = 3.2kg/Tonne
3.2kg/Tonne x 894Tonnes / 365 days = 7.83kg/day
Even if it is assumed that no more Fluoride is removed in 2007 than was being removed
in 2001 (current sludge arising are approximately 1600 Tonnes per annum) these figures
do demonstrate that some further fluoride removal is taking place at the Leixlip WWTW
beyond what is removed by the Intel Fluoride treatment process at the Intel Facility.
Attachment F.1 Lower Liffey Valley Regional Sewerage Scheme
17 of 51
For
insp
ectio
n pur
pose
s only
.
Conse
nt of
copy
right
owne
r req
uired
for a
ny ot
her u
se.
EPA Export 25-04-2013:23:32:14

3. FLUORIDE ASSIMILATIVE CAPACITY OF THE RIVER LIFFEY
3.1 Survey Measurements carried out in the River Liffey
From the 23-30th of May samples were taken approximately at 12 Noon both upstream
and downstream of the Effluent discharge point from the Leixlip WWTW to the Liffey. The
upstream location is at the Leixlip Bridge and the downstream Location at Lucan Bridge.
The grab samples from this portion of the survey were sent to two laboratories. Lucan
Bridge was selected as it is well below the mixing zone for any effluent and there would
be no possibility of any “plug” flows from the WWTW impacting on the measured
samples. Flow in the River Liffey was also measured courtesy of the ESB. The Liffey is a
controlled river and the ESB control the water spilled from their reservoir and report
their spills to the river, describing the flow at any given time on a daily basis. The time
of year for the survey has been deliberately selected to show the impact on the Liffey
during its low flow period when increases in concentration of Fluoride would be most
noticeable. For every flow sample apart from the sample taken on the 24th May the Liffey
flows were at the mandated minimum of 2m3/sec at the time of sampling (e.g. on the
25th May sample was take at 1200hrs when flow was at 2m3/s. Between 1300hrs and
1800hrs liffey flows were increased to 8m3/hr). During the survey the Liffey was at the
minimum flow for 90% of the time. Liffey flows and fluoride results from the first
Laboratory are presented below.
Liffey Flow and Fluoride Samples
0
3
6
9
12
15
18
24/05/2007 00:00 25/05/2007 00:00 26/05/2007 00:00 27/05/2007 00:00 28/05/2007 00:00 29/05/2007 00:00 30/05/2007 00:00 31/05/2007 00:00
Date
m3/
sec
on
d
0
0.05
0.1
0.15
0.2
0.25
0.3
0.35
0.4
mg
/l F
luo
rid
e
Liffey Flow
Upstream Fluoride measurement
Downstream Fluoride Measurement
Attachment F.1 Lower Liffey Valley Regional Sewerage Scheme
18 of 51
For
insp
ectio
n pur
pose
s only
.
Conse
nt of
copy
right
owne
r req
uired
for a
ny ot
her u
se.
EPA Export 25-04-2013:23:32:14

The results from the first laboratory have been selected as they are the more
conservative results showing increases in the fluoride levels downstream on every day
except where the flow was 8m3/s on the 24th May. (The results from the second
laboratory as detailed in Appendix A do not show downstream increases in Fluoride
concentration on every day and in fact show decreases in fluoride level downstream on
certain days)
Although all the samples are grab samples the following should be noted:
1. The Intel Plant flow to the Leixlip WWTW is very consistent compared to the
Combined Domestic Flow with its Diurnal variations as shown below:
Intel vs. Domestic Influent Flow
0.00
100.00
200.00
300.00
400.00
500.00
600.00
700.00
800.00
22/05/200700:00
23/05/200700:00
24/05/200700:00
25/05/200700:00
26/05/200700:00
27/05/200700:00
28/05/200700:00
29/05/200700:00
30/05/200700:00
31/05/200700:00Date
M3/
ho
ur
Combined Domestic Flow Intel Flow
Thus it is reasonable, due to the size and balancing effects of the Effluent Balance
Tank (EBT) at the Intel Facility, to assume that the Fluoride load from the WWTW is
also reasonably consistent over the course of a day i.e. no Diurnal peaks and Troughs
in load.
2. The Liffey flow was also very consistent during the survey period and its flow is
definitively known during each sampling event.
3. The Fluoride results for the Liffey were also very consistent in a range of
0.19mg/l to 0.28mg/l Fluoride upstream and a range of 0.19mg/l to 0.36mg/l
downstream.
Because of the high level of consistency and stability seen for all the parameters a
calculation was performed to determine, in light of the known upstream Fluoride
Attachment F.1 Lower Liffey Valley Regional Sewerage Scheme
19 of 51
For
insp
ectio
n pur
pose
s only
.
Conse
nt of
copy
right
owne
r req
uired
for a
ny ot
her u
se.
EPA Export 25-04-2013:23:32:14

concentrations, the known flow in the Liffey and the known effluent Fluoride load what
the predicted effluent downstream Fluoride concentration would be.
Date
Liffey Flow m3/s
Upstream Fluoride Concentration mg/l
CalculatedUpstream Fluoride Load Kg/day
Effluent Fluoride Load Kg/day
Calculated Downstream Fluoride Load (Upstream Load + Effluent Load) Kg/day
Predicted Downstream Concentration mg/l
Recorded Downstream Concentration.mg/l
23/05/2007 2.00 0.19 32.83 71.76 104.59 0.61 0.19 24/05/2007 8.00 0.20 138.24 103.74 241.98 0.35 0.19 25/05/2007 2.00 0.24 41.47 76.46 117.93 0.68 0.30 26/05/2007 2.00 0.22 38.02 73.28 111.30 0.64 0.36 27/05/2007 2.00 0.23 39.74 91.72 131.46 0.76 0.34 28/05/2007 2.00 0.23 39.74 80.48 120.23 0.70 0.29 29/05/2007 2.00 0.28 48.38 80.31 128.69 0.74 0.36 30/05/2007 2.00 0.19 32.83 77.21 110.04 0.64 0.21 Average 2.75 0.22 51.41 81.87 133.28 0.64 0.28 There is a significant discrepancy between the Predicted downstream concentration (in
Bold) and the measured downstream concentration. The hardness levels (both total and
calcium hardness) appear to change considerably between the upstream and
downstream sampling locations as detailed below in the following graphs which show
levels of fluoride much lower than they should be and levels of Calcium hardness which
are also decreasing.
Predicted Vs. Recorded Fluoride Concentrations
0
0.1
0.2
0.3
0.4
0.5
0.6
0.7
0.8
22/05/2007 23/05/2007 24/05/2007 25/05/2007 26/05/2007 27/05/2007 28/05/2007 29/05/2007 30/05/2007 31/05/2007 01/06/2007
Date
mg
/l
Predicted Downstream Fluoride Concentration
Recorded Downstream Fluoride Concentration.
Recorded Upstream Fluoride Concentration
Attachment F.1 Lower Liffey Valley Regional Sewerage Scheme
20 of 51
For
insp
ectio
n pur
pose
s only
.
Conse
nt of
copy
right
owne
r req
uired
for a
ny ot
her u
se.
EPA Export 25-04-2013:23:32:14

Calcium Hardness results
0
50
100
150
200
250
300
350
23/05/2007 24/05/2007 25/05/2007 26/05/2007 27/05/2007 28/05/2007 29/05/2007 30/05/2007 31/05/2007Date
mg
/l
0
0.05
0.1
0.15
0.2
0.25
0.3
flu
ori
de
mg
/l
Upstream Calcium Harness
Downstream Calcium Hardness
Upstream Fluoride Concentration
For each of the sampling days the Hardness decreased between the upstream and
downstream location. It should also be noted that the upstream Hardness was at its
lowest on the 29th May corresponding to a slightly higher upstream fluoride
concentration. Measured concentrations of Fluoride downstream are not as high as is
expected and there is a potential relationship between calcium hardness and fluoride
levels in the Liffey. It is well known that, under certain circumstances of pH, Calcium
(Ca) will combine with Fluoride (F) and precipitate out as CaF2 an almost insoluble ionic
compound of calcium and fluorine. (Hard water is difficult to Fluoridate because of this
effect and can require softening prior to Fluoridation). It appears that the Liffey at Leixlip
where the water had an average total hardness over the survey period of 315mg/l is a
very hard water and that this appears to be having the effect of reducing the amount of
biologically available Fluoride in the water as detailed in the following table
Date
Liffey Flow m3/s
Calculated “Predicted” Downstream Fluoride Load (from previous table)
Measured Downstream Fluoride Load Kg/day (based on measured Fluoride Concentrations)
Calculated Downstream Fluoride “Reduction” Kg/day
23/05/2007 2.00 104.59 32.83 71.76 24/05/2007 8.00 241.98 131.33 110.65 25/05/2007 2.00 117.93 51.84 66.09 26/05/2007 2.00 111.30 62.21 49.09 27/05/2007 2.00 131.46 58.75 72.71 28/05/2007 2.00 120.23 50.11 70.11 29/05/2007 2.00 128.69 62.21 66.49 30/05/2007 2.00 110.04 36.29 73.75 Average 2.75 133.28 66.53 66.75
Attachment F.1 Lower Liffey Valley Regional Sewerage Scheme
21 of 51
For
insp
ectio
n pur
pose
s only
.
Conse
nt of
copy
right
owne
r req
uired
for a
ny ot
her u
se.
EPA Export 25-04-2013:23:32:14

It should also be noted that in a study carried out by Japanese Scientists on the toxicity
of Calcium Fluoride to marine organisms levels as high as 376mg/l of CaF2 were reported
as having no effect on the organisms probably due to the extremely low concentrations
of fluoride ion in the test solutions, as calculated from the solubility product of calcium
fluoride and the concentration of calcium ion in the natural sea water used.
(Susceptibility of marine organisms to calcium fluoride. Ishio,S; Nakagawa, H Bull. Jap.
Soc. Sci. Fish. Vol. 37, no. 2, pp. 98-104. 1971.)
3.2 Fluoride Assimilative Capacity Calculation
The EPA inspectors report of 11th October 2005 states the following with respect to the
calculation of the allowable Fluoride Load from the Intel Facility: “In response, the
Agency considers that the 95%ile flow is the appropriate value for the calculation of the
assimilative capacity as it provides protection for the receiving waters in the event of low
flows, and, as the information submitted by Intel does not confirm that sufficient fluoride
reduction is taking place in the treatment plant by way of treatment, the requirement to
reduce the mass load of fluoride discharged to LMWWTP by June 2006 is retained in the
RD. The mass limit of 240 kg/day specified by Kildare County Council in the Section 99E
response is to be complied with until that date.”
With respect to the EPA report it should be noted that:
1. Flow in the river Liffey although it is controlled is very similar in nature (if not in
volume) to that of another river in the same catchment namely the Rye, the graph below
shows the daily flows of the two rivers in 2005 for comparison purposes.
Liffey and Rye Flow Comparison
0
5
10
15
20
25
30
35
40
45
01/01/2005 20/02/2005 11/04/2005 31/05/2005 20/07/2005 08/09/2005 28/10/2005 17/12/2005Dates
Lif
fey
Flo
w
0
2
4
6
8
10
12
14
Rye
Flo
w
Liffey
Rye
Attachment F.1 Lower Liffey Valley Regional Sewerage Scheme
22 of 51
For
insp
ectio
n pur
pose
s only
.
Conse
nt of
copy
right
owne
r req
uired
for a
ny ot
her u
se.
EPA Export 25-04-2013:23:32:14

As can be seen from the graph the Liffey is a highly reactive river to rainfall events and
the changes in season in a very similar manner to its smaller tributary. The noticeable
differences are in the controlling of peak and trough river flows, where over time peak
flow are stored so that during the low season (may-october) a higher level of minimum
flow is maintained. 2m3/s is not only the 95 percentile flow it is effectively the Dry
Weather Flow and comparatively speaking the Rye has a much lower 95 percentile flow.
The regulation does not refer to Q95 flow it refers to mean annual flow. Six sets of
results from 2006 (all of the most recent data available) have been obtained from the
Central Laboratory of Dublin City Council showing the Fluoride levels both upstream and
downstream of the Leixlip WWTW as far as Islandbridge (where the Liffey becomes tidal)
on no occasion at any of these sites did the fluoride level exceed 0.5mg/l this data is
tabulated below:
Liffey Leixlip Bridge
U/S Lucan Weir
Hermitage Golf Club
Glenaulin Park
Lynches Lane
Downstream Creosote Overflow
Date Fluoride mg/l
Fluoride mg/l
Fluoride mg/l Date
Fluoride mg/l
Fluoride mg/l Fluoride mg/l
06/03/2006 0.12 0.26 0.26 14/02/2006 0.17 0.16 0.22 13/06/2006 0.12 0.28 0.39 11/04/2006 0.18 0.19 0.19 16/10/2006 0.1 0.12 0.11 11/07/2006 0.36 0.35 0.31 05/12/2006 0.13 0.14 0.15 14/11/2006 0.2 0.2 0.25 Average 0.1175 0.2 0.2275 0.2275 0.225 0.2425
It should also be noted that there is an apparent increase in the fluoride level between
Lucan and the Hermitage Golf Club and also between Lynches Lane and the Creosote
Overflow (near Islandbridge) neither of which can be related to Intel activities. This
indicates that there may be other sources, natural and otherwise impacting on the
Fluoride Concentration in the Liffey.
2. According to the EPA Inspector’s Report issued as part of Intel’s IPPC licence
application appeal review (dated 11th October 2005), the proposed licence limit of 80
kg/day was based on the low flow value for the River Liffey (95%ile flow of 2 m3/s) to
attain the Water Quality (Dangerous Substances) Regulations, 2001 (S.I. No. 12 of
2001) EQS of 0.5 mg/l F. During the survey period, 2m3/s was the flow for 90% of the
time and on several occasions the Load exceeded 80 kg/day. Based on the loads
discharged which were in excess of 80 kg/day it would have been expected that the
concentration in the River would have been greater than 0.5 mg/L. The fact that this
was clearly not the case demonstrates that the effect of the fluoride load on the actual
fluoride concentration in the River is not a simple relationship.
Attachment F.1 Lower Liffey Valley Regional Sewerage Scheme
23 of 51
For
insp
ectio
n pur
pose
s only
.
Conse
nt of
copy
right
owne
r req
uired
for a
ny ot
her u
se.
EPA Export 25-04-2013:23:32:14

3. Under S.I. No. 294/1989 EUROPEAN COMMUNITIES (QUALITY OF SURFACE WATER
INTENDED FOR THE ABSTRACTION OF DRINKING WATER) REGULATIONS, 1989. The
acceptable level of Fluoride for a water supply to be categorised as Class 1 water (the
very best, requiring minimal treatment) is 1mg/l Fluoride. Under the current drinking
water regulations S.I. No. 106 of 2007 EUROPEAN COMMUNITIES (DRINKING WATER)
REGULATIONS 2007 the minimum design Fluoride level (for water with no naturally
occurring Fluoride) is 0.8mg/l. Not one measured result for Fluoride either taken during
this survey or in fact taken in 2006 by the Dublin Councils would have any impact
whatsoever on the suitability for the waters of the Liffey for abstraction. In fact the
apparent “softening” aspects of the Fluoride to the river is arguably beneficial as is the
fluoridation of the water potentially providing potential cost savings to a downstream
treatment plant both in terms of the costs of Softening Water prior to fluoridation and
also the cost of fluoridation itself.
Attachment F.1 Lower Liffey Valley Regional Sewerage Scheme
24 of 51
For
insp
ectio
n pur
pose
s only
.
Conse
nt of
copy
right
owne
r req
uired
for a
ny ot
her u
se.
EPA Export 25-04-2013:23:32:14

4. CONCLUSIONS AND RECOMMENDATIONS
1. The 2001 survey and the sludge results from this 2007 survey show that some
fluoride is present in the sludge and thus is being removed at the Leixlip WWTW.
2. The River portion of the survey has shown that even during low flows and
significant fluoride loads the impact on the fluoride concentration in the River
Liffey is minimal.
3. At no time either during this survey or in 2006 at any other location downstream
of Leixlip WWTW has the Fluoride level exceeded 0.39mg/l (13/6/2006,
Hermitage Golf Club) and because of its location the highest value could not have
been due to effluent from Leixlip WWTW.
4. Analytical results demonstrate that the quantity of measurable dissolved fluoride
(the form taken into consideration in the standard) is considerably lower than
that which would be mathematically predicted because the water hardness is so
high and it is evident that the fluoride has been progressively converted to a non
toxic non biologically reversible or available form (Calcium Fluoride) and therefore
is of no environmental significance. Therefore, the calculation of the Fluoride
Assimilative Capacity in the River Liffey is not a straightforward one as it needs to
take into account the form of fluoride present.
5. A further fluoride survey in both the River and a new extended survey of the post
digestion sludge to confirm the fluoride load removed from the sludge in 2007 is
recommended.
Prepared by
____________________
Peter McNulty
For Nicholas O'Dwyer Ltd
Attachment F.1 Lower Liffey Valley Regional Sewerage Scheme
25 of 51
For
insp
ectio
n pur
pose
s only
.
Conse
nt of
copy
right
owne
r req
uired
for a
ny ot
her u
se.
EPA Export 25-04-2013:23:32:14

APPENDIX A
SURVEY RESULTS
Attachment F.1 Lower Liffey Valley Regional Sewerage Scheme
26 of 51
For
insp
ectio
n pur
pose
s only
.
Conse
nt of
copy
right
owne
r req
uired
for a
ny ot
her u
se.
EPA Export 25-04-2013:23:32:15

APPENDIX B
2001 SLUDGE DATA
Attachment F.1 Lower Liffey Valley Regional Sewerage Scheme
27 of 51
For
insp
ectio
n pur
pose
s only
.
Conse
nt of
copy
right
owne
r req
uired
for a
ny ot
her u
se.
EPA Export 25-04-2013:23:32:15

Flow & Fluoride Report
22 - 30 May 2007
Various Locations associated with
Leixlip Wastewater treatment plants
22 June 2007
Client:
Intel Ireland Limited
Collinstown Industrial Estate
Leixlip
Co. Kildare
Commissioned By:Nicholas O’Dwyer Consulting Engineers
Nutgrove House
Nutgrove Avenue
Dublin 14
Job number 850
Quotation number NQ 850 iv/MMcC/05-07
Date of commencement 22 May 2007
Nutrisolv project manager Mr. M. McConnell
Number of monitoring locations 7
Our Ref: 850/df iii/22-06-07 Page 1 of 21
Nutrisolv Ireland LtdBusiness Innovation Centre, Ballinode, Sligo 1850 266 266 [email protected]
Attachment F.1 Lower Liffey Valley Regional Sewerage Scheme
28 of 51
For
insp
ectio
n pur
pose
s only
.
Conse
nt of
copy
right
owne
r req
uired
for a
ny ot
her u
se.
EPA Export 25-04-2013:23:32:15

1.0 Monitoring Programme - location & objectives:
i Monitor the flow and load at the 380 mm inlet channel to the Leixlip wastewater
treatment plant over a 8 day period (in the front garden of No 27 Mill Lane.)
ii Monitor the flow and load at the 750 mm beside a small stream on a footpath
outside no 27 Mill Lane over a 8 day period
iii Monitor the flow and load at the 750 mm inlet channel located by the riverbank
over a 8 day period
iv Sample and conduct analyses on the effluent sample from combined lines at Leixlip
WWTP
v Conduct analyses on samples received from Intel
vi Sample and conduct analyses on river water from the river Liffey at 2 No. Locations
(upstream of the wastewater treatment plan at Leixlip Bridge and Downstream at
Lucan Bridge). Samples were to be split and sent to two separate laboratories for
analyses.
vii A total of 8 daily samples from each of 7 locations (4 No. sampler, 1 No. Intel & 2
No. River locations) were taken for analyses , with split samples being sent to two
different laboratories for river water analyses. 2 No. sludge samples from the
Leixlip WWTP aeration basin were also taken for analysis.
2.0 Methodology
2.1 Flow measurement
Flows were recorded using a Isco 4250 and 750 area velocity logging devices, where the
sensor was mounted at the bottom of the channel. The Isco probe uses Doppler technology to
directly measure the average velocity throughout the flow stream. An integral pressure
transducer measures depth to determine flow area. The flow is calculated by multiplying the
Our Ref: 850/df iii/22-06-07 Page 2 of 21
Nutrisolv Ireland LtdBusiness Innovation Centre, Ballinode, Sligo 1850 266 266 [email protected]
Attachment F.1 Lower Liffey Valley Regional Sewerage Scheme
29 of 51
For
insp
ectio
n pur
pose
s only
.
Conse
nt of
copy
right
owne
r req
uired
for a
ny ot
her u
se.
EPA Export 25-04-2013:23:32:15

area of the flow stream by the average velocity. Data was recorded at 2 minute intervals and
hourly, daily and monthly summaries were compiled.
2.2 Sampling
Samples of the influents and the effluent were taken using Isco 6712 programmable samplers
which operated on either time or flow proportional basis dependent upon whether they were
connected to a flow meter.
Daily river samples taken were grab samples.
2.3 Analyses
The following methods were employed for sample analysis:
i pH pH-4500 H+ B Electrochemical
ii Turbidity Robotic Analyser
iii Conductivity Conductivity 2510 B (APHA) Electrochemical
iv TSS 2540 D Total suspended solids
v Fluoride Ion chromatography based on APHA, 1998, 20th
Edition, Method 4110B
vi Alkalinity Colormetric Titration
vii hardness Colormetric Titration
viii Ca Hardness Colormetric Titration
ix TOC Catalytic Oxidation, Infra Red Analysis
Our Ref: 850/df iii/22-06-07 Page 3 of 21
Nutrisolv Ireland LtdBusiness Innovation Centre, Ballinode, Sligo 1850 266 266 [email protected]
Attachment F.1 Lower Liffey Valley Regional Sewerage Scheme
30 of 51
For
insp
ectio
n pur
pose
s only
.
Conse
nt of
copy
right
owne
r req
uired
for a
ny ot
her u
se.
EPA Export 25-04-2013:23:32:15

3.0 Results
Reference should be made to the following spreadsheets.
• 850 Leixlip flow.xls
3.1 Flow measurement
Leixlip Influent 750mm Daily Flows, May 2007
Date / Time Average Min Max Totals
m3/h m3/h m3/h m3
23/05/2007 11:00 501.43 304.23 711.82 12034
24/05/2007 11:00 537.94 280.23 691.28 12910
25/05/2007 11:00 503.34 291.76 649.71 12080
26/05/2007 11:00 468.22 236.68 622.69 11237
27/05/2007 11:00 514.18 281.7 677.46 12340
28/05/2007 11:00 516.51 267.97 676.64 12396
29/05/2007 11:00 493.01 245.52 639.44 11832
30/05/2007 10:50 475.28 247.02 629.46 11426
Our Ref: 850/df iii/22-06-07 Page 4 of 21
Nutrisolv Ireland LtdBusiness Innovation Centre, Ballinode, Sligo 1850 266 266 [email protected]
Attachment F.1 Lower Liffey Valley Regional Sewerage Scheme
31 of 51
For
insp
ectio
n pur
pose
s only
.
Conse
nt of
copy
right
owne
r req
uired
for a
ny ot
her u
se.
EPA Export 25-04-2013:23:32:15

Intel Influent 750mm Daily Flows, May 2007
Date / Time Average Min Max Totals
m3/h m3/h m3/h m3
23/05/2007 11:00 451.17 394.7 516.1 10828
24/05/2007 11:00 478.2 432.14 512.41 11477
25/05/2007 11:00 450.87 414.25 486.15 10821
26/05/2007 11:00 447.49 417.53 473.14 10740
27/05/2007 11:00 475.81 463.45 491.03 11420
28/05/2007 11:00 430.63 388.08 481.53 10335
29/05/2007 11:00 488.21 451.75 510.39 11717
30/05/2007 10:00 486.31 460.49 509.89 11185
Intel Intel (1) Nutrisolv Daily Mean Max Min
Date Hrly mean daily total daily total Difference Difference DifferenceDifference
m3/hr m3 m3 m3 % % %
22 - 23 /05/07 436.679 10480.289 10828 348 3.3 3.3 3.2
23- 24/05/07 475.131 11403.114 11477 74 0.6 0.6 0.6
24 - 25/05/07 438.671 10528.1 10821 293 2.7 2.8 2.7
25 - 26/05/07 439.129 10539.096 10740 201 1.9 1.9 1.9
26 - 27/05/07 480.148 11523.552 11420 -104 0.9 0.9 0.9
27 - 28/05/07 425.186 10204.464 10335 131 1.3 1.3 1.3
28 - 29/05/07 499.18 11980.32 11717 -263 2.2 2.2 2.2
29 - 30/05/07 487.464 11699.136 11185 -514 4.5 4.6 4.4
Our Ref: 850/df iii/22-06-07 Page 5 of 21
Nutrisolv Ireland LtdBusiness Innovation Centre, Ballinode, Sligo 1850 266 266 [email protected]
Attachment F.1 Lower Liffey Valley Regional Sewerage Scheme
32 of 51
For
insp
ectio
n pur
pose
s only
.
Conse
nt of
copy
right
owne
r req
uired
for a
ny ot
her u
se.
EPA Export 25-04-2013:23:32:15

Leixlip Influent 380mm Daily Flows, May 2007
Date / Time Average Min Max Totals
m3/h m3/h m3/h m3
23/05/2007 11:00 11.904 6.0855 16.986 285.7
24/05/2007 11:00 13.069 2.8883 23.412 313.66
25/05/2007 11:00 11.223 4.7211 20.41 269.36
26/05/2007 11:00 9.5321 2.2679 15.816 228.77
27/05/2007 11:00 15.655 5.3056 23.867 375.73
28/05/2007 11:00 10.997 0.3873 37.912 263.93
29/05/2007 11:00 2.9887 -0.71375 13.055 71.728
30/05/2007 11:00 4.0463 1.9616 11.983 97.1109
Our Ref: 850/df iii/22-06-07 Page 6 of 21
Nutrisolv Ireland LtdBusiness Innovation Centre, Ballinode, Sligo 1850 266 266 [email protected]
Attachment F.1 Lower Liffey Valley Regional Sewerage Scheme
33 of 51
For
insp
ectio
n pur
pose
s only
.
Conse
nt of
copy
right
owne
r req
uired
for a
ny ot
her u
se.
EPA Export 25-04-2013:23:32:15

Figure 1: Total Flows
12:0
0:00
pm 5
/22/
2007
12:0
0:00
am 5
/23/
2007
12:0
0:00
pm 5
/23/
2007
12:0
0:00
am 5
/24/
2007
12:0
0:00
pm 5
/24/
2007
12:0
0:00
am 5
/25/
2007
12:0
0:00
pm 5
/25/
2007
12:0
0:00
am 5
/26/
2007
12:0
0:00
pm 5
/26/
2007
12:0
0:00
am 5
/27/
2007
12:0
0:00
pm 5
/27/
2007
12:0
0:00
am 5
/28/
2007
12:0
0:00
pm 5
/28/
2007
12:0
0:00
am 5
/29/
2007
12:0
0:00
pm 5
/29/
2007
12:0
0:00
am 5
/30/
2007
0
100
200
300
400
500
600
700
800
900
1000
-20
0
20
40
60
80
100
Flow
750 m
m li
nes m
3/ho
ur
Flow
380 m
m li
ne m
3/Ho
ur
Time & Date
Leixlip 750 mm
Intel 750 mm
Leixlip 380 mm
Figure 2: Daily Flow Trends 22 - 24 May
12:00
:00 pm
5/22
/2007
06:00
:00 pm
5/22
/2007
12:00
:00 am
5/23
/2007
06:00
:00 am
5/23
/2007
12:00
:00 pm
5/23
/2007
06:00
:00 pm
5/23
/2007
12:00
:00 am
5/24
/2007
06:00
:00 am
5/24
/2007
12:00
:00 pm
5/24
/2007
0
100
200
300
400
500
600
700
800
900
1000
0
10
20
30
40
50
60
70
80
90
100
750m
m Flo
w m3
/hour
380 m
m Flo
w m3
/hour
Time & Date
Leixlip Influent 750mm
Intel Influent 750mm
Leixlip Influent 380mm
Our Ref: 850/df iii/22-06-07 Page 7 of 21
Nutrisolv Ireland LtdBusiness Innovation Centre, Ballinode, Sligo 1850 266 266 [email protected]
Attachment F.1 Lower Liffey Valley Regional Sewerage Scheme
34 of 51
For
insp
ectio
n pur
pose
s only
.
Conse
nt of
copy
right
owne
r req
uired
for a
ny ot
her u
se.
EPA Export 25-04-2013:23:32:15

3.2 Analytical Results
Intel Influent to Leixlip WWTP
Date Cert. No. pH Turbidity TSS Fluoride Flow Fluoride
m3 kg
22-23.05.07 12015 6.6 33 66 5.6 10828 61
23-24.05.07 12026 6.8 16 42 5.1 11477 59
24-25.05.07 12033 6.9 35 57 5.3 10821 57
25-26.05.07 12051 6.8 440 110 5.4 10740 58
26-27.05.07 12052 7 72 110 5.5 11420 63
27-28.05.07 12053 6.6 1300 630 4.4 10335 45
28-29.05.07 12077 6.7 160 150 4.8 11717 56
29-30.05.07 12093 6.6 120 120 4.6 11185 51
No 8 8 8 8 8 8
Min 6.6 16 42 4.4 10828 45
Max 7 1300 630 5.6 11717 63
Mean 6.75 272 160.63 5.09 11065 56
Median 6.8 120 110 5.3 11185 58
Note : All results are as mg/l except pH (units) and turbidity (NTU) unless otherwise
indicated.
Our Ref: 850/df iii/22-06-07 Page 8 of 21
Nutrisolv Ireland LtdBusiness Innovation Centre, Ballinode, Sligo 1850 266 266 [email protected]
Attachment F.1 Lower Liffey Valley Regional Sewerage Scheme
35 of 51
For
insp
ectio
n pur
pose
s only
.
Conse
nt of
copy
right
owne
r req
uired
for a
ny ot
her u
se.
EPA Export 25-04-2013:23:32:15

Influent to Leixlip WWTP 750 mm Pipe
Date Cert. No. pH Turbidity TSS Fluoride Flow Fluoride
m3 kg
22-23.05.07 12016 6.8 89 95 0.59 12034 7
23-24.05.07 12022 6.7 130 85 0.57 12910 7
24-25.05.07 12034 7.1 230 200 0.59 12080 7
25-26.05.07 12063 7 230 250 0.6 11237 7
26-27.05.07 12064 7.1 230 250 0.61 12340 8
27-28.05.07 12065 7.1 270 240 0.6 12396 7
28-29.05.07 12078 6.9 420 250 0.56 11832 7
29-30.05.07 12094 6.9 410 140 0.52 11426 6
No 8 8 8 8 8 8
Min 6.7 89 85 0.52 12034 6
Max 7.1 420 250 0.61 12910 8
Mean 6.95 251.13 188.75 0.58 12032 7
Median 7 230 240 0.59 12080 7
Note : All results are as mg/l except pH (units) and turbidity (NTU) unless otherwise
indicated
Our Ref: 850/df iii/22-06-07 Page 9 of 21
Nutrisolv Ireland LtdBusiness Innovation Centre, Ballinode, Sligo 1850 266 266 [email protected]
Attachment F.1 Lower Liffey Valley Regional Sewerage Scheme
36 of 51
For
insp
ectio
n pur
pose
s only
.
Conse
nt of
copy
right
owne
r req
uired
for a
ny ot
her u
se.
EPA Export 25-04-2013:23:32:15

Influent to Leixlip WWTP 380 mm Pipe
Date Cert. No. pH Turbidity TSS Fluoride Flow Fluoride
m3 kg
22-23.05.07 12017 7.1 140 160 0.62 285.7 0.18
23-24.05.07 12023 6.9 130 150 0.63 313.66 0.2
24-25.05.07 12036 6.8 330 370 0.66 269.36 0.18
25-26.05.07 12066 6.4 1600 2100 0.47 228.77 0.11
26-27.05.07 12067 6.7 290 270 0.68 375.73 0.26
27-28.05.07 12068 6.8 290 230 0.68 263.93 0.18
28-29.05.07 12079 6.7 130 250 0.06 71.73 0
29-30.05.07 12095 6.3 1500 700 0.55 97.11 0.05
No 8 8 8 8 8 8
Min 6.3 130 150 0.06 71.73 0
Max 7.1 1600 2100 0.68 375.73 0.26
Mean 6.71 551.25 528.75 0.536 238.25 0.14
Median 6.8 290 270 0.63 269.36 0.18
Note : All results are as mg/l except pH (units) and turbidity (NTU) unless otherwise
indicated
Our Ref: 850/df iii/22-06-07 Page 10 of 21
Nutrisolv Ireland LtdBusiness Innovation Centre, Ballinode, Sligo 1850 266 266 [email protected]
Attachment F.1 Lower Liffey Valley Regional Sewerage Scheme
37 of 51
For
insp
ectio
n pur
pose
s only
.
Conse
nt of
copy
right
owne
r req
uired
for a
ny ot
her u
se.
EPA Export 25-04-2013:23:32:15

Effluent Sample Leixlip WWTP
Date Cert. No. pH Turbidity TSS Fluoride
22-23.05.07 12018 7.5 1.8 4 3.1
23-24.05.07 12025 7.3 4.4 18 4.2
24-25.05.07 12037 7.1 4 3 3.3
25-26.05.07 12069 7.1 3 <3.0 3.3
26-27.05.07 12070 7.1 4 <3.0 3.8
27-28.05.07 12071 7 4 3 3.5
28-29.05.07 12080 6.7 3 <3.0 3.4
29-30.05.07 12096 6.8 3 2 3.4
No 8 8 8 8
Min 6.7 1.8 <3.0 3.1
Max 7.5 4.4 18 4.2
Mean 7.1 3.4 3.75 3.5
Median 7.1 4 3 3.4
Note : All results are as mg/l except pH (units) and turbidity (NTU) unless
otherwise indicated
Our Ref: 850/df iii/22-06-07 Page 11 of 21
Nutrisolv Ireland LtdBusiness Innovation Centre, Ballinode, Sligo 1850 266 266 [email protected]
Attachment F.1 Lower Liffey Valley Regional Sewerage Scheme
38 of 51
For
insp
ectio
n pur
pose
s only
.
Conse
nt of
copy
right
owne
r req
uired
for a
ny ot
her u
se.
EPA Export 25-04-2013:23:32:15

Intel Plant Sample
Date Cert. No. pH Turbidity TSS Fluoride
22-23.05.07 12021 6.6 10 9 5.2
23-24.05.07 12024 6.8 14 22 5.2
24-25.05.07 12035 6.9 15 13 5.2
25-26.05.07 12060 7 10 130 5.8
26-27.05.07 12061 7 14 12 5.3
27-28.05.07 12062 6.9 16 13 4.8
28-29.05.07 12076 6.7 12 12 5
29-30.05.07 12092 6.7 13 15 5.1
No 8 8 8 8
Min 6.6 10 9 5.2
Max 6.7 13 15 5.1
Mean 6.8 13 28 5.2
Median 7 14 12 5.3
Note : All results are as mg/l except pH (units) and turbidity (NTU) unless
otherwise indicated
Our Ref: 850/df iii/22-06-07 Page 12 of 21
Nutrisolv Ireland LtdBusiness Innovation Centre, Ballinode, Sligo 1850 266 266 [email protected]
Attachment F.1 Lower Liffey Valley Regional Sewerage Scheme
39 of 51
For
insp
ectio
n pur
pose
s only
.
Conse
nt of
copy
right
owne
r req
uired
for a
ny ot
her u
se.
EPA Export 25-04-2013:23:32:15

Summary
Total Influent Effluent
Daily Flow Fluoride Fluoride
m3 (1) kg kg
22-23.05.07 23148 67.92 71.76
23-24.05.07 24701 66.09 103.74
24-25.05.07 23170 64.66 76.46
25-26.05.07 22206 64.85 73.28
26-27.05.07 24136 70.59 91.72
27-28.05.07 22995 53.09 80.48
28-29.05.07 23621 62.87 80.31
29-30.05.07 22708 57.45 77.21
No 8 8 8
Min 23148 53.09 71.76
Max 24701 70.59 103.74
Mean 23336 63.44 81.87
Median 23170 64.85 80.31
1. Assumes influent flow and effluent flow are the same. No allowance has been made
for or load retention time in the calculation of effluent loads.
Sludge Results
Date Cert. No. Fluoride
mg/l
26.05.07 12072 4.5
28.05.07 12073 4.2
Our Ref: 850/df iii/22-06-07 Page 13 of 21
Nutrisolv Ireland LtdBusiness Innovation Centre, Ballinode, Sligo 1850 266 266 [email protected]
Attachment F.1 Lower Liffey Valley Regional Sewerage Scheme
40 of 51
For
insp
ectio
n pur
pose
s only
.
Conse
nt of
copy
right
owne
r req
uired
for a
ny ot
her u
se.
EPA Export 25-04-2013:23:32:15

River results:
Lab 1:
Upstream of Leixlip WWTP
Date Cert No. Fluoride Alk H/ness H/ness EC TSS pH TOC Temp
Total Calcium
mg/l mg/l mg/l mg/l us/cm mg/l units mg/l oC
23.05.07 12019 0.19 270 320 274 570 <3.0 7.7 <7.0 13.9
24.05.07 12027 0.2 292 340 260 688 <3.0 7.6 <7.0 14
25.05.07 12038 0.24 270 320 290 600 <3.0 7.9 <7.0 13.7
26.05.07 12054 0.22 270 330 280 490 <3.0 7.9 <7.0 13.9
27.05.07 12055 0.23 270 340 278 610 <3.0 7.9 <7.0 14.1
28.05.07 12056 0.23 270 320 274 590 <3.0 7.9 <7.0 14.2
29.05.07 12074 0.28 170 230 162 460 3 7.7 <7.0 14.3
30.05.07 12090 0.19 270 330 274 610 <3.0 7.8 <7.0 13.9
No 8 8 8 8 8 8 8 8 8
Min 0.19 170 230 162 460 <3.0 7.6 <7.0 13.7
Max 0.28 292 340 290 688 3 7.9 <7.0 14.3
Mean 0.18 260 316 262 577 <3.0 7.8 <7.0 14
Median 0.23 270 330 274 600 <3.0 7.9 <7.0 14
Our Ref: 850/df iii/22-06-07 Page 14 of 21
Nutrisolv Ireland LtdBusiness Innovation Centre, Ballinode, Sligo 1850 266 266 [email protected]
Attachment F.1 Lower Liffey Valley Regional Sewerage Scheme
41 of 51
For
insp
ectio
n pur
pose
s only
.
Conse
nt of
copy
right
owne
r req
uired
for a
ny ot
her u
se.
EPA Export 25-04-2013:23:32:15
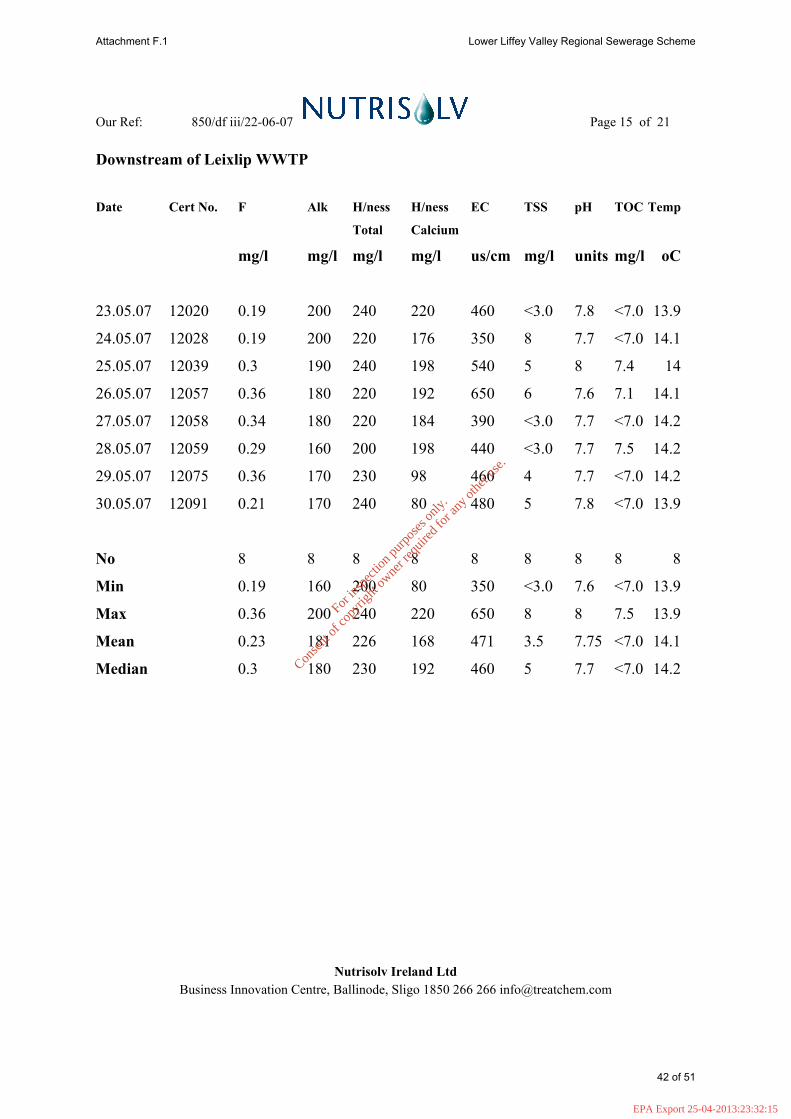
Downstream of Leixlip WWTP
Date Cert No. F Alk H/ness H/ness EC TSS pH TOC Temp
Total Calcium
mg/l mg/l mg/l mg/l us/cm mg/l units mg/l oC
23.05.07 12020 0.19 200 240 220 460 <3.0 7.8 <7.0 13.9
24.05.07 12028 0.19 200 220 176 350 8 7.7 <7.0 14.1
25.05.07 12039 0.3 190 240 198 540 5 8 7.4 14
26.05.07 12057 0.36 180 220 192 650 6 7.6 7.1 14.1
27.05.07 12058 0.34 180 220 184 390 <3.0 7.7 <7.0 14.2
28.05.07 12059 0.29 160 200 198 440 <3.0 7.7 7.5 14.2
29.05.07 12075 0.36 170 230 98 460 4 7.7 <7.0 14.2
30.05.07 12091 0.21 170 240 80 480 5 7.8 <7.0 13.9
No 8 8 8 8 8 8 8 8 8
Min 0.19 160 200 80 350 <3.0 7.6 <7.0 13.9
Max 0.36 200 240 220 650 8 8 7.5 13.9
Mean 0.23 181 226 168 471 3.5 7.75 <7.0 14.1
Median 0.3 180 230 192 460 5 7.7 <7.0 14.2
Our Ref: 850/df iii/22-06-07 Page 15 of 21
Nutrisolv Ireland LtdBusiness Innovation Centre, Ballinode, Sligo 1850 266 266 [email protected]
Attachment F.1 Lower Liffey Valley Regional Sewerage Scheme
42 of 51
For
insp
ectio
n pur
pose
s only
.
Conse
nt of
copy
right
owne
r req
uired
for a
ny ot
her u
se.
EPA Export 25-04-2013:23:32:15

Lab 2:
Note: limits of detection for TSS and single high TSS result (cert 12074) have been
queried with the subcontractor laboratory for both sets of samples.
Upstream of Leixlip WWTP
Date Cert No. F Alk H/ness H/ness EC TSS pH TOC Temp
Total Calcium
mg/l mg/l mg/l mg/l us/cm mg/l units mg/l oC
23.05.07 12019 0.3 294 340 274 654 <10 8 5 13.9
24.05.07 12027 0.3 292 340 258 669 <10 8 5 14
25.05.07 12038 0.2 292 336 290 663 <10 7.8 3 13.7
26.05.07 12054 0.1 296 322 276 666 <10 7.8 5 13.9
27.05.07 12055 0.2 292 330 276 663 <10 7.9 3 14.1
28.05.07 12056 0.5 302 332 278 662 <10 7.8 3 14.2
29.05.07 12074 0.09 198 208 160 436 98 8 4 14.3
30.05.07 12090 0.3 288 334 272 651 <10 8 6 13.9
No 8 8 8 8 8 8 8 8 8
Min 0.09 198 208 160 436 <10 7.8 3 13.7
Max 0.5 302 340 290 669 98 8 6 14.3
Mean 0.24 281.75317.75 260.5 633 12.25 7.9 4.25 14
Median 0.3 292 334 276 663 <10 8 5 14
Our Ref: 850/df iii/22-06-07 Page 16 of 21
Nutrisolv Ireland LtdBusiness Innovation Centre, Ballinode, Sligo 1850 266 266 [email protected]
Attachment F.1 Lower Liffey Valley Regional Sewerage Scheme
43 of 51
For
insp
ectio
n pur
pose
s only
.
Conse
nt of
copy
right
owne
r req
uired
for a
ny ot
her u
se.
EPA Export 25-04-2013:23:32:15

Downstream of Leixlip WWTP
Date Cert No. F Alk H/ness H/ness EC TSS pH TOC Temp
Total Calcium
mg/l mg/l mg/l mg/l us/cm mg/l units mg/l oC
23.05.07 12020 0.3 218 250 230 654 <10 8 5 13.9
24.05.07 12028 0.1 216 222 174 458 <10 8.1 4 14.1
25.05.07 12039 0.2 210 238 194 520 <10 7.7 5 14
26.05.07 12057 0.2 198 228 194 523 <10 7.7 4 14.1
27.05.07 12058 0.3 200 238 188 519 <10 7.8 4 14.2
28.05.07 12059 0.2 184 204 194 459 <10 7.8 4 14.2
29.05.07 12075 0.09 178 202 102 458 11 7.8 5 14.2
30.05.07 12091 0.3 188 218 84 503 <10 7.7 3 13.9
No 8 8 8 8 8 8 8 8 8
Min 0.09 178 202 84 458 <10 7.7 3 13.9
Max 0.3 218 250 230 654 11 8.1 5 14.2
Mean 0.2 199 225 170 512 1.4 7.8 4.3 14.1
Median 0.2 200 228 194 519 <10 7.8 4 14.1
Our Ref: 850/df iii/22-06-07 Page 17 of 21
Nutrisolv Ireland LtdBusiness Innovation Centre, Ballinode, Sligo 1850 266 266 [email protected]
Attachment F.1 Lower Liffey Valley Regional Sewerage Scheme
44 of 51
For
insp
ectio
n pur
pose
s only
.
Conse
nt of
copy
right
owne
r req
uired
for a
ny ot
her u
se.
EPA Export 25-04-2013:23:32:15

Site Notes:
i. Times presented for hourly flow reflect the flow for the previous 60 minutes.
ii. Times presented for daily flow, reflect flow from 11.00 hrs the previous day unless
otherwise indicated, ie 25/05/07 11:00 represents the time period from 11:01 hours
on 24/05/07 until 11:00 hours on 25/05/07.
iii. Flow was measured commenced on 22/05/07 at 12.00 hrs and continued up to 11.00
hrs on 30/05/07, the time of the final data download.
iv. No significant incident occurred during the programme that could have affected
results in any way.
v. Weather was generally fair throughout the monitoring period with little to no rain.
vi. 22-05-07: Installation:
a. 3 No. Sampler/flowmeters were installed at the following locations:
b. Intel Influent Line,River Bank (750mm Diameter)
c. Leixlip Influent Line (750mm Diameter)
d. Leixlip Influent Line (380mm Diameter)
e. 1 No. sampler was installed on the combined effluent line of Leixlip
WWTW.
f. All samplers and flowmeters were programmed to start sampling at 11:00
hrs
g. Flowmeters were calibrated prior to installation.
vii. 23.05.07
a. All sample volumes taken correctly.
b. Data was downloaded and checked on site for each influent location.
c. Grab samples were taken both upstream and downstream from leixlip
treatment plant at Leixlip and Lucan bridges respectively. Samples were
taken at approximately 12:00 hrs.
d. Instant Flow Readings:
• Intel In (750mm): 452.62 m3/hr
Our Ref: 850/df iii/22-06-07 Page 18 of 21
Nutrisolv Ireland LtdBusiness Innovation Centre, Ballinode, Sligo 1850 266 266 [email protected]
Attachment F.1 Lower Liffey Valley Regional Sewerage Scheme
45 of 51
For
insp
ectio
n pur
pose
s only
.
Conse
nt of
copy
right
owne
r req
uired
for a
ny ot
her u
se.
EPA Export 25-04-2013:23:32:15

• Leixlip In (750mm): 491.23 m3/hr
• Leixlip In (380mm): 10.94 m3/hr
viii. 24.05.07
a. All sample volumes taken correctly.
b. Data was downloaded and checked on site.
c. Grab samples were taken both upstream and downstream from leixlip
treatment plant at Leixlip and Lucan bridges respectively. Samples were
taken at approximately 12:00 hrs.
d. Instant Flow Readings:
• Intel In (750mm): 436.78 m3/hr
• Leixlip In (750mm): 520.10 m3/hr
• Leixlip In (380mm): 11.32 m3/hr
ix. 25.05.07
a. All sample volumes taken correctly.
b. Data was downloaded and checked on site.
c. Grab samples were taken both upstream and downstream from leixlip
treatment plant at Leixlip and Lucan bridges respectively. Samples were
taken at approximately 12:00 hrs.
d. Instant Flow Readings:
• Intel In (750mm): 411.98 m3/hr
• Leixlip In (750mm): 532. 11 m3/hr
• Leixlip In (380mm): 9.87 m3/hr
x. 26.05.07
a. All sample volumes taken correctly.
b. Grab samples were taken both upstream and downstream from leixlip
treatment plant at Leixlip and Lucan bridges respectively. Samples were
taken at approximately 12:00 hrs.
Our Ref: 850/df iii/22-06-07 Page 19 of 21
Nutrisolv Ireland LtdBusiness Innovation Centre, Ballinode, Sligo 1850 266 266 [email protected]
Attachment F.1 Lower Liffey Valley Regional Sewerage Scheme
46 of 51
For
insp
ectio
n pur
pose
s only
.
Conse
nt of
copy
right
owne
r req
uired
for a
ny ot
her u
se.
EPA Export 25-04-2013:23:32:15

xi. 27-05-07
a. All sample volumes taken correctly.
b. Grab samples were taken both upstream and downstream from leixlip
treatment plant at Leixlip and Lucan bridges respectively. Samples were
taken at approximately 12:00 hrs.
xii. 28.05.07
a. All sample volumes taken correctly.
b. Data was downloaded and checked on site.
c. Grab samples were taken both upstream and downstream from leixlip
treatment plant at Leixlip and Lucan bridges respectively. Samples were
taken at approximately 12:00 hrs.
d. Instant Flow Readings:
• Intel In (750mm): 426.22 m3/hr
• Leixlip In (750mm): 601.12 m3/hr
• Leixlip In (380mm): 3.76 m3/hr
xiii.29.05.07
a. All sample volumes taken correctly.
b. Data was downloaded and checked on site.
c. Grab samples were taken both upstream and downstream from leixlip
treatment plant at Leixlip and Lucan bridges respectively. Samples were
taken at approximately 12:00 hrs.
d. Instant Flow Readings:
• Intel In (750mm): 503.53 m3/hr
• Leixlip In (750mm): 534.61 m3/hr
• Leixlip In (380mm): 2.38 m3/hr
xiv.30.05.07
a. All sample volumes taken correctly.
Our Ref: 850/df iii/22-06-07 Page 20 of 21
Nutrisolv Ireland LtdBusiness Innovation Centre, Ballinode, Sligo 1850 266 266 [email protected]
Attachment F.1 Lower Liffey Valley Regional Sewerage Scheme
47 of 51
For
insp
ectio
n pur
pose
s only
.
Conse
nt of
copy
right
owne
r req
uired
for a
ny ot
her u
se.
EPA Export 25-04-2013:23:32:15

b. Data was downloaded and checked on site.
c. Grab samples were taken both upstream and downstream from leixlip
treatment plant at Leixlip and Lucan bridges respectively. Samples were
taken at approximately 12:00 hrs.
d. Instant Flow Readings:
• Intel In (750mm): 493.36 m3/hr
• Leixlip In (750mm): 462.79 m3/hr
• Leixlip In (380mm): 5.46 m3/hr
e. All equipment was decommissioned and flowmeters calibration was
rechecked.. There was a 0% fluctuation in calibration at all three locations.
Our Ref: 850/df iii/22-06-07 Page 21 of 21
Nutrisolv Ireland LtdBusiness Innovation Centre, Ballinode, Sligo 1850 266 266 [email protected]
Attachment F.1 Lower Liffey Valley Regional Sewerage Scheme
48 of 51
For
insp
ectio
n pur
pose
s only
.
Conse
nt of
copy
right
owne
r req
uired
for a
ny ot
her u
se.
EPA Export 25-04-2013:23:32:15

Attachment F.1 Lower Liffey Valley Regional Sewerage Scheme
49 of 51
For
insp
ectio
n pur
pose
s only
.
Conse
nt of
copy
right
owne
r req
uired
for a
ny ot
her u
se.
EPA Export 25-04-2013:23:32:15

Attachment F.1 Lower Liffey Valley Regional Sewerage Scheme
50 of 51
For
insp
ectio
n pur
pose
s only
.
Conse
nt of
copy
right
owne
r req
uired
for a
ny ot
her u
se.
EPA Export 25-04-2013:23:32:15

Attachment F.1 Lower Liffey Valley Regional Sewerage Scheme
51 of 51
For
insp
ectio
n pur
pose
s only
.
Conse
nt of
copy
right
owne
r req
uired
for a
ny ot
her u
se.
EPA Export 25-04-2013:23:32:15

Attachment F.2 Tabular Data on Drinking Water Abstraction Point(s) Not applicable as no downstream or down gradient drinking water abstraction points.
Attachment F.2 Lower Liffey Valley Regional Sewerage Scheme
1 of 1
For
insp
ectio
n pur
pose
s only
.
Conse
nt of
copy
right
owne
r req
uired
for a
ny ot
her u
se.
EPA Export 25-04-2013:23:32:15