
for Central and Western Minnesota: February 2005 Survey ... · Traverse Wilkin Secondhand Smoke...
39
Issued March 2005 Prepared by: North Dakota State Data Center at North Dakota State University, an Equal Opportunity Institution in Fargo, North Dakota Kay Schwarzwalter Ramona Danielson Dr. Richard Rathge, Director Detailed results of the 2005 Collaborative Assessment for Eight Central and Western Minnesota Counties presenting attitudes and perceptions regarding smoking and secondhand smoke issues and policies. Prepared for: Eight Central and Western Counties in Minnesota: Clay Douglas Grant Otter Tail Pope Stevens Traverse Wilkin Secondhand Smoke Survey for Central and Western Minnesota: February 2005 Survey Results North Dakota State Data Center North Dakota State University IACC Building, Room 424 PO Box 5636 Fargo, North Dakota 58105 Available online at: http://www.ndsu.edu/sdc/ publications.htm Newspaper clipping courtesy of The Forum of Fargo-Moorhead
Transcript of for Central and Western Minnesota: February 2005 Survey ... · Traverse Wilkin Secondhand Smoke...

Issued March 2005
Prepared by:North Dakota State Data Centerat North Dakota State University,an Equal Opportunity Institutionin Fargo, North Dakota
Kay SchwarzwalterRamona DanielsonDr. Richard Rathge, Director
Detailed results of the 2005 Collaborative Assessment for Eight Central andWestern Minnesota Counties presenting attitudes and perceptions regardingsmoking and secondhand smoke issues and policies.
Prepared for:Eight Central and Western Countiesin Minnesota:ClayDouglasGrantOtter TailPopeStevensTraverseWilkin
Secondhand Smoke Surveyfor Central and Western Minnesota:February 2005 Survey Results
North Dakota State Data CenterNorth Dakota State UniversityIACC Building, Room 424PO Box 5636Fargo, North Dakota 58105
Available online at:http://www.ndsu.edu/sdc/publications.htm
Newspaper clipping courtesy of The Forum of Fargo-Moorhead

Secondhand Smoke Survey for Central and Western Minnesota: February 2005 Survey Results 2
FORWARD This study was designed as a collaborative project intended to offer a regional perspective of residents in an eight-county region in central and western Minnesota. The research presented in this report will give policy makers insight into residents’ attitudes and perceptions regarding smoking and secondhand smoke. Acknowledgements We wish to acknowledge the following committee members who participated in the regional effort. They include: Heidi Happel - Clay County Public Health Kathy McKay - Clay County Public Health Jessica Anderson - Douglas County Public Health Sandy Tubbs - Douglas County Public Health Maxine Norman - Minnesota Department of Health Marion Kershner - Otter Tail County Public Health Diane Thorsen - Otter Tail County Public Health Sharon Braaten - Pope County Public Health Jodie Trill - Pope County Public Health Pam Lindahl - Stevens Traverse Grant Public Health Jan Neumann - Stevens Traverse Grant Public Health Elle Habberstad - Stevens Traverse Grant Public Health Betty Windom-Kirsch - Stevens Traverse Grant Public Health Shirley Larson - Wilkin County Public Health Brenda Woytassek - Wilkin County Public Health
����������
��
�� �
������
����� �������
���������������

Secondhand Smoke Survey for Central and Western Minnesota: February 2005 Survey Results 3
INTRODUCTION Study Objectives The objective of this study was to gather information from residents in an eight-county region in Minnesota regarding their attitudes and perceptions of secondhand smoke and its consequences. Methodology A generalizable survey was conducted in February 2005 of residents in the following eight Minnesota counties: Clay, Douglas, Grant, Otter Tail, Pope, Stevens, Traverse, and Wilkin. The survey was developed in cooperation with healthcare representatives from the eight counties and the North Dakota State Data Center at North Dakota State University. The survey contained 22 questions and took, on average, 15 minutes to complete. (See Appendix at the back of the report for the survey instrument) The survey was conducted by telephone and consisted of 601 randomly selected households in the eight-county region. A disproportionate random sample was drawn from telephone directories for each of the counties. Approximately 75 households from each county completed surveys. The data were weighted for the regional analysis to reflect the appropriate overall distribution. This sample size provided a generalizable sample for each county with an error rate of 10 percent and an overall regional sample with an error rate below 4 percent. Since the error estimate is much larger at the county level, this should be considered when making county-specific conclusions. Due to the sizable error estimate for county-level results only regional results of the survey are detailed in this report. A county-level distribution of responses on all items is available in appendix tables in the back of the report. Distributions for the overall region based on weighted data, along with the non-weighted number of respondents, is also included in the appendix tables. Response rates for telephone interviewing typically range from 50 to 60 percent given the proliferation of tele-marketing in recent years, and the advent of answering machines, caller identification systems, and other screening devices. The response rate for this survey was 83 percent. Bad or disconnected numbers and hang-ups were not factored into the calculations. Interviewers came from a pool of trained surveyors and were supervised by Data Center staff. Approval from the Institutional Review Board (IRB) at North Dakota State University was obtained to ensure that proper protocol was used and the rights of human subjects maintained. The survey consisted of questions that focus on a) general views regarding the county in which the resident resides, b) attitudes regarding smoking and secondhand smoke, and c) attitudes regarding smoke-free policies.

Secondhand Smoke Survey for Central and Western Minnesota: February 2005 Survey Results 4
EXECUTIVE SUMMARY General Issues in Respondent’s County
• The vast majority of respondents agreed or strongly agreed that the economic health of their community is good, and that they generally support the decisions being made by their county leaders. Most respondents also said that people in their county seem resistant to change.
Smoking and Secondhand Smoke Issues
• Most respondents think that people in their county were only somewhat informed about issues relating to secondhand smoke. Four in 10 respondents thought that issues surrounding smoking and secondhand smoke were not receiving enough attention.
• Most respondents do not think that getting rid of smoking discriminates against smokers.
Furthermore, the vast majority of respondents believe that people should be protected from secondhand smoke.
• At least three in four respondents think that restaurant workers and bar workers should be
able to work in a smoke-free workplace. In addition, most respondents did not think that getting rid of smoking would negatively impact the restaurant business. However, more than half of respondents thought that getting rid of smoking in bars would indeed hurt the bar business.
• An overwhelming majority of respondents believe that while secondhand smoke is harmful to
both adults and children, four in 10 respondents strongly agreed that secondhand smoke is harmful to adults, while more than one in two respondents strongly agreed that secondhand smoke is harmful to children.
• The vast majority of respondents believe that children are more likely to become smokers if
they are used to seeing adults around them smoke.
• Most respondents think that improved ventilation systems are effective methods to reduce exposure to secondhand smoke in indoor places.
Preferences For Smoke-Free Locations
• Respondents were asked about their smoking preferences for locations in and around their county, regardless of whether smoke-free ordinances already existed. In all locations, the proportions of respondents who said they would use the location more often were far greater than the proportions of respondents who said they would use the location less often. At least half of respondents for each location said that if the locations were smoke-free, it would not make a difference in how often they used the location.
• The greatest resistance to smoke-free locations was attributed to the locations that served
alcohol. Roughly one in 10 respondents said they would use the locations less often if they were smoke-free. However, about one in three respondents said they would actually use those locations more often if they were smoke-free.

Secondhand Smoke Survey for Central and Western Minnesota: February 2005 Survey Results 5
Smoking Policies in the Workplace
• Six in 10 respondents said they work outside the home; one in three of those respondents are exposed to secondhand smoke at their workplace. One-half of the respondents who work outside the home and are exposed to secondhand smoke said the exposure to secondhand smoke bothers them.
• With respect to indoor smoking policies in the workplace, most respondents who work outside
the home said that smoking is not allowed anywhere indoors. One in four respondents said that smoking was allowed indoors at their workplace, either in a designated area, or everywhere.
• Respondents’ preferences for indoor smoking policies at their workplace mirrored the current
policies in that most respondents said they preferred that smoking not be allowed anywhere inside the building. One in 10 preferred designated areas for smoking indoors. Slightly less than one in 10 preferred no restrictions on smoking indoors.
• Regarding outdoor smoking policies in the workplace, half of respondents said there are
outdoor smoking restrictions; one in five said smoking is not allowed on company property, and roughly three in 10 said smoking is limited to certain distances from the building or entrances into the building. Slightly less than half said there are no restrictions on smoking outdoors at their workplace.
• Most respondents preferred restrictions on smoking outdoors at their workplace, either that
smoking not be allowed on company property, or that smoking be limited (i.e., to certain distances from the building or to certain entrances into the building). Roughly one in three preferred no restrictions on smoking outdoors at their workplace.
Community Issues
• A majority of respondents said that over the past two years there had been efforts in their communities to educate people about the harmful effects of secondhand smoke.
• Most respondents said that over the past two years there were more smoke-free workplaces,
more smoke-free restaurants, and more smoke-free entrances into public buildings. Respondents also said there were more smoke-free outdoor school events and more smoke-free outdoor recreation areas. Roughly one in five respondents said they were not aware of any changes in their communities regarding smoke-free areas.
• A majority of respondents said they believe it is the responsibility of the government to enact
ordinances that protect workers and members of the community from secondhand smoke.
• The vast majority of respondents said they believe their counties should continue to explore the most effective ways of dealing with issues regarding secondhand smoke.
Demographics
• Roughly three-fourths of respondents had some education beyond high school. • One in three respondents had children younger than 18 living in their household. • One-third of respondents were younger than 45 years of age; one-fourth were 45 to 54 years
of age.

Secondhand Smoke Survey for Central and Western Minnesota: February 2005 Survey Results 6
• The vast majority of respondents were not using or smoking tobacco: one-third of respondents had previously used or smoked tobacco, but quit, and one-half had never used.
• The largest proportion of tobacco users, roughly one-fourth, were 35 to 44 years of age.
• When receiving information about important issues in their community, region, or state, a
majority of respondents preferred receiving information via the newspaper.
• Six in 10 respondents were female.

Secondhand Smoke Survey for Central and Western Minnesota: February 2005 Survey Results 7
TABLE OF CONTENTS
FORWARD .............................................................................................................................................2
Acknowledgements.............................................................................................................................2
INTRODUCTION ....................................................................................................................................3
Study Objectives .................................................................................................................................3
Methodology........................................................................................................................................3
EXECUTIVE SUMMARY........................................................................................................................4
SURVEY RESULTS ...............................................................................................................................8
General Issues in Respondent’s County ............................................................................................9
Smoking and Secondhand Smoke Issues ........................................................................................10
Preferences For Smoke-Free Locations...........................................................................................12
Smoking Policies in the Workplace...................................................................................................13
Community Issues ............................................................................................................................17
Demographics...................................................................................................................................19
APPENDIX TABLES.............................................................................................................................22
SURVEY INSTRUMENT ......................................................................................................................34

SURVEY RESULTS

Secondhand Smoke Survey for Central and Western Minnesota: February 2005 Survey Results 9
General Issues in Respondent’s County
• Eight in 10 respondents agreed or strongly agreed that the economic health of their community is good (79.4 percent). Roughly one in 10 respondents (13.1 percent) disagreed or strongly disagreed with the statement (Figure 1, Appendix Table 1).
Figure 1. The economic health of my community is good.
7.5
3.7
75.7
11.8
1.3
0 10 20 30 40 50 60 70 80 90 100
Percentage of respondents
Refused/DNK
Strongly agree
Agree
Disagree
Strongly disagree
• Eight in 10 respondents agreed or strongly agreed that they generally support the decisions
being made by county leaders. Roughly one in 10 respondents disagreed or strongly disagreed with the statement (14.4 percent) (Figure 2, Appendix Table 1).
Figure 2. Overall, I generally support the decisions being made by county leaders.
6.2
4.5
75.0
11.9
2.5
0 10 20 30 40 50 60 70 80 90 100
Percentage of respondents
Refused/DNK
Strongly agree
Agree
Disagree
Strongly disagree

Secondhand Smoke Survey for Central and Western Minnesota: February 2005 Survey Results 10
• Six in 10 respondents agreed or strongly agreed that people in their county seem resistant to change (62.6 percent). Three in 10 respondents disagreed or strongly disagreed with the statement (29.1 percent) (Figure 3, Appendix Table 1).
Figure 3. People in my county seem resistant to change.
8.2
12.0
50.6
28.6
0.5
0 10 20 30 40 50 60 70 80 90 100
Percentage of respondents
Refused/DNK
Strongly agree
Agree
Disagree
Strongly disagree
Smoking and Secondhand Smoke Issues
• Four in 10 respondents said that issues regarding smoking and secondhand smoke were not receiving enough attention in their county (38.2 percent). Fewer than two in 10 respondents said smoking and secondhand smoking issues were receiving too much attention (15.2 percent) (Figure 4, Appendix Table 2).
Figure 4. Respondent’s Perception of Attention Given to Issues Regarding Smoking and Secondhand Smoke in Their County
3.2
43.4
38.2
15.2
0 10 20 30 40 50
Percentage of respondents
Refused/DNK
Just the right amount ofattention
Not enough attention
Too much attention

Secondhand Smoke Survey for Central and Western Minnesota: February 2005 Survey Results 11
• Nearly two-thirds of respondents said that people in their county were somewhat informed about issues regarding secondhand smoke (62.8 percent). Approximately 4 percent of respondents said that people in their county were not at all informed about secondhand smoke issues (Figure 5, Appendix Table 3).
Figure 5. How Informed People in Their County Are About Issues Regarding Secondhand Smoke
1.8
32.0
62.8
3.5
0 10 20 30 40 50 60 70 80 90 100
Percentage of respondents
Refused/DNK
Very informed
Somewhat informed
Not at all informed
• Respondents were read a list of statements regarding smoking and secondhand smoke and
then asked if they strongly disagreed, disagreed, agreed, or strongly agreed with each statement (Table 1, Appendix Table 4).
o Nearly two in three respondents (62.3 percent) strongly disagreed or disagreed that
getting rid of smoking in public places discriminates against smokers; 21 percent strongly disagreed.
o An overwhelming majority (93.2 percent) of respondents agreed or strongly agreed that people should be protected from secondhand smoke; 39 percent strongly agreed.
o The vast majority of respondents (88.5 percent) agreed or strongly agreed that restaurant employees should be able to have a smoke-free workplace, and fewer than one in three (28.5 percent) agreed or strongly agreed that getting rid of smoking in restaurants would hurt their business.
o While three in four respondents (72.9 percent) said that bar employees should be able to have a smoke-free workplace, 56 percent agreed or strongly agreed that getting rid of smoking in bars would hurt their business.
o An overwhelming majority of respondents agreed or strongly agreed that secondhand smoke is harmful to adults and children (94.8 percent and 97.7 percent, respectively). While four in 10 respondents (39.9 percent) strongly agreed that secondhand smoke is harmful to adults, more than one in two respondents (54.6 percent) strongly agreed that secondhand smoke is harmful to children.
o The vast majority of respondents (80.7 percent) agreed or strongly agreed that children are more likely to become smokers if they are used to seeing adults around them smoke; 31 percent strongly agreed.
o Six in 10 respondents (60.1 percent) agreed or strongly agreed that improvements to ventilation systems in indoor public places are effective methods to reduce exposure to secondhand smoke. In contrast, three in 10 disagreed with the statement (28.4 percent).

Secondhand Smoke Survey for Central and Western Minnesota: February 2005 Survey Results 12
Table 1. Statements Regarding Smoking and Secondhand Smoke Percentage of respondents
Statements Strongly disagree Disagree Agree
Strongly agree
Refused/ DNK Total
Getting rid of smoking in public places discriminates against smokers. 21.3 41.0 28.8 5.5 3.5 100.1People should be protected from secondhand smoke. 0.7 4.1 54.0 39.2 1.9 99.9Restaurant employees should be able to have a smoke-free workplace. 1.0 8.7 53.6 34.9 1.8 100.0Getting rid of smoking in restaurants will hurt their business. 16.1 51.9 26.3 2.2 3.6 100.1Bar employees should be able to have a smoke-free workplace. 3.4 19.1 50.6 22.3 4.7 100.1Getting rid of smoking in bars will hurt their business. 6.6 33.2 46.1 9.7 4.4 100.0Secondhand smoke is harmful to adults. 0.4 2.7 54.9 39.9 2.1 100.0Secondhand smoke is harmful to children. 0.2 0.7 43.1 54.6 1.5 100.1Children are more likely to become smokers if they are used to seeing adults around them smoke. 1.8 15.0 50.2 30.5 2.5 100.0Improvements to ventilation systems in indoor public places are effective methods to reduce exposure to secondhand smoke. 6.7 28.4 52.8 7.3 4.8 100.0 Preferences For Smoke-Free Locations
• Respondents were asked about their smoking preferences for locations in and around their
county, regardless of whether smoke-free ordinances already existed (Table 2, Appendix Table 5).
• Regarding restaurants that DO NOT serve alcohol:
o Four in 10 respondents said they would actually use the restaurants more often if they were smoke-free (42.6 percent). One in two respondents said if these restaurants were smoke-free it would not make a difference in how often they used them (52.3 percent).
• Regarding restaurants that DO serve alcohol: o Nearly four in 10 respondents (38.0 percent) indicated they would use the restaurants
more often if they were smoke-free. One in two respondents said if these restaurants were smoke-free it would not make a difference in how often they used them (51.6 percent). Fewer than one in 10 respondents (8.2 percent) said they would use the restaurants less often if they were smoke-free.
• Regarding bars or cocktail lounges: o Nearly one in three respondents (29.9 percent) said they would use bars or cocktail
lounges more often if they were smoke-free. More than half of respondents (56.7 percent) said if bars or cocktail lounges were smoke-free it would not make a difference in how often they used them. Fewer than one in 10 said they would use them less often if they were smoke-free (9.3 percent).

Secondhand Smoke Survey for Central and Western Minnesota: February 2005 Survey Results 13
• Regarding places of INDOOR public amusement or recreation: o Nearly equal proportions of respondents said they would use places of indoor public
amusement or recreation more often (48.3 percent) or that it would not make a difference in how often they used them (47.5 percent) if those places were smoke- free.
• Regarding places of OUTDOOR public amusement or recreation: o More than one-fourth of respondents (27.4 percent) said they would use them more
often if those locations were smoke-free. Two-thirds of respondents said if those locations were smoke-free it would not make a difference in how often they used them (67.6 percent).
Table 2. How Smoke-Free Environments Would Affect Respondent’s Visits to Various Locations
Percentage of respondents
Locations Would use less often
Would use more often
Would not make a
difference Refused/
DNK Total If restaurants that DO NOT serve alcohol were smoke-free… 4.0 42.6 52.3 1.1 100.0If restaurants that DO serve alcohol were smoke-free… 8.2 38.0 51.6 2.2 100.0If bars or cocktail lounges were smoke-free… 9.3 29.9 56.7 4.2 100.1If places of INDOOR public amusement or recreation were smoke-free… 3.5 48.3 47.5 0.8 100.1If places of OUTDOOR public amusement or recreation were smoke-free… 4.0 27.4 67.6 1.1 100.1 Smoking Policies in the Workplace
• Six in 10 respondents indicated they work outside the home (59.0 percent) (Figure 6, Appendix Table 6).
Figure 6. Whether Respondent Works Outside the Home
No 41.0
Yes 59.0

Secondhand Smoke Survey for Central and Western Minnesota: February 2005 Survey Results 14
• One in three respondents who work outside the home said they are exposed to secondhand smoke at their workplace (34.3 percent) (Figure 7, Appendix Table 7).
Figure 7. Of Respondents Who Work Outside the Home, Whether Respondent is Exposed to Secondhand Smoke at Their Workplace
No 65.7
Yes 34.3
• Nearly one-half of respondents who work outside the home and are exposed to secondhand smoke said the exposure bothers them (46.9 percent). Roughly one in 10 said they were bothered a great deal (14.7 percent); one-third said they were somewhat bothered by the exposure to secondhand smoke (32.2 percent) (Figure 8, Appendix Table 8).
Figure 8. Of Respondents Who Work Outside the Home and Are Exposed to Secondhand Smoke, How Much Respondent is Bothered By Secondhand Smoke
53.1
32.2
14.7
0
10
20
30
40
50
60
Perc
enta
ge o
f res
pond
ents
Not at all Somewhat A great deal
Amount respondent is bothered

Secondhand Smoke Survey for Central and Western Minnesota: February 2005 Survey Results 15
• Three in four respondents who work outside the home said that smoking is not allowed anywhere indoors at their workplace. One in four respondents (23.8 percent) said that smoking was allowed indoors at their workplace; 13 percent said smoking was allowed in designated areas, and 11 percent said there were no restrictions on smoking indoors at their workplace (Figure 9, Appendix Table 9).
Figure 9. Of Respondents Who Work Outside the Home, INDOOR Smoking Policies at Respondent’s Workplace
0.7
0.710.8
13.074.7
0 10 20 30 40 50 60 70 80 90 100
Percentage of respondents
Refused/DNK
Other
No restrictions on smoking INDOORS
Smoking allowed in designated areas
Smoking not allowed anywhere
Pol
icie
s
• Respondent’s preference for indoor smoking policies at their workplace mirrored the current policies in their workplace. Three in four respondents who work outside the home said they preferred that smoking not be allowed anywhere inside the building. One in 10 preferred designated areas for smoking indoors (10.5 percent). Less than one in 10 preferred no restrictions on smoking indoors (8.6 percent) (Figure 10, Appendix Table 10).
Figure 10. Of Respondents Who Work Outside the Home, Respondent’s Preference for INDOOR Smoking Policies at Workplace
2.7
2.8
8.6
10.5
75.3
0 10 20 30 40 50 60 70 80 90 100
Percentage of respondents
Refused/DNK
Other
No restrictions on smoking INDOORS
Smoking allowed in designated areas
Smoking not allowed anywhere
Pre
fere
nce

Secondhand Smoke Survey for Central and Western Minnesota: February 2005 Survey Results 16
• One-half of respondents who work outside the home (50.7 percent) said there are restrictions to smoking outdoors at their workplace; 22 percent said smoking is not allowed on company property, and 29 percent said smoking is limited to certain distances from the building or entrances into the building. Slightly less than half (46.1 percent) said there are no restrictions on smoking outdoors at their workplace (Figure11, Appendix Table 11).
Figure 11. Of Respondents Who Work Outside the Home, OUTDOOR Smoking Policies at Respondent’s Workplace
2.3
0.8
46.1
28.5
22.2
0 10 20 30 40 50 60 70 80 90 100
Percentage of respondents
Refused/DNK
Other
No restrictions on smoking OUTDOORS
Smoking limited to certain distance/entrance
Smoking not allowed on company property
Pol
icie
s
• Six in 10 respondents who work outside the home (60.4 percent) preferred restrictions on smoking outdoors at their workplace; 31 percent preferred that smoking not be allowed on company property, and 29 percent preferred that smoking be limited to certain distances from the building or to certain entrances into the building. One in three preferred no restrictions on smoking outdoors (34.6 percent) (Figure 12, Appendix Table 12).
Figure 12. Of Respondents Who Work Outside the Home, Respondent’s Preference for OUTDOOR Smoking Policies at Workplace
2.0
2.934.6
29.1
31.3
0 10 20 30 40 50 60 70 80 90 100
Percentage of respondents
Refused/DNK
Other
No restrictions on smoking OUTDOORS
Smoking limited to certain distance/entrance
Smoking not allowed on company property
Pre
fere
nce

Secondhand Smoke Survey for Central and Western Minnesota: February 2005 Survey Results 17
Community Issues
• Two-thirds of respondents (63.5 percent) said that over the past two years there has been an effort in the community to educate people about the harmful effects of secondhand smoke; 19 percent said a great deal of effort, and 45 percent said some effort had been made. Roughly one in 10 respondents (13.9 percent) said there had been no effort in the community to educate people about the harmful effects of secondhand smoke. One in five said they did not know (22.2 percent) (Figure 13, Appendix Table 13).
Figure 13. In the Past Two Years, Amount of Effort in Community to Educate People About the Harmful Effects of Secondhand Smoke
0.4
22.2
18.8
44.7
13.9
0 10 20 30 40 50
Percentage of respondents
Refused
I do not know
A great deal
Some
None at all
Amou
nt o
f effo
rt
• Two-thirds of respondents (66.1 percent) said that over the past two years there are more
smoke-free workplaces. Nearly six in 10 respondents (58.2 percent) said there are more smoke-free restaurants, and more than one in two (53.9 percent) said there are more smoke-free entrances to public buildings. Respondents also said there were more smoke-free outdoor areas; 42 percent said there were more smoke-free outdoor school events, and 21 percent said there were more smoke-free outdoor recreation areas. Roughly one in five respondents (21.1 percent) said they were not aware of any changes in their community over the past two years regarding smoke-free areas (Table 3, Appendix Table 14).
Table 3. In Past Two Years, Changes in the Community Regarding Smoke-Free Areas
Changes in community
Percentage of
respondents*There are more smoke-free workplaces 66.1There are more smoke-free restaurants 58.2There are more smoke-free entrances to public buildings 53.9There are more smoke-free outdoor school events (K-12th grade) 42.3There are more smoke-free outdoor recreation areas, like parks and playgrounds 21.3I’m not aware of any changes 21.1Other 0.6Refused 0.0*Percentages do not equal 100.0 due to multiple responses.

Secondhand Smoke Survey for Central and Western Minnesota: February 2005 Survey Results 18
• Six in 10 respondents (62.2 percent) agreed or strongly agreed that it is the responsibility of the government to enact ordinances that protect workers and members of the community from secondhand smoke; 14 percent strongly agreed. Less than one in 10 respondents (7.8 percent) strongly disagreed with the statement (Figure 14, Appendix Table 15).
Figure 14. It is the responsibility of government to enact ordinances that protect workers and members of the community from secondhand smoke.
3.3
13.9
48.3
26.8
7.8
0 10 20 30 40 50
Percentage of respondents
Refused/DNK
Strongly agree
Agree
Disagree
Strongly disagree
• The vast majority of respondents (84.9 percent) agreed or strongly agreed that their county should continue to explore the most effective ways of dealing with issues regarding secondhand smoke; 22 percent strongly agreed. Roughly one in 10 respondents (13.3 percent) disagreed or strongly disagreed with the statement (Figure 15, Appendix Table 16).
Figure 15. My county should continue to explore the most effective ways of dealing with issues regarding secondhand smoke.
1.9
21.7
63.2
12.6
0.7
0 10 20 30 40 50 60 70 80 90 100
Percentage of respondents
Refused/DNK
Strongly agree
Agree
Disagree
Strongly disagree

Secondhand Smoke Survey for Central and Western Minnesota: February 2005 Survey Results 19
Demographics
• One in four respondents had a high school diploma or passed the test of General Education Development (GED). Nearly three-fourths of respondents (71.2 percent) had some education beyond high school (Table 4, Appendix Table 17).
Table 4. Education of Respondent
Level of education Percentage of respondents
Less than high school 4.0High school graduate or GED 24.9Some vocational/technical school, but no degree 9.5Vocational/technical degree 16.0Some college, but no degree 13.7College degree 23.4Graduate school or professional degree 8.6Refused 0.0TOTAL 100.1
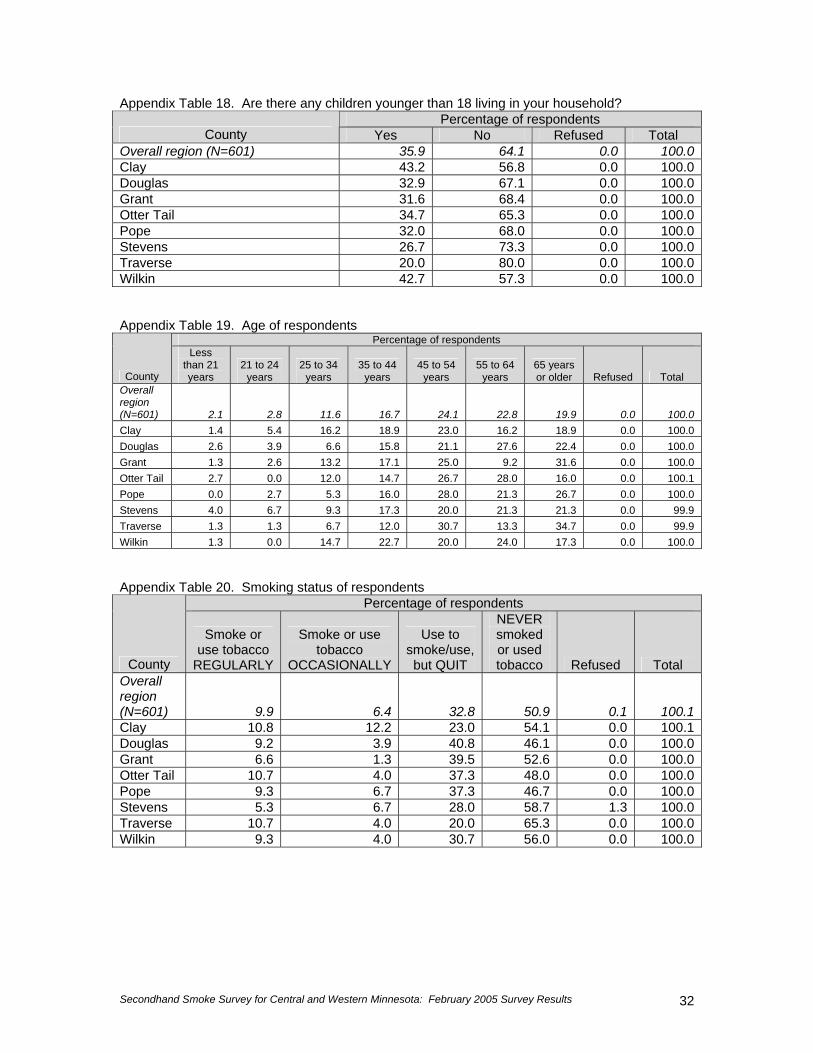
• Approximately one-third of respondents (35.9 percent) said they had children younger than
18 living in their household (Figure 16, Appendix Table 18).
Figure 16. Whether Children Younger Than 18 Live in the Household
No64.1
Yes 35.9

Secondhand Smoke Survey for Central and Western Minnesota: February 2005 Survey Results 20
• The largest proportions of respondents were 45 to 54 years of age (24.1 percent) and 65 or older (22.8 percent). One-third of respondents were younger than 45 years of age (Figure 17, Appendix Table 19).
Figure 17. Age of Respondent
0.019.9
22.8
24.1
16.7
11.6
2.8
2.1
0 10 20 30 40 50
Percentage of respondents
Refused
65 or older
55 to 64
45 to 54
35 to 44
25 to 34
21 to 24
Less than 21
Year
s of
age
• The vast majority of respondents (83.7 percent) were not using or smoking tobacco; one-third
had used or smoked tobacco, but quit (32.8 percent). One in 10 respondents said they smoked or used tobacco regularly (Figure 18, Appendix Table 20).
• The largest proportion of respondents who smoked or used tobacco, either regularly or
occasionally, were 35 to 44 years of age (27.1 percent) (data not shown).
Figure 18. Smoking Status of Respondent
0.1
50.9
32.8
6.4
9.9
0 10 20 30 40 50 60 70 80 90 100
Percentage of respondents
Refused
Have NEVER smoked or used
Used to smoke/use, but QUIT
Smoke or use OCCASIONALLY
Smoke or use REGULARLY

Secondhand Smoke Survey for Central and Western Minnesota: February 2005 Survey Results 21
• When receiving information about important issues in their community, region, or state, seven in 10 respondents (69.9 percent) indicated they preferred receiving information via the newspaper. Two-thirds of respondents (62.6 percent) preferred the television, and roughly half preferred the radio (52.0 percent) (Figure 19, Appendix Table 21).
Figure 19. Methods of Receiving Information Preferred by Respondent
0.2
0.5
2.0
18.8
36.0
52.0
62.6
69.9
0 10 20 30 40 50 60 70 80 90 100
Percentage of respondents*
Refused
Other
Prefer not to receive info
Internet
Newsletter
Radio
Television
Newspaper
*Percentages do not equal 100.0 due to multiple responses.
• Six in 10 respondents were female (60.5 percent) (Figure 20, Appendix Table 22).
Figure 20. Gender of Respondent
Female 60.5
Male 39.5

APPENDIX TABLES

Secondhand Smoke Survey for Central and Western Minnesota: February 2005 Survey Results 23
Appendix Table 1. General issues in respondent’s county Percentage of respondents
Statements by county Strongly disagree Disagree Agree
Strongly agree
Refused/ DNK Total
The economic health of my county is good. Overall region (N=601) 1.3 11.8 75.7 3.7 7.5 100.0 Clay 1.4 8.1 78.4 6.8 5.4 100.1 Douglas 1.3 7.9 78.9 2.6 9.2 99.9 Grant 2.6 21.1 72.4 2.6 1.3 100.0 Otter Tail 0.0 12.0 76.0 1.3 10.7 100.0 Pope 5.3 25.3 68.0 0.0 1.3 99.9 Stevens 2.7 10.7 70.7 9.3 6.7 100.1 Traverse 1.3 22.7 58.7 10.7 6.7 100.1 Wilkin 2.7 16.0 74.7 1.3 5.3 100.0Overall, I generally support the decisions being made by county leaders. Overall region (N=601) 2.5 11.9 75.0 4.5 6.2 100.1 Clay 5.4 9.5 70.3 10.8 4.1 100.1 Douglas 0.0 9.2 78.9 3.9 7.9 99.9 Grant 0.0 10.5 81.6 3.9 3.9 99.9 Otter Tail 2.7 14.7 74.7 0.0 8.0 100.1 Pope 1.3 17.3 77.3 1.3 2.7 99.9 Stevens 0.0 9.3 78.7 6.7 5.3 100.0 Traverse 2.7 18.7 70.7 6.7 1.3 100.1 Wilkin 1.3 9.3 78.7 2.7 8.0 100.0People in my county seem resistant to change. Overall region (N=601) 0.5 28.6 50.6 12.0 8.2 99.9 Clay 0.0 32.4 48.6 13.5 5.4 99.9 Douglas 0.0 32.9 52.6 9.2 5.3 100.0 Grant 1.3 31.6 53.9 5.3 7.9 100.0 Otter Tail 0.0 22.7 53.3 10.7 13.3 100.0 Pope 0.0 17.3 50.7 29.3 2.7 100.0 Stevens 5.3 33.3 42.7 12.0 6.7 100.0 Traverse 1.3 20.0 60.0 10.7 8.0 100.0 Wilkin 1.3 41.3 40.0 8.0 9.3 99.9 Appendix Table 2. In general, do you think issues regarding smoking and secondhand smoke are receiving too much, not enough, or just the right amount of attention?
Percentage of respondents
County Too much attention
Not enough attention
Just the right amount of attention
Refused/ DNK Total
Overall region (N=601) 15.2 38.2 43.4 3.2 100.0Clay 23.0 27.0 48.6 1.4 100.0Douglas 19.7 46.1 27.6 6.6 100.0Grant 9.2 55.3 32.9 2.6 100.0Otter Tail 12.0 33.3 52.0 2.7 100.0Pope 9.3 46.7 44.0 0.0 100.0Stevens 4.0 60.0 29.3 6.7 100.0Traverse 4.0 52.0 44.0 0.0 100.0Wilkin 10.7 45.3 38.7 5.3 100.0

Secondhand Smoke Survey for Central and Western Minnesota: February 2005 Survey Results 24
Appendix Table 3. How informed are people in your county about issues regarding secondhand smoke?
Percentage of respondents
County Not at all informed
Somewhat informed
Very informed
Refused/ DNK Total
Overall region (N=601) 3.5 62.8 32.0 1.8 100.1Clay 4.1 64.9 31.1 0.0 100.1Douglas 2.6 69.7 27.6 0.0 99.9Grant 6.6 68.4 22.4 2.6 100.0Otter Tail 2.7 56.0 37.3 4.0 100.0Pope 8.0 62.7 29.3 0.0 100.0Stevens 2.7 68.0 26.7 2.7 100.1Traverse 4.0 52.0 44.0 0.0 100.0Wilkin 1.3 58.7 36.0 4.0 100.0 Appendix Table 4. Statements regarding smoking and secondhand smoke
Percentage of respondents
Statements by county Strongly disagree Disagree Agree
Strongly agree
Refused/ DNK Total
Getting rid of smoking in public places discriminates against smokers. Overall region (N=601) 21.3 41.0 28.8 5.5 3.5 100.1 Clay 27.0 50.0 16.2 5.4 1.4 100.0 Douglas 19.7 35.5 32.9 7.9 3.9 99.9 Grant 18.4 40.8 35.5 2.6 2.6 99.9 Otter Tail 17.3 36.0 37.3 4.0 5.3 99.9 Pope 25.3 42.7 22.7 8.0 1.3 100.0 Stevens 22.7 41.3 25.3 8.0 2.7 100.0 Traverse 16.0 44.0 34.7 4.0 1.3 100.0 Wilkin 21.3 41.3 28.0 4.0 5.3 99.9People should be protected from secondhand smoke. Overall region (N=601) 0.7 4.1 54.0 39.2 1.9 99.9 Clay 0.0 1.4 45.9 51.4 1.4 100.1 Douglas 1.3 1.3 57.9 36.8 2.6 99.9 Grant 0.0 5.3 64.5 30.3 0.0 100.1 Otter Tail 1.3 8.0 57.3 30.7 2.7 100.0 Pope 1.3 5.3 53.3 38.7 1.3 99.9 Stevens 0.0 2.7 56.0 38.7 2.7 100.1 Traverse 0.0 6.7 49.3 44.0 0.0 100.0 Wilkin 0.0 1.3 56.0 42.7 0.0 100.0Restaurant employees should be able to have a smoke-free workplace. Overall region (N=601) 1.0 8.7 53.6 34.9 1.8 100.0 Clay 1.4 9.5 39.2 50.0 0.0 100.1 Douglas 1.3 10.5 56.6 28.9 2.6 99.9 Grant 0.0 9.2 64.5 26.3 0.0 100.0 Otter Tail 0.0 8.0 60.0 29.3 2.7 100.0 Pope 5.3 8.0 50.7 34.7 1.3 100.0 Stevens 0.0 5.3 60.0 29.3 5.3 99.9 Traverse 0.0 10.7 66.7 22.7 0.0 100.1 Wilkin 1.3 6.7 57.3 33.3 1.3 99.9

Secondhand Smoke Survey for Central and Western Minnesota: February 2005 Survey Results 25
Percentage of respondents
Statements by county Strongly disagree Disagree Agree
Strongly agree
Refused/ DNK Total
Getting rid of smoking in restaurants will hurt their business. Overall region (N=601) 16.1 51.9 26.3 2.2 3.6 100.1 Clay 23.0 58.1 18.9 0.0 0.0 100.0 Douglas 11.8 53.9 26.3 3.9 3.9 99.8 Grant 2.6 65.8 25.0 3.9 2.6 99.9 Otter Tail 14.7 44.0 33.3 1.3 6.7 100.0 Pope 16.0 48.0 28.0 6.7 1.3 100.0 Stevens 10.7 54.7 26.7 4.0 4.0 100.1 Traverse 17.3 56.0 20.0 6.7 0.0 100.0 Wilkin 18.7 53.3 21.3 1.3 5.3 99.9Bar employees should be able to have a smoke-free workplace. Overall region (N=601) 3.4 19.1 50.6 22.3 4.7 100.1 Clay 5.4 20.3 43.2 31.1 0.0 100.0 Douglas 2.6 15.8 57.9 18.4 5.3 100.0 Grant 0.0 23.7 53.9 18.4 3.9 99.9 Otter Tail 2.7 18.7 52.0 17.3 9.3 100.0 Pope 4.0 14.7 44.0 33.3 4.0 100.0 Stevens 4.0 26.7 50.7 16.0 2.7 100.1 Traverse 1.3 28.0 49.3 17.3 4.0 99.9 Wilkin 2.7 16.0 58.7 21.3 1.3 100.0Getting rid of smoking in bars will hurt their business. Overall region (N=601) 6.6 33.2 46.1 9.7 4.4 100.0 Clay 5.4 39.2 43.2 8.1 4.1 100.0 Douglas 10.5 34.2 39.5 7.9 7.9 100.0 Grant 1.3 40.8 51.3 5.3 1.3 100.0 Otter Tail 4.0 26.7 54.7 10.7 4.0 100.1 Pope 10.7 33.3 40.0 16.0 0.0 100.0 Stevens 8.0 32.0 40.0 14.7 5.3 100.0 Traverse 9.3 33.3 45.3 12.0 0.0 99.9 Wilkin 9.3 37.3 41.3 6.7 5.3 99.9Secondhand smoke is harmful to adults. Overall region (N=601) 0.4 2.7 54.9 39.9 2.1 100.0 Clay 1.4 1.4 45.9 50.0 1.4 100.1 Douglas 0.0 0.0 61.8 36.8 1.3 99.9 Grant 0.0 1.3 72.4 26.3 0.0 100.0 Otter Tail 0.0 5.3 57.3 33.3 4.0 99.9 Pope 0.0 2.7 53.3 41.3 2.7 100.0 Stevens 0.0 4.0 53.3 42.7 0.0 100.0 Traverse 0.0 1.3 57.3 41.3 0.0 99.9 Wilkin 0.0 2.7 53.3 42.7 1.3 100.0Secondhand smoke is harmful to children. Overall region (N=601) 0.2 0.7 43.1 54.6 1.5 100.1 Clay 0.0 0.0 28.4 70.3 1.4 100.1 Douglas 0.0 0.0 51.3 47.4 1.3 100.0 Grant 0.0 0.0 51.3 48.7 0.0 100.0

Secondhand Smoke Survey for Central and Western Minnesota: February 2005 Survey Results 26
Percentage of respondents
Statements by county Strongly disagree Disagree Agree
Strongly agree
Refused/ DNK Total
Otter Tail 0.0 1.3 52.0 44.0 2.7 100.0 Pope 1.3 1.3 45.3 52.0 0.0 99.9 Stevens 0.0 2.7 38.7 58.7 0.0 100.1 Traverse 0.0 0.0 42.7 57.3 0.0 100.0 Wilkin 1.3 0.0 33.3 65.3 0.0 99.9Children are more likely to become smokers if they are used to seeing adults around them smoke. Overall region (N=601) 1.8 15.0 50.2 30.5 2.5 100.0 Clay 2.7 14.9 41.9 39.2 1.4 100.1 Douglas 0.0 17.1 50.0 30.3 2.6 100.0 Grant 1.3 13.2 55.3 27.6 2.6 100.0 Otter Tail 1.3 16.0 56.0 22.7 4.0 100.0 Pope 0.0 12.0 52.0 34.7 1.3 100.0 Stevens 8.0 10.7 48.0 33.3 0.0 100.0 Traverse 2.7 6.7 65.3 22.7 2.7 100.1 Wilkin 1.3 16.0 45.3 34.7 2.7 100.0Improvements to ventilation systems in indoor public places are effective methods to reduce exposure to secondhand smoke. Overall region (N=601) 6.7 28.4 52.8 7.3 4.8 100.0 Clay 8.1 35.1 43.2 8.1 5.4 99.9 Douglas 7.9 26.3 53.9 7.9 3.9 99.9 Grant 3.9 28.9 61.8 3.9 1.3 99.8 Otter Tail 5.3 25.3 56.0 6.7 6.7 100.0 Pope 5.3 28.0 60.0 6.7 0.0 100.0 Stevens 5.3 30.7 50.7 6.7 6.7 100.1 Traverse 5.3 26.7 50.7 14.7 2.7 100.1 Wilkin 9.3 20.0 65.3 5.3 0.0 99.9 Appendix Table 5. Preferences for smoke-free locations
Percentage of respondents
Questions by county Less often
More often
Would not make a
difference Refused/
DNK Total If restaurants that DO NOT serve alcohol were smoke-free, would you use them…? Overall region (N=601) 4.0 42.6 52.3 1.1 100.0 Clay 1.4 40.5 56.8 1.4 100.1 Douglas 6.6 46.1 46.1 1.3 100.1 Grant 2.6 46.1 51.3 0.0 100.0 Otter Tail 5.3 38.7 54.7 1.3 100.0 Pope 4.0 45.3 50.7 0.0 100.0 Stevens 5.3 52.0 41.3 1.3 99.9 Traverse 1.3 49.3 48.0 1.3 99.9 Wilkin 1.3 45.3 53.3 0.0 99.9

Secondhand Smoke Survey for Central and Western Minnesota: February 2005 Survey Results 27
Percentage of respondents
Questions by county Less often
More often
Would not make a
difference Refused/
DNK Total If restaurants that DO serve alcohol were smoke-free, would you use them…? Overall region (N=601) 8.2 38.0 51.6 2.2 100.0 Clay 8.1 33.8 56.8 1.4 100.1 Douglas 10.5 44.7 42.1 2.6 99.9 Grant 5.3 39.5 55.3 0.0 100.1 Otter Tail 6.7 36.0 53.3 4.0 100.0 Pope 10.7 44.0 45.3 0.0 100.0 Stevens 8.0 40.0 50.7 1.3 100.0 Traverse 6.7 34.7 58.7 0.0 100.1 Wilkin 9.3 40.0 50.7 0.0 100.0If bars or cocktail lounges were smoke-free, would you use them…? Overall region (N=601) 9.3 29.9 56.7 4.2 100.1 Clay 14.9 28.4 56.8 0.0 100.1 Douglas 10.5 34.2 51.3 3.9 99.9 Grant 7.9 30.3 61.8 0.0 100.0 Otter Tail 4.0 26.7 60.0 9.3 100.0 Pope 14.7 33.3 50.7 1.3 100.0 Stevens 5.3 36.0 54.7 4.0 100.0 Traverse 8.0 33.3 58.7 0.0 100.0 Wilkin 9.3 29.3 58.7 2.7 100.0If places of INDOOR public amusement or recreation were smoke-free, would you use them…? Overall region (N=601) 3.5 48.3 47.5 0.8 100.1 Clay 4.1 47.3 48.6 0.0 100.0 Douglas 3.9 55.3 39.5 1.3 100.0 Grant 6.6 48.7 43.4 1.3 100.0 Otter Tail 2.7 41.3 54.7 1.3 100.0 Pope 4.0 56.0 40.0 0.0 100.0 Stevens 2.7 52.0 44.0 1.3 100.0 Traverse 2.7 57.3 40.0 0.0 100.0 Wilkin 2.7 53.3 44.0 0.0 100.0If places of OUTDOOR public amusement or recreation were smoke-free, would you use them…? Overall region (N=601) 4.0 27.4 67.6 1.1 100.1 Clay 4.1 36.5 59.5 0.0 100.1 Douglas 5.3 22.4 69.7 2.6 100.0 Grant 3.9 18.4 75.0 2.6 99.9 Otter Tail 2.7 20.0 76.0 1.3 100.0 Pope 5.3 37.3 57.3 0.0 99.9 Stevens 6.7 40.0 52.0 1.3 100.0 Traverse 5.3 28.0 66.7 0.0 100.0 Wilkin 2.7 24.0 73.3 0.0 100.0

Secondhand Smoke Survey for Central and Western Minnesota: February 2005 Survey Results 28
Appendix Table 6. Do you work outside the home? Percentage of respondents
County Yes No Refused Total Overall region (N=345) 59.0 41.0 0.0 100.0Clay 68.9 31.1 0.0 100.0Douglas 55.3 44.7 0.0 100.0Grant 52.6 47.4 0.0 100.0Otter Tail 54.7 45.3 0.0 100.0Pope 53.3 46.7 0.0 100.0Stevens 54.7 45.3 0.0 100.0Traverse 54.7 45.3 0.0 100.0Wilkin 65.3 34.7 0.0 100.0 Appendix Table 7. Of respondents who work outside the home, are you exposed to secondhand smoke?
Percentage of respondents County Yes No Refused Total
Overall region (N=345) 34.3 65.7 0.0 100.0Clay 33.3 66.7 0.0 100.0Douglas 35.7 64.3 0.0 100.0Grant 27.5 72.5 0.0 100.0Otter Tail 41.5 58.5 0.0 100.0Pope 20.0 80.0 0.0 100.0Stevens 24.4 75.6 0.0 100.0Traverse 31.7 68.3 0.0 100.0Wilkin 26.5 73.5 0.0 100.0 Appendix Table 8. Of respondents who work outside the home and are exposed to secondhand smoke, how much does exposure to secondhand smoke at your workplace bother you?
Percentage of respondents County Not at all Somewhat A great deal Refused Total
Overall region (N=104) 53.1 32.2 14.7 0.0 100.0Clay* 47.1 47.1 5.9 0.0 100.1Douglas* 53.3 40.0 6.7 0.0 100.0Grant* 36.4 36.4 27.3 0.0 100.1Otter Tail* 58.8 17.6 23.5 0.0 99.9Pope* 75.0 12.5 12.5 0.0 100.0Stevens* 50.0 30.0 20.0 0.0 100.0Traverse* 30.8 23.1 46.2 0.0 100.1Wilkin* 53.8 38.5 7.7 0.0 100.0*Caution should be used when interpreting these data due to small numbers. Appendix Table 9. Of respondents who work outside the home, what are the INDOOR smoking policies at your place of work?
Percentage of respondents
County
Smoking is not allowed anywhere
Smoking is allowed in designated areas only
There are no
restrictions on smoking INDOORS Other
Refused/ DNK Total
Overall region (N=345) 74.7 13.0 10.8 0.7 0.7 99.9Clay 78.4 11.8 9.8 0.0 0.0 100.0Douglas 78.6 9.5 9.5 0.0 2.4 100.0Grant 60.0 15.0 15.0 7.5 2.5 100.0Otter Tail 73.2 14.6 12.2 0.0 0.0 100.0Pope 82.5 2.5 12.5 2.5 0.0 100.0

Secondhand Smoke Survey for Central and Western Minnesota: February 2005 Survey Results 29
Percentage of respondents
County
Smoking is not allowed anywhere
Smoking is allowed in designated areas only
There are no
restrictions on smoking INDOORS Other
Refused/ DNK Total
Stevens 68.3 19.5 7.3 2.4 2.4 99.9Traverse 46.3 29.3 19.5 4.9 0.0 100.0Wilkin 71.4 16.3 8.2 2.0 2.0 99.9 Appendix Table 10. Of respondents who work outside the home, how would you like your employer to handle smoking INDOORS at your workplace?
Percentage of respondents
County
Prefer that smoking is not allowed anywhere inside the building
Prefer smoking be limited to a designated area inside the building
Prefer no INDOOR smoking
restrictions Other Refused/
DNK Total Overall region (N=345) 75.3 10.5 8.6 2.8 2.7 99.9Clay 90.2 2.0 7.8 0.0 0.0 100.0Douglas 66.7 16.7 9.5 2.4 4.8 100.1Grant 70.0 10.0 12.5 5.0 2.5 100.0Otter Tail 70.7 9.8 9.8 4.9 4.9 100.1Pope 70.0 17.5 7.5 5.0 0.0 100.0Stevens 63.4 19.5 4.9 4.9 7.3 100.0Traverse 61.0 22.0 7.3 9.8 0.0 100.1Wilkin 71.4 20.4 8.2 0.0 0.0 100.0 Appendix Table 11. Of respondents who work outside the home, what are the OUTDOOR smoking policies at your place of work?
Percentage of respondents
County
Smoking is not allowed
on company property
Smoking is limited to certain distance
or entrance
There are no restrictions on smoking
OUTDOORS Other Refused/
DNK Total Overall region (N=345) 22.2 28.5 46.1 0.8 2.3 99.9Clay 23.5 29.4 45.1 0.0 2.0 100.0Douglas 16.7 35.7 45.2 0.0 2.4 100.0Grant 12.5 15.0 67.5 2.5 2.5 100.0Otter Tail 22.0 31.7 43.9 0.0 2.4 100.0Pope 32.5 12.5 47.5 7.5 0.0 100.0Stevens 17.1 24.4 46.3 4.9 7.3 100.0Traverse 14.6 12.2 70.7 2.4 0.0 99.9Wilkin 34.7 20.4 42.9 0.0 2.0 100.0

Secondhand Smoke Survey for Central and Western Minnesota: February 2005 Survey Results 30
Appendix Table 12. Of respondents who work outside the home, how would you like your employer to handle smoking OUTDOORS at your workplace?
Percentage of respondents
County
Prefer that smoking is not allowed
on company property
Prefer smoking be
limited to certain
distance or entrance
Prefer no restrictions
for the grounds
around the building Other
Refused/ DNK Total
Overall region (N=345) 31.3 29.1 34.6 2.9 2.0 99.9Clay 37.3 33.3 29.4 0.0 0.0 100.0Douglas 23.8 40.5 26.2 4.8 4.8 100.1Grant 25.0 15.0 55.0 2.5 2.5 100.0Otter Tail 29.3 19.5 43.9 4.9 2.4 100.0Pope 40.0 20.0 35.0 5.0 0.0 100.0Stevens 24.4 41.5 24.4 4.9 4.9 100.1Traverse 29.3 26.8 41.5 2.4 0.0 100.0Wilkin 34.7 28.6 34.7 0.0 2.0 100.0 Appendix Table 13. In the past two years, how much effort has there been in your community to educate people about the harmful effects of secondhand smoke?
Percentage of respondents
County None at all Some
A great deal
I do not know Refused Total
Overall region (N=345) 13.9 44.7 18.8 22.2 0.4 100.0Clay 9.5 43.2 24.3 21.6 1.4 100.0Douglas 13.2 52.6 19.7 14.5 0.0 100.0Grant 14.5 36.8 13.2 35.5 0.0 100.0Otter Tail 17.3 44.0 17.3 21.3 0.0 99.9Pope 26.7 41.3 10.7 21.3 0.0 100.0Stevens 10.7 40.0 12.0 37.3 0.0 100.0Traverse 13.3 45.3 8.0 33.3 0.0 100.0Wilkin 6.7 42.7 22.7 26.7 1.3 100.1 Appendix Table 14. To the best of your knowledge, have any of the following changes occurred in your community in the past two years?
Percentage of respondents*
County
There are more
smoke-free restaurants
There are more
smoke-free workplaces
There are more
smoke-free outdoor
recreation areas
There are more smoke-
free outdoor school events
There are more
smoke-free entrances to public buildings Other
I’m not aware of
any changes Refused
Overall region (N=601) 58.2 66.1 21.3 42.3 53.9 0.6 21.1 0.0 Clay 81.1 81.1 27.0 58.1 66.2 0.0 10.8 0.0 Douglas 47.4 55.3 3.9 14.5 44.7 0.0 34.2 0.0 Grant 32.9 32.9 11.8 26.3 28.9 0.0 46.1 0.0 Otter Tail 53.3 69.3 26.7 44.0 56.0 0.0 16.0 0.0 Pope 45.3 65.3 21.3 46.7 61.3 4.0 29.3 0.0 Stevens 41.3 41.3 34.7 28.0 32.0 4.0 33.3 0.0 Traverse 34.7 44.0 5.3 41.3 30.7 1.3 42.7 0.0 Wilkin 70.7 68.0 18.7 66.7 54.7 1.3 10.7 0.0 *Percentages do not equal 100.0 due to multiple responses.

Secondhand Smoke Survey for Central and Western Minnesota: February 2005 Survey Results 31
Appendix Table 15. It is the responsibility of government to enact ordinances, such as policies and regulations that protect the works and members of the community from exposure to secondhand smoke.
Percentage of respondents
County Strongly disagree Disagree Agree
Strongly agree
Refused/ DNK Total
Overall region (N=601) 7.8 26.8 48.3 13.9 3.3 100.1Clay 4.1 29.7 48.6 14.9 2.7 100.0Douglas 7.9 23.7 55.3 9.2 3.9 100.0Grant 5.3 31.6 48.7 13.2 1.3 100.1Otter Tail 10.7 26.7 44.0 14.7 4.0 100.1Pope 5.3 22.7 50.7 20.0 1.3 100.0Stevens 8.0 22.7 50.7 14.7 4.0 100.1Traverse 9.3 25.3 49.3 12.0 4.0 99.9Wilkin 10.7 30.7 44.0 13.3 1.3 100.0 Appendix Table 16. My county should continue to explore the most effective ways of dealing with issues regarding secondhand smoke.
Percentage of respondents
County Strongly disagree Disagree Agree
Strongly agree
Refused/ DNK Total
Overall region (N=601) 0.7 12.6 63.2 21.7 1.9 100.1Clay 0.0 10.8 59.5 28.4 1.4 100.1Douglas 0.0 7.9 72.4 14.5 5.3 100.1Grant 2.6 5.3 65.8 23.7 2.6 100.0Otter Tail 0.0 18.7 61.3 20.0 0.0 100.0Pope 4.0 10.7 56.0 28.0 1.3 100.0Stevens 2.7 9.3 61.3 24.0 2.7 100.0Traverse 1.3 12.0 72.0 13.3 1.3 99.9Wilkin 2.7 10.7 65.3 17.3 4.0 100.0 Appendix Table 17. Education of respondents
Percentage of respondents
County
Less than high
school
High school
grad/GED
Some voc or tech
Vocational or tech degree
Some college
College degree
Grad or professional
degree Refused Total Overall region (N=601) 4.0 24.9 9.5 16.0 13.7 23.4 8.6 0.0 100.1 Clay 2.7 14.9 9.5 17.6 14.9 29.7 10.8 0.0 100.1 Douglas 6.6 25.0 11.8 18.4 9.2 15.8 13.2 0.0 100.0 Grant 2.6 31.6 7.9 14.5 10.5 30.3 2.6 0.0 100.0 Otter Tail 2.7 32.0 8.0 13.3 14.7 24.0 5.3 0.0 100.0 Pope 4.0 22.7 14.7 22.7 10.7 13.3 12.0 0.0 100.1 Stevens 8.0 21.3 2.7 13.3 20.0 24.0 10.7 0.0 100.0 Traverse 4.0 38.7 8.0 17.3 8.0 18.7 5.3 0.0 100.0 Wilkin 5.3 25.3 13.3 12.0 18.7 24.0 1.3 0.0 99.9
Secondhand Smoke Survey for Central and Western Minnesota: February 2005 Survey Results 32
Appendix Table 18. Are there any children younger than 18 living in your household? Percentage of respondents
County Yes No Refused Total Overall region (N=601) 35.9 64.1 0.0 100.0Clay 43.2 56.8 0.0 100.0Douglas 32.9 67.1 0.0 100.0Grant 31.6 68.4 0.0 100.0Otter Tail 34.7 65.3 0.0 100.0Pope 32.0 68.0 0.0 100.0Stevens 26.7 73.3 0.0 100.0Traverse 20.0 80.0 0.0 100.0Wilkin 42.7 57.3 0.0 100.0 Appendix Table 19. Age of respondents
Percentage of respondents
County
Less than 21 years
21 to 24 years
25 to 34 years
35 to 44 years
45 to 54 years
55 to 64 years
65 years or older Refused Total
Overall region (N=601) 2.1 2.8 11.6 16.7 24.1 22.8 19.9 0.0 100.0 Clay 1.4 5.4 16.2 18.9 23.0 16.2 18.9 0.0 100.0 Douglas 2.6 3.9 6.6 15.8 21.1 27.6 22.4 0.0 100.0 Grant 1.3 2.6 13.2 17.1 25.0 9.2 31.6 0.0 100.0 Otter Tail 2.7 0.0 12.0 14.7 26.7 28.0 16.0 0.0 100.1 Pope 0.0 2.7 5.3 16.0 28.0 21.3 26.7 0.0 100.0 Stevens 4.0 6.7 9.3 17.3 20.0 21.3 21.3 0.0 99.9 Traverse 1.3 1.3 6.7 12.0 30.7 13.3 34.7 0.0 99.9 Wilkin 1.3 0.0 14.7 22.7 20.0 24.0 17.3 0.0 100.0 Appendix Table 20. Smoking status of respondents
Percentage of respondents
County
Smoke or use tobacco
REGULARLY
Smoke or use tobacco
OCCASIONALLY
Use to smoke/use, but QUIT
NEVER smoked or used tobacco Refused Total
Overall region (N=601) 9.9 6.4 32.8 50.9 0.1 100.1Clay 10.8 12.2 23.0 54.1 0.0 100.1Douglas 9.2 3.9 40.8 46.1 0.0 100.0Grant 6.6 1.3 39.5 52.6 0.0 100.0Otter Tail 10.7 4.0 37.3 48.0 0.0 100.0Pope 9.3 6.7 37.3 46.7 0.0 100.0Stevens 5.3 6.7 28.0 58.7 1.3 100.0Traverse 10.7 4.0 20.0 65.3 0.0 100.0Wilkin 9.3 4.0 30.7 56.0 0.0 100.0

Secondhand Smoke Survey for Central and Western Minnesota: February 2005 Survey Results 33
Appendix Table 21. When receiving information about important issues in the community, region, or state, what method or methods of communication do you prefer?
Percentage of respondents*
County Internet Newsletter Radio Television Newspaper Other
Prefer not to
receive Refused Overall region (N=601) 18.8 36.0 52.0 62.6 69.9 0.5 2.0 0.2 Clay 13.5 27.0 62.2 73.0 78.4 0.0 4.1 0.0 Douglas 22.4 36.8 44.7 61.8 67.1 0.0 0.0 0.0 Grant 17.1 23.7 46.1 52.6 53.9 0.0 5.3 0.0 Otter Tail 20.0 41.3 54.7 60.0 69.3 0.0 0.0 0.0 Pope 28.0 44.0 50.7 56.0 68.0 6.7 2.7 0.0 Stevens 25.3 42.7 33.3 49.3 68.0 0.0 4.0 1.3 Traverse 14.7 20.0 41.3 62.7 60.0 0.0 9.3 0.0 Wilkin 12.0 44.0 42.7 57.3 61.3 2.7 1.3 1.3 *Percentages do not equal 100.0 due to multiple responses. Appendix Table 22. Gender of respondents
Percentage of respondents County Male Female Total
Overall region (N=601) 39.5 60.5 100.0Clay 41.9 58.1 100.0Douglas 39.5 60.5 100.0Grant 51.3 48.7 100.0Otter Tail 38.7 61.3 100.0Pope 38.7 61.3 100.0Stevens 40.0 60.0 100.0Traverse 34.7 65.3 100.0Wilkin 30.7 69.3 100.0

SURVEY INSTRUMENT

Secondhand Smoke Survey for Central and Western Minnesota: February 2005 Survey Results 35
Tobacco Survey Minnesota 8-County Region
Hello, my name is ______________ and I'm calling from the Center for Social Research at North Dakota State University on behalf of the health departments in an 8-county region in western Minnesota. We are conducting a research study to find out views about smoking among residents in your area. Do you have a few minutes to answer some questions? 1. Yes 2. No [If possible, try to establish a call-back time] This research study will help us determine residents' views concerning the effects of smoking and secondhand smoke and what policy makers can do to address concerns. The survey is voluntary and will take about 10 minutes. If you have questions about the research study, you may call Dr. Richard Rathge at 701-231-8621. If you have questions about your rights as a participant in this study, you may call the Institutional Review Board at 701-231-8908. To begin, I would like to get your opinion regarding general issues in your county. Please tell me if you strongly disagree, disagree, agree, or strongly agree with the following statements. Q1.
-The economic health of my county is good. -Overall, I generally support the decisions being made by county leaders. -People in my county seem resistant to change.
Do you… 1. Strongly disagree 2. Disagree 3. Agree 4. Strongly agree 5. [Refused/DNK] Now, I would like to focus specifically on smoking and secondhand smoke related issues. Q2. In general, do you think issues regarding smoking and secondhand smoke in your county are receiving too much attention, not enough attention, or just the right amount of attention? 1. Too much attention 2. Not enough attention 3. Just the right amount of attention 4. [Refused/DNK] Q3. How informed are people in your county about issues regarding secondhand smoke? Do you think they are... 1. Not at all informed 2. Somewhat informed 3. Very informed 4. [Refused/DNK] For the next series of questions, please tell me if you strongly disagree, disagree, agree, or strongly agree.

Secondhand Smoke Survey for Central and Western Minnesota: February 2005 Survey Results 36
Q4. -Getting rid of smoking in public places discriminates against smokers. -People should be protected from secondhand smoke. -Restaurant employees should be able to have a smoke-free workplace. -Getting rid of smoking in restaurants will hurt their business. -Bar employees should be able to have a smoke-free workplace. -Getting rid of smoking in bars will hurt their business. -Secondhand smoke is harmful to adults. -Secondhand smoke is harmful to children. -Children are more likely to become smokers if they are used to seeing adults around them smoke. -Improvements to ventilation systems in indoor public places are effective methods to reduce exposure to secondhand smoke.
Do you… 1. Strongly disagree 2. Disagree 3. Agree 4. Strongly agree 5. [Refused/DNK] Next, I would like to know your preferences regarding smoking for locations in and around your county, regardless of whether ordinances already exist. If the locations were smoke-free, please tell me if you would visit or use them less often, more often, or if it would not make a difference. Q5.
-If restaurants that DO NOT serve alcohol were smoke-free, would you use them... -If restaurants that DO serve alcohol were smoke-free, would you use them... -If bars or cocktail lounges were smoke-free, would you use them... -If places of INDOOR public amusement or recreation were smoke-free, would you use them...[bowling alleys, entertainment and sports arenas] -If places of OUTDOOR public amusement or recreation were smoke-free, would you use them...[parks, fairgrounds, sports fields or stadiums]
1. Less often 2. More often 3. Would not make a difference 4. [Refused/DNK] Now I would like to get your opinion about smoking policies in your own workplace. Q6. Do you work outside the home? 1. Yes 2. No 3. [Refused] Q7. Are you exposed to secondhand smoke at your workplace, either indoors or outdoors? 1. Yes 2. No 3. [Refused]

Secondhand Smoke Survey for Central and Western Minnesota: February 2005 Survey Results 37
Q7a. How much does it bother you? 1. Not at all 2. Somewhat 3. A great deal 4. [Refused/DNK] Q8. What are the INDOOR smoking policies at your place of work? 1. Smoking is NOT allowed anywhere. 2. Smoking is allowed in designated areas only. 3. There are no restrictions on smoking. 4. Other 5. [Refused/DNK] Q9. How would you like your employer to handle smoking INDOORS at your workplace? 1. I prefer that smoking would NOT be allowed anywhere inside the building. 2. I prefer that smoking be limited to a designated area inside the building. 3. I would prefer no indoor smoking restrictions. 4. Other 5. [Refused/DNK] Q10. What are the OUTDOOR smoking policies at your place of work? 1. Smoking is NOT allowed on company property. 2. Smoking is limited to a certain distance from the building, or to a certain entrance into the building. 3. There are no restrictions on smoking OUTDOORS. 4. Other 5. [Refused/DNK] Q11. How would you like your employer to handle smoking OUTDOORS at your workplace? 1. I prefer that smoking would NOT be allowed on company property. 2. I prefer that smoking be limited to a certain distance from the building, or to a certain entrance into the building. 3. I would prefer no restrictions for the grounds around the building. 4. Other 5. [Refused/DNK] Next, I would like to get your opinion regarding issues about secondhand smoke. Q12. In the past two years, how much effort has there been in your community to educate people about the harmful effects of secondhand smoke? 1. None at all 2. Some 3. A great deal 4. I do not know 5. [Refused]

Secondhand Smoke Survey for Central and Western Minnesota: February 2005 Survey Results 38
Q13. To the best of your knowledge, have any of the following changes occurred in your community in the past two years? -There are more smoke-free restaurants
-There are more smoke-free workplaces -There are more smoke-free outdoor recreation areas, like parks and playgrounds -There are more smoke-free outdoor school events (K-12th grade) -There are more smoke-free entrances into public buildings -Other -I'm not aware of any changes -[Refused]
For the following statements, please tell me if you strongly disagree, disagree, agree, or strongly agree. Q14. It is the responsibility of the government to enact ordinances, such as policies and regulations, that protect the workers and members of the community from exposure to secondhand smoke. 1. Strongly disagree 2. Disagree 3. Agree 4. Strongly agree 5. [Refused] Q15. My county should continue to explore the most effective ways of dealing with issues regarding secondhand smoke. 1. Strongly disagree 2. Disagree 3. Agree 4. Strongly agree 5. [Refused] Finally, it is important to know some general characteristics about who responded to the survey. Q16. Please tell me which category best describes your age. 1. Less than 21 years of age 2. 21 to 24 years of age 3. 25 to 34 years of age 4. 35 to 44 years of age 5. 45 to 54 years of age 6. 55 to 64 years of age 7. 65 years or older 8. [Refused] Q17. Which category best describes your current level of education? 1. Less than high school 2. High school graduate or GED 3. Some vocational/technical school, but no degree 4. Vocational/technical degree 5. Some college, but no degree

Secondhand Smoke Survey for Central and Western Minnesota: February 2005 Survey Results 39
6. College degree 7. Graduate school or professional degree 8. [Refused] Q18. Are there any children younger than 18 living in your household? 1. Yes 2. No 3. [Refused] Q19. Which of the following statements best describes you? 1. I smoke cigarettes or use other tobacco products on a regular basis. 2. I occasionally smoke cigarettes or use other tobacco products. 3. I used to smoke or use other tobacco products, but I've quit 4. I have never smoked or used other tobacco products 5. [Refused] Q20. When receiving information about important issues in your community, region, or state, what method or methods of communication do you prefer? -Internet -Newsletter -Radio -Television -Newspaper -Other -I prefer not to receive information -[Refused] That concludes our survey. Thank you for taking the time to help us with this important study. Goodnight. Q21 Record gender based on voice. 1. Male 2. Female Q22 Record county code from calling sheet. 1. Clay 2. Douglas 3. Grant 4. Otter Tail 5. Pope 6. Stevens 7. Traverse 8. Wilkin


![Secondhand Smoke Seepage into · the effects of [secondhand smoke].”9 For children, secondhand smoke increases the likelihood that they will develop bronchitis, pneumonia, asthma,](https://static.fdocuments.in/doc/165x107/5f919093df81c360d57fbf43/secondhand-smoke-seepage-the-effects-of-secondhand-smokea9-for-children-secondhand.jpg)


![Secondhand Smoke Seepage into Multi-Unit Affordable Housing · 2016-11-23 · the effects of [secondhand smoke].”9 For children, secondhand smoke increases the likelihood that they](https://static.fdocuments.in/doc/165x107/5f918e723442960b9f248dc0/secondhand-smoke-seepage-into-multi-unit-affordable-housing-2016-11-23-the-effects.jpg)