FOR CEA WEBSITE final mapping report 25-05-10
59
Mapping of 85 pulverized coal fired thermal power generating units in different states (Under Indo-German Energy Program (IGEN)) FOREWORD The Power Plant Component of India German Energy Programme (IGEN) is being implemented in India with the cooperation of Central Electricity Authority (CEA), Ministry of Power, Government of India and GTZ, Germany. The overall aim of this programme is to support and prepare public plant operators for performance reporting as well as implementation of financially attractive and technically viable improvements of power plant net heat rate. Under the IGEN programme, mapping of 85 coal based power generating units, ranging from 100 to 500 MW capacities, were carried out by using a diagnostic tool. This study has been completed during the period 2007-09 covering state owned plants in 14 States, 17 power utilities and 45 thermal power stations. The mapping studies have been done on two conditions namely design parameter as well as on actual operating parameters gathered from different plants for a specific period. The unique feature of this study is that heat rate of the generating unit is not based on the quantification of coal consumed and energy generated but with the thermo dynamic balancing of actual operating parameters. The primary purpose of mapping study is to provide a data base and broadly identify areas requiring attention for improving energy efficiency. The baseline mapping provides an objective method of setting targets and monitoring progress. The reports provide an indication about the necessity and urgency of taking up detailed Residual Life Assessment studies and Renovation & Moderation (R&M) measures in some of the plants. The report, also, indicates measures that could be taken up immediately with comparatively smaller expenditure to improve plant performance before going in for regular R&M measures. The outcome of the study was discussed with the individual State Utilities, who appreciated the recommendations made and findings of the study. Some of the utilities have already implemented majority of the recommendations and others are in process of implementing. For wider dissemination of the findings of the mapping study, the report is being uploaded on CEA website for the benefit of power stations where the mapping study was not carried out. The report highlights the major deviations in operation from design parameters and measures suggested to improve the performance of the plants. The power station personnel may implement the recommendations of the mapping studies to improve the performance of their plants.
Transcript of FOR CEA WEBSITE final mapping report 25-05-10

Mapping of 85 pulverized coal fired thermal power generating units in different states (Under Indo-German Energy Program (IGEN))
FOREWORD
The Power Plant Component of India German Energy Programme (IGEN) is being implemented in India with the cooperation of Central Electricity Authority (CEA), Ministry of Power, Government of India and GTZ, Germany. The overall aim of this programme is to support and prepare public plant operators for performance reporting as well as implementation of financially attractive and technically viable improvements of power plant net heat rate. Under the IGEN programme, mapping of 85 coal based power generating units, ranging from 100 to 500 MW capacities, were carried out by using a diagnostic tool. This study has been completed during the period 2007-09 covering state owned plants in 14 States, 17 power utilities and 45 thermal power stations. The mapping studies have been done on two conditions namely design parameter as well as on actual operating parameters gathered from different plants for a specific period. The unique feature of this study is that heat rate of the generating unit is not based on the quantification of coal consumed and energy generated but with the thermo dynamic balancing of actual operating parameters. The primary purpose of mapping study is to provide a data base and broadly identify areas requiring attention for improving energy efficiency. The baseline mapping provides an objective method of setting targets and monitoring progress. The reports provide an indication about the necessity and urgency of taking up detailed Residual Life Assessment studies and Renovation & Moderation (R&M) measures in some of the plants. The report, also, indicates measures that could be taken up immediately with comparatively smaller expenditure to improve plant performance before going in for regular R&M measures. The outcome of the study was discussed with the individual State Utilities, who appreciated the recommendations made and findings of the study. Some of the utilities have already implemented majority of the recommendations and others are in process of implementing. For wider dissemination of the findings of the mapping study, the report is being uploaded on CEA website for the benefit of power stations where the mapping study was not carried out. The report highlights the major deviations in operation from design parameters and measures suggested to improve the performance of the plants. The power station personnel may implement the recommendations of the mapping studies to improve the performance of their plants.

IGEN-1/BAC/EBSILON THEROMO DYNAMIC SIMULATION MAPPING PERFORMANCE ANALYSIS-SUMMARY REPORT 2 of 59
Mapping of 85 pulverized coal fired thermal power generating
units in different states (Under Indo-German Energy Program (IGEN))
SUMMARY REPORT
IGEN-1/BAC/EBSILON THEROMO DYNAMIC SIMULATION MAPPING PERFORMANCE ANALYSIS-SUMMARY REPORT 3 of 59
TABLE CONTENTS
SECTIONS PAGE 1.0 INTRODUCTION ............................................................................ 5
2.0 MAPPING PROCEDURE ................................................................... 6
3.0 METHODOLOGY ............................................................................ 6
4.0 FINDINGS ..................................................................................... 7
5.0 ANALYSIS OF OBSERVATIONS ........................................................ 7
6.0 SAVINGS POTENTIAL IN COAL CONSUMPTION AND COST .............. 9 7.0 REASONS FOR HIGH OPERATING GROSS HEAT RATES ................... 10 8.0 MODEL ANALYSIS ....................................................................... 15
9.0 RECOMMENDATIONS AS PROPOSED IN THE MAPPING STUDIES ..... 16 10.0 INADEQUACIES IN OPERATION AND MAINTENANCE ..................... 17 11.0 SYSTEM IMPROVEMENTS SUGGESTED .......................................... 19 12.0 CONCLUSION ............................................................................. 21
LIST OF ANNEXURES 1 Description of 85 Final Mapping Reports of Various Generating Units submitted
to CEA 2A Operating Indices for 500 MW units
2B Operating Indices for 250 MW units 2C Operating Indices for 210 MW units
2D Operating Indices for 195-200 MW units
2E Operating Indices for 140 MW units
2F Operating Indices for 120-125 MW units 2G Operating Indices for 100-110 MW units
3A Graph for Operating Gross Heat Rate of 500 MW capacity units (kcal/kWh) 3B Graph for Operating Gross Heat Rate of 250 MW capacity units (kcal/kWh)
3C Graph for Operating Gross Heat Rate of 210 MW capacity units (kcal/kWh)
3D Graph for Operating Gross Heat Rate of 100-125 MW capacity units (kcal/kWh)
3E Graph for Operating Turbine Heat Rate of 500 MW capacity units (kcal/kWh) 3F Graph for Operating Turbine Heat Rate of 250 MW capacity units (kcal/kWh)
3G Graph for Operating Turbine Heat Rate of 210 MW capacity units (kcal/kWh)
3H Graph for Operating Turbine Heat Rate of 100-125 MW capacity units (kcal/kWh)

IGEN-1/BAC/EBSILON THEROMO DYNAMIC SIMULATION MAPPING PERFORMANCE ANALYSIS-SUMMARY REPORT 4 of 59
3I Graph for Operating Boiler Efficiency of 500 MW capacity units (%) 3J Graph for Operating Boiler Efficiency of 250 MW capacity units (%)
3K Graph for Operating Boiler Efficiency of 210 MW capacity units (%)
3L Graph for Operating Boiler Efficiency of 100-125 MW capacity units (%)
3M Graph for Operating Auxiliary Consumption of 500 MW capacity units (%)
3N Graph for Operating Auxiliary Consumption of 250 MW capacity units (%) 3O Graph for Operating Auxiliary Consumption of 210 MW capacity units (%) 3P Graph for Operating Auxiliary Consumption of 100-125 MW capacity units (%)
4A Graph for Performance Monitoring Points
4B Graph for Major Loss Area in the Plants

IGEN-1/BAC/EBSILON THEROMO DYNAMIC SIMULATION MAPPING PERFORMANCE ANALYSIS-SUMMARY REPORT 5 of 59
SUMMARY OF EBSILON MAPPING AND MODEL ANALYSIS OF 85 PULVERIZED COAL FIRED THERMAL POWER GENERATING UNITS IN
DIFFERENT STATES
1.0 INTRODUCTION The Ministry of Power, Government of India, and Deutsche Gesellschaft fur Technische Zusammenarbeil (GTZ) Gmbh signed an ‘implementation agreement’ with respect to the Indo-German Energy Programme (IGEN) in the year 2006. Under the IGEN agreement, power plant component is being implemented by the Central Electricity Authority (CEA), in association with the Bureau of Energy Efficiency (BEE), for performance optimization and efficiency improvements of thermal power plants. The programme aims to support and prepare power plant operators for performance reporting as well as implementation of financially attractive and technically viable improvements of power plant net heat rate under the provisions of the Energy Conservation Act.
The project is being executed under two main sub-components:
(i) Mapping studies of thermal power generating units and, (ii) Performance optimization of thermal power stations.
Under the first phase of the programme, GTZ provided support to Central Electricity Authority (CEA) for creating data base of the older thermal power plants in India. The scope of the work primarily covers the mapping of 85 thermal power generating units using Ebsilon software. The mapping has been done for two conditions, namely for design parameters and for the actual operating status for the plant parameters gathered from different plant locations. The primary purpose is to provide a database within CEA and broadly identify areas needing attention in the short, medium and long term for improving energy efficiency. The baseline mapping provides an objective method of setting targets and monitoring progress. Evonik Energy Services India (EESI) was appointed to carry out the mapping of the 85 power generating units. EESI is a 100% owned subsidiary of Evonik Energy Services GmbH Germany. Evonik, Germany, owns and operates a number of large coal fired power plants with an installed capacity of 11,000 MW in Germany and other countries.

IGEN-1/BAC/EBSILON THEROMO DYNAMIC SIMULATION MAPPING PERFORMANCE ANALYSIS-SUMMARY REPORT 6 of 59
The identified mapping studies of 85 units ranging in capacity from 100 MW to 500 MW each were completed during the period 2007-09 in 14 Indian States viz Andhra Pradesh, Chhattisgarh, Gujarat, Haryana, Jharkhand, Madhya Pradesh, Karnataka, Maharashtra, Orissa, Punjab, Rajasthan, Tamil Nadu, Uttar Pradesh and West Bengal. These units are part of 45 thermal power stations owned by 17 Power Utilities. The numbers of selected units of different capacities are shown in Table 1 while details of owning utility, name of power station and capacity of unit selected for mapping are depicted in Annexure 1.
Table 1 – Capacities of Selected Units
Capacity (MW) Number of Units 100 1105 1110 6120 8125 1140 4195 1200 4210 49250 5500 5Total 85
2.0 MAPPING PROCEDURE Project teams comprising engineers from CEA and Evonik Energy Services were constituted for groups of units to ensure expert contribution in the mapping studies and in analysis. A nodal officer of the owning utility was nominated at each plant to assist and provide data to the project team. The team visited the unit and discusses and physically checked the condition of the unit. The major observations were discussed and incorporated in the model. 3.0 METHODOLOGY Design and current operating data for the units were obtained through questionnaires sent by CEA to concerned utilities. Further required data were collected during site visits by Evonik engineers. A design model was then built on the basis of design data obtained from site using Ebsilon software. Actual

IGEN-1/BAC/EBSILON THEROMO DYNAMIC SIMULATION MAPPING PERFORMANCE ANALYSIS-SUMMARY REPORT 7 of 59
operating parameters were obtained from site and the design model was adjusted to create an operating model based on the current condition of environment and status of the machine. Simulations were then done using the actual coal and the design coal data. 4.0 FINDINGS The mapping studies revealed that most of the units are being operated under various constraints like poor quality of coal, poor spare and activity planning, turbine and other equipments, Poor condenser vacuum, high steam consumption, poor housekeeping, operating parameters different from the rated values and obsolete instrumentation. These have resulted in high heat rates and unreliable plant operations. These observations are analyzed below. 5.0 ANALYSIS OF OBSERVATIONS The gross heat rate values as well as other operating indices for all the 85 generating units have been tabulated for different unit sizes in Annexures 2A to 2G. Analysis of important power plant performance indicators namely gross heat rate, turbine heat rate, boiler efficiency and auxiliary power consumption has been carried out for the same size of units (100-110 MW, 120-125 MW, 140 MW, 195-200 MW, 210 MW, 250 MW and 500 MW). The comparative unit wise position for the above indices is shown in Annexures 3A to 3P. 5.1 Heat Rate Variations The average design and operating values of gross heat rate as also the percentage deviation for each group size is given in Table 2 below:
Table 2 - Gross Heat Rate Deviations
Capacity range of units
No. of
units
Average DesignGross Heat
Rate (kcal/kWh)
Average Operating
Gross Heat Rate (kcal/kWh)
Average deviation (%)
Range of operating GHR
(kcal/kWh)
100-110 MW 8 2413.3 2994.4 24.1 2696 - 3601 120-125 MW 9 2415.4 2894.5 19.8 2690 - 3730 140 MW 4 2381.7 2822.9 18.5 2750 - 2905 195-200 MW 5 2385.7 2873.6 20.5 2393 - 3962 210 MW 49 2408.3 2765.8 14.8 2384 – 3064 250 MW 5 2300.6 2685.6 16.7 2546 – 2773 500 MW 5 2254.6 2561.3 13.6 2508 – 2647
*Heat Rate calculated using the design & operating model

IGEN-1/BAC/EBSILON THEROMO DYNAMIC SIMULATION MAPPING PERFORMANCE ANALYSIS-SUMMARY REPORT 8 of 59
Since the operating heat rates recorded were very high in smaller capacity units compared to higher capacity units, this is because of the development metallurgy and in turbine design. Even the variation found higher in 195-200 MW units and most of the unit except one are very old units and these units require the mega R&M and use the latest technology and up gradation and replace the obsolete technology. The variations in turbine heat rates are depicted in Table 3 below.
Table 3 - Turbine Heat Rate Variations
Capacity range of units
No. of units
Average Design Turbine Heat Rate
(kcal/kWh)*
Average OperatingTurbine Heat Rate
(kcal/kWh)*
Average Deviation
(%)
Range of operating THR
100-110 MW 8 2134.4 2356.3 10.4 2215 - 2881 120-125 MW 9 2081.0 2314.6 11.2 2162 - 2796 140 MW 4 2054.0 2279.4 11.0 2243 - 2325195-200 MW 5 2051.9 2305.8 12.4 2033 - 2893 210 MW 49 2024.3 2166.1 7.0 2045 - 2442 250 MW 5 2001.2 2239.2 11.9 2179 - 2274 500 MW 5 1976.4 2108.3 6.7 2087 - 2179
*Heat Rate calculated using the design & operating model. The tabulation of operating indices for individual units in the above seven capacity ranges in Annexures 2A to 2G indicates that in each category there are a few units which are operating quite close to their design heat rates. For example, in the 210 MW categories, out of the 49 units for which operating data is available, there are 17 units for which operating heat rate is within 7.5% of the design heat rate. For 500 MW capacity, 4 units out of 5 units mapped have their operating turbine heat rate within 7.5% of design. The analysis brings out, also, that deterioration in the turbine heat rate is the major factor for gross heat rate deterioration. For example, the weighted average deterioration of turbine heat rate came as 10% compared to the average gross heat rate deviation of 18 %

IGEN-1/BAC/EBSILON THEROMO DYNAMIC SIMULATION MAPPING PERFORMANCE ANALYSIS-SUMMARY REPORT 9 of 59
5.2 Variations in Boiler Efficiency Table 4 depicts the variations in boiler efficiency observed in units of different sizes.
Table 4 – Boiler Efficiency Variations
Capacity range of units
No. of units
Average Design Boiler Efficiency (%)
Average Operating Boiler Efficiency (%)
Average Deviation
(%)
Range of Operating Boiler Eff.
100-110 MW 8 86.9 80.5 7.4 78.8 - 82.3 120-125 MW 9 86.1 80.1 7.0 75.0 - 82.5 140 MW 4 85.9 80.7 6 80.0 - 81.5 195-200 MW 5 86 80.8 6.1 73.0 - 85.0 210 MW 49 85.8 81.7 4.8 71.0 - 86.0 250 MW 5 87.2 83.4 4.4 82.7 - 85.6 500 MW 5 87.7 82.3 6.1 79.0 - 84.1
*Boiler Efficiency calculated using the design & operating model It is seen that boiler efficiencies are close to design values and variation is mainly due to variation from design parameters and combustion problems. 6.0 SAVINGS POTENTIAL IN COAL CONSUMPTION AND COST Substantial savings in coal consumption and operational costs are possible with better maintenance and improvements in heat rate. The potential savings under two assumptions are shown below: Assumption
Units operate at an average gross heat rate which deviates only by 7.5 % from the average design heat rate.
Table 5 below gives the potential savings in coal consumption and economy in cost if all the units of a particular capacity group operate at an average heat rate which deviates by 7.5% only from the average design heat rate as compared to the situation in which all the units in the group operate at the actual operating heat rate.
Assumptions: Average calorific value of coal - 3626 kcal/kg Price of coal - Rs 1400/ton Average plant load factor (2008-09) - 77.2%

IGEN-1/BAC/EBSILON THEROMO DYNAMIC SIMULATION MAPPING PERFORMANCE ANALYSIS-SUMMARY REPORT 10 of 59
Table 5 – Savings with improvement in heat rate to within 7.5% of the average design heat rate
Unit size No. of
units
Heat rate 7.5% higher than design
Actual operating heat rate
Diff in heat rate
Savings in Coal ''000 tons/yr
Savings in Money Rs crore/yr
MW Nos. kcal/ kWh kcal/ kWh kcal/ kWh Sp coal
saving/unit Saving in
coal
Overall cost
100-110 8 2594.3 2994.4 400.1 0.11 655.05 91.7120-125 9 2596.5 2894.5 298.0 0.082 623.65 87.3140 4 2560.3 2822.9 262.6 0.072 273.56 38.3195-200 5 2564.63 2873.6 309 0.085 856.49 119.9210 49 2588.97 2765.8 176.8. 0.049 3384.62 473.8250 5 2473.1 2685.6 212.5 0.058 494.18 69.2500 5 2423.7 2561.3 137.6 0.038 640.18 89.6
Total 6927.7
969.9
*Heat Rate calculated using the design & operating model Table 5 indicates that with improvement in heat rate of units to within 7.5 per cent of the design heat rate, as is normally accepted after R&M is undertaken for the units, saving of 6.92 million tons per year of coal can be expected for all the 85 units for which Ebsilon mapping studies were undertaken. This saving in coal could enable generation of about 9,600 MU per year if used in 500 MW units.
7.0 REASONS FOR HIGH OPERATING GROSS HEAT RATES It is observed that the heat rate is very high in some units while in others it is only moderately high. Based on observations during site visit and discussions with the site engineers on the operation and maintenance aspects of the power plants, some areas commonly observed to be responsible for high operating gross heat rate are listed below. These observations are not applicable to all the units but are representative of the type of problems encountered. For specific sites, pertaining units , the individual reports may be referred to obtain more details. The simulations have been carried out considering the current condition of unit and its operating environment

IGEN-1/BAC/EBSILON THEROMO DYNAMIC SIMULATION MAPPING PERFORMANCE ANALYSIS-SUMMARY REPORT 11 of 59
Analysis of observations for different power plants indicates that the major reasons for the high operating gross heat rate are:
1 Low combustion efficiency lead to high carbon loss. 2 High force outages due to failure of boiler tubes. 3 Poor performance of milling system. 4 Lack of Maintenance planning and spare planning 5 Low turbine cylinder efficiency 6 High dry gas losses due to high unwanted excess air 7 Poor sealing and heat transfer in air pre-heaters 8 Low condenser vacuum. 9 High air ingress in the boiler and high heat loss due to poor insulation 10 Poor Performance of ESP lead to failure of ID fan and low availability. 11 High cooling water inlet temperature due to poor performance of CT 12 Improper mill maintenance due to non availability of grinding media. 13 Non availability of quantity and quality fuel. 14 High auxiliary power consumption due to high heat rate and outages. 15 Obsolete C&I system needs maximum manual controls lead to error. 16 Poor quality critical valves lead to passing and poor control 17 High Boiler corrosion and erosion lead to high force outage 18 Obsolete electrical relays and control lead to more force outage 19 Obsolete governing and excitation system unable to meet the grid demand variation of load
It must be observed that the significance of the above factors differs amongst different capacity ranges, as also, in between units of the same range. In general, the deviations from optimum are less for 250 MW and 500 MW units. One of the major cause for the unreliability is poor Housekeeping and equipment maintenance planning.
7.1 Un-optimized Boiler Combustion and High Excess air In some of the units, the boiler is being operated without having the feedback based control of combustion air and new measurement of air-fuel ratio. There was a wide variation of fuel air ratio and quantity of secondary air and primary air .The other major attention is the air fuel velocity is not the same for all the coal burners. The unbalanced flame velocity leads poor flame profile in tangential firing system (mostly in operation in India) and change in temperature profile.

IGEN-1/BAC/EBSILON THEROMO DYNAMIC SIMULATION MAPPING PERFORMANCE ANALYSIS-SUMMARY REPORT 12 of 59
7.2 Low Turbine Cylinder Efficiency The efficiency of HP, IP and LP turbine cylinders was mapped. It was observed that most of the turbines have much lower isentropic efficiency than design values .This is due to high seal clearances and salt deposits. This has affected the turbine heat rate. 7.3 Inefficient Soot Blowing of Boiler Tubes Soot blowing is provided to clean the boiler tubes from the fire side deposits resulting from combustion of coal. The ineffective soot blowing leads to lower heat transfer to boiler tubes, wastage of thermal energy lead to higher exit flue gas temperatures which affect boiler efficiency adversely. We are not operating LRSB due to the earlier design defects. The modified LRSB and sonic soot blowers shown excellent results to maintain a clean boiler tube surface in second pass effectively. 7.4 Inefficient Air Pre-Heaters Air pre-heater is important equipment which utilizes waste flue gas heat to pre-heat the cold combustion air. Low temperature inlet hot air to mills affect the coal drying and intern reduce the mill capacity. Worn-out/choked heating elements, Improper seal clearances, damaged sector plates and side sealing plates, air ingress due to damaged expansion bellows improper sealing of inspection holes were observed for the poor air preheater efficiency .This also lead to increase the auxiliary power consumption by more power consumption of ID fan and PA and FD fan due to handling of high qty unutilized leakage air. In case of tubular air heater improper damaged ferruling and leaking tubes were recorded as the major causes 7.5 Low Condenser Vacuum This act as a major factor for heat rate deterioration in india due to variation in air ingress and cooling water quality and quantity. It was observed that in some units, the condenser vacuum was lower by 3 to 5 percent from its design value. The vacuum in turn depends upon cooling water quantity, temperature and air ingress in the condenser. It was notices that heat rate increase due to low condenser vacuum which is 6 to 10 percent of the design value. Most places we do not have HP/LP by pass system working on auto and have capacity of only 30%
IGEN-1/BAC/EBSILON THEROMO DYNAMIC SIMULATION MAPPING PERFORMANCE ANALYSIS-SUMMARY REPORT 13 of 59
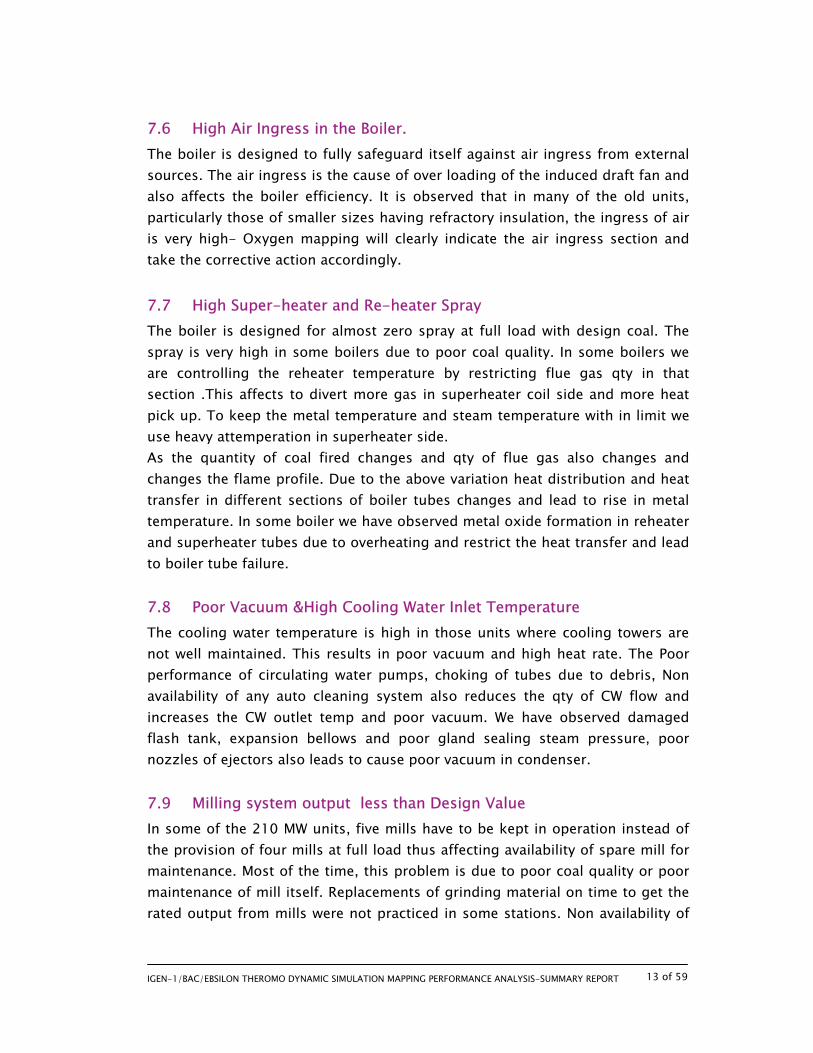
7.6 High Air Ingress in the Boiler. The boiler is designed to fully safeguard itself against air ingress from external sources. The air ingress is the cause of over loading of the induced draft fan and also affects the boiler efficiency. It is observed that in many of the old units, particularly those of smaller sizes having refractory insulation, the ingress of air is very high- Oxygen mapping will clearly indicate the air ingress section and take the corrective action accordingly. 7.7 High Super-heater and Re-heater Spray The boiler is designed for almost zero spray at full load with design coal. The spray is very high in some boilers due to poor coal quality. In some boilers we are controlling the reheater temperature by restricting flue gas qty in that section .This affects to divert more gas in superheater coil side and more heat pick up. To keep the metal temperature and steam temperature with in limit we use heavy attemperation in superheater side. As the quantity of coal fired changes and qty of flue gas also changes and changes the flame profile. Due to the above variation heat distribution and heat transfer in different sections of boiler tubes changes and lead to rise in metal temperature. In some boiler we have observed metal oxide formation in reheater and superheater tubes due to overheating and restrict the heat transfer and lead to boiler tube failure. 7.8 Poor Vacuum &High Cooling Water Inlet Temperature The cooling water temperature is high in those units where cooling towers are not well maintained. This results in poor vacuum and high heat rate. The Poor performance of circulating water pumps, choking of tubes due to debris, Non availability of any auto cleaning system also reduces the qty of CW flow and increases the CW outlet temp and poor vacuum. We have observed damaged flash tank, expansion bellows and poor gland sealing steam pressure, poor nozzles of ejectors also leads to cause poor vacuum in condenser. 7.9 Milling system output less than Design Value In some of the 210 MW units, five mills have to be kept in operation instead of the provision of four mills at full load thus affecting availability of spare mill for maintenance. Most of the time, this problem is due to poor coal quality or poor maintenance of mill itself. Replacements of grinding material on time to get the rated output from mills were not practiced in some stations. Non availability of

IGEN-1/BAC/EBSILON THEROMO DYNAMIC SIMULATION MAPPING PERFORMANCE ANALYSIS-SUMMARY REPORT 14 of 59
reliable gravimetric feeder further reduces the analysis and preventive action on time
7.10 Coal Quality not conforming to Design Coal The boiler is designed to burn specified coal linked to a particular source having defined set of values for gross calorific value, volatile matter, moisture and ash content. It is observed that the quality of coal actually received at power plants was vastly different from that of the design coal. The mismatch in design and actual characteristics of coal is the cause of many of the maintenance and operational problems. Many power plants get coal with much lower gross calorific value which in turn is due to high ash content. The high ash content results in lowering boiler efficiency and erosion of boiler tubes leading to high outages and high wear and tear of milling and coal carrying system. Due to the high size of the coal neither station able to unload the coal nor able to handle the same. If we can bring the coal less than 5 mm, we can reduce the handling and transportation easy. Non availability of the coal is becoming one of the major partial outage of units. 7.11 High Auxiliary Power Consumption The auxiliary power consumption is an important index to determine as how efficiently a plant is operating. The auxiliary consumption has been found to vary in the range of 8 to 15 percent. It is essential to reduce it to acceptable limits. The problems relate to poor turbine efficiency lead to high specific steam consumption and indirectly high specific coal consumption. To meet the high specific fuel demand lead to more milling operation and more air requirement and more ID fan power consumption. Many auxiliaries were found running at over load regimes due to air ingress, passing of valves and similar reasons. The operation controllable parameters can reduce the auxiliary by 0.2 t0 0.3% for the best station 1% for worst case from the high-end and other reduction needs the investment and use latest development in technology. 7.12 High Boiler tube leakage due to internal corrosion During the evaluation of the performance of the units we have observed lot of failure due to internal corrosion. During the deposit analysis one of the major causes of failure was copper deposition and poor water chemistry. Some of the latest units came after 1990 it was observed that copper alloys were not used in the condensate circuit and these types of failure were not reported.. Since the change in rise of copper cost stainless steel low thickness tubes also found

IGEN-1/BAC/EBSILON THEROMO DYNAMIC SIMULATION MAPPING PERFORMANCE ANALYSIS-SUMMARY REPORT 15 of 59
economical and reliable. So in case of the mega R& M it should be considered on case to case basis.
8.0 MODEL ANALYSIS The model analysis has been carried out to determine the degradation of performance of important equipment which can affect the overall plant performance and efficiency. HS (Mollier) diagrams has been plotted to assess the current condition of the turbines. Ebsilon software has been used to simulate and frame models with the design and the operating parameters. The software enables assessment of impact of changes in some parameters over those on other related parameters. The thermodynamic cycle analysis balances in totality and we can access the impact of one system gain on the other system. Such changes include deviations in coal quality; change in environmental parameters, cooling water temperature has been assessed. The base model in each case was developed on the basis of design parameters. Thereafter actual operating parameters were obtained from site and put in the sub-profile of the design model to obtain the performance of the unit under current operational conditions and assess the deviations. Deviations in the following can be determined with the help of the model taking into account the impact of external factors and current condition of the plant after operation of so many running hours. Most units already crossed more than 100,000 running hour’s needs immediate attention to retain the following parameters within the best possible limits. In some cases it was already crossing the limits that require immediate R&M.
• Gross heat rate • Turbine heat rate • Boiler efficiency • Unit efficiency • Efficiency of HP turbine • Efficiency of IP turbine • Efficiency of LP turbine • Regenerative heater performance • Condenser performance • Impact of exit flue gas temperature • Coal quality deterioration

IGEN-1/BAC/EBSILON THEROMO DYNAMIC SIMULATION MAPPING PERFORMANCE ANALYSIS-SUMMARY REPORT 16 of 59
9.0 RECOMMENDATIONS AS PROPOSED IN THE MAPPING STUDIES Recommendations to improve the performance and efficiency of the plant have been made for each of the units covering maintenance and operational aspects. These recommendations take into account the observations of Evonik experts at site, discussions with project engineers and deviations in operating parameters determined by Ebsilon mapping. The recommendations have been divided into three categories namely:
• Short term • Medium term • Long term
The short term recommendations are those which can be implemented immediately at a low cost. These relate to improving vacuum, mill operation, boiler operation, ESP ( better housekeeping, on time deashing to avoid ash carry over and electrical maintenance) etc and all other equipment and systems as are considered important for improvement of plant efficiency. The medium term recommendations pertain to those works which can be taken up during major shut down or during overhauling. These recommendations relate to attending to coal firing system, air dampers, flue gas system, cooling towers etc and other major defects observed by Evonik engineers. The long term recommendations cover renovation and modernization aspects of the plant considering the available poor quality coal for power generation. Retrofitting the latest technology solutions for energy efficiency and increase in capacity, close loop auto controls to operate the plant with less manpower remotely, high quality material boiler tubes to operate continuously at high metal temperature and reduce the weight due to high stress limits, capsule turbines, EHS system, HP heaters, energy efficient cartridges for BFP, zero leak valves, SWAS system, new design condensers with stainless steel tubes and ATRS and 60% HP/LP bypass valves, vacuum pumps and energy efficient variable pitch axial fans, maintenance free metallic rotary gravimetric feeders Advanced grinding material to ensure reliable guaranteed operation. Numerical control relays, new switch gears Advanced DVRs, energy efficient motors VVF drives, VAM system for HVAC system by utilizing the waste heat after APH. Advanced ESP to meet the environmental STDs. These recommendations, however, will need further detailed studies which could be taken up at the stage of Residual Life Assessment, Renovation and Modernization and Life Extension studies.

IGEN-1/BAC/EBSILON THEROMO DYNAMIC SIMULATION MAPPING PERFORMANCE ANALYSIS-SUMMARY REPORT 17 of 59
10.0 INADEQUACIES IN OPERATION AND MAINTENANCE The studies conducted on 85 units of thermal plants and interactions with project staff have indicated a number of inadequacies in operation and maintenance. These inadequacies are caused due to insufficiency of funds available for maintenance, a very poor spare planning and poor housekeeping and lack of predictive maintenance lead high Break down maintenance and non availability of equipments. Non availability of condition based routine maintence lead to high outages. Lack of training and non availability of documents lead to high outage time during the Breakdown jobs. Deficiencies commonly noticed for major plant components are noted below. The O&M team needs to be trained to meet the latest operational need of the station.
10.1 Boiler And Accessories • Maintaining the Air-fuel mixture as per available coal. • Poor pulverized coal fineness and qty to ensure optimum combustion. • High excess air and flue gas qty at ID fan lead to reduce the operating
margin. • Poor ESP and ash collection system to meet the statuvatory requirements. • Poor insulation leaking ducts and expansion joints lead to high radiation
losses and heat losses. • Poor water chemistry and copper deposition on boiler tubes lead to high
boiler tube failures. • Non availability of gravimetric feeders. • Poor performance of burner tilt and secondary dampers, fuel and air
control outstanding to obsolete C&I system. • Poor penthouse sealing and totally filled with hot ash. • Non replacement of grinding media on time lead to high specific power
consumption and wastage of coal • Poor house keeping • Obsolete C&I system with minimum close loop controls • Vent valves needs replacement • No grid measurement of Oxygen and CO at economizer outlet. • Oxide scale formation in superheater and reheater tubes due to high
boiler tube metal temperature • Damaged hangers and supports lead to vibration • Poor condition of critical valves and vent valves lead to high DM
consumption.

IGEN-1/BAC/EBSILON THEROMO DYNAMIC SIMULATION MAPPING PERFORMANCE ANALYSIS-SUMMARY REPORT 18 of 59
10.2 Turbine • Obsolete and inefficient blades needs replacement can able to generate
more power. • High Nozzle losses and Poor inlet parameters of the turbine • High sealing losses lead to due to poor efficiency and output. • Obsolete Governing system and control valves not allow to operate the
unit on frequency modulation mode. • Obsolete Turbo supervisory system and protection needs replacement. • Poor gland sealing and Brg housing and pedestal lead to restriction in
expansion and vibration problems and lub oil leakages • High air ingress into system due to pedestal oval and parting plane
leakages and poor glands. • Gland steam pressure control failure lead to high temperature and
damage of oil guards and moisture ingress into lub oil system. • Poorly maintained ATRS system • Non working and low capacity Hp/Lp by pass valves on auto leads to
more unit trips in emergency. • Frequent failure of condenser tubes and in efficient ejectors, • Poor steam quality lead to high deposition and pressure drop across the
stages. • Poor maintained deaerator lead to high dissolved oxygen • Poor regenerative heaters lead to high DCA and less output. • Poor Turbine insulation • Poorly maintained lub oil quality and high consumption.
10.3 Condenser & cooling tower
• Online cleaning system not installed in many stations • Debris filter not provided • High air ingress and high dissolved oxygen in condensate. • Leakage in expansion bellows and flash tanks • Traveling water screen and back washing system not available • Poor water quality lead to corrosion and pitting on base plates • High copper carry over lead to copper deposition in Boiler • High inlet cooling water temperature due to poor CT
10.4 C&I system • The C&I systems at most of the plants are of older versions which become
obsolete needs replacement by new DCS system

IGEN-1/BAC/EBSILON THEROMO DYNAMIC SIMULATION MAPPING PERFORMANCE ANALYSIS-SUMMARY REPORT 19 of 59
11.0 SYSTEM IMPROVEMENTS SUGGESTED Experience of study and interaction with project personnel at power plants spread all over the country suggest that substantial improvements in their performance are feasible with improvements in management systems. These are indicated below which may be analyzed from case to case.
• Each unit should have a “Performance Monitoring schedule all Major systems in power plant including the auxiliaries (Coal handling plant, ash handling plant, water treatment plants and compressors). Monthly performance tests should be conducted to evaluate boiler efficiency, condenser performance, turbine cylinder efficiency, LP/HP heater performance, turbine heat rate etc. These figures should be checked with the design, last month’s performance, best performance of the unit and best performance of similar other units in the station.
• Milling system maintenance and air preheater maintenance should be given the top priority based on the performance monitoring parameters and ensure timely replacement of worn out parts to ensure reliable output.
• Grid monitoring of Oxygen and CO to ensure a complete combustion and control combustion air to limit the dry gas losses.
• Installation of reliable rotary gravimetric feeders to ensure the coal quantity feed into the mill and indirectly to boiler to get an online assessment of boiler performance.
• Major maintenance of CW system and cooling towers to achieve quality and quantity of water, a clean condenser tubes to achieve better heat transfer and possible vacuum to gain maximum output.
• Up gradation of C&I system to replace the obsolete technology and installation of more close loop controls to avoid manual interference.
• Retrofitting of Electro hydraulic control system with auto starting of turbine system with motorized drains to meet the new grid codes and fast response to variation in demand and auto operation,
• Shift wise monitoring of operating controllable parameters and merit order operation concept to gain efficiency and availability.
• The results of monthly performance monitoring of the station should be discussed in a meeting taken by the Head of the plant and remedial action plan including action on urgent financial issues, should be decided in the meeting.
• Provision of computer software for performance monitoring, maintenance planning and for simulation studies at the plant site may be considered.

IGEN-1/BAC/EBSILON THEROMO DYNAMIC SIMULATION MAPPING PERFORMANCE ANALYSIS-SUMMARY REPORT 20 of 59
Spare planning and inventory management tools to be incorporated to avoid the delay in maintenance duration and non availability of spares.
• Annual overhaul of units and auxiliaries should be done regularly based on the performance deterioration. Assessment to be made before and after to access the techno economical gain as far as possible. Activities to be planned as far as possible on account of system demands.
• Manufacturer’s maintenance manuals for different equipments and operating guide lines should be available in plant office. Senior officers during their inspections should ascertain that the instructions of the manuals are being followed.
• Retrofitting energy efficient hydro drive system for conveyors more than75 KW capacity
• Important work instructions pertaining to particular equipments should be displayed close to the equipment at an appropriate place.
• CFD modeled ducts to reduce the duct pressure losses and implementing VVF drives to reduce the auxiliary power consumption to be incorporated to update the unit performance to meet the latest demands.
• Retrofitting dry rotary compressors with HOC (heat of compressor for regeneration) drier in place of old compressors to maintain better instrument air and service air to meet the modern pneumatic instruments.
• Retrofitting the latest development in purification like RO system etc to make quality DM water from the deteriorated input water available.
• Retrofitting the dry bottom ash system with recirculation to reduce the water consumption and utilization of bottom ash.
• Charging the auxiliary header from CRH at rated load condition to reduce the energy loss of conversion to low pressure steam.
• Utilizing the waste heat to retrofit the VAM ( Vapor absorption machines) refrigeration system in place of HVAC system.
• Energy efficient lighting system to utilize the latest LEDs to reduce the life cycle cost.
• One of the major causes for the poor performance is the poor housekeeping which needs immediate attention and close monitoring by top management. It has already proven that this will reduce the maintenance cost and increase the availability.
• Establishing a separate company at loading point or a centralized location ( coal conditioning company) to condition or blend the coal and supply the proper size coal (1mm to 5mm size) in ensured quality ( without stones and controlled calorific value and ash content) can reduce the losses to minimum and reduce the auxiliary power consumption . They can do the blending and first grinding and separation; This Company can

IGEN-1/BAC/EBSILON THEROMO DYNAMIC SIMULATION MAPPING PERFORMANCE ANALYSIS-SUMMARY REPORT 21 of 59
utilize the low calorific reject coal in the low capacity CFBC/PFBC technology and meet the heat and power requirement for coal conditioning. This will ensure reliability and availability of high capacity most efficient units and reduce the partial and force outage to minimum. Major partial outages were observed due to variation and non availability of coal for bigger capacity high efficiency units. This will reduce the high quality grinding media consumption and outage of high capacity units.
12.0 CONCLUSION The mapping exercise of the 85 power plants has generated a lot of data and information on the performance of power plants. The reports have been sent to respective plant authorities and presentations have been made before the top managements at the respective utility headquarters. The reports provide an indication about the necessity and urgency of taking up detailed RLA / CA studies and R&M measures in some of the plants. The reports, also, indicate measures that could be taken up immediately with comparatively small expenditure to improve plant performance before going in for regular R&M measures.
The improvement in heat rate of units to within 7.5 per cent of the design heat rate, as is normally accepted after R&M is undertaken for the units, results in expected saving of about 6.93 million tons of coal per year for all the 85 units for which Ebsilon mapping studies were undertaken. This saving in coal could enable generation of about 9,600 MU per year if used in 500 MW units. It has been observed, also, that in addition to the plant problems explained above, there is need to give attention to improved maintenance practices, manpower planning, training of engineers, installation of, preferably, on-line monitoring system and updating of auto controls and instrumentation. The use of computers for maintaining plant history records should be more extensive. It is necessary to carry out total audit of plant functions covering management issues, delegation of powers and inventory management which are equally important to improve the plant performance. The institutional arrangements require the establishment of an energy efficiency cell at each power plant location. The concept of Model Power Plant has been suggested by CEA to sustain the benefits of the mapping exercise.

IGEN-1/BAC/EBSILON THEROMO DYNAMIC SIMULATION MAPPING PERFORMANCE ANALYSIS-SUMMARY REPORT 22 of 59
ANNEXURE-1
Report No
State Board/ Electricity Gen. Company Power Station Unit
size
1 PSEB Guru Nanak Dev Thermal Power Station, Bathinda 110
2 MAHAGENCO Khapar Kheda Thermal Power Station 210 3 WBPDCL Kolaghat Thermal Power Station 210 4 TNEB Mettur Thermal Power Station 2105 MAHAGENCO Nasik Thermal Power Station 210 6 HPGCL Panipat Thermal Power Station 210 7 OPGLC IB Valley Thermal Power Station 210
8 PSEB Guru Hargobind Singh Thermal Power Station, Lehra Mohabbat 210
9 NLCL Neyveli Lignite Corporation 210 10 NLCL Neyveli Lignite Corporation 21011 MPPGCL Satpura Thermal Power Station 210 12 RRVUNL Suratgarh Thermal Power Station 250 13 TNEB Tuticorn Thermal Power Station 210 14 MAHAGENCO Chandrapur Thermal Power Station 500 15 MAHAGENCO Chandrapur Thermal Power Station 210 16 MAHAGENCO Koradi Thermal Power Station 200 17 WBPDCL Bandel Thermal Power Station 210 18 MAHAGENCO Bhusawal Thermal Power Station 210 19 Chhattisgarh SEB Korba Thermal Power Station 210
20 PSEB Guru Gobind Singh Thermal Power Station, Ropar 210
21 GSECL Ukai Thermal Power Station 210 22 TNEB North Chennai Thermal Power Station 210 23 GSECL Ukai Thermal Power Station 200 24 GSECL Ukai Thermal Power Station 210 25 DVC Bokaro Thermal Power Station 210 26 GSCEL Wanakbori Thermal Power Station 210 27 GSCEL Wanakbori Thermal Power Station 210 28 DVC Durgapur Thermal Power Station 210 29 DVC Mejia Thermal Power Station 210 30 APGENCO Vijayawada Thermal Power Station 21031 APGENCO Kothagudem Thermal Power Station 250 32 Chhattisgarh SEB Korba East Thermal Power Station 120 33 UPRVUNL Anpara Thermal Power Station 21034 UPRVUNL Anpara Thermal Power Station 500 35 UPRVUNL Obra Thermal Power Station 200

IGEN-1/BAC/EBSILON THEROMO DYNAMIC SIMULATION MAPPING PERFORMANCE ANALYSIS-SUMMARY REPORT 23 of 59
Report No
State Board/ Electricity Gen. Company Power Station Unit
size 36 APGENCO Vijayawada Thermal Power Station 210 37 APGENCO Kothagudem Thermal Power Station 250 38 APGENCO Rayalseema Thermal Power Station 210 39 WBPDCL Bakreswar Thermal Power Station 210 40 MAHAGENCO Parli Thermal Power Station 210 41 KPCL Raichur Thermal Power Station 210 42 KPCL Raichur Thermal Power Station 210 43 HPGCL Panipat Thermal Power Station 11044 APGENCO Kothagudem Thermal Power Station 120 45 UPRVUNL Obra Thermal Power Station 110 46 UPRVUNL Pariccha Thermal Power Station 21047 UPRVUNL Pariccha Thermal Power Station 110 48 GSECL Dhuvaran Thermal Power Station 140 49 GSECL Gandhinagar Thermal Power Station 120 50 GSECL Wanakbori Thermal Power Station 210 51 TVNL Tenughat Thermal Power Station 210 52 GSECL Ukai Thermal Power Station 120 53 HPGCL Panipat Thermal Power Station 250 54 GIPCL Surat Lignite 125 55 GSECL Sikka Thermal Power Station 120 56 DVC Chandarapura Thermal Power Station 140
57 MPPGCL Birsinghpur (Sanjay Gandhi) Thermal Power Station T.P.S. 210
58 MPPGCL Amarkantak Thermal Power Station 120 59 WBPDCL Santaldih Thermal Power Station 120 60 DVC Durgapur Thermal Power Station 140 61 APGENCO Kothagudem Thermal Power Station 120 62 APGENCO Rayalseema Thermal Power Station 210 63 OPGCL IB Valley Thermal Power Station 210 64 UPRVUNL Obra Thermal Power Station 200 65 UPRVUNL Panki Thermal Power Station 105 66 RRVUNL Kota Thermal Power Station 11067 RRVUNL Kota Thermal Power Station 210 68 UPRVUNL Paricha Thermal Power Station 210 69 TNEB North Chennai Thermal Power Station 210 70 TNEB Mettur Thermal Power Station 210 71 TNEB Ennore Thermal Power Station 110 72 MAHAGENCO Chandrapur Thermal Power Station 500 73 MAHAGENCO Koradi Thermal Power Station 210 74 PSEB Guru Nanak Dev Thermal Power Station, 110

IGEN-1/BAC/EBSILON THEROMO DYNAMIC SIMULATION MAPPING PERFORMANCE ANALYSIS-SUMMARY REPORT 24 of 59
Report No
State Board/ Electricity Gen. Company Power Station Unit
size Bathinda
75 APGENCO Vijayawada Thermal Power Station 210 76 Chhattisgarh SEB Korba Thermal Power Station 210
77 PSEB Guru Gobind Singh Thermal Power Station, Ropar 210
78 PSEB Guru Gobind Singh Thermal Power Station. Ropar 210
79 MAHAGENCO Khapar Kheda Thermal Power Station 21080 MAHAGENCO Nashik Thermal Power Station 140 81 MAHAGENCO Nashik Thermal Power Station 210 82 RRUVNL Kota Thermal Power Station 195 83 UPRVUNL Anpara Thermal Power Station 500 84 RRVUNL Suratgarh Thermal Power Station 250 85 MAHAGENCO Chandrapur Thermal Power Station 500
Note: Observations/analysis presented in the table are based on the operating parameters as observed at the time of Mapping Studies

BAC/IGEN//EBSILON MAPPING SUMMARY REPORT 25 of 59
Operating indices for 500 MW units ANNEXURE-2A
SL. NO.
Year of Commiss-
ioning
Age till
2008 Mode Load
(MW) Gross
Heat Rate (kcal/kWh)
Turbine Heat Rate (kcal/kWh)
Boiler Efficiency
(%)
Main Steam Condenser Vacuum (mmHg)
Auxiliary Power Cons.
(%) Flow (t/h)
Tempera-ture (°C)
Pressure (kg/cm2)
1 1991 17 Design 500 2238.0 1972.0 88.10 1,524.0 537.0 170.0 670.8
8.69 Operating 481 2508.0 2093.0 83.50 1,455.0 538.0 165.0 650.0Dev (%) -3.8% 12.1% 6.1% -5.2% -4.5% 0.2% -2.9% -3.1%
2 1992 16
Design 500 2238.0 1972.0 88.10 1,524.0 538.0 174.0 675.0
7.71 Operating 370 2646.7 2090.9 79.00 1,137.0 539.0 143.0 651.0
Dev (%) -
26.0% 18.3% 6.0% -10.3% -25.4% 0.2% -17.8% -3.6%
3 1997 11 Design 500 2238.0 1972.0 88.10 1,524.0 537.0 170.0 670.8
7.81 Operating 457 2563.0 2087.0 81.40 1,207.0 537.0 170.0 636.1Dev (%) -8.6% 14.5% 5.8% -7.6% -20.8% 0.0% 0.0% -5.2%
4 1994 14
Design 500 2281.0 1984.3 87.00 1,507.8 538.0 169.0 760.0
7.51 Operating 425 2590.0 2178.6 84.12 1,315.0 540.0 168.0 715.0
Dev (%) -
15.0% 13.5% 9.8% -3.3% -12.8% 0.4% -0.6% -5.9%
5 1994 14 Design 500.21 2277.9 1981.8 87.00 1,509.0 538.0 173.3 690.0
7.50 Operating 498.51 2523.4 2095.7 83.05 1,550.0 542.0 171.3 670.0Dev (%) -0.3% 10.8% 5.8% -4.5% 2.7% 0.7% -1.2% -2.9%
Total
Average Design Values 500.0 2254.6 1976.4 87.66 1,517.8 537.6 171.3 693.3
7.84 Average Operating Values 446.3 2566.2 2109.1 82.21 1,332.8 539.2 163.5 664.4Average Deviations (%)
-10.7% 13.8% 6.7% -6.2% -12.2% 0.3% -4.5% -4.1%
Minimum of Operating Values 370 2508.0 2087.0 79.00 1,137.0 537.0 143.0 636.1 7.50 Maximum of Operating Values 498.5 2646.7 2178.6 84.12 1,550.0 542.0 171.3 715.0 8.69
Note: Observations/analysis presented in the table are based on the parameters at the time of Mapping Studies and simulated by model
BAC/IGEN//EBSILON MAPPING SUMMARY REPORT 26 of 59
Operating indices for 250 MW units ANNEXURE-2B
SL. NO.
Year of Commiss-
ioning
Age till
2008 Mode
Load (MW)
Gross Heat Rate (kcal/kWh)
Turbine Heat Rate (kcal/kWh)
Boiler Efficiency
(%)
Main Steam Condenser
Vacuum (mmHg)
Auxiliary Power Cons.
(%)
Flow (tph)
Tempera-ture (°C)
Pressure (kg/cm2)
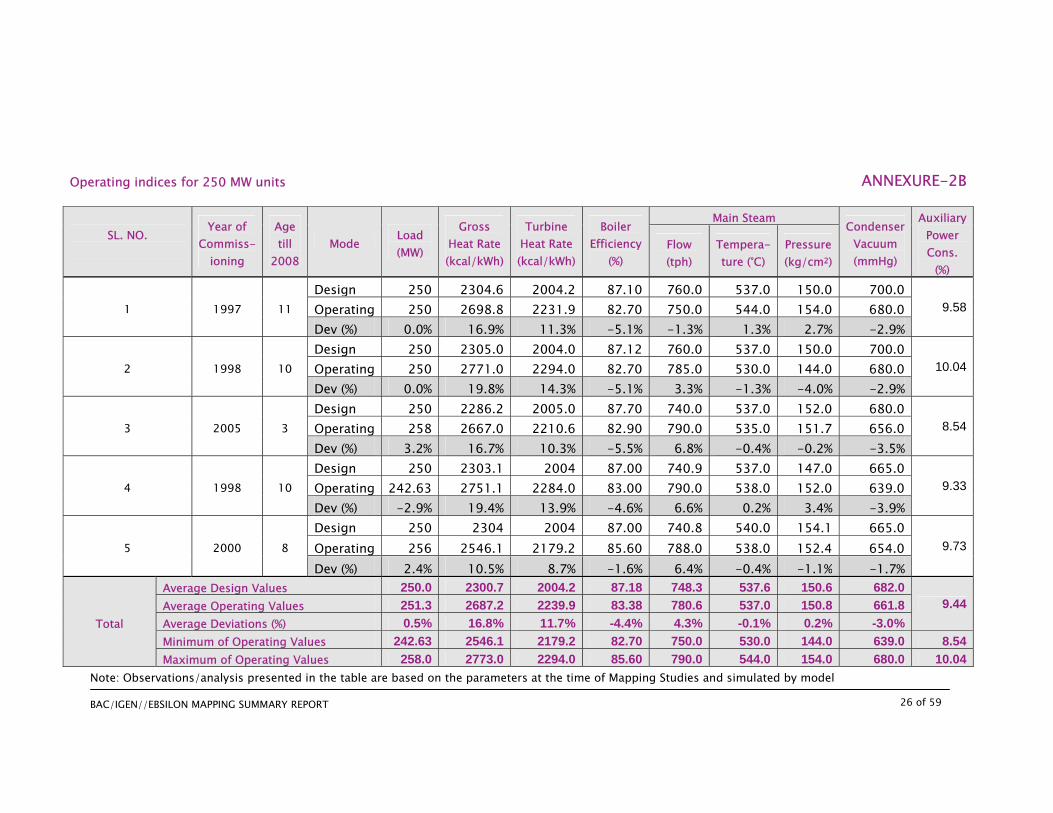
1 1997 11 Design 250 2304.6 2004.2 87.10 760.0 537.0 150.0 700.0
9.58Operating 250 2698.8 2231.9 82.70 750.0 544.0 154.0 680.0Dev (%) 0.0% 16.9% 11.3% -5.1% -1.3% 1.3% 2.7% -2.9%
2 1998 10 Design 250 2305.0 2004.0 87.12 760.0 537.0 150.0 700.0
10.04Operating 250 2771.0 2294.0 82.70 785.0 530.0 144.0 680.0Dev (%) 0.0% 19.8% 14.3% -5.1% 3.3% -1.3% -4.0% -2.9%
3 2005 3 Design 250 2286.2 2005.0 87.70 740.0 537.0 152.0 680.0
8.54Operating 258 2667.0 2210.6 82.90 790.0 535.0 151.7 656.0Dev (%) 3.2% 16.7% 10.3% -5.5% 6.8% -0.4% -0.2% -3.5%
4 1998 10 Design 250 2303.1 2004 87.00 740.9 537.0 147.0 665.0
9.33Operating 242.63 2751.1 2284.0 83.00 790.0 538.0 152.0 639.0Dev (%) -2.9% 19.4% 13.9% -4.6% 6.6% 0.2% 3.4% -3.9%
5 2000 8 Design 250 2304 2004 87.00 740.8 540.0 154.1 665.0
9.73Operating 256 2546.1 2179.2 85.60 788.0 538.0 152.4 654.0Dev (%) 2.4% 10.5% 8.7% -1.6% 6.4% -0.4% -1.1% -1.7%
Total
Average Design Values 250.0 2300.7 2004.2 87.18 748.3 537.6 150.6 682.09.44Average Operating Values 251.3 2687.2 2239.9 83.38 780.6 537.0 150.8 661.8
Average Deviations (%) 0.5% 16.8% 11.7% -4.4% 4.3% -0.1% 0.2% -3.0%Minimum of Operating Values 242.63 2546.1 2179.2 82.70 750.0 530.0 144.0 639.0 8.54Maximum of Operating Values 258.0 2773.0 2294.0 85.60 790.0 544.0 154.0 680.0 10.04
Note: Observations/analysis presented in the table are based on the parameters at the time of Mapping Studies and simulated by model

BAC/IGEN//EBSILON MAPPING SUMMARY REPORT 27 of 59
Operating indices for 210 MW units ANNEXURE-2C
SL. NO.
Year of Commiss-
ioning
Age till
2008Mode
Load (MW)
Gross Heat Rate (kcal/kWh)
Turbine Heat Rate (kcal/kWh)
Boiler Efficiency
(%)
Main Steam Condenser Vacuum (mmHg)
Auxiliary Power
Cons. (%) Flow (t/h)
Tempera-ture (°C)
Pressure (kg/cm2)
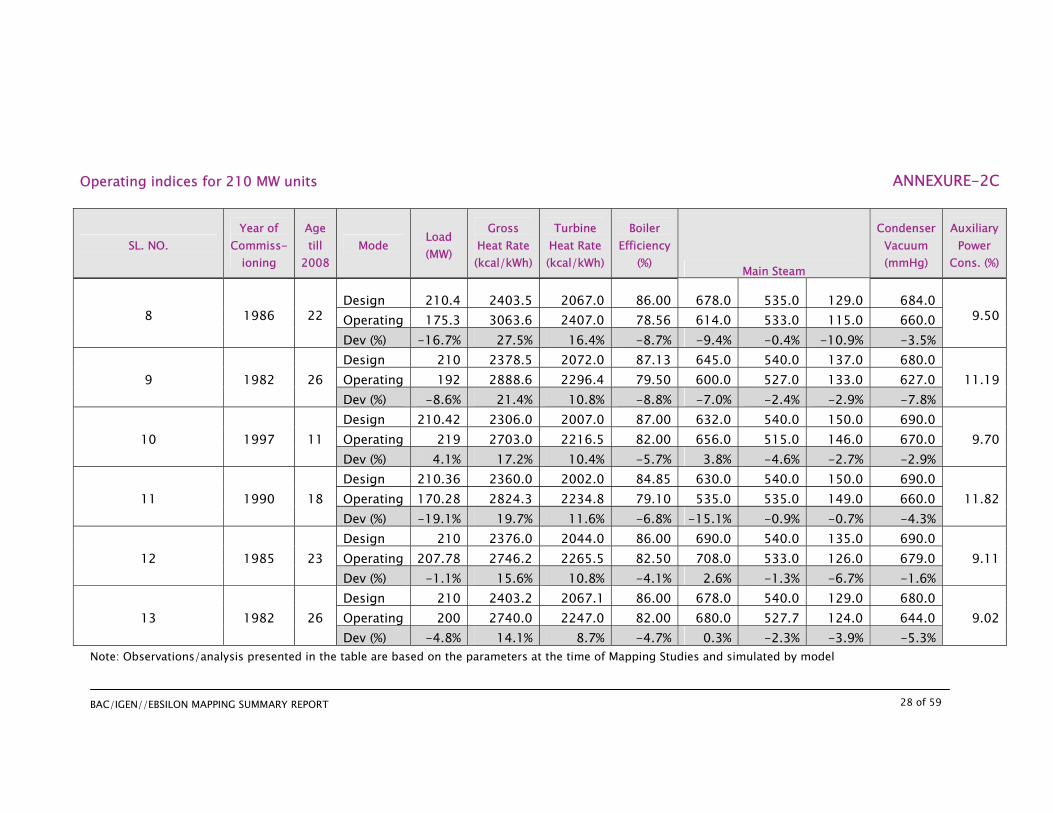
1 1994 14 Design 210 2270.8 2007.4 88.40 640.0 540.0 147.0 672.0
9.75 Operating 210.38 2480.6 2110.0 85.00 668.0 538.0 150.0 660.0Dev (%) 0.2% 9.2% 5.1% -3.8% 4.4% -0.4% 2.0% -1.8%
2 2007 1 Design 210.2 2270.8 2007.4 88.40 646.0 537.0 147.0 690.0
11.29 Operating 179.44 2383.7 2050.0 86.00 556.0 537.0 147.0 684.0Dev (%) -14.6% 5,6% 2.1% -2.7% -13.9% 0.0% 0.0% -0.9%
3 1979 29 Design 210 2397.0 2062.0 86.00 673.0 540.0 130.0 710.0
8.92 Operating 210.3 2642.9 2186.6 82.80 726.0 535.0 130.0 680.0Dev (%) 0.1% 10.3% 6.0% -3.7% 7.9% -0.9% 0.0% -4.2%
4 1994 14 Design 210.4 2331.8 2007.8 86.10 630.0 539.0 150.0 710.0
8.51 Operating 210 2490.1 2110.5 84.75 635.0 540.0 149.0 695.0Dev (%) -0.2% 6.8% 5.1% -1.6% 0.8% 0.2% -0.7% -2.1%
5 1995 13 Design 210 2332.0 2007.0 86.10 630.0 540.0 150.0 693.0
9.70 Operating 214 2445.0 2093.5 85.60 666.0 540.0 149.5 695.0Dev (%) 1.9% 4.8% 4.3% -0.6% 5.7% 0.0% -0.3% 0.3%
6 1984 24 Design 210 2333.7 2007.0 86.00 625.0 535.0 147.0 684.0
9.87 Operating 207 2602.1 2178.5 83.70 620.0 536.0 133.0 631.0Dev (%) -1.4% 11.5% 8.5% -2.7% -0.8% 0.2% -9.5% -7.7%
7 1986 22 Design 210 2333.7 2007.0 86.10 630.0 540.0 150.0 680.0
10.05 Operating 160.4 2859.6 2209.2 77.25 505.0 535.0 134.6 660.0Dev (%) -23.6% 22.5% 10.1% -10.3% -19.8% -0.9% -10.3% -2.9%
Note: Observations/analysis presented in the table are based on the parameters at the time of Mapping Studies and simulated by model
BAC/IGEN//EBSILON MAPPING SUMMARY REPORT 28 of 59
Operating indices for 210 MW units ANNEXURE-2C
SL. NO. Year of
Commiss-ioning
Age till
2008Mode
Load (MW)
Gross Heat Rate (kcal/kWh)
Turbine Heat Rate (kcal/kWh)
Boiler Efficiency
(%) Main Steam
Condenser Vacuum (mmHg)
Auxiliary Power
Cons. (%)
8 1986 22 Design 210.4 2403.5 2067.0 86.00 678.0 535.0 129.0 684.0
9.50 Operating 175.3 3063.6 2407.0 78.56 614.0 533.0 115.0 660.0Dev (%) -16.7% 27.5% 16.4% -8.7% -9.4% -0.4% -10.9% -3.5%
9 1982 26 Design 210 2378.5 2072.0 87.13 645.0 540.0 137.0 680.0
11.19 Operating 192 2888.6 2296.4 79.50 600.0 527.0 133.0 627.0Dev (%) -8.6% 21.4% 10.8% -8.8% -7.0% -2.4% -2.9% -7.8%
10 1997 11 Design 210.42 2306.0 2007.0 87.00 632.0 540.0 150.0 690.0
9.70 Operating 219 2703.0 2216.5 82.00 656.0 515.0 146.0 670.0Dev (%) 4.1% 17.2% 10.4% -5.7% 3.8% -4.6% -2.7% -2.9%
11 1990 18 Design 210.36 2360.0 2002.0 84.85 630.0 540.0 150.0 690.0
11.82 Operating 170.28 2824.3 2234.8 79.10 535.0 535.0 149.0 660.0Dev (%) -19.1% 19.7% 11.6% -6.8% -15.1% -0.9% -0.7% -4.3%
12 1985 23 Design 210 2376.0 2044.0 86.00 690.0 540.0 135.0 690.0
9.11 Operating 207.78 2746.2 2265.5 82.50 708.0 533.0 126.0 679.0Dev (%) -1.1% 15.6% 10.8% -4.1% 2.6% -1.3% -6.7% -1.6%
13 1982 26 Design 210 2403.2 2067.1 86.00 678.0 540.0 129.0 680.0
9.02 Operating 200 2740.0 2247.0 82.00 680.0 527.7 124.0 644.0Dev (%) -4.8% 14.1% 8.7% -4.7% 0.3% -2.3% -3.9% -5.3%
Note: Observations/analysis presented in the table are based on the parameters at the time of Mapping Studies and simulated by model

BAC/IGEN//EBSILON MAPPING SUMMARY REPORT 29 of 59
ANNEXURE-2C
SL. NO.
Year of Commiss-
ioning
Age till
2008 Mode
Load (MW)
Gross Heat Rate (kcal/kWh)
Turbine Heat Rate (kcal/kWh)
Boiler Efficiency
(%) Main Steam
Condenser Vacuum (mmHg)
Auxiliary Power
Cons. (%)
14 1984 24 Design 210 2403.2 2067 86.00 680.0 540.0 129.0 680.0
8.90Operating 190 2877.0 2359.0 82.00 651.0 535.0 123.0 635.0Dev (%) -9.5% 19.7% 14.1% -4.7% -4.3% -0.9% -4.7% -6.6%
15 1986 22 Design 210 2333.7 2007.0 86.10 635.0 535.0 147.0 680.0
9.32Operating 195.86 2839.1 2336.7 82.30 605.0 535.0 151.0 640.0Dev (%) -6.7% 21.7% 16.4% -4.4% -4.7% 0.0% 2.7% -5.9%
16 1989 19 Design 210 2318.5 1994.2 86.00 635.0 540.0 150.0 684.0
8.89Operating 210 2716.3 2142.0 79.00 670.0 538.0 140.0 655.0Dev (%) 0.0% 17.2% 7.4% -8.1% 5.5% -0.4% -6.7% -4.2%
17 1991 19 Design 210.5 2307.0 2007.0 87.00 635.0 540.0 147.0 684.0
8.10Operating 215.26 2545.4 2138.0 84.00 665.0 540.3 144.9 679.0Dev (%) 2.3% 10.3% 6.5% -3.4% 4.7% 0.1% -1.4% -0.7%
18 1994 14 Design 210 2304.8 1995.0 86.60 631.0 540.0 146.0 710.0
8.29Operating 206 2556.5 2167.9 84.80 632.0 538.7 143.4 661.0Dev (%) -1.9% 10.9% 8.7% -2.1% 0.2% -0.2% -1.8% -6.9%
19 1982 26 Design 210 2403.0 2067.0 86.00 646.0 535.0 123.0 684.0
9.12Operating 210.78 2805.0 2272.0 81.00 648.0 535.0 116.0 670.0Dev (%) 0.4% 17.3% 9.9% -5.8% 0.3% 0.0% -5.7% -2.0%
Note: Observations/analysis presented in the table are based on the parameters at the time of Mapping Studies and simulated by model

BAC/IGEN//EBSILON MAPPING SUMMARY REPORT 30 of 59
ANNEXURE-2C
Board / Place Year of
Commiss-ioning
Age till
2008 Mode
Load (MW)
Gross Heat Rate (kcal/kWh)
Turbine Heat Rate (kcal/kWh)
Boiler Efficiency
(%) Main Steam
Condenser Vacuum (mmHg)
Auxiliary Power
Cons. (%)
20 1986 22 Design 210 2403 2067 86.00 652.0 535.0 127.0 684.0
9.03Operating 200.88 2843.7 2304.9 81.05 670.0 532.0 119.0 660.0Dev (%) -4.3% 18.3% 11.5% -5.8% 2.8% -0.6% -6.3% -3.5%
21 1989 19 Design 210 2317.3 2007.0 86.61 630.0 540.0 150.0 684.0
9.70Operating 210 2664.0 2122.0 79.60 640.0 533.0 147.0 660.0Dev (%) 0.0% 15.0% 5.7% -8.1% 1.6% -1.3% -2.0% -3.5%
22 1990 18 Design 210 2317.0 2007.0 86.60 628.0 535.0 150.0 684.0
9.19Operating 194 2984.0 2441.7 81.80 611.0 533.0 146.0 647.0Dev (%) -7.6% 28.8% 21.7% -5.5% -2.7% -0.4% -2.7% -5.4%
23 1982 26 Design 210 2395.4 2060.0 86.00 650.0 535.0 130.0 680.0
9.43Operating 188.9 2614.5 2192.7 83.90 588.0 535.0 130.0 662.0Dev (%) -10.0% 9.1% 6.4% -2.4% -9.5% 0.0% 0.0% -2.6%
24 1979 29 Design 210.18 2371.0 2040 86.00 652.0 535.0 130.0 680.0
9.92Operating 200 2697.0 2222.7 82.30 627.0 535.0 127.5 666.0Dev (%) -4.8% 13.7% 9.0% -4.3% -3.8% 0.0% -1.9% -2.1%
25 1981 27 Design 210 2378.7 2040.0 85.80 670.0 535.0 130.0 680.0
9.48Operating 190 2948.4 2324.2 78.80 578.0 534.0 130.0 648.0Dev (%) -9.5% 24.0% 13.9% -8.2% -13.7% -0.2% 0.0% -4.7%
Note: Observations/analysis presented in the table are based on the parameters at the time of Mapping Studies and simulated by model

BAC/IGEN//EBSILON MAPPING SUMMARY REPORT 31 of 59
ANNEXURE-2C
SL. NO.
Year of Commiss-
ioning
Age till
2008 Mode
Load (MW)
Gross Heat Rate (kcal/kWh)
Turbine Heat Rate (kcal/kWh)
Boiler Efficiency
(%) Main Steam
Condenser Vacuum (mmHg)
Auxiliary Power
Cons. (%)
26 1980 28 Design 210 2373.0 2040.0 86.00 670.0 535.0 137.0 663.0
12.87Operating 182 2715.0 2227.0 82.00 600.0 533.0 130.0 600.0Dev (%) -13.3% 14.4% 9.2% -4.7% -10.4% -0.4% -5.1% -9.5%
27 1993 15 Design 210.56 2334.0 2007.0 86.00 635.0 535.0 150.0 690.0
10.74Operating 148 2690.0 2208.0 82.10 442.0 535.0 93.8 660.0Dev (%) -29.7% 15.3% 10.0% -4.5% -30.4% 0.0% -37.5% -4.3%
28 1980 28 Design 210 2409.0 2047.6 85.00 670.0 540.0 130.0 684.0
9.00Operating 175 2875.1 2342.9 81.50 650.0 525.0 108.0 650.0Dev (%) -16.7% 19.4% 14.4% -4.1% -3.0% -2.8% -16.9% -5.0%
29 1986 22 Design 210 2617.3 2012.7 76.90 641.9 535.0 150.0 689.0
10.05Operating 210.12 2970.4 2109.8 71.00 630.0 541.0 149.0 674.0Dev (%) 0.1% 13.5% 4.8% -7.7% -1.8% 1.1% -0.7% -2.2%
30 1993 15 Design 210 2570.0 2008.8 78.17 657.0 535.0 150.0 684.0
10.44Operating 210.19 2899.9 2235.1 77.10 660.0 535.0 149.0 667.0Dev (%) 0.1% 12.8% 11.3% -1.4% 0.5% 0.0% -0.7% -2.5%
31 1994 14 Design 210 2350.0 1991.0 84.71 645.0 535.0 150.0 680.0
10.40Operating 210.39 2679.5 2223.0 83.00 660.0 536.0 148.0 655.0Dev (%) 0.2% 14.0% 11.7% -2.0% 2.3% 0.2% -1.3% -3.7%
Note: Observations/analysis presented in the table are based on the parameters at the time of Mapping Studies and simulated by model

BAC/IGEN//EBSILON MAPPING SUMMARY REPORT 32 of 59
ANNEXURE-2C
SL. NO.
Year of Commiss-
ioning
Age till
2008 Mode
Load (MW)
Gross Heat Rate (kcal/kWh)
Turbine Heat Rate (kcal/kWh)
Boiler Efficiency
(%) Main Steam
Condenser Vacuum (mmHg)
Auxiliary Power
Cons. (%)
32 1995 13 Design 210 2369.3 2007.0 84.70 636.0 535.0 150.0 680.0
10.38Operating 183 2668.7 2201.8 82.50 616.0 543.0 145.0 642.0Dev (%) -12.9% 12.6% 9.7% -2.6% -3.1% 1.5% -3.3% -5.6%
33 1998 10 Design 210 2335.6 2007.0 85.93 635.0 535.0 150.0 685.0
9.00Operating 210 2477.0 2044.8 82.55 645.0 535.0 147.0 655.0Dev (%) 0.0% 6.1% 1.9% -3.9% 1.6% 0.0% -2.0% -4.4%
34 1985 23 Design 210 2333.3 2007.2 86.10 625.0 535.0 147.0 684.0
9.27Operating 210 2559.0 2116.1 82.70 620.0 535.0 140.0 667.0Dev (%) 0.0% 9.7% 5.4% -3.9% -0.8% 0.0% -4.8% -2.5%
35 1988 20 Design 210 2333.3 2007.2 86.10 625.0 535.0 147.0 684.0
9.15Operating 210 2672.1 2224.7 83.30 670.0 535.0 139.0 671.0Dev (%) 0.0% 14.5% 10.8% -3.3% 7.2% 0.0% -5.4% -1.9%
36 1993 15 Design 210 2333.7 2007.0 86.00 630.0 535.0 147.0 684.0
9.50Operating 210 2867.1 2285.0 79.69 650.0 533.0 135.0 660.0Dev (%) 0.0% 22.9% 13.9% -7.3% 3.2% -0.4% -8.2% -3.5%
37 1989 19 Design 210 2333.7 2007.0 86.00 631.0 535.0 147.1 670.0
9.17Operating 210 2711.4 2250.4 83.00 658.0 535.0 147.1 605.0Dev (%) 0.0% 16.2% 12.1% -3.5% 4.3% 0.0% 0.0% -9.7%
Note: Observations/analysis presented in the table are based on the parameters at the time of Mapping Studies and simulated by model

BAC/IGEN//EBSILON MAPPING SUMMARY REPORT 33 of 59
ANNEXURE-2C
SL. NO.
Year of Commiss-
ioning
Age till
2008 Mode
Load (MW)
Gross Heat Rate (kcal/kWh)
Turbine Heat Rate (kcal/kWh)
Boiler Efficiency
(%) Main Steam
Condenser Vacuum (mmHg)
Auxiliary Power
Cons. (%)
38 1987 21 Design 210 2400 2062 85.93 650.0 540.0 136.0 684.0
9.12Operating 210 2656.2 2147.9 80.86 680.0 540.0 130.0 650.0Dev (%) 0.0% 10.7% 4.3% -5.9% 4.6% 0.0% -4.4% -5.0%
39 1990 18 Design 210 2395.9 2060.0 86.00 670.0 540.0 136.0 700.0
8.66Operating 204 2529.4 2152.0 85.10 633.0 540.0 132.9 663.0Dev (%) -2.9% 5.6% 4.5% -1.0% -5.5% 0.0% -2.3% -5.3%
40 1994 14 Design 210.52 2312.5 2005.8 86.73 640.0 539.0 147.0 690.0
9.78Operating 210.36 2650.8 2232.8 84.23 628.0 535.0 149.2 680.0Dev (%) -0.1% 14.6% 11.3% -2.9% -1.9% -0.7% 1.5% -1.4%
41 1995 13 Design 210 2312.4 2005.8 86.70 640.0 535.0 147.1 690.0
8.92Operating 211.8 2575.3 2086.0 81.00 627.0 540.0 152.2 690.0Dev (%) 0.9% 11.4% 4.0% -6.6% -2.0% 0.9% 3.5% 0.0%
42 1979 29 Design 210 2378.0 2062.0 86.70 653.0 535.0 130.0 684.0
8.07Operating 210.29 2826.3 2259.8 80.00 722.0 535.0 125.0 640.0Dev (%) 0.1% 18.6% 8.4% -7.7% 10.6% 0.0% -3.8% -6.4%
43 1996 12 Design 210 2318.6 1994.0 86.00 635.0 535.0 150.0 690.0
9.57Operating 180 2751.0 2160.0 78.50 526.0 526.0 124.0 660.0Dev (%) -14.3% 18.6% 8.3% -8.7% -17.2% -1.7% -17.3% -4.3%
Note: Observations/analysis presented in the table are based on the parameters at the time of Mapping Studies and simulated by model

BAC/IGEN//EBSILON MAPPING SUMMARY REPORT 34 of 59
ANNEXURE-2C
SL. NO.
Year of Commiss-
ioning
Age till
2008 Mode
Load (MW)
Gross Heat Rate (kcal/kWh)
Turbine Heat Rate (kcal/kWh)
Boiler Efficiency
(%) Main Steam
Condenser Vacuum (mmHg)
Auxiliary Power
Cons. (%)
44 1987 21 Design 210.42 2333.7 2007.0 86.00 632.0 540.0 150.0 690.0
9.20Operating 184.38 2706.4 2192.4 81.00 600.0 530.0 144.0 680.0Dev (%) -12.4% 16.0% 9.2% -5.8% -5.1% -1.9% -4.0% -1.4%
45 2006 2 Design 210.36 2333.7 2007.0 86.00 630.0 540.0 150.0 690.0
9.76Operating 185.34 2751.5 2261.5 82.18 527.0 535.0 122.0 655.0Dev (%) -11.9% 17.9% 12.7% -4.4% -16.3% -0.9% -18.7% -5.1%
46 2006 2 Design 210 2333.0 2007.0 86.00 630.0 540.0 150.0 690.0
9.27Operating 202 2459.7 2090.7 85.00 570.0 563.9 136.4 632.0Dev (%) -3.8% 5.4% 4.2% -1.2% -9.5% 4.4% -9.0% -8.4%
47 2000 8 Design 210 2303.2 1981.2 86.00 640.0 537.0 150.0 720.0
8.78Operating 210 2656.0 2238.3 84.27 658.0 530.0 148.1 690.0Dev (%) 0.0% 15.3% 13.0% -2.0% 2.8% -1.3% -1.3% -4.2%
48 1982 26 Design 210 2397 2062.2 86.00 660.0 535.0 127.5 684.0
8.68Operating 200 2747.3 2211.7 80.50 644.0 535.0 101.0 660.0Dev (%) -4.8% 13.6% 10.0% -6.4% -2.4% 0.0% -20.8% -3.5%
Note: Observations/analysis presented in the table are based on the parameters at the time of Mapping Studies and simulated by model

BAC/IGEN//EBSILON MAPPING SUMMARY REPORT 35 of 59
Operating indices for 210 MW units ANNEXURE-2C
SL. NO.
Year of Commiss-
ioning
Age till
2008 Mode
Load (MW)
Gross Heat Rate (kcal/kWh)
Turbine Heat Rate (kcal/kWh)
Boiler Efficiency
(%) Main Steam
Condenser Vacuum (mmHg)
Auxiliary Power
Cons. (%)
49 1984 24 Design 210 2388.1 2064.8 86.46 657.5 535.0 130.0 683.3
11.15 Operating 183 2952.4 2347.0 79.50 635.0 530.0 107.0 670.0Dev (%) -12.9% 23.6% 13.7% -8.0% -3.4% -0.9% -17.7% -1.9%
Total
Average Design Values 210.1 2361.6 2025.5 85.8 645.1 537.3 142.2 686.5 9.57 Average Operating Values 198.5 2714.4 2213.8 81.7 626.6 535.0 134.8 659.3Average Deviations (%) -5.5 14.9 9.3 -4.8 -2.9 -0.4 -5.2 -4.0Minimum of Operating Values 148.0 2383.7 2044.8 71.0 442.0 515.0 93.8 600.0 8.07 Maximum of Operating Values 219.0 3063.6 2441.7 86.0 726.0 563.9 152.2 695.0 12.87
Note: Observations/analysis presented in the table are based on the parameters at the time of Mapping Studies and simulated by model

BAC/IGEN//EBSILON MAPPING SUMMARY REPORT 36 of 59
Operating indices for 195-200 MW units ANNEXURE-2D
SL. NO.
Year of Commiss-
ioning
Age till
2008 Mode
Load (MW)
Gross Heat Rate (kcal/kWh)
Turbine Heat Rate (kcal/kWh)
Boiler Efficiency
(%)
Main Steam Condenser
Vacuum (mmHg)
Auxiliary Power Cons.
(%)
Flow (tph)
Tempera-ture (°C)
Pressure (kg/cm2)
1 2003 5 Design 195 2326 2000.0 86.00 583.5 540.0 147.1 680.0
10.00 Operating 211 2392.6 2033.7 85.00 642.5 544.0 150.2 666.0Dev (%) 8.2% 2.86% 1.6% -1.2% 10.1% 0.7% 2.1% -2.1%
2 1979 29 Design 200 2403.0 2067.0 86.01 638.0 535.0 133.0 690.0
8.80 Operating 194 2799.7 2267.2 80.98 614.0 535.0 106.0 687.0Dev (%) -3.0% 16.5% 9.7% -5.8% -3.8% 0.0% -20.3% -0.4%
3 1978 30 Design 200.09 2403 2067.0 86.00 630.0 535.0 127.0 680.0
8.07 Operating 180.86 2891.3 2340.8 81.00 633.0 518.0 123.5 659.0Dev (%) -9.6% 20.3% 13.20% -5.8% 0.5% -3.2% -2.8% -3.1%
4 1979 29 Design 200 2395.0 2062.0 86.10 680.0 540.0 135.3 710.0
12.59 Operating 100 3962.5 2892.5 73.00 360.0 535.0 62.7 660.0Dev (%) -50.0% 64.1% 39.3% -15.2% -47.1% -0.9% -53.7% -7.0%
5 1982 26 Design 200.09 2400.0 2062 86.00 680.0 540.0 136.0 690.0
11.74 Operating 145.22 2899.5 2305.1 79.50 460.0 532.0 104.0 670.0Dev (%) -27.4% 20.7% 11.7% -7.6% -32.4% -1.5% -23.5% -2.9%
Total
Average Design Values 199.0 2399.6 2051.6 86.02 642.3 538.0 135.7 690.010.24 Average Operating Values 166.2 2989.1 2367.9 79.90 541.9 532.8 109.3 668.4
Average Deviations (%) -16.4% 24.4% 15.4% -7.1% -14.5% -1.0% -19.6% -3.1%Minimum of Operating Values 100 2392.6 2033.7 73.00 360.0 518.0 62.7 659.0 8.07 Maximum of Operating Values 211.0 3962.5 2892.5 85.00 642.5 544.0 150.2 687.0 12.59
Note: Observations/analysis presented in the table are based on the parameters at the time of Mapping Studies and simulated by model

BAC/IGEN//EBSILON MAPPING SUMMARY REPORT 37 of 59
Operating indices for 140 MW units ANNEXURE-2E
SL. NO. .
Year of Commiss-
ioning
Age till
2008 Mode
Load (MW)
Gross Heat Rate (kcal/kWh)
Turbine Heat Rate (kcal/kWh)
Boiler Efficiency
(%)
Main Steam Condenser Vacuum (mmHg)
Auxiliary Power
Cons. (%) Flow (tph)
Tempera-ture (°C)
Pressure (kg/cm2)
1 1968 40 Design 140 2462.9 2054.0 83.40 412.0 538.0 130.0 690.0
13.70 Operating 112 2750.0 2242.9 81.50 344.0 530.0 124.5 660.0Dev (%) -20.0% 11.7% 9.2% -2.3% -16.5% -1.5% -4.2% -4.3%
2 1981 27 Design 140 2341.9 2054.0 86.23 395.0 540.0 130.0 690.0
14.13 Operating 104.23 2904.8 2325.4 80.00 321.0 530.0 106.0 670.0Dev (%) -25.6% 24.0% 13.2% -7.2% -18.7% -1.9% -18.5% -2.9%
3 1972 36 Design 140.23 2361.0 2054.0 87.00 400.0 535.0 130.0 690.0
14.56 Operating 104 2827.6 2298.0 81.30 315.0 520.0 120.0 670.0Dev (%) -25.8% 19.7% 7.7% -6.6% -21.3% -2.8% -7.7% -2.9%
4 1970 38 Design 140 2361 2054.0 87.0 428.4 543.0 141.0 663.0
8.91 Operating 97 2814.0 2252.0 80.00 315.0 515.0 121.5 657.0Dev (%) -30.7% 19.1% 9.6% -8.5% -26.5% -5.2% -13.9% -0.9%
Total
Average Design Values 140.1 2381.2 2054.0 86.01 408.9 539.0 132.8 683.312.83 Average Operating Values 104.3 2824.1 2279.6 80.70 323.8 523.8 118.0 664.3
Average Deviations (%) -25.5% 18.6% 11.0% -6.1% -20.7% -2.8% -11.1% -2.8%Minimum of Operating Values 97.0 2750.0 2242.9 80.00 315.0 515.0 106.0 657.0 8.91 Maximum of Operating Values 112.0 2904.8 2325.4 81.50 344.0 530.0 124.5 670.0 14.6
Note: Observations/analysis presented in the table are based on the operating parameters as observed at the time of Mapping Studies

BAC/IGEN//EBSILON MAPPING SUMMARY REPORT 38 of 59
Operating indices for 120-125 MW units ANNEXURE-2F
SL. NO.
Year of
Commiss-ioning
Age till
2008
Mode Load (MW)
Gross Heat Rate (kcal/kWh)
Turbine Heat Rate (kcal/kWh)
Boiler Efficiency
(%)
Main Steam Condenser Vacuum (mmHg)
Auxiliary Power Cons.
(%)
Flow (tph)
Tempera-ture (°C)
Pressure (kg/cm2)
1 1974/2000 34 Design 120 2388.4 2054.7 86.00 360.0 540.0 130.4 690.0 10.02
Operating 66 2764.1 2244.3 81.20 200.0 532.0 73.5 684.1
Dev (%) -45.0% 15.7% 9.2% -5.6% -44.4% -1.5% -43.6% -0.9%
2 1978/2000 30 Design 120 2394.5 2054.7 86.00 362.0 535.0 130.0 690.0 13.47
Operating 98 2709.7 2207.9 81.50 290.0 530.0 107.0 676.0
Dev (%) -18.3% 13.2% 7.2% -5.2% -19.9% -0.9% -17.7% -2.0%
3 1981 27 Design 120 2442.0 2100 85.99 410.0 537.0 128.8 700.0 10.36
Operating 114 2796.0 2261.5 80.88 410.0 532.0 126.2 680.0
Dev (%) -5.0% 14.4% 7.7% -5.9% 0.0% -0.9% -2.0% -2.9%
4 1977 31 Design 120 2442 2100 86.00 362.0 535.0 130.0 690.0 14.32
Operating 102.9 2689.9 2187.7 81.30 320.0 530.0 120.0 670.0
Dev (%) -14.3% 10.1% 4.1% -5.5% -11.6% -0.9% -7.7% -2.9%
5 1988 20 Design 120 2442.0 2100 85.50 372.0 537.0 127.0 684.0 13.66
Operating 73 2801.7 2306.9 82.30 246.0 536.0 118.0 664.0
Dev (%) -39.2% 14.8% 9.8% -3.7% -33.9% -0.2% -7.1% -2.9%
6 1976 32 Design 120 2346 2100 89.60 370.0 537.8 127.6 686.0 10.54
Operating 108 2862.0 2360.6 82.50 328.0 510.0 106.0 663.0
Dev (%) -10.0% 24.4% 14.5% -7.9% -11.4% -5.2% -16.9% -3.4%
7 1977 31 Design 120 2442 2100.0 86.00 403.0 540.0 133.0 686.0 12.41
Operating 78.46 3730.0 2796.0 75.00 273.0 523.0 102.8 654.0
Dev (%) -34.6% 54.2% 33.4% -12.8% -32.3% -3.1% -22.7% -4.7%

BAC/IGEN//EBSILON MAPPING SUMMARY REPORT 39 of 59
8 1974 34 Design 120.3 2442 2100.0 86.00 344.0 535.0 130.0 690.0 13.57
Operating 70.3 3172.4 2478.5 78.10 248.0 505.0 78.8 660.0
Dev (%) -41.6% 31.2% 18.2% -9.2% -27.9% -5.6% -39.4% -4.3%
9 1999 9 Design 125 2400.0 2022.0 84.30 390.0 540.0 132.0 710.0 11.50 Operating 128 2771.0 2162.0 78.00 391.0 539.0 145.0 676.4
Dev (%) 2.4% -15.5% -6.9% 7.5% -0.3% 0.2% -9.8% 4.7%
Total Average Design Values 120.6 2395.4 2063.4 86.15 374.8 537.4 129.9 691.8 12.21 Average Operating Values 93.2 2921.9 2333.9 80.09 300.7 526.3 108.6 669.7Average Deviations (%) -22.8% 18.5% 11.5% -5.4% -20.2% -2.0% -18.6% -2.1%Minimum of Operating Values 66 2689.9 2162.0 75.00 200.0 505.0 73.5 654.0 10.02 Maximum of Operating Values 128.0 3730.0 2796.0 82.50 410.0 539.0 145.0 684.1 14.32
Note: Observations/analysis presented in the table are based on the operating parameters as observed at the time of Mapping Studies

BAC/IGEN//EBSILON MAPPING SUMMARY REPORT 40 of 59
ANNEXURE-2G Operating indices for 100-110 MW units
SL. NO.
Year of Commiss-
ioning
Age till
2008 Mode
Load (MW)
Gross Heat Rate (kcal/kWh)
Turbine Heat Rate (kcal/kWh)
Boiler Efficiency
(%)
Main Steam Condenser
Vacuum (mmHg)
Auxiliary Power Cons.
(%)
Flow (tph)
Tempera-ture (°C)
Pressure (kg/cm2)
1 1975 33 Design 100 2472.0 2138.0 86.50 420.0 535.0 90.0 700.0
19.76 Operating 52 2924.4 2310.3 79.00 220.0 525.0 68.9 682.0Dev (%) 48.0% -20.7% -10.3% 8.7% 47.6% 1.9% 23.4% 2.6%
2 1977 31 Design 105 2463.1 2140 86.90 320.0 535.0 130.4 684.0
14.14 Operating 80 3280.7 2138 78.80 258.0 539.0 122.6 660.0Dev (%) 23.8% 32.5% -11.1% 9.3% 19.4% -0.7% 6.0% 3.5%
3 1985 23 Design 110 2377.0 2138.0 87.50 326.0 535.0 130.0 684.0
15.31 Operating 103.43 2851.3 2310.3 81.00 330.0 515.0 118.0 638.0Dev (%) 6.0% 20.0% 11.1% -7.4% 1.2% -3.7% -9.2% -6.7%
4 1975 33 Design 110 2482.0 2120.0 89.48 324.0 540.0 129.0 681.2
9.60 Operating 110.19 3067.5 2440.0 80.00 315.0 535.0 124.5 660.0Dev (%) -0.2% -23.6% -9.9% 10.6% 2.8% 0.9% 3.5% 3.1%
5 1974 34 Design 110 2460.0 2120.0 86.00 324.0 540.0 139.0 680.0
9.11 Operating 107 2696.3 2215.0 82.20 315.0 533.0 130.0 660.0Dev (%) 2.7% -9.6% -4.7% 4.4% 2.8% 1.3% 6.5% 2.9%
6 1983 25 Design 110 2245.6 2140.0 86.40 365.0 540.0 137.5 684.0
9.38 Operating 109 2883.0 2372.7 82.30 366.0 534.0 127.3 645.0Dev (%) 0.9% -28.4% -22.3% 4.7% -0.3% 1.1% 7.4% 5.7%
7 1975 33 Design 110 2395.9 2140.0 86.70 354.0 535.0 128.0 684.0
13.04 Operating 75 3600.8 2881.4 80.00 285.0 537.5 121.0 560.0Dev (%) 31.8% -50.3% -28.1% 7.7% 19.5% -0.5% 5.5% 18.1%
8 1984 24 Design 110 2418.6 2140.0 86.00 325.0 540.0 130.0 684.0 14.44 Operating 85 2830.5 2230.6 78.80 257.0 538.0 96.0 638.0

BAC/IGEN//EBSILON MAPPING SUMMARY REPORT 41 of 59
SL. NO.
Year of Commiss-
ioning
Age till
2008 Mode
Load (MW)
Gross Heat Rate (kcal/kWh)
Turbine Heat Rate (kcal/kWh)
Boiler Efficiency
(%)
Main Steam Condenser
Vacuum (mmHg)
Auxiliary Power Cons.
(%)
Flow (tph)
Tempera-ture (°C)
Pressure (kg/cm2)
Dev (%) 22.7% -17.0% -7.2% 8.4% 20.9% 0.4% 26.2% 6.7%
Total
Average Design Values 108.1 2434.9 2138.7 86.94 344.8 537.5 126.7 685.213.10 Average Operating Values 90.2 3016.8 2418.3 80.26 293.3 532.1 113.5 642.9
Average Deviations (%) 17.0% -19.0% -10.3% 5.8% 14.2% 0.1% 8.6% 4.5%Minimum of Operating Values 52 2696.3 2215.0 78.80 220.0 515.0 68.9 560.0 9.11 Maximum of Operating Values 110.2 3600.8 2881.4 82.30 366.0 539.0 130.0 682.0 19.76
Note: Observations/analysis presented in the table are based on the operating parameters as observed at the time of Mapping Studies

BAC/IGEN//EBSILON MAPPING SUMMARY REPORT 42 of 59
ANNEXURE-3A
Operating Gross Heat Rate of 500 MW capacity units (kcal/kWh)
2508.02523.4
2563.0
2646.7
2590.0
2400
2450
2500
2550
2600
2650
2700
kcal
/kW
h

BAC/IGEN//EBSILON MAPPING SUMMARY REPORT 43 of 59
Note: Observations/analysis presented in the table are based on the operating parameters as observed at the time of Mapping Studies
ANNEXURE-3B Operating Gross Heat Rate of 250 MW capacity units (kcal/kWh)
2546.1
2698.82751.1
2773.0
2667.0
2200
2300
2400
2500
2600
2700
2800
2900
kcal
/kW
h
Note: Observations/analysis presented in the table are based on the parameters at the time of Mapping Studies and simulated by model

BAC/IGEN//EBSILON MAPPING SUMMARY REPORT 44 of 59
ANNEXURE-3C
Operating Gross Heat Rate of 210 MW capacity units (kcal/kWh)
3063.6
2970.4
2875.12805.0
2711.42672.1
2602.1
2529.4
2383.7
2000
2100
2200
2300
2400
2500
2600
2700
2800
2900
3000
3100
3200
kcal
/kW
h
Note: Observations/analysis presented in the table are based on the parameters at the time of Mapping Studies and simulated by model
Gross Heat Rate
(kcal/kWh)
Share of units
- 2500 12.2%2500 - 2600 10.2%2600 - 2700 24.5%2700 - 2800 20.4%2800 - 2900 22.4%
2900 - 10.2%

BAC/IGEN//EBSILON MAPPING SUMMARY REPORT 45 of 59
ANNEXURE-3D
Operating Gross Heat Rate of 110-120 MW capacity units (kcal/kWh)
2689.9 2709.72764.1 2801.7 2851.3 2883.0
3067.53172.4
3600.83730.0
2000
2200
2400
2600
2800
3000
3200
3400
3600
3800
4000
kcal
/kW
h
Note: Observations/analysis presented in the table are based on the parameters at the time of Mapping Studies and simulated by model

BAC/IGEN//EBSILON MAPPING SUMMARY REPORT 46 of 59
ANNEXURE-3E
Operating Turbine Heat Rate of 500 MW capacity units (kcal/kWh)
2087.02095.7
2178.6
2093.02090.9
2000
2020
2040
2060
2080
2100
2120
2140
2160
2180
2200
kcal
/kW
h
Note: Observations/analysis presented in the table are based on the parameters at the time of Mapping Studies and simulated by model

BAC/IGEN//EBSILON MAPPING SUMMARY REPORT 47 of 59
ANNEXURE-3F
Operating Turbine Heat Rate of 250 MW capacity units (kcal/kWh)
2210.6
2294.0
2179.2
2284.0
2231.9
2000
2050
2100
2150
2200
2250
2300
2350
kcal
/kW
h
Note: Observations/analysis presented in the table are based on the parameters at the time of Mapping Studies and simulated by model
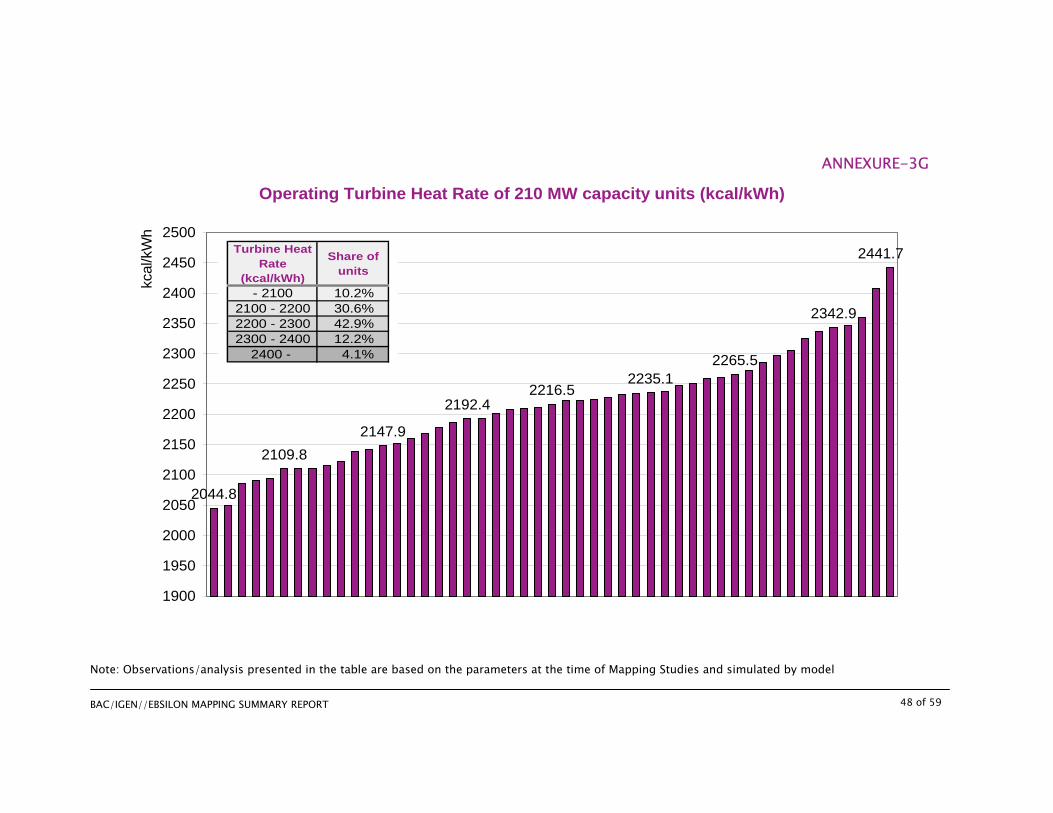
BAC/IGEN//EBSILON MAPPING SUMMARY REPORT 48 of 59
ANNEXURE-3G
Operating Turbine Heat Rate of 210 MW capacity units (kcal/kWh)
2441.7
2342.9
2265.52235.1
2216.52192.4
2147.92109.8
2044.8
1900
1950
2000
2050
2100
2150
2200
2250
2300
2350
2400
2450
2500
kcal
/kW
h
Note: Observations/analysis presented in the table are based on the parameters at the time of Mapping Studies and simulated by model
Turbine Heat Rate
(kcal/kWh)
Share of units
- 2100 10.2%2100 - 2200 30.6%2200 - 2300 42.9%2300 - 2400 12.2%
2400 - 4.1%

BAC/IGEN//EBSILON MAPPING SUMMARY REPORT 49 of 59
ANNEXURE-3H
Operating Turbine Heat Rate of 110-120 MW capacity units (kcal/kWh)
2187.7 2215.0
2306.92360.6
2478.5
2796.0
2881.4
2244.3
2440.3
2000
2100
2200
2300
2400
2500
2600
2700
2800
2900
3000
kcal
/kW
h
Note: Observations/analysis presented in the table are based on the parameters at the time of Mapping Studies and simulated by model

BAC/IGEN//EBSILON MAPPING SUMMARY REPORT 50 of 59
ANNEXURE-3I
Operating Boiler Efficiency of 500 MW capacity units (%)
79.00
83.05
84.1283.50
81.40
74
76
78
80
82
84
86
%
Note: Observations/analysis presented in the table are based on the parameters at the time of Mapping Studies and simulated by model

BAC/IGEN//EBSILON MAPPING SUMMARY REPORT 51 of 59
ANNEXURE-3J
Operating Boiler Efficiency of 250 MW capacity units (%)
82.7 82.7 82.9 83.0
85.6
74
76
78
80
82
84
86
%
Note: Observations/analysis presented in the table are based on the parameters at the time of Mapping Studies and simulated by model

BAC/IGEN//EBSILON MAPPING SUMMARY REPORT 52 of 59
ANNEXURE-3K
Operating Boiler Efficiency of 210 MW capacity units (%)
86.084.8
83.982.782.382.0
81.0
79.678.6
77.1
71.0
70
72
74
76
78
80
82
84
86
88
90
%
Note: Observations/analysis presented in the table are based on the parameters at the time of Mapping Studies and simulated by model
Boiler Efficiency
(%)
Share of units
- 78 6.1%78 - 80 18.4%80 - 82 18.4%82 - 84 36.7%84 - 20.4%

BAC/IGEN//EBSILON MAPPING SUMMARY REPORT 53 of 59
ANNEXURE-3L
Operating Boiler Efficiency of 110-120 MW capacity units (%)
75.0
78.178.8
80.0 80.080.9 81.0 81.2 81.3 81.5
82.2 82.3 82.3 82.5
70
72
74
76
78
80
82
84
86
%
Note: Observations/analysis presented in the table are based on the parameters at the time of Mapping Studies and simulated by model

BAC/IGEN//EBSILON MAPPING SUMMARY REPORT 54 of 59
ANNEXURE-3M
Operating Auxiliary Consumption of 500 MW capacity units (%)
7.50 7.517.71
8.69
7.81
5.0
5.5
6.0
6.5
7.0
7.5
8.0
8.5
9.0
%
Note: Observations/analysis presented in the table are based on the parameters at the time of Mapping Studies and simulated by model

BAC/IGEN//EBSILON MAPPING SUMMARY REPORT 55 of 59
ANNEXURE-3N
Operating Auxiliary Consumption of 250 MW capacity units (%)
8.54
9.339.58
10.049.73
5.0
6.0
7.0
8.0
9.0
10.0
11.0
%
Note: Observations/analysis presented in the table are based on the parameters at the time of Mapping Studies and simulated by model

BAC/IGEN//EBSILON MAPPING SUMMARY REPORT 56 of 59
ANNEXURE-3O
Operating Auxiliary Consumption of 210 MW capacity units (%)
11.15
12.87
9.929.70
9.329.159.008.66
8.07
5.0
6.0
7.0
8.0
9.0
10.0
11.0
12.0
13.0
14.0
%
Note: Observations/analysis presented in the table are based on the parameters at the time of Mapping Studies and simulated by model
Auxiliary Power
Cons.%
Share of units
8 - 9 22.4%9 - 10 55.1%
10 - 11 12.2%11 - 12 8.2%
12 - 2.0%

BAC/IGEN//EBSILON MAPPING SUMMARY REPORT 57 of 59
ANNEXURE-3P
Operating Auxiliary Consumption of 110-120 MW capacity units (%)
9.11 9.38 9.60 10.02 10.36 10.54
12.4113.04 13.47 13.57 13.66
14.32 14.4415.31
0
2
4
6
8
10
12
14
16
18
%
Note: Observations/analysis presented in the table are based on the parameters at the time of Mapping Studies and simulated by model

BAC/IGEN//EBSILON MAPPING SUMMARY REPORT 58 of 59
ANNEXURE-4A
Performance Monitoring Points
Dry gas loss
Cooling tower performance
ESP & Dry ash handling system

BAC/IGEN//EBSILON MAPPING SUMMARY REPORT 59 of 59
ANNEXURE-4B Section wise Unit Heat rate losses in a particular unit
Note: Observations/analysis presented in the table are based on the parameters at the time of Mapping Studies and simulated by model
![B2B Logistics Website Conversion Mapping & Content Overhaul [CASE STUDY]](https://static.fdocuments.in/doc/165x107/58e84feb1a28ab78478b4e87/b2b-logistics-website-conversion-mapping-content-overhaul-case-study.jpg)