
For all the tea in Kenya
73
Yuca Waarts, Lan Ge and Linda Puister For all the tea in Kenya Impact assessment and baseline situation of Farmer Field Schools Annexes to the main report
Transcript of For all the tea in Kenya

LEI Wageningen UR carries out socio-economic research and is the strategic partner for governments and the business community in the field of sustainable economic development within the domain of food and the living environment. LEI is part of Wageningen UR (University and Research centre), forming the Social Sciences Group together with the Department of Social Sciences and Wageningen UR Centre for Development Innovation.
The mission of Wageningen UR (University & Research centre) is ‘To explore the potential of nature to improve the quality of life’. Within Wageningen UR, nine specialised research institutes of the DLO Foundation have joined forces with Wageningen University to help answer the most important questions in the domain of healthy food and living environment. With approximately 30 locations, 6,000 members of staff and 9,000 students, Wageningen UR is one of the leading organisations in its domain worldwide. The integral approach to problems and the cooperation between the various disciplines are at the heart of the unique Wageningen Approach.
LEI Wageningen URP.O. Box 297032502 LS Den HaagThe NetherlandsE [email protected]/en/lei
ANNEXESLEI 2014-007a
Yuca Waarts, Lan Ge and Linda Puister
For all the tea in KenyaImpact assessment and baseline situation of Farmer Field Schools
Annexes to the main report

ANNEXES to the main report: For all the tea in Kenya
Impact assessment and baseline situation of Farmer Field Schools
Yuca Waarts, Lan Ge, Linda Puister1 Davies Onduru2
1 LEI Wageningen UR)
2 ETC East Africa
This study was carried out by LEI Wageningen UR and was commissioned by KTDA, Unilever and IDH-the sustainable Trade initiative.
LEI Wageningen UR Wageningen, June 2014
ANNEXES
LEI 2014-007a

Waarts, Y, L. Ge, L. Puister and D. Onduru, 2014. ANNEXES to the main report: For all the tea in Kenya; Impact assessment and baseline situation of Farmer Field Schools. Wageningen, LEI Wageningen UR (University & Research centre), LEI Report 2014-007. This report can be downloaded free of charge at the E-depot http://edepot.wur.nl/305592 or at www.wageningenUR.nl/en/lei (under LEI publications). © 2014 LEI Wageningen UR P.O. Box 29703, 2502 LS Den Haag, The Netherlands, T +31 (0)70 335 83 30, E [email protected], www.wageningenUR.nl/en/lei. LEI is part of Wageningen UR (University & Research centre).
For its reports, LEI utilises a Creative Commons Attributions 3.0 Netherlands license. © LEI, part of DLO Foundation, 2014 The user may reproduce, distribute and share this work and make derivative works from it. Material by third parties which is used in the work and which are subject to intellectual property rights may not be used without prior permission from the relevant third party. The user must attribute the work by stating the name indicated by the author or licensor but may not do this in such a way as to create the impression that the author/licensor endorses the use of the work or the work of the user. The user may not use the work for commercial purposes. LEI accepts no liability for any damage resulting from the use of the results of this study or the application of the advice contained in it. LEI is ISO 9001:2008 certified. LEI 2014-007a| Project code 2273000615 Cover photo: Davies Onduru

Contents
1 Extended methodology 5
1.1 General approach 5 1.2 Data sources and sampling 5 1.3 Data analysis 7
2 The questionnaire 9
2.1 Impact Assessment Questionnaire: Kinoro, Ndima, Nyankoba, Litein 9 2.2 Impact Assessment Questionnaire: Gachege, Mudete 32
3 Basic characteristics of respondents from the TESA-led FFS 54
4 Key performance indicators of respondents from TESA-led FFS 55
5 Regression outputs impact assessment of TESA-led FFS 60
6 Basic characteristics of respondents from the farmer-led FFS 64
7 Key performance indicators in baseline situation from the farmer-led FFS 65
8 Regression outputs baseline situation of farmer-led FFS 69
8.1 Propensity Score Matching (PSM) 69 8.2 Balancing test of covariates before and after matching 70


1 Extended methodology
This appendix elaborates the methodological approach employed to assess the impact of Farmer Field Schools (TESA-led FFS) on the key performance indicators and to establish the baseline situation of farmer-led FFS with a more detailed description of the sampling strategy and data analysis.
1.1 General approach
The overall design employed in this study was a longitudinal impact evaluation using panel data1 that include the baseline data, which measure the outcome before the intervention, and follow-up data that measure the outcome after a passage of time deemed sufficient for the impact of the intervention to set in. The evaluation combines the difference-in-difference (DiD) approach, propensity score matching (PSM), and regression analysis to net out the impacts of other factors. As illustrated in the main report, the difference-in-difference approach essentially compares the changes among the FFS participants (before and after participating FFS) and changes among the non-participants (the control group). The control group ideally has similar observable characteristics as those of the participants and is assumed to share a parallel trend over time with the participants if they had not participated in an FFS. This assumption was assessed through the comparison of the status quo in the baseline situation on a number of key characteristics and performance indicators of the two groups. The changes in the situation of the control group during the same period in which the participants undergo FFS activities are used as a proxy for the counterfactual situation of the participants, i.e. 'what would have happened to them if they had not participated in an FFS?’. The use of differences in the regression analysis made it possible to assess the impact of training activities that took place between 2010 and 2014 on the indicators of interest by 'differencing out' the influence of persistent factors about which no information is available. To establish the baseline situation of farmers participating in the farmer-led FFS and the baseline situation of the control farmers, we performed a mean comparison of the two groups on a number of key characteristics and performance indicators. We also performed propensity score matching (PSM) using key characteristics – such as age, gender, farm size and education level – to assess potential selection bias that may influence the impact evaluation to be carried out in 2015.
1.2 Data sources and sampling
For the impact assessment of TESA-led FFS, this research used both factory data from KTDA (grower registration data, rainfall data, tea green leaf purchase data and quality information on processed tea) and survey data from households that supply tea (green leaf) to four KTDA managed factories sampled in 2010.2 From all these four factories, households that were to undergo training activities were randomly selected for the baseline interview in 2010. Households in the control group, which were not to undergo the FFS training, were also randomly selected to be interviewed.
1 In statistics and econometrics, the term ‘panel data’ refers to multidimensional data that contain observations on multiple
phenomena observed over multiple time periods for the same firms or individuals. A basic introduction to panel data techniques can be found in Verbeek (2000), A Guide to Modern Econometrics. John Wiley & Sons, Ltd Chichester.
2 Detailed description of the four factories and the sampling strategy used can be found in Waarts, Y., Lan Ge, Giel Ton, Don
Jansen, 2012, Sustainable tea production in Kenya: Impact assessment of Rainforest Alliance and Farmer Field School training. LEI Wageningen UR, The Hague.
LEI Report 2014-007 (Annexes) | 5

Table A1.1 below shows the number of households interviewed in the pre-training situation (i.e. July 2010) per factory. The interviews were repeated in 2012 and 2014 using the same sample. The questionnaire used for the household interview can be found in Appendix 2. The sampling of factories in 2010 took into account the following factors: • Region: East of the Rift Valley and the West of Rift Valley • Whether RA-trained/certified
The actual participation of households in the two types of training activities in 2012, however, turned out to be different from what was planned in 2010. For example, more households participated in FFS-training and training for RA-lead farmers than originally planned. Some farmers in the control group participated in FFS training. This made it necessary to identify ex post ‘treatment group’ and ‘comparison group’ to reflect the actual participation in RA and FFS training. The ‘treatment’ group and the ‘control group’ used in the impact assessment were therefore not exactly the same as the originally sampled groups (see Table A1.2).
Table A1.1 Distribution of sampled farmers over factories (pre-training situation, 2010).
Region RA training sites FFS training sites Total % of all sample East of Rift Valley
Kinoro factory
60 farmers to undergo RA training
Ndima factory
58 FFS farmers 118 33
30 comparison farmers ‘near’
30 8
30 comparison farmers ‘far’
30 8
West of Rift Valley
Nyankoba factory
60 farmers to undergo RA training
Litein factory
58 FFS farmers 118 33
30 comparison farmers ‘near’
30 8
30 comparison farmers ‘far’
30 8
Total 120 236 356 100
Table A1.2 Distribution of sampled farmers over factories (after-training situation, 2014).
Region Factory FFS participation Total East of Rift Valley
Non-FFS % of all sample
FFS % of all sample
Non-FFS+FFS % of all sample
Kinoro 0 0.0 47 15.3 47 15.3 Ndima 37 12.0 67 21.8 104 33.8 West of Rift Valley
Litein 9 2.9 91 29.5 100 32.5 Nyankoba 32 10.4 25 8.1 57 18.5 Total 78 25.3 230 74.7 308 100.0
For the baseline study of the farmer-led FFS, this research analysed survey data from households that supply tea (green leaf) to two KTDA managed factories, namely Gachege (east of the Rift Valley) and Mudete (west of the Rift Valley). The FFS participants and non-participants were randomly selected with the assistance of KTDA factory staff. Table A1.3 below shows the number of households interviewed in the pre-training situation (i.e. January 2014) per factory.
6 | LEI Report 2014-007 (Annexes)

Table A1.3 Distribution of sampled farmers over factories (pre-training situation, 2014).
Region Factory FFS participation Total East of Rift Valley
Non FFS % of all sample
FFS % of all sample
Non FFS+FFS % of all sample
Gachege 42 17.5 78 32.5 120 50 West of Rift Valley
Mudete 60 25.0 60 25.0 120 50 Total 102 42.5 138 57.5 240 100
1.3 Data analysis
The data analysis was carried out using the statistical analysis package Stata IC/13.13. Variables and descriptive statistics The survey data (processed as Stata data files) contain categorical variables and numerical variables. Categorical variables are characteristics that are not numbers per se, but categories or types. Examples of categorical variables are individual characteristics such as gender and position in the household, and group characteristics such as factory and region. Numerical variables are by their very nature numbers. Examples of numerical variables are the kilograms of tea green leaf sold and the number of people in a household. We use simple descriptive statistics to provide basic information about the variables of interest. These descriptive statistics include, but are not limited to, number of observations (abbreviated as N in the tables), percentage distributions, medians, means and standard deviations (abbreviated as Std. Deviation in the tables). Basic statistical tests We used the following statistical tests to compare the means and proportions of different groups and the relationships between different variables: • T-test • Proportion test • two sample Kolmogorov-Smirnov test of proportions • Spearman’s rank correlation Propensity score matching (PSM) Propensity score matching (PSM) is a commonly used method to match participants and non-participants based on the observable characteristics that affect their participation in the programme and the outcome being measured.4 We use PSM to address potential self-selection bias. The propensity score is the estimated probability of getting a treatment (e.g. participating in the programme) for each household using a vector of pre-treatment covariates. We used the Stata commands ‘psmatch2’5 and ‘teffects’ for PSM and the estimation of ATT with kernel and nearest neighbour matching. After PSM, a balancing test was carried out on the covariates to gauge the comparability between the treatment group and the control group. Regression analysis
3 StataCorp. 2013. Stata Statistical Software: Release 13. College Station, TX: StataCorp LP.
4 See technical description in Rosenbaum, P.R., and
D.B. Rubin (1983). The central role of the propensity score in observational studies for causal effects. Biometrika 70 (1): 41-55
5 E. Leuven and B. Sianesi. (2003). "PSMATCH2: Stata module to perform full Mahalanobis and propensity score matching,
common support graphing, and covariate imbalance testing". http://ideas.repec.org/c/boc/bocode/s432001.html
LEI Report 2014-007 (Annexes) | 7

Regression analysis is a statistical tool for the investigation of relationships between variables using observed data. It is usually used to ascertain the causal effect of one variable upon another that is predicted by a plausible theory (hypothesis). The focus of regression analysis is on the relationship between a dependent variable and one or more independent variables. More specifically, it helps one understand how the typical value of the dependent variable changes when any one of the independent variables (also called the explanatory variables) is varied, while the other independent variables are held fixed. We used regression analysis to understand the impacts of potential contributing or influencing factors on the outcome indicators such as knowledge level, implementation of GAPs and yield. Since the dataset on the TESA-led FFS contains repeated observations on the same households, we used panel data techniques to analyse the changes in each household and the impact of FFS and other factors on these changes. Each household in the dataset is uniquely identified by its grower number and is one panel about which information was collected on various indicators in different periods, that is, the baseline situation (July 2010), the mid-term situation (February 2012) and the latest situation (January 2014). Changes in each individual household were calculated as the differences in values of various variables or indicators between 2010 and 2012. Regression analysis was then performed using these differences as the dependent variables, and training and other characteristics of the households as the explanatory variables. For a number of regression models, we performed post-estimation tests of model specification and coefficients (Hausman's specification test and Likelihood-ratio test after estimation). Comparison groups When relevant, different groups were compared to assess impact or potential bias. These groups were the following: • FFS participants (FFS) vs. non-participants (non-FFS) • Three ‘degrees of participation’ over time (see main report and Figure A1.1 for the sizes of the
groups) • FFS participants vs. all farmers
Figure A1.1 Groups with different ‘degrees of participation’ in FFS
49.0%
35.1%
15.9%
Has been FFS member for 3-4 yearsHas been FFS member for 1-2 yearsHas never been FFS member
8 | LEI Report 2014-007 (Annexes)

2 The questionnaire
2.1 Impact Assessment Questionnaire: Kinoro, Ndima, Nyankoba, Litein
Enumerators, no blanks are allowed: • Please fill out -999 when the farmer does not know. • Please fill out NA when the question is not applicable to the farmer, and for questions on inputs used
a 0 when a farmer did not buy or use a certain input. KTDA Sustainable Agriculture Project A: Household identification + FFS A Date of interview (dd/mm/yyyy):………………… Start time: …………….. End time:……………… B Name of enumerator…………………………………………………………………………... C Name of Factory: …………………………………………………………………………….. 1 Factory grower number (2 letters for the factory, 3 numbers for buying centre, 4
numbers for grower number)
2 Name of the respondent (Enumerator: interview the person who attended FFS training
or the person in charge of tea production):
…………………………………………………………………………………........................
3a What is the gender of the respondent? (Circle correct number) 0 Female 1 Male
3b What is your year of birth?
…………………………………………………………………………………........................
3c How many years of education have you followed? (number of years, ‘I do not know’ = -999)
…………………………………………………………………………………........................
4 Is the respondent the household head? (Circle correct number)
0 No 1 Yes
5 How many people are part of your household? ………………………
LEI Report 2014-007 (Annexes) | 9

6 Did you sell tea in the July 2012/ June 2013 financial year?
0 No 1 Yes
6b Did you sell tea between July 2013 and December 2013?
0 No 1 Yes
If the answers to both questions 6 and 6b are NO, then stop the interview and go to another farmer on your list 7 Are you a member of a FFS or have you been a member of an FFS?
0 No please continue with question 13 1 No, but a family member is/was an FFS member continue with question 8a 2 Yes please continue with question 8b 3 Not anymore please continue with question 8b
8a If you did not participate in the FFS activities yourself but other person(s) from your
household did participate, how did he/she/they value(s) the activities? (Circle one option) 0 Unsatisfied please continue with question 13 1 Neutral please continue with question 13 2 Satisfied please continue with question 13 3 I do not know please continue with question 13
8b How do you value FFS activities? How satisfied are you with the following aspects of the
FFS? (Enumerator: ask the farmer about all aspects and put one code in the square that corresponds with the given answer)
Aspect: how satisfied are you with…? 1: Very satisfied 2: Satisfied 3: Neutral 4: Unsatisfied 5: Very unsatisfied 6: I do not know 7: Not applicable
1. FFS training 2. Role of facilitators 3. Group organization (officials, sub group) 4. Group dynamics 5. Frequency of meetings 6. Time necessary 7. Special topic sessions 8. FFS commercial activities 9. Micro credit 10. Insurance 11. Costs of running FFS 8c Would you recommend other farmers to participate in an FFS? 0 No 1 Yes 2 N/A / I don’t know 9 Has your FFS group continued existing after you have graduated?
0 No Continue with question 11 1 Yes Continue with question 10
10 | LEI Report 2014-007 (Annexes)

10a What have been the activities of the FFS since your graduation? (List maximum 10
activities, in order of importance, as specific as possible e.g. training on chicken rearing)
0 No activities
1 Activity 1: .......................................
2 Activity 2: .......................................
3 Activity 3: .......................................
4 Activity 4: .......................................
5 Activity 5: .......................................
6 Activity 6: .......................................
7 Activity 7: .......................................
8 Activity 8: .......................................
9 Activity 9: .......................................
10 Activity 10: .......................................
11a What would you like to see changed in the organization of the Farmer Field Schools to
improve its functioning in the future? (Enumerator: write down maximum 3 changes)
1. …………………………………………………………………………………………………………….
2. …………………………………………………………………………………………………………….
3. …………………………………………………………………………………………………………….
12a Have you or your household benefitted from participating in the Farmer Field School
group in the last 2 years? 0. No please go to question 12b 1. Yes please go to question 12c
12b Why have you not benefitted from participating in the Farmer Field School group in the
last 2 years? (Enumerator: Write down maximum 3 reasons)
1. ……………………………………………………………………………………………………………
2. ……………………………………………………………………………………………………………
3. …………………………………………………………………………………………………………… 12c What benefits have you or your household realised from participating in the Farmer Field
School in the last 2 years? (Enumerator: write down maximum 3 benefits)
1. ……………………………………………………………………………………………………………
2. ……………………………………………………………………………………………………………
3. ……………………………………………………………………………………………………………
LEI Report 2014-007 (Annexes) | 11

13 Have you been trained as a lead farmer by Rainforest Alliance? 0 No 1 Yes 14a If you are not a lead farmer, have you, or any person from your household attended
Rainforest Alliance certification training? 0 Nobody
1 Yes, me 2 Yes, somebody else (Q14b……….................................................... (Record
relationship) 3 I do not know 15a Have you or any member of your household participated in any other certification
scheme training or workshops, other than by Rainforest Alliance over the past 12 months? Trainings are defined as educational events; for instance, one-on-one training, group training, workshop, demonstration, training during TESA visit. (E.g. UTZ Certified, Fairtrade/FLO, ISO) 0 No
1 Yes, UTZ Certified 2 Yes, FLO/Fairtrade
3 Yes, ISO 4 Yes, I have received training to become certified, but I do not know for which
certificate 5 I do not know
15b Have you or any member of your household participated in any non-certification scheme
trainings or workshops over the past 12 months (trainings defined as educational events; for instance, one-on-one training, group training, workshop, demonstration, training during TESA visit)? 0 No
1 Yes Skip question 16 16 If no, what was the reason? 1) No training offered 2) Offered, but could not get to training, no transportation or resources 3) Offered, but other reasons for not attending (no time, not interested in topic). 17 If yes, how many trainings (trainings defined as educational events; for instance, one on
one training, group training, workshop, demonstration, training during TESA visit) have you and other persons from your household attended in the past 12 months?
1) 1 training 2) Between 1-5 trainings 3) More than 5 trainings 4) I do not know
12 | LEI Report 2014-007 (Annexes)

18 Did the person(s) that participated in training follow the following topics? (one-on-one
training, group training, workshop, demonstration, training during TESA visit)? Fill in 1 for yes or 0 for no in column 1. (If yes, who gave the training? Fill in codes 1 to 6).
Topics Attended
training on this topic? [0 = No, 1 = Yes, 2= Do not know]
Name the type of organization 1= factory 2= government 3= NGO 4= input supplier 5= Local individual (e.g. neighbour) 6= others 7 = I do not know
18a Crop production (for instance new crops)
a1………
a2i…………… a2ii ………………. a2iii………..
18b Health and safety (for instance HIV/AIDS, housekeeping, food)
b1………
b2i…………… b2ii ………………. b2iii………..
18c Farm management skills (for instance record keeping, economic decision making)
c1………
c2i…………… c2ii ………………. c2iii………..
18d Agro-chemical application (chemicals used for all farm activities)
d1……… d2i…………… d2ii ……………….
d2iii……….. 18e Others/ combination of topics
e1…………
e2i…………… e2ii ………………. e2iii………..
19 Apart from information provided in the trainings, does the extension staff provide you
with information or services that helps you with your tea production? 0 No Please go to Section B on the next page 1 Yes please go to question 20 2 I don’t know Please go to question 20
LEI Report 2014-007 (Annexes) | 13

20 Can you name the services the factory provides you with and if you are satisfied with it /
them? (Instructions for enumerators: please read the options to the farmers and record one response/possible answer in each box according to the code)
Services by the Factory 1: Very satisfied 2: Satisfied 3: Neutral 4: Unsatisfied 5: Very unsatisfied 6: I do not know 7: Not applicable
20a Training 20b Market information on inputs 20c Market information on sales and prices (e.g. also of other crops than
tea)
20d Providing information about inspection results and corrective actions after Internal Inspections (Internal Management System)
20e Providing information about the external Inspections (audit) 20f Providing access to fertilizer 20g Providing access to seedlings, planting material 20h Providing access to pesticides 20i Providing access to (micro) credits 20j Insurance 20k Information on Group Commercial activities; sales and marketing
B: Implementation of sustainable practices
1. Answering options should not be read out to the households, options are for enumerators’ convenience only! 2. Select one answer option per question by circling the corresponding letter, apart from questions with questions which state multiple answers can be given 3. Do not give any additional information about the ‘right’ answers as we will be questioning knowledge later on. Profit (questions are all related to tea) 1 How many times does your household pluck tea in the same tea plot per month (this
refers to a normal month- when there is no drought and it is not very cold)? 1. 4 times (every 7-8 days) 2. 3 times (every 10 days) 3. 2 times (every 2 weeks) 4. Less than twice (less than once every 2 weeks)
2 Where does your household experience leaf spillage at the farm, during transport to
buying centre or at the buying centre? 1. No spillage at all places 2. Spillage in all three places 3. Spillage at home only 4. Spillage at BC only 5. Spillage during transport
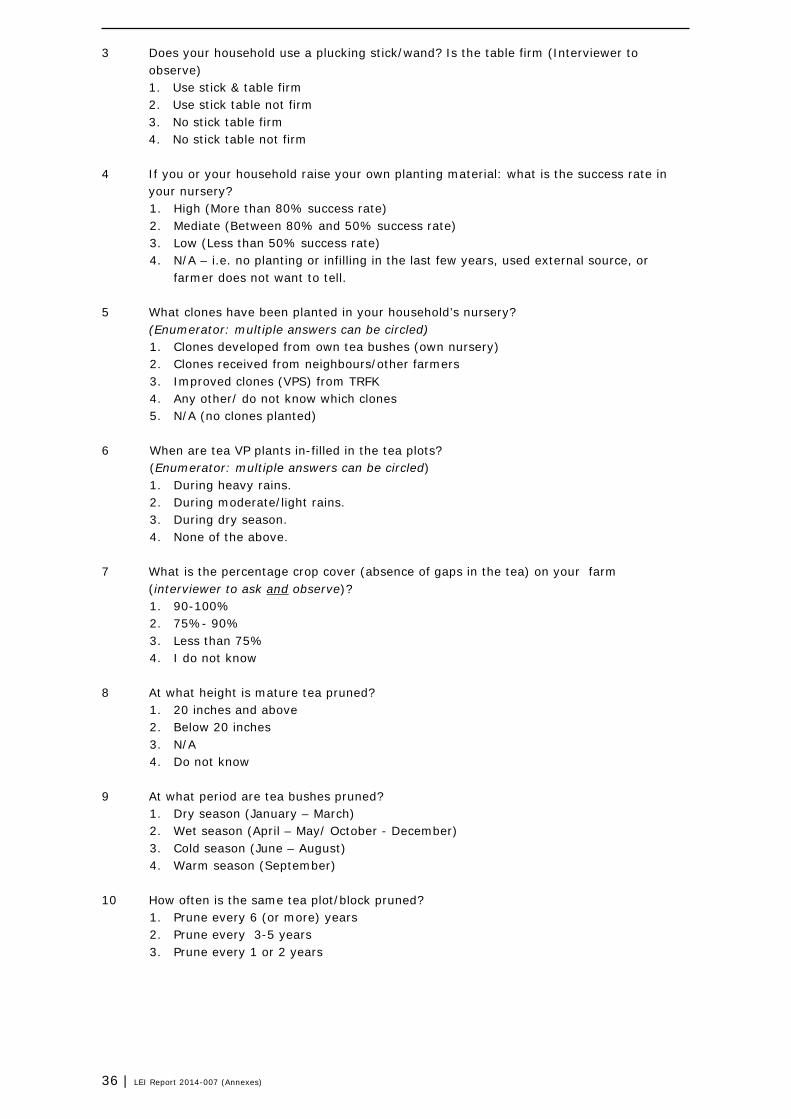
3 Does your household use a plucking stick/wand? Is the table firm (Interviewer to
observe) 1. Use stick & table firm 2. Use stick table not firm 3. No stick table firm
14 | LEI Report 2014-007 (Annexes)

4. No stick table not firm
4 If you or your household raise your own planting material: what is the success rate in your nursery? 1. High (More than 80% success rate) 2. Mediate (Between 80% and 50% success rate) 3. Low (Less than 50% success rate) 4. N/A – i.e. no planting or infilling in the last few years, used external source, or
farmer does not want to tell. 5 What clones have been planted in your household’s nursery? (Enumerator: multiple answers can be circled)
1. Clones developed from own tea bushes (own nursery) 2. Clones received from neighbours/other farmers 3. Improved clones (VPS) from TRFK 4. Any other/ do not know which clones 5. N/A (no clones planted)
6 When are tea VP plants in-filled in the tea plots? (Enumerator: multiple answers can be circled)
1. During heavy rains. 2. During moderate/light rains. 3. During dry season. 4. None of the above.
7 What is the percentage crop cover (absence of gaps in the tea) on your farm
(interviewer to ask and observe)? 1. 90-100% 2. 75%- 90% 3. Less than 75% 4. I do not know
8 At what height is mature tea pruned?
1. 20 inches and above 2. Below 20 inches 3. N/A 4. Do not know
9 At what period are tea bushes pruned?
1. Dry season (January – March) 2. Wet season (April – May/ October - December) 3. Cold season (June – August) 4. Warm season (September)
10 How often is the same tea plot/block pruned?
1. Prune every 6 (or more) years 2. Prune every 3-5 years 3. Prune every 1 or 2 years
11 What is the major tool used to prune the tea your household produces? (Enumerator:
multiple answers can be circled) 1. Use pruning knife 2. Use pruning machine 3. Other tools
LEI Report 2014-007 (Annexes) | 15

12 Who prunes the tea bushes and have they been trained? (Enumerator: multiple
answers can be circled)
1. Untrained family member. 2. Trained family member. 3. Untrained non family member. 4. Trained non family member
13 At what height are your bushes tipped in? 1. More than 6 inches above pruning height 2. 4 to 6 inches above pruning height 3. Less than 4 inches above pruning height
14 How frequently do you apply composted manure in tea (= organic fertilizer)? 1. Never / do not apply 2. Less than once every three years 3. Every three years 4. More often than once every three years
15 How frequently do you apply chemical fertilizer in tea?
1. Once per year 2. Twice a year 3. More than twice per year 4. Never / Do not apply
16 Do you keep records on input use and production in tea?
1. Only records on production/sales 2. Only records on inputs 3. Records on input use and production 4. No records kept
People (question 17 about tea, other questions about the whole production system) 17 Who plucks your tea?
1. Only household members 2. Regular workers 3. Seasonal workers 4. Mixture of household members and workers
18 Do you hire workers? Do you have agreements with hired workers about pay and timing
of payment? 1. Yes, agreement in writing 2. Yes, oral agreements 3. No 4. I do not hire workers, only family members work on the farm please go to
question 19b 19a Do your workers have access to easily accessible water for drinking and latrines?
1. Access to potable water 2. Access to latrines 3. Both 4. Neither
19b Does your household have access to easily accessible water for drinking and latrines?
1. Access to potable water 2. Access to latrines 3. Both 4. Neither
16 | LEI Report 2014-007 (Annexes)

20 How often did your family or any of your workers need medical attention after injury on
the farm for example fractures or wounds requiring stitches, in the last 12 months? 1. More than three occasions 2. On one or two occasions 3. No occasions
21 When chemicals are sprayed, which personal protective equipment (PPE) does your
family or your workers use? 1. All PPE (Mask, gloves, boots, overall, goggles) 2. Some of the above PPE 3. No PPE 4. N/A (don’t spray)
22a Do you group together with other farmers to carry out certain activities e.g. sourcing of
fertilizer, leaf transport, plucking, learning visits to other farmers etc.? 1. Yes 2. No continue with question 23
22b If yes, do you group together with other farmers more frequent than 2 years ago?
1. Less frequent 2. Not more or less frequent than 2 years ago 3. More frequent 4. I do not know
23 Do you turn to KTDA if you experience any problems in your tea production?
1. Yes 2. No
24 Do your children go to school?
1. N/A, no, the children are too young or too old to go to school 2. No, some children are not going to school although they have the age to attend
primary or secondary school 3. Yes, all children in the age to attend primary or secondary school are attending
school 4. Yes, all children in the age to attend primary or secondary school are attending
school and one or more children are following college or university Planet 25 Do you collect prunings from the tea field?
1. No 2. Yes - use as mulch elsewhere on farm 3. Yes - use as fuel
26 Do you infill open areas in your tea (Interviewer to ask and observe)?
1. Yes 2. No 3. N/A (no gaps)
27 When do you apply fertilizer to your tea?
1. Apply fertiliser during moderate rains 2. Apply fertiliser during heavy rains 3. Apply fertiliser during dry periods 4. Apply fertilizer on another moment 5. Do not apply fertilizer
LEI Report 2014-007 (Annexes) | 17
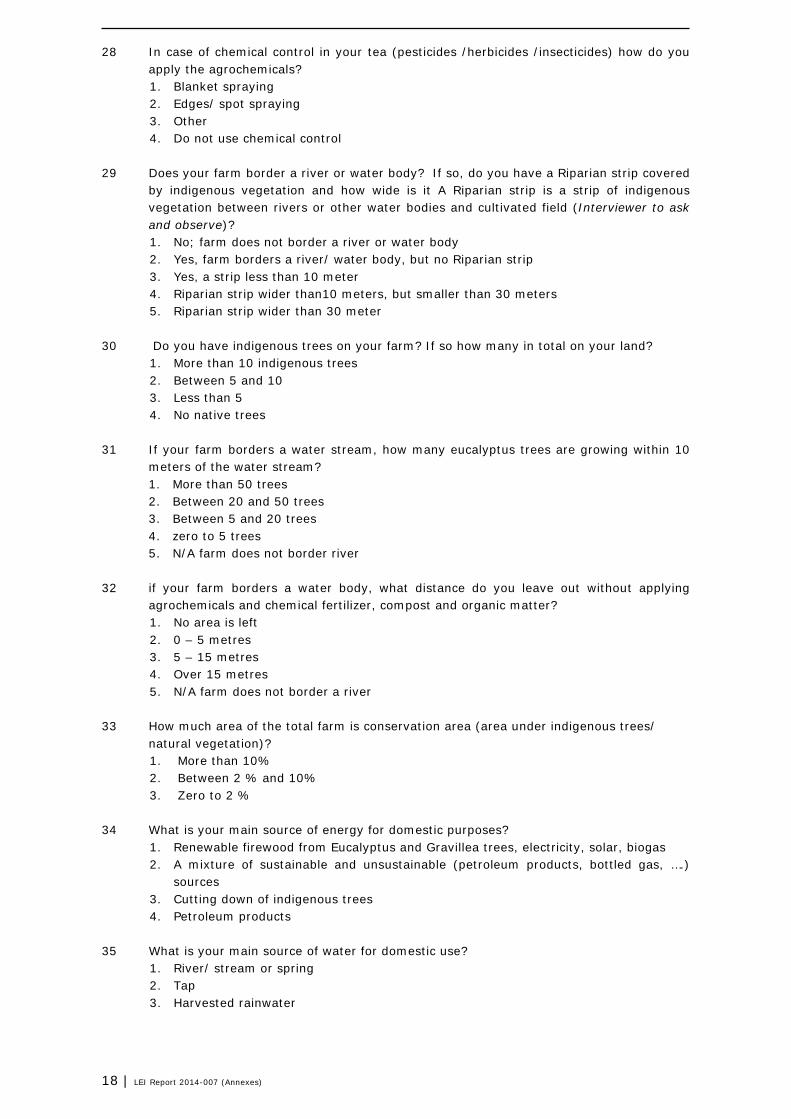
28 In case of chemical control in your tea (pesticides /herbicides /insecticides) how do you
apply the agrochemicals? 1. Blanket spraying 2. Edges/ spot spraying 3. Other 4. Do not use chemical control
29 Does your farm border a river or water body? If so, do you have a Riparian strip covered
by indigenous vegetation and how wide is it A Riparian strip is a strip of indigenous vegetation between rivers or other water bodies and cultivated field (Interviewer to ask and observe)? 1. No; farm does not border a river or water body 2. Yes, farm borders a river/ water body, but no Riparian strip 3. Yes, a strip less than 10 meter 4. Riparian strip wider than10 meters, but smaller than 30 meters 5. Riparian strip wider than 30 meter
30 Do you have indigenous trees on your farm? If so how many in total on your land?
1. More than 10 indigenous trees 2. Between 5 and 10 3. Less than 5 4. No native trees
31 If your farm borders a water stream, how many eucalyptus trees are growing within 10 meters of the water stream? 1. More than 50 trees 2. Between 20 and 50 trees 3. Between 5 and 20 trees 4. zero to 5 trees 5. N/A farm does not border river
32 if your farm borders a water body, what distance do you leave out without applying
agrochemicals and chemical fertilizer, compost and organic matter? 1. No area is left 2. 0 – 5 metres 3. 5 – 15 metres 4. Over 15 metres 5. N/A farm does not border a river
33 How much area of the total farm is conservation area (area under indigenous trees/ natural vegetation)? 1. More than 10% 2. Between 2 % and 10% 3. Zero to 2 %
34 What is your main source of energy for domestic purposes?
1. Renewable firewood from Eucalyptus and Gravillea trees, electricity, solar, biogas 2. A mixture of sustainable and unsustainable (petroleum products, bottled gas, ….)
sources 3. Cutting down of indigenous trees 4. Petroleum products
35 What is your main source of water for domestic use? 1. River/ stream or spring 2. Tap 3. Harvested rainwater
18 | LEI Report 2014-007 (Annexes)

36 How do you manage household waste water and effluent from livestock (interviewer to
observe if possible)? 1. Presence of soak pits/ waste pits; 2. Other ways of filtering water 3. Part of the waste in soak pits, part runs directly into farm 4. Discharge direct onto the farm or into waterways
37 How do you manage household solid waste?
1. No waste management in place 2. One pit for all waste 3. One pit for organic waste and one pit for other waste 4. More than two pits in place: non-organic waste is further separated, for instance for
plastic or glass 38 Is waste collected and taken elsewhere?
1. Glass, plastic and other waste is collected 2. One of three waste types is collected (either glass, or plastic, or other waste) 3. No, recycling options known but no transportation available 4. No, collection service is not available 5. N/A no waste pit available
Decision-making in tea We also would like to ask you some questions on how you make decisions about tea production and management activities at the moment and how you made such decisions two years ago. (Enumerator: multiple options are possible, read the options aloud to the farmers and tick the relevant box). 39a How do you generally make decisions on tea production activities at the moment and
two years ago? (Enumerator, put relevant code in the box; every row must be filled; multiple answers possible as many factors contribute to making a decision)
Nr Way for decision-making on tea production (more than
one factor may contribute to making a decision) Now (39a)
Two years ago (39b)
No = 0 Yes = 1
No = 0 Yes = 1
0 Based on advice from my parents/friends/neighbours 1 Based on what I did last year 2 Based on a routine 3 Based on the state of my tea bushes/field(s) 4 Based on recommendations by the TESA/FSC/factory 5 Based on regular check of my records to see whether my
farm is doing well
6 Based on comparing my records with the records of my neighbours/friends/other farmer to see how my farm is doing
7 Based on what I learned from the training 8 Based on information on prices for tea and other crops 9 Based on comparing my production with figures with average
tea production in Kenya to see how my farm is doing
10 Based on my own experience 11 Other, please specify ……………….
…………………………………
39c If any of the answers are not the same for specific questions 39a and 39b above: Why
did you change the way you make decisions since two years ago? (Give the three most important reasons.) (Enumerator: when all answers are the same, write NA)
LEI Report 2014-007 (Annexes) | 19

1. …………………………………………………………………………………………
2. ………………………………………………………………………………………… 3. …………………………………………………………………………………………
40 How do you decide how much fertilizer to apply on tea now, and how did you do so 2
years ago? (Enumerator, put relevant code in the box; multiple answers; fill every row)
Nr Way for decision-making on fertilizer application on tea
(more than one factor may contribute partly/wholly in making a decision)
Now (40a)
Two years ago (40b)
No = 0 Yes = 1
No = 0 Yes = 1
1 I apply the same amount per bush / hectare as my parents / neighbours do
2 I apply the same as last year 3 I always apply the same amount 4 I apply on the basis of the state of the tea bushes 5 I apply on the basis of recommendations by the factory 6 I apply on the basis of recommendations obtained in the
training
7 I apply on the basis of the records that I kept last year (analysed fertilizer input and yield relations)
8 I apply on the basis of my own experience 9 Other, please specify (one only) ……………….
…………………………………
41 How do you decide on how often to pluck tea (plucking frequency) now, and how did you
decide on this 2 years ago? (Enumerator, put relevant code in the box) Nr Way for decision-making on frequency of plucking (more
than one factor may partly/wholly contribute to making a decision)
Now (41a)
Two years ago (41b)
No = 0 Yes = 1
No = 0 Yes = 1
0 I pluck as often as my parents/neighbours/friends do 1 I pluck frequently as I did: ( last year); (….two yrs ago for
column 2)
2 I pluck on the basis of the state of the tea bushes 3 I pluck on the basis of recommendations by the factory 4 I pluck on the basis of recommendations obtained in the
training
5 I pluck on the basis of the records that I kept last year 6 I pluck on the basis of my own experience 7 Other, please specify (one only) ……………….
…………………………………
42 How do you decide how to handle (apply, store etc.) agro-chemicals now and how did
you do so 2 years ago? (Enumerator, put relevant code in the box; multiple answers; fill every row)
20 | LEI Report 2014-007 (Annexes)

Nr Way for decision-making Now
(42a) Two years ago (42b)
No = 0 Yes = 1
No = 0 Yes = 1
1 Based on advice from my parents/friends/neighbours 2 Based on what I did last year 3 Based on a routine 4 Based on recommendations by the TESA/FSC/factory 5 Based on requirements for RA certification 6 Based on what I learned from the training to make my
decisions
7 Based on the basis of my own experience 8 Other, please specify (one only) ……………….
…………………………………
C: Tea production We would like to know more about your tea production. 1a How many times was your tea rejected by the buying centre the last 12 months?
0 Never please skip question 1b 1 Less than 3 times 2 More than 3 times 3 I do not know 1b How many kilograms of your tea was rejected by the buying centre in the last 12
months?
…………………………………………………………………………………........................ 1c How many times was your tea rejected by the buying centre 2 years ago?
0 Never please skip question 1d 1 Less than 3 times 2 More than 3 times 3 I do not know 1d How many kilograms of your tea was rejected by the buying centre 2 years ago?
………………………………………………………………………………….........................
LEI Report 2014-007 (Annexes) | 21

2. Labour for tea (tea production within your household, not work for someone else)
Enumerator: Please fill out -999 when the farmer does not know. 1) How much time is spent on tea production? This can be both family and hired labour. We ask these questions for plucking weeding and pruning. The unit is different per activity. Example: for weeding we ask the days per year spent on weeding. 2) The cost of hired labour are in different units. Tea plucking is cost per kg of green leaves, while for other activities the costs per day or per bush should be stated. If the labour is family labour the costs are zero. Activity Quantity (0
when farmer/labourer did not spend time on activity)
Unit of measurement
Cost (Family labour cost = 0)
Per unit:
C2 Plucking 1b……………… Ksh/Kg green tea leaves
C2 Weeding
2a……………….. Days last year 2b……………… Per day
C2 Pruning
3a………………. Number of bushes last year
3b…………….. Ksh/ bush
C2 Applying fertilizer
4a………………. Number of bags applied last year
4b……………… Ksh/bag applied
Inputs used for tea production in the last 12 months (questions 4 until 9) 1) Please state the inputs used for your total tea area in the last 12 months. If the respondent
has difficulties answering this question ask him/her the quantity of these inputs they might have bought and if they finished all these inputs.
2) As different people might use different measures this question allows for different units in question 5 and 6: for example quantity 1, unit kg or quantity 0.5, unit litre.
3) Write down the cost for one unit 4) Give respondent time to think about any other inputs used for tea
22 | LEI Report 2014-007 (Annexes)

Enumerator: Please fill out -999 when the farmer does not know. And 0 when the farmer did not buy any fertilizer/chemicals/tea plants. Input Quantity used in
last 12 months 0, 1, 2, 3, ½, ¼, ¾ etc.
Unit:
Cost per unit input (may be 0)
Number of bushes receiving input
4. Fertilizer (chemical) List common/ trade names incl. composition (N,P,K): 1a. …………………………. 2a………..…………………. 3a……..……………………. 4a. ..……………………….
1b. ……… 2b……….. 3b……..… 4b. ..………
Bag Bag Bag Bag
1d…..…… 2d……….. 3d……..… 4d..………
1e. ……… 2e……….. 3e……..… 4e..………
5. Organic fertilisers, compost, manure List types, if any: 1a. …………………………. 2a………..…………………. 3a……..……………………. 4a. ..……………………….
Quantity in last 12 months 0, 1, 2, 3, ½, ¼, ¾ etc. 1b……… 2b……….. 3b……..… 4b. ..………
Unit 1c. ……… 2c……….. 3c……..… 4c. ..…….
Cost per unit input 1d…..…… 2d……….. 3d……..… 4d..………
Number of bushes receiving input 1e……… 2e……….. 3e……..… 4e..………
6. Other chemicals (pesticides/ herbicides/ insecticides), if any: List common/ trade names: 1a. …………………………. 2a………..…………………. 3a……..……………………. 4a. ..……………………......
Quantity in last 12 months 0, 1, 2, 3, ½, ¼, ¾ etc. 1b. ……… 2b……….. 3b……..… 4b. ..………
Unit: 1c. ……… 2c……….. 3c……..… 4c. ..…….
Cost per unit input 1d…..…… 2d……….. 3d……..… 4d..………
Number of bushes receiving input 1e……… 2e……….. 3e……..… 4e..………
7. New tea plants, if any 7b…………….
Number in last year:
7d……………
8. Other input used: 8a……………………………………
8b…………….. 8c………… 8d……………. 8e…………….
9. Other input used: 9a……………………………………
9b……………… 9c…………. 9d……………. 9e…………….
LEI Report 2014-007 (Annexes) | 23

10a Have you bought any Personal Protective Equipment for your tea or other production in
the 2012/2013 financial year? 0 No please continue with Section D on the next page 1 Yes 2 I do not know Enumerator: please add -999 in the table for 1a-7a and
continue with Section D on the next page
Please fill out -999 when the farmer does not know, and 0 when the question is not applicable (the farmer did not buy a certain PPE item); when a full PPE set row is filled, then fill 0 in row 1-6, column one)
10b. If yes, what did you buy? 1 Overall 2 Hat 3 Mask/respirator 4 Gumboots 5 Goggles 6 Apron/plucking cape/nylon bags/raincoat 7 Full PPE set
How many? 1a………….. 2a………….. 3a………….. 4a………….. 5a………….. 6a………….. 7a…………..
Piece Piece Piece Piece Piece Piece Piece
Cost per piece 1d.………… 2d…………. 3d…………. 4d…………. 5d…………. 6d………….. 7d………….
11 If you bought protective equipment (PPE) last year, why did you buy it?
(Enumerator: multiple answers are possible but do not read aloud to respondent) 0 I was taught in training that I can benefit from it 1 I need it for required practises for Rainforest Alliance or UTZ Certification 2 I have seen my neighbour / colleague farmer using it 3 I wanted to buy it for a long time but just recently got the required funds 4 It increases my status as a farmer 5 Other
12 Do you (or your labourers) use a tea harvesting machine for plucking tea?
0 No 1 Yes
D: Other sources of income in the last 12 months 1 Can you give an approximation of the percentage of income from tea production in total
household income, in the last 12 months? 0 100% please continue with question 4 1 Between 80 and 100% 2 Between 60 and 79% 3 Between 40 and 59% 4 Between 20 and 39% 5 Less than 20%
24 | LEI Report 2014-007 (Annexes)

2 Can you state your families’ sources of income, starting with the most important income
generation activity (excluding tea)? Can you give an approximation of the yearly income and costs from the activities?
Enumerators: you can use the bottom of the sheet to take notes before filling the table. Help respondents with possible sources of income: vegetables, fruit, grain, dairy, calves, pigs, rabbit, chicken. Remittances, retirement, business, employment, teaching, and more. Enumerators: write down -999 when the farmer does not know. And -888 when the farmer does not want to answer! (Every row must have an answer in column 1) D2 Income generating activities
from most to least important income generating activity
Yearly gross income from this activity (last 12 months)
Yearly costs from this activity (last 12 months)
Category I ii iii
0 = No 1 = Yes
D2.1.
a. Plant production (vegetable, fruit, grain etc.)
A c
d
D2.2.
a. Livestock (dairy, cows, chicken etc.)
A c
d
D2.3.
a. Business (trade, shop etc.)
A c
d
D2.4.
a. Employment A
c
d
D2.5.
a. Services (teaching, government etc.)
A
c
d
D2.6.
a. Remittances A
c
d
D2.7.
a. Retirement A
c
d
D2.8.
a. Other.... A
c
d
D2.9.
a. Other..... A
c
d
D2.10.
a. Other.... A
c
d
LEI Report 2014-007 (Annexes) | 25

3 Can you indicate the monthly income earned from all your activities except tea
production over the last 12 months? (Read answer options and ask farmer to select one)
1. Less than 2000 Ksh per month 2. Between 2000 and 5 000 ksh per month 3. Between 5 000 and 10 000 ksh per month 4. Between 10 000 and 15 000 ksh per month 5. Between 15 000 and 20 000 ksh per month 6. More than 20 000 ksh per month
4 Indicate whether you agree or disagree with the following statements: 4a I earn more income from tea production now than two years ago:
1. I do not agree, I earn less income from tea now than 2 year ago 2. I do not agree, I earn the same amount from tea now as 2 years ago 3. I agree 4. I do not know
4b I earn more income from other sources of income than tea production than two years
ago 1. I do not agree, I earn less income from other sources now than 2 year ago 2. I do not agree , I earn the same amount from other sources as 2 years ago 3. I agree 4. Not applicable: I do not have other sources of income now, and neither 2 years ago. 5. I do not know
5 Does your household have any loans / (micro)credit at this moment? 0 No please skip question 6 1 Yes 6 Whom has provided you with the loan / (micro) credit?
………………………………………………………………………………….........................
7 Does your household have any insurance (related to agricultural production) at this
moment? 0 No please skip question 8 1 Yes 8 With which organisation/company did you take out the insurance?
………………………………………………………………………………….........................
26 | LEI Report 2014-007 (Annexes)

9 How did you use the income from your tea farm last year?
(Enumerator: ask all options and record the relevant answer code in the box).
Nr Item No = 0 Yes = 1
0 Buying inputs / equipment for tea production 1 Buying inputs / equipment for other crops/animals 2 Hire labour for tea production 3 Hire labour for other crops/animals 4 Buy food 5 Medical bills for family 6 Education fees for children 7 Investment in business 8 Mobile phones 9 Buy home use items e.g. Radio/TV/sofa set 10 Other, please specify (maximum 3, most important uses of income)
……………….......................... ……………….......................... ………………..........................
E: Knowledge and skills learned 1. Answering options should not be read out to the households, options are for enumerators’
convenience only! 2. In this part it is encouraged that the enumerators stimulate the farmers to give more options
(time to think), but never mention the options! 3. Select the given option by circling the corresponding letter, more answer options can be selected 1 Can you mention some benefits of leaving prunings in the field?
1. To suppress weeds 2. To prevent soil erosion 3. To improve soil structure 4. Releases nutrients into the top soil at decomposition 5. Reduces loss of water by evaporation (mulch) 6. None of the above / I do not know
2 Can you mention the best height to prune mature tea?
1. Never below 20 inches 2. 2 inches above the former height 3. After reaching 28 inches, the bush should be down pruned to 21 inches 4. None of the above / I do not know
3 Can you mention reasons to prune tea?
1. To maintain a manageable plucking table 2. To rejuvenate the bush / increase production 3. To remove diseased, dead and knotted branches 4. None of the above / I do not know
LEI Report 2014-007 (Annexes) | 27

4 Can you mention some recommended methods to handle weeds in tea?
1. Slashing using panga 2. Use of plain jembe 3. Uprooting using hands 4. Use of round up for perennial weeds such as couch grass (new fields and young tea
only) 5. None of the above / I do not know
5 Can you mention benefits of fertilizer application to tea?
1. Get better yields of green leaf. 2. Get better quality of green leaf 3. Maintain the tea bush for a long time 4. Increase nutrients to soil/improve soil fertility. 5. None of the above / I do not know
6 Can you mention any benefits of plucking tea every 7 to 8 days (during normal
weather)? 1. To maintain good quality (older tea is of less quality; more than 2 leaves per bud) 2. To maintain enough yield (if leaves are plucked too early this leads to less yield; less
than 2 leaves per bud) 3. To maintain good plucking table 4. None of the above / I do not know
7 Can you mention any benefits of maintaining a plucking table? (A plucking table is the surface of the tea bush from which the farmer plucks the tea, 2 leaves and a bud.) 1. Yields increase when shoots can grow because they are not hindered by shade 2. Shoots are missed during plucking/ plucking goes faster with an even plucking table 3. None of the above / I do not know
8 Can you mention benefits from infilling? 1. Maximises the yield of land in tea production / increases yield 2. Reduces weeding efforts 3. None of the above / I do not know
9 Can you mention the best height for tipping-in tea?
1. 4 inches above pruning height 2. None of the above / I do not know
10 A Riparian strip is a strip of indigenous vegetation between rivers or other water bodies
and cultivated field. Can you mention benefits of a Riparian strip? 1. A riparian strip helps protect and conserve wetlands 2. A riparian strip helps prevent soil erosion 3. A riparian strip enriches biodiversity 4. A Riparian strip forms a buffer so that pollution cannot reach the water 5. None of the above / I do not know
11 What are the benefits of personal protective equipment (PPE)?
1. Protects your skin from being touched by chemicals 2. Protects you from inhaling chemicals 3. Protects your feet from chemicals 4. Prevents illness 5. None of the above / I do not know
28 | LEI Report 2014-007 (Annexes)

12 What are the potential dangers of applying agrochemicals and fertilizer near the natural
water bodies like rivers, streams, pools, ponds etc. ? 1. Kill the aquatic life (water plants and animals) 2. Kill the plants growing near the water body 3. Poison the people drinking water downstream 4. None of the above / I do not know
13 Why is application of agrochemicals discouraged in tea?
1. High cost of agrochemicals 2. Harmful effect on people 3. Risk of getting into made tea 4. Loss of market of tea 5. Harmful effect on environment 6. None of the above / I do not know
14 What methods can you use to improve the yield and quality of tea in your farm?
1. Application of the right fertilizer at the right time. 2. Regular plucking rounds 3. Maintaining the plucking table. 4. Training of pluckers 5. None of the above / I do not know
15 What are the benefits applying soil conservation measures?
1. Preserve soil fertility 2. Prevent loss of soil 3. Get high production 4. Prevent siltation in water bodies 5. None of the above / I do not know
F: Experiments, dissemination and diffusion of Good Agricultural
Practices 1 Have you experimented with or implemented any new agricultural practices or tools on
your land (for example on tea, new crops, other fertilizer) in the last year? 0 No skip question 2 (the table below). 1 Yes
2 New practice
1) Fill in any practices the farmer has experimented with, for instance new crop varieties, other fertilizer, more/less frequent maintenance, new tools, and new income generating activities).
2) Fill in if the farmer experimented alone or in a group. 3) Do not read aloud the possible reasons: let the respondents come up with reason
him/herself
What did the farmer experiment?
0=Alone or 1= in group
Reason (e.g. learned from neighbour, training or because of certification)
Tea related F2.1a
F2.1b
F2.1c
F2.2a
F2.2b
F2.2c
F2.3a
F2.3b
F2.3c
F2.4a
F2.4b
F2.4c
LEI Report 2014-007 (Annexes) | 29

What did the farmer experiment?
0=Alone or 1= in group
Reason (e.g. learned from neighbour, training or because of certification)
Not tea-related F2.5a
F2.5b
F2.5c
F2.6a
F2.6b
F2.6c
F2.7a
F2.7b
F2.7c
F2.8a
F2.8b
F2.8c
7 Did you share information on good agricultural practices that you or your household
member were taught during the FFS training over the last year? 0 No please go to question 9 1 Yes 8 If yes, did any of your friends, relatives or neighbours that you shared information with
(on FFS training) changed their tea production practices due to information they got from you? 0 No 1 Yes 2 I do not know
9 How often do your neighbours share information on good practices with you or your
household members? 1 Daily 2 Weekly 3 Monthly 4 Yearly 5 Never
30 | LEI Report 2014-007 (Annexes)

G: Social indicators 1 Can you indicate to what extend you are satisfied with the following issues. (Enumerator: mention each question: start with “how satisfied are you with the relation with ………” see options below, then put one code in the relevant box after the farmer answers) How satisfied are you with: 1: Very satisfied
2: Satisfied 3: Neutral 4: Unsatisfied 5: Very unsatisfied
a) The relation with your neighbours b) The relation with your family members c) The relation with the tea factory d) Knowledge on good tea management practice e) Leadership skills f) Access to information on agri commodity prices g) Access to self-help activities like Merry-go-rounds h) Diversification of income/ number of income sources i) Your homestead (house, access to water/electricity etc) j) Your families health k) Possibility to send children to school l) Family welfare m) Family income
That was the last question in this questionnaire. Thank you very much for your time and effort to help us understand more about tea production. Is there anything else you would like to tell us or ask us?
Do you have any comments or questions? …………………………………………………………………………………………………………………………………………….. ……………………………………………………………………………………………………………………………………………… ……………………………………………………………………………………………………………………………………………… …………………………………………………………………………………………………………………………………………….. ……………………………………………………………………………………………………………………………………………… ……………………………………………………………………………………………………………………………………………… Enumerator: please read through questionnaire to make sure no questions were left unanswered before leaving the farmer! (NO blanks are allowed.) Thank you!
LEI Report 2014-007 (Annexes) | 31

2.2 Impact Assessment Questionnaire: Gachege, Mudete
Enumerators, no blanks are allowed: Please fill out -999 when the farmer does not know. Please fill out NA when the question is not applicable to the farmer, and for questions on inputs
used a 0 when a farmer did not buy or use a certain input. KTDA Sustainable Agriculture Project A: Household identification + FFS A Date of interview (dd/mm/yyyy):………………… Start time: …………….. End time:……………… B Name of enumerator…………………………………………………………………………... C Name of Factory: …………………………………………………………………………….. 1 Factory grower number (2 letters for the factory, 3 numbers for buying centre, 4
numbers for grower number)
2 Name of the respondent (Enumerator: interview the person who attended FFS training
or the person in charge of tea production):
…………………………………………………………………………………........................
3a What is the gender of the respondent? (Circle correct number) 0 Female 1 Male
3b What is your year of birth?
…………………………………………………………………………………........................
3c How many years of education have you followed? (number of years, ‘I do not know’ = -999)
…………………………………………………………………………………........................
4 Is the respondent the household head? (Circle correct number)
0 No 1 Yes
5 How many people are part of your household? ……………………… 6 Did you sell tea in the July 2012/ June 2013 financial year?
0 No 1 Yes
32 | LEI Report 2014-007 (Annexes)

6b Did you sell tea between July 2013 and December 2013?
0 No 1 Yes
If the answers to both questions 6 and 6b are NO, then stop the interview and go to another farmer on your list 7 Are you a member of a Farmer Field School (FFS)?
0 No 1 No, but a family member is an FFS member 2 Yes 3 Not anymore
13 Have you been trained as a lead farmer by Rainforest Alliance? 0 No 1 Yes 14a If you are not a lead farmer, have you, or any person from your household attended
Rainforest Alliance certification training? 0 Nobody
1 Yes, me 2 Yes, somebody else (Q14b……….................................................... (Record
relationship) 3 I do not know 15a Have you or any member of your household participated in any other certification
scheme training or workshops, other than by Rainforest Alliance over the past 12 months? Trainings are defined as educational events; for instance, one-on-one training, group training, workshop, demonstration, training during TESA visit. (E.g. UTZ Certified, Fairtrade/FLO, ISO) 0 No
1 Yes, UTZ Certified 2 Yes, FLO/Fairtrade
3 Yes, ISO 4 Yes, I have received training to become certified, but I do not know for which
certificate 5 I do not know
15b Have you or any member of your household participated in any non-certification scheme
trainings or workshops over the past 12 months (trainings defined as educational events; for instance, one-on-one training, group training, workshop, demonstration, training during TESA visit)? 0 No
1 Yes Skip question 16 16 If no, what was the reason? 1) No training offered 2) Offered, but could not get to training, no transportation or resources 3) Offered, but other reasons for not attending (no time, not interested in topic).
LEI Report 2014-007 (Annexes) | 33

17 If yes, how many trainings (trainings defined as educational events; for instance, one on
one training, group training, workshop, demonstration, training during TESA visit) have you and other persons from your household attended in the past 12 months?
1) 1 training 2) Between 1-5 trainings 3) More than 5 trainings 4) I do not know 18 Did the person(s) that participated in training follow the following topics? (one-on-one
training, group training, workshop, demonstration, training during TESA visit)? Fill in 1 for yes or 0 for no in column 1. (If yes, who gave the training? Fill in codes 1 to 6).
Topics Attended
training on this topic? [0 = No, 1 = Yes, 2= Do not know]
Name the type of organization 1= factory 2= government 3= NGO 4= input supplier 5= Local individual (e.g. neighbour) 6= others 7 = I do not know
18a Crop production (for instance new crops)
a1………
a2i…………… a2ii ………………. a2iii………..
18b Health and safety (for instance HIV/AIDS, housekeeping, food)
b1………
b2i…………… b2ii ………………. b2iii………..
18c Farm management skills (for instance record keeping, economic decision making)
c1………
c2i…………… c2ii ………………. c2iii………..
18d Agro-chemical application (chemicals used for all farm activities)
d1……… d2i…………… d2ii ……………….
d2iii………..
18e Others/ combination of topics
e1…………
e2i…………… e2ii ………………. e2iii………..
19 Apart from information provided in the trainings, does the extension staff provide you
with information or services that helps you with your tea production? 1 No Please go to Section B on the next page 2 Yes please go to question 20 3 I don’t know Please go to question 20
34 | LEI Report 2014-007 (Annexes)

20 Can you name the services the factory provides you with and if you are satisfied with it /
them? (Instructions for enumerators: please read the options to the farmers and record one response/possible answer in each box according to the code)
Services by the Factory 1: Very satisfied 2: Satisfied 3: Neutral 4: Unsatisfied 5: Very unsatisfied 6: I do not know 7: Not applicable
20a Training 20b Market information on inputs 20c Market information on sales and prices (e.g. also of other crops than
tea)
20d Providing information about inspection results and corrective actions after Internal Inspections (Internal Management System)
20e Providing information about the external Inspections (audit) 20f Providing access to fertilizer 20g Providing access to seedlings, planting material 20h Providing access to pesticides 20i Providing access to (micro) credits 20j Insurance 20k Information on Group Commercial activities; sales and marketing
B: Implementation of sustainable practices
1. Answering options should not be read out to the households, options are for enumerators’ convenience only!
2. Select one answer option per question by circling the corresponding letter, apart from questions with questions which state multiple answers can be given
3. Do not give any additional information about the ‘right’ answers as we will be questioning knowledge later on.
Profit (questions are all related to tea) 1 How many times does your household pluck tea in the same tea plot per month (this
refers to a normal month- when there is no drought and it is not very cold)? 1. 4 times (every 7-8 days) 2. 3 times (every 10 days) 3. 2 times (every 2 weeks) 4. Less than twice (less than once every 2 weeks)
2 Where does your household experience leaf spillage at the farm, during transport to
buying centre or at the buying centre? 1. No spillage at all places 2. Spillage in all three places 3. Spillage at home only 4. Spillage at BC only 5. Spillage during transport
LEI Report 2014-007 (Annexes) | 35
3 Does your household use a plucking stick/wand? Is the table firm (Interviewer to
observe) 1. Use stick & table firm 2. Use stick table not firm 3. No stick table firm 4. No stick table not firm
4 If you or your household raise your own planting material: what is the success rate in
your nursery? 1. High (More than 80% success rate) 2. Mediate (Between 80% and 50% success rate) 3. Low (Less than 50% success rate) 4. N/A – i.e. no planting or infilling in the last few years, used external source, or
farmer does not want to tell. 5 What clones have been planted in your household’s nursery? (Enumerator: multiple answers can be circled)
1. Clones developed from own tea bushes (own nursery) 2. Clones received from neighbours/other farmers 3. Improved clones (VPS) from TRFK 4. Any other/ do not know which clones 5. N/A (no clones planted)
6 When are tea VP plants in-filled in the tea plots? (Enumerator: multiple answers can be circled)
1. During heavy rains. 2. During moderate/light rains. 3. During dry season. 4. None of the above.
7 What is the percentage crop cover (absence of gaps in the tea) on your farm
(interviewer to ask and observe)? 1. 90-100% 2. 75%- 90% 3. Less than 75% 4. I do not know
8 At what height is mature tea pruned?
1. 20 inches and above 2. Below 20 inches 3. N/A 4. Do not know
9 At what period are tea bushes pruned?
1. Dry season (January – March) 2. Wet season (April – May/ October - December) 3. Cold season (June – August) 4. Warm season (September)
10 How often is the same tea plot/block pruned?
1. Prune every 6 (or more) years 2. Prune every 3-5 years 3. Prune every 1 or 2 years
36 | LEI Report 2014-007 (Annexes)

11 What is the major tool used to prune the tea your household produces? (Enumerator:
multiple answers can be circled) 1. Use pruning knife 2. Use pruning machine 3. Other tools
12 Who prunes the tea bushes and have they been trained? (Enumerator: multiple
answers can be circled) 1. Untrained family member. 2. Trained family member. 3. Untrained non family member. 4. Trained non family member
13 At what height are your bushes tipped in? 1. More than 6 inches above pruning height 2. 4 to 6 inches above pruning height 3. Less than 4 inches above pruning height
14 How frequently do you apply composted manure in tea (= organic fertilizer)? 1. Never / do not apply 2. Less than once every three years 3. Every three years 4. More often than once every three years
15 How frequently do you apply chemical fertilizer in tea?
1. Once per year 2. Twice a year 3. More than twice per year 4. Never / Do not apply
16 Do you keep records on input use and production in tea?
1. Only records on production/sales 2. Only records on inputs 3. Records on input use and production 4. No records kept
People (question 17 about tea, other questions about the whole production system) 17 Who plucks your tea?
1. Only household members 2. Regular workers 3. Seasonal workers 4. Mixture of household members and workers
18 Do you hire workers? Do you have agreements with hired workers about pay and timing
of payment? 1. Yes, agreement in writing 2. Yes, oral agreements 3. No 4. I do not hire workers, only family members work on the farm please go to
question 19b
LEI Report 2014-007 (Annexes) | 37

19a Do your workers have access to easily accessible water for drinking and latrines?
1. Access to potable water 2. Access to latrines 3. Both 4. Neither
19b Does your household have access to easily accessible water for drinking and latrines?
1. Access to potable water 2. Access to latrines 3. Both 4. Neither
20 How often did your family or any of your workers need medical attention after injury on
the farm for example fractures or wounds requiring stitches, in the last 12 months? 1. More than three occasions 2. On one or two occasions 3. No occasions
21 When chemicals are sprayed, which personal protective equipment (PPE) does your
family or your workers use? 1. All PPE (Mask, gloves, boots, overall, goggles) 2. Some of the above PPE 3. No PPE 4. N/A (don’t spray)
22a Do you group together with other farmers to carry out certain activities e.g. sourcing of
fertilizer, leaf transport, plucking, learning visits to other farmers etc.? 1. Yes 2. No continue with question 23
22b If yes, do you group together with other farmers more frequent than 2 years ago?
1. Less frequent 2. Not more or less frequent than 2 years ago 3. More frequent 4. I do not know
23 Do you turn to KTDA if you experience any problems in your tea production?
1. Yes 2. No
24 Do your children go to school?
1. N/A, no, the children are too young or too old to go to school 2. No, some children are not going to school although they have the age to attend
primary or secondary school 3. Yes, all children in the age to attend primary or secondary school are attending
school 4. Yes, all children in the age to attend primary or secondary school are attending
school and one or more children are following college or university
38 | LEI Report 2014-007 (Annexes)

Planet 25 Do you collect prunings from the tea field?
1. No 2. Yes - use as mulch elsewhere on farm 3. Yes - use as fuel
26 Do you infill open areas in your tea (Interviewer to ask and observe)?
1. Yes 2. No 3. N/A (no gaps)
27 When do you apply fertilizer to your tea?
1. Apply fertiliser during moderate rains 2. Apply fertiliser during heavy rains 3. Apply fertiliser during dry periods 4. Apply fertilizer on another moment 5. Do not apply fertilizer
28 In case of chemical control in your tea (pesticides /herbicides /insecticides) how do you
apply the agrochemicals? 1. Blanket spraying 2. Edges/ spot spraying 3. Other 4. Do not use chemical control
29 Does your farm border a river or water body? If so, do you have a Riparian strip covered
by indigenous vegetation and how wide is it A Riparian strip is a strip of indigenous vegetation between rivers or other water bodies and cultivated field (Interviewer to ask and observe)? 1. No; farm does not border a river or water body 2. Yes, farm borders a river/ water body, but no Riparian strip 3. Yes, a strip less than 10 meter 4. Riparian strip wider than10 meters, but smaller than 30 meters 5. Riparian strip wider than 30 meter
30 Do you have indigenous trees on your farm? If so how many in total on your land?
1. More than 10 indigenous trees 2. Between 5 and 10 3. Less than 5 4. No native trees
31 If your farm borders a water stream, how many eucalyptus trees are growing within 10 meters of the water stream? 1. More than 50 trees 2. Between 20 and 50 trees 3. Between 5 and 20 trees 4. zero to 5 trees 5. N/A farm does not border river
32 if your farm borders a water body, what distance do you leave out without applying
agrochemicals and chemical fertilizer, compost and organic matter? 1. No area is left 2. 0 – 5 metres 3. 5 – 15 metres 4. Over 15 metres 5. N/A farm does not border a river
LEI Report 2014-007 (Annexes) | 39

33 How much area of the total farm is conservation area (area under indigenous trees/
natural vegetation)? 1. More than 10% 2. Between 2 % and 10% 3. Zero to 2 %
34 What is your main source of energy for domestic purposes?
1. Renewable firewood from Eucalyptus and Gravillea trees, electricity, solar, biogas 2. A mixture of sustainable and unsustainable (petroleum products, bottled gas, ….)
sources 3. Cutting down of indigenous trees 4. Petroleum products
35 What is your main source of water for domestic use? 1. River/ stream or spring 2. Tap 3. Harvested rainwater
36 How do you manage household waste water and effluent from livestock (interviewer to
observe if possible)? 1. Presence of soak pits/ waste pits; 2. Other ways of filtering water 3. Part of the waste in soak pits, part runs directly into farm 4. Discharge direct onto the farm or into waterways
37 How do you manage household solid waste?
1. No waste management in place 2. One pit for all waste 3. One pit for organic waste and one pit for other waste 4. More than two pits in place: non-organic waste is further separated, for instance for
plastic or glass 38 Is waste collected and taken elsewhere?
1. Glass, plastic and other waste is collected 2. One of three waste types is collected (either glass, or plastic, or other waste) 3. No, recycling options known but no transportation available 4. No, collection service is not available 5. N/A no waste pit available
40 | LEI Report 2014-007 (Annexes)

Decision-making in tea We also would like to ask you some questions on how you make decisions about tea production and management activities at the moment and how you made such decisions two years ago. (Enumerator: multiple options are possible, read the options aloud to the farmers and tick the relevant box). 39a How do you generally make decisions on tea production activities at the moment and
two years ago? (Enumerator, put relevant code in the box; every row must be filled; multiple answers possible as many factors contribute to making a decision)
Nr Way for decision-making on tea production (more than
one factor may contribute to making a decision) Now (39a)
Two years ago (39b)
No = 0 Yes = 1
No = 0 Yes = 1
0 Based on advice from my parents/friends/neighbours 1 Based on what I did last year 2 Based on a routine 3 Based on the state of my tea bushes/field(s) 4 Based on recommendations by the TESA/FSC/factory 5 Based on regular check of my records to see whether my
farm is doing well
6 Based on comparing my records with the records of my neighbours/friends/other farmer to see how my farm is doing
7 Based on what I learned from the training 8 Based on information on prices for tea and other crops 9 Based on comparing my production with figures with average
tea production in Kenya to see how my farm is doing
10 Based on my own experience 11 Other, please specify ……………….
…………………………………
39c If any of the answers are not the same for specific questions 39a and 39b above: Why
did you change the way you make decisions since two years ago? (Give the three most important reasons.) (Enumerator: when all answers are the same, write NA)
1…………………………………………………………………………………………
2………………………………………………………………………………………… 3…………………………………………………………………………………………
LEI Report 2014-007 (Annexes) | 41

40 How do you decide how much fertilizer to apply on tea now, and how did you do so 2
years ago? (Enumerator, put relevant code in the box; multiple answers; fill every row)
Nr Way for decision-making on fertilizer application on tea
(more than one factor may contribute partly/wholly in making a decision)
Now (40a)
Two years ago (40b)
No = 0 Yes = 1
No = 0 Yes = 1
1 I apply the same amount per bush / hectare as my parents / neighbours do
2 I apply the same as last year 3 I always apply the same amount 4 I apply on the basis of the state of the tea bushes 5 I apply on the basis of recommendations by the factory 6 I apply on the basis of recommendations obtained in the
training
7 I apply on the basis of the records that I kept last year (analysed fertilizer input and yield relations)
8 I apply on the basis of my own experience 9 Other, please specify (one only) ……………….
…………………………………
41 How do you decide on how often to pluck tea (plucking frequency) now, and how did you
decide on this 2 years ago? (Enumerator, put relevant code in the box) Nr Way for decision-making on frequency of plucking (more
than one factor may partly/wholly contribute to making a decision)
Now (41a)
Two years ago (41b)
No = 0 Yes = 1
No = 0 Yes = 1
0 I pluck as often as my parents/neighbours/friends do 1 I pluck frequently as I did: ( last year); (….two yrs ago for
column 2)
2 I pluck on the basis of the state of the tea bushes 3 I pluck on the basis of recommendations by the factory 4 I pluck on the basis of recommendations obtained in the
training
5 I pluck on the basis of the records that I kept last year 6 I pluck on the basis of my own experience 7 Other, please specify (one only) ……………….
…………………………………
42 | LEI Report 2014-007 (Annexes)

42 How do you decide how to handle (apply, store etc.) agro-chemicals now and how did
you do so 2 years ago? (Enumerator, put relevant code in the box; multiple answers; fill every row)
Nr Way for decision-making Now
(42a) Two years ago (42b)
No = 0 Yes = 1
No = 0 Yes = 1
1 Based on advice from my parents/friends/neighbours 2 Based on what I did last year 3 Based on a routine 4 Based on recommendations by the TESA/FSC/factory 5 Based on requirements for RA certification 6 Based on what I learned from the training to make my
decisions
7 Based on the basis of my own experience 8 Other, please specify (one only) ……………….
…………………………………
C: Tea production We would like to know more about your tea production. 1a How many times was your tea rejected by the buying centre the last 12 months?
0 Never please skip question 1b 1 Less than 3 times 2 More than 3 times 3 I do not know 1b How many kilograms of your tea was rejected by the buying centre in the last 12
months?
…………………………………………………………………………………........................ 1c How many times was your tea rejected by the buying centre 2 years ago?
0 Never please skip question 1d 1 Less than 3 times 2 More than 3 times 3 I do not know 1d How many kilograms of your tea was rejected by the buying centre 2 years ago?
………………………………………………………………………………….........................
LEI Report 2014-007 (Annexes) | 43

2. Labour for tea (tea production within your household, not work for
someone else)
Enumerator: Please fill out -999 when the farmer does not know. 4. How much time is spent on tea production? This can be both family and hired labour. We ask
these questions for plucking weeding and pruning. The unit is different per activity. Example: for weeding we ask the days per year spent on weeding.
5. The cost of hired labour are in different units. Tea plucking is cost per kg of green leaves, while for other activities the costs per day or per bush should be stated.
6. If the labour is family labour the costs are zero. Activity Quantity (0
when farmer/labourer did not spend time on activity)
Unit of measurement
Cost (Family labour cost = 0)
Per unit:
C2 Plucking 1b……………… Ksh/Kg green tea leaves
C2 Weeding
2a……………….. Days last year 2b……………… Per day
C2 Pruning
3a………………. Number of bushes last year
3b…………….. Ksh/ bush
C2 Applying fertilizer
4a………………. Number of bags applied last year
4b……………… Ksh/bag applied
Inputs used for tea production in the last 12 months (questions 4 until 9) 7. Please state the inputs used for your total tea area in the last 12 months. If the respondent has
difficulties answering this question ask him/her the quantity of these inputs they might have bought and if they finished all these inputs.
8. As different people might use different measures this question allows for different units in question 5 and 6: for example quantity 1, unit kg or quantity 0.5, unit litre.
9. Write down the cost for one unit 10. Give respondent time to think about any other inputs used for tea
44 | LEI Report 2014-007 (Annexes)
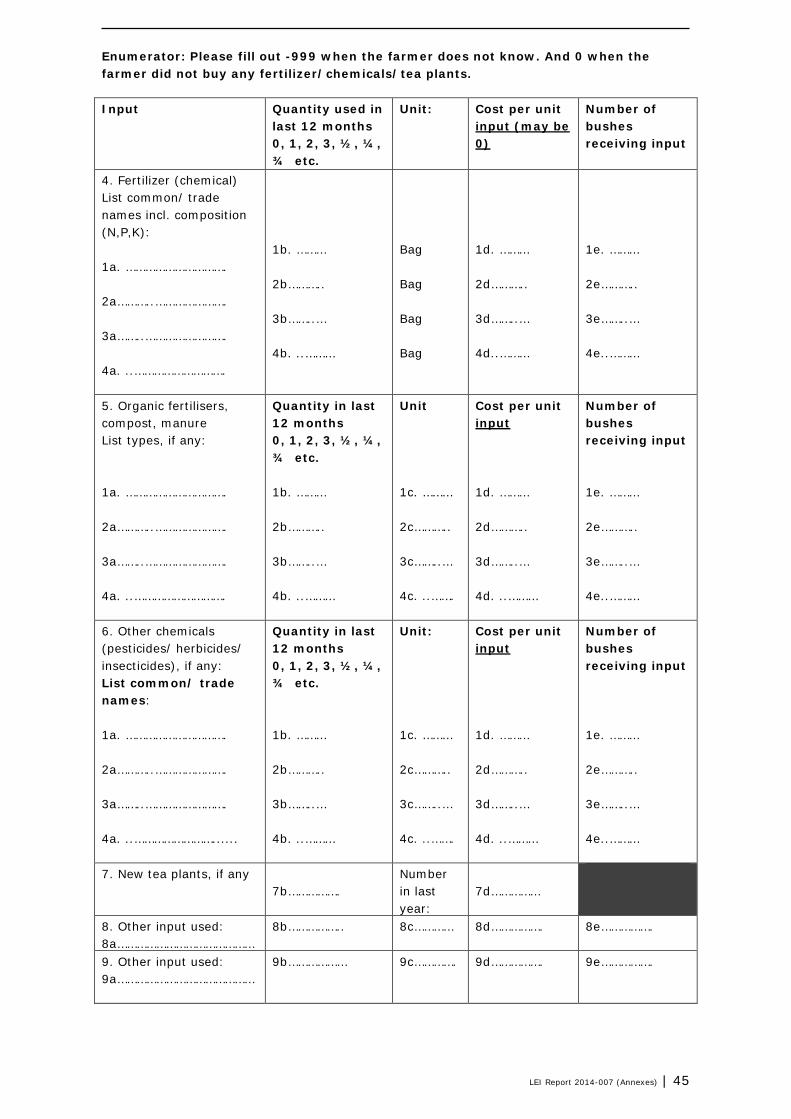
Enumerator: Please fill out -999 when the farmer does not know. And 0 when the farmer did not buy any fertilizer/chemicals/tea plants. Input Quantity used in
last 12 months 0, 1, 2, 3, ½, ¼, ¾ etc.
Unit:
Cost per unit input (may be 0)
Number of bushes receiving input
4. Fertilizer (chemical) List common/ trade names incl. composition (N,P,K): 1a. …………………………. 2a………..…………………. 3a……..……………………. 4a. ..……………………….
1b. ……… 2b……….. 3b……..… 4b. ..………
Bag Bag Bag Bag
1d. ……… 2d……….. 3d……..… 4d..………
1e. ……… 2e……….. 3e……..… 4e..………
5. Organic fertilisers, compost, manure List types, if any: 1a. …………………………. 2a………..…………………. 3a……..……………………. 4a. ..……………………….
Quantity in last 12 months 0, 1, 2, 3, ½, ¼, ¾ etc. 1b. ……… 2b……….. 3b……..… 4b. ..………
Unit 1c. ……… 2c……….. 3c……..… 4c. ..…….
Cost per unit input 1d. ……… 2d……….. 3d……..… 4d. ..………
Number of bushes receiving input 1e. ……… 2e……….. 3e……..… 4e..………
6. Other chemicals (pesticides/ herbicides/ insecticides), if any: List common/ trade names: 1a. …………………………. 2a………..…………………. 3a……..……………………. 4a. ..……………………......
Quantity in last 12 months 0, 1, 2, 3, ½, ¼, ¾ etc. 1b. ……… 2b……….. 3b……..… 4b. ..………
Unit: 1c. ……… 2c……….. 3c……..… 4c. ..…….
Cost per unit input 1d. ……… 2d……….. 3d……..… 4d. ..………
Number of bushes receiving input 1e. ……… 2e……….. 3e……..… 4e..………
7. New tea plants, if any 7b…………….
Number in last year:
7d……………
8. Other input used: 8a……………………………………
8b…………….. 8c………… 8d……………. 8e…………….
9. Other input used: 9a……………………………………
9b……………… 9c…………. 9d……………. 9e…………….
LEI Report 2014-007 (Annexes) | 45

10a Have you bought any Personal Protective Equipment for your tea or other production in
the 2012/2013 financial year? 0 No please continue with Section D on the next page 1 Yes 2 I do not know Enumerator: please add -999 in the table for 1a-7a and
continue with Section D on the next page
Please fill out -999 when the farmer does not know, and 0 when the question is not applicable (the farmer did not buy a certain PPE item); when a full PPE set row is filled, then fill 0 in row 1-6, column one)
10b. If yes, what did you buy? 1 Overall 2 Hat 3 Mask/respirator 4 Gumboots 5 Goggles 6 Apron/plucking cape/nylon bags/raincoat 7 Full PPE set
How many? 1a………….. 2a………….. 3a………….. 4a………….. 5a………….. 6a………….. 7a…………..
Piece Piece Piece Piece Piece Piece Piece
Cost per piece 1d.………… 2d…………. 3d…………. 4d…………. 5d…………. 6d………….. 7d………….
11 If you bought protective equipment (PPE) last year, why did you buy it?
(Enumerator: multiple answers are possible but do not read aloud to respondent) 0 I was taught in training that I can benefit from it 1 I need it for required practises for Rainforest Alliance or UTZ Certification 2 I have seen my neighbour / colleague farmer using it 3 I wanted to buy it for a long time but just recently got the required funds 4 It increases my status as a farmer 5 Other
12 Do you (or your labourers) use a tea harvesting machine for plucking tea?
0 No 1 Yes
46 | LEI Report 2014-007 (Annexes)

D: Other sources of income in the last 12 months 1 Can you give an approximation of the percentage of income from tea production in total
household income, in the last 12 months? 0 100% please continue with question 4 1 Between 80 and 100% 2 Between 60 and 79% 3 Between 40 and 59% 4 Between 20 and 39% 5 Less than 20% 2 Can you state your families’ sources of income, starting with the most important income
generation activity (excluding tea)? Can you give an approximation of the yearly income and costs from the activities?
Enumerators: you can use the bottom of the sheet to take notes before filling the table. Help respondents with possible sources of income: vegetables, fruit, grain, dairy, calves, pigs, rabbit, chicken. Remittances, retirement, business, employment, teaching, and more. Enumerators: write down -999 when the farmer does not know. And -888 when the farmer does not want to answer! (Every row must have an answer in column 1) D2 Income generating activities
from most to least important income generating activity
Yearly gross income from this activity (last 12 months)
Yearly costs from this activity (last 12 months)
Category I ii iii
0 = No 1 = Yes
D2.1.
a. Plant production (vegetable, fruit, grain etc.)
A c
d
D2.2.
a. Livestock (dairy, cows, chicken etc.)
A c
d
D2.3.
a. Business (trade, shop etc.)
A c
d
D2.4.
a. Employment A
c
d
D2.5.
a. Services (teaching, government etc.)
A
c
d
D2.6.
a. Remittances A
c
d
D2.7.
a. Retirement A
c
d
D2.8.
a. Other.... A
c
d
D2.9.
a. Other.....
A c d
LEI Report 2014-007 (Annexes) | 47

D2 Income generating activities
from most to least important income generating activity
Yearly gross income from this activity (last 12 months)
Yearly costs from this activity (last 12 months)
Category I ii iii
0 = No 1 = Yes
D2.10.
a. Other.... A
c
d
3 Can you indicate the monthly income earned from all your activities except tea
production over the last 12 months? (Read answer options and ask farmer to select one)
1. Less than 2000 Ksh per month 2. Between 2000 and 5 000 ksh per month 3. Between 5 000 and 10 000 ksh per month 4. Between 10 000 and 15 000 ksh per month 5. Between 15 000 and 20 000 ksh per month 6. More than 20 000 ksh per month
4 Indicate whether you agree or disagree with the following statements: 4a I earn more income from tea production now than two years ago:
1. I do not agree, I earn less income from tea now than 2 year ago 2. I do not agree, I earn the same amount from tea now as 2 years ago 3. I agree 4. I do not know
4b I earn more income from other sources of income than tea production than two years
ago 1. I do not agree, I earn less income from other sources now than 2 year ago 2. I do not agree , I earn the same amount from other sources as 2 years ago 3. I agree 4. Not applicable: I do not have other sources of income now, and neither 2 years ago. 5. I do not know
5 Does your household have any loans / (micro)credit at this moment? 0 No please skip question 6 1 Yes 6 Whom has provided you with the loan / (micro) credit?
………………………………………………………………………………….........................
7 Does your household have any insurance (related to agricultural production) at this
moment? 0 No please skip question 8 1 Yes 8 With which organisation/company did you take out the insurance?
………………………………………………………………………………….........................
48 | LEI Report 2014-007 (Annexes)

9 How did you use the income from your tea farm last year?
(Enumerator: ask all options and record the relevant answer code in the box).
Nr Item No = 0 Yes = 1
0 Buying inputs / equipment for tea production 1 Buying inputs / equipment for other crops/animals 2 Hire labour for tea production 3 Hire labour for other crops/animals 4 Buy food 5 Medical bills for family 6 Education fees for children 7 Investment in business 8 Mobile phones 9 Buy home use items e.g. Radio/TV/sofa set 10 Other, please specify (maximum 3, most important uses of income)
……………….......................... ……………….......................... ………………..........................
E: Knowledge and skills learned 11. 1.Answering options should not be read out to the households, options are for enumerators’
convenience only! 12. 2. In this part it is encouraged that the enumerators stimulate the farmers to give more options
(time to think), but never mention the options! 13. 3. Select the given option by circling the corresponding letter, more answer options can be
selected 1 Can you mention some benefits of leaving prunings in the field?
1. To suppress weeds 2. To prevent soil erosion 3. To improve soil structure 4. Releases nutrients into the top soil at decomposition 5. Reduces loss of water by evaporation (mulch) 6. None of the above / I do not know
2 Can you mention the best height to prune mature tea?
1. Never below 20 inches 2. 2 inches above the former height 3. After reaching 28 inches, the bush should be down pruned to 21 inches 4. None of the above / I do not know
3 Can you mention reasons to prune tea?
1. To maintain a manageable plucking table 2. To rejuvenate the bush / increase production 3. To remove diseased, dead and knotted branches 4. None of the above / I do not know
LEI Report 2014-007 (Annexes) | 49

4 Can you mention some recommended methods to handle weeds in tea?
1. Slashing using panga 2. Use of plain jembe 3. Uprooting using hands 4. Use of round up for perennial weeds such as couch grass (new fields and young tea
only) 5. None of the above / I do not know
5 Can you mention benefits of fertilizer application to tea?
1. Get better yields of green leaf. 2. Get better quality of green leaf 3. Maintain the tea bush for a long time 4. Increase nutrients to soil/improve soil fertility. 5. None of the above / I do not know
6 Can you mention any benefits of plucking tea every 7 to 8 days (during normal
weather)? 1. To maintain good quality (older tea is of less quality; more than 2 leaves per bud) 2. To maintain enough yield (if leaves are plucked too early this leads to less yield; less
than 2 leaves per bud) 3. To maintain good plucking table 4. None of the above / I do not know
7 Can you mention any benefits of maintaining a plucking table? (A plucking table is the surface of the tea bush from which the farmer plucks the tea, 2 leaves and a bud.) 1. Yields increase when shoots can grow because they are not hindered by shade 2. Shoots are missed during plucking/ plucking goes faster with an even plucking table 3. None of the above / I do not know
8 Can you mention benefits from infilling? 1. Maximises the yield of land in tea production / increases yield 2. Reduces weeding efforts 3. None of the above / I do not know
9 Can you mention the best height for tipping-in tea?
1. 4 inches above pruning height 2. None of the above / I do not know
10 A Riparian strip is a strip of indigenous vegetation between rivers or other water bodies
and cultivated field. Can you mention benefits of a Riparian strip? 1. A riparian strip helps protect and conserve wetlands 2. A riparian strip helps prevent soil erosion 3. A riparian strip enriches biodiversity 4. A Riparian strip forms a buffer so that pollution cannot reach the water 5. None of the above / I do not know
11 What are the benefits of personal protective equipment (PPE)?
1. Protects your skin from being touched by chemicals 2. Protects you from inhaling chemicals 3. Protects your feet from chemicals 4. Prevents illness 5. None of the above / I do not know
50 | LEI Report 2014-007 (Annexes)

12 What are the potential dangers of applying agrochemicals and fertilizer near the natural
water bodies like rivers, streams, pools, ponds etc. ? 1. Kill the aquatic life (water plants and animals) 2. Kill the plants growing near the water body 3. Poison the people drinking water downstream 4. None of the above / I do not know
13 Why is application of agrochemicals discouraged in tea?
1. High cost of agrochemicals 2. Harmful effect on people 3. Risk of getting into made tea 4. Loss of market of tea 5. Harmful effect on environment 6. None of the above / I do not know
14 What methods can you use to improve the yield and quality of tea in your farm?
1. Application of the right fertilizer at the right time. 2. Regular plucking rounds 3. Maintaining the plucking table. 4. Training of pluckers 5. None of the above / I do not know
15 What are the benefits applying soil conservation measures?
1. Preserve soil fertility 2. Prevent loss of soil 3. Get high production 4. Prevent siltation in water bodies 5. None of the above / I do not know
F: Experiments, dissemination and diffusion of Good Agricultural Practices 1 Have you experimented with or implemented any new agricultural practices or tools on
your land (for example on tea, new crops, other fertilizer) in the last year? 0 No skip question 2 (the table below). 1 Yes
2 New practice 14. Fill in any practices the farmer has experimented with, for instance new crop varieties, other
fertilizer, more/less frequent maintenance, new tools, and new income generating activities). 15. Fill in if the farmer experimented alone or in a group. 16. Do not read aloud the possible reasons: let the respondents come up with reason him/herself
What did the farmer experiment?
0=Alone or 1= in group
Reason (e.g. learned from neighbour, training or because of certification)
Tea related F2.1a
F2.1b
F2.1c
F2.2a
F2.2b
F2.2c
F2.3a
F2.3b
F2.3c
F2.4a
F2.4b
F2.4c
LEI Report 2014-007 (Annexes) | 51

What did the farmer experiment?
0=Alone or 1= in group
Reason (e.g. learned from neighbour, training or because of certification)
Not tea-related F2.5a
F2.5b
F2.5c
F2.6a
F2.6b
F2.6c
F2.7a
F2.7b
F2.7c
F2.8a
F2.8b
F2.8c
7 Did you share information on good agricultural practices that you or your household
member were taught during the FFS training over the last year? 0 No please go to question 9 1 Yes 8 If yes, did any of your friends, relatives or neighbours that you shared information with
(on FFS training) changed their tea production practices due to information they got from you? 0 No 1 Yes 2 I do not know
9 How often do your neighbours share information on good practices with you or your
household members? 1 Daily 2 Weekly 3 Monthly 4 Yearly 5 Never
52 | LEI Report 2014-007 (Annexes)

G: Social indicators 1 Can you indicate to what extend you are satisfied with the following issues. (Enumerator: mention each question: start with “how satisfied are you with the relation with ………” see options below, then put one code in the relevant box after the farmer answers) How satisfied are you with: 1: Very satisfied
2: Satisfied 3: Neutral 4: Unsatisfied 5: Very unsatisfied
a) The relation with your neighbours b) The relation with your family members c) The relation with the tea factory d) Knowledge on good tea management practice e) Leadership skills f) Access to information on agri commodity prices g) Access to self-help activities like Merry-go-rounds h) Diversification of income/ number of income sources i) Your homestead (house, access to water/electricity etc) j) Your families health k) Possibility to send children to school l) Family welfare m) Family income
That was the last question in this questionnaire. Thank you very much for your time and effort to help us understand more about tea production. Is there anything else you would like to tell us or ask us?
Do you have any comments or questions? …………………………………………………………………………………………………………………………………………….. ……………………………………………………………………………………………………………………………………………… ……………………………………………………………………………………………………………………………………………… …………………………………………………………………………………………………………………………………………….. ……………………………………………………………………………………………………………………………………………… ……………………………………………………………………………………………………………………………………………… Enumerator: please read through questionnaire to make sure no questions were left unanswered before leaving the farmer! (NO blanks are allowed.) Thank you!
LEI Report 2014-007 (Annexes) | 53

3 Bas
ic c
hara
cter
istic
s of
res
pond
ents
fro
m t
he T
ESA-l
ed F
FS
Tabl
e 1
Bas
ic c
hara
cter
istic
s of
res
pond
ents
fro
m t
he T
ESA-l
ed F
FS
Gro
up
Non
-FFS
FFS
To
tal
C
har
acte
rist
ics
N
Mea
n
Med
ian
S
td.
D
evia
tio
n
N
Mea
n
Med
ian
S
td.
D
evia
tio
n
N
Mea
n
Med
ian
S
td.
D
evia
tio
n
Age
78
51
.3
50.5
14
.7
230
50.3
50
.0
13.1
30
8 50
.6
50.0
13
.5
Year
of
educ
atio
n 78
8.
3 8.
0 4.
0 23
0 8.
7 8.
0 3.
3 30
8 8.
6 8.
0 3.
5 H
ouse
hold
siz
e 78
5.
6 5.
0 5.
4 23
0 5.
6 5.
0 2.
7 30
8 5.
6 5.
0 3.
6 Te
a pl
antin
g ar
ea (
ha)
75
.35
.25
.55
218
.45
.25
.59
293
.42
.25
.58
Gen
der
(% f
emal
e)
78
47.4
%
230
38.7
%
308
40.9
%
Perc
enta
ge R
A-t
rain
ed
78
28.2
%
230
77.8
%
308
65.2
%
LEI
Rep
ort
2014
-007
(Ann
exes
) | 5
4

4 Key
per
form
ance
indi
cato
rs o
f re
spon
dent
s fr
om T
ESA-l
ed F
FS
Tabl
e 2
Key
per
form
ance
indi
cato
rs p
er y
ear
per
grou
p (2
014)
Gro
up
S
tati
stic
s K
PI
(Yea
r=2
01
4)
Kn
ow
led
ge
sco
re
Imp
lem
enta
tio
n
sco
re
Nu
mb
er o
f b
ush
es
Tea
gre
en l
eaf
sold
(kg
) R
even
ue
fro
m
tea
gre
en l
eaf
sale
s (K
sh)
Gro
ss m
arg
in
fro
m t
ea
pro
du
ctio
n
(Ksh
)
Rev
enu
e fr
om
o
ther
in
com
e so
urc
es (
Ksh
)
Gro
ss m
arg
in
fro
m o
ther
in
com
e so
urc
es
(Ksh
) N
on
-FFS
N
78
78
75
75
75
75
78
78
Mea
n 5.
72
6.59
15
97.1
25
62.7
11
9682
.0
8863
6.1
3173
9.7
1755
7.0
M
edia
n 5.
18
6.54
10
75.0
21
30.6
89
057.
0 66
778.
0 30
00.0
0.
0
Std
. D
evia
tion
2.
06
0.88
15
88.9
21
06.0
10
4023
.8
8763
5.5
1046
39.7
49
209.
6
min
2.
62
4.48
30
4 8.
4 34
6.08
-2
6162
0
-132
00
m
ax
9.40
8.
23
1200
0 10
219
5043
07.6
49
1233
.6
8400
00
3326
00
FFS
N
23
0 23
0 21
9 21
9 21
9 21
9 23
0 23
0
Mea
n 6.
61
7.34
21
38.7
32
45.8
14
0000
.0
1082
78.4
12
0100
.3
8859
6.3
M
edia
n 6.
42
7.39
15
00.0
20
53.3
91
239.
0 70
384.
8 30
000.
0 16
450.
0
Std
. D
evia
tion
1.
82
0.65
20
85.4
41
74.2
16
3361
.6
1433
07.1
44
1139
.0
4284
15.4
min
2.
90
5.27
29
9 3.
9 16
0.68
-9
9410
0
-830
00
m
ax
10.0
0 8.
77
1670
0 32
602
1238
876
1228
410
6170
035
6117
035
To
tal
N
308
308
294
294
294
294
308
308
M
ean
6.39
7.
15
2000
.6
3071
.5
1348
16.9
10
3267
.6
9772
3.3
7060
5.8
M
edia
n 6.
34
7.26
14
17.5
20
92.0
91
159.
9 69
352.
4 20
000.
0 11
000.
0
Std
. D
evia
tion
1.
92
0.79
19
82.2
41
3764
.7
1505
57.3
13
1503
.8
3865
07.4
37
2118
.7
m
in
2.62
4.
48
299
3.9
160.
68
-994
10
0 -8
3000
max
10
.00
8.77
16
700
3260
2 12
3887
6 12
2841
0 61
7003
5 61
1703
5 D
iffer
ence
in m
ean*
(F
FS-
Non
-FFS
) 0
.89
0
.75
5
41
.7
683.
0 20
318.
0 19
642.
3 88
360.
6 71
039.
3
*Diff
eren
ces
in b
old
are
stat
istica
lly s
igni
fican
t (p
<0.
05)
LEI
Rep
ort
2014
-007
(Ann
exes
) | 5
5
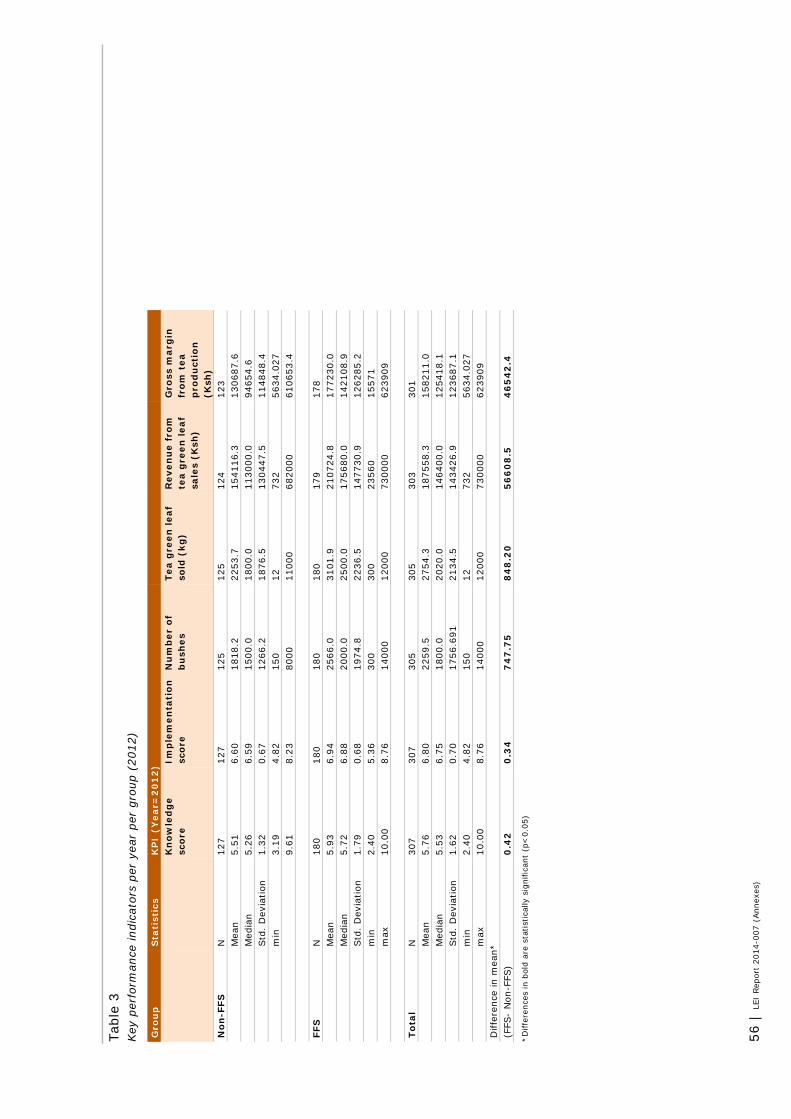
Tabl
e 3
Key
per
form
ance
indi
cato
rs p
er y
ear
per
grou
p (2
012)
Gro
up
S
tati
stic
s K
PI
(Yea
r=2
01
2)
Kn
ow
led
ge
sco
re
Imp
lem
enta
tio
n
sco
re
Nu
mb
er o
f b
ush
es
Tea
gre
en l
eaf
sold
(kg
) R
even
ue
fro
m
tea
gre
en l
eaf
sale
s (K
sh)
Gro
ss m
arg
in
fro
m t
ea
pro
du
ctio
n
(Ksh
) N
on
-FFS
N
12
7 12
7 12
5 12
5 12
4 12
3
Mea
n 5.
51
6.60
18
18.2
22
53.7
15
4116
.3
1306
87.6
Med
ian
5.26
6.
59
1500
.0
1800
.0
1130
00.0
94
654.
6
Std
. D
evia
tion
1.
32
0.67
12
66.2
18
76.5
13
0447
.5
1148
48.4
min
3.
19
4.82
15
0 12
73
2 56
34.0
27
9.61
8.
23
8000
11
000
6820
00
6106
53.4
FF
S
N
180
180
180
180
179
178
M
ean
5.93
6.
94
2566
.0
3101
.9
2107
24.8
17
7230
.0
M
edia
n 5.
72
6.88
20
00.0
25
00.0
17
5680
.0
1421
08.9
Std
. D
evia
tion
1.
79
0.68
19
74.8
22
36.5
14
7730
.9
1262
85.2
min
2.
40
5.36
30
0 30
0 23
560
1557
1
max
10
.00
8.76
14
000
1200
0 73
0000
62
3909
T
ota
l N
30
7 30
7 30
5 30
5 30
3 30
1
Mea
n 5.
76
6.80
22
59.5
27
54.3
18
7558
.3
1582
11.0
Med
ian
5.53
6.
75
1800
.0
2020
.0
1464
00.0
12
5418
.1
Std
. D
evia
tion
1.
62
0.70
17
56.6
91
2134
.5
1434
26.9
12
3687
.1
m
in
2.40
4.
82
150
12
732
5634
.027
max
10
.00
8.76
14
000
1200
0 73
0000
62
3909
D
iffer
ence
in m
ean*
(F
FS-
Non
-FFS
) 0
.42
0
.34
7
47
.75
8
48
.20
5
66
08
.5
46
54
2.4
*Diff
eren
ces
in b
old
are
stat
istica
lly s
igni
fican
t (p
<0.
05)
56 |
LEI
Rep
ort
2014
-007
(Ann
exes
)

Tabl
e 4
Key
per
form
ance
indi
cato
rs p
er y
ear
per
grou
p (2
010)
Gro
up
S
tati
stic
s K
PI
(Yea
r=2
01
0)
Kn
ow
led
ge
sco
re
Imp
lem
enta
tio
n
sco
re
Nu
mb
er o
f b
ush
es
Tea
gre
en l
eaf
sold
(kg
) R
even
ue
fro
m
tea
gre
en l
eaf
sale
s (K
sh)
Gro
ss m
arg
in
fro
m t
ea
pro
du
ctio
n
(Ksh
) N
on
-FFS
N
12
7 12
8 12
8 12
6 12
6 12
5
Mea
n 4.
83
5.79
17
11.6
21
34.7
88
009.
7 62
775.
0
Med
ian
4.64
5.
82
1400
.0
1500
.0
6226
5.0
4366
5.0
Std
. D
evia
tion
1.
35
0.75
12
88.8
20
50.0
81
668.
4 63
170.
1
min
2.
04
4.15
15
0 24
0 95
88
3760
7.
88
7.21
80
00
1400
0 53
6200
42
6350
FF
S
N
179
180
179
178
178
177
M
ean
4.87
5.
98
2470
.5
2997
.0
1209
60.0
86
097.
7
Med
ian
4.49
6.
02
2000
.0
2500
.0
9845
2.0
7010
0.0
Std
. D
evia
tion
1.
47
0.68
19
37.1
25
77.6
10
0500
.5
7520
5.2
m
in
2.04
4.
37
250
130
4979
32
50
m
ax
9.09
7.
45
1260
0 17
600
6740
80
5176
00
To
tal
N
306
308
307
304
304
302
M
ean
4.86
5.
90
2154
.1
2639
.6
1073
03.0
76
444.
3
Med
ian
4.54
5.
92
1760
.0
2000
.0
8755
2.0
6178
5.0
Std
. D
evia
tion
1.
42
0.71
17
35.6
68
2407
.5
9442
5.1
7129
7.7
m
in
2.04
4.
15
150
130
4979
32
50
m
ax
9.09
7.
45
1260
0 17
600
6740
80
5176
00
Diff
eren
ce in
mea
n*
(FFS
- N
on-F
FS)
0.04
0
.19
7
58
.9
86
2.3
3
29
50
.3
23
32
2.7
*Diff
eren
ces
in b
old
are
stat
istica
lly s
igni
fican
t (p
<0.
05)
LEI
Rep
ort
2014
-007
(Ann
exes
) | 5
7

Tabl
e 5
Impl
emen
tatio
n sc
ore
assi
gned
to
diff
eren
t an
swer
s to
que
stio
ns o
n su
stai
nabl
e pr
actic
es
Qu
est
ion
no
. Q
ue
stio
n o
n s
ust
ain
able
pra
ctic
es
Scor
e to
dif
fere
nt a
nsw
ers
1
2
3
4
5
B1
How
oft
en p
luck
per
mon
th?
10
7 2
0 0
B2
Expe
rien
ce le
af s
pilla
ge a
t fa
rm o
r bu
ying
cen
tre?
10
0
3 3
3 B3
Use
plu
ckin
g st
ick/
wan
d, t
able
firm
? 10
5
8 0
0 B4
Suc
cess
rat
e yo
ur n
urse
ry?
10
5 0
5 0
B6
Whe
n pl
ant
VP
plan
ts?
5 10
0
0 0
B7
Wha
t is
the
% o
f cr
op c
over
? 10
8
4 0
0 B8
At
wha
t he
ight
do
you
prun
e?
10
0 0
0 0
B9
At
wha
t pe
riod
do
you
prun
e 0
0 10
0
0 B10
H
ow o
ften
do
you
prun
e sa
me
tea
plot
/blo
ck?
4 10
6
0 0
B11
W
hat
tool
s ar
e us
ed t
o pr
une
your
tea
? 6
10
0 0
0 B12
W
ho p
rune
s th
e te
a an
d ha
ve t
hey
been
tra
ined
? 0
10
0 10
0
B13
At
wha
t he
ight
do
you
tip in
? 2
10
2 0
0 B14
H
ow o
ften
app
ly c
ompo
sted
man
ure
t?
0 4
10
6 0
B15
H
ow f
requ
ently
do
you
appl
y fe
rtili
zer
10
0 0
0 0
B16
D
o yo
u ke
ep r
ecor
ds?
5 5
10
0 0
B17
W
ho p
luck
s yo
ur t
ea?
8 10
0
5 0
B18
D
o yo
u ha
ve a
fix
ed
agre
emen
t w
ith e
mpl
oyee
s?
10
0 5
0 0
B19
D
o yo
ur w
orke
rs h
ave
acce
ss t
o po
tabl
e w
ater
and
latr
ines
5
5 10
0
0 B20
H
ow o
ften
did
you
r fa
mily
or
wor
kers
nee
d m
edic
al a
tten
tion
0 2
10
0 0
B21
D
o yo
u us
e an
y pe
rson
al p
rote
ctiv
e eq
uipm
ent
(PPE
)?
10
5 0
10
0 B22
D
o yo
u gr
oup
toge
ther
with
oth
ers
farm
ers
to c
arry
out
act
iviti
es
10
0 0
0 0
B23
D
o yo
u tu
rn t
o KTD
A if
you
exp
erie
nce
any
prob
lem
s in
you
r te
a pr
oduc
tion?
10
0
0 0
0 B24
D
o yo
ur c
hild
ren
go t
o sc
hool
? 5
0 8
10
0 B25
D
o yo
u co
llect
pru
ning
s fr
om t
he t
ea f
ield
? 10
5
0 0
0 B26
D
o yo
u in
fill o
pen
area
s?
10
0 5
0 0
B27
W
hen
do y
ou a
pply
fer
tiliz
er t
o yo
ur t
ea?
10
0 0
0 0
B28
H
ow d
o yo
u sp
ray?
0
10
2 10
0
B29
D
oes
your
far
m b
orde
r a
rive
r or
wat
er b
ody?
5
0 8
10
0 B30
D
o yo
u ha
ve in
dige
nous
tre
es o
n yo
u fa
rm?
10
6 3
0 0
B31
H
ow m
any
euca
lypt
us t
rees
gro
w w
ithin
10
met
ers
from
wat
er?
0 2
4 10
5
B32
If
you
r fa
rm b
orde
rs a
wat
er b
ody,
dis
tanc
e sp
ray
from
wat
er?
0 2
8 10
5
B33
H
ow m
uch
area
of
the
tota
l far
m is
con
serv
atio
n ar
ea?
10
8 4
0 0
B34
W
hat
is y
our
mai
n so
urce
of en
ergy
for
dom
estic
pur
pose
s?
10
5 0
4 0
B35
W
hat
is y
our
mai
n so
urce
of
wat
er for
dom
estic
use?
4
5 10
0
0 B36
H
ow d
o yo
u m
anag
e ho
useh
old
was
te w
ater
and
eff
luen
t fr
om li
vest
ock?
10
8
5 0
0 B37
H
ow d
o yo
u m
ange
hou
seho
ld s
olid
was
te?
0 4
8 10
0
B38
W
aste
is c
olle
cted
and
tak
en e
lsew
here
for
rec
yclin
g?
10
7 1
2 0
58 |
LEI
Rep
ort
2014
-007
(Ann
exes
)

Tabl
e 6
Cha
nges
in im
plem
enta
tion
scor
es f
or s
usta
inab
le p
ract
ices
No
.
Dif
fere
nce
in
Dif
fere
nce
(F
FS v
s. N
on
FS
S)
Dif
fere
nce
s (2
01
4-2
01
2)
In
dica
tors
are
gro
uped
into
'pro
fit' (
yello
w),
'peo
ple'
(bl
ue),
and
'pla
net'(
gree
n)
*=si
gnifi
cant
at
0.05
leve
l N
on-F
SS
FF
S
B13
At
wha
t he
ight
do
you
tip in
? 2.
30*
-1.3
1.
00
B16
D
o yo
u ke
ep r
ecor
ds?
2.29
* -0
.65
1.64
B3
Use
plu
ckin
g st
ick/
wan
d, t
able
firm
? 1.
68*
-0.3
8 1.
30
B1
How
oft
en p
luck
per
mon
th?
1.31
* -1
.19
0.12
B14
H
ow o
ften
app
ly c
ompo
sted
man
ure
t?
1.29
* -0
.54
0.75
B8
At
wha
t he
ight
do
you
prun
e?
0.75
0.
26
1.01
B15
H
ow f
requ
ently
do
you
appl
y fe
rtili
ser
0.58
0.
64
1.22
B11
W
hat
tool
s ar
e us
ed t
o pr
une
your
tea
? 0.
52*
-0.3
8 0.
14
B7
Wha
t is
the
% o
f cr
op c
over
? 0.
42
1.27
1.
69
B12
W
ho p
rune
s th
e te
a an
d ha
ve t
hey
been
tra
ined
? 0.
02
0.77
0.
79
B2
Expe
rien
ce le
af s
pilla
ge a
t fa
rm o
r bu
ying
cen
tre?
0.
00
0.33
0.
33
B10
H
ow o
ften
do
you
prun
e sa
me
tea
plot
/blo
ck?
-0.1
5 0.
54
0.39
B4
Suc
cess
rat
e of
you
r nu
rser
y?
-0.3
2 0.
71
0.39
B6
Whe
n pl
ant
VP
plan
ts?
-0.7
5*
0.71
-0
.04
B9
At
wha
t pe
riod
do
you
prun
e -2
.05*
2.
44
0.39
B23
D
o yo
u tu
rn t
o KTD
A if
you
exp
erie
nce
any
prob
lem
s in
you
r te
a pr
oduc
tion?
1.
93*
-0.9
5 0.
98
B19
D
o yo
ur w
orke
rs h
ave
acce
ss t
o po
tabl
e w
ater
and
latr
ines
1.
10*
0.16
1.
26
B21
D
o yo
u us
e an
y pe
rson
al p
rote
ctiv
e eq
uipm
ent
(PPE
)?
0.93
1.
67
2.60
B27
W
hen
do y
ou a
pply
fer
tilis
er t
o yo
ur t
ea?
0.57
0.
00
0.57
B17
W
ho p
luck
s yo
ur t
ea?
0.55
-0
.72
-0.1
7 B25
D
o yo
u co
llect
pru
ning
s fr
om t
he t
ea f
ield
? 0.
52
-0.1
3 0.
39
B24
D
o yo
ur c
hild
ren
go t
o sc
hool
? 0.
50
-0.0
9 0.
41
B22
D
o yo
u gr
oup
toge
ther
with
oth
ers
farm
ers
to c
arry
out
act
iviti
es
0.23
1.
56
1.79
B28
H
ow d
o yo
u sp
ray?
0.
20
0.51
0.
71
B20
H
ow o
ften
did
you
r fa
mily
or
wor
kers
nee
d m
edic
al a
tten
tion
-0.3
0 -0
.72
-1.0
2 B26
D
o yo
u in
fill o
pen
area
s?
-1.0
4 1.
54
0.50
B18
D
o yo
u ha
ve a
fix
ed a
gree
men
t w
ith e
mpl
oyee
s?
-1.2
5*
-6.3
6 -7
.61
B36
H
ow d
o yo
u m
anag
e ho
useh
old
was
te w
ater
and
eff
luen
t fr
om li
vest
ock?
2.
27*
-0.1
1 2.
16
B38
W
aste
is c
olle
cted
and
tak
en e
lsew
here
for
rec
yclin
g?
1.94
* -2
.54
-0.6
0 B37
H
ow d
o yo
u m
ange
hou
seho
ld s
olid
was
te?
1.67
* -0
.31
1.36
B34
W
hat
is y
our
mai
n so
urce
of en
ergy
for
dom
estic
pur
pose
s?
1.52
-0
.33
1.19
B32
If
you
r fa
rm b
orde
rs a
wat
er b
ody,
dis
tanc
e sp
ray
from
wat
er?
1.16
-1
.13
0.03
B30
D
o yo
u ha
ve in
dige
nous
tre
es o
n yo
u fa
rm?
0.70
-0
.09
0.61
B33
H
ow m
uch
area
of
the
tota
l far
m is
con
serv
atio
n ar
ea?
0.58
0.
22
0.80
B29
D
oes
your
far
m b
orde
r a
rive
r or
wat
er b
ody?
0.
04
1.08
1.
12
B35
W
hat
is y
our
mai
n so
urce
of
wat
er for
dom
estic
use?
-0
.09
0.03
-0
.06
B31
H
ow m
any
euca
lypt
us t
rees
gro
w w
ithin
10
met
res
from
wat
er?
-1.1
6*
1.57
0.
41
LEI
Rep
ort
2014
-007
(Ann
exes
) | 5
9

5 Reg
ress
ion
outp
uts
impa
ct a
sses
smen
t of
TES
A-le
d FF
S
Tabl
e 7
Impa
ct o
f FF
S p
artic
ipat
ion
on k
now
ledg
e sc
ore
and
impl
emen
tatio
n sc
ore
Tre
atm
ent
vari
able
s an
d c
ova
riat
es
Reg
ress
ion
ou
tpu
ts
Lo
gist
ic r
egre
ssio
n
Num
ber
of o
bs
=
308
LR c
hi2(
7)
=
10
1.02
Pr
ob >
chi
2 =
0
Lo
g lik
elih
ood
= -
123.
7787
6
Pseu
do R
2
=
0.28
98
Tre
atm
ent
vari
able
Var
iabl
e na
me
in d
atas
et
W
heth
er h
ad F
FS t
rain
ing
(1=
yes
; 0=
No)
dm
_ffs
C
oef.
Std
. Er
r.
z P>
z [9
5% C
onf.
In
terv
al]
Co
vari
ates
use
d f
or
PS
M
age
a4_a
ge
0.01
1814
5 0.
0141
81
0.83
0.
41
-0.0
1598
05
0.03
9609
ye
ars
of e
duca
tion
a4_e
du
-0.0
1919
67
0.05
3804
-0
.36
0.72
-0
.124
651
0.08
6258
ge
nder
(1=
mal
e; 0
= f
emal
e)
a4_s
ex
0.10
7767
5 0.
3357
38
0.32
0.
75
-0.5
5026
73
0.76
5802
ho
useh
old
size
a5
0.
0287
918
0.04
0365
0.
71
0.48
-0
.050
323
0.10
7907
re
gion
(1=
East
of
Rift
Val
ley;
0=
Wes
t of
Rift
Val
ley)
re
gion
1 -0
.630
7424
0.
3713
-1
.70
0.09
-1
.358
476
0.09
6991
w
heth
er h
ad R
A-t
rain
ing
(1=
yes
; 0=
No)
dm
_ra
2.02
1678
0.
3324
68
6.08
0.
00
1.37
0054
2.
6733
03
whe
ther
had
non
-cer
tific
atio
n tr
aini
ng (
1= y
es;
0= N
o)
a15b
2.
2944
22
0.39
6254
5.
79
0.00
1.
5177
79
3.07
1066
C
onst
ant
_con
s -2
.036
177
1.08
4656
-1
.88
0.06
-4
.162
063
0.08
9709
Ou
tco
me
vari
able
Sam
ple
Trea
ted
Con
trol
s D
iffer
ence
S.E
. T-
stat
know
ledg
e U
nmat
ched
6.
6115
9417
5.
7196
5807
.8
9193
6098
.2
4684
1891
3.
61
ATT
6.
6022
319
5.85
3989
33
.748
2425
63
.444
3367
88
1.68
impl
emen
tatio
n U
nmat
ched
7.
3396
7224
6.
5913
4107
.7
4833
1162
.0
9409
7264
7.
95
ATT
7.
3375
9795
6.
8841
7669
.4
5342
1262
.1
8986
8804
2.
39
60 |
LEI
Rep
ort
2014
-007
(Ann
exes
)

Tabl
e 8
Reg
ress
ion
anal
ysis
on
the
chan
ges
in k
now
ledg
e
Dep
end
ent
and
exp
lan
ato
ry v
ari
able
s
Reg
ress
ion
ou
tpu
ts
Sou
rce
SS
df
MS
Num
ber
of o
bs
=
612
Mod
el
992.
4409
4
248.
1102
2 Pr
ob >
F
=
0 Res
idua
l 15
70.5
37
607
2.58
7376
R-s
quar
ed
=
0.38
72
To
tal
2562
.978
61
1 4.
1947
269
Roo
t M
SE
=
1.60
85
C
hang
e in
kno
wle
dge
scor
e C
oef.
Std
. Er
r.
t P>
t [9
5% C
onf.
In
terv
al]
Le
ngth
of
part
icip
atio
n in
FFS
(1=
3-4
year
s; 2
=1-
2 ye
ars;
3=
nev
er p
artic
ipat
ed)
-0.5
3983
0.
0909
56
-5.9
4 0.
00
-0.7
1845
48
-0.3
6120
28
Whe
ther
par
ticip
ated
in R
A t
rain
ing
(1=
yes
; 0=
No)
0.
4567
68
0.14
4134
3.
17
0.00
0.
1737
05
0.73
9830
2
Whe
ther
Wes
t of
Rift
Val
ley
(1=
yes
; 0=
No)
-0
.982
36
0.13
9015
-7
.07
0.00
-1
.255
373
-0.7
0935
35
Impl
emen
tatio
n sc
ore
in p
revi
ous
year
-0
.732
29
0.04
1231
-1
7.76
0.
00
-0.8
1326
53
-0.6
5131
94
C
onst
ant
5.77
1858
0.
3036
45
19.0
1 0.
00
5.17
5536
6.
3681
8
LEI
Rep
ort
2014
-007
(Ann
exes
) | 6
1

Tabl
e 9
Reg
ress
ion
anal
ysis
on
the
chan
ges
in im
plem
enta
tion
Dep
end
ent
and
exp
lan
ato
ry v
ari
able
s
Reg
ress
ion
ou
tpu
ts
Sou
rce
SS
df
MS
Num
ber
of o
bs
=
307
Mod
el
165.
3526
5
33.0
7052
9 Pr
ob >
F
=
0 Res
idua
l 10
4.26
27
301
0.34
6387
7 R-s
quar
ed
=
0.61
33
To
tal
269.
6153
30
6 0.
8810
959
Roo
t M
SE
=
0.58
855
C
hang
e in
impl
emen
tatio
n sc
ore
(201
4-20
12)
Coe
f.
Std
. Er
r.
t P>
t [9
5% C
onf.
In
terv
al]
Le
ngth
of
part
icip
atio
n in
FFS
(1
=3-
4 ye
ars;
2=
1-2
year
s; 3
= n
ever
par
ticip
ated
) -0
.185
13
0.05
545
-3.3
4 0.
00
-0.2
9424
69
-0.0
7600
84
Whe
ther
par
ticip
ated
in R
A t
rain
ing
(1
= y
es;
0= N
o)
0.32
6858
0.
0754
85
4.33
0.
00
0.17
8312
4 0.
4754
037
Whe
ther
Wes
t of
Rift
Val
ley
(1=
yes
; 0=
No)
-0
.528
99
0.07
0273
-7
.53
0.00
-0
.667
2772
-0
.390
7016
Impl
emen
tatio
n sc
ore
in p
revi
ous
year
-0
.960
65
0.05
0641
-1
8.97
0.
00
-1.0
6030
6 -0
.860
9951
W
heth
er h
ad n
on-c
ertific
atio
n tr
aini
ng
0.56
7236
0.
1018
36
5.57
0.
00
0.36
6836
5 0.
7676
36
Con
stan
t 6.
7939
3 0.
4021
81
16.8
9 0.
00
6.00
2486
7.
5853
73
62 |
LEI
Rep
ort
2014
-007
(Ann
exes
)

Tabl
e 10
Pa
nel d
ata
estim
atio
n of
impa
ct o
f FF
S o
n gr
een
leaf
yie
ld p
er b
ush
Reg
ress
ion
mo
del
Reg
ress
ion
ou
tpu
ts
Cro
ss-s
ectio
nal t
ime-
seri
es F
GLS
reg
ress
ion
Coe
ffic
ient
s:
gene
ralis
ed le
ast
squa
res
Pane
ls:
hete
rosk
edas
tic
Cor
rela
tion:
co
mm
on A
R(1
) co
effic
ient
for
all
pane
ls (
-1.6
492)
Estim
ated
cov
aria
nces
=
2
88
Num
ber
of o
bs
=
576
Estim
ated
aut
ocor
rela
tion
s =
1
Num
ber
of g
roup
s =
28
8 Es
timat
ed c
oeff
icie
nts
=
3
Ti
me
peri
ods
=
2
Wal
d ch
i2(2
) =
86
883.
01
Pr
ob >
chi
2 =
0
Dep
end
ent
and
exp
lan
ato
ry v
ari
able
s
Kilo
gram
s of
tea
gre
en le
af s
old
Coe
f.
Std
. Er
r.
z P>
z [9
5% C
onf.
In
terv
al]
N
umbe
r of
bus
hes
0.88
3443
0.
0088
908
99.3
7 0.
000
0.86
6017
0.
9008
68
Num
ber
of b
ushe
s (w
ith p
artici
pation
in F
FS)
0.16
2823
0.
0087
908
18.5
2 0.
000
0.14
5593
0.
1800
52
Con
stan
t 71
3.22
72
5.46
3416
13
0.55
0.
000
702.
5191
72
3.93
53
Tabl
e 11
C
ompa
riso
n of
cha
nges
in k
ey p
rofit
abili
ty p
aram
eter
s
Pro
fita
bil
ity
par
ame
ters
C
han
ges
am
on
g F
FS a
nd
N
on
FFS
(2
01
4-
20
12
) %
bia
s t
p>
t
FF
S
No
n F
FS
To
tal r
even
ue fro
m t
ea g
reen
leaf
sol
d -1
8863
-1
6338
-2
.9
-0.2
0 0.
84
Tea
gree
n le
af p
rodu
ctio
n (k
g)
445.
74
-64.
085
18
1.19
0.
236
Num
ber
of t
ea b
ushe
s -2
48.1
-3
54.1
5 5.
8 0.
41
0.68
Fe
rtili
ser
use
per
bush
0.
0004
7 -0
.003
12
3.6
0.29
0.
771
Hired
labo
ur c
osts
2.
519
10.8
86
-21.
9 -2
.23
0.0
27
C
ost
of P
PE
-727
.19
-783
.35
2.7
0.14
0.
89
Num
ber
of o
ther
inco
me
sour
ces
-0.1
1354
-0
.756
41
41.6
3.
24
0.0
01
LEI
Rep
ort
2014
-007
(Ann
exes
) | 6
3

6 Bas
ic c
hara
cter
istic
s of
res
pond
ents
fro
m t
he far
mer
-led
FFS
Tabl
e 12
C
ompa
riso
n of
cha
nges
in k
ey p
rofit
abili
ty p
aram
eter
s
N
on
FFS
FF
S
To
tal
Sta
tistics
N
M
ean
Med
ian
Std
. D
evia
tion
N
M
ean
Med
ian
Std
. D
evia
tion
N
M
ean
Med
ian
Std
. D
evia
tion
Age
13
8 53
.5
51.5
13
.0
102
56.5
57
.5
13.9
24
0 54
.8
54.5
13
.4
Year
of
educ
atio
n 13
8 7.
6 7.
0 3.
6 10
2 8.
1 8.
0 3.
6 24
0 8
8 4
Hou
seho
ld s
ize
138
5 5
2 10
2 6
6 3
240
6 5
3 N
umbe
r of
tea
bus
hes
138
1465
10
36
1262
10
2 15
45
1299
10
68
240
1499
11
81
1182
Kilo
gram
s of
gre
en le
af s
old
135
1603
97
1 18
59
99
1778
13
46
2245
23
4 16
77
1217
20
28
G
ende
r (%
fem
ale)
13
8 49
.2%
10
2 52
.9%
24
0 50
.8%
Pe
rcen
tage
RA-t
rain
ed
138
26.8
%
102
72.5
%
240
46.2
%
64 |
LEI
Rep
ort
2014
-007
(Ann
exes
)

7 Key
per
form
ance
indi
cato
rs in
bas
elin
e si
tuat
ion
from
the
fa
rmer
-led
FFS
Tabl
e 13
Bas
ic c
ost-
bene
fit m
odel
for
ana
lysi
ng p
rofit
abili
ty o
f te
a pr
oduc
tion
Pro
fita
bil
ity
an
alys
is
Rev
enue
(Ksh
) 11
7,00
0 Pa
ram
eter
s in
gre
y ce
lls (
can
be c
hang
ed)
Cal
cula
ted
valu
es in
blu
e ce
lls
Cos
ts (
Ksh
) 26
,464
G
ross
mar
gin
(Rev
enue
-Cos
ts)
(Ksh
) 90
,536
Rev
enue
-Cos
ts (
USD
) 1,
065
Gro
ss m
argi
n pe
r ca
pita
per
day
(U
SD
) 2.
9
Ex
chan
ge r
ate
(ksh
/USD
) 85
Fa
rm b
usi
nes
s m
od
el
Par
amet
ers
Rev
enu
e
Co
sts
(K
sh)
(K
sh)
117,
000
26,4
64
Inco
me
fro
m o
ther
so
urc
es
To
tal i
ncom
e
0
Tota
l cos
ts
0
Fa
rm c
har
act
eris
tics
Num
ber
of t
ea b
ushe
s 20
00
Farm
land
(ac
re)
H
ouse
hold
siz
e (n
umbe
r of
peo
ple)
5
Yiel
d (k
g gr
een
leaf
/bus
h)
1.3
Prop
ortion
of
prun
ing
0.4
Tea
rev
enu
e 1
17
,00
0
117,
000
G
reen
leaf
pro
duct
ion
(kg/
bush
) 2,
600
Pric
e gr
een
leaf
14
Bon
us g
reen
leaf
31
T
ea p
rod
uct
ion
co
sts
La
bo
ur
inp
ut
Pl
ucki
ng (
1=hi
red
labo
ur,
0=ow
n)
1
W
eedi
ng (
num
ber
of d
ays)
10
Pr
unin
g (n
umbe
r of
bus
hes)
80
0
LEI
Rep
ort
2014
-007
(Ann
exes
) | 6
5

App
lyin
g fe
rtili
ser
(num
ber
of b
ags)
2.
8
La
bo
ur
wag
e
Pluc
king
(ks
h/kg
) 6
Wee
ding
(ks
h/da
y)
180
Prun
ing
(ksh
/bus
h)
3
App
lyin
g fe
rtili
ser
(ksh
/bag
) 80
La
bo
ur
cost
s 2
00
24
Pl
ucki
ng (
ksh/
kg)
1560
0
1560
0 W
eedi
ng (
ksh/
day)
18
00
18
00
Prun
ing
(ksh
/bus
h)
2400
2400
App
lyin
g fe
rtili
ser
(ksh
/bag
) 22
4
224
Mat
eria
l co
sts
64
40
Fe
rtili
ser
cost
s (k
sh)
6440
6440
Fe
rtili
ser
pric
e (k
sh/b
ag)
2300
Fe
rtili
ser
use
(kg/
bush
) 0.
07
Tota
l fer
tilis
er u
se (
bags
) 2.
8
C
hem
ical
s co
sts
0
0 pr
ice
(ksh
/kg)
quan
tity(
kg)
O
rgan
ic f
ertil
iser
0
0
pric
e (k
sh/k
g)
qu
antit
y(kg
)
Plan
ting
mat
eria
ls
0
0 pr
ice
(ksh
/kg)
quan
tity(
kg)
O
ther
co
sts
0
PP
E
0
Oth
er
0
66 |
LEI
Rep
ort
2014
-007
(Ann
exes
)

Tabl
e 14
In
put
use
and
cost
s in
the
bas
elin
e si
tuat
ion
(1)
Sta
tist
ics
Gro
up
La
bo
ur
cost
s
La
bo
ur
inp
ut
Pl
ucki
ng (
Ksh
/kg)
W
eedi
ng
(Ksh
/day
) Pr
unin
g (K
sh/b
ush)
App
lyin
g fe
rtili
ser
(Ksh
/bag
) W
eedi
ng d
ays
Bus
hes
prun
ed
Bag
s ap
plie
d
N
on F
FS
N
138
138
138
138
136
138
138
Mea
n
5.05
77
.72
1.80
31
.31
4.82
73
6.20
2.
49
Med
ian
7
0 2
0 3
475
2 sd
4.01
92
.59
1.70
59
.37
4.37
12
47.3
4 2.
00
min
0 0
0 0
0 0
0 m
ax
15
35
0 6
200
30
1350
0 12
FFS
N
10
2 10
2 10
2 10
2 10
1 10
2 10
1 M
ean
5.
03
80.5
9 2.
24
49.5
1 4.
86
1059
.20
2.76
M
edia
n
7 10
0 2
0 4
700
2 sd
3.81
85
.06
1.78
68
.03
4.43
15
31.3
4 2.
05
min
0 0
0 0
0 0
0 m
ax
10
30
0 8
200
30
1300
1 15
Tota
l
N
24
0 24
0 24
0 24
0 23
7 24
0 23
9 M
ean
5.
04
78.9
4 1.
98
39.0
5 4.
84
873.
47
2.61
M
edia
n
7 0
2 0
3 50
0 2
sd
3.
91
89.3
0 1.
74
63.7
0 4.
39
1381
.46
2.02
m
in
0
0 0
0 0
0 0
max
15
350
8 20
0 30
13
500
15
D
iffer
ence
-0.0
2 2.
87
0.44
18
.20
0.04
3
23
.00
0.
27
(FFS
- N
on-F
FS)
LEI
Rep
ort
2014
-007
(Ann
exes
) | 6
7
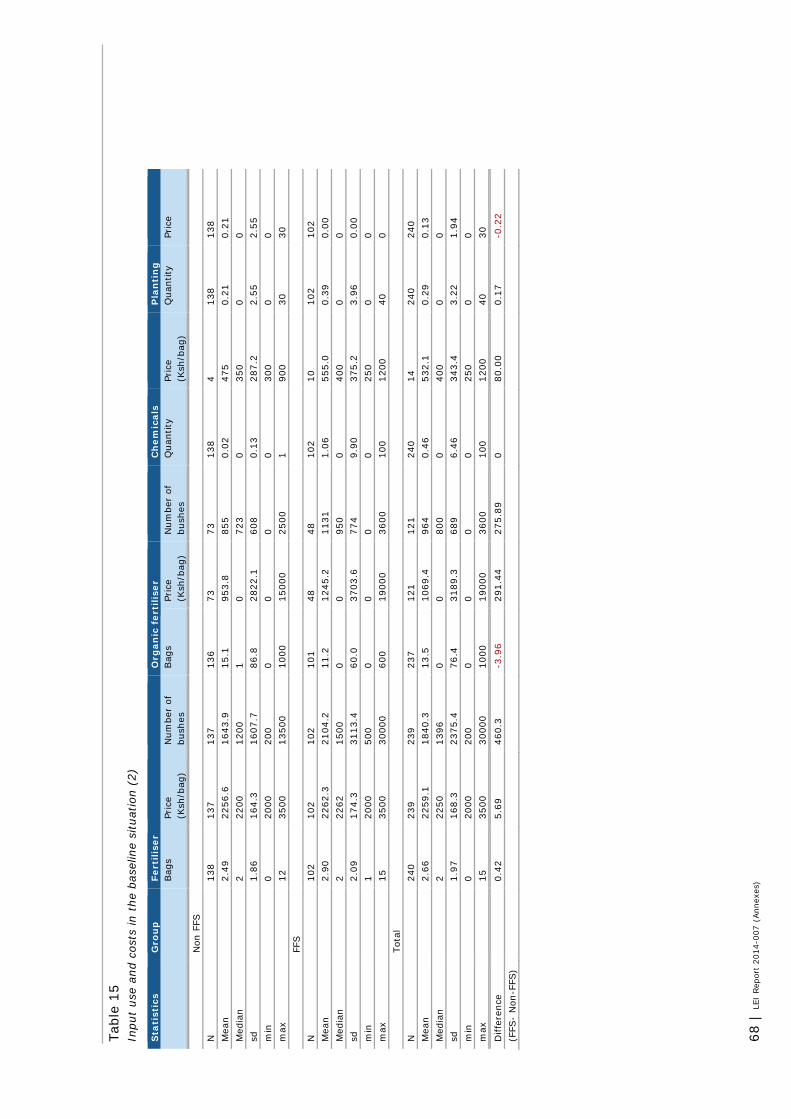
Tabl
e 15
In
put
use
and
cost
s in
the
bas
elin
e si
tuat
ion
(2)
Sta
tist
ics
Gro
up
Fe
rtil
iser
O
rgan
ic f
erti
lise
r
Ch
emic
als
P
lan
tin
g
Bag
s Pr
ice
(Ksh
/bag
) N
umbe
r of
bu
shes
Bag
s Pr
ice
(Ksh
/bag
) N
umbe
r of
bu
shes
Q
uant
ity
Pric
e (K
sh/b
ag)
Qua
ntity
Pr
ice
N
on F
FS
N
13
8 13
7 13
7 13
6 73
73
13
8 4
138
138
Mea
n
2.49
22
56.6
16
43.9
15
.1
953.
8 85
5 0.
02
475
0.21
0.
21
Med
ian
2
2200
12
00
1 0
723
0 35
0 0
0 sd
1.86
16
4.3
1607
.7
86.8
28
22.1
60
8 0.
13
287.
2 2.
55
2.55
m
in
0
2000
20
0 0
0 0
0 30
0 0
0 m
ax
12
35
00
1350
0 10
00
1500
0 25
00
1 90
0 30
30
FFS
N
102
102
102
101
48
48
102
10
102
102
Mea
n
2.90
22
62.3
21
04.2
11
.2
1245
.2
1131
1.
06
555.
0 0.
39
0.00
M
edia
n
2 22
62
1500
0
0 95
0 0
400
0 0
sd
2.
09
174.
3 31
13.4
60
.0
3703
.6
774
9.90
37
5.2
3.96
0.
00
min
1 20
00
500
0 0
0 0
250
0 0
max
15
3500
30
000
600
1900
0 36
00
100
1200
40
0
To
tal
N
24
0 23
9 23
9 23
7 12
1 12
1 24
0 14
24
0 24
0 M
ean
2.
66
2259
.1
1840
.3
13.5
10
69.4
96
4 0.
46
532.
1 0.
29
0.13
M
edia
n
2 22
50
1396
0
0 80
0 0
400
0 0
sd
1.
97
168.
3 23
75.4
76
.4
3189
.3
689
6.46
34
3.4
3.22
1.
94
min
0 20
00
200
0 0
0 0
250
0 0
max
15
3500
30
000
1000
19
000
3600
10
0 12
00
40
30
Diff
eren
ce
0.
42
5.69
46
0.3
-3.9
6 29
1.44
27
5.89
0
80.0
0 0.
17
-0.2
2 (F
FS-
Non
-FFS
)
68 |
LEI
Rep
ort
2014
-007
(Ann
exes
)

8 Reg
ress
ion
outp
uts
base
line
situ
atio
n of
far
mer
-led
FFS
8.1
Prop
ensi
ty S
core
Mat
chin
g (P
SM)
The
cova
riat
es u
sed
are
the
resp
onde
nts’
age
(a4
_age
), y
ears
of
educ
atio
n ha
d (a
4_ed
u),
gend
er (
a4_s
ex),
far
m s
ize
in h
ecta
re (
ha_f
act)
and
hou
seho
ld s
ize(
a5).
A n
umbe
r of
dum
my
variab
les
are
also
incl
uded
to
repr
esen
t w
heth
er t
he h
ouse
hold
is f
rom
the
eas
t of
Rift
Val
ley
(reg
ion1
), h
ad o
ther
non
-cer
tific
atio
n tr
aini
ngs
(a15
b),
had
RA-
trai
ning
(dm
_ra)
. Th
e ou
tput
s of
the
logi
c re
gres
sion
are
sho
wn
belo
w.
Ta
ble
16
Out
puts
of
the
logi
c re
gres
sion
Tre
atm
ent
vari
able
s an
d c
ova
riat
es
Reg
ress
ion
ou
tpu
ts
Lo
gist
ic r
egre
ssio
n
Num
ber
of o
bs
=
238
LR c
hi2(
8)
=
68
.26
Prob
> c
hi2
=
0
Log
likel
ihoo
d =
-12
8.40
015
Ps
eudo
R2
=
0.
21
Tre
atm
ent
vari
able
va
riab
le n
ame
in d
atas
et
W
heth
er h
ad F
FS t
rain
ing
(1=
yes
; 0=
No)
dm
_ffs
C
oef.
Std
. Er
r.
z P>
z [9
5% C
onf.
In
terv
al]
Co
vari
ates
ag
e a4
_age
0.
0056
955
0.01
5946
0.
36
0.72
-0
.025
5573
0.
0369
48
year
s of
edu
catio
n a4
_edu
0.
0139
842
0.05
1956
0.
27
0.79
-0
.087
8483
0.
1158
17
gend
er (
1= m
ale;
0=
fem
ale)
a4
_sex
-0
.553
5804
0.
3437
91
-1.6
1 0.
11
-1.2
2739
9 0.
1202
38
farm
siz
e (h
ecta
re)
ha_f
act
0.41
9939
6 0.
2841
52
1.48
0.
14
-0.1
3698
73
0.97
6867
ho
useh
old
size
a5
-0
.010
4036
0.
0664
42
-0.1
6 0.
88
-0.1
4062
71
0.11
982
regi
on (
1=Ea
st o
f R
ift V
alle
y; 0
= W
est
of R
ift V
alle
y)
regi
on1
-0.4
3822
25
0.38
2099
-1
.15
0.25
-1
.187
122
0.31
0677
w
heth
er h
ad R
A-t
rain
ing
(1=
yes
; 0=
No)
a1
5b
1.00
9884
0.
3325
53
3.04
0.
00
0.35
8092
2 1.
6616
75
whe
ther
had
non
-cer
tific
atio
n tr
aini
ng (
1= y
es;
0= N
o)
dm_r
a 1.
7855
64
0.31
8074
5.
61
0.00
1.
1621
51
2.40
8978
C
onst
ant
_con
s -1
.998
846
1.24
2453
-1
.61
0.11
-4
.434
01
0.43
6317
LEI
Rep
ort
2014
-007
(Ann
exes
) | 6
9

8.2
Bal
anci
ng t
est
of c
ovar
iate
s be
fore
and
aft
er m
atch
ing
Tabl
e 17
Bal
anci
ng t
est
of c
ovar
iate
s be
fore
and
aft
er m
atch
ing
Var
iab
le
Un
mat
ched
/M
atc
hed
M
ean
t-te
st
Tr
eate
d C
ontr
ol
%bi
as
% b
ias
redu
ctio
n t
p>t
a4_a
ge
Unm
atch
ed
56.4
9 53
.581
21
.8
1.
67
0.09
6
Mat
ched
56
.49
59.1
18
-19.
7 9.
7 -1
.54
0.12
5
a4
_edu
U
nmat
ched
8.
1176
7.
6471
13
.2
1.
01
0.31
6
Mat
ched
8.
1176
7.
3725
20
.8
-58.
3 1.
51
0.13
2
a4
_sex
U
nmat
ched
0.
4705
9 0.
5147
1 -8
.8
-0
.67
0.50
3
Mat
ched
0.
4705
9 0.
4803
9 -2
77
.8
-0.1
4 0.
889
ha_f
act
Unm
atch
ed
0.80
453
0.66
78
24.6
1.88
0.
061
M
atch
ed
0.80
453
0.86
877
-11.
6 53
-0
.66
0.50
8
a5
U
nmat
ched
6.
1275
5.
3971
28
.9
2.
24
0.02
6
Mat
ched
6.
1275
5.
6961
17
.1
40.9
1.
28
0.20
3
re
gion
1 U
nmat
ched
0.
4117
6 0.
5588
2 -2
9.6
-2
.26
0.02
5
Mat
ched
0.
4117
6 0.
5686
3 -3
1.6
-6.7
-2
.26
0.02
5
a1
5b
Unm
atch
ed
0.78
431
0.47
059
68.3
5.15
0.
00
M
atch
ed
0.78
431
0.89
216
-23.
5 65
.6
-2.1
0.
037
dm_r
a U
nmat
ched
0.
7254
9 0.
2720
6 10
1.3
7.
74
0.00
Mat
ched
0.
7254
9 0.
6764
7 11
89
.2
0.76
0.
447
70 |
LEI
Rep
ort
2014
-007
(Ann
exes
)


LEI Wageningen UR carries out socio-economic research and is the strategic partner for governments and the business community in the field of sustainable economic development within the domain of food and the living environment. LEI is part of Wageningen UR (University and Research centre), forming the Social Sciences Group together with the Department of Social Sciences and Wageningen UR Centre for Development Innovation.
The mission of Wageningen UR (University & Research centre) is ‘To explore the potential of nature to improve the quality of life’. Within Wageningen UR, nine specialised research institutes of the DLO Foundation have joined forces with Wageningen University to help answer the most important questions in the domain of healthy food and living environment. With approximately 30 locations, 6,000 members of staff and 9,000 students, Wageningen UR is one of the leading organisations in its domain worldwide. The integral approach to problems and the cooperation between the various disciplines are at the heart of the unique Wageningen Approach.
LEI Wageningen URP.O. Box 297032502 LS Den HaagThe NetherlandsE [email protected]/en/lei
ANNEXESLEI 2014-007a
Yuca Waarts, Lan Ge and Linda Puister
For all the tea in KenyaImpact assessment and baseline situation of Farmer Field Schools
Annexes to the main report


![TEA ACT - Kenya Law Reportskenyalaw.org/kl/fileadmin/pdfdownloads/Acts/TeaActCap343.pdfTea CAP. 343 LAWS OF KENYA TEA ACT CHAPTER 343 Revised Edition 2012 [1960] Published by the National](https://static.fdocuments.in/doc/165x107/5ea402388175346b2922b3a8/tea-act-kenya-law-tea-cap-343-laws-of-kenya-tea-act-chapter-343-revised-edition.jpg)
