Footprint Calculator Carbon Fund. Figure 1 tracks the per-person resource demand (Ecological...
17
• Footprint Calculator • Carbon Fund
-
Upload
hilary-franklin -
Category
Documents
-
view
223 -
download
1
Transcript of Footprint Calculator Carbon Fund. Figure 1 tracks the per-person resource demand (Ecological...

• Footprint Calculator• Carbon Fund


Figure 1 tracks the per-person resource demand (Ecological Footprint) and resource supply (Biocapacity) in United States since 1961. Biocapacity varies each year with ecosystem management, agricultural practices (such as fertilizer use and irrigation), ecosystem degradation, and weather.

Ecological Footprint
Our current global situation:
• Since the 1970s, humanity has been in ecological overshoot with annual demand on resources exceeding what Earth can regenerate each year.
• It now takes the Earth one year and six months to regenerate what we use in a year.
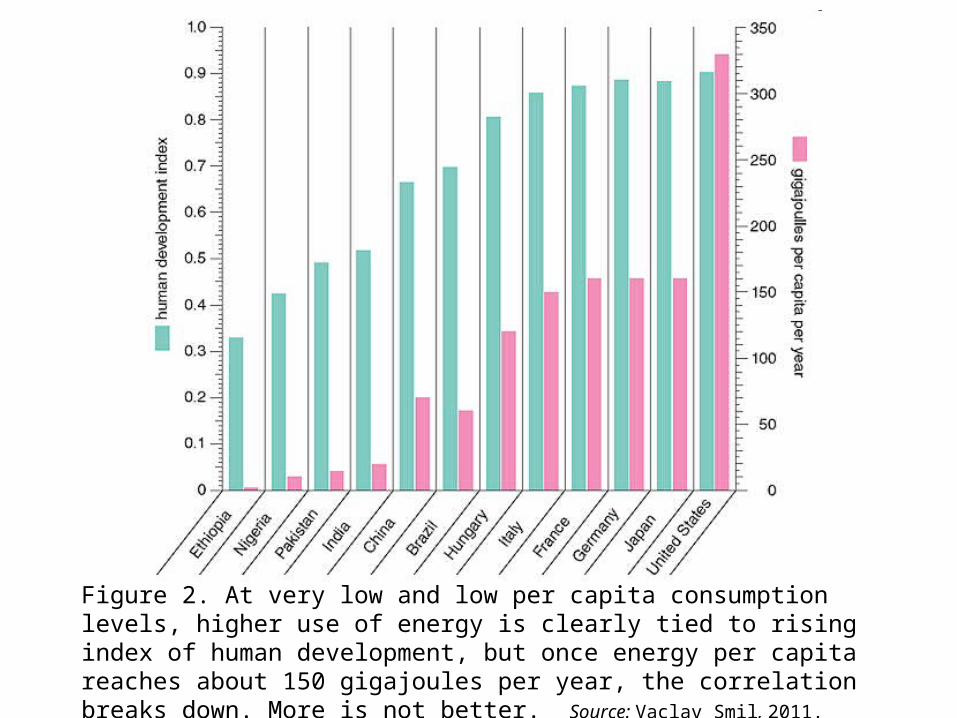
Figure 2. At very low and low per capita consumption levels, higher use of energy is clearly tied to rising index of human development, but once energy per capita reaches about 150 gigajoules per year, the correlation breaks down. More is not better. Source: Vaclav Smil, 2011. American Scientist, v99(3), p.212

Figure 3. Although the efficiency of internal combustion engines has increased substantially in the past 90 years (particularly when the adoption of diesel-powered cars is taken into account), the average performance of motor vehicles in the Unites States has improved only from about 14 miles per gallon to about 18 mpg. Source: Vaclav Smil, 2011. American Scientist, v99(3), p.212
In 2010 U.S. energy consumption averaged about 330 gigajoules per capita, nearly 4 percent lower than in 1970, and even the 2007 (pre-crisis) rate of 355 gigajoules (GJ) per capita was below the 1980 mean of 359 GJ. This means that the U.S. per capita consumption of primary energy has remained essentially flat for more than one generation

CAFE and Efficiency
• Corporate Automobile Fuel Efficiency (CAFE) • For 40 years car efficiencies ran against the universal
trend of improvements – – In 1974 it was lower (at 13.4 mpg) than during the mid-1930s!
• With CAFE standards, efficiency of passenger cars doubled by 1985, BUT…
• In 1985 the U.S. froze any further improvements– Encouraged a massive diffusion of exceptionally inefficient SUVs
and, at the same time, failed to follow the rest of modernizing world in building fast train links
– The average performance of the entire (two-axle, four-wheel) car fleet was less than 26 mpg in 2006, or no better than in 1986

CAFE and Efficiency
• A combination of continued – CAFE upgrades, – Diffusion of new ultra low-emission diesels (inherently
at least 25–30% more efficient than gasoline-powered cars)
– And an early introduction of hybrid drives
• Could have raised passenger car efficiency easily to more than 35 or even 40 mpg,
• Massively cutting the U.S. crude oil imports for which the country paid $1.5 trillion during the first decade of the 21st century.

Trains?
• U.S. too large,
• Dispersed,
• Low population density
• Northeast Megalpolis– 50 million people– 360 km-2
– France, at the leading edge of high speed train systems has a national population of 65 million and density of 120 km-2

Energy
• 88% of modern energy (biomass fuels, wood, etc. aside) in 2009 was derived from fossil fuels:– Oil = 35%– Coal = 29%– Natural gas = 24%
• Fossil fuel flux is nearly 20x larger than at the start of the 20th century
• Nuclear Fission: 13% Globally, 75% for France, 20% US, 2% China

Energy Transitions
• On the order of decades or generations – not years.– Secure sufficient resources, develop infrastructures,
achieve competitive costs.
• Example: Natural Gas (24%)– 60 years to hit 5% (starting around 1870 with
commercial extraction)– Another 55 years to ~25%– U.S. (pioneers of NG) shorter time span, but still not
rapid: 53 years > 5%, 31 years to now.

Energy Transitions: Real and “Imagined”
Reality:• 2010 World’s Renewable Primary Energy
– Ethanol & Biodiesel = 0.5%– Wind ~ 2%– PV < 0.05%
• Wished for:– Germany: 18% of all energy, and 35% electricity by
2020– U.S.: 10% of electricity from PV by 2025, 30% from
wind by 2030– China: 15-20% of energy from renewables by 2020

Availability
• Load factor deals with the day to day productivity of electricity generating plant. Different energy technologies have different load factors, no individual power plants is always available to supply electricity.
• Coal = 74% (U.S.)• Nuclear = 92%• Wind = 25% (U.S.), 21% (EU)• PV = 16% (example from Spain)

Energy
• In the United States the foremost problem in replacing much conventional electrical production with renewables is to get power from where it is most efficiently produced to where it is most needed.
• The existing U.S. grid is divided into zones (a), which do not normally share power on a large scale, and a new nationwide grid would be needed to connect them.
• The availability of solar power is concentrated in the southwestern United States (b). Even there, many new transmission lines would be required to transfer PV electricity from production to demand.
• Challenges of delivering wind-generated electricity from the Great Plains and other windy regions to the coastal concentrations of heaviest demand are even greater (c).
Source: Visualizing The U.S. Electric Grid
Note: In 2009, the U.S. grid report card got a D+.

Figure 6. Desertec is perhaps the most ambitious renewable energy plan yet conceived. Most of its electricity would come from concentrating solar thermal power plants in desert regions of northern Africa and the Middle East and would be transmitted by intercontinental high-voltage direct-current lines. The scale of the challenge is obvious, and recent political upheavals across the entire region where these conversions were to take place are not encouraging.