Food System Policies and Population Health: Moving Toward ... · Identify food system policies and...
54
www.denvergov.org/deh Food System Policies and Population Health: Moving Toward Collective Impact in Denver
Transcript of Food System Policies and Population Health: Moving Toward ... · Identify food system policies and...

www.denvergov.org/deh
Food System Policies and Population Health: Moving Toward Collective Impact in Denver

City & County of Denver Department of Environmental Health Mondi Mason, PhD, MPH Policy Program Administrator Doug Linkhart Executive Director Robin Valdez Director, Community Health Stacey McConlogue, MPH Denver Healthy People Program Manager Heidi Hoffman Healthy Food Access Administrator Lindsay Saperstone Corner Store Program Manager Gretchen Armijo Build Environment Administrator
Suggested Citation Denver Department of Environmental Health (December 2014). Food system policies and population health: Moving toward collective impact in Denver. Denver, CO.
For more information, contact: Mondi Mason, PhD, MPH Policy Program Administrator Denver Department of Environmental Health [email protected] 720-865-5463

Acknowledgements City and County of Denver Susan Gallo Office of Children’s Affairs Danica Lee Department of Environmental Health Michael Miera Office of Economic Development Lisana Muñoz Department of Human Services Jerry Tinianow, Director Office of Sustainability Beth Truby Office of Economic Development
Key Informants Maura Barnes Hunger Free Colorado Mya Bea Liberation Sequence Gardens Meghan Bradley Share Our Strength and Cooking Matters Adam Brock The Growhaus Alisha Brown The Stapleton Foundation Rusty Collins, Denver County Director Colorado State University Extension Cindy Dormer Metro State University at Denver Ryan Galanaugh Metro CareRing Jessica George Waste Farmers Beverly Grant Mo’ Betta Green Ginger Harrell The Stapleton Foundation Patti Iwasaki Taking Neighborhood Health to Heart Eric Kornacki Re:Vision
Kyle Leglieter The Colorado Health Foundation Owetta McNeil NE Park Hill Coalition Debbi Main University of Colorado at Denver Dana Miller Grow Local Colorado and Produce for Pantries Susan Motika Colorado Department of Public Health and Environment Chris Parr, Director Denver Housing Authority Wendy Peters Moschetti WPM Consulting Jini Puma Colorado School of Public Health Aleece Raw The Garden and The Sunshine Food Project Kendra Sandoval Sandoval & Sandoval Consulting Kevin Seggelke Food Bank of the Rockies Shannon Spurlock Denver Urban Gardens Damien Thomas Regis University Victoria Treski Hunger Free Colorado Lisa Walvoord LiveWell Colorado Jennifer Wieczorek Moreland
Denver Public Health Michele Wheeler 2040 Partners for Health Amy Yaroch Gretchen Swanson Center for Nutrition Membership, Denver Sustainable Food Policy Council Membership, LiveWell Denver Regional Collaborative Membership, Taking Neighborhood Health to Heart
This project was supported through funding from LiveWell Colorado

ii
Acronyms Used BMI Body Mass Index
CACFP Child and Adult Care Food Program
CDC Centers for Disease Control and Prevention
CHIP Community Health Improvement Plan
CPD Community Planning and Development
CO4F Colorado Fresh Financing Fund
CSA Community Supported Agriculture
CSU Ext. Colorado State University Extension
DBG Denver Botanic Gardens
DEH Department of Environmental Health
DHA Denver Housing Authority
DHS Denver Human Services
DPH Denver Public Health
DPS Denver Public Schools
DPR Denver Parks and Recreation
DPS Denver Public Schools
EBT Electronic Benefit Transfer
FEED Food, Environment and Economic Development Act
FRESH Food Retail Expansion to Support Health
HIA Health Impact Assessment
OCA Office of Children’s Affairs
OED Office of Economic Development
OoS Office of Sustainability
SFPC The Mayor’s Sustainable Food Policy Council
SNAP Supplemental Nutrition Assistance Program (food stamps)
SSB Sugar-sweetened Beverages
USDA United States Department of Agriculture
USDHHS United States Department of Health and Human Services
WIC Supplemental Nutrition Assistance Program for Women, Infants and Children

iii
Table of Contents
Acknowledgements .......................................................................................................... i
Acronyms Used ................................................................................................................... ii
Table of Contents .............................................................................................................. iii
Forward .............................................................................................................................. iv
Executive Summary .......................................................................................................... v
The Food System and Health .......................................................................................... 1
Food Insecurity .................................................................................................................. 2
Childhood Obesity ............................................................................................................ 4
Policies that Impact Population Health ......................................................................... 5
Policy Scan Findings At-A-Glance .................................................................................. 8
Healthy Food Retail .......................................................................................................... 9
Federal Food and Nutrition Service Programs.…………………………………………11
Agriculture……………………………………………………………………………………..15
Institutional Procurement and Vending Contracts...….………………………………19
Sugar-Sweetened Beverages……………………………………………………………...22
Policy Options At-A-Glance………………………………………………………………..25
Food System Policies and Population Health: Moving Toward Collective Impact
in Denver .......................................................................................................................... 28
Appendix A: Policy Scan Methods ............................................................................... 32
Appendix B: 24 National Organizations and Recommended Policy Domains to
Prevent Food Insecurity and/or Childhood Obesity .................................................. 34
Appendix C: Cities Implementing Best Practice Policies to Increase Food Access
........................................................................................................................................... 35
Appendix D: List of Key Informants that Informed the Findings ............................... 36
Appendex E: City and County of Denver Agencies and Affiliates Addressing
Food Access .................................................................................................................... 37
References & Endnotes .................................................................................................. 39

iv
Foreward From the Executive Director Denver’s food economy is thriving. Yet at the same time, many Denver residents, especially children, have limited access to healthy, affordable foods and beverages. Limited access to nutritious foods results in poor health outcomes. Creating healthy communities is not just about changing individual behaviors; it is also about changing the environments in which people live, work, learn and play. The Department of Environmental Health is proud to present this Food System Policy report as an overview of the activities by multiple City and County of Denver agencies to address some aspect of the food system – from production, distribution and retail to consumption and composting. The report is intended to help identify and prioritize food policy options that offer the greatest potential to impact population health, as well as build upon the success of programs like the LiveWell Park Hill Thriving Communities (PHTC) Initiative, which helped guide Environmental Health’s focus on food access in underserved areas. By collectively implementing broad, coordinated and evidence-based strategies across the food system, we have an opportunity to achieve the City’s health, economic and environmental sustainability goals. We also have an opportunity to change the community’s food environments so that all Denver residents can attain the health and wellbeing they deserve.
Doug Linkhart, Executive Director, Denver Environmental Health

v
Executive Summary Food insecurity, childhood obesity and environmental sustainability are interconnected and some of the most pressing challenges of the 21st century. All of these food-related issues have been given priority in Denver, where 1 child in 4 does not have enough to eat and about 3 in 10 children are considered overweight or obese. While multiple national organizations have recommended a variety of policy and environmental changes as “best practices” for increasing access to healthy food, uncertainty exists about which policies might have population level impacts on health. The goal of this report is to: Identify food system policies and best practices with an evidence-
base for impacting population health in the areas of food insecurity and childhood obesity, and
Help prioritize new and existing food system policy options for the
City and County of Denver and its partners to inform decision-making about how to reach health, economic and environmental sustainability goals.
The policy scan process for this report used the following research methods: 1. Best Practice Review: Reviewing best practices and policy
recommendations of national public health, planning, and municipal organizations.
2. Scientific Evidence Review: Assessing the scientific evidence that shows the policy’s likelihood of improving food access, increasing fruit and vegetable consumption and/or reducing body mass index at the population level.
3. Policy Review of Comparable Cities: Exploring food-related policies being implemented in cities of comparable size to Denver.
4. Stakeholder Review: Interviewing 37 key informants within the City and County of Denver and local stakeholders to identify existing food system efforts in Denver.
5. Rank and Prioritize Issues: Utilizing four community stakeholder groups, including the Denver Sustainable Food Policy Council, to rank and prioritize issues.
Signs of a Healthy
Neighborhood*
Jobs that pay a living
wage
Affordable, safe
housing
Quality schools
Access to healthy,
affordable food
Available health care
services
Access to local parks
and the natural
environment
Clean air and water
Feeling safe from
crime
Having good
interactions with
neighbors
Safe and reliable
transportation options
*California Newsreel (2008). Unnatural
causes: Is inequality making us sick?

vi
Factors that Impact Health Multiple factors impact the health of individuals and populations. Health is not solely caused by genetics or even improved by the amount of education a person has about a health topic. Health is more often influenced by the environmental contexts in which a person lives (e.g., safe neighborhoods, availability of parks and recreation centers, affordable housing, jobs that pay a living wage, quality schools). Therefore, it is critical to address these “root causes” of health to achieve the most positive population health outcomes.
Key Findings 24 national public health, planning or municipal organizations in the United States most frequently
recommended the following five policy domains as best practices to address food insecurity and/or childhood obesity.
o Healthy Food Retail (e.g., grocery and corner stores, farmers’ markets, food cooperatives) o Federal Food and Nutrition Service Programs (e.g., food stamps, free and reduced school
lunch, senior nutrition) o Agriculture (e.g., home and community gardens, farms, aquaponics) o Institutional Procurement & Vending Contracts (e.g., healthy food and beverages standards
in public venues) o Sugar-Sweetened Beverages (a consideration in 3 of the 4 domains above – e.g., soda,
flavored milk) The research on how policies in these domains affect population health is new and evolving.
However, based on the current evidence-base, there have been shown to be effective in the areas of increasing food access, consumption of fruits and vegetables, and/or reducing body mass index (BMIa). According to the United States Department of Health and Human Services’ criteria for determining the likelihood of achieving positive population health outcomes, healthy food retail, federal food and nutrition service programs, and reducing the consumption of sugar-sweetened beverages are likely to be effective. Evidence of health outcomes within the agriculture and institutional procurement domains are considered “promising” and “emerging” respectively.
11 cities around the nation with populations of approximately 600,000 (about the same size as Denver) are implementing policies within each of the domains; all but three cities have had reductions in childhood obesity rates.
All five domains align with multiple currently existing efforts and formal plans or goals (e.g., Community Health Improvement Plan, The Climate Adaptation Plan, The Mayor’s Children’s Cabinet and 2020 Sustainability goals) in many agencies within the City and County of Denver and among affiliates and partners.
a Body Mass Index (BMI) is calculated from a person’s weight and height. It is considered to be a reliable indicator of
body fatness for most people. (Source: Centers for Disease Control and Prevention 2014)

vii
The following findings at-a-glance table highlights each policy domain, the number of organizations out of 24 that recommended policies within the domain, the cities about the same size as Denver that have implemented policies in these domains, the evidence of the likelihood of the domain having a positive effect on population health, the priority ranking by local stakeholders of the policy domain, and how the domain aligns with the Denver Sustainable Food Policy Council, and the Be Healthy Denver Community Health Improvement Plan. All policy domains are superseded by higher level cross cutting factors that impact population health.
Policy Scan Findings At-A-Glance
Food System Policy
Domains
# out of 24 ntl. orgs.
Precedent in 11 cities with
population of ~600,000
Evidence of population
health outcomes
b
Local stakeholder
priority rankings
Aligns with Denver SFPC
c
Priorities
Aligns with Be Healthy
Denver CHIP
d
Healthy Food Retail
17 Austin, TX Baltimore, MD
Boston, MA Louisville, KY
Milwaukee, WI Portland, OR Seattle, WA
Washington, DC
LIKELY EFFECTIVE Access Fruit & vegetable intake BMI
1 Encourage a broad range of fresh food outlets (overlaps with SNAP priority)
Create incentives & # of grocery & convenience stores offering healthy food and beverage options
Federal Food and Nutrition Service Programs
13
Austin, TX Baltimore, MD
Boston, MA Louisville, KY Memphis, TN Portland, OR Seattle, WA
LIKELY EFFECTIVE Access Fruit & vegetable intake BMI
2
Increase SNAP redemption at farmers’ markets
Agriculture 16
All 11 Cities
PROMISING Access Fruit & vegetable intake
3
Identify city land currently underutilized & available for growing food
Increase urban agriculture and gardening
Institutional Procurement & Vending Contracts
17
Austin, TX Baltimore, MD
Boston, MA Louisville, KY Memphis, TN Portland, OR Seattle, WA
Washington, DC
EMERGING Unhealthy calorie purchases
4
Local purchasing ordinance
Implement healthy vending policies in city bldgs. & worksites; encourage the same in city partners
A special consideration
Sugar-sweetened beverages
10
Boston, MA LIKELY EFFECTIVE BMI
N/A
N/A
Multiple strategies
b Evidence classification source: USDHHS (2010). Evidence-based clinical and public health: Generating & Applying the
Evidence. Washington, DC: USDHHS Healthy People 2020. c Denver Sustainable Food Policy Council, a Mayoral appointed citizen advisory council d Denver Community Health Improvement Plan, coordinated by the Department of Environmental Health and Denver
Public Health
Ad
dit
ion
al c
ross
cu
ttin
g fa
cto
rs t
hat
imp
act
po
pu
lati
on
hea
lth
Job
s an
d L
ivin
g W
ages
, Aff
ord
able
Ho
usi
ng,
an
d Q
ual
ity
Edu
cati
on

viii
Conclusions Improving population health requires a whole food system approach and including health considerations in all policies. To move toward collective impact the City and County of Denver and its partners need to create a common agenda and a unified food system vision. Multiple City agencies and affiliates are already working together and invested in creating an innovative food economy across the food policy domains included in this report. A coordinated approach across the City to align plans and proposed goals of each agency through a strategic food action plan, can facilitate both the supply and demand for healthy and local foods that could result in positive health, economic and environmental sustainability outcomes.

1
The Food System and Health
Healthy foode is integral to health and well being. Lack of access, availability, and affordability of healthy food results in serious health, economic and social consequences for individuals and society[1]. In fact, some of the most important public and environmental health challenges of the 21st century are food security, obesity, and environmental sustainability[2][3]. The food system (See Figure 1) and related agricultural policies intersect with these health challenges are coming under increased scrutiny and are considered to be broken[4][5][6][7]. The food system cuts across multiple sectors and is comprised of all the processes needed to feed a population - “from farm to fork” – and is comprised of: growing, processing, preparing, distributing,
retailing, marketing, consuming, and disposing of food. Comprehensive approaches are
needed to reform this system, where consumers are faced with a plethora of
inexpensive, high calorie and nutritionally deficient foods and beverages[8]. Current food policies come at a cost to society by endangering environmental sustainability and adverse public health consequences[9][10].
The challenge. Food insecurity and obesity have been called “wicked problems” due to their complex and multiple causes[11][12]. There are no simple solutions. To address these issues, cities across the nation are overcoming historically siloed approaches and developing multi-sector supports and “whole food system” approaches. Strategies include policies, programs, and educational media campaigns addressing everything from agriculture to food disposal (e.g., food rescue, composting for urban agriculture). The intent of these approaches is to fix the broken food system, increase equal access to healthy foods[13] and create positive collective impactsf on health, social equity, environmental sustainability, and cultural and economic vitality[14].
e Healthy food is defined as fruits, vegetables, lean meats, whole grain, and low fat dairy products. f Collective Impact Initiatives are long-term commitments by a group of important actors from different sectors to a
common agenda for solving a specific social problem.
Food security, childhood obesity and
sustainability are some of the most
important public and environmental
health challenges in the 21st century.
Figure 1: Community-based Food System (Source: Michigan State University)

2
Food Insecurity
Many Denver residents do not know when or where they will get their next meal. According to Feeding America, about 1 in 6 adults (about 107,500 people) and 1 in 4 children (31,900 children under 18) in Denver did not have enough to eat in 2012[15]. Inadequate neighborhood food environments and poverty contribute to food insecurity, which is defined as “hunger due to having to skip a meal or having anxiety about having enough food to serve a balanced meal due to budgetary constraints”[16]. In contrast, food security exists “when all people at all times, have physical, social and economic access to sufficient, safe, and nutritious foods which meets their dietary needs and food preferences for an active and healthy life”[17].
Many Denver residents do not have equal access to nutritious foods. Accessing affordable, high-quality, and healthy food is a challenge for many families; this unequal access is often most pronounced in low-income neighborhoods of color[18]. These families may face hunger because of declining wages[19], poverty, and/or living in an area with limited or no access to nutritious and affordable foods. Limited access is typically defined as living over half a mile from a grocery store[20]. Without convenient access to larger, more affordable grocery retailers, many families have to rely on easily accessible high-calorie prepackaged foods and sugar-sweetened beverages available in convenience stores and fast food outlets[21][22]. Figure 2 is a map of areas within Denver that are underserved by full service grocery retailers. The highlighted areas represent places in the city with 1) a higher than average (>50%) percentage of residents with a low to moderate income by census block, 2) those who live more than a quarter mile from a full service grocery store. The yellow areas encompass about 49% of Denver’s population - about 295,794 people as of 2010). Until recently, Colorado had one of the fastest growing rates of childhood poverty in the nation. In 2012, 18.5% of all Colorado children were living in poverty, that percentage has now decline to 16.9%[23]. In Denver, 29.1% of children 18 years of age or younger were living in poverty in 2012[24]. The number of adults and children who qualify for Federal Food and Nutrition Service Programs administered by the United States Department of Agriculture (USDA) is another indicator of poverty. Some of these programs include: Child and Adult Care Food Program, National School Lunch Program (commonly called the free and reduce lunch program), Supplemental Nutrition Assistance Program, formerly food stamps (SNAP), and Supplemental Nutrition Program for Women, Infants and Children (WIC). Some recent Denver County data include:
National School Lunch Program - 72% of Denver Public School (DPS) students from early childhood education to high school qualify for free and reduced lunches [25]. In 2012, DPS also served over 204,111 summer meals to students.
Supplemental Nutrition Assistance Program (SNAP, formerly food stamps - 11.8% (more than 1 in 10) Denver residents participated in this program within the past 12 months[26]. The majority of participants are families with children (76%) or in households with seniors or people with disabilities (25%)[27]. Many Coloradans who could benefit from SNAP do not participate. In 2012, 69% of eligible individuals participated in the program.
About 14% of Denver families lack access
to a grocery store that offers nutritious
and affordable foods and beverages.

3
Figure
2: U
nd
erse
rved
Gro
cery R
etail A
reas in
De
nve
r (Sou
rce: D
enve
r Enviro
nm
ental H
ealth
)

4
Childhood Obesity
A growing problem worldwide. For the first time in history, childhood obesity is the reason the current generation of youth is predicted to live a shorter life compared to their parents[28]. Obesity is one of the biggest drivers of preventable chronic diseases like heart disease, stroke, type 2 diabetes and some cancers, and associated medical costs increasing from $48 to $66 billion per year by 2030[29]. Although in simple terms obesity results from eating too many calories and limited amounts of physical activity, the reasons for these behaviors are complex and multi-faceted in today’s society. Changes to the built and food environments through policies and programs, especially in school and early childcare settings, are seen as the best ways to prevent obesity and reduce health care costs[30]. Despite Colorado’s prior ranking as one of the fittest states in the nation, 21% of adults are obese and 1 in 8 children ages 2-14 is obese. In 2013, the Centers for Disease Control and Prevention (CDC) reported Colorado is 1 of 3 states in the nation where the obesity rate of low-income preschoolers is increasing; the highest rates are among children who are Hispanic (16%) or African American (19%)[31]. Among children in Denver, 16% are overweight and 15% are obese (See Figure 3)[32].
The Connection between Food Insecurity and Obesity
Hunger and obesity are two sides of the same coin. These two forms of malnutrition stem from the same broken food system and often co-exist with risk factors such as poverty, living in neighborhoods with limited access to a variety of healthy foods, and increased consumption of low-cost, high calorie foods[33]. Cycling between periods of lacking enough food and eating too much increases body fat and weight gain. The weight gain resulting from food that is filling and affordable but not nutritious is the unintended side effect of hunger[34]. The evidence of the burdens of food insecurity and obesity is sufficient to warrant action[35]. By focusing on increasing access and affordability of healthy foods, the City and County of Denver can address these problems through comprehensive policies and programs.
Figure 3: Overweight and Obesity among Children in
Denver (Source: Denver Environmental Health and Denver Public
Health)

5
Policies that Impact Population Health
Shift to “upstream” solutions. The complex 21st century challenges of food insecurity, obesity, and sustainability cannot be solved by 20th century approaches. In order to improve population health, the whole food system (See Figure 1, page 1) needs to be addressed along with socioeconomic and structural factors such as creating jobs with a living wage, affordable housing, and quality schools[36]. This focus on systems and linking socioeconomic policies and environmental interventions with health impacts require a paradigm change in how multiple sectors work together to address these overlapping
challenges[37][38]. Recognizing multiple factors influence health led to calls for “health
in all policies”[39][40] across the nation[41][42][43][44] and the world[45][46]. This comprehensive strategy aims to systematically include health considerations in all policy making across different sectors. The CDC’s health impact pyramid (Figure 4) provides a way to visualize what impacts health the most. Socioeconomic factors (e.g., income, education) at the base of the pyramid have been found to have the largest impacts on the health of a population. This is followed by changes in the environmental context in which people live, learn, work, and play. Safe neighborhoods with parks and recreation centers, affordable housing, places to buy healthy fresh food and other amenities tend to have healthier
The shift to a systems focus linking policies and
interventions with health impacts requires a
paradigm change in how multiple sectors work
together.
Figure 4: Health Impact Pyramid (Source: Center for Disease Control and Prevention, 2010)

6
residents. The next layer of the pyramid, long-lasting protective interventions, includes such things like vaccinations and fluoridated water that keep populations healthy. This is then followed by clinical health care interventions and education and counseling. These top two layers of the pyramid focus primarily on educating individuals about behavior change. Though important to the whole, these types of intervention have the smallest impact on population health and often result in only small scale, short-
term changes. Addressing the “root causes” (i.e., social determinants) of poor
health requires the examination of what impacts population health outcomes
the most[47][48]. For example, if poverty is a root cause of food insecurity, then economic development and creating jobs with a living wage has the potential to affect health outcomes among adults and children. Figure 5 provides a simple illustration of the theory of change of how addressing root causes could impact food security and community health.
Figure 5: The theory of change. How addressing root causes could impact food security and community
health
The Purpose of this Policy Scan This policy scan provides an overview and analysis of the activities of various City and County of Denver agencies to address some aspect of the food system, to help inform decision-makers about food systems policies to address food insecurity and childhood obesity. This section includes the policy scan methods, limitations, and a description of each policy domain. Each domain is an umbrella term encompassing multiple types of best practices, which include policies and environmental changes to address food insecurity and/or childhood obesity. The currently existing evidence of health outcomes is highlighted. Denver- or Colorado-based policies, programs, and activities related to healthy food access are provided along with policy examples from other cities. When available, hyperlinks are provided for easy access.
Methods Multiple methods (See Appendix A) were used to inform the findings in this report. The food policy best practice recommendations of 24 governmental and non-governmental organizations (See Appendix B) were reviewed and subsequent policy domains were presented to stakeholder groups for discussion and ranking of importance to Denver. Food policies in cities about the same size as Denver (See Appendix C) were reviewed along with reports and the peer-reviewed literature across multiple disciples to determine policy precedence and determine the evidence related to population health in those settings.
Economic development
Jobs with a living wage
Increased food security
Healthier families and communities

7
The United States Department of Health and Human Services rating criteria “proven effective,” “likely effective,” “promising,” and “emerging” for research studies was used to classify the policy domains (See Appendix A)[49]. Key informant interviews (See Appendix D) helped to identify food policy and program opportunities in Denver. These multiple methods resulted in the following overarching evidence-based policy domains:
1. Healthy Food Retail
2. Federal Food and Nutrition Service Programs
3. Agriculture
4. Institutional Procurement & Vending Contracts
5. Sugar-Sweetened Beverages
Table 1 highlights each policy domain, the number of organizations out of 24 that recommended policies within the domain, the cities about the same size as Denver that have implemented policies in these domains, the evidence of the likelihood of the domain having a positive effect on population health, the priority ranking by local stakeholders of the policy domain, and how the domain aligns with the Denver Sustainable Food Policy Council, and the Be Healthy Denver Community Health Improvement Plan. All policy domains are superseded by higher level cross cutting factors that impact population health.
Limitations
This new field of study is evolving. Challenges exist when trying to provide direction on food system policies that can impact population health outcomes. The majority of food policy and health research occurred within the last decade. Of those studies, often findings were mixed, or inconsistent, due to a variety of study-related limitations. Many studies were cross-sectional, meaning they reported on one point in time and did not include a longitudinal perspective. These types of studies shed little light on whether a particular policy or program affects health. Other studies used small sample sizes, which made it difficult to extrapolate the findings to an entire population. From a scientific standpoint, the preferred approach for measuring the effectiveness of interventions is a randomized experiment where individuals or settings are randomly assigned to a “treatment” (receives a policy or program intervention) and a control group (does not receive a policy or program intervention). Random assignments assure groups are comparable and differences in outcomes are attributed to a particular policy or program. Food system policy and environmental changes are difficult to study because one cannot control for all the potential reasons that something like food access, increased fruits and vegetable consumption, or BMIg may change. Despite these challenges, the Institute of Medicine provides policy guidance “based on the best available evidence – as opposed to waiting for [all the] possible evidence”[50]. To strengthen the findings of this policy scan, systematic reviews of food policy studies were examined to hone in on policies with the strongest evidence base and the United States Health and Human Services criteria for public health evidence was used to determine the potential effectiveness of each domain on population health.
g Body Mass Index (BMI) is calculated from a person’s weight and height. It is considered to be a reliable indicator of
body fatness for most people. (Source: Centers for Disease Control and Prevention 2014)

8
Findings At-A-GlanceTable 1: Policy Scan Findings At-A-Glance
Food System Policy
Domains
# out of 24 ntl. orgs.
Precedent in 11 cities with
population of ~600,000
Evidence of population
health outcomes
h
Local stakeholder
priority rankings
Aligns with Denver SFPC
i
priorities
Aligns with Be Healthy
Denver CHIP
j
Healthy Food Retail
17 Austin, TX Baltimore, MD
Boston, MA Louisville, KY
Milwaukee, WI Portland, OR Seattle, WA
Washington, DC
LIKELY EFFECTIVE Access Fruit & vegetable intake BMI
1 Encourage a broad range of fresh food outlets (overlaps with SNAP priority)
Create incentives & # of grocery & convenience stores offering healthy food and beverage options
Federal Food and Nutrition Service Programs
13
Austin, TX Baltimore, MD
Boston, MA Louisville, KY Memphis, TN Portland, OR Seattle, WA
LIKELY EFFECTIVE Access Fruit & vegetable intake BMI
2
Increase SNAP redemption at farmers’ markets
Agriculture 16
All 11 Cities
PROMISING Access Fruit & vegetable intake
3
Identify city land currently underutilized & available for growing food
Increase urban agriculture and gardening
Institutional Procurement & Vending Contracts
17
Austin, TX Baltimore, MD
Boston, MA Louisville, KY Memphis, TN Portland, OR Seattle, WA
Washington, DC
EMERGING Unhealthy calorie purchases
4
Local purchasing ordinance
Implement healthy vending policies in city bldgs. & worksites; encourage the same in city partners
A special consideration
Sugar-sweetened beverages
10
Boston, MA LIKELY EFFECTIVE BMI
N/A
N/A
Multiple strategies
h Evidence classification source: USDHHS (2010). Evidence-based clinical and public health: Generating & Applying the
Evidence. Washington, DC: USDHHS Healthy People 2020. i Denver Sustainable Food Policy Council, a Mayoral appointed citizen advisory council j Denver Community Health Improvement Plan, coordinated by the Department of Environmental Health and Denver
Public Health
The purpose of the policy scan is to:
1. Identify evidence-based best practices for
food system policies
2. Prioritize policy options likely to impact
population health
3.
Ad
dit
ion
al c
ross
cu
ttin
g fa
cto
rs t
hat
imp
act
po
pu
lati
on
hea
lth
Job
s an
d L
ivin
g W
ages
, Aff
ord
able
Ho
usi
ng,
an
d Q
ual
ity
Edu
cati
on
S
oci
al M
arke
tin
g, E
du
cati
on
, an
d C
om
mu
nit
y En
gage
men
t

9
Healthy food retail is defined as a variety of retail outlets selling high quality fruits and vegetables, lean meats, whole grain and/or low fat dairy products. Retail outlets include supermarkets, smaller grocery stores, corner stores, convenience stores, farmers’ markets, food cooperatives, mobile produce vendors, and other retail settings that sell fresh, affordable, and nutritious foods[51]. Seventeen organizations recommend the expansion of healthy food retail stores, like supermarkets, in low-income areas as part of a multi-pronged approach to increase access to healthy food access[52] (See Appendix B). In 2011, the City and County of Denver’s Food Access Task Force “found compelling health and economic reasons for expanding access to grocery retail in low income communities in Denver”[53]. This food advocacy network published their guidance for stimulating grocery development Healthy Food for All: Encouraging Grocery Investment in Colorado . Guidance included:
1. Prioritize food retail and enhance City and County of Denver systems to coordinate departments and services for grocery retail development
2. Partner with local transit agencies to promote safe, affordable and efficient transportation services for neighborhoods lacking healthy food retailers
3. Establish a fresh food finance fund
4. Improve the participation rate among people eligible for SNAP.
Evidence of Health Outcomes
The presence of a full service grocery store can have multiple positive outcomes on a community.
Having a grocery store in a neighborhood contributes to the economic vitality of
the area by creating jobs, anchors other development and boosts housing
values[54]. Food tends to be more affordable and also healthier in full-service supermarkets as opposed to other options such as corner stores and fast food restaurants[55]. Living within close proximity to a grocery retailer has been associated with increased access to healthy foods, food security, and lower rates of obesity and other diet-related diseases[56][57][58][59]. Other studies have shown a relationship between grocery store and corner store access and increased fruit and vegetable intake[60][61][62][63]. One study of low-income teenagers found higher fruit and vegetable intake and lower BMI when they had greater access to supermarkets and there were pricing differentials between produce and fast food[64]. However, other studies found no conclusive evidence of a direct link between easier access to grocery retail and health outcomes like eating more fruit and vegetable or a reduction in BMI rates[65][66][67]. These inconsistent findings suggest the importance of understanding other community environmental factors influencing access such as transportation, pricing, store inventories, and the cultural
appropriateness of the food being sold. We need to shift from solely thinking about
HEALTHY FOOD RETAIL

10
physical proximity of grocery stores to ensuring people with lower incomes have
greater purchasing power[68]. For example, the price of fruits and vegetables rose much faster in the last 30 years than the prices of other consumer goods like sugar-sweetened beverages and prepackaged foods[69}.
Healthy food financing is a frequently recommended intervention strategy to incentivize and open healthy food retail stores. The United States Department of Health and Human Services leads a national Healthy Food Financing Initiative modeled on the Pennsylvania Fresh Food Financing Initiative. This program has gained national attention because it has committed over $12.1 million in grants and $73.2 million in loans to applicants. Their funded projects are expected to create over 5,000 jobs and over 1.67 million square feet of fresh food retail across the state. Based on the Denver Food Access Task Force guidance, a Colorado Fresh Food Financing Fund (CO4F) was created. Established in 2013, the CO4F finances grocery stores and other forms of healthy food retail in underserved communities throughout Colorado. Increasing other types of healthy food retail such as farmers’ markets or farm stands in low-income neighborhoods is another way to increase access to healthy foods. There is evidence to suggest that these markets increase access to fruit and vegetables[70], increase the likelihood of purchasing a larger variety of produce [71], and increased self-reported fruit and vegetable consumption[72]. Including education efforts (e.g., recipes, cooking classes) at farmers’ markets has also been found to have a substantial affect on customer consumption of produce[73].
Existing Food System Activities Be Healthy Denver - Community Health Improvement Plan (CHIP) – Includes a strategy to create
incentives and increase number of grocery and convenience stores offering healthy food and beverage options. The Department of Environmental Health, Denver Public Health and multiple partner agencies are implementing this plan.
Be Healthy Denver – How Neighborhood Planning Affects Health in Globeville and Elyria Swansea – This Health Impact Assessment (HIA) includes recommendations to develop grocery retail, implement a healthy corner store program, and promote new sources of healthy food such as a farmers markets in the redeveloped National Western Center.
11
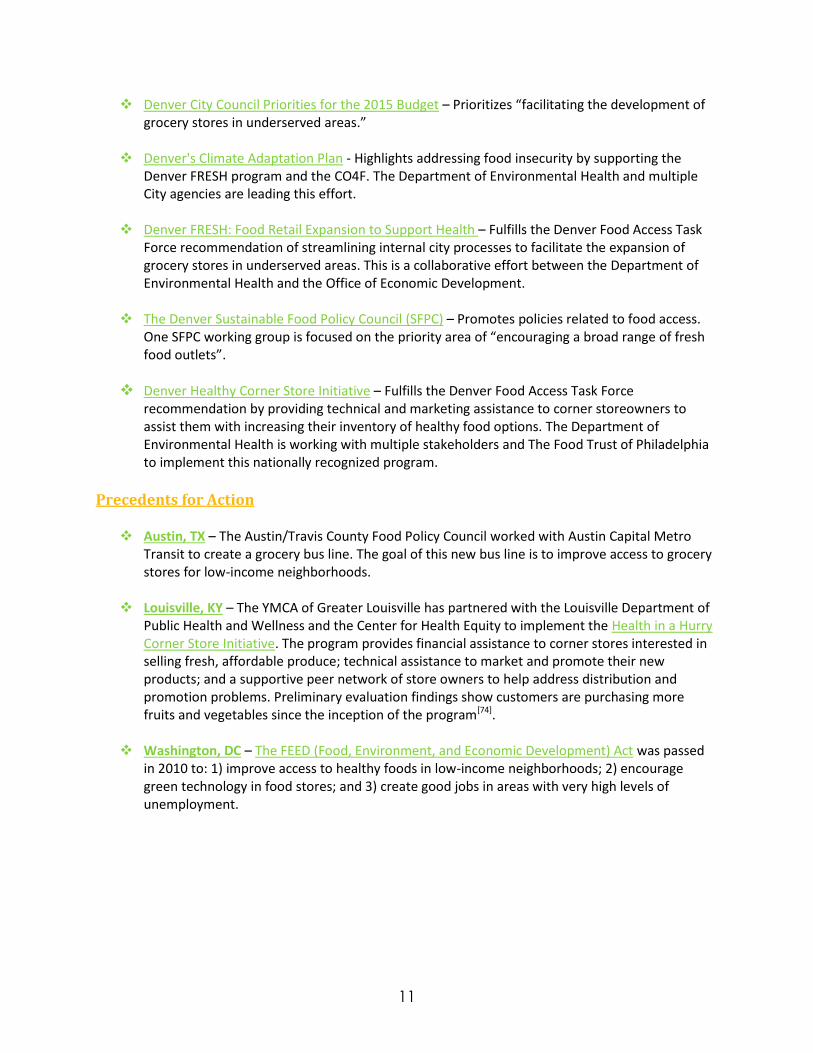
Denver City Council Priorities for the 2015 Budget – Prioritizes “facilitating the development of grocery stores in underserved areas.”
Denver's Climate Adaptation Plan - Highlights addressing food insecurity by supporting the
Denver FRESH program and the CO4F. The Department of Environmental Health and multiple City agencies are leading this effort.
Denver FRESH: Food Retail Expansion to Support Health – Fulfills the Denver Food Access Task Force recommendation of streamlining internal city processes to facilitate the expansion of grocery stores in underserved areas. This is a collaborative effort between the Department of Environmental Health and the Office of Economic Development.
The Denver Sustainable Food Policy Council (SFPC) – Promotes policies related to food access.
One SFPC working group is focused on the priority area of “encouraging a broad range of fresh food outlets”.
Denver Healthy Corner Store Initiative – Fulfills the Denver Food Access Task Force
recommendation by providing technical and marketing assistance to corner storeowners to assist them with increasing their inventory of healthy food options. The Department of Environmental Health is working with multiple stakeholders and The Food Trust of Philadelphia to implement this nationally recognized program.
Precedents for Action Austin, TX – The Austin/Travis County Food Policy Council worked with Austin Capital Metro
Transit to create a grocery bus line. The goal of this new bus line is to improve access to grocery stores for low-income neighborhoods.
Louisville, KY – The YMCA of Greater Louisville has partnered with the Louisville Department of
Public Health and Wellness and the Center for Health Equity to implement the Health in a Hurry Corner Store Initiative. The program provides financial assistance to corner stores interested in selling fresh, affordable produce; technical assistance to market and promote their new products; and a supportive peer network of store owners to help address distribution and promotion problems. Preliminary evaluation findings show customers are purchasing more fruits and vegetables since the inception of the program[74].
Washington, DC – The FEED (Food, Environment, and Economic Development) Act was passed
in 2010 to: 1) improve access to healthy foods in low-income neighborhoods; 2) encourage green technology in food stores; and 3) create good jobs in areas with very high levels of unemployment.

12
Healthy Food Retail Policy Options
1. Diversify, upgrade, and expand currently existing retail outlets to enable them to offer healthy food options.
2. Provide technical assistance, business development, and marketing assistance to healthy corner stores and small and medium sized grocery stores in underserved areas.
3. Decrease the relative price of produce and healthy foods compared to unhealthy (competitive) snack foods and beverages items available in a variety of retail environments.
4. Partner with local transit agencies to promote safe, affordable, and efficient transportation services for neighborhoods lacking access to healthy food retailers.
5. Incentivize healthy grocery retail in transit oriented development projects.
6. Support farmers’ markets with electronic benefit transfer (EBT) technology to accept SNAP or WIC in communities underserved by grocery retail (e.g., zoning, land use, health department regulations, insurance needs).
7. Continue to streamline City systems and enhance outreach to open healthy retail outlets.
8. Collaborate with local partners, including farmers and food distributors, to coordinate and improve the availability of healthy, affordable produce in healthy food retail outlets.
Images by: Mondi Mason

13
Federal food & nutrition service programs potentially protect against childhood obesity, improve dietary intake, reduce food insecurity, and improve health, especially among children[75]. They are the first line of public policy defense against food insecurity and are included as part of the President’s essential strategies for ending childhood hunger by 2015[76]. Thirteen (See Appendix B) national organizations recommended the following programs as best practices to alleviate hunger and improve dietary intake and health, especially among children[77]:
Child and Adult Care Food Program (CACFP) - for meals and snacks in early childcare settings and non-residential adult day care centers
National School Lunch Program - free and reduced price lunches to children. Other similar programs include the School Breakfast Program and Summer Food Service Program
Supplemental Nutrition Assistance Program (SNAP, formerly food stamps) – provides food benefits to individuals with low-incomes. The benefits can be used at most grocery stores and some farmers’ markets. Often includes nutrition, cooking and shopping education
Special Supplemental Nutrition Program for Women, Infants and Children (WIC) – provides food benefits and education to eligible low-income women, infants & children. The benefits can be used at some grocery stores.
These programs are heavily influenced by federal agricultural food production policies that do not
always reflect the research about what foods promote health[78]. The federal government
provides very little to support for the production of the fruits and vegetables,
which its own dietary guidelines say should make up half the food on our plates. In 2011, about $1.6 billion was spent to subsidize and insure “specialty crops” (i.e., produce) whereas about $11 billion was spent to subsidize and insure the “commodity crops” (i.e., corn and soy) used for sugar-sweetened beverages and corn-fed beef products like hot dogs[79]. Nutrition standards are starting to be applied to FNPs. The challenges now are that 1) neither the monthly benefit amount nor the reimbursement rate reflects current food prices, and 2) Colorado falls short of fully enrolling eligible households, and thereby misses the economic benefits of the programs[80]. The average monthly SNAP benefit is about $137.00 a month for each household member, about $1.50 per person per meal despite a 2008 USDA study estimating it costs $2.50 per day to satisfy the U.S. Dietary Guideline’s recommended fruit and vegetable intake[81]. School reimbursement rates for 2014-2015 are $1.62 for each free breakfast served, $1.32 for each reduced-cost breakfast, and .28 cents for each full priced breakfast[82]. All federally funded nutrition programs reimburse states only to the extent resources are used. In the case of WIC, current Colorado policy limits where and what types of retail outlets are authorized to accept benefits, thus limiting the potential for increasing access to healthy foods. The average monthly supplemental WIC benefit is about $40.60.
FEDERAL FOOD & NUTRITION
SERVICE PROGRAMS

14
When monthly food benefits run out, families turn to food pantries. Colorado food pantries are experiencing historic demand due to the loss of jobs during the recession as well as recent fires and floods[83]. Food pantries often receive prepackaged and unhealthy products as donations, but little to no healthy options like produce or whole grain, lean meat and low-fat dairy products. A recently passed Colorado law HB 14-1119 allows individuals to get a tax credit for the donation of these types of foods to a hunger-relief charitable organization. This law provides one way to support programs that increase access to healthy, local foods and to incentivize farmers and others to donate food that might otherwise go to waste.
Evidence of Health Outcomes Improving dietary intake is critical to preventing food insecurity and obesity, and positively addressing other health outcomes. Researching outcomes of Federal Food and Nutrition Services Programs is complicated because: 1) participants tend to be more financially and nutritionally worse off than those who do not participate in these programs. This difference may blur the causes of any dietary changes that might occur, and 2) the amount or length of time an individual or family has received FNP benefits is often not considered in studies. Both of these limitations make it hard to tease out reasons for any associations between FNP participation and outcomes. However, despite these challenges, studies showed FNP participation in certain programs improved dietary intake[84] and possibly even provided a protective effect on obesity risk. Strong evidence shows participating in breakfast portion of the federal free and reduced school
meal program improves children’s food security, breakfast consumption, BMI, and academic performance [85]. Studies of children found those who participate in the school lunch and breakfast programs are four times more likely to consume milk and get an adequate daily intake of key nutrients than non-participants[86].
Changing the WIC food package to include fruits, vegetables, whole grains, and nonfat milk has been found to increase healthy food consumption and decrease BMI in children 2 to 4 years of age[87]. Between 2008 and 2011 children participating in WIC showed significant reductions in obesity prevalence among low income preschoolers in 18 states[88].
A national study of 772 low-income families found that girls from food insecure households who participated in SNAP and/or school lunch and school breakfast programs had a lower risk of being overweight compared to food insecure girls from non-participating households[89].
Image by: Mondi
Mason

15
A 2005-2006 study of a national sample of women found those with a larger SNAP benefit amount had significantly lower BMI and waist circumference [90]. Another study found the mean BMI of women receiving at least $150 in SNAP benefits per household member was lower than the mean BMI of women who received less than $150 in benefits per household member[91].
There is some evidence that the USDA’s The Farmers’ Market Nutrition Program (FMNP) which
includes SNAP, WIC, and the Senior Nutrition Program, improves access to and consumption of fruits and vegetables, but this effect is dependent on the among of the benefit given to recipients[92].
Incentivizing a SNAP or WIC recipient to purchase fruits and vegetables not only has the potential for
increasing health outcomes, but it also drives local economic impacts. One study suggested every $5
in new SNAP benefits could generate $9 in local spending at supermarkets,
grocery stores, and other authorized SNAP retailers [93]. In 2013, $824 million of SNAP benefits contributed the Colorado economy[94]. Recent modeling studies show that increased SNAP expenditures can also lead to maintaining or generating jobs to support the increased demand for products[95]. A recent evaluation study of SNAP and WIC incentive programs for purchasing produce at farmers’ markets showed a 25% increase in fruit and vegetable consumption among recipients[96].
Existing Food System Policies and Activities
Breakfast After the Bell Nutrition Program (HB 13-1006) – Offers breakfast at no charge to each student enrolled in a public school with 70% or more students who are eligible for free or reduced priced lunch under the National School Lunch Program.
Denver's Climate Adaptation Plan - Highlights increasing participation rates among Coloradans eligible for SNAP to address food security.
Denver Sustainable Food Policy Council – Prioritizes increasing SNAP redemption opportunities at farmers’ markets.
Healthy Hunger-Free Kids Act of 2010 – This federal policy authorizes funding and sets policy for USDA’s core child nutrition programs (e.g., WIC, school lunch and breakfast programs, and CACNP); focuses on improving nutrition standards, developing school wellness policies.
Healthy Meals for Youth (after school meals and summer food programs) – Ensures all children
receive free, safe and healthy meals all year long to prevent hunger and improve overall health. Meals and snacks are low in fat, preservative free, and are always served with fresh fruit. Sponsored by multiple partners: Denver Office of Children's Affairs, Denver Parks and Recreation, Denver Public Schools, Food Bank of the Rockies, and Hunger Free Colorado. Funded by the US Department of Agriculture Food and Nutrition Services.
SNAP into Health – Enrolls SNAP eligible households in Denver. Implemented by partners Denver Human Services and Hunger Free Colorado.

16
Denver Human Services (DHS) Farm Stand – Sells produce at the Castro Building – the location of the main DHS office. Has EBT technology and can accept SNAP. The farm stand is sponsored by the Denver Botanic Gardens. This program has been so successful there are plans to expand to other locations.
Precedents for Action Austin, Texas - City Council passed a resolution for the City to help fund a position with a
partner organizations to increase and track SNAP enrollment. Sustainable Food Center promotes fresh produce grown within 150 miles of Austin at its farmers’ markets. In 2012, they launched the Double Dollar Incentive Program. This program allows participants to double the dollar amount spent on fruits and vegetables at the market. Eligible shoppers are matched dollar-for-dollar up to $20 each week. This program is being implemented with the support of the City, which is facilitating the establishment of EBT technology in a variety of healthy food retail outlets (e.g., farm stands, farmers’ markets, mobile venues).
Memphis, TN - Double Green$ - Provides a dollar-for-dollar match up to $10 when shoppers spend their SNAP benefits at participating farmers’ markets. Shoppers go to the market booth and swipe their EBT card, receiving tokens that can be spent with all vendors at the market that sell fresh fruits and vegetables. This program has been shown to increase attendance and sales at farmers’ markets, increases revenue for farmers, and increases access to healthy foods for low-income residents.
Portland Oregon - Fresh Exchange is administered by the Farmers’ Market Fund. This money
matching program for SNAP recipients provides shoppers using SNAP benefits an additional $5 per week in matching tokens to spend on fresh local food.
Food and Nutrition Services Programs and Policy Options
1. Continue to expand the outreach to and enrollment of eligible families into all federal Food and
Nutrition Services Programs to ensure maximum reimbursement rates of federal dollars.
2. Enhance healthy food options for participants in all federal nutrition programs.
3. Expand EBT technology to a variety of healthy food retail outlets (e.g., corner stores, farmers’ market) so they can accept SNAP and WIC benefits.
4. Increase the number of healthy food retailers (grocery and corner stores) and farm-to-consumer venues (farmers’ markets, community supported agriculture) accepting SNAP and WIC.
5. Develop SNAP, WIC and Senior Nutrition benefit incentive programs to promote the purchase of fruits and vegetables from a variety of healthy food retail outlets.
6. Enhance nutrition education (e.g., cooking classes, grocery store or farmers’ market tours) for participants in a variety of Food and Nutrition Service Programs to increase demand for produce and help participants work within a limited budget.

17
Agriculture, urban or rural, is where the availability of produce and other nutritious foods start. This is the beginning of the “pipeline” for increased access to healthy foods. Sixteen of twenty-four national organizations recommended agricultural strategies, especially “urban agriculture”, (See Appendix B) as a way to impact health. Urban agriculture can take place in a variety of spaces such as community and home gardens, urban and peri-urban farms, vacant lots, schools, rooftops, and public lands. Community gardens especially are seen as a means to cultivate fruits and vegetables, and depending on local laws, keep bees, raise chickens, goats and other livestock. The economic development aspects of agricultural policies include finding ways to support farmers, farmers’ markets, community supported agriculture, and food cooperatives. Historically, the Victory Garden program during World War II with political backing of the U.S. government developed an estimated 20 million gardens and produced approximately 40% of fresh vegetables consumed in the US at that time. The success of this program suggests local agricultural efforts have the potential to produce large scale outcomes, especially with adequate support by local, state and federal governments[97].
Evidence of Health Outcomes There is promising evidence about the health benefits of urban agriculture, especially in the form of community gardens [98]. Research has shown that there is an association between gardening and dietary knowledge and increase fruit and vegetable consumption compared to those who do not garden. Other outcomes include improved physical activity levels, and increased community engagement, a reduction in stress and a sense of safety, and the economic vitality of a neighborhood[99][100].Some of the most rigorous garden-related studies have been conducted with Denver Urban Gardens and the Colorado School of Public Health . These studies explored the social and health benefits of gardeners who participate in community gardens and found that over half of participants met the national dietary guidelines for fruit and vegetable intake compared to those who did not garden[101]. However, the question becomes, how do we “scale up” these impacts on individuals or members a neighborhood to a population level? One Denver-based mapping study suggested expanded urban agriculture efforts could contribute to urban food supplies[102]. It is difficult to draw a direct association between agriculture policies and health outcomes, however there is a promising and growing body of research showing school and community gardens lead to positive personal and community benefits.
Existing Food System Policies and Activities Be Healthy Denver – How Neighborhood Planning Affects Health in Globeville and Elyria Swansea
– Includes a recommendation to promote new sources of healthy foods within the redeveloped National Western Center, such as community gardens.
Blue Bear Farms - One of the largest urban farms in the country located at a convention center. This
farm is part of Mayor Hancock’s Denver Seeds Initiative. It provides fresh, locally sourced produce to the Colorado Convention Center’s catering company, Centerplate.
AGRICULTURE
http://www.ucdenver.edu/academics/colleges/PublicHealth/Apply/youridentity/Profiles/Pages/LittJ.aspx

18
City Kitchen Food Hub Feasibility Study – Outlines a plan to create a community destination for
urban agriculture, food storage, processing and distribution, education, business incubation and health screenings among other activities. Conducted by Community Planning and Development as part of the Denver Livability Partnership.
The Colorado Charitable Crop Donation Act (HB-1119) - Offers Colorado producers a 25% tax credit for the wholesale value of the food they produce and donate to qualified no-profit food distribution organizations.
The Colorado Cottage Food Act (Senate Bill 12-048) – Allows individuals to sell certain types of “cottage food” products (e.g., teas, dehydrated produce, honey, spices) in an unlicensed home kitchen. It also allows the sale of whole eggs and uncut produce.
Colorado Farm to School Task Force - Created in 2010 by the Colorado General Assembly to “study,
develop and recommend policies and methods to best implement a Farm to School program.”
Denver's 2020 Sustainability Goals - Coordinated by the Office of Sustainability this effort includes 12 government and 12 community goals, one of which is “grow and process at least 20% of the food purchased in Denver entirely within Colorado”.
Denver's Climate Adaptation Plan - Encourages local urban agriculture as a strategy to address food
insecurity by: identifying vacant lots, financing new community and school gardens, strengthening regulations to protect the productive capacity of gardens, reducing tax barriers, and establishing regional food hubs for processing and distribution of local foods.
Denver County Jail - Explored the use of commercial scale aquaponics within the penal system. This
program has many potential benefits including: growing a portion of the prison’s food on site, utilizing inmate labor to construct and maintain the system as part of education and job training, and rehabilitative work emphasizing care for living organisms.
The Department of Environmental Health – Coordinates the Sustainable Neighborhoods Program
which supports neighborhoods in deepening their sustainability efforts, while getting support and recognition from the City. Many neighborhood projects are related to urban agriculture and healthy food access. Currently West Colfax, North City Park, and Chaffee Park-Regis participate in the program.
Denver Housing Authority’s 2013-2015 Strategic Vision - Engages partners in neighborhood food hub development as part of their efforts to encourage healthy living choices. Some examples include:
Denver Botanic Gardens - Oversees the teaching and management of the vegetable garden at Denver Housing Authority’s Mariposa development. This food is provided to residents.
Denver’s Sustainability Park at 2500 Lawrence Street serves as a demonstration and testing site for innovative renewable energy, green building, and urban farm installations.
Denver Parks and Recreation - Works with Grow Local Colorado to convert existing flower plots in Denver parks to edible demonstration gardens. This food is donated to local food pantries.

19
Denver Public Schools (DPS) - Partners with many organizations to experiment with farm-to-school programs that include gardens, greenhouses, and urban farms. Currently there are over 100 school gardens or farms across DPS.
Denver Sustainable Food Policy Council – Worked with Community Planning and Development, the Department of Environmental Health, Colorado State University Cooperative Extension, the Office of Sustainability, and the LiveWell Denver Regional Collaborative to support the July 14, 2014 passage of a zoning code amendment Fresh Produce and Cottage Foods Sales Home Occupations
Denver Office of Economic Development (OED) – Provides financial and community resources to
innovative businesses and non-profit organizations such as Denver Urban Gardens, Growhaus, and Re:vision. These local community-based organizations are committed to using urban agriculture (i.e., community gardens, farmers’ markets, CSAs, aquaponics, food hubs) as a means to provide healthy, affordable food, and build community connections.
Food Producing Animals Ordinance – In 2011, Denver City Council adopted this ordinance that
allows eight chickens or ducks, and two dwarf goats to be raised on a property.

20
Precedents for Action Milwaukee, WI – In 2012 the City of Milwaukee conducted an urban agriculture code audit to
identify: 1) needed clarifications of existing code language, 2) potential barriers to the practice or expansion of urban agriculture, and 3) opportunities to provide explicit support for and regulation of urban agriculture uses.
Seattle, WA – The City of Seattle has resolved to support the maintenance and long-term
expansion of the P-Patch Garden Program. This is executed through 1) inter-agency and intergovernmental cooperation among the parks department, the engineering department, the school district, and housing authority, 2) the preservation and protection of community gardens in the Comprehensive Plan, 3) budgetary, evaluation support, and outreach support.
Baltimore, MD – The City of Baltimore’s Power of Dirt Project has streamlined its “adopt-a-lot”
process so residents and community groups can redevelop blighted properties into spaces for urban agriculture and transfer lots to Land Trusts for their long-term preservation as open space.
Agriculture Policy Options
1. Act on findings of recent Denver land audits and allow agricultural uses on vacant land.
2. Strengthen distribution systems to small and medium sized retailers to increase food affordability.
3. Grow produce on the grounds of public agencies.
4. Incentivize and increase the production, distribution and procurement from Colorado farms.
5. Increase the number of farm-to-institution programs in schools, early childcare settings, restaurants, hospitals, and government institutions.

21
Institutional procurement and vending contracts refers to public service venues capitalizing on existing operational infrastructures to improve the availability of healthy foods and beverages by exercising their power to buy and sell goods and services[103]. Public service venues include government offices, early childcare settings, schools, college/university campuses, jails, faith-based organizations, theme parks, senior centers, and hospital systems[104]. Adopting a healthy procurement or vending policy was recommended by 17 of 24 national organizations (See Appendix B). Healthy procurement means revising purchasing policies to institute buy local policies and nutrition standards (e.g., limited calories, salt, sugar and/or fat)[105] to reduce or eliminate the availability of “competitive” unhealthy foods and beverages and make healthy eating the “default” choice[106]. Competitive foods are widely available in many public venues and sold in vending machines, cafeterias, and snack bars. Schools districts around the nation are already leading the way by implementing healthy vending standards and limiting the types of foods and beverages sold at schools outside of (and in competition with) federal nutrition programs[107]. If the purchasing power is large enough, public venues may be able to influence the types of foods available by creating greater demand for and supply of healthier products. The Colorado Farm to School movement is one example of working with local producers to provide healthier, nutrition options to local institutions.
Evidence of Health Outcomes Most studies focus on food and beverage vending in early childcare centers or schools because between 30-50% of children’s calorie intake occurs in these types of settings. These “captive settings” facilitate studying the effects of vending policy changes on food and beverage consumption among children. However, although procurement and vending policy interventions are becoming increasingly popular, there are still many unknowns about contexts and processes that facilitate the effectiveness and sustainability of such interventions[108]. One systematic review of 26 studies about healthy eating policy changes in early childcare settings found food policy intervention (which may include institutional procurement standards) influence vegetable consumption among children, especially if changes were accompanied with education[109]. Some studies of school-aged children found less weight gain over time among children in states with strong snack food (competitive food) policies in schools compared to those children in states without strong laws[110]. While studies of policies addressing point-of-purchase prices show declines in youth purchases, only small or no reductions in calorie
INSTITUTIONAL PROCUREMENT &
VENDING CONTRACTS

22
consumption or changes in BMI were found among these youth. Researchers speculate the small decrease in consumption and any subsequent small BMI changes may be attributed to the multiple sources of unhealthy competitive foods and beverages outside of school environments. There is limited rigorous research and direct evidence of farm-to-school program effects on fruit and vegetable consumption among youth. Farm-to-school programs that include multiple components (e.g., cooking classes, nutrition education, school gardens) have the potential to increase knowledge, willingness to try, and the intake of fruit and vegetables among school children. However, there is a paucity of research to date[111].
Existing Food System Policies and Activities
Be Healthy Denver - Community Health Improvement Plan (CHIP) – Recommends implementing
healthy vending policies and practices in City buildings and worksites; encourages the same in City partner organizations such as hospitals, and child facing institutions (e.g., theme parks).
Denver Office of Sustainability – 2020 Sustainability Goals states that at least 25% of food
purchased through Denver’s municipal government supply chain should be from local sources produced (grown and processed) entirely within Colorado.
Farm-to-School Healthy Kids Act (SB10-081) - Passed in 2010, this Colorado law establishes an
interagency task force to develop farm-to-school policies. The resulting Farm-to-School Task Force supports the development of regional farm-to-school networks across the state.
Increase the Inclusion of Nutritious Choices in School Vending Machines (SB103) – This Colorado law concerns the inclusion of nutritious choices in school vending machines. Directs school districts to adopt a vending policy where at least 50% of all items offered shall be healthful foods and beverages. Prohibits school districts from entering into a new or renewing a contract including unhealthy foods or beverages in such machines unless certain conditions are met.
Improving Children's Nutrition (SB81) – This Colorado law encourages each school district board
of education to adopt a policy insuring a child's access to healthful food and beverages on the school premises, nutritional information, daily physical activity, and instruction regarding proper nutrition and health, encourages each district board to adopt rules regarding competitive food availability and also to adopt a local wellness policy as provided for in the federal Child Nutrition and WIC Reauthorization Act of 2004.

23
Precedents for Action Memphis, TN – The Healthy Memphis Common Table started the Million Calorie Reduction
Match to address obesity. The county wide project is enlisting corporations, public venues, and other organizations to transform their food and beverage environments by adopting and implementing policies related to healthy meetings/events and healthy vending.
Seattle, WA – Seattle Public Schools developed a policy on the distribution and sales of
competitive foods requiring all beverages, except milk, be priced higher than the price for bottled water. In addition, vendor contracts for sales of competitive foods are not allowed to include incentives for increasing students’ consumption of foods or drinks.
Institutional Procurement and Vending Policy Options
1. Create nutrition standards and healthy, local institutional procurement/vending policies for multiple types of public venues (e.g., government, hospitals, institutions of higher learning).
2. Work with vendors to decrease the relative cost of more healthful foods and beverages.
3. Develop procurement contracts supporting the purchase of local and healthy products in a variety of venues.
4. Eliminate unhealthy “competitive” foods and beverages from institutions.
5. Incentivize institutions to buy locally grown agriculture products.
6. Include farm-to-institution (e.g., schools, childcare settings, hospitals) programs as a source for healthy, local food procurement and as a way to increase the supply and demand of healthy, local foods.

24
Sugar-sweetened beverages (SSBs) include sodas, flavored milk, sports drinks, sugary gourmet coffees and teas, and fruit juice. Beverage policies cut across all the policy domains included in this report with the exception of urban agriculture. The marketing of these beverages influences purchasing preferences, especially among children, though it is uncertain if limiting exposure to advertising affects consumption[112]. Finding ways to replace consumption of SSBs with healthier options with low or no amounts of sugar and calories (e.g., water, unflavored low fat milk, 100% fruit or vegetables juice in limited quantities) may aid obesity prevention efforts[113].
The American Heart Association recommends consuming no more than six to
nine teaspoons of sugar each day, yet a 20-ounce bottle of soda contains about
16 teaspoons of sugar[114]. Studies suggest price differentials between water and SSBs, or a one-cent per ounce tax on SSBs, would result in reduce SSB consumption and obesity rates. The Congressional Budget Office estimates a nation-wide one-cent per ounce tax on a 20-ounce bottle could result in $13.2 billion in tax revenue in one year[115]. More recently, a study estimated a one-cent tax on SSBs would reduce consumption by 24% and raise about $80 billion over a 5-year period[116].
Evidence of Health Outcomes There is overwhelming evidence of the link between consuming SSBs and weight gain, higher obesity rates and diabetes[117][118][119]. Studies of school vending and SSB policies found decreased consumption of SSBs per day by students and increased healthier vending machine options. Other studies of educational interventions about drinking water led to decreased SSB consumption and increased water consumption among school-aged children[120]. However, if other school venues such as concessions, school stores, and school events are not also addressed, this negates any positive outcomes[121].
Existing Food System Policies and Activities Beverage policy for school districts and schools (1 CCR 302-2) – This regulation describes the
rules for the administration of the healthy beverage policy for the Colorado Charter School Institute. It describes beverages school districts, and schools, are allowed to sell to students in elementary, middle and high schools. It also requires beverages that satisfy minimum nutritional standards based in science and established by national organizations.
Concerning Nutrition in Schools (SB129) – This Colorado law regulates the sale of beverages in schools and requires beverages sold to satisfy minimum nutritional standards. Boards of education are required to adopt policies ensuring student access to healthy food.
SUGAR-SWEETENED BEVERAGES

25
Denver Public School District – An active partner in Denver’s Community Health Improvement Plan, DPS has comprehensive approaches to school nutrition. Their “one vend” concept places all food and beverage vending under the management of the District’s Food and Nutrition Department. Healthier products are promoted by allowing only water to be sold in elementary schools, allowing only water or physical activity graphics on vending machine, and requiring water to be priced less than other beverages.
Eliminate candy and soda sales tax exemption (HB 10-1191) – This Colorado law narrows the
existing state sales and use tax exemptions so candy and soft drinks are no longer exempt from such taxes.
Denver Metro Partners for Healthy Beverage Consumption – A regional partnership of six local
health departments increasing the capacity of the region to implement healthy beverage policies and practices in seven metro Denver counties.
Precedents for Action Boston, MA – Citing a link between the consumption of sugary beverages and rising obesity
rates and health care costs, Mayor Thomas M. Menino issued an executive order requiring City departments to take steps within six months to phase out the sale, advertising, and promotion of sugary beverages on City-owned property. The policy applies to cafeterias, vending machines, concession stands, beverages served at meetings, City-run programs, and events where food is purchased with City dollars. The City’s policy mirrors the Boston Public School District’s 2006 ban on soda and junk food from all vending machines, snack lines, and a la carte foods throughout the district’s 135 schools. Boston Public Health Commission created a Healthy Beverage Toolkit to help municipal agencies and other organizations to implement similar policies. Recent studies have found subsequent reductions in SSB consumption among students[122].
Austin, TX – Aiming to increase student water consumption and reduce sugar-sweetened beverages, five school districts (n=30) schools implemented beverage policies and environmental changes as a part of the “get ur H2O” campaign. Strategies included upgrading water fountains, including hydration stations, “water first” policies, posters/item promotion, and teacher promotion. Student consumed significantly more water versus those schools that did not implement policies and environmental changes.
Portland, OR (Multnomah County) – Created an educational campaign called “it starts here” that highlights how many packs of sugar there are in a various sugary drinks and emphasizes the amount of activity necessary to burn off the extra calories in sugary drinks. The campaign features online ads, public service announcements, outdoor signage, displays in public spaces and downloadable posters.

26
Sugar-Sweetened Beverage Policy Options
1. Increase access to water fountains and safe, potable water in public venues to encourage water consumption.
2. Work with beverage vendors to implement price differentials between water, milk and SSBs.
3. Implement nutrition standards for foods and beverages in schools and early childcare settings, government institutions and other employers.
4. Limit and restrict the sale, advertising, and promotion of SSBs in public venues.
5. Work with supermarkets to address the cooperative marketing/placement agreements with beverage companies.
6. Work closely with local, state and national partners to pursue implementation of an
excise tax on the manufacture and importation of beverages with sugar or high-fructose corn syrup.

27
Table 2: Policy Options At-A-Glance
Healthy Food Retail Support the City Council’s 2015 budget priority to develop grocery stores in
underserved areas.
Continue to streamline City systems and enhance outreach to open healthy retail
outlets, especially for small to medium sized stores.
Partner with local transit agencies to promote safe, affordable, and efficient
transportation services for neighborhoods lacking access to healthy food retailers.
Incentivize healthy grocery retail in transit oriented development projects.
Provide technical assistance, economic development, and marketing assistance to
healthy corner stores and small and medium sized grocery stores in underserved areas.
Collaborate with local partners, including farmers and food distributors, to coordinate
and improve the availability of healthy, affordable produce in healthy food retail
outlets.
Expand year-round farmers’ markets with EBT technology to accept SNAP or WIC in
neighborhoods underserved by grocery retailers.
Federal Food and
Nutrition Service
Programs
Continue to expand the enrollment of eligible families into all federal Food and
Nutrition Services Programs to ensure maximum reimbursement rates of federal dollars.
Increase the number of healthy food retailers (grocery and corner stores) and farm-to-
consumer venues (farmers’ markets, community supported agriculture) accepting
SNAP and WIC.
Develop SNAP WIC benefit incentive programs to promote the purchase of fruits and
vegetables from a variety of healthy food retail outlets (e.g., grocery retailers, farmers’
markets, food cooperatives).
Enhance nutrition education (e.g., cooking classes, grocery store or farmers’ market
tours) for participants in a variety of Food and Nutrition Service Programs to increase
demand for produce and help participants work within a limited budget.
Agriculture Act on findings of recent vacant land audits and allow agricultural uses on vacant
land, including City-owned property
Increase the production, distribution and procurement (i.e., farm-to-institution
programs) from Colorado farms.
Incentivize the purchase of Colorado produce.
Institutional
Procurement and
Vending Contracts
Create nutrition standards and healthy, local institutional procurement/vending
policies for multiple types of public venues (e.g., government, hospitals, institutions of
higher learning).
Work with vendors to decrease the relative cost of more healthful foods and
beverages.
Include farm-to-institution programs as a source for healthy, local food procurement
and as a way to increase the supply and demand of healthy, local foods.
Sugar-Sweetened
Beverages
Increase access to water fountains and safe, potable water in public venues to
encourage water consumption.
Limit or restrict the sale, advertising, and promotion of sugary beverages in public
venues.
Work with beverage vendors to implement price differentials between water, milk and
SSBs.
Work closely with local, state and national partners to pursue taxing SSBs.

28
Food System Policies and Population Health: Moving Toward Collective Impact in Denver Numerous national organizations recommend a broad range of best practices to address food insecurity and/or childhood obesity. The intent of this policy scan is to provide City decision-makers with a better understanding of how food systems policies have the potential to impact population health. The findings demonstrate that healthy food retail and federal food and nutrition services programs are likely to be most effective at increasing access to and intake of healthy foods like fruit and vegetables and reducing BMI. Agriculture is a promising approach to increasing access to and intake of fruit and vegetables, but the concern is how to scale up these efforts to make significant population impacts on health. Though frequently recommended as a best practice, institutional procurement and vending contracts have an emerging evidence-base for decreasing purchases and consumption of unhealthy foods and beverages in settings where there is a “captive audience” like students in schools or patients in hospitals. The sale of SSBs, a special consideration across three of the four policy domains included in this document, has a
strong and growing evidence-base for impacting childhood obesity.
Due to the complexities of the food system as a whole and the issues of food insecurity and childhood obesity specifically, making direct connections between the policy domains and population health outcomes is complicated[123]. There are no simple solutions to these multi-faceted issues. It is still too early to determine long-term outcomes for any particular policy. Many policies have only been implemented within the last decade and have not yet been adequately evaluated. In addition, those policies that show promise in one setting are not always replicable in other settings[124]. Although the field continues to evolve, the one constant is that policy experts recommend multiple wide-reaching strategies and that all of the recommended policy domains are interconnected[125]. Figure 7 highlights how Denver can leverage the current city-wide synergy related to food to achieve a wide range of positive health, social, economic and environmental sustainability outcomes[126]. This comprehensive food system framework creates an opportunity to identify leverage points to create needed contextual changes and outcomes desired by stakeholders[127]. Agencies within the City and County of Denver along with local and regional partners are already working on policies and programs across the food system. However, key informant interviewed for this project revealed that agencies are not always effectively communicating about strategies or common
goals, nor are efforts being rigorously monitored or evaluated over time. Segmenting one aspect
of the food system and its policies as solely pertaining to agriculture, public
health, environmental sustainability, or economic development is inefficient and
ineffective.
You can’t solve big problems with big
solutions. You need to solve big
problems with a million small solutions.
– Wendell Berry

29
Fig
ure
7: P
rop
ose
d F
oo
d S
yste
m F
ram
ew
ork
for D
en
ve
r

30
To create collective impacts in these areas, multiple sectors in Denver need to develop and commit to a common agenda for solving food insecurity and childhood obesity. Collective impact requires the following five conditions be in place: 1) a common agenda, 2) shared measurements, 3) mutually reinforcing activities, 4) continuous communication, and 5) backbone support[128].
A best practice leading to collective impact is having a common agenda and
mutually reinforcing activities. Key informants identified the need to create a long-term shared food system vision and action plan for Denver. Aligning multiple City plans that include food-related goals or strategies may be a good place to start. Appendix E highlights City agencies working on food access policies and programs. Some of the agency goals and plans that include food insecurity and/or childhood obesity policy domains are as follows: Be Healthy Denver Community Health Improvement Plan City Development Services’ Develop Denver Plan Denver Food Access Task Force’s Healthy Food for All Report Department of Human Services’ SNAP into Health program Department of Parks and Recreation healthy vending policies The Mayor’s 2020 Sustainability Goals The Climate Adaptation Plan The Mayor’s Children’s Cabinet Goals
Economic development and environmental sustainability are inextricably linked to population health. Developing a coordinated vision can help to leverage the current food system policy efforts to create the shifts required to accomplish multiple City goals.
Continuous communication and shared measurements. A frequent theme among key informants was the need for continuous communication and a more systematic way to track the multiple outcomes related to the City’s food policies and programs. Very few programs reported by key informants included a strong evaluation strategy. By developing a coordinated vision and plan, the City can create and align metrics to quantify the impact and benefits of policies and programs. Some of the criteria should include: the numbers reached by policies or programs, representativeness of people impacted by the policy or program, adoption or institutionalization of policies, impacts on health and quality of life, and cost effectiveness[129]. It is important to note that health, economic, and sustainability plans often use a 5-10 year window to assess impacts. However, a recent study by the Congressional Budget Office suggests it may take 75 years to see budgetary benefits from today’s childhood obesity prevention policies[130]. Therefore all stakeholders need to take “the long view” toward reaching their proposed outcomes, while at the same time strategically planning on how to reach short-, intermediate- and long-term goals through education, and environmental and policy changes.
Backbone support. The City collaborates with many sectors and provides critical skills and support to carry out food system policies, plans, and initiatives. An example of the backbone support that is already provided by the City is the Mayor’s Sustainable Food Policy Council (SFPC). The SFPC is a multi-sector appointed council that makes food policy recommendations to the City based on best practices. The SFPC is staffed by Ex-Officios from the Department of Community Planning and Development, Department of Environmental Health, Office of Economic Development, and the Office of Sustainability, along with Colorado State University Extension and Denver Public Health staff. The SFPC provides a way

31
to engage a range of stakeholders actively working in the food system. Having a food policy council is often cited as a best practice by many national organizations. Finally, key informants suggested the need for a more coordinated inter-departmental approach to coordinate food system policy. A position or agency dedicated to aligning cross-sector goals and evaluating metrics of multiple City plans may be a way to measure Denver’s progress toward moving the needle and creating a culture shift related to healthy and fresh local foods. A Food System Coordinator position could help lead the way toward facilitating the systems changes needed to make broad impactful changes. There are precedents for creating a municipal “food department.” Baltimore and Boston have successfully hired staff and developed inter-departmental collaborations to work toward collective health, economic and sustainability goals.
The Baltimore Food Policy Initiative is an inter-governmental collaboration with the Department of Planning, Baltimore Office of Sustainability, Baltimore Development Corporation, and the Baltimore Health Department. This initiative was formed to increase access to healthy and affordable foods in underserved neighborhoods and has led the policy efforts related to increasing healthy food retail in corner stores and improving access to local produce in public markets. The City of Boston Office of Food Initiatives was established in 2010 to engage the Boston Food Council, partners and City departments to address the following directives set by the mayor’s office: 1) increase access to healthy and affordable food in schools, farmers’ markets and stores, educate the public about healthy choices, and promote food benefits to reduce hunger and obesity, 2) expand Boston’s capacity to produce, distribute and consume local food through urban agriculture and distribution models to supply schools and local businesses, 3) build a strong local food economy through financing and supporting local food retail and distribution businesses, and 4) expand private and public partnerships to advance the food agenda.
The City and County of Denver plays an increasingly important role in fostering a healthy, sustainable, and equitable food system. Mayor Hancock’s vision for Denver Seeds, with its focus on socioeconomic factors and environmental contexts (i.e., social determinants) in which people live, learn, work and play[131][132] will help to pave the way toward addressing the root causes of food insecurity and childhood obesity. With employment in the food sector growing at about twice the rate of the overall economy{133}, investing in a coordinated food system effort has the potential to lead the City toward multiple large-scale and long-lasting goals related to health, environmental sustainability, and economic development. By working closely with multi-sector partners and bridging human, social, financial, physical and natural capital, Denver can develop the needed innovations and investments for creating impactful population health solutions. [134][135]

32
Appendix A: Policy Scan Methods The policy scan took place in five phases from March 2013 to March 2014. Phase 1: Websites of governmental and non-governmental organizations in the areas of health care, public health, public policy or planning were scanned to determine if they had best practice guidance for addressing food insecurity and/or childhood obesity. These documented were entered into an Excel database. Fourteen types of best practices were identified. Each was categorized by area of the food system - growing, processing, preparing, distributing, retailing/marketing, consuming and disposing. The frequency of each best practice recommendation was calculated. Of the 14 types of guidance, eight policy areas across the food system emerged as having been recommended by at least 10 organizations. Phase 2: The eight policy areas identified in the first phase were presented to two stakeholder groups for discussion and ranking of importance to Denver. After the discussion and ranking, the policy areas were collapsed into four domains: healthy food retail, federal food and nutrition services programs, agriculture, and institutional procurement and vending. Phase 3: To determine the population health evidence-base for policies within these domains, a literature review was conducted using PubMed, a commonly used academic database, and the search engine Google. Searches within each policy domain were conducted using terms like “food policy”, “food security”, “obesity”, “nutrition standards”, “healthy food access” “systematic review” or combinations thereof. The scan identified peer-reviewed journal articles (especially systematic reviews), national and international published reports, and unpublished white papers written in English within the last 10 years. Reference lists of articles and reports were also scanned for additional sources. Each document was reviewed to determine if any specific health outcomes resulted from the best practice policy. The ratings categories “proven effective”, “likely effective”, “promising”, and “emerging” were used to determine if a policy domain was likely to have meaningful population health impacts[136][137][138].
Category How Established
Proven effective Strategies include those identified in published systematic reviews, syntheses or meta-analyses producing significant, positive health or behavioral outcomes and intermediate policy, environmental or economic impacts.
Likely Effective Strategies include those demonstrated in published high-quality, peer-reviewed studies and evaluation reports to produce significant positive health or behavioral outcomes and policy, environmental or economic impacts.
Promising Strategies include those based on evidence from published or unpublished evaluation studies or exploratory evaluations showing meaningful, plausible positive health or behavioral outcomes, and policy, environmental or economic impacts.
Emerging Strategies include newly implemented, untested innovations with some face validity, suggesting a strategy may be a strong candidate for exploratory evaluation.

33
Phase 4: To determine if there was precedence for implementing the best practices at the local level the food-related policies in 11 cities were reviewed. Cities with a similar population size (~600,000) of Denver were chosen. Phase 5: Using a convenience sample and a snowballing technique to identify additional key informants (See Appendix D), one-on-one interviews were conducted with people working in programs to address childhood obesity or food security. Copious notes were taken during each interview. The notes were typed immediately after the interview and analyzed to identify food policy and program opportunities in Denver.

34
Appendix B: 24 National Organizations and Recommended Policy Domains to Prevent Food Insecurity and/or Childhood Obesity
Organization Federal Food and Nutrition Services
Programs
Healthy Food Retail
Institutional Procurement and Vending
Agriculture
1 American Academy of Pediatrics X
2 American Heart Association X X
3 American Medical Association X X
4 American Planning Association X X
5 American Public Health Association X X X
6 Brookings Institution X X
7 Centers for Disease Control and Prevention
X X X X
8 ChangeLab Solutions X X
9 Community Food Security Coalition X X X
10 Community Preventive Services Task Force
X
11 Fair Food Network X X X X
12 Federal Drug Administration X
13 Food Research & Action Center X X X
14 Food Systems Planning and Healthy Communities Lab
X X X
15 The Food Trust X X X
16 Institute of Medicine X X X X
17 National Conference of State Legislators
X X
18 PolicyLink X X X X
19 The Prevention Institute X X X X
20 Robert Wood Johnson Foundation X X X X
21 US Conference of Mayors X X X X
22 US Department of Agriculture X
23 US Dept. of Health and Human Services
X
24 Yale’s Rudd Center for Food Policy & Obesity
X X X
TOTAL 13 17 17 16

35
Appendix C: Citiesk Implementing Best Practice Policies to Increase Food Access
Cities with Population of
~600,00
Food Policy
Council
Food Vision, Guiding
Document
A City Office Focused on Food Initiatives
Federal Food and Nutrition Services
Programs
Healthy Food Retail
Institutional Procurement and Vending
Agriculture Childhood obesity rates
Austin, TX X X X X X X 7% to 8% n.d.
Baltimore, MD
X X X X X X X n.a.
Boston, MA X X X X X X X 34.3% to 30.6% 2009 to
2013
Denver, CO X X X X rates statewide
El Paso, TX X X 25.8% to 18.8% 2000-2002 to 2004-2005
Louisville, KY X X X X X X 17.2% to 15.5%
2003 to 2011
Memphis, TN X X X X rates statewide
Milwaukee, WI
X X X n.a.
Nashville, TN X n.a.
Portland, OR X X X X X X Statewide rate 32%
2003 to 2007. Now
at 9.6%
Seattle, WA X X X X King County rate
17% 2010 to 2012
Washington DC
X X X X 2% in high
school students 2007 to
2011
k Cities listed are located in the United States and are similar in population size as Denver.

36
Appendix D: List of Key Informants that Informed the Findings
Name Organization
Maura Barnes Hunger Free Colorado
Meghan Bradley Share Our Strength/Cooking Matters
Adam Brock GrowHaus
Rusty Collins Colorado State University Cooperative Extension
Cindy Dormer Metropolitan State University at Denver
Ryan Galanaugh Metro CareRing
Susan Gallo Denver Office of Children’s Affairs
Jessica George Veterans to Famers
Beverly Grant Mo’ Betta Green Marketplace
Ginger Harrell Stapleton Foundation
Erica Heller Progressive Urban Management Associates
Eric Kornacki Re:vision
Patti Iwasaki Taking Neighborhood Health to Heart
Danica Lee City and County of Denver Department of Environmental Health
Kyle Leglieter The Colorado Health Foundation
Debbi Main University of Colorado at Denver
Stacey McConlogue City and County of Denver Department of Environmental Health
Owetta McNeil Resident, NE Park Hill
Michael Miera Denver Office of Economic Development
Dana Miller Grow Local Colorado, Produce for Pantries
Susan Motika Colorado Department of Public Health and Environment
Lisana Muñoz Denver Department of Human Services
Chris Parr Denver Housing Authority
Wendy Peters Moschetti WPM Consulting
Jini Puma Colorado School of Public Health, Rocky Mountain Prevention
Research Center
Aleece Raw The Garden, The Sunshine Food Project
Kendra Sandoval Sandoval & Sandoval Consulting, LLC
Kevin Seggelke Food Bank of the Rockies
Shannon Spurlock Denver Urban Gardens
Damien Thomas Regis University
Jerry Tinianow Mayor’s Office of Sustainability
Victoria Treski Hunger Free Colorado
Beth Truby Denver Office of Economic Development
Lisa Walvoord LiveWell Colorado
Michelle Wheeler NE Park Hill Coalition, 2040 Partners for Health
Jennifer Wieczorek
Moreland
Denver Public Health
Amy Yaroch Gretchen Swanson Center for Nutrition
Membership Denver Sustainable Food Policy Council
Membership LiveWell Denver Regional Collaborative
Membership NE Park Hill Coalition
Membership Taking Neighborhood Health to Heart
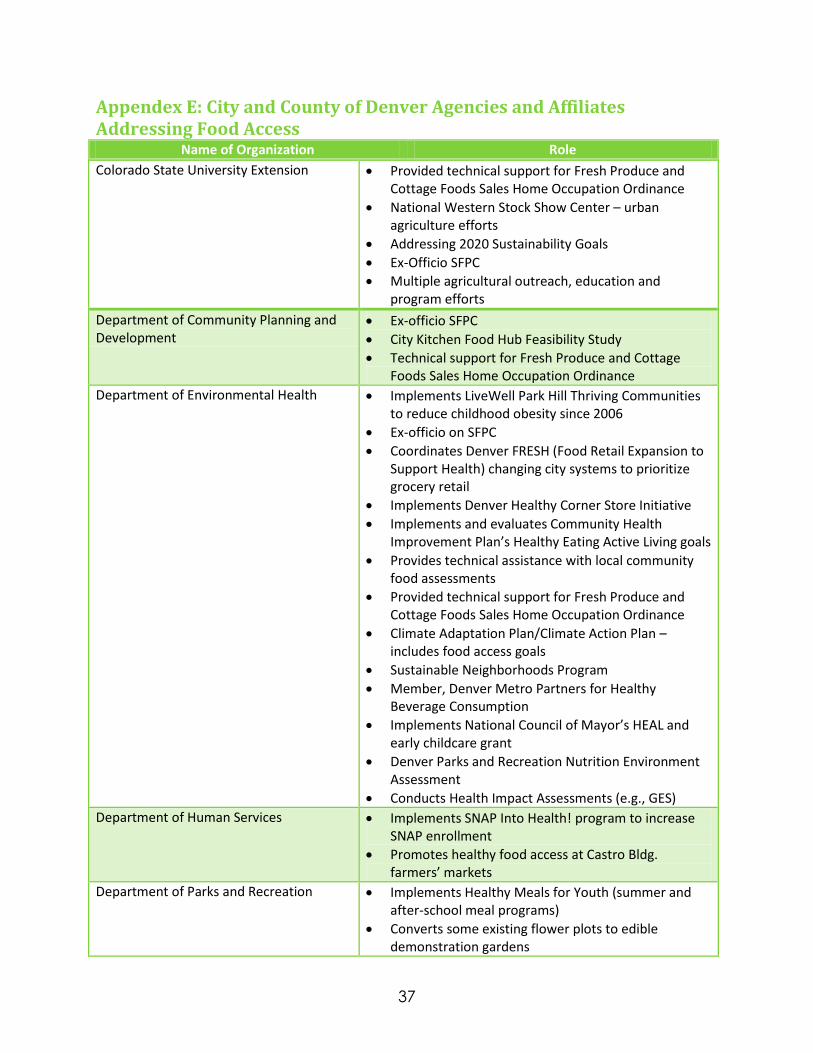
37
Appendex E: City and County of Denver Agencies and Affiliates Addressing Food Access
Name of Organization Role
Colorado State University Extension Provided technical support for Fresh Produce and Cottage Foods Sales Home Occupation Ordinance
National Western Stock Show Center – urban agriculture efforts
Addressing 2020 Sustainability Goals
Ex-Officio SFPC
Multiple agricultural outreach, education and program efforts
Department of Community Planning and Development
Ex-officio SFPC
City Kitchen Food Hub Feasibility Study
Technical support for Fresh Produce and Cottage Foods Sales Home Occupation Ordinance
Department of Environmental Health Implements LiveWell Park Hill Thriving Communities to reduce childhood obesity since 2006
Ex-officio on SFPC
Coordinates Denver FRESH (Food Retail Expansion to Support Health) changing city systems to prioritize grocery retail
Implements Denver Healthy Corner Store Initiative
Implements and evaluates Community Health Improvement Plan’s Healthy Eating Active Living goals
Provides technical assistance with local community food assessments
Provided technical support for Fresh Produce and Cottage Foods Sales Home Occupation Ordinance
Climate Adaptation Plan/Climate Action Plan – includes food access goals
Sustainable Neighborhoods Program
Member, Denver Metro Partners for Healthy Beverage Consumption
Implements National Council of Mayor’s HEAL and early childcare grant
Denver Parks and Recreation Nutrition Environment Assessment
Conducts Health Impact Assessments (e.g., GES)
Department of Human Services Implements SNAP Into Health! program to increase SNAP enrollment
Promotes healthy food access at Castro Bldg. farmers’ markets
Department of Parks and Recreation Implements Healthy Meals for Youth (summer and after-school meal programs)
Converts some existing flower plots to edible demonstration gardens

38
DPR Nutrition Environment Assessment
Denver Botanic Gardens Addressing 2020 Sustainability Goals
Promoting healthy food access at Castro Bldg. and 16th Street Mall farmers’ markets
Manages Mariposa development’s garden
Denver County Jail Aquaponics pilot
Denver Housing Authority Strategic vision includes facilitating urban gardens and healthy food access (e.g., Mariposa development)
Denver Public Health Implements Community Health Improvement Plan’s Healthy Eating Active Living goals
Ex-Officio SFPC
Facilitator and Member, Denver Metro Partners for Healthy Beverage Consumption
Colorado Health Observation Regional Data Service (CHORDS) partner providing neighborhood, county and regional surveillance on BMI
Provides Denver student BMI, physical activity, and nutrition behavior surveillance
Denver Public Schools School gardens, greenhouses, farms
Farm-to-school programs
Implements Community Health Improvement Plan’s Healthy Eating Active Living goals
Mayor’s Children’s Cabinet Goal to reduce rate of overweight and obese children
Mayor’s Denver Seeds Initiative Blue Bear Farms / Centerplate
Mayor’s Sustainable Food Policy Council (SFPC)
Healthy Food Retail and Sourcing
Increase SNAP redemption at Farmers Markets
Fresh Produce and Cottage Foods Sales Home Occupation Ordinance
Institutional Procurement
Office of Children’s Affairs Leads Mayor’s Children’s Cabinet
Implements Head Start “Culture of Wellness” program
Coordinates Healthy Meals for Youth (summer and after-school meal programs)
Office of Economic Development Ex-Officio SFPC
Funds innovative food retail businesses working to address food access
Denver FRESH (Food Retail Expansion to Support Health) changing city systems to prioritize grocery retail
Office of Sustainability 2020 Sustainability Goals include government and community food and health goals
Ex-officio on SFPC
39
References & Endnotes 1 Brennan, L., Castro, S., Brownson, R.C., Claus, J., Orleans, C.T. (2011). Accelerating evidence reviews and
broadening evidence standards to identify effective, promising, and emerging policy and environmental strategies for prevention of childhood obesity. Annual Review of Public Health, 32, 199-223 2 Nestle, M. (2013). Food politics: How the food industry influences nutrition and health (10
th edition). University of
California Press. 3 Steiner, G., & Schernhammer, E. (2014). Hunger and obesity as symptoms of non-sustainable food systems:
Stakeholder-driven innovation policies as countermeasures. 4 Black, J. (2014, Feb 12). Silicon Valley’s next big goal: Fixing our broken food system. Fast Company.
5 Forsight. The future of food and farming (2011). The Government Office for Science, London
https://www.gov.uk/government/publications/future-of-food-and-farming 6 Nestle, M. (2013). Food politics: How the food industry influences nutrition and health (10
th edition). University of
California Press. 7 Richardson, J. (2009). Recipe for American: Why our food system is broken and what we can do to fix it. Ig
Publishing: Brooklyn, NY. 8 Arndt, R., Cheney, R., Cohen, J., Craddock, A., Etkin, S., Greeley, C., Moriarty, B., Posavetz, N., Sanders, C. (2009).
Building a community-based sustainable food system. University of Michigan 9 Glickman, D., Parker, L., Sim, L.J., Del Valle Cook, H., & Miller, A.M., (Eds.) (2012). Accelerating progress in obesity
prevention: Solving the weight of the nation. Washington, DC: Institute of Medicine, National Academy Press. 10
Hesterman, O.B. (2011). Fair food: Growing a healthy, sustainable food system for all. Public Affairs Books: New York, NY. 11
Kreuter, M.W., De Rosa, C., Howze, E.H., Baldwin, G.T. (2004). Understanding wicked problems: A key to advancing environmental health promotion. Health Education & Behavior, 31(4), 441-454. 12
Hunter, D.J. (2009). Leading for health and wellbeing: The need for a new paradigm. Journal of Public Health, 31(2, 202-204. 13
Troy, L.M., Miller, E.A., Olson, S. (2011). Hunger and obesity: Understanding a food insecurity paradigm. Institutes of Medicine. National Academies Press. 14
Rutten et al (2012). 15
Feeding America (2014). Map the meal gap 2014: Overall food insecurity in Colorado by County in 2012. 16
World Health Organizations (1996). Food Security. World Food Summit. Retrieved from: http://www.who.int/trade/glossary/story028/en/ 17
ibid 18
Bell, J., Mora, G., Hagan, E., Rubin, V., Karpyn, A. (2013). Access to health food and why it matters: A review of the research. Oakland, CA: PolicyLink. 19
McMillan, T. (2014). The new face of hunger: Why are people malnourished in the richest country on Earth?. National Geographic, 66-89. 20
Economic Research Service (ERS), U.S. Department of Agriculture (USDA). Food Environment Atlas. http://www.ers.usda.gov/data-products/food-environment-atlas.aspx 21
Morland, K., Diez Rouz, A.V., Wing, S. (2006). Supermarkets, other food stores, and obesity: The atherosclerosis risk in community study. American Journal of Preventive Medicine. 30(4).333-339. 22
Beaulac, J., Krstijansson, E., Cummins, S. (2009) A systematic review of food deserts, 1966-2007. Preventing Chronic Disease, 6(3), A105. 23
Colorado Public Radio (September 18, 2014). Colorado child poverty rate drops for the first time since 2008. http://www.cpr.org/news/story/colorado-child-poverty-rate-drops-first-time-2008 24
Colorado Children’s Campaign (2014). Kids County in Colorado! Denver County Data. 25
Colorado Children’s Campaign (2014). Kids Count Report: Denver County students qualifying for free or reduced lunch by school district. Retrieved April 2014 from http://datacenter.kidscount.org/data/Map/469-students-qualifying-for-free-or-reduced-price-lunch-by-school-district?loc=7&loct=2#10/any/true/868/109/7665/-11749900.5,4725392.5,10,523,528

40
26
U.S. Census. Retrieved April 2014 from http://factfinder2.census.gov/faces/tableservices/jsf/pages/productview.xhtml?pid=ACS_12_1YR_CP03&prodType=table 27
Center of Budget and Policy Priorities (2013). Colorado Food Assistance Program. http://www.cbpp.org/files/1-14-13fa/CO.pdf 28
Trust for America’s Health (2012). F as in Fat: How obesity threatens American’s future. Princeton, NJ: Robert Wood Johnson Foundation. 29
ibid 30
Swinburn, B. (2010). Evidence framework for childhood obesity prevention. In E. Waters, B. Swinburn, J. Seidell, R. Uauy (Eds). Preventing Childhood Obesity: Evidence Policy and Practice. Wiley-Blackwell. 31
Centers for Disease Control (CDC) (2013) Vital signs early childhood obesity. Atlanta, GA: CDC. 32
BRFSS 2012 33
Food Research and Action Center (2014). Relationship between hunger and overweight or obesity. Retrieved from www.frac.org 34
McMillan, T. (2014). The new face of hunger: Why are people malnourished in the richest country on Earth?. National Geographic, 66-89. 35
In E. Waters, B. Swinburn, J. Seidell, R. Uauy (Eds). Preventing Childhood Obesity: Evidence Policy and Practice. Wiley-Blackwell. 36
Hunter, D. (2009). Leading for health and wellbeing: The need for a new paradigm. Journal of Public Health, 31(2), 202-204. 37
ibid 38
Chopra, M (2010). Lessons from the control of other epidemics. In E. Waters, B. Swinburn, J. Seidell, R. Uauy (Eds). Preventing Childhood Obesity: Evidence Policy and Practice. Wiley-Blackwell. 39
McCann, L. (2012). Strategies, approaches and policies to include in Denver’s next comprehensive plan. Unpublished white paper. Denver Department of Environmental Health. 40
Denver Department of Environmental Health (2014). Community Health Improvement Plan. 41
Public Health Institute (2013). Health in all policies: A guide for state and local government. 42
National Association of County & City Health Officials (n.d.). Environmental health in all policies project. 43
Association of State and Territorial Health Officials (2013). Health in all policies: Strategies to promote innovative leadership. 44
Snowdon, W., Potter, J.L., Swinburn, B., Schultz, J., & Lawrence, M. (2010). Prioritizing policy interventions to improve diets? Will it work, can it happen, will it do harm? Health Promotion International, 25(1), 123-33. 45
Ministry of Social Affairs and Health (2006). Health in all policies: Prospects and potentials. 46
World Health Organization (2010). Adelaide statement on health in all policies: Moving toward a shared governance for health and well-being. Report from the International Meeting on Health in All Policies. 47
USDHHS, 2010 48
Huang, T.T., Drewnowski, A., Kumanyika, S.K., & Glass, T.A. (2009). A systems-oriented multilevel framework for addressing obesity in the 21
st century. Preventing Chronic Disease: Public Health Research, Practice and Policy. 6(3),
A82. 49
Secretary’s Advisory Committee on National Health Promotion and Disease Prevention Objectives for 2020 (2010). Evidence-based clinical & public health: Generating and applying the evidence. Washington, DC: US Department of Health and Human Services. http://www.healthypeople.gov/2020/about/advisory/EvidenceBasedClinicalPH2010.pdf 50
Institutes of Medicine (2005). Health in the balance. 51
Bell, J., Mora, G., Hagan, E., Rubin, V., Karpyn, A. (2013). Access to health food and why it matters: A review of the research. Oakland, CA: PolicyLink. 52
Keener, D. Goodman, K., Lowry, A., Zaro, S., & Kettel Khan, L. (2009). Recommended community strategies and measurements to prevent obesity in the United States: Implementation and measurement guide. Atlanta, GA: USDHHS, Centers for Disease Control and Prevention. 53
Denver Food Access Task Force (2011). Healthy food for all: Encouraging grocery investment in Colorado, pg. 8.

41
54
PolicyLink “Grocery stores and Co-ops” Healthy Food Access Portal. Retrieved from http://www.healthyfoodaccess.org/retail-strategies/grocery-stores-and-co-ops 55
Berg, J., & Moses, J. (2011). The case for state food action plans: Laboratories for food democracy. Center for American Progress. Retrieved from: http://cdn.americanprogress.org/wp-content/uploads/issues/2011/02/pdf/hunger_report.pdf 56
Bell, J., Mora, G., Hagan, E., Rubin, V., Karpyn, A. (2013). Access to health food and why it matters: A review of the research. Oakland, CA: PolicyLink. 57
Morland, K., Diez Rouz, A.V., Wing, S. (2006). Supermarkets, other food stores, and obesity: The atherosclerosis risk in community study. American Journal of Preventive Medicine. 30(4).333-339. 58
Larson, N.I., Story, M.T., & Nelson, M.C. (2009). Neighborhood environments: Disparities in access to healthy foods in the U.S. American Journal of Preventive Medicine. 36(1), 74-81. 59
Carroll-Scott, A., Gilstad-Hayden, K., Rosenthal, L., Peters, S.M., McCaslin, C., Joyce, R., Ickovics, J.R. (2013). Disentangling neighborhood contextual associations with child body mass index, diet, and physical activity: The role of built, socioeconomic, and social environments. Social Science & Medicine. 95,106-114. 60
Bell, J., Mora, G., Hagan, E., Rubin, V., Karpyn, A. (2013). Access to health food and why it matters: A review of the research. Oakland, CA: PolicyLink. 61
Ayala, G.X., Baquero, B., Linnan, L., Laraia, B.A., Bloom, P. (2009). Working with tiendas to promote healthy eating. In The Public Health Effects of Food Deserts: Workshop Summary. Washington DC: National Academies Press 62
Gittelsohn, J. (2009) 63
Sturm R., (2008). Disparities in the food environment surrounding US middle and high schools. Public Health, 122, 681–90. 64
Powell, L.M., Han, E., Chaloupka, F.J. (2010). Economic contextual factors, food consumption, and obesity among U.S. adolescents. Journal of Nutrition, 140(6). 1175-1180. 65
Sadler, R.C., Gilliland, J.A., & Arku, G. (2013). A food retail-based intervention on food security and consumption. International Journal of Environmental Research and Public Health, 10,3325-2246. 66
Boone-Heinonen, J., Gordon-Larsen, P., Kiefe, C.I., Shikany, J.M., Lewis, C.E., & Popkin, B.M. (2011). Fast food restaurants and food stores: Longitudinal associations with diet in young to middle-aged adults: The CARDIA study. Archives of Internal Medicine, 171(13), 1162-1170. 67
Cummins, S., Flint, E., Matthews, S.A. (2014). New neighborhood grocery store increased awareness of food access but did not alter dietary habits or obesity. Health Affairs, 33(2), 283-291. 68
Aggarwal, A., Cook, A.J., Jiao, J., Seguin, R.A., Vernez Moudon, A., Hurvitz, P.M., & Drewnowski, A. (2014). Access to supermarkets and fruits and vegetable consumption. American Journal of Public Health. E-view ahead of print. DOI: 10.2105/AJPH.2013.301763. 69
Brownell K.D., & Frieden, T.R. (2009). Ounces of prevention—the public policy case for taxes on sugared beverages. New England Journal of Medicine, 360:1805–8. 70
Cromp, D., Cheadle, A., Solomon, L., Maring, P., Wong, E., Reed, K.M. (2012). Kaiser Permanente’s farmers’ market program: Description, impact and lessons learned. Journal of Agriculture, Food Systems and Community Development. 2(7), 29-36. 71
Kaiser Permanente 2005 72
Jilcott Pitts SB, Wu Q, McGuirt JT, Crawford TW, Keyserling TC, Ammerman AS. (2013) Associations between access to farmers' markets and supermarkets, shopping patterns, fruit and vegetable consumption and health indicators among women of reproductive age in eastern North Carolina, U.S.A. - Public Health Nutr.;16(11):1944-52 73
Robert Wood Johnson Foundation. County health rankings & roadmaps: Farmers’ markets/stands in low income neighborhoods. Retrieved from http://www.countyhealthrankings.org/policies/farmers-marketsstands-low-income-neighborhoods 74
Geronemus, K. (2010). The State of Food: A snapshot of food access in Louisville. Louisville, KY: Mayor’s Healthy Hometown Movement. 75
Food Research and Action Center (2014). School breakfast program. Retrieved August 1, 2014 from http://frac.org/federal-foodnutrition-programs/school-breakfast-program/

42
76
The Food Research and Action Center (FRAC) (2009). Ending childhood hunger by 2015: The essential strategies for achieving the President’s goals. Washington, DC: FRAC. 77
ibid 78
Muller, M, Tagtow, Roberts, SL., MacDougall, R. (2009). Aligning food systems policies to advance public health. Journal of Hunger & Environmental Health, 4(3), 225-240. 79
McMillan, T. (2014). The new face of hunger: Why are people malnourished in the richest country on Earth?. National Geographic, 66-89. 80
ibid 81
Muller, M, Tagtow, Roberts, SL., MacDougall, R. (2009). Aligning food systems policies to advance public health. Journal of Hunger & Environmental Health, 4(3), 225-240. 82
Food Research and Action Center (2014). School breakfast program. Retrieved August 1, 2014 from http://frac.org/federal-foodnutrition-programs/school-breakfast-program/ 83
Hunger Free Colorado (2014). Colorado Charitable Crop Donation Act. Retrieved from: http://www.hungerfreecolorado.org/policy-and-advocacy/the-colorado-charitable-crop-donation-act.html 84
Food Research and Action Center (2011). A review of strategies to bolster SNAP’s role in improving nutrition as well as food security. 85
Gleason, P.M., Hedley-Dodd, A., (2009). School breakfast program but not school lunch program participation is associated with lower body mass index. Journal of the American Dietetic Assocation. 109(2 Suppl), S118-S128. 86
Centers for Disease Control and Prevention (2010). The CDC guide to strategies for reducing the consumption of sugar-sweetened beverages. Atlanta, GA: USDHHS CDC. 87
Chiasson, M.A., Findley, S.E., Sekhobo, J.P., Scheinmann, R., Edmunds, L.S., Faly, A.S., & McLeod, N.J. (2013). Changing WIC changes what children eat. Obesity, 21(7), 1423-1429. 88
Centers for Disease Control and Prevention (2013, August 6). Vital signs: Obesity among low-income, preschool-aged children, United States, 2008-2011. Morbidity and Mortality Weekly Report, 62(31), 629-634. http://www.cdc.gov/mmwr/preview/mmwrhtml/mm6231a4.htm 89
Jones, S.J., Jahns, L., Lariaia, B.A. & Haughton, B. (2003). Lower risk of overweight in school-aged food insecure girls who participate in food assistance: Results from the Panel study of income dynamics children development supplement. Archives of Pediatric and Adolescent Medicine, 157(8), 780-784. 90
Jilcott, S.B., Liu, H., Dubose, K.D., Chen, S., & Kranz, S. (2011). Food stamp participation is associated with fewer meals away from home, yet higher body mass index and waist circumference in a nationally representative sample. Journal of Nutrition Education and Behavior, 43(2), 110-115. 91
Jilcott, S.B., Wall-Bassett, E.D., Burke, S.C., & Moore, J.B., (2011). Associations between food insecurity, Supplemental Nutrition Assistance Program (SNAP) benefits, and body mass index among adult females. Journal of American Dietetic Association, 111(11), 1741-1745. 92
Racine, E.F., Smith Vaughn, A., & Laditka, S.B. (2010). Farmers’ market use among African American women participating in the special supplemental nutrition program for women, infants, and children. Journal of the American Dietetic Association, 110(3), 441-446. 93
FRAC – see PolicyLink document access to healthy food. 94
Center of Budget and Policy priorities (2013). 95
Hanson, K. (2010) The Food Assistance National Input-Output Multiplier Model and Stimulus Effects of SNAP. Washington, DC: US Department of Agriculture. Economic Research Service. 96
Fair Food Network (2014). Double Up Food Bucks: A five-year success story. http://www.fairfoodnetwork.org/sites/default/files/FFN_DoubleUpFoodBucks_5YearReport.pdf 97
Dixon, J.M., Kelly, J.D., Pike, L.L., & Hattersley, L. (2009). Functional foods and urban agriculture: Two responses to climate change-related food insecurity. New South Wales Public Health Bulletin, 20(5062), 14-18. 98
Teig, E., Amylya, J., Buchenau, M., Bardwell, L., Marshall, J., Litt, LS. (2009). Collective efficacy in Denver, Colorado: Strengthening neighborhoods and health through community gardens. Health and Place, 15, 1115-1122. 99
Broadway, M. (2009). Growing urban agriculture in North American cities: The example of Milwaukee. Focus on Geography, 52(3). 23-30. 100
ChangeLab Solutions (2014). Community gardens for public health. Retrieved from http://changelabsolutions.org/publications/community-gardens-public-health

43
101
Litt, J.S., Soobader, M.S., Hale, J., Buchenau, M., Marshall, J.A. (2011). The influences of social involvement, neighborhood aesthetics and community garden participation on fruit and vegetable consumption. The Journal of American Public Health. 101, 1466-1473. 102
Brett, J., Main, D., Cook, J., Coventry, Z., DePierre, A., Fiene, E., Fisher, S., Guenther, D., Oviatt, K., Spiric, Z. (n.d.). Farming the city: 103
Robles, B., Wood., M., Kimmons, J., Kuo, T. (2013). Comparison of nutrition standards and other recommended procurement practices for improving institutional food offerings in Los Angeles County, 2010-2012, Advances in Nutrition, 4(2), 191-202. 104
Gardner, C.D., Whitsel, L.P., Thorndike, A.N., Marrow, M.W., Otten, J.J., Foster, G.D., Carson, J.S., Johnson, R.K. (2014). Food and beverage environments and procurement policies for healthier work environments. Nutrition Reviews. 1-21. 105
The National Policy & Legal Analysis Network to Prevent Childhood Obesity (2011). Understanding healthy procurement: Using government’s purchasing power to increase access to health food. ChangeLab Solutions. 106
Robles, B., Wood., M., Kimmons, J., Kuo, T. (2013). Comparison of nutrition standards and other recommended procurement practices for improving institutional food offerings in Los Angeles County, 2010-2012, Advances in Nutrition, 4(2), 191-202. 107
Trust for American’s Health (2010). F as in Fat: How obesity threatens American’s future, Princeton, NJ Robert Wood Johnson Foundation. p. 26. 108
Robles, B., Wood., M., Kimmons, J., Kuo, T. (2013). Comparison of nutrition standards and other recommended procurement practices for improving institutional food offerings in Los Angeles County, 2010-2012, Advances in Nutrition, 4(2), 191-202. 109
Mikkelson, M.V., Husby, S., Skov, L.R., Perez-Cueto, F.J.A. (2014). A systematic review of types of healthy eating interventions in preschools, Nutrition Journal, 13:56. 110
Taber, D.R., Chriqui, J.F., Perna, F.M., Powell, L.M. & Frank, J. (2012). Weight status among adolescents in the states that govern competitive food nutrition content. Pediatrics, 130, 437-444. 111
Taylor, J.C., & Johnson, R.K. (2013). Farm to school as a strategy to increase children’s fruit and vegetable consumption in the United States: Research and guidance. Nutrition Bulletin, 38(1), 70-70. 112
Institutes of Medicine (2006). Food marketing to children and youth: Threat or opportunity? Washington, DC: The National Academies Press. 113
Institutes of Medicine (2012). Accelerating Progress in Obesity Prevention report. Washington, DC: The National Academies Press 114
Wang, Y.C., Coxson, P., Shen, Y.M., Goldman, L., Bibbins-Domingo, K. (2012). A penny-per-ounce tax on sugar-sweetened beverages would cut health and cost burdens of diabetes. Health Affairs, 31(1), 199-207. 115
Congressional Budget Office (CBO) (2008). Budget options, volumne 1: health care, option 106. Washington, DC: CBO. 116
Andreyeva, T., Chaloupka, F.J., & Brownell, K.D. (2011). Estimating the potential of taxes on sugar-sweetened beverages to reduce consumption and generate revenue. Preventive Medicine, 52:413-6. 117
Malik, V.S., Schulze, M.B., Hu, F.S. (2006). Intake of sugar-sweetened beverages and weight gain: A systematic review. American Journal of Clinical Nutrition, 84(2), 274-288. 118
DeBoer, M.D., Scharf, R.J. and Demmer, R.T. (2013). Sugar-sweetened beverages and weight gain in 2 to 5 year old children. Pediatrics, 132(3), 1-8. 119
Yale Rudd Center. Study synopses: Sugar-sweetened beverages (SSBs) and child obesity. 120
Centers for Disease Control and Prevention (2010). The CDC guide to strategies for reducing the consumption of sugar-sweetened beverages. US Department of Health and Human Services, Centers for Disease Control and Prevention. 121
Robert Wood Johnson Foundation (2012). Influence of competitive food and beverage policies on children’s diets and childhood obesity. Healthy Eating Research. RWJF. 122
Cradock, A.L., McHugh, A., Mont-Ferguson, H., Grant, L., Barrett, J.L., Wang, Y.C., Gortmaker, S.L.. (2011). Effect of school district policy change on consumption of sugar-sweetened beverages among high school students, Boston, Massachusetts, 2004-2006. Prevention of Chronic Disease, 8:A74.
44
123
Centers of Disease Control and Prevention (CDC) (2009). Recommended community strategies and measurements to prevent obesity in the United States: Implementation and measurement guide. Atlanta, GA: USDHHS CDC. 124
Stroup, D.F., Johnson, V.R., & Proctor, D.C. (2009). Reversing the trend of childhood obesity. Preventing Chronic Disease: Public Health Research, Practice, and Policy, 6(3), 1-5. 125
Muller, M., Tagtow, A., Roberts, S.I., MacDougall, E. (2009). Aligning food systems policies to advance public health. Journal of Hunger & Environmental Nutrition, 4(3), 225-240. 126
MacRae, R., & Donahue, K. (2013). Municipal food policy entrepreneurs: A preliminary analysis fo how Canadian cities and regional districts are involved in food system change. Toronto, Canada: Toronto Food Policy Council. 127
Institutes of Medicine (2012). Accelerating Progress in Obesity Prevention report. Washington, DC: The National Academies Press. 128
Hanleybroan, F., Kania, J., Kramer, M. Channeling change: Making collective impact work. Stanford Innovation Review, 1-8. 129
Brennan, L., Castro, S., Brownson, R.C., Claus, J., Orleans, C.T. (2011). Accelerating evidence reviews and broadening evidence standards to identify effective, promising and emerging policy and environmental strategies for prevention of childhood obesity. Annual Review of Public Health, 32, 199-223. 130
Brill, A. (2013). The long-term returns of obesity prevention policies. Matrix Global Advisors. 131
Larson, N., Story, M., & Nelson, M. (2009). Neighborhood environments: Disparities in access to healthy foods in the US. American Journal of Preventive Medicine, 36(1), 74-81. 132
Rutten, L.F., Yaroch, A.L., Patrick, H., Story, M. (2012). Obesity prevention and national food security: A food system approach. Public Health, 2012. http://www.hindawi.com/journals/isrn/2012/539764/ 133
Pansing, C., Wasserman, A., Fisk, J., Muldoon, M., Kiraly, S., Benjamin, T. (2014). A roadmap for city food sector innovation & investment. Urban Sustainability Directors Network Wallace Center. 134
Flora, C.B. & Flora, J.L. (2008). Rural Communities: Legacy and Change, 3rd
Edition, Boulder, CO: Westview Press. 135
Pansing, C., Wasserman, A., Fisk, J., Muldoon, M., Kiraly, S., Benjamin, T. (2014). A roadmap for city food sector innovation & investment. Urban Sustainability Directors Network Wallace Center. 136
Secretary’s Advisory Committee on National Health Promotion and Disease Prevention Objectives for 2020 (2010). Evidence-based clinical & public health: Generating and applying the evidence. Washington, DC: US Department of Health and Human Services. 137
Brennan, L., Castro, S., Brownson, R.C., Claus, J., Orleans, C.T. (2011). Accelerating evidence reviews and broadening evidence standards to identify effective, promising and emerging policy and environmental strategies for prevention of childhood obesity. Annual Review of Public Health, 32, 199-223.