Food Stamps: Supplemental Nutrition Assistance Program (SNAP)
IRP Discussion Paper
No. 1407-13
Food Stamps, Food Sufficiency, and Diet-Related Disease among the Elderly
Nadia Greenhalgh-Stanley Kent State University
Department of Economics E-mail: [email protected]
Katie Fitzpatrick Seattle University
Albers School of Business and Economics E-mail: [email protected]
February 2013
Greenhalgh-Stanley gratefully acknowledges the financial support of the Institute for Research on Poverty Research Innovation and Development Grants in Economics Program (RIDGE) Center for National Food and Nutrition Assistance Research at the University of Wisconsin–Madison and the Economic Research Service of the U.S. Department of Agriculture. The authors also thank the staff of the Food and Nutrition Service (FNS) of the USDA for generously providing data on the advertising campaign and answering numerous questions regarding its implementation. All errors are our own. IRP Publications (discussion papers, special reports, Fast Focus, and the newsletter Focus) are available on the Internet. The IRP Web site can be accessed at the following address: http://www.irp.wisc.edu.

Abstract
In 2010, more than 2.3 million households (7.9 percent) with an elderly member were food
insecure and even more reported some difficulties with obtaining adequate resources for food (Coleman-
Jensen et al. 2010). It is widely acknowledged that any food insufficiency contributes to poor health and
increases the likelihood of diet-related disease. The Supplemental Nutrition Assistance Program (SNAP),
formerly the Food Stamp Program, is the primary nutrition assistance program aimed at reducing food-
related hardship. Yet, participation rates for the eligible elderly are estimated at 35 percent (Cunnyngham
2010). This low take-up rate among the elderly and its effects on food insufficiency and diet-related
disease is relatively unexplored. This paper uses restricted-use Health and Retirement Study (HRS) data
to examine the effect of SNAP participation on reported food insufficiency, health measures, and diet-
related disease to better understand potential long-term health consequences of the elderly. To address the
endogeneity of the SNAP participation decision and identify the causal effects of SNAP use on the
elderly, we instrument for SNAP participation with state and county-level variables related to SNAP
outreach, including radio and television advertisements, and state SNAP rules. We find that the causal
effect of SNAP participation results in higher levels of preventative health care, some improved diet-
related outcomes, but a higher incidence of food distress, which has potential policy implications about
the generosity of SNAP benefits for the elderly.
Keywords: Supplemental Nutrition Assistance Program; elderly; diet-related disease; food insufficiency

Food Stamps, Food Sufficiency, and Diet-Related Disease among the Elderly
SECTION I. INTRODUCTION
At least 2.3 million households (7.9 percent) with an elderly member were food insecure in 2010
and even more likely experienced at least some difficulty obtaining adequate resources for food
(Coleman-Jensen, Nord, Andrews, and Carlson 2011; Ziliak and Gundersen 2009). Yet, according to the
latest estimates the Supplemental Nutrition Assistance Program (SNAP, formerly the Food Stamp
Program), the largest nutritional assistance program aimed at reducing the prevalence of food insecurity,
only 35 percent of eligible elderly participated in FY2008 (compared to 67 percent for the entire
population) (Cunnyngham 2010). Given the fixed incomes, worse health, and high medical needs of the
elderly poor and near poor, the low take-up rate is both puzzling and concerning due to the potential for
SNAP to improve the well-being of participants (Kreider, Pepper, Gundersen, and Jolliffe 2011; Yen,
Andrews, Chen, and Eastwood 2008; Ratcliffe, McKernan, and Zhang 2011).
As the national name change alludes to, SNAP has undergone dramatic change for more than a
decade. States utilized new flexibility over program eligibility and rules, introduced more technology in
administering the program, and adopted state-specific names for the program. With these changes came
an emphasis on outreach to eligible nonparticipants, culminating in federal grants to local nonprofits, a
national advertising campaign that encouraged eligible nonparticipants to apply for benefits, and data
sharing across agencies to reach those participating in other means-tested programs. Of particular interest
to policymakers was increasing participation rates for two groups with historically low take-up rates: the
elderly and Hispanic households.
Understanding the relationship between SNAP, food sufficiency, health, and health care use
among the elderly is important for several reasons. First, with high health care spending among this
group, we need a better understanding of how their use (or non-use) of food assistance programs affect
health outcomes, especially diet-related disease. Second, the elderly were disproportionately affected by
the Great Recession as they have fewer (possibly none) working years to replenish their retirement assets

2
and food assistance programs may become more important for the elderly. Thirdly, given the rapid
growth of the elderly population, understanding if the use of SNAP reduces the incidence of food
insecurity and other health problems associated with inadequate resources for food is of substantial policy
importance. Finally, understanding these relationships assists in understanding the spillovers associated
with SNAP participation, as well as the forecasting of state and federal health care budgets.
Despite this importance, literature examining effects of SNAP on food security and diet-related
disease among the elderly is relatively thin. We make a number of contributions to the larger literature on
the effects of SNAP participation on health-related outcomes, as well as the literature specifically
examining this relationship among the elderly. First, we introduce an instrumental variable approach to
determine the causal effect of SNAP participation on food insufficiency. Our current results suggest that
SNAP participation improves reported health status and indicators of preventative health care use, but
SNAP participation does not have a significant effect on either the specific diet-related health we consider
or food insufficiency. These results have important policy implications for the generosity of SNAP and
the availability of affordable nutritious food options. These suggest that SNAP benefits may be
inadequate to reduce food distress among the growing elderly population.1
We also contribute to the understanding of how new policies affect SNAP take-up. Our first stage
estimates quantify the effectiveness of targeted outreach and simplified application procedures on the
SNAP participation decisions of the eligible elderly. We find that radio advertisements and Combined
Application Projects (CAPs) increase SNAP participation while Spanish language television ads have
little measurable effect on elderly Hispanics.
The remainder of this paper proceeds as follows. The next section provides relevant background
on the SNAP program and Section III reviews previous literature related to SNAP take-up and the effects
1Our sample ends in 2008, before the 2008 Farm Bill’s increase in the minimum SNAP benefit for one- and two-person households. This change is particularly important for elderly SNAP households as the elderly are more likely than the larger population to live in a one- or two-person household. We plan to add data from 2010 when it becomes available.

3
of SNAP participation, with a specific focus on the elderly. Section IV presents the methodology and the
estimation approach. Section V provides the results. The final section concludes with policy implications
and future plans for this research.
SECTION II. BACKGROUND
SNAP provides nutritional assistance to all financially needy households. In the 2010 fiscal year,
SNAP provided $64.7 billion in benefits to more than 40 million individuals (19 million households).
Only 8 percent of SNAP recipients were age 60 or over, despite this population composing more than 18
percent of the population. Figure 1 shows the portion of the SNAP caseload composed of individuals age
60 and over has remained between 7 and 10 percent for the last 20 years.
In general, eligibility requires total household income at less than 130 percent of the federal
poverty line and financial assets of less than $2,000. Households with elderly adults—defined as
individuals age 60 and older—have less stringent criteria: net household income (total income less
deductions) must be at least 100 percent of the federal poverty line and financial assets of less than
$3,000.2
SNAP witnessed enormous changes after welfare reform in 1996. The Welfare Reform Era, in
general, reduced program access with more stringent eligibility rules including ending SNAP eligibility to
noncitizens (although subsequent legislation restored eligibility to many subpopulations) and restricting
eligibility for nonworking participants. It also ended the use of paper vouchers in favor of benefits paid
via an Electronic Benefit Transfer (EBT) card.
After this period ended, policymakers emphasized access to the program, most notably with the
2002 Farm Bill. The federal government granted states greater flexibility over program rules and, in
2Pure Public Assistance households—those in which every household member receives income from SSI, TANF, or General Assistance—are categorically eligible for SNAP so they are not subject to the income or asset test.

4
Source: Authors’ calculations using SNAP Quality Control (QC) data from 1987–2009 and annual July population estimates from the Census Bureau, 2000–2010.

5
general, states enacted policies that expanded eligibility and reduced the direct and indirect costs of
program participation.3
In addition, federal and state governments increased outreach to potentially eligible
nonparticipants, particularly to two populations with historically low rates of SNAP participation:
Hispanics and the elderly. The emphasis on program access and outreach to eligible nonparticipants, in
addition to economic factors, contributed to historically high SNAP caseloads over the past decade. With
this emphasis on program access and outreach, along with economic factors, SNAP caseloads soared and
even the elderly caseloads increased between 2002 and 2006 (Cunnyngham 2010). As Figure 2 shows,
caseload increases for the elderly occurred over this period, despite steady poverty rates. This provides
suggestive evidence that even with little change in the eligibility, the new emphasis on program outreach
reached elderly households.
SECTION III. LITERATURE REVIEW
An extensive literature examines factors influencing SNAP participation (Blank and Ruggles
1996; Cody, Castner, Mabli, and Sykes 2007; Dickert-Conlin, Fitzpatrick, and Tiehen 2011; Klerman and
Danielson 2011; Ratcliffe, McKernan, and Zhang 2011). Relatively few studies focus on the elderly.
Studies that focus on the elderly find explanations for low participation consistent with economic theory
(Currie 2006). Low participation may be explained by lack of awareness of eligibility (Daponte, Sanders,
and Taylor 1999; Hollonbeck and Ohls 1984; Wolfe, Olson, Kendall, and Frongillo 1996; Wu 2009);
stigma (Gabor, Bellamy, Hardison 2002); and low benefit levels (Gabor et al. 2002; Wu 2009).
Participation in other nutritional assistance programs, such as Meals on Wheels and the Elderly Nutrition
Program (ENP) may crowd out SNAP participation (Wu 2009). The elderly may also face higher costs in
3In total, the number of changes made over the last decade may be particularly important for the elderly as they have a longer experience with the traditional Food Stamp Program. As a result, the many changes in eligibility and the new program name may create more confusion for this population than other groups. Similarly, the elderly may face higher costs in adapting to new technology in program administration, including EBT, the use of Call Centers, and online applications. In total, these changes may depress elderly participation, holding all else constant.

6
Source: Authors’ calculations using SNAP Quality Control (QC) data from 1987–2009; annual July population estimates from the Census Bureau, 2000–2010; and annual estimates of the poverty rate for different demographic groups from the Census Bureau, 1975–2010.

7
navigating the application process, such as physical limitations; or difficulty in adapting to technology,
such as use of EBT (Wilde and Dagata 2002; Heflin and Mueser 2010). The elderly may have less need
for the program (Haider, Jacknowitz, and Schoeni 2003).4 Of course, these explanations may not be
mutually exclusive: those with the lowest need or those eligible for lower benefits may be less likely to be
aware of their eligibility.
The Effects of SNAP Participation on Outcomes
Understanding how SNAP affects food insecurity is important due to the link between food
insecurity, health, and diet-related disease, as reviewed in Gundersen et al. (2011). While most of the food
security literature focuses on households with children, Ziliak, Gundersen, and Haist (2008) and Ziliak
and Gundersen (2009) examine food insecurity among the elderly. They find between 2001 and 2005,
11.4 percent of the elderly faced some type of food insecurity and predict this figure will grow over the
coming decades. Like other work (DeMarco and Thorburn 2009; Gundersen, Kreider, and Pepper 2011;
Mammen, Bauer, and Richards 2009), they conclude that food insecurity is not solely a result of low
income as more than half of elderly with some problem obtaining adequate resources for food had
incomes above the federal poverty line. Correlates of food security among the elderly include age, race,
living arrangements, education, and geography (Ziliak et al. 2008).
Food insecurity and other measures of food insufficiency reduce well-being, as well as health. As
noted by Ziliak et al. (2008), even the food secure elderly may suffer from nutrient and calorie
deficiencies at times due to medications, health problems, and other factors. Research finds that food
insecurity among the elderly results in lower nutrient intakes (Bhattacharya, DeLeire, Haider, and Currie
2004; Lee and Frongillo 2001; Ziliak et al. 2008); lower body mass index (BMI) (Bhattacharya et al.
4Zedlewski and Issa (2010) note that long wait lists exist for Meals on Wheels, suggesting unmet nutrition needs do exist. Like other groups, the elderly report that “too many hassles” as a reason to not participate (Daponte et al. 1999, Gabor et al. 2002). Yet, the elderly likely have more leisure time as other groups and should face lower opportunity costs than working households or households with children.
8
2004); fair or poor health (Lee and Frongillo 2001; Ziliak et al. 2008); and limitations in activities of daily
living (ADLs) (Ziliak et al. 2008).
Given the effects of food security, a number of articles examine if SNAP protects against food
insecurity. Overall, evidence is mixed, likely due to the endogeneity of SNAP participation and the lack
of success some have found in breaking this endogeneity. The best evidence does suggest that SNAP is
successful at reducing food insecurity (Gundersen and Oliveira 2001; Wilde and Nord 2005; Ratcliffe, et
al. 2011; Yen et al. 2008).5
While the effects of SNAP participation on the elderly are not as extensively studied as that for
the larger population, SNAP may play an even more important role for this population. The elderly may
be more likely to be long-term recipients of SNAP and, as a result, outcomes that reflect a longer time
period of use may be more apparent, such as reduced incidence of obesity or diet-related disease.
Evidence does suggest there could be a difference between the short-run and long-run effects of SNAP
(Baum 2007; Gibson 2003; Gibson 2006; Vartanian, Houser, and Harkness 2011). Additionally, the
elderly may have lower health status before SNAP participation and, therefore, the marginal effect of
SNAP use may be more dramatic.
Two recent papers specifically examine the effects of SNAP receipt on elderly outcomes,
although neither can fully account for the endogeneity of participation and unobservable differences
between participants and nonparticipants remain a concern. Wu (2009), in her extensive study of SNAP
participation among the elderly, also examines food spending, nutritional outcomes, and poverty. Wu
finds that, compared to nonparticipants, SNAP participants spend less on food, consume fewer vitamins,
eat a less healthy diet, and are more likely to experience consumption poverty.6 Nicholas (2011) examines
5Among the nonelderly population, SNAP also appears to increase BMI and the risk of obesity, particularly for women (Meyerhoefer and Pylypchuck 2008; Baum 2007; Gibson 2003; Gibson 2006; Ver Ploeg and Ralston 2008). The relationship between food insecurity and obesity is fully reviewed in Dinour, Bergen, and Yeh (2007).
6This is consistent with evidence throughout the population that higher SNAP benefits are unlikely to increase the consumption of healthier food, including the consumption of fruits and vegetables (Frazao, Andrews, Smallwood, and Prell 2007).

9
the effect of SNAP receipt on Medicare spending for diabetes. She finds no effect of SNAP receipt on
Medicare spending, outpatient medical care utilization, or blood sugar. The only protective effect of
SNAP receipt she finds is against end-stage renal disease for non-whites.
In this paper, we seek to make several contributions. First, despite the low rates of SNAP
participation among the elderly, there is little empirical evidence on ways to improve take-up rates among
the elderly. Our first stage regressions provide evidence of how increasing outreach and simplifying the
application procedures can improve SNAP take-up rates. Second, we explore SNAP related outcomes on
a population that has received little research attention, despite the large and growing elderly population.
We seek to shed light on the effectiveness of SNAP in reducing food distress, as well as its effectiveness
in improving health and use of preventative health care. Our findings, thus far, find mixed evidence for
the effectiveness of SNAP in improving the health outcomes of the elderly.
SECTION IV. DATA AND METHODOLOGY
We use data from the Health and Retirement Study (HRS) data set, a biannual longitudinal data
set that consists of a wealth of information on the elderly including health indicators, SNAP participation,
income and work variables, along with a rich set of demographic variables. We construct a panel data set
with data from the 2000 through 2008 waves in order to focus on years with more similar food stamp
programs as states gained significant flexibility in program rules since 2002. In addition, the HRS
restructured its sample in 1998 by combining two cohorts. Beginning the sample in 2000 allows more
consistent data across waves.
We select a sample based on age of at least 60 and eligible or nearly eligible based on income and
financial assets. For households in states without a broad-based categorical eligibility policy, we set the
financial asset limit to $3,000; for households in states with a broad-based categorical eligibility policy,

10
we waived the asset test when determining eligibility.7 We also impose the net income test by comparing
the household’s monthly income to $500 more than the federal poverty level. Because elderly households
face only the net income test, rather than the net and gross income tests, the $500 was chosen to
approximate the deductions of an elderly household.8 Our sample selection criteria does not necessarily
capture all of the eligible elderly, but it approximately does so and allows our sample selection to be
generous to allow for the deductions that we cannot necessarily capture in our data set (i.e., utility bills).
The HRS conducts interviews approximately every two years. Some of the outcomes we consider
relate to well-being or health outcomes that occurred since the last interview, while others relate to
current health conditions. The HRS outcome variables of most interest relate to food insufficiency over
the past two years9; skipping meals or skipping prescription drug use due to resource constraints over the
past two years; receipt of subsidized meals over the past two years; current self-reported health; measures
of preventative health services over the past two years, including receiving a flu shot, mammogram, or a
prostate exam; health expenditures, including out-of-pocket health spending over the past two years, out-
of-pocket spending on doctors over the past two years, and monthly out-of-pocket spending on
prescription drugs; and, health-related outcomes, including current body mass index (BMI) and its change
7The USDA defines which financial assets should be considered for the SNAP asset test, although states maintain some flexibility. In general, financial assets include liquid assets such as savings, stocks, and bonds; the treatment of retirement savings and vehicles varies over state and time. State broad-based categorical exemption (BBCE) policies waive the asset test for certain types of households, including households with one or more elderly individuals. BBCE policies vary over state and time. To measure financial wealth, we use the RAND definition of financial wealth, which includes stocks, checking accounts, CDs, bonds, and other assets but does not include IRAs, Keogh plans, vehicles, businesses, or real estate.
8The $500 allows for some households to take a larger than average amount of deductions. We verified this value with SNAP QC data. Examining households with at least one elderly individual, the average deductions ranged from $277 in FY2000 to $498 in FY2010; median deductions ranged from $206 in FY2000 to $442 in FY2010.
9The food insufficiency question asks the respondent if in the past two years they have felt at anytime that they did not have enough food. This differs from the official definition of food insecurity but it provides the best approximation in the data set.
11
over the past two years, weight gain since the last interview, as well as current incidence and changes in
the incidence of heart disease, diabetes, and hypertension.10
The primary independent variable of interest is SNAP participation. Participation in SNAP is
endogenous to both observable and unobservable household characteristics. As a result, we rely on the
restricted access version of the HRS to utilize geographic identifiers to instrument for SNAP eligibility.
These instruments, described later, include: SNAP outreach, including state-level information on targeted
radio and television advertisements, county-level information on federally-funded outreach grants
targeting the elderly, and state-level outreach spending; and, state-level variables including CAP
programs, the implementation of EBT, the use of fingerprinting in the application process, and average
length of recertification periods for elderly participants in the state.11 Thanks to changes in program rules
arising from welfare reform and the 2002 Farm Bill, states differ in many policies affecting eligibility and
program administration.
Methodology
The main hypothesis of interest is examining whether SNAP participation among the elderly
reduces food insufficiency and, in turn, other indicators of poor health.12 This relationship can be
examined and tested using the following equation:
10Health expenditures are used to determine SNAP eligibility in all states through the medical expenses deduction. Households with elderly or disabled members can deduct any out-of-pocket medical expenses greater than $35. We recognize that this variable is potentially endogenous to SNAP receipt because it affects both eligibility for the program as well as benefit levels. We plan to address this problem in future drafts.
11Once the 2010 HRS data are released, we plan to also include changes in the name of the Food Stamp Program to SNAP that occurred after October 1, 2008. This will introduce variation across states as not all states changed the state program name from the Food Stamp Program. Those that did took a number of routes, including changing the name to SNAP and creating a new program name, such as the Basic Food Program (in Washington) or CalFresh (in California). We hypothesize that these new program names created confusion, particularly among the elderly who may be more accustomed to the food stamp name. In future work, we will also examine other SNAP program rules that may affect the elderly.
12Our data source, the Health and Retirement Study (HRS) does not contain the food insecurity module but instead includes a question indicating that over the past two years the respondent did not have sufficient food due to lack of financial resources. We refer to this indicator as food insufficiency.

12
(1) ,
where h indexes household, s indexes state of residence, and t represents calendar year. In addition, X
includes time varying demographic variables including age, age squared, and a series of dummy variables
indicating SSI use, widowed, married, and Medicare Part D (after January 1, 2006).
The dependent variable, food insufficiency, is equal to one if the elderly household reports food
insufficiency since the last interview and is equal to zero otherwise. The variable of interest, SNAP
receipt last month, is a dummy variable that signifies SNAP participation. The main coefficient of
interest, α, represents the impact of an eligible elderly individual participating in the SNAP program on
their reported food insufficiency or other outcomes.
The central identification problem in understanding the effect of SNAP participation on food
insufficiency and other health outcomes is the endogeneity of the SNAP participation decision. Holding
all else constant, SNAP participants may be unobservably different than SNAP nonparticipants and,
therefore, we will be unable to capture the true effect of SNAP participation on food insufficiency, health,
and diet-related disease. We address this problem with an Instrumental Variable (IV) approach by
identifying plausibly exogenous variation in the SNAP participation decision arising from state-level
policy changes and state-level outreach. As a result, the set of estimating equations becomes
2)
3)
Instruments
We utilize a number of plausibly exogenous variables, each related to either increased outreach
about the SNAP program or program rules. Variables related to increased outreach would be expected to
increase SNAP enrollment among the elderly by reducing the costs of receiving information about
eligibility and/or providing assistance with the application process. The first set of instruments we use is

13
federally funded radio and television advertisements. Each calendar year, since 2004, the USDA launched
a radio advertising campaign to raise participation among eligible nonparticipants. The radio ads typically
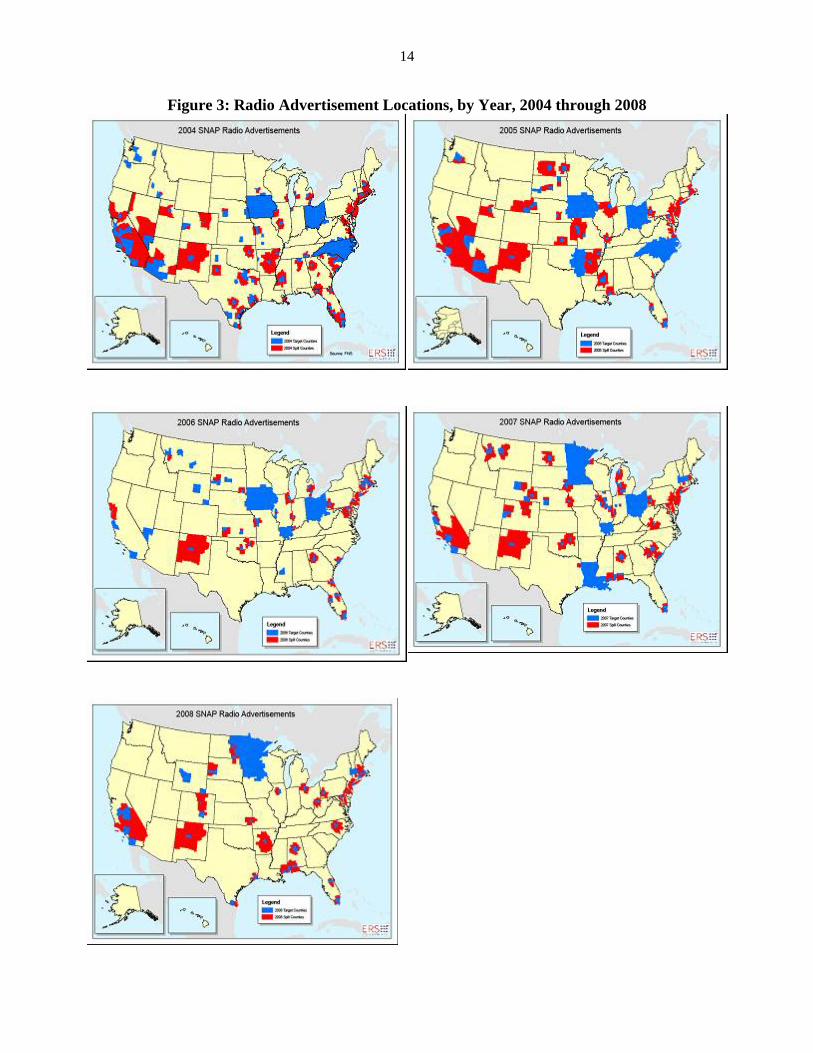
were broadcast for two months in the spring and two months in the fall of each year. Figure 3 shows the
variation over time in advertising locations.
By featuring elderly actors and discussion of “early bird specials” and retirement, some
advertisements were targeted towards the elderly; other advertisements were targeted at Hispanics and
aired in Spanish; other advertisements did not have any specific targeting but emphasized the ability of
SNAP recipients to purchase healthy food.13 Anecdotal evidence suggests that the advertisements
generated an overwhelming number of calls to request information about SNAP; in some instances, the
volume of calls to the toll-free information number forced phone companies to reroute the calls. We
expect this outreach to positively impact SNAP participation, as these advertising campaigns are
associated with state-level and county-level caseload increases (Dickert-Conlin, Fitzpatrick, and Tiehen
2010; Dickert-Conlin et al. 2011). In addition to these radio advertisements, in 2006, the USDA also aired
Spanish language television advertisements in September of 2006.
Due to a limited budget, the USDA did not choose the media markets to place
advertisements randomly. Instead, the USDA used available state- and county-level
characteristics (such as SNAP participation rates and food insecurity rates), combined with input
from the Regional Administrators, on which media markets were in most need of increased
outreach. Importantly, the USDA would not place an ad in a media market unless the state was
prepared to handle an increase in SNAP applications. Because we are concerned about the
potential endogenous placement of these advertisements, our primary specification relies on
state-level advertising measures, although we also report estimates in Table 3 using county-level
13To listen or view some of the advertisements, see: http://www.fns.usda.gov/snap/outreach/radio/default.htm and http://www.fns.usda.gov/snap/outreach/psas.htm. In future work, we plan to explore the variation arising from the targeting of different advertisements.
14
Figure 3: Radio Advertisement Locations, by Year, 2004 through 2008

15
measures.14 We exploit the timing of both the advertisements, as well as the interview, by
determining if the respondent could have ever been exposed to an advertisement and entered into
the program by the interview. For example, an initial set of ads were aired in March 2004. Given
that SNAP participation is measured by receipt of benefits in the previous month, anyone
interviewed in March 2004 was not treated, while anyone interviewed anytime after April 2004
was considered treated.
The second instrument we utilize is Combined Application Projects (CAPs). These are
joint application programs between SSI and SNAP in certain states. CAPs reduce transaction
costs associated with the application process through both the reduction in paperwork and the
elimination of a visit to the local SNAP office. States can implement one of two types of CAP
policies: the standard CAP, which includes joint application processing with the Social Security
Administration (SSA) when an individual applies for or recertifies for the Supplemental Security
Income (SSI) program, and the modified CAP, which allow states to verify application data with
the SSA to enroll SSI recipients in SNAP. Previous evidence from South Carolina, the first state
to implement a CAP, suggests an increase in participation with CAP implementation (Boussy,
Jackson, and Wemmerus 2000).
In additional specifications, we utilize instruments related to the use of technology in
program policies, as well as the length of the recertification period. The first is an indicator of
when the state began implementing payment via EBT and the second is an indicator that the state
14Dickert-Conlin et al. (2011) conclude that there may be negative selection of advertising placement: those counties targeted to receive an advertisement appear to be counties that have a larger distaste for participation in welfare programs. Dickert-Conlin et al. (2011) also compare counties targeted for an advertisement to those counties that could hear an advertisement but were not directly targeted. We plan to utilize this variation in future work. We also plan to explore how to better link the timing of the advertising air date with the timing of the HRS interview. In particular, we will explore the sensitivity of these results to the length of time between the advertising air date and when we should expect an effect on participation.
16
requires fingerprinting of SNAP recipients. In general, research is mixed on the effect of EBT on
SNAP participation (Ziliak, Gundersen, and Figlio 2003; Ratcliffe and McKernan 2008; Dickert-
Conlin et al. 2010). Theoretically, EBT could reduce SNAP participation among the elderly.
Work examining the effect of fingerprinting technologies on SNAP applicants tends to find large
negative effects of these policies on SNAP participation due to either increases in transaction
costs or stigma (Ratcliffe and McKernan 2008; Dickert-Conlin et al. 2010).
Finally, we examine the portion of the elderly caseload in the state with a long
recertification period (more than one year). Research on recertification periods suggests that
“short” recertification periods (typically defined as one to three months) discourage participation
in the program while “long” recertification periods (typically defined as more than a year)
encourage participation (Kabbani and Wilde 2003). Given the mobility problems facing some
elderly poor, we hypothesize that long recertification periods may be important for continuing
participation.
RESULTS
Summary Statistics
Table 1 presents summary statistics for the entire SNAP-eligible sample pooled across years
(column 1) and by SNAP participation (columns 2 and 3).15 In terms of demographic characteristics, our
sample is roughly 75 years old, and white; roughly 30 percent of the sample is married and nearly half of
the sample is widowed. Fifteen percent of our sample receives SSI at the household level (i.e., anyone in
the household receives SSI). Roughly 13 percent of sample households in all years report participating in
SNAP in the previous month at the time of interview. Our estimates of SNAP participation are lower than
15Appendix 1 offers a complete summary statistics table by each of the three instruments in our preferred specification.

17
Table 1. Summary Statistics of Elderly Households Eligible (or Nearly Eligible) for SNAP from Health and Retirement Survey Data, 2000–2008
(1) (2) (3)
By SNAP Participation
Full Sample Participants Non-Participants
Current SNAP Participation 0.130 (0.337)
1.00 0
Observable Characteristics Married 0.295
(0.456) 0.265
(0.442) 0.299
(0.458) Widowed 0.488
(0.500) 0.386
(0.487) 0.504
(0.500) Black 0.261
(0.439) 0.366
(0.482) 0.245
(0.430) Hispanic 0.157
(0.364) 0.266
(0.442) 0.140
(0.348) Female 0.713
(0.452) 0.745
(0.436) 0.709
(0.454) Age 902.750
(112.860) 870.121
(100.863) 907.645
(113.750) Annual Social Security Income 7855.137
(4617.494) 5,365.808
(3,857.845) 8,228.573 (4606.419)
SSI Receipt 0.150 (0.357)
0.518 (0.500)
0.095 (0.293)
Medicare Part D Implemented 0.367 (0.482)
0.383 (0.486)
0.365 (0.481)
Outcome Variables: Indicators of Well-Being Reported Food Insufficiency 0.120
(0.325) 0.282
(0.450) 0.095
(0.294) Received Subsidized Meals 0.066
(0.248) 0.104
(0.306) 0.060
(0.237) Skipped Meals 0.058
(0.233) 0.158
(0.365) 0.043
(0.203) Skipped Prescriptions 0.122
(0.327) 0.140
(0.347) 0.119
(0.324) Respondent’s BMI 27.243
(6.184) 28.672 7.003
27.028 6.022
At least one adult is Underweight 0.043 (0.204)
0.037 (0.190)
0.044 (0.206)
All Adults in Household are Normal Weight 0.029 (0.167)
0.024 (0.152)
0.029 (0.169)
All Adults in Household are Overweight 0.042 (0.200)
0.034 (0.180)
0.043 (0.202)
At Least One Adult is Obese 0.862 (0.345)
0.882 (0.323)
0.858 (0.349)
Large Weight Swing of Respondent 0.001 (0.031)
0.002 (0.044)
0.001 (0.028)
Out-of-Pocket Health Spending, Since Last Interview
$4,543 (14838.61)
$1,470.518 (8487.033)
$5,007.621 (15522.46)
Out-of-Pocket Doctor Spending, Since Last Interview
$332.688 (1934.046)
$75.370 (290.538)
$377.655 (2089.479)
Monthly Out-of-Pocket Spending on Prescriptions Drugs
$58.933 (389.358)
$20.771 (150.056)
$65.092 (414.926)
(table continues)

18
Table 1, continued (1) (2) (3) By SNAP Participation Full Sample Participants Non-Participants Outcome Variables: Indicators of Health and Health Care Usage
Received Preventative Care 0.720 (0.449)
0.684 (0.465)
0.725 (0.446)
Received Flu Shot 0.412 (0.492)
0.402 (0.490)
0.414 (0.493)
Reported Worse Health than Two Years Ago 0.392 (0.488)
0.436 (0.496)
0.385 (0.487)
Reported Very Good Health 0.571 (0.495)
0.730 (0.444)
0.547 (0.498)
Has Diabetes 0.316 (0.465)
0.401 (0.490)
0.304 (0.460)
Reports Diabetes Worse than Two Years Ago 0.027 (0.162)
0.040 (0.196)
0.025 (0.157)
Has Heart Disease 0.386 (0.487)
0.418 (0.493)
0.381 (0.486)
Reports Heart Disease Worse than Two Years Ago
0.035 (0.183)
.0442 (0.206)
0.033 (0.179)
Has High Blood Pressure 0.722 (0.448)
0.775 (0.418)
0.714 (0.452)
Takes Blood Pressure Medication 0.592 (0.492)
0.658 (0.474)
0.582 (0.493)
Reports High Blood Pressure Worse than Two Years Ago
0.039 (0.194)
0.050 (0.218)
0.038 (0.191)
Blood Pressure Mostly Under Control 0.624 (0.484)
0.663 (0.473)
0.618 (0.486)
Total Household Health Conditions Over the Past Two Years
0.355 (0.650)
0.337 (0.608)
0.358 (0.656)
Total Number of Health Conditions Ever 3.269 (2.084)
3.684 (2.242)
3.207 (2.052)
Observations 15,953 2,081 13,872 Notes: Author’s calculations using Health and Retirement Survey (HRS) data from 2000–2008. Sample includes households with $3,000 or less of financial assets and income near or below the federal poverty level. Standard deviations are in parentheses.

19
national estimates, which have trended slightly upwards over time. Future work will determine if our
sample selection procedures result from low rates of SNAP participation among HRS respondents.
We examine many outcomes that could possibly be affected by SNAP receipt. The first set of
outcomes relates to measures of well-being, particularly food distress. Our sample has a level of food
insufficiency over the past two years slightly higher than the estimated levels of food insecurity among
the elderly, though the previous literature postulated that the incidence of food insecurity would grow
over the coming years, with roughly 12 percent of the sample reporting food insufficiency. Despite this,
few elderly (5.8 percent) report skipping meals or receiving subsidized meals (6.6 percent). More
frequently, elderly report skipping prescriptions (12.2 percent). While this population is also, largely
covered by Medicare, out-of-pocket medical expenses are $4,543 over the past two years, $333 of which
was spent on doctors. Moreover, over the past month, they spent an average of $59 on out-of-pocket on
prescription drugs.
The second set of outcomes we investigate reflect measures of health and health care use. This
sample appears to be in relatively poor health: the average household reports 3.3 health conditions; just
over 30 percent of the sample reports diabetes, nearly 40 percent of the sample reports heart disease, and
72 percent report suffering from high blood pressure. For each of these conditions, a small percentage of
the sample—2 to 4 percent—report these conditions worsened since the last interview.
Preventative care, which includes whether either member of the household received a flu shot,
mammogram, pap smear, or prostate exam since the previous interview, was used by 72 percent of the
population. Examining flu shots alone, 41 percent of the sample received a flu shot since the previous
interview.
Endogenous Regressions
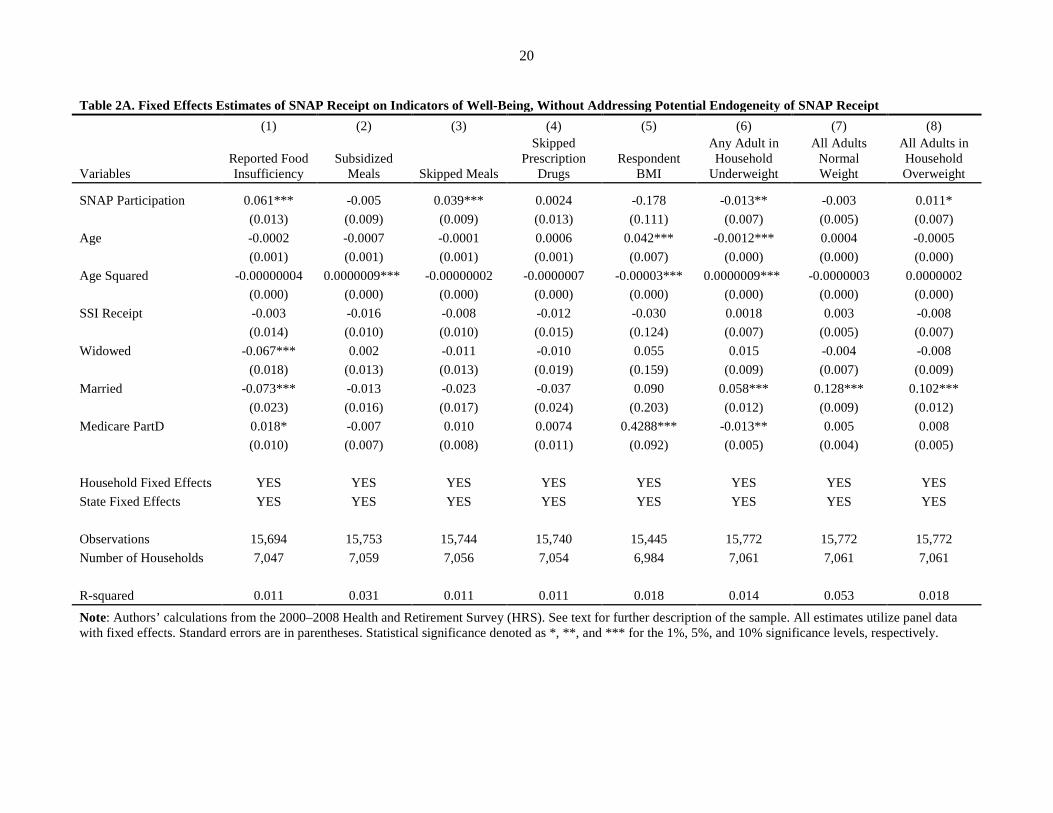
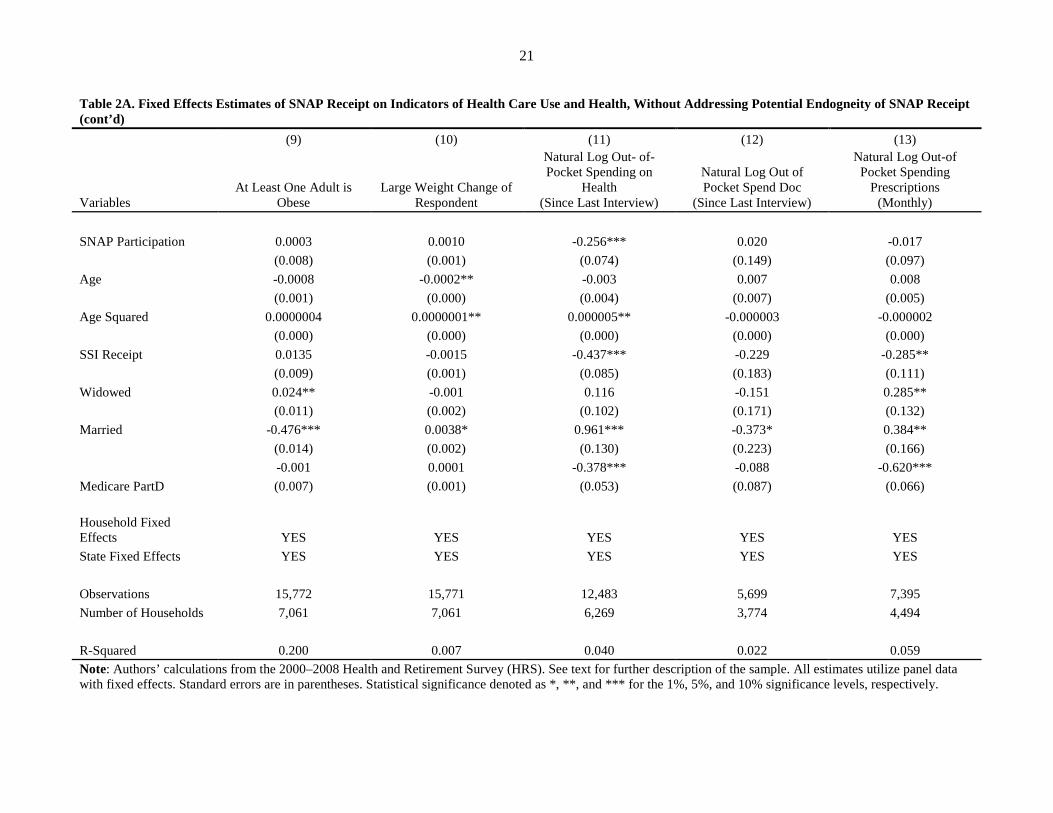
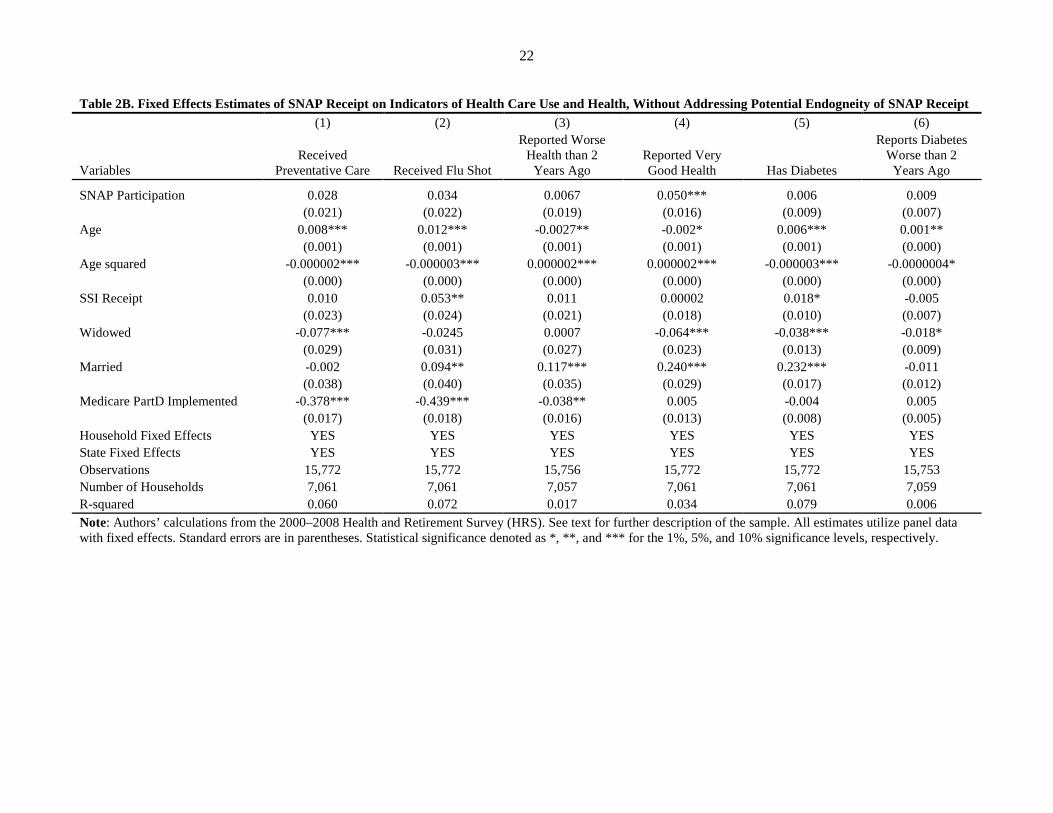
We begin with estimates that do not correct for the endogeneity of SNAP receipt on food
sufficiency, health, and health care use. Tables 2A and 2B present regressions with household fixed
effects that examine how SNAP participation affects food insufficiency and the incidence of diet-related
20
Table 2A. Fixed Effects Estimates of SNAP Receipt on Indicators of Well-Being, Without Addressing Potential Endogeneity of SNAP Receipt (1) (2) (3) (4) (5) (6) (7) (8)
Variables Reported Food Insufficiency
Subsidized Meals Skipped Meals
Skipped Prescription
Drugs Respondent
BMI
Any Adult in Household
Underweight
All Adults Normal Weight
All Adults in Household Overweight
SNAP Participation 0.061*** -0.005 0.039*** 0.0024 -0.178 -0.013** -0.003 0.011*
(0.013) (0.009) (0.009) (0.013) (0.111) (0.007) (0.005) (0.007)
Age -0.0002 -0.0007 -0.0001 0.0006 0.042*** -0.0012*** 0.0004 -0.0005
(0.001) (0.001) (0.001) (0.001) (0.007) (0.000) (0.000) (0.000)
Age Squared -0.00000004 0.0000009*** -0.00000002 -0.0000007 -0.00003*** 0.0000009*** -0.0000003 0.0000002
(0.000) (0.000) (0.000) (0.000) (0.000) (0.000) (0.000) (0.000)
SSI Receipt -0.003 -0.016 -0.008 -0.012 -0.030 0.0018 0.003 -0.008
(0.014) (0.010) (0.010) (0.015) (0.124) (0.007) (0.005) (0.007)
Widowed -0.067*** 0.002 -0.011 -0.010 0.055 0.015 -0.004 -0.008
(0.018) (0.013) (0.013) (0.019) (0.159) (0.009) (0.007) (0.009)
Married -0.073*** -0.013 -0.023 -0.037 0.090 0.058*** 0.128*** 0.102***
(0.023) (0.016) (0.017) (0.024) (0.203) (0.012) (0.009) (0.012)
Medicare PartD 0.018* -0.007 0.010 0.0074 0.4288*** -0.013** 0.005 0.008
(0.010) (0.007) (0.008) (0.011) (0.092) (0.005) (0.004) (0.005)
Household Fixed Effects YES YES YES YES YES YES YES YES State Fixed Effects YES YES YES YES YES YES YES YES
Observations 15,694 15,753 15,744 15,740 15,445 15,772 15,772 15,772 Number of Households 7,047 7,059 7,056 7,054 6,984 7,061 7,061 7,061
R-squared 0.011 0.031 0.011 0.011 0.018 0.014 0.053 0.018
Note: Authors’ calculations from the 2000–2008 Health and Retirement Survey (HRS). See text for further description of the sample. All estimates utilize panel data with fixed effects. Standard errors are in parentheses. Statistical significance denoted as *, **, and *** for the 1%, 5%, and 10% significance levels, respectively.
21
Table 2A. Fixed Effects Estimates of SNAP Receipt on Indicators of Health Care Use and Health, Without Addressing Potential Endogneity of SNAP Receipt (cont’d) (9) (10) (11) (12) (13)
Variables At Least One Adult is
Obese Large Weight Change of
Respondent
Natural Log Out- of-Pocket Spending on
Health (Since Last Interview)
Natural Log Out of Pocket Spend Doc
(Since Last Interview)
Natural Log Out-of Pocket Spending
Prescriptions (Monthly)
SNAP Participation 0.0003 0.0010 -0.256*** 0.020 -0.017 (0.008) (0.001) (0.074) (0.149) (0.097) Age -0.0008 -0.0002** -0.003 0.007 0.008 (0.001) (0.000) (0.004) (0.007) (0.005) Age Squared 0.0000004 0.0000001** 0.000005** -0.000003 -0.000002 (0.000) (0.000) (0.000) (0.000) (0.000) SSI Receipt 0.0135 -0.0015 -0.437*** -0.229 -0.285** (0.009) (0.001) (0.085) (0.183) (0.111) Widowed 0.024** -0.001 0.116 -0.151 0.285** (0.011) (0.002) (0.102) (0.171) (0.132) Married -0.476*** 0.0038* 0.961*** -0.373* 0.384** (0.014) (0.002) (0.130) (0.223) (0.166)
Medicare PartD -0.001 0.0001 -0.378*** -0.088 -0.620*** (0.007) (0.001) (0.053) (0.087) (0.066)
Household Fixed
Effects YES YES YES YES YES State Fixed Effects YES YES YES YES YES
Observations 15,772 15,771 12,483 5,699 7,395 Number of Households 7,061 7,061 6,269 3,774 4,494
R-Squared 0.200 0.007 0.040 0.022 0.059 Note: Authors’ calculations from the 2000–2008 Health and Retirement Survey (HRS). See text for further description of the sample. All estimates utilize panel data with fixed effects. Standard errors are in parentheses. Statistical significance denoted as *, **, and *** for the 1%, 5%, and 10% significance levels, respectively.
22
Table 2B. Fixed Effects Estimates of SNAP Receipt on Indicators of Health Care Use and Health, Without Addressing Potential Endogneity of SNAP Receipt (1) (2) (3) (4) (5) (6)
Variables Received
Preventative Care Received Flu Shot
Reported Worse Health than 2
Years Ago Reported Very Good Health Has Diabetes
Reports Diabetes Worse than 2
Years Ago
SNAP Participation 0.028 0.034 0.0067 0.050*** 0.006 0.009
(0.021) (0.022) (0.019) (0.016) (0.009) (0.007)
Age 0.008*** 0.012*** -0.0027** -0.002* 0.006*** 0.001**
(0.001) (0.001) (0.001) (0.001) (0.001) (0.000)
Age squared -0.000002*** -0.000003*** 0.000002*** 0.000002*** -0.000003*** -0.0000004*
(0.000) (0.000) (0.000) (0.000) (0.000) (0.000)
SSI Receipt 0.010 0.053** 0.011 0.00002 0.018* -0.005
(0.023) (0.024) (0.021) (0.018) (0.010) (0.007)
Widowed -0.077*** -0.0245 0.0007 -0.064*** -0.038*** -0.018*
(0.029) (0.031) (0.027) (0.023) (0.013) (0.009)
Married -0.002 0.094** 0.117*** 0.240*** 0.232*** -0.011
(0.038) (0.040) (0.035) (0.029) (0.017) (0.012)
Medicare PartD Implemented -0.378*** -0.439*** -0.038** 0.005 -0.004 0.005
(0.017) (0.018) (0.016) (0.013) (0.008) (0.005)
Household Fixed Effects YES YES YES YES YES YES State Fixed Effects YES YES YES YES YES YES Observations 15,772 15,772 15,756 15,772 15,772 15,753 Number of Households 7,061 7,061 7,057 7,061 7,061 7,059 R-squared 0.060 0.072 0.017 0.034 0.079 0.006 Note: Authors’ calculations from the 2000–2008 Health and Retirement Survey (HRS). See text for further description of the sample. All estimates utilize panel data with fixed effects. Standard errors are in parentheses. Statistical significance denoted as *, **, and *** for the 1%, 5%, and 10% significance levels, respectively.

23
Table 2B. Fixed Effects Estimates of SNAP Receipt on Indicators of Well-Being, Without Addressing Potential Endogeneity of SNAP Receipt (cont’d)
(7) (8) (9) (10) (11) (12) (13) (14)
Variables Has Heart Disease
Reports Heart Disease
Worse than 2 Years Ago
Has High Blood
Pressure
Takes Blood Pressure
Medication
Reports High Blood
Pressure Worse than 2
Years Ago
Blood Pressure
Mostly Under Control
Total Household
Health Conditions
Past 2 Years
Total Household
Health Conditions
Ever SNAP Participation 0.002 0.005 0.026** 0.027* -0.006 0.022 -0.016 0.021
(0.012) (0.008) (0.011) (0.014) (0.009) (0.015) (0.025) (0.029)
Age 0.002** -0.0003 0.005*** 0.006*** 0.001* 0.005*** 0.001 0.026***
(0.001) (0.000) (0.001) (0.001) (0.001) (0.001) (0.002) (0.002)
Age squared -0.0000002 0.0000003 -0.000002*** -0.000003*** -0.0000006* -0.000002*** 0.0000001 -0.00001***
(0.000) (0.000) (0.000) (0.000) (0.000) (0.000) (0.000) (0.000)
SSI Receipt 0.005 0.002 0.038*** 0.045*** -0.0032 0.020 0.095** 0.074**
(0.013) (0.008) (0.012) (0.016) (0.010) (0.016) (0.043) (0.032)
Widowed -0.0074 -0.007 0.023 -0.008 -0.004 0.024 -0.008 -0.187***
(0.017) (0.011) (0.015) (0.020) (0.012) (0.021) (0.038) (0.042)
Married 0.272*** 0.010 0.228*** -0.015 0.0028 0.011 0.417*** 2.825***
(0.021) (0.014) (0.020) (0.026) (0.016) (0.027) (0.058) (0.054)
Medicare Part D Implemented
-0.023** -0.010 0.009 0.006 0.0008 -0.0019 -0.056** -0.034 (0.010) (0.006) (0.009) (0.012) (0.007) (0.012) (0.022) (0.024)
Household Fixed Effects YES YES YES YES YES YES YES YES State Fixed Effects YES YES YES YES YES YES YES YES
Observations 15,772 15,764 15,772 15,738 15,703 15,704 17,563 15,621 Number of Households 7,061 7,059 7,061 7,053 7,047 7,048 7,923 6,972
R-Squared 0.057 0.006 0.055 0.042 0.004 0.030 0.016 0.461 Note: Authors’ calculations from the 2000–2008 Health and Retirement Survey (HRS). See text for further description of the sample. All estimates utilize panel data with fixed effects. Standard errors are in parentheses. Statistical significance denoted as *, **, and *** for the 1%, 5%, and 10% significance levels, respectively.

24
diseases. As Tables 2A and 2B show, the elderly who select to participate in SNAP report more food
insufficient and more likely to skip meals than those that choose not to participate. While SNAP
participants self-report themselves to be in better health than nonparticipants, this could reflect that those
able to travel to a local SNAP office, as well as grocery shop, may be more mobile than otherwise similar
nonparticipants. SNAP participation is correlated with 26 percent less out-of-pocket health spending over
the past two years—roughly $181 (0.26 * $4,543) for the average elderly sample member.
Considering diet-related disease, the fixed effects regressions suggest that SNAP participation
results in elderly more likely to have high blood pressure, take medication to control high blood pressure,
more likely to be overweight, and more likely to assess that their overall health is worse than it was two
years ago, though the last outcomes are not precisely measured. Because of potential selection into SNAP
receipt and potential correlation in take-up of both SNAP and Medicaid, these estimates do not provide
the causal effect of SNAP participation on these outcomes. With this initial evidence, we turn towards
addressing the endogeneity of SNAP participation as we present the first stage and IV regression results.
Regression Estimates: First Stage Results
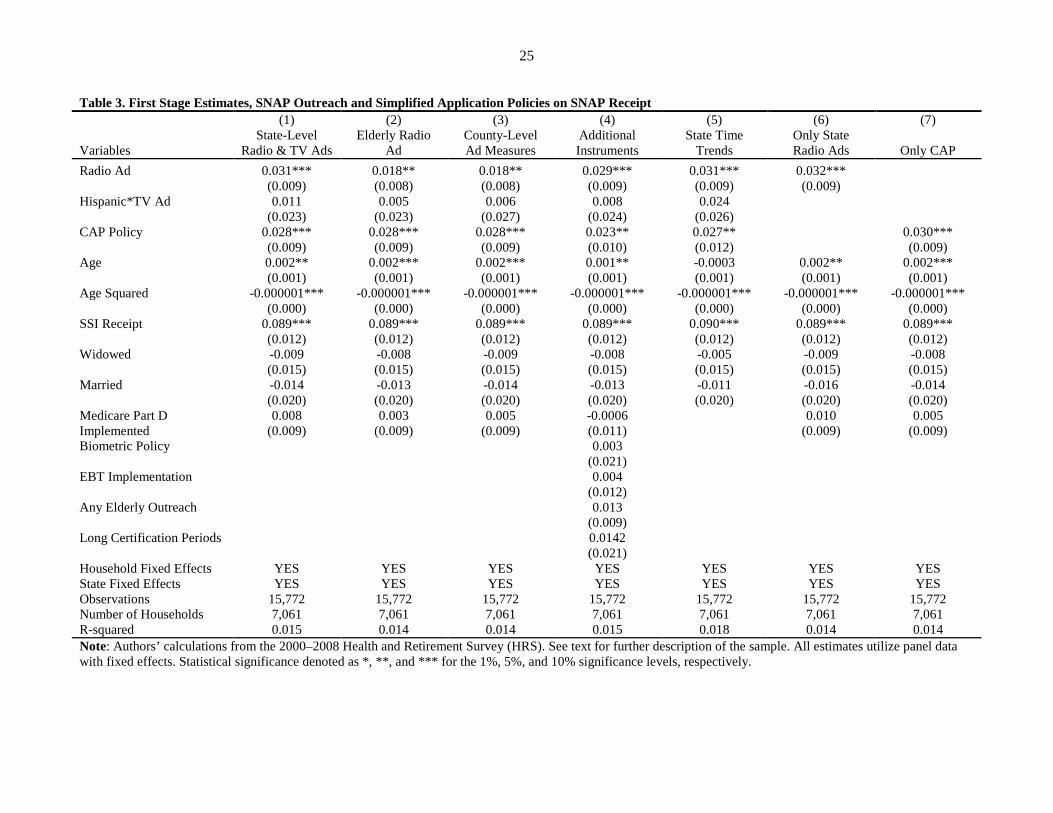
We report estimates for the first-stage regression in Table 3 that capture the effect of outreach and
SNAP policy on participation of eligible elderly households. Because of long-standing interest in the low
participation rates of this population, these results are policy relevant in their own right. Column 1
provides our preferred specification. We find that outreach efforts, in general, have the expected effect. If
any media market in the state had ever received a radio advertisement by the time of the respondent’s
interview, SNAP participation is approximately three percentage points greater and highly statistically
significant (t-statistic of 3.41). We find small and insignificant effects of the Spanish-language television
advertisements. Given the highly targeted nature of these advertisements and the airing of these
advertisements for only one month in 2006, it may be difficult to measure a discernible effect in the
sample.
25
Table 3. First Stage Estimates, SNAP Outreach and Simplified Application Policies on SNAP Receipt (1) (2) (3) (4) (5) (6) (7)
Variables State-Level
Radio & TV Ads Elderly Radio
Ad County-Level Ad Measures
Additional Instruments
State Time Trends
Only State Radio Ads Only CAP
Radio Ad 0.031*** 0.018** 0.018** 0.029*** 0.031*** 0.032***
(0.009) (0.008) (0.008) (0.009) (0.009) (0.009)
Hispanic*TV Ad 0.011 0.005 0.006 0.008 0.024
(0.023) (0.023) (0.027) (0.024) (0.026)
CAP Policy 0.028*** 0.028*** 0.028*** 0.023** 0.027**
0.030***
(0.009) (0.009) (0.009) (0.010) (0.012)
(0.009)
Age 0.002** 0.002*** 0.002*** 0.001** -0.0003 0.002** 0.002***
(0.001) (0.001) (0.001) (0.001) (0.001) (0.001) (0.001)
Age Squared -0.000001*** -0.000001*** -0.000001*** -0.000001*** -0.000001*** -0.000001*** -0.000001***
(0.000) (0.000) (0.000) (0.000) (0.000) (0.000) (0.000)
SSI Receipt 0.089*** 0.089*** 0.089*** 0.089*** 0.090*** 0.089*** 0.089***
(0.012) (0.012) (0.012) (0.012) (0.012) (0.012) (0.012)
Widowed -0.009 -0.008 -0.009 -0.008 -0.005 -0.009 -0.008
(0.015) (0.015) (0.015) (0.015) (0.015) (0.015) (0.015)
Married -0.014 -0.013 -0.014 -0.013 -0.011 -0.016 -0.014
(0.020) (0.020) (0.020) (0.020) (0.020) (0.020) (0.020)
Medicare Part D Implemented
0.008 0.003 0.005 -0.0006
0.010 0.005 (0.009) (0.009) (0.009) (0.011)
(0.009) (0.009)
Biometric Policy
0.003
(0.021)
EBT Implementation
0.004
(0.012)
Any Elderly Outreach
0.013
(0.009)
Long Certification Periods
0.0142
(0.021)
Household Fixed Effects YES YES YES YES YES YES YES State Fixed Effects YES YES YES YES YES YES YES Observations 15,772 15,772 15,772 15,772 15,772 15,772 15,772 Number of Households 7,061 7,061 7,061 7,061 7,061 7,061 7,061 R-squared 0.015 0.014 0.014 0.015 0.018 0.014 0.014 Note: Authors’ calculations from the 2000–2008 Health and Retirement Survey (HRS). See text for further description of the sample. All estimates utilize panel data with fixed effects. Statistical significance denoted as *, **, and *** for the 1%, 5%, and 10% significance levels, respectively.

26
The simplified application procedures associated with CAP have large, significant, and positive
effects. Respondents in states that implemented any type of CAP (standard or modified) increased SNAP
participation by 2.6 percentage points. This result—significant at the one percent level—suggests that
greater cross-agency data sharing can increase take-up rates for the elderly. It also suggests that the
current application process, perhaps including the required visit to the local SNAP office, deter elderly
households from participating.
The remaining columns of Table 3 examine the sensitivity of our results to different
specifications. In Column 2, we continue to measure radio advertising at the state-level but only consider
radio ads targeted at the elderly. The effect of the radio ad falls to a 1.9 percentage point increase in
SNAP participation. This decline, although small, could suggest that social interactions could be
important in expanding knowledge of SNAP eligibility. The non-targeted advertisements may have
reached friends and family of the eligible elderly who then encouraged the elderly to apply for SNAP.
Estimates of the Spanish language television advertisement and CAP remain essentially unchanged.
In Column 3, we utilize county-level rather than state-level advertising measures. This reduces
the effect of the radio ads slightly but has little effect on the television ads or the CAP estimate. Column 4
augments the analysis with additional outreach variables for the elderly, EBT implementation,
fingerprinting, and long recertification periods. The covariate estimates remain unchanged. These
additional policies, once we control for advertising and CAP, are not statistically significant. Column 5
adds state-time trends rather than state fixed effects to the analysis, while columns 6 and 7 show our main
significant instruments (state level radio ads and CAP) independently.16 All estimates for radio
advertisements and CAP are similar to our preferred estimate.
16Because these state policies are a linear combination of state and time fixed effects, we cannot include time fixed effects in the estimates.

27
Reduced Form Estimates
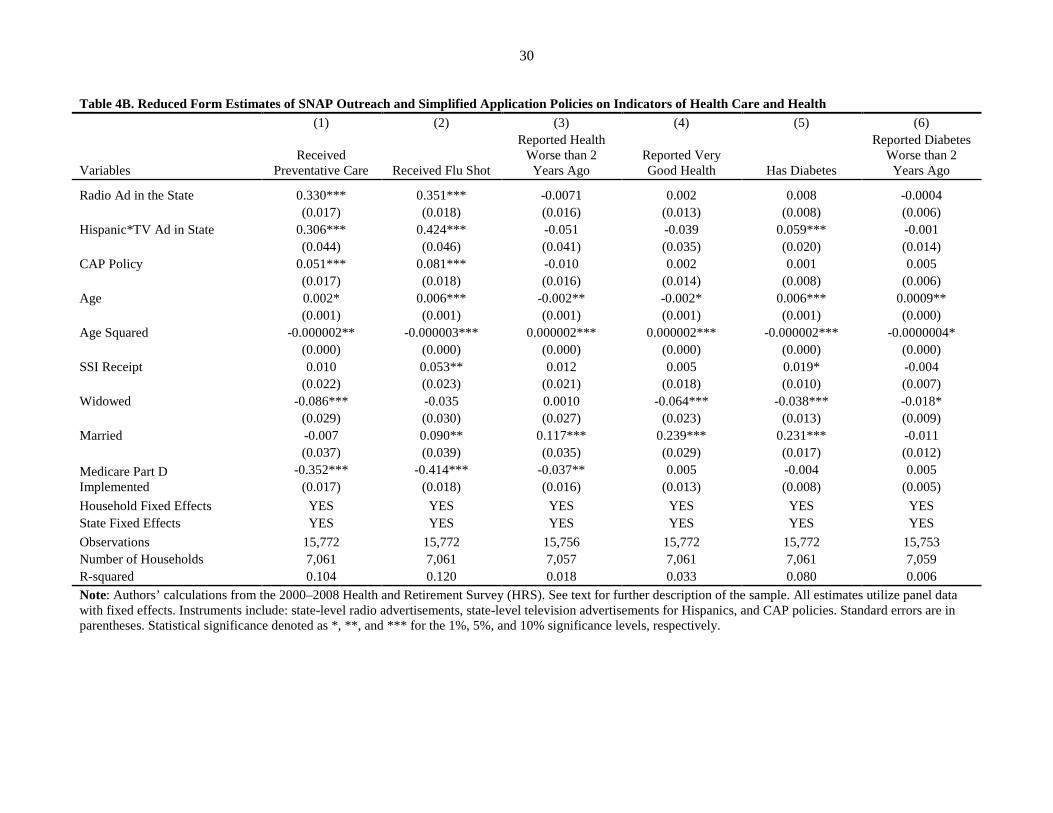
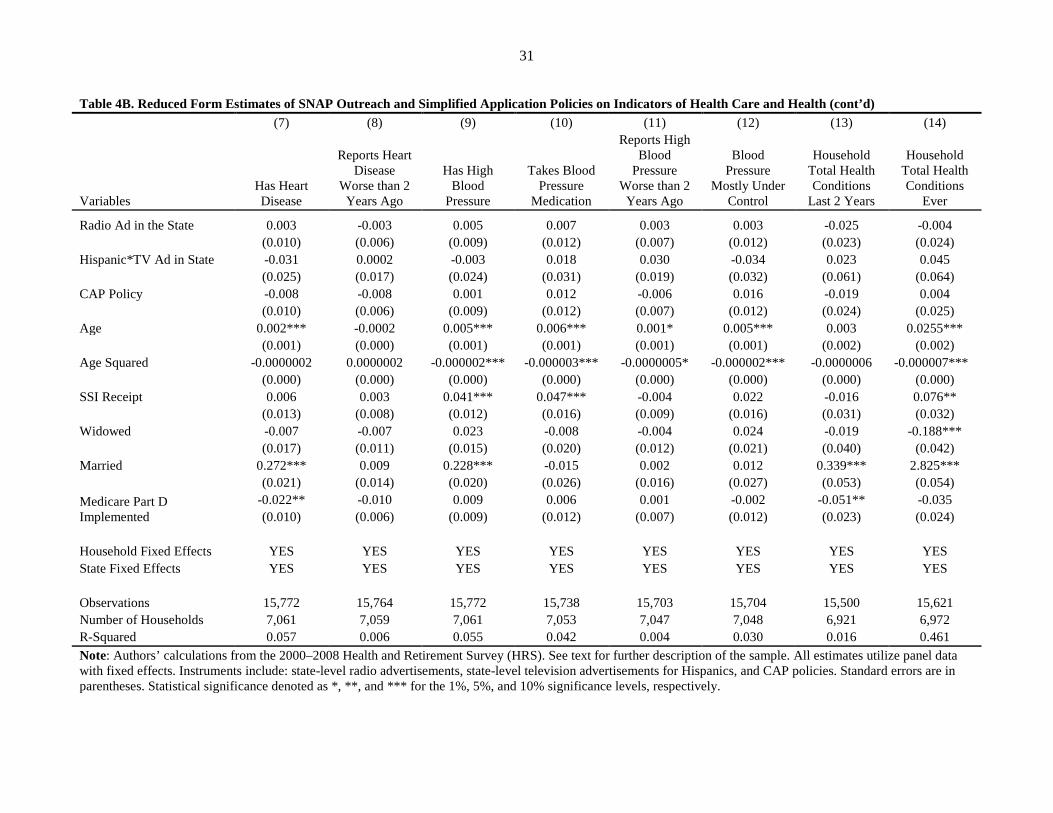
Tables 4A and 4B display the reduced form estimates and have the same dependent variables and
column specifications as both the endogenous regressions (Tables 2A and 2B) and the instrumental
variable regressions (Tables 5A and 5B). We first consider outcomes related to well-being (Table 4A).
State-level radio advertisements are only associated with a higher incidence of receiving subsidized
meals. The interaction between being Hispanic and seeing the Spanish television advertisements leads to
a decrease in the proportion of the elderly that are food insufficient, less likely to have skipped meals, less
likely to be overweight, yet more likely to have at least one member of the household be obese. The CAP
policies are associated with higher likelihood of skipping meals, more likely to have both members of the
household be of normal weight, and have lower out-of-pocket medical spending over the past two years.
Columns 1 and 2 of Table 4B show that all three instruments are associated with a positive and
statistically significant (at the 1 percent level) effect on the elderly receiving preventative care and,
specifically, receiving flu shots. In addition, the interaction between being Hispanic and having a
television ad also results in a higher incidence of reported diabetes among the elderly. The remaining
results in Table 4B are imprecisely measured and, generally, small in magnitude.
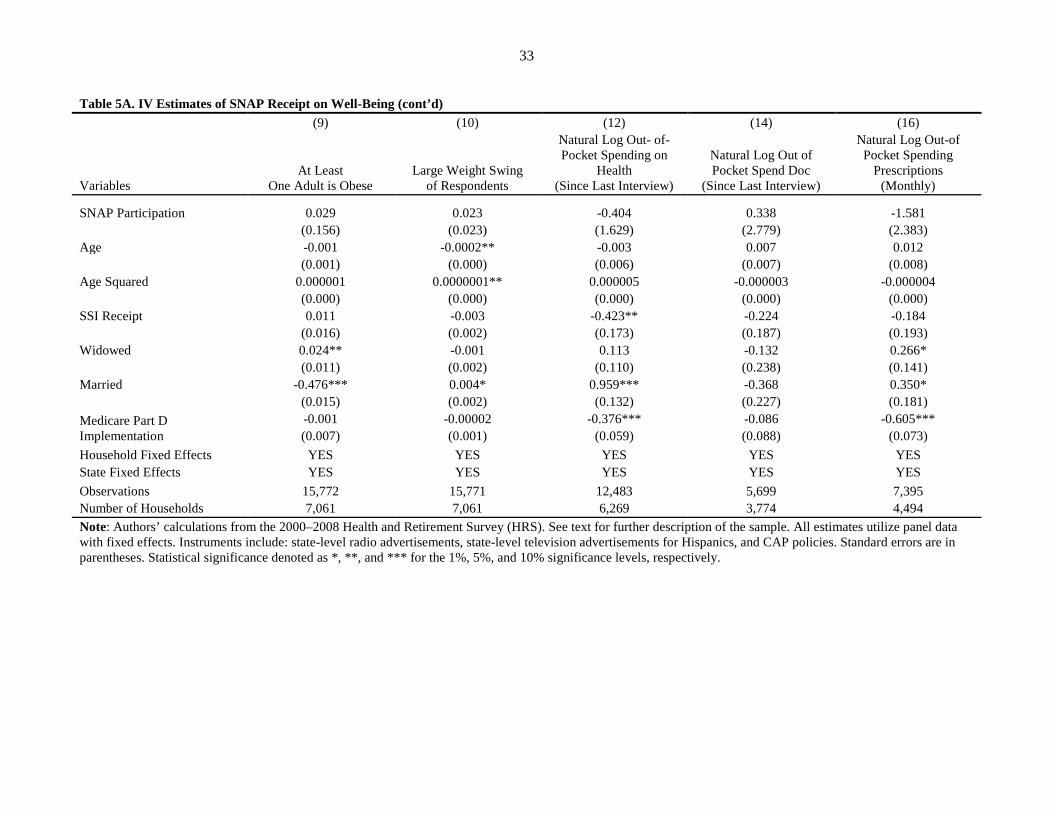
Regression Estimates: Full Instrumental Variable Results
Tables 5A and 5B presents instrumental variable results to measure the causal effect of SNAP
participation on food sufficiency and diet-related disease measures. The columns match up to the
endogenous regressions presented in Tables 2A and 2B. Because many of these results lack statistical
significance, the discussion will focus on the direction of the effect.
Using the instruments discussed previously, Columns 1 through 4 of Table 5A point to declines
in well-being with SNAP participation, although none are statistically significant. Food insufficiency
increases, use of subsidized meals increase, and skipping prescription drugs due to resource constraints
increases. These results are not the expected direction of the effect of SNAP participation. One possible

28
Table 4A. Reduced Form Estimates of SNAP Outreach and Simplified Application Policies on Indicators of Well-Being (1) (2) (3) (4) (5) (6) (7) (8)
Variables Food Insecure Subsidized
Meals Skipped Meals
Skipped Prescriptions
Respondent BMI
Underweight (At Least One
Adult)
Normal Weight
(All Adults) Overweight (All Adults)
Radio Ad in the State 0.012 0.017** -0.004 0.015 0.030 0.0006 0.004 -0.006
(0.011) (0.007) (0.008) (0.011) (0.094) (0.006) (0.004) (0.006)
Hispanic*TV Ad in State -0.070** 0.011 -0.024 0.007 0.050 -0.021 0.0002 -0.081***
(0.028) (0.019) (0.020) (0.029) (0.245) (0.014) (0.011) (0.014)
CAP Policy 0.001 -0.010 0.024*** 0.002 -0.004 -0.008 0.008** -0.001
(0.011) (0.008) (0.008) (0.011) (0.095) (0.006) (0.004) (0.006)
Age -0.0001 -0.001 -0.0001 0.0004 0.041*** -0.001*** 0.0003 -0.0002
(0.001) (0.001) (0.001) (0.001) (0.007) (0.000) (0.000) (0.000)
Age Squared -0.0000002 0.000001*** -0.0000001 -0.000001 -0.00003*** 0.000001*** -0.0000002 0.0000001
(0.000) (0.000) (0.000) (0.000) (0.000) (0.000) (0.000) (0.000)
SSI Receipt 0.003 -0.016* -0.005 -0.012 -0.046 0.0007 0.002 -0.007
(0.014) (0.010) (0.010) (0.015) (0.123) (0.007) (0.005) (0.007)
Widowed -0.067*** 0.002 -0.011 -0.010 0.056 0.015* -0.0041 -0.007
(0.018) (0.013) (0.013) (0.019) (0.159) (0.009) (0.007) (0.009)
Married -0.073*** -0.014 -0.021 -0.038 0.092 0.058*** 0.129*** 0.103***
(0.023) (0.016) (0.017) (0.024) (0.203) (0.012) (0.009) (0.012)
Medicare Part D Implemented
0.020* -0.005 0.008 0.009 0.430*** -0.012** 0.005 0.008 (0.011) (0.007) (0.008) (0.011) (0.093) (0.005) (0.004) (0.005)
Household Fixed Effects YES YES YES YES YES YES YES YES State Fixed Effects YES YES YES YES YES YES YES YES Observations 15,694 15,753 15,744 15,740 15,445 15,772 15,772 15,772 Number of Households 7,047 7,059 7,056 7,054 6,984 7,061 7,061 7,061 R-squared 0.009 0.032 0.010 0.011 0.018 0.014 0.053 0.021 Note: Authors’ calculations from the 2000–2008 Health and Retirement Survey (HRS). See text for further description of the sample. All estimates utilize panel data with fixed effects. Instruments include: state-level radio advertisements, state-level television advertisements for Hispanics, and CAP policies. Standard errors are in parentheses. Statistical significance denoted as *, **, and *** for the 1%, 5%, and 10% significance levels, respectively.

29
Table 4A. Reduced Form Estimates of SNAP Outreach and Simplified Application Policies on Indicators of Well-Being (cont’d) (9) (10) (12) (14) (16)
Variables At Least on Adult is
Obese Large Weight Swing Since Last Interview
Natural Log Out- of-Pocket Spending on
Health (Since Last Interview)
Natural Log Out of Pocket Spend Doc
(Since Last Interview)
Natural Log Out-of Pocket Spending
Prescriptions (Monthly)
Radio Ad in the State -0.003 0.00001 0.026 0.150 0.049
(0.007) (0.001) (0.054) (0.092) (0.063)
Hispanic*TV Ad in State 0.041** -0.004 0.058 0.338 0.136
(0.017) (0.003) (0.156) (0.265) (0.257)
CAP Policy 0.005 0.001 -0.064 -0.094 -0.073
(0.007) (0.001) (0.057) (0.097) (0.070)
Age -0.0008* -0.0002** -0.004 0.005 0.007
(0.001) (0.000) (0.004) (0.007) (0.005)
Age Squared 0.0000005* 0.0000001** 0.00001** -0.000003 -0.000002
(0.000) (0.000) (0.000) (0.000) (0.000)
SSI Receipt 0.013 -0.001 -0.459*** -0.233 -0.288***
(0.009) (0.001) (0.085) (0.182) (0.111)
Widowed 0.024** -0.001 0.124 -0.156 0.285**
(0.011) (0.002) (0.102) (0.170) (0.133)
Married -0.476*** 0.004* 0.960*** -0.379* 0.378**
(0.014) (0.002) (0.130) (0.223) (0.167)
Medicare Part D Implemented
-0.002 0.0000788954 -0.376*** -0.065 -0.606*** (0.007) (0.001) (0.054) (0.088) (0.068)
Household Fixed Effects YES YES YES YES YES State Fixed Effects YES YES YES YES YES Observations 15,772 15,771 12,483 5,699 7,395 Number of Households 7,061 7,061 6,269 3,774 4,494 R-squared 0.200 0.008 0.038 0.024 0.059 Note: Authors’ calculations from the 2000–2008 Health and Retirement Survey (HRS). See text for further description of the sample. All estimates utilize panel data with fixed effects. Instruments include: state-level radio advertisements, state-level television advertisements for Hispanics, and CAP policies. Standard errors are in parentheses. Statistical significance denoted as *, **, and *** for the 1%, 5%, and 10% significance levels, respectively.
30
Table 4B. Reduced Form Estimates of SNAP Outreach and Simplified Application Policies on Indicators of Health Care and Health (1) (2) (3) (4) (5) (6)
Variables Received
Preventative Care Received Flu Shot
Reported Health Worse than 2
Years Ago Reported Very Good Health Has Diabetes
Reported Diabetes Worse than 2
Years Ago
Radio Ad in the State 0.330*** 0.351*** -0.0071 0.002 0.008 -0.0004
(0.017) (0.018) (0.016) (0.013) (0.008) (0.006)
Hispanic*TV Ad in State 0.306*** 0.424*** -0.051 -0.039 0.059*** -0.001
(0.044) (0.046) (0.041) (0.035) (0.020) (0.014)
CAP Policy 0.051*** 0.081*** -0.010 0.002 0.001 0.005
(0.017) (0.018) (0.016) (0.014) (0.008) (0.006)
Age 0.002* 0.006*** -0.002** -0.002* 0.006*** 0.0009**
(0.001) (0.001) (0.001) (0.001) (0.001) (0.000)
Age Squared -0.000002** -0.000003*** 0.000002*** 0.000002*** -0.000002*** -0.0000004*
(0.000) (0.000) (0.000) (0.000) (0.000) (0.000)
SSI Receipt 0.010 0.053** 0.012 0.005 0.019* -0.004
(0.022) (0.023) (0.021) (0.018) (0.010) (0.007)
Widowed -0.086*** -0.035 0.0010 -0.064*** -0.038*** -0.018*
(0.029) (0.030) (0.027) (0.023) (0.013) (0.009)
Married -0.007 0.090** 0.117*** 0.239*** 0.231*** -0.011
(0.037) (0.039) (0.035) (0.029) (0.017) (0.012)
Medicare Part D Implemented
-0.352*** -0.414*** -0.037** 0.005 -0.004 0.005 (0.017) (0.018) (0.016) (0.013) (0.008) (0.005)
Household Fixed Effects YES YES YES YES YES YES State Fixed Effects YES YES YES YES YES YES Observations 15,772 15,772 15,756 15,772 15,772 15,753 Number of Households 7,061 7,061 7,057 7,061 7,061 7,059 R-squared 0.104 0.120 0.018 0.033 0.080 0.006 Note: Authors’ calculations from the 2000–2008 Health and Retirement Survey (HRS). See text for further description of the sample. All estimates utilize panel data with fixed effects. Instruments include: state-level radio advertisements, state-level television advertisements for Hispanics, and CAP policies. Standard errors are in parentheses. Statistical significance denoted as *, **, and *** for the 1%, 5%, and 10% significance levels, respectively.
31
Table 4B. Reduced Form Estimates of SNAP Outreach and Simplified Application Policies on Indicators of Health Care and Health (cont’d) (7) (8) (9) (10) (11) (12) (13) (14)
Variables Has Heart Disease
Reports Heart Disease
Worse than 2 Years Ago
Has High Blood
Pressure
Takes Blood Pressure
Medication
Reports High Blood
Pressure Worse than 2
Years Ago
Blood Pressure
Mostly Under Control
Household Total Health Conditions
Last 2 Years
Household Total Health Conditions
Ever
Radio Ad in the State 0.003 -0.003 0.005 0.007 0.003 0.003 -0.025 -0.004
(0.010) (0.006) (0.009) (0.012) (0.007) (0.012) (0.023) (0.024)
Hispanic*TV Ad in State -0.031 0.0002 -0.003 0.018 0.030 -0.034 0.023 0.045
(0.025) (0.017) (0.024) (0.031) (0.019) (0.032) (0.061) (0.064)
CAP Policy -0.008 -0.008 0.001 0.012 -0.006 0.016 -0.019 0.004
(0.010) (0.006) (0.009) (0.012) (0.007) (0.012) (0.024) (0.025)
Age 0.002*** -0.0002 0.005*** 0.006*** 0.001* 0.005*** 0.003 0.0255***
(0.001) (0.000) (0.001) (0.001) (0.001) (0.001) (0.002) (0.002)
Age Squared -0.0000002 0.0000002 -0.000002*** -0.000003*** -0.0000005* -0.000002*** -0.0000006 -0.000007***
(0.000) (0.000) (0.000) (0.000) (0.000) (0.000) (0.000) (0.000)
SSI Receipt 0.006 0.003 0.041*** 0.047*** -0.004 0.022 -0.016 0.076**
(0.013) (0.008) (0.012) (0.016) (0.009) (0.016) (0.031) (0.032)
Widowed -0.007 -0.007 0.023 -0.008 -0.004 0.024 -0.019 -0.188***
(0.017) (0.011) (0.015) (0.020) (0.012) (0.021) (0.040) (0.042)
Married 0.272*** 0.009 0.228*** -0.015 0.002 0.012 0.339*** 2.825***
(0.021) (0.014) (0.020) (0.026) (0.016) (0.027) (0.053) (0.054)
Medicare Part D Implemented
-0.022** -0.010 0.009 0.006 0.001 -0.002 -0.051** -0.035 (0.010) (0.006) (0.009) (0.012) (0.007) (0.012) (0.023) (0.024)
Household Fixed Effects YES YES YES YES YES YES YES YES State Fixed Effects YES YES YES YES YES YES YES YES
Observations 15,772 15,764 15,772 15,738 15,703 15,704 15,500 15,621 Number of Households 7,061 7,059 7,061 7,053 7,047 7,048 6,921 6,972 R-Squared 0.057 0.006 0.055 0.042 0.004 0.030 0.016 0.461 Note: Authors’ calculations from the 2000–2008 Health and Retirement Survey (HRS). See text for further description of the sample. All estimates utilize panel data with fixed effects. Instruments include: state-level radio advertisements, state-level television advertisements for Hispanics, and CAP policies. Standard errors are in parentheses. Statistical significance denoted as *, **, and *** for the 1%, 5%, and 10% significance levels, respectively.

32
Table 5A. IV Estimates of SNAP Receipt on Well-Being (1) (2) (3) (4) (5) (6) (7) (8)
Variables Food
Insufficient Subsidized
Meals Skip Meals Skip
Prescriptions Respondent
BMI Either Adult Underweight
Both Adults Normal Weight
All Adults Overweight
SNAP Participation 0.218 0.139 0.310 0.302 0.461 -0.124 0.210** -0.129
(0.252) (0.176) (0.190) (0.269) (2.165) (0.131) (0.106) (0.133)
Age -0.001 -0.001 -0.001 -0.0001 0.041*** -0.001* -0.00003 -0.0002
(0.001) (0.001) (0.001) (0.001) (0.009) (0.001) (0.000) (0.001)
Age Squared 0.0000002 0.000001*** 0.0000003 -0.0000003 -0.00003*** 0.000001*** 0.00000001 0.00000001
(0.000) (0.000) (0.000) (0.000) (0.000) (0.000) (0.000) (0.000)
SSI Receipt -0.016 -0.029 -0.032 -0.039 -0.089 0.012 -0.016 0.004
(0.026) (0.019) (0.020) (0.028) (0.236) (0.014) (0.011) (0.014)
Widowed -0.065*** 0.003 -0.009 -0.008 0.062 0.014 -0.002 -0.008
(0.018) (0.013) (0.014) (0.020) (0.161) (0.010) (0.008) (0.010)
Married -0.071*** -0.011 -0.019 -0.033 0.102 0.056*** 0.132*** 0.100***
(0.024) (0.017) (0.018) (0.025) (0.207) (0.012) (0.010) (0.012)
Medicare Part D Implementation
0.017 -0.008 0.008 0.005 0.425*** -0.012** 0.004 0.009 (0.011) (0.008) (0.008) (0.011) (0.093) (0.006) (0.005) (0.006)
Household Fixed Effects YES YES YES YES YES YES YES YES State Fixed Effects YES YES YES YES YES YES YES YES Observations 15,694 15,753 15,744 15,740 15,445 15,772 15,772 15,772 Number of Households 7,047 7,059 7,056 7,054 6,984 7,061 7,061 7,061 Note: Authors’ calculations from the 2000–2008 Health and Retirement Survey (HRS). See text for further description of the sample. All estimates utilize panel data with fixed effects. Instruments include: state-level radio advertisements, state-level television advertisements for Hispanics, and CAP policies. Standard errors are in parentheses. Statistical significance denoted as *, **, and *** for the 1%, 5%, and 10% significance levels, respectively.
33
Table 5A. IV Estimates of SNAP Receipt on Well-Being (cont’d) (9) (10) (12) (14) (16)
Variables At Least
One Adult is Obese Large Weight Swing
of Respondents
Natural Log Out- of-Pocket Spending on
Health (Since Last Interview)
Natural Log Out of Pocket Spend Doc
(Since Last Interview)
Natural Log Out-of Pocket Spending
Prescriptions (Monthly)
SNAP Participation 0.029 0.023 -0.404 0.338 -1.581
(0.156) (0.023) (1.629) (2.779) (2.383)
Age -0.001 -0.0002** -0.003 0.007 0.012
(0.001) (0.000) (0.006) (0.007) (0.008)
Age Squared 0.000001 0.0000001** 0.000005 -0.000003 -0.000004
(0.000) (0.000) (0.000) (0.000) (0.000)
SSI Receipt 0.011 -0.003 -0.423** -0.224 -0.184
(0.016) (0.002) (0.173) (0.187) (0.193)
Widowed 0.024** -0.001 0.113 -0.132 0.266*
(0.011) (0.002) (0.110) (0.238) (0.141)
Married -0.476*** 0.004* 0.959*** -0.368 0.350*
(0.015) (0.002) (0.132) (0.227) (0.181)
Medicare Part D Implementation
-0.001 -0.00002 -0.376*** -0.086 -0.605*** (0.007) (0.001) (0.059) (0.088) (0.073)
Household Fixed Effects YES YES YES YES YES State Fixed Effects YES YES YES YES YES Observations 15,772 15,771 12,483 5,699 7,395 Number of Households 7,061 7,061 6,269 3,774 4,494 Note: Authors’ calculations from the 2000–2008 Health and Retirement Survey (HRS). See text for further description of the sample. All estimates utilize panel data with fixed effects. Instruments include: state-level radio advertisements, state-level television advertisements for Hispanics, and CAP policies. Standard errors are in parentheses. Statistical significance denoted as *, **, and *** for the 1%, 5%, and 10% significance levels, respectively.

34
Table 5B. IV Estimates of SNAP Receipt on Health Care and Health (1) (2) (3) (4) (5) (6)
Variables Received
Preventative Care Received Flu Shot
Reported Health Worse than 2
Years Ago Reported Very Good Health Has Diabetes
Reported Diabetes Worse than 2
Years Ago
SNAP Participation 6.786*** 7.652*** -0.295 0.062 0.166 0.073
(1.485) (1.666) (0.377) (0.314) (0.183) (0.130)
Age -0.007 -0.004 -0.002 -0.002 0.005*** 0.001
(0.006) (0.006) (0.001) (0.001) (0.001) (0.001)
Age Squared 0.00001** 0.00001 0.000002** 0.000002** -0.000002*** -0.0000004
(0.000) (0.000) (0.000) (0.000) (0.000) (0.000)
SSI Receipt -0.592*** -0.625*** 0.038 -0.001 0.004 -0.011
(0.156) (0.175) (0.040) (0.033) (0.019) (0.014)
Widowed -0.019 0.041 -0.002 -0.064*** -0.037*** -0.017*
(0.108) (0.121) (0.028) (0.023) (0.013) (0.009)
Married 0.106 0.216 0.112*** 0.240*** 0.234*** -0.010
(0.140) (0.157) (0.036) (0.030) (0.017) (0.012)
Medicare Part D Implementation
-0.427*** -0.494*** -0.036** 0.005 -0.005 0.005 (0.063) (0.071) (0.016) (0.013) (0.008) (0.006)
Household Fixed Effects YES YES YES YES YES YES State Fixed Effects YES YES YES YES YES YES Observations 15,772 15,772 15,756 15,772 15,772 15,753 Number of Households 7,061 7,061 7,057 7,061 7,061 7,059 Note: Authors’ calculations from the 2000–2008 Health and Retirement Survey (HRS). See text for further description of the sample. All estimates utilize panel data with fixed effects. Instruments include: state-level radio advertisements, state-level television advertisements for Hispanics, and CAP policies. Standard errors are in parentheses. Statistical significance denoted as *, **, and *** for the 1%, 5%, and 10% significance levels, respectively.

35
Table 5B. IV Estimates of SNAP Receipt on Health and Health Care (cont’d) (7) (8) (9) (10) (11) (12) (13) (14)
Variables Has Heart Disease
Reported Heart Disease Worse than 2
Years Ago
Has High Blood
Pressure
Takes Blood Pressure
Medication
Reported High Blood
Pressure Worse than 2
Years Ago
Blood Pressure
Mainly Under Control
Total Household
Health Conditions
Past 2 Years
Total Household
Health Conditions
Ever
SNAP Participation -0.069 -0.184 0.107 0.318 -0.031 0.295 -0.739 -0.0006
(0.229) (0.155) (0.214) (0.287) (0.170) (0.291) (0.560) (0.560)
Age 0.002** 0.0001 0.005*** 0.006*** 0.001* 0.005*** 0.004* 0.026***
(0.001) (0.001) (0.001) (0.001) (0.001) (0.001) (0.002) (0.002)
Age Squared -0.0000002 0.00000002 -0.000002*** -0.000002*** -0.000001 -0.000002*** -0.000002 -0.00001***
(0.000) (0.000) (0.000) (0.000) (0.000) (0.000) (0.000) (0.000)
SSI Receipt 0.012 0.019 0.031 0.019 -0.001 -0.004 0.048 0.076
(0.024) (0.016) (0.023) (0.030) (0.018) (0.031) (0.058) (0.059)
Widowed -0.008 -0.009 0.024 -0.005 -0.004 0.027 -0.024 -0.188***
(0.017) (0.011) (0.016) (0.021) (0.012) (0.021) (0.042) (0.042)
Married 0.271*** 0.007 0.229*** -0.011 0.002 0.015 0.334*** 2.825***
(0.022) (0.015) (0.020) (0.027) (0.016) (0.028) (0.056) (0.055)
Medicare Part D Implementation
-0.022** -0.008 0.008 0.004 0.001 -0.004 -0.045* -0.034 (0.010) (0.007) (0.009) (0.012) (0.007) (0.013) (0.024) (0.024)
Household Fixed Effects YES YES YES YES YES YES YES YES State Fixed Effects YES YES YES YES YES YES YES YES
Observations 15,772 15,764 15,772 15,738 15,703 15,704 15,500 15,621 Number of Households 7,061 7,059 7,061 7,053 7,047 7,048 6,921 6,972 Note: Authors’ calculations from the 2000–2008 Health and Retirement Survey (HRS). See text for further description of the sample. All estimates utilize panel data with fixed effects. Instruments include: state-level radio advertisements, state-level television advertisements for Hispanics, and CAP policies. Standard errors are in parentheses. Statistical significance denoted as *, **, and *** for the 1%, 5%, and 10% significance levels, respectively.

36
explanation could be that we measure SNAP as receipt in the last month but these well-being indicators
are measured since the past interview (roughly two years).
These findings provide some evidence that SNAP participation does not improve food distress of
the elderly. Leftin (2010) estimates that the average SNAP benefit for an elderly household was $128 per
month, a lower benefit than many other types of SNAP households due to smaller household size. With
this level of benefits, SNAP benefits may be too low to reduce the incidence of food insufficiency.
Additionally, the effect on subsidized meal receipt contrasts with the findings of Wu (2009), who
concludes subsidized meal receipt crowds out the use of SNAP. One way to reconcile these findings with
Wu, as well as the findings for skipping meals, is that we measure current SNAP participation (i.e., SNAP
benefits received last month) but the subsidized meal receipt (or skipping meals) outcome is measured
since the last interview (roughly two years).
Next, we consider outcomes related to weight. The BMI of the respondent (Column 5) increases,
but the probability of all adults in the household being underweight falls (Column 6), the probability of at
least one adult being obese slightly rises, and the probability of all adults being overweight falls (Column
8). Meanwhile, SNAP participation does make the elderly more likely to have both members of the
household be in the normal weight range (statistically significant at the 5 percent level). The BMI result
may be difficult to interpret because improvements in well-being depend on whether the respondent was
originally overweight or underweight. In future work, we hope to investigate ways to improve
measurement of weight changes related to SNAP receipt. Overall, SNAP participation may provide better
food access and nutrition for some of the elderly, leading to less underweight elderly and less overweight
elderly. These outcomes provide some evidence for improvements in well-being associated with SNAP
receipt.
The final outcomes related to well-being relate to out-of-pocket health spending. Overall, the
point estimates suggest the amount of health spending since the last interview falls. When we look at a
few components of this spending, out-of-pocket spending on doctors since the last interview rises slightly

37
but out-of-pocket spending on prescription drugs in the last month falls dramatically. None, however, are
statistically significant.
Table 5B contains specific measures of health and health care. Columns 1 and 2 of Table 5B
displays that the causal effect of SNAP participation dramatically increases the use of preventative care,
particularly flu shots. This may indicate that SNAP improves knowledge of the importance of such care
or improves access to health care, especially primary care.
Although not statistically significant, the higher levels of self-reported health reported by SNAP
recipients shown in Columns 3 and 4 include both changes in health since the last interview and current
health. For a population like the elderly that is at-risk of falling into poor health, not having worsening
health over a two-year period is an important outcome. When looking at specific diet-related diseases, we
see similar patterns for diabetes (Columns 5 and 6). Unlike diabetes, point estimates for heart disease
(Column 7) and its severity (Column 8) indicate declines over time. The incidence of high blood pressure
is greater for SNAP participants (Column 9) but more participants take medication (Column 10), report
improvements over time (Column 11), and indicate that their high blood pressure is under control
(Column 12). In addition, there are a smaller number of total household health conditions both in the past
two years and ever among households that participated in SNAP (Column 13 and 14).
Like the dramatic results for preventative health care, the blood pressure results may indicate
SNAP assists households with access to providers or encourages the use of primary care. The negative
point estimate for number of new health conditions in the household since the last interview provides
some support for this idea. This could result in lower overall health care usage, especially high cost usage
like emergency room visits and specialists, when preventable or chronic diseases are not well-managed.
POTENTIAL POLICY IMPLICATIONS
While results are preliminary, there are potentially several policy implications for our findings.
Our first stage results provide new evidence on the effect of outreach and program rules on SNAP
participation for the elderly. We find evidence that radio advertisements, but not Spanish language

38
television advertisements, increase SNAP participation. We also confirm that CAP programs boost
participation among the elderly and the use of technology in program administration reduces
participation. With concern about low participation rates among elderly households, these findings shed
light on potential changes to the program for this growing subpopulation of Americans. Targeted outreach
to Hispanics, however, does not appear to be decisive in significantly changing decisions about
participation among the elderly. The point estimate is positive but not statistically significant and this
outreach may be too targeted to be measurable in the HRS. Future work, detailed below, will continue to
explore richer measures of outreach and additional SNAP program rules.
Our main outcomes of interest—food sufficiency and diet-related disease—are also of substantive
policy interest. The preliminary evidence does not find a protective effect of SNAP on food sufficiency
and other outcomes related to economic well-being. While not significant, the direction of the estimated
effects for these outcomes is concerning given the goal of SNAP is to reduce food distress. Low SNAP
benefits received by the elderly may be part of the story and, in future work, we will fully examine this
explanation as it suggests an avenue where the program can be improved to better meet participant needs.
The 2008 Farm Bill increased the minimum SNAP benefit so 2010 data may be able to shed light on this.
We find that SNAP participation leads to a much greater incidence of receiving preventative
health care, as well as a improvements in hypertension and high blood pressure, which suggests that
SNAP participation may lead to better disease management. More work is needed to verify this finding,
as well as to investigate how long program participation is required for this effect. Given the high and
growing health care costs of this important subpopulation, these findings have important policy
implications for shaping the future of food assistance for the elderly. It could have important long-term
spending consequences for both Medicaid and Medicare if the increased use of preventative health care
results in costly diseases like cancer to be diagnosed early, resulting in lower treatment costs. It also
suggests the importance of increasing awareness among the elderly of their eligibility for benefits.
Finally, our findings will lead to a better understanding of how to best train social workers that
deal primarily with the elderly (and their families), such as gerontology social workers in hospital and

39
other social insurance settings, to help facilitate the transfer of information about food assistance
eligibility and also make the elderly and their families aware of the health consequences of food
insufficiency. Another possible way to get the information disseminated would be to target doctors and
medical practices that serve Medicare patients, as new Medicare enrollees are covered for a one-time
physical exam known as a “Welcome to Medicare” visit, making it an ideal opportunity to increase
knowledge about diet-related diseases, consequences of food insufficiency, and the availability of food
assistance programs. Finally, in light of the recent movement toward health care reform and attempting to
better control health care spending, it is vital to understand the long-term health consequences related to
food assistance use (or non-use) as the elderly have the highest per-capita health care spending in the
United States.
FUTURE WORK
In future work on this project, we plan a number of changes and modifications. First, we will
continue to explore our sample selection criteria. Our low rate of SNAP receipt, even for a population
with historically low participation rates, suggests that further refinement may be needed. We also plan to
include richer controls for state-level SNAP policies that may affect the decisions of the elderly to
participate. We will do this by collecting more data on program modernization that may affect the ability
of the elderly to enter the program or recertify for benefits, such as a growing reliance on Call Centers and
use of online application.17 The use of technology in program administration may be particularly difficult
for the elderly to adapt to and could lead to a reduction in participation rates either through increases in
the entry or exit rates. Heflin and Mueser (2010) find the modernization of program administration
imposes high costs on the elderly.
An important programmatic change we plan to investigate is once 2010 HRS data is released,
controlling for the change in the program name. The names adopted by various states likely lead to
17Other potential state-level policy changes include the Standard Medical Deduction, Simplified Application, and Simplified Elderly Reporting.

40
confusion among the elderly and generate a great deal of state-time variation. The 2010 data will also
allow us to have a longer panel and additional variation to exploit to strengthen our analysis and hopefully
help with the precious of some of our estimates. We anticipate that the 2010 HRS data should be released
in the coming months.
Our second focus will be to incorporate the length of SNAP participation into our results.
Currently, we may be too focused on the short-term effects of SNAP participation when food distress and
many of the diet-related diseases we measure evolve over a longer time period. Although our IV estimates
provide us local average treatment effects (LATE), that is, the effect of SNAP participation on those
households that enter into participation because of the instrument we believe we can still examine long-
term rather than short-term effects. For example, we would expect a household transitioning into SNAP
receipt because of the 2004 ads may have different outcomes in 2010 than a household transitioning into
SNAP receipt because of the 2008 ads.
Finally, we hope to refine the analysis, to increase our precision. We plan to further investigate
any potentially omitted variables, incorporate the 2010 data to increase our sample, and refine our sample
selection procedures.

41
References
Bhattacharya, Jayanta, Thomas DeLeire, Steven Haider, and Janet Currie. 2004. “Poverty, Food Insecurity, and Nutritional Outcomes in Children and Adults.” Journal of Health Economics 23(4): 839–862.
Baum, Charles. 2007. “The Effects of Food Stamps on Obesity.” Contractor and Cooperator Report No. 34. Washington, DC: U.S. Department of Agriculture, Economic Research Service.
Boussy, Carole, Russell Jackson, and Nancy Wemmerus. 2000. “Evaluation of SSI/FSP Joint Processing Alternatives Demonstration.” Washington, DC: Department of Agriculture, Food and Consumer Service, January.
Blank, Rebecca, and Patricia Ruggles. 1996. “When Do Women Use Aid to Families with Dependent Children and Food Stamps? The Dynamics of Eligibility versus Participation.” Journal of Human Resources 31(1): 57–89.
Cody, Scott, Laura Castner, James Mabli, and Julia Sykes. 2007. “Dynamics of Food Stamp Program Participation, 2001–2003.” Submitted to the US Department of Agriculture, Food and Nutrition Service. Washington, DC: Mathematica Policy Research, Inc.
Coleman-Jensen, Alisha, Mark Nord, Margaret Andrews, and Steven Carlson. 2011. “Household Food Security in the United States in 2010.” ERR-125. Washington, DC: U.S. Department of Agriculture, Economic Research Service, September.
Cunnyngham, Karen. 2010. “State Trends in Supplemental Nutrition Assistance Program Eligibility and Participation among Elderly Individuals”. Report Prepared for U.S. Department of Agriculture, Economic Research Service. Accessed at http://www.mathematica-mpr.com/publications/PDFs/nutrition/SNAP_elderly.pdf
Currie, Janet. 2006. “The Take-up of Social Benefits.” In Public Policy and the Income Distribution, edited by Alan J. Auerbach, David Card, and John M. Quigley, 80–148. NY: Russell Sage Foundation Publications.
Daponte, Beth Osborne, Seth Sanders, and Lowell Taylor. 1999. “Why Do Low-Income Households Not Use Food Stamps? Evidence from a Natural Experiment.” Journal of Human Resources 34(3): 612–628.
De Marco, Molly, and Sheryl Thorburn. 2009. “The Relationship between Income and Food Insecurity among Oregon Residents: Does Social Support Matter?” Public Health Nutrition 12(11): 2104–2112.
Dickert-Conlin, Stacy, Katie Fitzpatrick, and Laura Tiehen. 2010. “The Downs and Ups of the SNAP Caseload: What Matters?” Mimeo.
Dickert-Conlin, Stacy, Katie Fitzpatrick, and Laura Tiehen. 2011. “The Role of Advertising in the Growth of the SNAP Caseload.” Paper presented at the 2012 Allied Social Science Association Annual Meetings.

42
Dinour, Lauren M., Dara Bergen, and Ming-Chin Yeh. 2007. “The Food Insecurity-Obesity Paradox: A Review of the Literature and the Role Food Stamps May Play.” Journal of the American Dietetic Association 107(11): 1952–1961.
Frazão, Elizabeth, Margaret Andrews, David Smallwood, and Mark Prell. 2007. “Can Food Stamps Do More To Improve Food Choices? An Economic Perspective—Food Spending Patterns of Low-Income Households: Will Increasing Purchasing Power Result in Healthier Food Choices?” Economic Information Bulletin No. 29-4. Washington, DC: U.S. Department of Agriculture, Economic Research Service.
Gabor, Vivian, Susan Schreiber Williams, Hilary Bellamy, and Brooke Layne Hardison. 2002. “Seniors’ Views of the Food Stamp Program and Ways to Improve Participation-Focus Group Findings in Washington State.” E-FAN-02–012. Washington, DC: U. S. Department of Agriculture Economic Research Service.
Gibson, Diane. 2003. “Food Stamp Program Participation is Positively Related to Obesity in Low Income Women.” Journal of Nutrition 134(7): 2225–2231.
Gibson, Diane. 2006. “Long-Term Food Stamp Program Participation is Positively Related to Simultaneous Overweight in Young Daughters and Obesity in Mothers.” Journal of Nutrition 136(4): 1081–1085.
Gundersen, Craig, Brent Kreider, and John Pepper. 2011. “The Economics of Food Insecurity in the United States.” Applied Economic Perspectives and Policy 33(3): 281–303.
Gundersen, Craig and Victor Oliveira. 2001. “The Food Stamp Program and Food Insufficiency.” American Journal of Agricultural Economics 83(4): 875–887.
Haider, Steven, Alison Jacknowitz, and Robert F. Schoeni. 2003 “Food Stamps and the Elderly: Why is Participation so Low?” Journal of Human Resources 38(Suppl.): pp. 1080–1111.
Heflin, Colleen, and Peter Mueser. 2010. “Assessing the Impact of a Modernized Application Process on Florida’s Food Stamp Caseload.” UKCPR Discussion Paper DP 2010-01. Lexington, KY: University of Kentucky Center for Poverty Research.
Hollonbeck, Darrell, and James Ohls. 1984. “Participation among the Elderly in the Food Stamp Program.” The Gerontologist 24(6): 616–621.
Kabbani, Nader, and Parke Wilde. 2003. “Short Recertification Periods in the U.S. Food Stamp Program.” The Journal of Human Resources, Special Issue on Income Volatility and Implications for Food Assistance Programs, 38(Suppl.): 1112–1138.
Klerman, Jacob, and Caroline Danielson. 2011. “The Transformation of the Supplemental Nutrition Assistance Program.” Journal of Policy Analysis and Management 30(4): 863–888.
Kreider, Brent, John Pepper, Craig Gundersen, and Dean Jolliffe. 2011. “Identifying the Effects of Food Stamps on Child Health Outcomes when Participation is Endogenous and Misreported.” Working Paper. Ames, IA: Department of Economics, University of Iowa.

43
Leftin, Joshua. 2010. “Trends in Supplemental Nutrition Assistance Program Participation Rates: 2001 to 2008.” Alexandria, VA: U.S. Department of Agriculture, Food and Nutrition Service, Office of Research and Analysis, Mathematica Policy Research Reports, Mathematica Policy Research.
Lee, Jung Sun, and Edward Frongillo Jr. 2001. “Factors Associated with Food Insecurity among U.S. Elderly Persons: Importance of Functional Impairments. Journal of Gerontology Series B Psychological Sciences and Social Sciences 52(2) :s94–s99.
Mammen, Sheila, Jean Bauer, and Leslie Richards. 2009. “Understanding Persistent Food Insecurity: A Paradox of Place and Circumstance.” Social Indicators Research 92(1): 151–168.
Meyerhoefer, Chad, and Yuriy Pylypchuck. 2008. “Does Participation in the Food Stamp Program Increase the Prevalence of Obesity and Health Care Spending?” American Journal of Agricultural Economics 90(2): 287–305.
Nicholas, Lauren Hersch. 2011. “Can Food Stamps Help to Reduce Medicare Spending on Diabetes?” Economics and Human Biology 9(1): 1–13.
Ratcliffe, Caroline, Signe-Mary McKernan, and Kenneth Finegold. 2008. “Effect of Food Stamp and TANF Policies on Food Stamp Participation.” Social Service Review 82(2): 291–334.
Ratcliffe, Caroline, Signe-Mary McKernan, and Sisi Zhang. 2011. “How Much Does the Supplemental Nutrition Assistance Program Reduce Food Insecurity?” American Journal of Agricultural Economics 93(4): 1082–1098.
Vartanian, Thomas P., Linda Houser, and Joseph Harkness. 2011. “Food Stamps and Dependency: Disentangling the Short-Term and Long-Term Economic Effects of Food Stamp Receipt and Low Income for Young Mothers.” Journal of Sociology and Social Welfare 38(4): 101–122.
Ver Ploeg, Michele, and Katherine Ralston. 2008. “Food Stamps and Obesity: What Do We Know?” EIB-34. Washington, DC: U.S. Dept. of Agriculture, Economic Research Service.
Wilde, Parke, and Elizabeth Dagata. 2002. “Food Stamp Participation by Elderly Americans Remains Low.” Food Review 25(2): 25–29.
Wilde, Parke, and Mark Nord. 2005. “The Effect of Food Stamps on Food Security: A Panel Data Approach.” Review of Agricultural Economics (72)3: 425–432.
Wolfe, Wendy S., Christine Olson, Anne Kendall, and Edward Frongillo Jr. 1996. “Understanding Food Insecurity in the Elderly: A Conceptual Framework.” Journal of Nutrition Education 28(2): 92–100.
Wu, April. 2009. “Why Do So Few Elderly Use Food Stamps?” Mimeo. Chicago: University of Chicago.
Yen, Steven T., Margaret Andrews, Zhuo Chen, and David Eastwood. 2008. “Food Stamp Program Participation and Food Insecurity: An Instrumental Variables Approach.” American Journal of Agricultural Economics 90(1): 117–132.
Zedlewski, Sheila, and Philip Issa. 2010. “Nutrition Assistance for Older Americans.” Washington, DC: Urban Institute, Face Sheet.

44
Ziliak, James P., Craig Gundersen, and David Figlio. 2003. “Food Stamp Caseloads over the Business Cycle.” Southern Economic Journal 69(4): 903–919.
Ziliak, James P., Craig Gundersen, and Margaret Haist. 2008. “The Causes, Consequences, and Future of Senior Hunger in America.” Prepared for Meals on Wheels Association.
Ziliak, James, and Craig Gundersen. 2009. “Senior Hunger in the United States: Differences across States and Rural and Urban Areas.” University of Kentucky Center for Poverty Research Special Reports. Retrieved (3/1/11) from http://www.ukcpr.org/Publications/senior-hungerfollowup.pdf.