Food sources of carbohydrates in a European cohort of adults
20
Food sources of carbohydrates in a European cohort of adults. Wirfält, Elisabet; McTaggart, A; Pala, V; Gullberg, Bo; Frasca, G; Panico, S; Bueno-de- Mesquita, H B; Peeters, P H M; Engeset, D; Skeie, G; Chirlaque, M D; Amiano, P; Lundin, E; Mulligan, A; Spencer, E A; Overvad, K; Tjønneland, A; Clavel-Chapelon, F; Linseisen, J; Nöthlings, U; Polychronopoulos, E; Georga, K; Charrondière, U R; Slimani, N Published in: Public Health Nutrition DOI: 10.1079/PHN2002399 2002 Link to publication Citation for published version (APA): Wirfält, E., McTaggart, A., Pala, V., Gullberg, B., Frasca, G., Panico, S., Bueno-de-Mesquita, H. B., Peeters, P. H. M., Engeset, D., Skeie, G., Chirlaque, M. D., Amiano, P., Lundin, E., Mulligan, A., Spencer, E. A., Overvad, K., Tjønneland, A., Clavel-Chapelon, F., Linseisen, J., ... Slimani, N. (2002). Food sources of carbohydrates in a European cohort of adults. Public Health Nutrition, 5(6B), 1197-1215. https://doi.org/10.1079/PHN2002399 Total number of authors: 24 General rights Unless other specific re-use rights are stated the following general rights apply: Copyright and moral rights for the publications made accessible in the public portal are retained by the authors and/or other copyright owners and it is a condition of accessing publications that users recognise and abide by the legal requirements associated with these rights. • Users may download and print one copy of any publication from the public portal for the purpose of private study or research. • You may not further distribute the material or use it for any profit-making activity or commercial gain • You may freely distribute the URL identifying the publication in the public portal Read more about Creative commons licenses: https://creativecommons.org/licenses/ Take down policy If you believe that this document breaches copyright please contact us providing details, and we will remove access to the work immediately and investigate your claim. Download date: 05. Feb. 2022
Transcript of Food sources of carbohydrates in a European cohort of adults
LUND UNIVERSITY
PO Box 117221 00 Lund+46 46-222 00 00
Food sources of carbohydrates in a European cohort of adults.
Wirfält, Elisabet; McTaggart, A; Pala, V; Gullberg, Bo; Frasca, G; Panico, S; Bueno-de-Mesquita, H B; Peeters, P H M; Engeset, D; Skeie, G; Chirlaque, M D; Amiano, P; Lundin, E;Mulligan, A; Spencer, E A; Overvad, K; Tjønneland, A; Clavel-Chapelon, F; Linseisen, J;Nöthlings, U; Polychronopoulos, E; Georga, K; Charrondière, U R; Slimani, NPublished in:Public Health Nutrition
DOI:10.1079/PHN2002399
2002
Link to publication
Citation for published version (APA):Wirfält, E., McTaggart, A., Pala, V., Gullberg, B., Frasca, G., Panico, S., Bueno-de-Mesquita, H. B., Peeters, P.H. M., Engeset, D., Skeie, G., Chirlaque, M. D., Amiano, P., Lundin, E., Mulligan, A., Spencer, E. A., Overvad,K., Tjønneland, A., Clavel-Chapelon, F., Linseisen, J., ... Slimani, N. (2002). Food sources of carbohydrates in aEuropean cohort of adults. Public Health Nutrition, 5(6B), 1197-1215. https://doi.org/10.1079/PHN2002399
Total number of authors:24
General rightsUnless other specific re-use rights are stated the following general rights apply:Copyright and moral rights for the publications made accessible in the public portal are retained by the authorsand/or other copyright owners and it is a condition of accessing publications that users recognise and abide by thelegal requirements associated with these rights. • Users may download and print one copy of any publication from the public portal for the purpose of private studyor research. • You may not further distribute the material or use it for any profit-making activity or commercial gain • You may freely distribute the URL identifying the publication in the public portal
Read more about Creative commons licenses: https://creativecommons.org/licenses/Take down policyIf you believe that this document breaches copyright please contact us providing details, and we will removeaccess to the work immediately and investigate your claim.
Download date: 05. Feb. 2022

Food sources of carbohydrates in a European cohort of adults
E Wirfalt1,*, A McTaggart2, V Pala3, B Gullberg4, G Frasca5, S Panico6,HB Bueno-de-Mesquita7, PHM Peeters8, D Engeset9, G Skeie9, MD Chirlaque10,P Amiano11, E Lundin12, A Mulligan2, EA Spencer13, K Overvad14, A Tjønneland15,F Clavel-Chapelon16, J Linseisen17, U Nothlings18, E Polychronopoulos19, K Georga20,UR Charrondiere21 and N Slimani21
1Department of Medicine, Lund University, Malmo, SE-20502 Sweden: 2Department of Public Health and PrimaryCare, School of Clinical Medicine, University of Cambridge, UK: 3Department of Epidemiology, National CancerInstitute, Milan, Italy: 4Department of Community Medicine, Lund University, Malmo, Sweden: 5Cancer Registry,‘Civile – M.P. Arezzo’ Hospital, Ragusa, Italy: 6Department of Clinical and Experimental Medicine, Federico IIUniversity, Naples, Italy: 7Centre of Chronic Diseases Epidemiology, National Institute of Public Health and theEnvironment, Bilthoven, The Netherlands: 8Julius Center for General Practice and Patient Oriented Research,University of Utrecht, The Netherlands: 9Institute of Community Medicine, University of Tromsø, Norway:10Department of Epidemiology, Regional Health Council, Murcia, Spain: 11Public Health Division of Gipuzkoa,Department of Health of the Basque Government, San Sebastian, Spain: 12Department of Public Health and ClinicalMedicine, Umea University, Sweden: 13Cancer Research UK, Epidemiology Unit, University of Oxford, UK:14Department of Epidemiology and Social Medicine, Aarhus University, Denmark: 15Danish Cancer Society, Instituteof Cancer Epidemiology, Copenhagen, Denmark: 16INSERM, E3N–EPIC Group, Institute Gustave Roussy, Villejuif,France: 17Division of Clinical Epidemiology, German Cancer Research Centre, Heidelberg, Germany: 18Departmentof Epidemiology, German Institute of Human Nutrition, Potsdam-Rehbrucke, Germany: 19National School of PublicHealth, Athens, Greece: 20Department of Hygiene and Epidemiology, School of Medicine, University of Athens,Greece: 21International Agency for Research on Cancer, Lyon, France
Abstract
Objective: To describe the average consumption of carbohydrate-providing foodgroups among study centres of the European Prospective Investigation into Cancerand Nutrition (EPIC).Methods: Of the 27 redefined EPIC study centres, 19 contributed subjects of bothgenders and eight centres female participants only (men, n ¼ 13 031; women, n ¼
22 924; after exclusion of subjects under 35 and over 74 years of age from the original36 900 total). Dietary data were obtained using the 24-hour recall methodology usingthe EPIC-SOFT software. The major sources of dietary carbohydrate were identified,and 16 food groups were examined.Results: The 10 food groups contributing most carbohydrate were bread; fruit; milkand milk products; sweet buns, cakes and pies; potato; sugar and jam; pasta and rice;vegetables and legumes; crispbread; and fruit and vegetable juices. Consumption offruits as well as vegetables and legumes was higher in southern compared withnorthern centres, while soft drinks consumption was higher in the north. Italiancentres had high pasta and rice consumption, but breakfast cereal, potato, and sweetbuns, cakes and pies were higher in northern centres. In Sweden, lower breadconsumption was balanced with a higher consumption of crispbread, and with sweetbuns, cakes and pies. Overall, men consumed higher amounts of vegetables andlegumes, bread, soft drinks, potatoes, pasta and rice, breakfast cereal and sugar andjam than women, but fruit consumption appeared more frequent in women.Conclusion: The study supports the established idea that carbohydrate-rich foodschosen in northern Europe are different from those in the Mediterranean region.When comparing and interpreting diet–disease relationships across populations,researchers need to consider all types of foods.
KeywordsFoods
CarbohydratesDescriptive epidemiology
EPIC studyCancer
24-Hour dietary recallEurope
Carbohydrates contribute a major proportion of dietary
energy in most populations1,2. The influences of
carbohydrate-rich diets on health and disease may,
however, diverge substantially depending on the specific
types and food sources of carbohydrate. Dietary carbo-
hydrates are defined as naturally occurring sugars, added
sugars, starch, resistant starch and dietary fibre/non-starch
polysaccharides (NSP). Plant foods contribute not only
dietary carbohydrates, but also a whole array of essential
micronutrients and food components, generally identified
q The Authors 2002*Corresponding author: Email [email protected]
Public Health Nutrition: 5(6B), 1197–1215 DOI: 10.1079/PHN2002399
as protective agents with respect to cancer risk2,3. For
instance, soy products, legumes, whole grains and flax,
with a high content of isoflavones and lignans4,5, have
been related to decreased cancer risk, especially breast
cancer6. Most refined food products that contribute
carbohydrates will provide only negligible amounts of
these food components.
The evidence linking carbohydrates to the risk of
disease is inconsistent. Several factors influence the
physiological response after carbohydrate ingestion and
these factors may explain some inconsistencies. Exper-
imental studies indicate that both the type of carbohydrate
and the physical properties of the specific food item7,8
influence the postprandial glucose and insulin response
(i.e. the Glycaemic Index (GI) and Insulin Index). Thus
not only the type of carbohydrate ingested7,9, but also
factors such as the refinement of foods and the physical
and chemical properties of carbohydrates at the moment
of consumption, could potentially influence the develop-
ment of disease8. For instance, observational studies
indicate that high-GI diets are related to increased risk of
non-insulin-dependent diabetes mellitus (NIDDM) both in
men and women10,11, and clinical trials show that low-GI
energy-restricted diets, compared with similar high-GI
diets, favour long-term weight reduction12. It has been
hypothesised that chronic hyperinsulinaemia may be a
link between dietary factors (other than simply a sum of
nutrients) and the development of high-risk steroid
hormone profiles and increased breast cancer incidence13.
Case–control studies14,15, and two large prospective
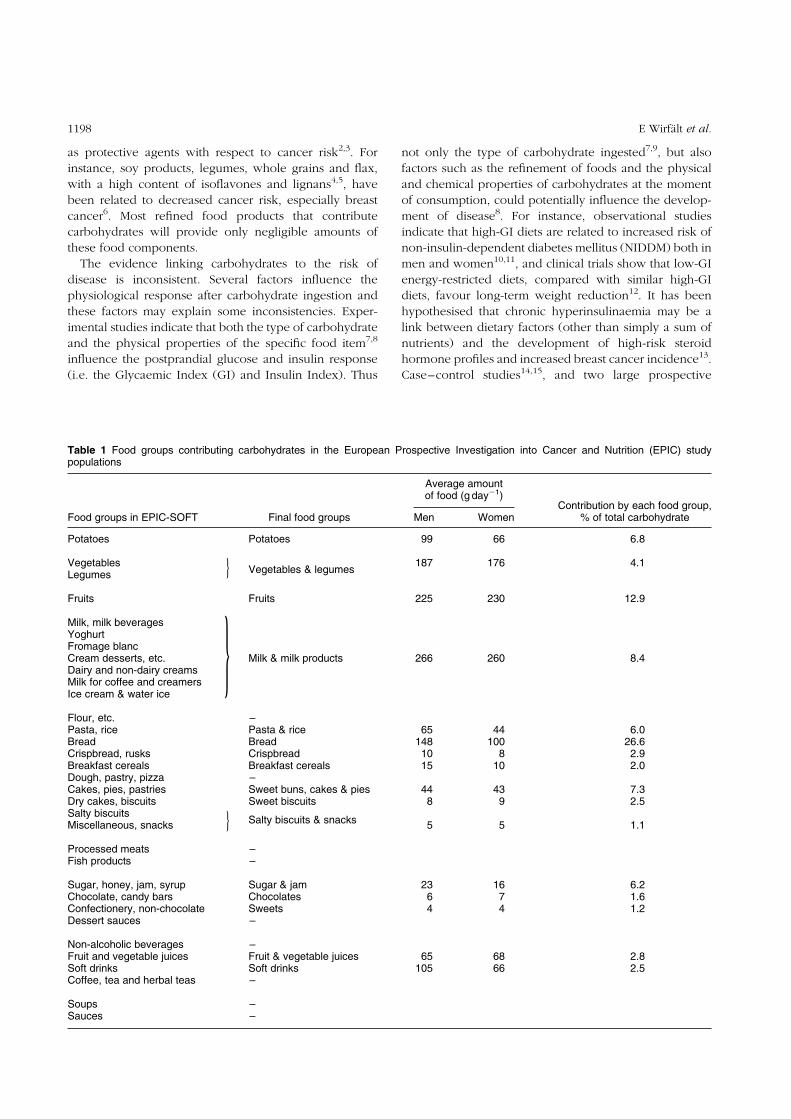
Table 1 Food groups contributing carbohydrates in the European Prospective Investigation into Cancer and Nutrition (EPIC) studypopulations
Average amountof food (g day21)
Contribution by each food group,% of total carbohydrateFood groups in EPIC-SOFT Final food groups Men Women
Potatoes Potatoes 99 66 6.8
VegetablesVegetables & legumes
187 176 4.1Legumes
Fruits Fruits 225 230 12.9
Milk, milk beveragesYoghurtFromage blancCream desserts, etc. Milk & milk products 266 260 8.4Dairy and non-dairy creamsMilk for coffee and creamersIce cream & water ice
Flour, etc. –Pasta, rice Pasta & rice 65 44 6.0Bread Bread 148 100 26.6Crispbread, rusks Crispbread 10 8 2.9Breakfast cereals Breakfast cereals 15 10 2.0Dough, pastry, pizza –Cakes, pies, pastries Sweet buns, cakes & pies 44 43 7.3Dry cakes, biscuits Sweet biscuits 8 9 2.5Salty biscuitsMiscellaneous, snacks
Salty biscuits & snacks5 5 1.1
Processed meats –Fish products –
Sugar, honey, jam, syrup Sugar & jam 23 16 6.2Chocolate, candy bars Chocolates 6 7 1.6Confectionery, non-chocolate Sweets 4 4 1.2Dessert sauces –
Non-alcoholic beverages –Fruit and vegetable juices Fruit & vegetable juices 65 68 2.8Soft drinks Soft drinks 105 66 2.5Coffee, tea and herbal teas –
Soups –Sauces –
}
}
}
E Wirfalt et al.1198

studies that have related NIDDM to colon cancer
incidence16,17, imply that insulin resistance is a putative
risk factor for colon cancers. Furthermore, it has been
hypothesised that the intestinal flora in the colon uses, in
addition to NSP, some component of starch as a substrate.
In fact, the consumption of resistant starch leads to an
increase in faecal bulk and butyrate production as well as a
decrease in secondary bile acids in faeces18–20. These
factors are all potentially related to a decrease in colon
cancer risk20.
In addition, studies suggest that added sucrose may
have specific disadvantageous effects. An experimental
study in rats recently found that high intakes of sucrose
were associated with a higher frequency of GC to AT
mutations in the cII transgene of the colonic epithelium21.
Also, an epidemiological study has observed similar
mutations in individuals with colon cancer and high-GI
diets22. Moreover, fibre-rich diets, especially those high in
cereal fibre, prevent constipation and may help control
energy intake and body weight by promoting satiety by
slowing gastric emptying23. Obesity and positive energy
balance have been identified as potential risk factors for
many cancers24,25. Some researchers argue that there is
sufficient evidence to link the dietary proportions of
macronutrients to the development of obesity (especially
high intakes of saturated fat and low intakes of fibre-rich
foods), but others only agree that excess of energy intake
over expenditure is important2.
Information about the distribution of different types of
carbohydrate-rich foods across European populations
would therefore not only illustrate how dietary habits
differ in Europe, but also could assist in the further
development of hypotheses on the relationships between
diet, cancer and other chronic diseases. The primary aim
of this paper is to describe, separately for men and
women, the average consumption of carbohydrate-
providing food groups across study centres of the
European Prospective Investigation into Cancer and
Nutrition (EPIC).
Methods and materials
The EPIC multi-centre cohort study is investigating the
relationship between diet and cancer in 10 Western
European countries: Denmark, France, Germany, Greece,
Italy, Norway, Spain, Sweden, The Netherlands and the
UK26. The study population consists of 519 978 mainly
middle-aged men and women. Of the 27 study centres
examined in this paper, 19 centres contributed subjects of
both genders and eight centres female participants only. In
Table 2a Mean consumption of bread and crispbread by men ðn ¼ 13 031Þ in 19 European ProspectiveInvestigation into Cancer and Nutrition (EPIC) centres
Bread (g day21) Crispbread (g day21)
Adjusted* Adjusted*
Country and centre Total n Crude mean Mean SEM Crude mean Mean SEM
GreeceGreece 1312 181.6 173.6 3.0 12.6 14.2 0.6
SpainGranada 214 149.6 148.8 7.4 4.0 3.8 1.5Murcia 243 156.3 156.3 6.9 5.8 6.5 1.4Navarra 444 179.2 178.8 5.1 2.6 2.7 1.1San Sebastian 490 150.9 147.4 4.9 4.3 5.1 1.0Asturias 386 139.6 137.1 5.5 6.2 6.8 1.1
ItalyRagusa 168 184.0 185.3 8.3 7.4 7.6 1.7Florence 271 164.8 165.2 6.6 7.3 7.3 1.3Turin 677 156.4 154.8 4.2 20.3 20.4 0.9Varese 328 138.3 144.3 6.0 6.7 7.4 1.2
GermanyHeidelberg 1033 147.5 141.0 3.4 1.3 1.5 0.7Potsdam 1235 161.6 159.1 3.1 2.7 2.7 0.6
The NetherlandsBilthoven 1024 173.6 167.7 3.5 2.9 3.9 0.7
United KingdomGeneral population 404 122.8 124.6 5.4 3.4 3.4 1.1‘Health-conscious’ 114 145.9 144.0 10.1 3.0 2.9 2.1
DenmarkCopenhagen 1356 174.8 177.4 2.9 2.5 2.2 0.6Aarhus 567 190.7 195.2 4.5 1.9 2.2 0.9
SwedenMalmo 1421 105.0 112.6 3.0 9.9 8.6 0.6Umea 1344 74.8 77.0 3.0 40.7 41.1 0.6
SEM – standard error of the mean.* Adjusted for age and standardised for day of the week and season.
Food sources of carbohydrates in EPIC centres 1199

order to standardise habitual dietary intakes reported
across the EPIC study centres, a calibration study using 24-
hour dietary recall interviews among sub-samples of each
study population was implemented. Individuals of the
calibration population were randomly selected from each
national cohort in proportion to the expected number of
cumulative cancer cases by gender and 5-year age strata,
and completed a single 24-hour dietary recall interview
ðn ¼ 36 900Þ: The final calibration samples represent 5–
12% of the population of each study centre. Over all EPIC
centres, a total of 22 924 women and 13 031 men were
considered in the analysis, after exclusion of subjects
under the age of 35 and over the age of 74 years. The
sampling procedure was defined to control for possible
day-to-day and seasonal variations in diet. Specific details
about the calibration studies in each country and the main
characteristics of the calibration populations are described
elsewhere in this supplement27.
Dietary data
Details of the computerised 24-hour dietary recall
interview software (EPIC-SOFT) developed for the
calibration study are given elsewhere28,29. During the
24-hour dietary recall interview, the EPIC-SOFT system
collected information about all food and beverage items
consumed. Common rules for describing, quantifying
and checking the 1500–2200 foods and 150–350 mixed
recipes per country were pre-entered into the system.
The 24-hour diet recalls were collected by a total of 90
interviewers. Almost all centres used face-to-face inter-
views, except in Norway where telephone interviews
were used. During the calibration study, preliminary
and country-specific national food composition tables
were used together with the EPIC-SOFT system to
calculate crude intakes of total energy and macronu-
trients. These estimates were used for quality control
purposes and in this paper for the preliminary
descriptive and methodological analyses.
A total of 33 food groups were initially identified as
potential major contributors of carbohydrates in the EPIC
countries (see Table 1). The relative carbohydrate
contribution and the number of recalls reporting zero
consumption of these food groups were examined in a
preliminary project across study centres and countries.
However, since current European food composition tables
compute carbohydrates differently and a common
European food composition table is not available30, the
relative contribution of specific food groups was not
examined in the final project. The number of food groups
was reduced to 16, because some (e.g. dessert sauce,
Table 2b Mean consumption of sweet buns, cakes and pies, and sweet biscuits by men ðn ¼ 13 031Þ in19 European Prospective Investigation into Cancer and Nutrition (EPIC) centres
Sweet buns, cakes & pies(g day21) Sweet biscuits (g day21)
Adjusted* Adjusted*
Country and centre Total n Crude mean Mean SEM Crude mean Mean SEM
GreecesGreece 1312 14.5 15.4 2.3 7.4 6.7 0.6
SpainGranada 214 21.3 25.8 5.7 7.6 6.5 1.4Murcia 243 43.1 41.6 5.4 11.0 11.3 1.3Navarra 444 19.2 19.3 4.0 10.8 10.5 0.9San Sebastian 490 24.6 24.2 3.8 9.7 9.9 0.9Asturias 386 27.3 27.7 4.3 9.6 9.4 1.0
ItalyRagusa 168 30.1 37.8 6.5 16.3 12.0 1.5Florence 271 47.7 47.4 5.1 13.1 13.4 1.2Turin 677 33.8 35.5 3.2 13.4 13.5 0.8Varese 328 40.6 36.9 4.6 19.6 21.4 1.1
GermanyHeidelberg 1033 53.1 63.2 2.6 4.2 4.6 0.6Potsdam 1235 50.3 57.4 2.4 5.1 5.6 0.6
The NetherlandsBilthoven 1024 36.6 36.5 2.7 11.1 11.1 0.6
United KingdomGeneral population 404 69.7 69.0 4.2 12.7 12.6 1.0‘Health-conscious’ 114 59.3 59.2 7.8 10.6 10.2 1.7
DenmarkCopenhagen 1356 33.8 36.7 2.3 5.8 6.3 0.5Aarhus 567 44.2 46.8 3.5 9.0 8.4 0.8
SwedenMalmo 1421 51.8 54.1 2.3 5.9 5.6 0.6Umea 1344 69.0 69.8 2.3 5.6 5.8 0.5
SEM – standard error of the mean.* Adjusted for age and standardised for day of the week and season.
E Wirfalt et al.1200

pastry) had a very low frequency of consumption (less
than 10% of recalls contained items from the food group)
and others (e.g. sauce, flour, meat and fish products, non-
alcoholic beverages) contributed less than 1% to total
carbohydrate intake in most centres. Foods contributing
small amounts of carbohydrates were either combined
into broader food groups (e.g. vegetables and legumes,
milk and milk products) or excluded from further
examination (e.g. meat and fish products). The current
paper examines the following food groups: bread;
crispbread; pasta and rice; breakfast cereal; sweet buns,
cakes and pies; sweet biscuits; salty biscuits and snacks;
potato; vegetables and legumes; fruits; fruit and vegetable
juices; sugar and jam; sweets; chocolates; soft drinks; and
milk and milk products.
Analysis
Analysis was conducted separately for men and women.
The SPSS statistical package was used for all statistical
procedures31. The percentage of 24-hour dietary recalls
reporting consumption of a food group and the crude
mean food group intakes are described for each EPIC
centre. Preliminary analysis indicated that the distribution
of participants across seasons and days of the week was
not equal across study centres. Therefore a standardisation
procedure to control for day-to-day and seasonal
differences across centres was used in the multivariate
analysis. Thus the age-adjusted mean food group intakes
were computed for each EPIC centre with centre-specific
weights for season and day of the week, using the General
Linear Model. The computation of adjusted mean intakes
was also repeated including total energy in the model,
using the crude macronutrient data of EPIC-SOFT.
Results
As reported in Table 1, the 10 food groups contributing the
most carbohydrates in the EPIC population were: bread
(27% of total carbohydrate intake); fruit (13%); milk and
milk products (8%); sweet buns, cakes and pies (7%);
potato (7%); sugar and jam (6%); pasta and rice (6%);
vegetables and legumes (4%); crispbread (3%); and fruit
and vegetable juices (3%). Table 1 also suggests that men
overall have higher absolute intakes of vegetables and
legumes, bread, soft drinks, potatoes, pasta and rice,
breakfast cereal, and sugar and jam than women. Data
shown are not adjusted for energy, because only crude
energy data were available.
The percentage of 24-hour dietary recalls that include a
particular food group depends both on the proportion of
regular consumers in the population and on how often
these individuals select a food item from the food group.
Table 2c Mean consumption of breakfast cereal, pasta and rice, and salty snacks by men ðn ¼ 13 031Þ in 19 European ProspectiveInvestigation into Cancer and Nutrition (EPIC) centres
Breakfast cereal (g day21) Pasta & rice (g day21) Salty snacks (g day21)
Adjusted* Adjusted* Adjusted*
Country and centre Total n Crude mean Mean SEM Crude mean Mean SEM Crude mean Mean SEM
GreeceGreece 1312 1.1 0.5 1.3 72.1 81.3 3.0 0.9 2.0 0.6
SpainGranada 214 0.1 20.3 3.2 54.0 63.1 7.4 2.1 1.9 1.5Murcia 243 0.7 1.0 3.0 58.2 53.3 7.0 1.3 1.1 1.4Navarra 444 0.3 0.3 2.2 30.4 30.3 5.2 0.3 0.2 1.0San Sebastian 490 0.8 1.8 2.1 36.8 29.5 5.0 0.4 0 1.0Asturias 386 1.4 1.7 2.4 47.5 47.9 5.5 0.5 0.5 1.1
ItalyRagusa 168 1.3 1.5 3.6 222.1 228.7 8.4 13.3 8.9 1.7Florence 271 2.2 2.6 2.8 239.2 234.4 6.6 15.7 16.5 1.3Turin 677 0.8 1.3 1.8 202.4 202.2 4.2 8.4 8.4 0.8Varese 328 1.2 0.5 2.6 266.8 268.3 6.0 4.7 6.0 1.2
GermanyHeidelberg 1033 6.4 6.5 1.5 73.2 68.5 3.4 5.2 4.9 0.7Potsdam 1235 3.2 3.0 1.3 23.5 22.1 3.1 2.7 2.5 0.6
The NetherlandsBilthoven 1024 3.3 4.6 1.5 53.2 43.9 3.5 12.5 11.4 0.7
United KingdomGeneral population 404 34.8 33.3 2.3 29.8 32.1 5.4 15.0 15.4 1.1‘Health-conscious’ 114 61.1 62.5 4.4 59.1 44.3 10.2 8.1 12.0 2.0
DenmarkCopenhagen 1356 23.0 21.3 1.3 38.1 36.8 3.0 3.2 3.1 0.6Aarhus 567 24.6 22.4 2.0 32.0 30.5 4.6 3.9 3.1 0.9
SwedenMalmo 1421 29.9 28.0 1.3 27.8 36.4 3.0 2.5 3.9 0.6Umea 1344 50.6 50.0 1.3 41.7 42.0 3.0 3.7 4.0 0.6
SEM – standard error of the mean.* Adjusted for age and standardised for day of the week and season.
Food sources of carbohydrates in EPIC centres 1201

The percentage of recalls that included bread, vegetables
and legumes, fruit, and sugar and jam was high in all
centres. The percentage of 24-hour dietary recalls
including bread ranged from 91% to 98% in men and
from 83% to 94% in women. In Umea (Sweden), however,
only 79% of recalls (both genders) included bread.
Vegetables and legumes were found in at least 81% of
recalls in men and in 84% in women. Fruit was included
more commonly in recalls of women (72%), compared
with men (58%). The corresponding numbers for sugar
and jam were 59% in men and 52% in women and for milk
products, 52% and 62%, respectively.
The percentage of recalls including pasta and rice was
low in most centres, but high in Italian centres, where the
range was from 69% to 80% in women, and from 79% to
90% in men. The number of recalls including potatoes was
lowest in Italian and Greek centres (less than 38%) and
similar for men and women. In French centres (women
only) the percentage of recalls that included potato varied
from 28% to 44%. In other centres, the percentage ranged
from 41% to 73% (both men and women). Although few
recalls in most centres included sweet biscuits, sweet
buns, cakes and pies, crispbread, breakfast cereal and
juice, there were some distinct exceptions. Among women
in Utrecht (The Netherlands), 56% of recalls included
sweet biscuit consumption. Also, the percentage of recalls
including sweet buns, cakes and pies was high in the
Swedish centres (Umea, 59% in men, 58% in women;
Malmo, 49% in men, 56% in women) and in women in
Utrecht, The Netherlands (50%). Crispbread consumption
appeared particularly common among participants in
Umea (Sweden). Breakfast cereal consumption was most
common in the UK and in Umea (Sweden). The
percentage of recalls including fruit and vegetable juices
was highest in Murcia, Spain (men, 61%; women, 60%),
but it was also high in the ‘health-conscious’ UK
population, in Greece, Germany and The Netherlands.
Few recalls overall included soft drinks, sweets, choco-
lates, and salty biscuits and snacks. Soft drinks consump-
tion appeared uncommon among French women (7–9%
of recalls). The highest percentages were seen among men
in Bilthoven, The Netherlands (38%) and among women
in the North & West of Norway (38%).
Mean intakes
Crude and age-adjusted (standardised on day of the week
and season) mean intakes are displayed in Tables 2a–2f
and 3a–3f; age-adjusted mean intakes are presented in
Table 2d Mean consumption of potatoes, vegetables and legumes, and fruits by men ðn ¼ 13 031Þ in 19 European Prospective Investi-gation into Cancer and Nutrition (EPIC) centres
Potatoes (g day21)Vegetables & legumes
(g day21) Fruits (g day21)
Adjusted* Adjusted* Adjusted*
Country and centre Total n Crude mean Mean SEM Crude mean Mean SEM Crude mean Mean SEM
GreeceGreece 1312 46.3 43.1 3.5 299.0 302.2 4.5 236.2 272.1 6.6
SpainGranada 214 81.1 79.2 8.5 269.7 254.6 11.0 382.4 353.0 16.3Murcia 243 84.6 85.1 8.0 301.0 306.4 10.3 438.2 453.8 15.3Navarra 444 69.9 70.4 5.9 296.5 292.5 7.6 315.2 312.5 11.3San Sebastian 490 86.5 89.5 5.7 290.7 291.4 7.3 369.4 381.5 10.9Asturias 386 99.1 98.5 6.3 210.2 213.0 8.2 337.3 339.8 12.1
ItalyRagusa 168 59.0 57.5 9.6 189.1 187.2 12.4 391.3 438.6 18.4Florence 271 50.8 50.6 7.5 229.3 234.9 9.8 373.8 404.0 14.5Turin 677 49.6 51.9 4.8 261.6 255.1 6.2 410.4 418.5 9.2Varese 328 49.7 45.1 6.9 188.0 215.5 8.9 343.4 345.9 13.2
GermanyHeidelberg 1033 79.6 87.9 3.9 177.2 175.9 5.0 173.2 166.6 7.5Potsdam 1235 109.5 114.9 3.5 151.9 157.9 4.6 236.8 239.0 6.8
The NetherlandsBilthoven 1024 120.9 127.4 4.0 141.4 142.1 5.2 155.8 166.4 7.7
United KingdomGeneral population 404 111.2 110.7 6.2 166.6 169.1 8.0 148.7 152.2 11.9‘Health-conscious’ 114 92.9 105.5 11.6 248.2 255.5 15.1 261.0 255.0 22.3
DenmarkCopenhagen 1356 100.7 105.3 3.4 142.3 150.5 4.4 140.6 143.2 6.5Aarhus 567 115.5 117.0 5.2 131.4 135.8 6.8 180.4 178.2 10.0
SwedenMalmo 1421 131.7 128.2 3.5 125.2 127.6 4.5 135.3 120.8 6.7Umea 1344 147.6 148.7 3.4 106.7 105.4 4.4 124.9 120.7 6.5
SEM – standard error of the mean.* Adjusted for age and standardised for day of the week and season.
E Wirfalt et al.1202

Figs. 1a, 1b and 2a, 2b. Energy adjustment influenced the
relative ranking of a few centres, but had virtually no
influence on the north–south consumption gradients
observed. Therefore energy-adjusted data are not shown.
The means were computed for the population as a whole
(consumers and non-consumers).
Bread, crispbread, sweet buns, cakes and pies, and sweet
biscuits
Bread was a major food in all of the EPIC centres, and
specific consumption gradients were difficult to dis-
tinguish. In men, the highest consumption was observed
in Aarhus, Denmark (195 g) and the lowest in Umea,
Sweden (77 g). In women, the highest consumption levels
were seen in Denmark (Aarhus, 160 g; Copenhagen, 142 g)
and Norway (131 g), and the lowest in Sweden (Umea,
58 g).
Crispbread consumption was low and even across most
centres. Umea (Sweden) stands out, however, with high
consumption levels, both in men (41 g) and in women
(26 g). The lowest levels were found in Heidelberg,
Germany (men, 1.5 g) and in Aarhus, Denmark (women,
2.7 g).
Consumption of sweet buns, cakes and pies appeared
higher in most northern centres. The highest consumption
levels were seen in Umea, Sweden (men, 79 g; women,
59 g). Centres in the south and in The Netherlands and
Denmark had lower levels; the lowest was in Greece, both
in men (15 g) and women (19 g). Sweet biscuit consump-
tion was low overall. Varese, Italy had the highest
consumption (men and women, 21 g). The lowest levels
were seen in Heidelberg, Germany (men, 4.6 g) and in
South & East Norway (women, 2.4 g).
Breakfast cereal, pasta and rice, and salty biscuits and
snacks
Breakfast cereal consumption varied between centres. In
men, the UK ‘health-conscious’ population had the highest
consumption (63 g), but Swedish and Danish centres also
had high consumption levels. Similarly, in women
consumption was highest in Umea, Sweden (42 g),
followed by centres in the UK, Sweden, Denmark and
Norway. Other centres had, overall, very low consumption
levels, with the lowest being in Spanish centres (less than
1 g).
Italian centres had the highest mean levels of
consumption of pasta and rice, with the highest in Varese
(men, 268 g; women, 151 g). Other centres had much
Table 2e Mean consumption of fruit and vegetable juices, soft drinks, and milk and milk products by men ðn ¼ 13 031Þ in 19 EuropeanProspective Investigation into Cancer and Nutrition (EPIC) centres
Fruit & vegetablejuices (g day21) Soft drinks (g day21) Milk & milk products (g day21)
Adjusted* Adjusted* Adjusted*
Country and centre Total n Crude mean Mean SEM Crude mean Mean SEM Crude mean Mean SEM
GreeceGreece 1312 31.6 34.4 4.7 45.9 47.3 7.5 134.9 129.1 7.5
SpainGranada 214 46.9 50.7 11.6 106.5 98.5 18.5 355.5 352.9 18.5Murcia 243 43.0 42.3 10.9 99.7 101.1 17.4 230.3 228.6 17.4Navarra 444 28.6 27.8 8.1 52.7 52.2 12.9 270.4 269.6 12.9San Sebastian 490 23.2 17.7 7.8 46.5 33.1 12.4 314.9 314.4 12.4Asturias 386 38.5 35.6 8.7 77.3 80.5 13.8 394.9 391.1 13.8
ItalyRagusa 168 11.9 6.9 13.1 59.3 31.7 21.0 117.6 107.2 20.9Florence 271 22.7 20.3 10.3 29.3 25.0 16.5 170.8 168.9 16.5Turin 677 24.6 23.2 6.6 38.7 34.3 10.4 142.7 140.2 10.4Varese 328 23.3 22.2 9.4 43.9 48.7 15.0 199.9 223.8 15.0
GermanyHeidelberg 1033 186.7 182.5 5.3 149.4 141.7 8.5 190.8 177.8 8.5Potsdam 1235 145.6 140.6 4.9 79.8 81.1 7.7 188.8 188.6 7.7
The NetherlandsBilthoven 1024 70.3 62.0 5.5 183.8 168.8 8.8 324.6 318.9 8.7
United KingdomGeneral population 404 69.4 71.8 8.5 124.1 130.2 13.5 380.3 376.5 13.5‘Health-conscious’ 114 111.4 123.6 15.9 97.7 107.2 25.4 180.9 195.7 25.4
DenmarkCopenhagen 1356 58.0 60.5 4.6 177.5 173.7 7.4 300.7 292.7 7.4Aarhus 567 56.7 56.7 7.2 150.4 147.8 11.4 318.6 316.7 11.4
SwedenMalmo 1421 42.7 50.3 4.8 81.3 100.5 7.6 300.4 301.8 7.6Umea 1344 40.4 41.8 4.7 139.8 145.4 7.4 433.9 437.2 7.4
SEM – standard error of the mean.* Adjusted for age and standardised for day of the week and season.
Food sources of carbohydrates in EPIC centres 1203

lower levels; the lowest in women was in North & West
Norway (15 g) and in men in Potsdam, Germany (22 g).
Consumption of salty snacks was low overall. The
highest levels were seen in Italy (men, 17 g in Florence;
women, 16 g in Naples) and the UK ‘general population’
(men, 15 g; women, 12 g). Spanish centres had the lowest
levels, 1 g or less for both genders.
Potato, and vegetables and legumes
Potato consumption also varied between EPIC centres.
Umea, Sweden had the highest consumption (men, 149 g;
women, 92 g), followed by other centres in northern
Europe. Consumption was lowest in Ragusa, Italy
(women, 26 g; men, 43 g). The amounts of vegetables
and legumes eaten varied across EPIC centres. In men,
vegetable and legume consumption was highest in Murcia,
Spain (306 g), followed by centres in Greece, the ‘health-
conscious’ group in the UK and Italy, while Umea, Sweden
(105 g) had the lowest mean consumption. In women,
vegetable consumption was highest among women in
France (South coast, 275 g), followed by centres in Spain
and Greece, the ‘health-conscious’ group in the UK and
most Italian centres. Consumption was lowest in North &
West Norway (120 g). Clear north–south gradients were
observed in both men and women for potatoes and also
for vegetables and legumes, although less pronounced.
Fruits, and fruit and vegetable juices
Fruits were commonly consumed in all EPIC centres, but
the amounts varied considerably. High levels of con-
sumption were seen in the Italian and Spanish centres,
with the highest in Murcia, Spain (men, 454 g) and in
Ragusa, Italy (women, 397 g). Consumption was moder-
ately high in the ‘health-conscious’ group in the UK,
Greece, Germany and Aarhus (Denmark) and lowest in
Sweden (men, 121 g; women, 151 g). Fruit and vegetable
juice consumption was highest in Heidelberg, Germany
(men, 183 g; women, 165 g), followed by The Netherlands,
the UK and Norway (women). Ragusa, Italy had the lowest
mean consumption (men, 6.9 g; women, 4.4 g). Thus fruit
as well as fruit and vegetable juices clearly show opposing
north–south gradients.
Soft drinks, sugar and jam, sweets, and chocolates
Soft drinks consumption varied considerably across EPIC
centres with clear north–south gradients. In men,
Copenhagen (Denmark) had the highest mean consump-
tion of soft drinks (174 g) and Florence (Italy) had the
lowest consumption (25 g). In women, South & East
(163 g) and North & West (159 g) Norway had the highest
mean consumption levels of soft drinks, while the South
coast of France (12 g) had the lowest.
The consumption of sugar and jam, sweets, and
Table 2f Mean consumption of sugar and jam, sweets, and chocolates by men ðn ¼ 13 031Þ in 19 European Prospective Investigationinto Cancer and Nutrition (EPIC) centres
Sugar & jam (g day21) Sweets (g day21) Chocolates (g day21)
Adjusted* Adjusted* Adjusted*
Country and centre Total n Crude mean Mean SEM Crude mean Mean SEM Crude mean Mean SEM
GreeceGreece 1312 11.3 10.9 0.8 3.2 2.8 0.6 1.3 1.5 0.5
SpainGranada 214 15.3 15.2 2.1 3.3 3.4 1.5 2.0 2.1 1.3Murcia 243 15.4 15.1 1.9 2.7 2.6 1.4 2.8 2.6 1.2Navarra 444 15.0 15.1 1.4 4.1 4.0 1.0 2.3 2.3 0.9San Sebastian 490 18.1 18.6 1.4 5.2 4.5 1.0 2.8 2.1 0.9Asturias 386 18.7 18.9 1.5 4.4 4.2 1.1 4.7 4.7 1.0
ItalyRagusa 168 17.3 16.9 2.3 0.3 0.0 1.7 1.1 0.4 1.4Florence 271 14.1 13.8 1.8 1.5 1.4 1.3 2.6 2.5 1.1Turin 677 18.0 17.9 1.2 2.6 2.5 0.8 3.0 2.8 0.7Varese 328 24.0 25.7 1.7 4.6 3.2 1.2 3.4 3.2 1.0
GermanyHeidelberg 1033 19.8 20.0 1.0 3.1 2.3 0.7 7.3 7.3 0.6Potsdam 1235 19.5 19.9 0.9 2.0 1.7 0.6 7.1 7.3 0.5
The NetherlandsBilthoven 1024 31.8 32.9 1.0 8.9 8.4 0.7 8.3 7.6 0.6
United KingdomGeneral population 404 28.2 28.0 1.5 2.4 2.6 1.1 11.3 12.0 0.9‘Health-conscious’ 114 18.2 16.8 2.8 2.6 1.7 2.0 3.8 3.2 1.8
DenmarkCopenhagen 1356 25.8 26.2 0.8 3.9 4.0 0.6 7.3 7.6 0.5Aarhus 567 23.5 23.2 1.3 5.3 5.0 0.9 8.1 7.4 0.8
SwedenMalmo 1421 27.7 26.0 0.9 6.8 7.8 0.6 6.8 7.8 0.5Umea 1344 35.3 35.4 0.8 5.2 5.6 0.5 6.0 6.5 0.5
SEM – standard error of the mean.* Adjusted for age and standardised for day of the week and season.
E Wirfalt et al.1204

chocolates was low overall and specific trends were
difficult to discern. Sugar and jam consumption was
highest among men in Umea, Sweden (35 g) and in
Bilthoven, The Netherlands (33 g) and among women in
North & West Norway (22 g) and Umea, Sweden (21 g).
Consumption was lowest in Greece (men, 11 g) and in
Florence, Italy (women, 10 g). The consumption of sweets
ranked high in The Netherlands, Denmark and Sweden,
and lowest in Ragusa in Italy. Chocolate consumption was
highest in the UK general population, but overall higher in
northern centres. Men in Ragusa (Italy) and women in
Granada (Spain) had the lowest mean consumption of
chocolates.
Milk and milk products
The consumption of milk and milk products varied
substantially across EPIC centres. In men, Umea, Sweden
(437 g) had the highest mean consumption of milk and
milk products, followed by the UK general population,
Spanish centres, Bilthoven (The Netherlands), Malmo
(Sweden) and Danish centres. In women, consumption
was highest in Asturias, Spain (462 g), followed by other
Spanish centres, Utrecht (The Netherlands), Umea
(Sweden) and the UK general population. The lowest
levels were seen both for men (107 g) and women (116 g)
in Ragusa (Italy).
Discussion
This study indicates that several major sources of
carbohydrates differ between northern and southern
EPIC centres. Fruit consumption is high in most southern
centres. A similar pattern, although less pronounced, is
observed for vegetables and legumes, with a higher
consumption of these foods in southern Europe. Soft
drinks consumption is higher in the north, and fruit and
Table 3a Mean consumption of bread and crispbread by women ðn ¼ 22 924Þ in 27 European ProspectiveInvestigation into Cancer and Nutrition (EPIC) centres
Bread (g day21) Crispbread (g day21)
Adjusted* Adjusted*
Country and centre Total n Crude mean Mean SEM Crude mean Mean SEM
GreeceGreece 1374 109.6 102.6 2.1 10.9 11.5 0.4
SpainGranada 300 90.9 96.7 4.4 3.9 4.9 0.9Murcia 304 76.3 76.2 4.4 6.2 6.7 0.9Navarra 271 88.8 88.4 4.7 6.9 6.9 1.0San Sebastian 244 80.8 79.6 4.9 8.9 9.8 1.0Asturias 324 74.2 74.2 4.3 10.4 10.2 0.9
ItalyRagusa 138 102.5 93.4 6.5 6.3 5.8 1.3Naples 403 103.6 97.1 3.8 7.6 8.1 0.8Florence 785 97.6 97.8 2.7 7.9 8.0 0.6Turin 392 84.0 85.3 3.9 17.1 16.6 0.8Varese 794 75.9 77.6 2.7 7.5 7.3 0.6
FranceSouth coast 612 85.0 92.9 3.1 8.1 7.4 0.6South 1396 100.8 100.7 2.1 7.8 7.3 0.4North-west 622 96.7 99.3 3.1 3.9 3.2 0.6North-east 2009 92.7 94.5 1.7 5.1 4.8 0.4
GermanyHeidelberg 1087 101.1 102.5 2.4 2.8 2.9 0.5Potsdam 1063 106.4 104.7 2.4 3.8 4.4 0.5
The NetherlandsBilthoven 1086 116.5 114.8 2.4 4.2 4.8 0.5Utrecht 1874 110.1 111.0 1.8 6.3 6.0 0.4
United KingdomGeneral population 571 83.2 83.9 3.2 3.2 3.2 0.7‘Health-conscious’ 197 93.2 99.8 5.5 6.2 6.5 1.1
DenmarkCopenhagen 1485 140.1 141.9 2.0 3.4 3.1 0.4Aarhus 510 154.3 159.7 3.4 3.1 2.7 0.7
SwedenMalmo 1711 69.4 71.1 1.9 9.4 8.9 0.4Umea 1574 57.3 57.6 1.9 25.6 25.5 0.4
NorwaySouth & East 1136 135.7 131.4 2.3 7.4 7.8 0.5North & West 662 133.1 131.0 3.0 7.8 7.9 0.6
SEM – standard error of the mean.* Adjusted for age and standardised for day of the week and season.
Food sources of carbohydrates in EPIC centres 1205

vegetable juices higher in north-west and central Europe.
Potato consumption is high in northern centres and low in
the south of Europe. Breakfast cereals are consumed more
in the northern centres and Italian centres have high pasta
and rice consumption. Consumption of sweet buns, cakes
and pies is higher in northern compared with southern
centres, but consumption of sweet biscuits is more evenly
distributed. The consumption of bread and crispbread
shows an opposing gradient to that of sweet buns, cakes
and pies and sweet biscuits, although not so clearly along
a north–south axis. In Sweden, lower bread consumption
is balanced by a higher consumption of crispbread.
Consumption of milk and milk products is higher in most
northern centres and in Spain. Thus the consumption
levels of fruits, vegetables and legumes, and pasta and rice
are not only lower in northern compared with southern
centres, but the levels of consumption of potatoes,
breakfast cereals (in some centres), soft drinks, sweet
buns, cakes and pies, and juice (in some centres) are also
higher, and therefore constitute a larger part of the diet.
Although there are reports that food practices in the
Mediterranean region are incorporating Westernised food
styles32,33, this study shows that the foods providing
carbohydrates are still quite different in southern
compared with northern Europe.
Differences between food habits of populations depend
on factors such as culture, climate and geography, and
agricultural, economic and technical development. The
traditional diets of the Mediterranean region were high in
vegetables, fruits and pulses, with cereals (wheat)
contributing a large part of the energy content. In
traditional northern European diets, a smaller proportion
of energy came from cereals (rye, oats and barley rather
than wheat) and potatoes were commonly eaten. Animal
Table 3b Mean consumption of sweet buns, cakes and pies, and sweet biscuits by women ðn ¼ 22 924Þin 27 European Prospective Investigation into Cancer and Nutrition (EPIC) centres
Sweet buns, cakes & pies(g day21) Sweet biscuits (g day21)
Adjusted* Adjusted*
Country and centre Total n Crude mean Mean SEM Crude mean Mean SEM
GreeceGreece 1374 17.8 19.2 1.9 11.0 10.5 0.5
SpainGranada 300 19.4 21.9 4.1 6.2 5.7 1.1Murcia 304 43.7 43.0 4.1 9.9 9.9 1.1Navarra 271 29.6 30.4 4.4 14.0 14.3 1.2San Sebastian 244 26.3 28.7 4.6 10.4 9.4 1.2Asturias 324 28.4 30.2 4.0 10.7 11.0 1.1
ItalyRagusa 138 35.3 38.1 6.1 16.4 13.9 1.7Naples 403 39.6 37.4 3.6 9.9 9.6 1.0Florence 785 38.0 37.9 2.6 12.3 12.2 0.7Turin 392 29.8 29.9 3.6 13.7 14.4 1.0Varese 794 31.6 34.7 2.5 19.8 20.6 0.7
FranceSouth coast 612 35.6 36.9 2.9 5.9 6.5 0.8South 1396 39.6 41.3 1.9 6.3 6.2 0.5North-west 622 44.7 45.1 2.9 4.2 4.2 0.8North-east 2009 47.3 50.3 1.6 6.5 6.4 0.4
GermanyHeidelberg 1087 45.5 51.9 2.2 7.4 7.7 0.6Potsdam 1063 48.9 50.9 2.2 4.6 4.9 0.6
The NetherlandsBilthoven 1086 41.1 42.2 2.2 13.0 12.9 0.6Utrecht 1874 39.0 39.6 1.7 15.9 16.4 0.5
United KingdomGeneral population 571 48.4 51.0 3.0 10.5 10.4 0.8‘Health-conscious’ 197 50.4 54.3 5.1 8.9 8.2 1.4
DenmarkCopenhagen 1485 30.5 33.1 1.7 5.67 5.8 0.5Aarhus 510 45.6 49.2 3.2 8.67 8.2 0.9
SwedenMalmo 1711 52.5 52.6 1.8 5.4 5.4 0.5Umea 1574 58.3 59.1 1.8 5.3 5.6 0.5
NorwaySouth & East 1136 48.1 49.1 2.2 2.7 2.4 0.6North & West 662 54.6 55.1 2.8 2.9 2.7 0.8
SEM – standard error of the mean.* Adjusted for age and standardised for day of the week and season.
E Wirfalt et al.1206

products provided a larger part of dietary energy and
intakes of milk and milk products were high2. Traditional
Mediterranean diets are generally considered to promote
good health34,35; this is especially true for cardiovascular
health36,37, but also for some types of cancer38,39. For
instance, total mortality from malignant neoplasm was low
in Mediterranean countries compared with the UK during
the latter part of the last century32 and lung cancer rates
were low in southern Europe in spite of high rates of
cigarette smoking32. In addition, the protective effects
of vegetables and fruits with regard to a number of
cancers2,40 and cardiovascular disease41,42 have been
documented.
European food habits underwent drastic changes during
the second half of the last century. Thus the dietary
differences across European regions may have diminished
substantially32,33. Most studies describing these changes
either use food balance sheets32 or look at trends within
single countries43. Others compare food habits of a few
study centres and countries44 or those of studies using
dissimilar dietary methodologies45. Comparisons on food
availability in 14 European countries are also feasible,
using data retrieved from the DAFNE databank (the DAta
Food NEtworking initiative and DafneSoft program,
http://www.nut.uoa.gr), which comprises comparable
food and related data collected in national household
budget surveys. Few studies have, however, compared
dietary intake data collected from individuals in several
countries simultaneously. The major advantage of the
current project is that it uses dietary data from the EPIC
calibration study, with standardised study design and
dietary methodology in all centres. Also, it is of great
importance for future analytical projects within the EPIC
study that major differences in carbohydrate-containing
foods could be demonstrated.
This study provided only preliminary information on
Table 3c Mean consumption of breakfast cereal, pasta and rice, and salty snacks by women ðn ¼ 22 924Þ in 27 European ProspectiveInvestigation into Cancer and Nutrition (EPIC) centres
Breakfast cereal (g day21) Pasta & rice (g day21) Salty snacks (g day21)
Adjusted* Adjusted* Adjusted*
Country and centre Total n Crude mean Mean SEM Crude mean Mean SEM Crude mean Mean SEM
GreeceGreece 1374 1.2 1.2 1.0 51.7 53.2 2.1 1.2 1.8 0.6
SpainGranada 300 0.6 0.6 2.0 24.0 23.3 4.5 1.5 1.2 1.2Murcia 304 0.4 0.8 2.0 29.7 28.9 4.5 1.3 1.2 1.2Navarra 271 0.5 0.5 2.2 27.7 26.7 4.7 0.5 0.3 1.3San Sebastian 244 1.7 1.9 2.3 28.9 26.7 5.0 0.5 0 1.3Asturias 324 1.3 1.3 2.0 34.3 33.5 4.3 1.4 1.1 1.1
ItalyRagusa 138 0.4 0.8 3.0 125.0 101.7 6.6 3.2 2.2 1.8Naples 403 2.0 1.5 1.8 124.7 125.1 3.9 12.1 15.5 1.0Florence 785 1.8 1.9 1.3 125.7 126.5 2.8 10.1 10.1 0.7Turin 392 1.4 1.5 1.8 110.8 110.1 3.9 6.7 6.8 1.0Varese 794 2.6 2.5 1.3 147.1 150.5 2.8 5.6 5.2 0.7
FranceSouth coast 612 4.2 4.5 1.4 42.2 45.0 3.1 4.6 4.1 0.8South 1396 5.0 4.4 1.0 44.0 43.2 2.1 4.1 4.4 0.6North-west 622 4.9 4.8 1.4 36.5 37.7 3.1 5.7 5.1 0.8North-east 2009 4.3 3.7 0.8 40.0 40.1 1.7 6.2 6.8 0.5
GermanyHeidelberg 1087 4.7 5.3 1.1 55.3 49.8 2.4 4.5 3.9 0.6Potsdam 1063 3.4 3.6 1.1 26.7 26.5 2.4 2.9 2.3 0.6
The NetherlandsBilthoven 1086 3.3 4.0 1.1 37.2 33.2 2.4 10.9 10.4 0.6Utrecht 1874 3.6 3.2 0.8 24.1 25.5 1.8 8.8 9.4 0.5
United KingdomGeneral population 571 23.9 23.5 1.5 25.8 26.6 3.2 11.8 11.6 0.9‘Health-conscious’ 197 30.5 29.3 2.5 50.5 43.8 5.5 8.4 7.9 1.5
DenmarkCopenhagen 1485 16.3 15.6 0.9 28.3 28.5 2.0 3.5 3.4 0.5Aarhus 510 15.7 16.0 1.6 26.5 26.2 3.4 2.3 2.1 0.9
SwedenMalmo 1711 19.4 18.1 0.9 23.4 27.0 1.9 3.3 4.1 0.5Umea 1574 42.3 42.0 0.9 30.2 29.2 2.0 3.6 3.6 0.5
NorwaySouth & East 1136 13.1 14.9 1.1 20.1 16.5 2.3 4.5 4 0.6North & West 662 11.5 11.9 1.4 18.2 14.6 3.0 5.0 3.8 0.8
SEM – standard error of the mean.* Adjusted for age and standardised for day of the week and season.
Food sources of carbohydrates in EPIC centres 1207

the relative carbohydrate contribution of different food
groups. Since a uniform food composition table is not
available for Europe and current European food compo-
sition tables compute carbohydrates differently30, the
relative contribution of specific food groups in each EPIC
centre could not be examined. Similarly, preliminary
information on total energy intake was used when
adjusting for energy (energy-adjusted data are not
presented). Also, some food groups (e.g. coffee and tea,
soups) were not examined in the final analysis, because of
their apparent low contribution to carbohydrates. The
importance of these foods as carbohydrate sources may be
underestimated. Future studies need to examine different
types of carbohydrates, as well as the relative contribution
of carbohydrates, from various food products across EPIC
centres.
The broader food groups in this study may reduce the
actual diversity of European food habits, because each
food group incorporates a range of foods and food
products. For example, ‘crispbread’ in Nordic countries is
commonly based on whole-grain rye46, while wheat flour
is preferred in southern European countries. Also, salty
biscuits and snacks in Italian centres are not only crackers,
but also bread dipped in salt and olive oil. The apparent
balances, in some centres, between bread and sweet buns,
cakes and pies, potatoes, crispbread and breakfast cereal
indicate that the food sources of fibre may vary
considerably across EPIC centres. No conclusion on
differences in fibre sources can be made in this study,
because the fibre content of bread and cereal products
was not examined. The food group sweet buns, cakes and
pies includes cereal- or flour-based items with added
sugar, but the relative proportions of sugar, starch, fibre
and fat could vary substantially between study centres,
depending on the customary use. Similarly, bread is in
reality a composite of many kinds made with different
Table 3d Mean consumption of potatoes, vegetables and legumes, and fruits by women ðn ¼ 22 924Þ in 27 European Prospective Inves-tigation into Cancer and Nutrition (EPIC) centres
Potatoes (g day21)Vegetables & legumes
(g day21) Fruits (g day21)
Adjusted* Adjusted* Adjusted*
Country and centre Total n Crude mean Mean SEM Crude mean Mean SEM Crude mean Mean SEM
GreeceGreece 1374 34.0 32.4 2.4 229.7 225.5 4.0 219.6 238.8 5.7
SpainGranada 300 54.0 55.0 5.2 248.6 220.3 8.6 352.4 338.4 12.1Murcia 304 67.6 68.1 5.1 272.9 268.2 8.5 372.6 379.3 12.1Navarra 271 51.5 54.0 5.4 219.4 219.2 9.0 320.3 330.1 12.7San Sebastian 244 60.5 64.4 5.7 257.1 250.5 9.5 370.0 365.4 13.4Asturias 324 70.3 71.5 5.0 140.3 138.6 8.2 325.5 335.9 11.7
ItalyRagusa 138 25.4 26.2 7.6 160.1 149.4 12.6 362.9 397.0 17.9Naples 403 29.0 31.3 4.5 181.7 181.5 7.4 289.9 284.5 10.5Florence 785 31.7 31.6 3.2 207.5 206.9 5.3 321.5 320.8 7.5Turin 392 32.0 31.8 4.5 237.7 237.7 7.5 357.6 359.6 10.6Varese 794 34.6 36.6 3.2 173.8 166.0 5.3 334.7 333.6 7.4
FranceSouth coast 612 37.8 30.9 3.6 235.9 274.8 6.0 231.0 245.7 8.5South 1396 50.9 49.2 2.4 228.4 226.0 4.0 256.8 259.3 5.6North-west 622 68.8 68.8 3.6 199.3 213.8 6.0 237.5 249.7 8.4North-east 2009 55.3 56.5 2.0 222.9 220.8 3.3 244.8 248.8 4.7
GermanyHeidelberg 1087 62.1 69.3 2.8 173.4 170.1 4.6 202.1 211.3 6.4Potsdam 1063 81.9 82.7 2.8 177.0 171.5 4.6 247.8 260.2 6.5
The NetherlandsBilthoven 1086 81.9 84.8 2.8 135.5 132.0 4.6 157.2 168.1 6.5Utrecht 1874 87.2 84.4 2.1 136.5 136.1 3.5 222.2 212.8 4.9
United KingdomGeneral population 571 73.2 71.1 3.7 173.1 173.9 6.2 172.9 172.6 8.8‘Health-conscious’ 197 75.7 85.5 6.4 240.9 246.2 10.6 261.7 273.0 14.9
DenmarkCopenhagen 1485 66.8 70.6 2.3 148.2 152.9 3.9 186.6 180.1 5.5Aarhus 510 72.6 71.1 4.0 145.9 148.4 6.6 239.2 233.6 9.3
SwedenMalmo 1711 86.8 82.5 2.2 128.3 133.9 3.7 162.5 150.9 5.2Umea 1574 90.8 91.8 2.3 125.5 125.8 3.7 164.5 159.1 5.3
NorwaySouth & East 1136 69.7 72.6 2.7 132.2 132.4 4.5 163.3 173.1 6.3North & West 662 85.0 89.7 3.5 120.1 119.9 5.8 147.0 162.1 8.2
SEM – standard error of the mean.* Adjusted for age and standardised for day of the week and season.
E Wirfalt et al.1208

cereals, types of flour and bread-making procedures.
However, if all differences were accounted for, a huge
amount of data and many models would be required,
which is beyond the scope of this paper.
Other researchers have also reported higher intakes of
sugar-rich food products in northern compared with
southern Europe44. Such observations may have important
implications for cross-cultural comparisons and the
interpretation of diet–disease relationships. When the
percentage of dietary fat is reduced, intakes of foods with
low micronutrient density and rich in added sugars tend to
increase, rather than foods rich in starch and dietary fibre,
i.e. the so-called fat and sugar seesaw47–51. Populations of
southern Europe, where vegetables and fruits are
traditionally consumed in larger amounts, may be less
vulnerable to such seesaw patterns. However, a French
study indicates that individuals with high sugar intakes
(compared with those with low intakes) are younger,
leaner and have more varied diets, but also have low
intakes of fruits and vegetables51.
The consumption gradient of milk among adults across
European populations is believed to result from genetic
adaptation52,53, related to the prevalence of lactose
maldigestion being very low in northern Europe (i.e. 1–
3% in Denmark and Sweden), moderate in central Europe
(i.e. 8–22 % in Germany) and high in the south (i.e. 50–
72% in Italy)52. However, milk consumption is high in the
Spanish centres in this study. Other studies indicate that
milk consumption has increased in Spain during the last
three decades43 and it may be that lactose maldigestion is
less common in Spain than in other southern European
populations52. Also, moderate amounts of milk may be
tolerated well by individuals with lactose maldigestion53.
Cheese is not included in the milk group because of its
Table 3e Mean consumption of fruit and vegetable juices, soft drinks, and milk and milk products by women ðn ¼ 22 924Þ in 27 EuropeanProspective Investigation into Cancer and Nutrition (EPIC) centres
Fruit & vegetable juices(g day21) Soft drinks (g day21) Milk & milk products (g day21)
Adjusted* Adjusted* Adjusted*
Country and centre Total n Crude mean Mean SEM Crude mean Mean SEM Crude mean Mean SEM
GreeceGreece 1374 41.6 49.2 4.1 28.1 35.2 4.8 151.0 146.1 6.2
SpainGranada 300 36.2 37.8 8.8 67.7 77.9 10.3 363.5 366.3 13.3Murcia 304 37.6 32.4 8.7 49.7 45.3 10.3 316.0 314.1 13.2Navarra 271 28.2 26.5 9.2 22.9 20.3 10.9 380.6 378.4 14.0San Sebastian 244 23.1 18.3 9.7 29.5 22.4 11.5 386.9 388.2 14.7Asturias 324 39.4 35.6 8.5 41.3 38.2 10.0 462.5 461.6 12.8
ItalyRagusa 138 9.9 4.4 13.0 43.8 28.6 15.3 117.3 116.2 19.6Naples 403 21.6 19.0 7.6 22.3 17.6 8.9 145.0 150.7 11.4Florence 785 24.3 23.8 5.4 12.2 12.9 6.4 174.8 175.9 8.2Turin 392 28.8 26.9 7.7 27.1 28.0 9.0 154.5 152.8 11.6Varese 794 18.5 18.9 5.4 21.9 22.5 6.4 204.2 203.7 8.2
FranceSouth coast 612 48.2 47.8 6.2 9.3 11.9 7.3 233.7 241.4 9.3South 1396 51.6 54.1 4.1 14.5 18.9 4.8 237.9 232.8 6.2North-west 622 56.6 63.5 6.1 8.4 12.4 7.2 238.3 235.3 9.2North-east 2009 55.7 60.1 3.4 14.5 18.6 4.0 242.1 240.4 5.1
GermanyHeidelberg 1087 175.7 164.7 4.7 68.4 57.2 5.5 205.3 207.7 7.1Potsdam 1063 158.2 156.0 4.7 30.4 28.5 5.5 210.8 204.0 7.1
The NetherlandsBilthoven 1086 104.1 97.7 4.7 103.8 92.4 5.5 296.5 297.8 7.1Utrecht 1874 100.3 104.9 3.5 68.5 73.0 4.2 390.8 386.7 5.4
United KingdomGeneral population 571 65.5 69.8 6.4 141.1 140.6 7.5 350.4 346.1 9.6‘Health-conscious’ 197 94.7 82.4 10.8 103.3 101.1 12.8 220.5 195.6 16.4
DenmarkCopenhagen 1485 52.8 55.2 4.0 123.5 129.2 4.6 253.5 252.1 6.0Aarhus 510 59.0 54.7 6.7 93.2 96.0 7.9 276.1 268.7 10.2
SwedenMalmo 1711 46.9 53.4 3.8 63.3 75.9 4.4 276.2 273.3 5.7Umea 1574 42.8 43.0 3.8 114.6 121.9 4.5 334.5 334.3 5.8
NorwaySouth & East 1136 93.8 96.6 4.6 167.9 163.1 5.4 246.8 245.7 6.9North & West 662 89.2 83.5 6.0 167.7 159.1 7.0 243.4 247.6 9.0
SEM – standard error of the mean.* Adjusted for age and standardised for day of the week and season.
Food sources of carbohydrates in EPIC centres 1209

negligible carbohydrate content. In Norwegian diets,
however, 1% of total carbohydrate intake comes from
cheese54, because ‘brown’ cheese (made from whey and
with a high content of lactose) is commonly eaten. But the
percentage is not high enough to count as a major
carbohydrate source in this study.
Men consume, overall, higher amounts of vegetables
and legumes, bread, soft drinks, potatoes, pasta and rice,
breakfast cereal, and sugar and jam. Since no adjustment
was made for energy intake differences between gender
groups (but analysis was stratified by gender), the higher
intakes of these foods are most likely explained by higher
energy needs in men. Both gender groups consume sweet
buns, cakes and pies, sweet biscuits, crispbread, salty
biscuits and snacks, chocolates, sweets, milk and milk
products, and fruit and vegetable juices in equal amounts.
This suggests that these foods take up larger proportions
of the diets of women. In addition, fruit consumption is
reported in a larger percentage of dietary recalls in
women. Other studies report similar gender differences
both in food preferences55 and intakes56.
The study samples for the EPIC calibration study were
selected randomly from each sub-study cohort27. How-
ever, the definition and recruitment of sub-cohorts varied
by study centre (e.g. France and Norway recruited only
women; some centres used specific sub-populations) and
the findings should therefore not be extrapolated to the
general populations of each region. In addition, since this
study did not adjust for differences in socio-economic and
lifestyle factors, it is plausible that food consumption
differences observed between cohorts depend partly on
socio-economic or lifestyle differences. Several studies
have described that lifestyle behaviours and socio-
demographic factors co-vary with healthy food choices
Table 3f Mean consumption of sugar and jam, sweets, and chocolates by women ðn ¼ 22 924Þ in 27 European Prospective Investigationinto Cancer and Nutrition (EPIC) centres
Sugar & jam (g day21) Sweets (g day21) Chocolates (g day21)
Adjusted* Adjusted* Adjusted*
Country and centre Total n Crude mean Mean SEM Crude mean Mean SEM Crude mean Mean SEM
GreeceGreece 1374 9.8 10.2 0.6 3.1 3.1 0.5 2.3 2.5 0.5
SpainGranada 300 12.2 12.4 1.4 2.3 3.1 1.1 2.1 1.4 1.1Murcia 304 12.0 12.2 1.4 2.3 2.2 1.1 2.0 1.6 1.0Navarra 271 14.6 14.5 1.4 3.5 3.5 1.1 2.3 2.1 1.1San Sebastian 244 18.9 19.2 1.5 3.9 3.7 1.2 3.2 3.1 1.2Asturias 324 15.7 16.1 1.3 3.1 2.8 1.0 4.0 4.2 1.0
ItalyRagusa 138 8.9 11.8 2.0 0.2 0 1.6 4.2 8.1 1.6Naples 403 14.0 13.5 1.2 2.2 1.4 0.9 3.6 3.1 0.9Florence 785 10.2 9.9 0.8 0.6 0.6 0.7 2.8 2.6 0.7Turin 392 14.1 14.2 1.2 2.2 2.2 0.9 2.6 2.7 0.9Varese 794 15.0 14.9 0.8 2.2 2.6 0.7 2.5 2.6 6.4
FranceSouth coast 612 19.5 18.1 1.0 2.4 2.8 0.8 7.6 7.4 0.7South 1396 21.0 20.7 0.6 2.8 2.7 0.5 6.1 5.9 0.5North-west 622 20.4 19.5 0.9 1.8 2.6 0.7 6.3 6.5 0.7North-east 2009 19.0 19.0 0.5 3.0 3.3 0.4 8.1 7.8 0.4
GermanyHeidelberg 1087 15.4 16.2 0.7 3.3 2.8 0.6 8.6 8.0 0.6Potsdam 1063 14.3 14.8 0.7 3.1 3.1 0.6 7.4 7.6 0.6
The NetherlandsBilthoven 1086 17.3 17.7 0.7 8.8 8.3 0.6 10.1 9.3 0.6Utrecht 1874 15.3 15.0 0.6 9.1 9.4 0.4 7.8 8.4 0.4
United KingdomGeneral population 571 13.5 13.9 1.0 3.0 3.2 0.8 10.6 9.9 0.8‘Health-conscious’ 197 15.1 14.1 1.7 4.3 4.2 1.3 9.8 8.2 1.3
DenmarkCopenhagen 1485 14.5 15.1 0.6 3.9 3.8 0.5 7.0 7.5 4.7Aarhus 510 14.2 14.0 1.0 8.7 9.0 0.8 8.2 7.8 0.8
SwedenMalmo 1711 16.5 16.1 0.6 7.6 8.3 0.5 7.7 8.5 0.5Umea 1574 21.6 21.4 0.6 6.0 6.0 0.5 4.8 4.9 0.5
NorwaySouth & East 1136 17.6 18.7 0.7 3.0 2.6 0.6 10.7 9.8 0.6North & West 662 21.2 21.6 0.9 2.7 2.5 0.7 8.8 8.4 0.7
SEM – standard error of the mean.* Adjusted for age and standardised for day of the week and season.
E Wirfalt et al.1210

Fig. 1a Consumption of bread, crispbread, sweet buns, cakes and pies, sweet biscuits, pasta and rice, and breakfast cereal by men in19 European Prospective Investigation into Cancer and Nutrition (EPIC) centres. Abbreviations: GRE – Greece; SPA – Spain; ITA –Italy; GER – Germany; NLD – The Netherlands; UK – United Kingdom; DEK – Denmark; SWE – Sweden
Fig. 1b Consumption of potato, vegetables and legumes, fruit, fruit and vegetable juices, and soft drinks by men in 19 European Pro-spective Investigation into Cancer and Nutrition (EPIC) centres. Abbreviations: GRE – Greece; SPA – Spain; ITA – Italy; GER –Germany; NLD – The Netherlands; UK – United Kingdom; DEK – Denmark; SWE – Sweden
Food sources of carbohydrates in EPIC centres 1211

Fig. 2a Consumption of bread, crispbread, sweet buns, cakes and pies, sweet biscuits, pasta and rice, and breakfast cereal by womenin 27 European Prospective Investigation into Cancer and Nutrition (EPIC) centres. Abbreviations: GRE – Greece; SPA – Spain; ITA –Italy; FRA – France; GER – Germany; NLD – The Netherlands; UK – United Kingdom; DEK – Denmark; SWE – Sweden; NOR – Norway
Fig. 2b Consumption of potato, vegetables and legumes, fruit, fruit and vegetable juices, and soft drinks by women in 27 European Pro-spective Investigation into Cancer and Nutrition (EPIC) centres. Abbreviations: GRE – Greece; SPA – Spain; ITA – Italy; FRA – France;GER – Germany; NLD – The Netherlands; UK – United Kingdom; DEK – Denmark; SWE – Sweden; NOR – Norway
E Wirfalt et al.1212

such as fruit and vegetable intakes57–59. For instance,
reports from Denmark and Sweden indicate that alcohol
use (especially wine) is positively related to fruit and
vegetable consumption60,61. Such relations are not found
in Italy62, however. Because clear consumption gradients
are visible across EPIC centres in this study, one might
speculate that the associations between food sources of
carbohydrates and potential confounders are dissimilar.
This notion is supported by a review of research in 15
European countries that concluded that fruit and vegetable
consumption was higher in population groups with lower
education in some southern European countries63.
However, recent studies across EPIC centres in both
Spain and Italy indicate that vegetable and fruit consump-
tion is indeed higher among those with higher edu-
cation64–66. In addition, although many regional food
consumption differences have been removed by technical
developments and improved communications, some still
exist. For instance, fruit consumption is high in Ragusa
(Italy) because Sicily is a major fruit-producing region.
Also, differences in the cost of bread may explain the
north–south gradient in bread consumption seen in Italy
(less than e1 per kg in the south, more than e3 in the
north).
To conclude, this study supports the established idea
that the choice of carbohydrate-rich foods in northern
Europe is different from that in the Mediterranean region.
Due to potential differences in confounders across
geographically and culturally diverse populations,
researchers need to consider carefully the intake ranges
for all food choices and non-dietary confounders when
comparing and interpreting diet–disease relations across
centres participating in the EPIC study.
Acknowledgements
The work described in this paper was carried out with
financial support of the ‘Europe Against Cancer’ Pro-
gramme of the European Commission (SANCO); Ligue
contre le Cancer (France); Societe 3 M (France); Mutuelle
Generale de l’Education Nationale; Institut National de la
Sante et de la Recherche Medicale (INSERM); Institute
Gustave Roussy; German Cancer Aid; German Cancer
Research Centre; German Federal Ministry of Education
and Research; Danish Cancer Society; Health Research
Fund (FIS) of the Spanish Ministry of Health; the Spanish
Regional Governments of Andalucia, Asturias, Basque
Country, Murcia and Navarra; Cancer Research UK;
Medical Research Council, UK; Stroke Association, UK;
British Heart Foundation; Department of Health, UK; Food
Standards Agency, UK; Wellcome Trust, UK; Greek
Ministry of Health; Greek Ministry of Education; Italian
Association for Research on Cancer; Italian National
Research Council; Dutch Ministry of Public Health, Welfare
and Sports; Dutch Prevention Funds; LK Research Funds;
Dutch ZON (Zorg Onderzoek Nederland); World Cancer
Research Fund; Swedish Cancer Society; Swedish Scien-
tific Council; Regional Government of Skane, Sweden;
Norwegian Cancer Society; Norwegian Research Council.
Partial support for the publication of this supplement was
provided by the Centre de Recherche et d’Information
Nutritionnelles (CERIN).
In addition, we wish to thank all study participants for
their co-operation and all interviewers who participated in
the fieldwork studies in each EPIC centre.
References
1 Freudenheim JL, Krogh V, D’Amicis A, Scaccini C, Sette S,Ferro-Lucci A, et al. Food sources of nutrients in the diet ofelderly Italians: I. Macronutrients and lipids. Int. J. Epidemiol.1993; 22: 855–68.
2 World Cancer Research Fund/American Institute for CancerResearch (WCRF/AICR). Food, Nutrition and the Preventionof Cancer: A Global Perspective. Washington, DC:WCRF/AICR, 1997.
3 Trichopoulou A, Vasilopoulou E. Nutritional compositionand flavonoid content of edible wild greens and green pies:a potential rich source of antioxidant nutrients in theMediterranean diet. Food Chem. 2000; 70: 319–23.
4 Messina MJ, Persky V, Setchell KDR, Barnes S. Soy intake andcancer risk: a review of the in vitro and in vivo data. Nutr.Cancer 1994; 21: 113–31.
5 Thompson L, Robb P, Serraino M, Cheung F. Mammalianlignan production from various foods. Nutr. Cancer 1991;16: 43–52.
6 Adlercreutz H. Phytoestrogens: epidemiology and a possiblerole in cancer protection. Environ. Health Perspect. 1995;103: 103–12.
7 Liljeberg H, Bjorck I. Effects of a low-glycemic indexspaghetti meal on glucose tolerance and lipidemia at asubsequent meal in healthy subjects. Eur. J. Clin. Nutr. 2000;54: 24–8.
8 Liljeberg H, Bjorck I. Delayed gastric emptying rate mayexplain improved glycaemia in healthy subjects to a starchymeal with added vinegar. Eur. J. Clin. Nutr. 1998; 52:368–71.
9 Martin L, Dumon H, Lecannu G, Champ M. Potato and high-amylose maize starches are not equivalent producers ofbutyrate for the colonic mucosa. Br. J. Nutr. 2000; 84:689–96.
10 Salmeron J, Manson J-AE, Stampfer MJ, Colditz GA, Wing AL,Willet WC. Dietary fiber, glycemic load, and risk of non-insulin-dependent diabetes mellitus in women. J. Am. Med.Assoc. 1997; 277: 472–7.
11 Salmeron J, Ascherio A, Rimm E, Colditz G, Spiegelman D,Jenkins D, et al. Dietary fiber, glycemic load, and risk ofNIDDM in men. Diabetes Care 1997; 20: 545–50.
12 Agus M, Swain J, Larson C, Eckert E, Ludwig D. Dietarycomposition and physiologic adaptations to energy restric-tion. Am. J. Clin. Nutr. 2000; 71: 901–7.
13 Kaaks R. Nutrition, hormones and breast cancer: is insulinthe missing link? Cancer Causes Control 1996; 7: 605–25.
14 La Vecchia C, Negri E, Decarli A, Franceschi S. Diabetesmellitus and colorectal cancer risk. Cancer Epidemiol.Biomark. Prev. 1997; 6: 1007–10.
15 Kono S, Honjo S, Todoroki I, Nishiwaki M, Hamada H,Nishikawa H, et al. Glucose intolerance and adenomas of thesigmoid colon in Japanese men. Cancer Causes Control1998; 9: 441–6.
16 Hu F, Manson J, Liu S, Hunter D, Colditz G, Michels K, et al.Prospective study of adult onset diabetes mellitus (type 2)
Food sources of carbohydrates in EPIC centres 1213

and risk of colorectal cancer in women. J. Natl. Cancer Inst.1999; 91: 542–7.
17 Nilsen T, Vatten L. Prospective study of colorectal cancer riskand physical activity, diabetes, blood glucose and BMI:exploring the hyperinsulinemia hypothesis. Br. J. Cancer2001; 84: 417–22.
18 Phillips J, Muir J, Birkett A, Lu Z, Jones G, O’Dea K, et al.Effect of resistant starch on fecal bulk and fermentation-dependent events in humans. Am. J. Clin. Nutr. 1995; 62:121–30.
19 Jenkins D, Vuksan V, Kendall C, Wursch P, Jeffcoat R, WaringS, et al. Physiological effects of resistant starches on fecalbulk, short chain fatty acids, blood lipids and glycemicindex. J. Am. Coll. Nutr. 1998; 17: 609–16.
20 Hylla S, Gostner A, Dusel G, Anger H, Bartram H, Christl S,et al. Effects of resistant starch on the colon in healthyvolunteers: possible implications for cancer prevention. Am.J. Clin. Nutr. 1998; 67: 136–42.
21 Hald MT, Vogel U, Dragsted L, Loft S, WallinH. Characterization of sugar-induced mutations in the cIIgene in the colon of Big Blue rats. Paper presented at DanishCancer Society Symposium, Nutrition and Cancer, 26–29August 2001.
22 Slattery ML, Curtin K, Anderson K, Ma KN, Edwards S,Leppert M, et al. Associations between dietary intake and Ki-ras mutations in colon tumors: a population-based study.Cancer Res. 2000; 60: 6935–41.
23 Southgate D. The role of dietary fibre in the diet. J. Roy. Soc.Health 1990; 110: 174–176.
24 Greenwald P, Clifford C, Milner J. Diet and cancerprevention. Eur. J. Cancer 2001; 37: 948–965.
25 McCann J. Obesity, cancer links prompts new recommen-dations. J. Natl. Cancer Inst. 2001; 93: 901–902.
26 Riboli E, Kaaks R. The EPIC Project: rationale and studydesign. Int. J. Epidemiol. 2001; 26: S6–S14.
27 Slimani N, Kaaks R, Ferrari P, Casagrande C, Clavel F, LotzeG, et al. European Prospective Investigation into Cancer andNutrition (EPIC) calibration study: rationale, design andpopulation characteristics. Public Health Nutr. 2002; 5(6B):1125–45.
28 Slimani N, Ferrari P, Ocke M, Welch A, Boeing H, Liere M,et al. Standardization of the 24-hour recall calibrationmethod used in the European Prospective Investigation intoCancer and Nutrition (EPIC): general concepts andpreliminary results. Eur. J. Clin. Nutr. 2000; 54: 900–17.
29 Slimani N, Deharveng G, Charrondiere R, van Kappel A,Ocke M, Welch A, et al. Structure of the standardizedcomputerized 24-h diet recall interview used as referencemethod in the 22 centers participating in the EPIC project.European Prospective Investigation into Cancer and Nutri-tion. Comput. Meth. Programs Biomed. 1999; 58: 251–66.
30 Deharveng G, Charrondiere UR, Slimani N, Southgate DAT,Riboli E. Comparisons of nutrients in the food compositiontables available in the nine European countries participatingin EPIC. Eur. J. Clin. Nutr. 1999; 53: 60–79.
31 Norusis MJ. SPSS for Windows Professional Statistics, Release6.0. Chicago, IL: SPSS Inc., 1993.
32 Helsing E. Trends in fat consumption in Europe and theirinfluence on the Mediterranean diet. Eur. J. Clin. Nutr. 1993;47: S4–12.
33 Cruz A. Dietary habits and nutritional status in adolescentsover Europe – Southern Europe. Eur. J. Clin. Nutr. 2000; 54:S29–35.
34 Kushi L, Lenart E, Willett W. Health implications ofMediterranean diets in light of contemporary knowledge.1. Plant foods and dairy products. Am. J. Clin. Nutr. 1995; 61:1407S–15S.
35 Kushi L, Lenart E, Willett W. Health implications ofMediterranean diets in light of contemporary knowledge.
2. Meat, wine, fats, and oil. Am. J. Clin. Nutr. 1995; 61:1416S–27S.
36 Keys A. Coronary heart disease in seven countries.Circulation 1970; 41(Suppl. 1): 1–211.
37 Trichopoulou A, Vasilopoulou E, Lagiou A. Mediterraneandiet and coronary heart disease: are antioxidants critical?Nutr. Rev. 1999; 57: 253–5.
38 Tavani A, LaVecchia C. Fruit and vegetable consumption andcancer risk in a Mediterranean population. Am. J. Clin. Nutr.1995; 61: 1374S–7S.
39 Trichopoulou A, Lagiou P, Kuper H, Trichopoulos D. Cancerand Mediterranean dietary traditions. Cancer Epidemiol.Biomark. Prev. 2000; 9: 869–73.
40 Steinmetz K, Potter J. Vegetables, fruits and cancer.I. Epidemiology. Cancer Causes Control 1991; 2: 325–57.
41 Ness AR, Powles JW. Fruit and vegetables, and cardiovas-cular disease: a review. Int. J. Epidemiol. 1997; 26: 1–13.
42 Law M, Morris J. By how much does fruit and vegetableconsumption reduce the risk of ischaemic heart disease? Eur.J. Clin. Nutr. 1998; 52: 549–56.
43 Serra-Majem L, Ribas L, Tresserras R, Ngo J, Salleras J. Howcould changes in diet explain changes in coronary heartdisease mortality in Spain? The Spanish paradox. Am. J. Clin.Nutr. 1995; 61: 1351S–9S.
44 Holdsworth M, Gerber M, Haslam C, Scali J, Beardsworth A,Avallone M, et al. A comparison of dietary behaviour inCentral England and a French Mediterranean region. Eur.J. Clin. Nutr. 2000; 54: 530–9.
45 Roos G, Prattala R. Disparities in Food Habits. Review ofResearch in 15 European Countries. Publications of theNational Public Health Institute. FAIR-97-3096 DisparitiesGroup (tasks 4 and 5) (B24). Helsinki, Finland: KTL–National Public Health Institute, 1999.
46 Adlercreutz H. Epidemiology of phytoestrogens. BaillieresBest Pract. Clin. Endocrinol. Metab. 1998; 12: 605–23.
47 Gibson S. Are high-fat, high-sugar foods and diets conduciveto obesity? Int. J. Food Sci. Nutr. 1996; 47: 405–15.
48 Macdiarmid J, Cade J, Blundell J. High and low fatconsumers, their macronutrient intake and body massindex: further analysis of the National Diet and NutritionSurvey of British Adults. Eur. J. Clin. Nutr. 1996; 50: 505–12.
49 Macdiarmid J, Vail A, Cade J, Blundell J. The sugar–fatrelationship revisited: differences in consumption betweenmen and women of varying BMI. Int. J. Obes. Relat. Metab.Disord. 1998; 22: 1053–61.
50 Boulton-Smith C, Woodward M. Dietary composition and fatto sugar ratios in relation to obesity. Int. J. Obes. Relat.Disord. 1994; 18: 820–8.
51 Drewnowski A, Henderson S, Shore A, Fischler C, Preziosi P,Hercberg S. The fat–sucrose seesaw in relation to age anddietary variety of French adults. Obes. Res. 1997; 5: 511–8.
52 Gudmand-Hoyer E, Skovberg H. Disaccharide digestion andmaldigestion. Scand. J. Gastroenterol. 1996; 31: 111–21.
53 Suarez F, Savaiano D, Levitt M. A comparison of symptomsafter the consumption of milk or lactose-hydrolyzed milk bypeople with self-reported severe lactose intolerance. N. Engl.J. Med. 1995; 333: 1–4.
54 Norkost 1997. Landsomfattende kostholdsundersokelse blantmenn og kvinner i alderen 16–79 ar. Rapport 2/1999. Oslo:Statens rad for ernaering og fysisk aktivitet, 1999.
55 O’Doherty Jensen K, Holm L. Preferences, quantities andconcerns: socio-cultural perspectives on the genderedconsumption of foods. Eur. J. Clin. Nutr. 1999; 53: 351–9.
56 Beer-Borst S, Hercberg S, Morabia A, Bernstein M, Galan P,Galasso R, et al. Dietary patterns in six Europeanpopulations: results from EURALIM, a collaborative Euro-pean data harmonization and information campaign. Eur.J. Clin. Nutr. 2000; 54: 253–62.
57 Patterson RE, Haines PS, Popkin BM. Health lifestyle patternsof US adults. Prev. Med. 1994; 23: 453–60.
E Wirfalt et al.1214

58 Johansson L, Frost Andersen L. Who eats 5 a day? Intake offruits and vegetables among Norwegians in relation togender and lifestyle. J. Am. Diet. Assoc. 1998; 98: 689–91.
59 Irala-Estevez J, Groth M, Johansson L, Oltersdorf U, PrattalaR, Martinez-Gonzalez M. A systematic review of socio-economic differences in food habits in Europe: consumptionof fruit and vegetables. Eur. J. Clin. Nutr. 2000; 54: 706–14.
60 Tjonneland A, Gronbeck M, Stripp C, Overvad K. Wineintake and diet in a random sample of 48 763 Danish menand women. Am. J. Clin. Nutr. 1999; 69: 49–54.
61 Wallstrom P, Wirfalt E, Janzon L, Mattisson I, Elmstahl S,Johansson U, et al. Fruit and vegetable consumption inrelation to risk factors for cancer: a report from the MalmoDiet and Cancer Study. Public Health Nutr. 2000; 3: 263–71.
62 Chatenoud L, Negri E, Vecchia C, Volpato O, Franceschi S.Wine drinking and diet in Italy. Eur. J. Clin. Nutr. 2000; 54:177–9.
63 Roos G, Johansson L, Kasmel A, Klumbiene J, Prattala R.Disparities in vegetable and fruit consumption: Europeancases from the north to the south. Public Health Nutr. 2001;4: 35–43.
64 Agudo A, Pera G. Vegetable and fruit consumption associatedwith anthropometric, dietary and lifestyle factors in Spain.EPIC Group of Spain. European Prospective Investigationinto Cancer. Public Health Nutr. 1991; 2: 263–71.
65 Agudo A, Amiano P, Barcos A, Barricarte A, Beguiristain JM,Chirlaque MD, et al. Dietary intake of vegetables and fruitsamong adults in five regions of Spain. EPIC Group of Spain.European Prospective Investigation into Cancer and Nutri-tion. Eur. J. Clin. Nutr. 1991; 53: 174–80.
66 Pala V, Berrino F, Vineis P, Palli D, Celentano E, TuminoR. How vegetables are eaten in Italian EPIC centres: stillsetting a good example? Paper presented at EuropeanConference on Nutrition and Cancer, 21–24 June 2001.
Food sources of carbohydrates in EPIC centres 1215