24933895 Urban World Harmonious Cities China and India in Focus

Food Security in India, China, and the World
Michael S. Finnin
I N S T I T U T E F O R D E F E N S E A N A L Y S E S
INSTITUTE FOR DEFENSE ANALYSES4850 Mark Center Drive
Alexandria, Virginia 22311-1882
IDA Document D-5823Log: H 16-000660
June 2016Approved for public release;
distribution is unlimited.

About this Publication This work was conducted by the Institute for Defense Analyses (IDA) under contract HQ0034-14-D-0001, Project DA-2-4015, "Assessment of Food, Chemical, and Materials Security and Opportunities for Technical Solutions,” for the Defense Advanced Research Projects Agency (DARPA). The views, opinions and/or findings expressed are those of the author and should not be interpreted as representing the official views or policies of the Department of Defense or the U.S. Government.
Copyright Notice© 2016 Institute for Defense Analyses4850 Mark Center Drive, Alexandria, Virginia 22311-1882 • (703) 845-2000.
This material may be reproduced by or for the U.S. Government pursuant to the copyright license under the clause at DFARS 252.227-7013 (a)(16) [Jun 2013].
I N S T I T U T E F O R D E F E N S E A N A L Y S E S
IDA Document D-5823
Food Security in India, China, and the World
Michael S. Finnin


iii
Executive Summary
Background IDA was asked by the Defense Advanced Research Projects Agency (DARPA) to
make an assessment of the issue of global food security. Many studies in the literature and the popular press suggest that the world will not be able to support the expanding population of the world into the mid-21st century. It has been purported that emerging economies such as China, India, and Brazil will eventually place a large burden on the global food supply with their increasing populations and their eventual demand for a more Western-style diet that consists of greater proportions of meats, oils, and fresh vegetables. DARPA was interested in having IDA review projections and scientific studies in the literature and assess the state of the art and determine if it was likely that the world would have an impending food crisis in 2050. IDA was also asked to specifically assess the food security status of China and India, which are the two largest emerging economies that may have serious food security challenges in the future.
Global Food Security IDA found that the main assessments of current hunger and undernourishment and
projections of food security are made by the United Nations Food and Agricultural Organization (FAO). The FAO has been collecting agricultural data from individual nations for decades and makes yearly assessments of the current state of food insecurity and periodic projections of future global food security. The FAO assessment of food security in 2050 presents a likely future based on projections of current agricultural production and consumption. It also takes into account future projections of world population and economic indicators such as gross domestic products (GDPs) of nations.
The FAO assessments indicate that the proportion of undernourished in the world has been decreasing over the past two decades and projects that the percentage of undernourished people in the world will continue to decline. By 2050, FAO estimates that 320 million individuals will still be undernourished out of a world population of 9.7 billion. The world will continue to be food insecure, but that food insecurity will be localized to the Least Developed Countries (LDCs) of Sub-Saharan Africa and Asia. The main driver of food insecurity is not a question of whether the world can produce enough food for the world population, but whether it can be accessed by the world’s poor. World food prices and social inequality will continue to prevent many areas from accessing food, and they will continue to be food insecure.

iv
Other assessments in the literature, such as those by the U.S. Department of Agriculture and the World Resource Institute, generally agree with the FAO assessment, although there is some criticism of the FAO’s data and methodology. Critics argue that the data used for the FAO assessment are generally incomplete and not rigorously measured by submitting countries. Also, the FAO’s metric for measuring food security, the prevalence of undernourishment, is an imperfect measure of global food security. Still others argue that the FAO presents a too positive future because the effects of climate change, water scarcity, and economic food price shocks are not considered in their analysis.
IDA could find no compelling data to indicate that there will be a worldwide food crisis by 2050. The projections in the literature generally agree that there will be adequate resources for the world to produce enough food for the growing population. As many of the studies pointed out, however, if other factors such as the relatively unpredictable effects of climate change, the limited availability of fresh groundwater, and the sustainable production of agricultural products are considered, the future of global food security may not be as assured as the FAO projection concludes. DARPA specifically asked IDA not to consider these factors in its analysis. When these uncertainties of the future are ignored, the question of feeding the global population is dominated by food access by the poorest of the world’s population.
Food Security in India and China IDA assessed the food security issues of agricultural production, consumption, trade,
and potential food security shocks for India and China by reviewing the literature and supporting agricultural data provided by FAO databases like FAOSTAT. The food security picture of the two countries is vastly different. China, while making great strides to achieve improvements in food security in the 20th century, is facing many challenges for future food security. India, on the other hand, currently lags the rest of the emerging countries in food security, but has many internal natural resources that could be harnessed to ensure its food security for the first half of the 21st century. IDA’s assessment of future Chinese and India food security issues are summarized in the table below as a stoplight chart.
Agricultural production in China and India is at a level that both countries are currently able to achieve self-sufficiency in many agricultural commodities, including meat, cereals, and oil crops. China and India are not dependent on trade to meet consumption demands of their individual populations for these commodities. Production trends, however, indicate that agricultural yields are no longer increasing in China, which is likely because many techniques of improving yields on the current amount of arable land, such as double-cropping and increasing cropping intensity, have already been maximized. In India, agricultural yields are not maximized since many of the farms there have not yet taken advantage of the benefits of the Green Revolution that occurred in the developed world in the mid-20th century.

v
Summary of Chinese and Indian Food Security
Indicator China India Indicator China India
Production Food Security Shocks
Agricultural Yield Water Scarcity
Self-sufficiency Arable Land
Cereals Pollution
Vegetables Weather Extremes
Meat
Consumption Trade
Meat Food Access
Vegetable Oils
Cereals
Red = Likely an issue.
Yellow = Potentially an issue.
Green = Not an issue.
Consumption statistics, particularly in meat, vegetable oils, and fresh vegetables, have
been used as an indication that many emerging economies may be graduating to a Western-style diet. A Western-style diet consists of greater than 3,000 kcal/person/day with a high proportion of protein derived from meat. Many researchers in food security worry that if these countries do adopt the diet, enormous resources will be required to support the increased meat production throughout the developing world. Analysis of the per capita consumption of meat and vegetable oil shows that China may already have developed a Western diet. Meat consumption in China per capita is continuing to increase, and it may not show signs of slowing. China is now resorting to the world trade market to supplement its domestic supply of meat and vegetable oils, which may put strain on the world food supply in the future. India, on the other hand, has not experienced this “livestock revolution.” Meat consumption per capita in India is lower than that of China and the West. Indian meat consumption is decreasing over time, and India is becoming a net exporter of meat. On the other hand, vegetable oil consumption is increasing in India and China, and domestic production is not keeping up with demand.
China will face a number of challenges in the future that could induce shocks to the global food market and affect food prices. China has limited arable land for agriculture, and its water is relatively scarce and polluted. Agriculture is confined to a land area in

vi
China that is physically separate from areas with the greatest rainfall, which means that getting water supplies to cropland is an enormous challenge. These factors could limit China’s ability to expand agricultural production in the future. India, on the other hand, has the second largest cropped area in the world, with some additional arable land that could be used for future agricultural expansion. Freshwater for agriculture is also sufficient for India’s needs. Both countries are susceptible to monsoons in their individual climates, which have the potential to affect agricultural yields and food security of the countries. India still has a food access challenge—much of its rural population cannot achieve food security due to economic and social barriers.
China’s future food security appears to be more tenuous than that of India. China is attempting to combat future food insecurity by investing in technological advancements such as using resource-efficient cultivars (a plant produced by selective breeding), genetically modified organisms (GMOs), and building canals to transport water to cropland to improve crop yields. China is also engaging some of the LDCs in Africa where arable land is more plentiful and may be able to make up domestic production shortfalls by advancing agricultural technologies in that part of the world.
Should China’s potential solutions for mitigating food shocks fail or be only partly successful, China could rely more on imports to supplement stagnating internal production, but doing so would put stress on the global food network and on the United States as a trade partner. Another factor to consider is the question of India’s consumption of meat. Should India decide to consume more meat, the effects on the global food supply and global food security could become greater in the future.

vii
Contents
1. Background .............................................................................................................. 1-1 A. Malthusian and Neo-Malthusian Thought ....................................................... 1-1 B. Food Security .................................................................................................. 1-2 C. Population Growth and Food Price Spikes ...................................................... 1-3 D. DARPA’s Question to IDA ............................................................................. 1-5
2. Assessment of Global Food Security ...................................................................... 2-1 A. UN FAO Assessment of Global Food Security ............................................... 2-1
1. Food Insecurity Monitoring by the FAO ................................................... 2-1 2. FAO Metrics for Global Food Security ..................................................... 2-1 3. Global Food Availability and PoU in 2015 and 2050 ............................... 2-3 4. Prevalence of Undernourishment .............................................................. 2-5 5. Shifting Diet Structure ............................................................................... 2-8 6. Room for Agricultural Expansion ........................................................... 2-10 7. IDA Assessment of the FAO Study ........................................................ 2-10
B. USDA Economic Research Service Assessment .......................................... 2-11 1. Methodology ........................................................................................... 2-11 2. USDA Food Security Assessment ........................................................... 2-12
C. World Resource Institute Assessment ........................................................... 2-12 D. Comparison of Assessments .......................................................................... 2-12
3. Food Security in China ............................................................................................ 3-1 A. Summary of China’s Agriculture .................................................................... 3-1 B. China’s Agricultural Production ..................................................................... 3-1 C. China’s Agricultural Trade .............................................................................. 3-4 D. Potential Food Security Shocks ....................................................................... 3-6 E. China and Food Security Concerns ............................................................... 3-10
4. Food Security in India ............................................................................................. 4-1 A. Summary of India’s Agriculture ...................................................................... 4-1 B. India’s Agricultural Production ....................................................................... 4-1 C. India’s Agricultural Trade ............................................................................... 4-3 D. India and Food Security Concerns .................................................................. 4-4
5. Will There Be a Food Crisis in 2050? ..................................................................... 5-1 A. Global Food Security Conclusions .................................................................. 5-1 B. Future DARPA Investment ............................................................................. 5-1
References ....................................................................................................................... A-1 Abbreviations ...................................................................................................................B-1


1-1
1. Background
A. Malthusian and Neo-Malthusian Thought The question about whether the limited amount of resources of the planet will
eventually limit the population of humans has been asked and studied throughout human history. Most famously, it was proposed and studied by the economist and English cleric Thomas Malthus in his Essay on the Principle of Population in 1798. His ideas spawned an entire discipline of thought called Malthusian theory, which is still debated today. Malthus’s observations of exponential human population growth combined with fears of environmental crises spurred Paul Ehrlich, a biologist at Stanford University, to write the controversial book The Population Bomb in 1968. Ehrlich proposed that in the coming decades of the 1970s and 1980s, humanity would be faced with mass starvations based on environmental stress and limited food supply. Today, the threats of climate change, water scarcity, lack of arable land, energy crises, and seemingly endless human population growth continue to fuel concern that a “Malthusian disaster” is looming in the later part of the 21st century.
Malthus’s original theory concerning food supply and human population observed that population tends to increase exponentially while its means of subsistence tends to grow only linearly (Friedrichs 2014). A population is therefore limited by the amount of food it is able to obtain. As the human population continues to grow exponentially, the gap between it and the amount of food needed to sustain the population increases such that the amount of food intake per capita decreases. Since social inequality is a characteristic of human populations, and the food supply is not equally distributed over the whole population, the poorest of the poor usually suffer the most when there is a lack of food. A redistribution of food supplies to assist the needy can temporarily ward off hunger in the poor populations, but eventually stress on human populations would result in what Malthus termed “vice and misery.” In other words, overpopulation would lead to food shortages and stress the growing population, resulting in sinful behavior, potential famines, war, and pandemics, typically in the poorest segments of a population.
In the pre-industrial and pre-global human society under which Malthus was making his observations, Malthus’s ideas appear to be supported. Human existence may be similar to that of other animal species in that it is limited by the resources a group can obtain. In population biology, this concept is known as the carrying capacity of a species. For example, deer populations are much limited by the amount of food they can obtain locally in a forest, and their carrying capacity is determined by that amount of food. Malthus,

1-2
however, failed to consider characteristics of humans that make their carrying capacity more fluid and dynamic than other species. First, Malthus did not take into account the ability of humans to shape their environment through technological change, which has allowed humans to prosper despite exponential population growth, develop more than linear growth in food production, and establish a global society where food and wealth can be traded. Second, humans have the ability to make social choices that can alter their carrying capacity. For example, humans can change their lifestyles, such as by switching to a vegetarian diet, which can reduce the amount of resources needed to sustain the food supply of a population and increase a population’s carrying capacity.
Ultimately, the dynamic nature of the human carrying capacity has prevented a Malthusian disaster to this point, but it is possible that the fruits of modern industrial society may be under strain (Duncan 2007; Ehrlich and Ehrlich 2013). Many neo-Malthusian theories have sprouted in which the side effects of our modern globalized society are contributing to an eventual collapse of food resources. For example, the effects of polluted resources, land degradation, and decreasing biodiversity on the environment may eventually affect human food production. Climate change and energy scarcity could similarly contribute. In extreme Malthusian thought, called eco-scarcity theory, these environmental pressures in combination with human population growth and unequal access to food resources can lead to social unrest (Bellemare 2014). Political and social upheaval due to the migrations of human populations is possible, and it has been postulated that in some cases, states can collapse and violent conflict result.
B. Food Security The concepts of food security and insecurity have different definitions depending
on the usage and intended purpose. In the civilian world, these concepts are equated with world hunger, and by this definition the world has never been food insecure and will continue to be food secure for the future. The Food and Agricultural Organization (FAO) of the United Nations (UN) has been collecting world agricultural statistics since the end of World War II, using these data to study and implement policies to reduce hunger according to specified targets. The metric to describe hunger developed by the FAO is called the prevalence of undernourishment (PoU), which is the fraction of a population that is undernourished according to a per capita Minimum Dietary Energy Requirement (MDER) available to the population. The FAO has also developed a definition of food security (FAO, IFAD, and WFP 2015):
A situation that exist when all people, at all times, have physical, social and economic access to sufficient, safe and nutritious food that meets their dietary needs and food preferences for an active and healthy life. Based on this definition, four food security dimensions can be identified: food availability, economic and physical access to food, food utilization and stability over time.

1-3
A population that achieved food security would therefore have a PoU of zero.
The Department of Defense (DOD) does not have a formal definition of food security (GAO 2010), but it does have an interest in the topic. Food security for the DOD can, in addition to reflecting the UN definition, involve food safety. Ensuring safe and nutritious food for warfighters is an important thrust for DOD, but this study concerns itself with the UN definition of food security and the potential challenges that it might present to DOD. The DOD recognizes that food security (the UN definition) is an important part of maintaining governmental stability and legitimacy, especially in commands where food security is low, such as Southern Command (Bankus and Ramirez 2009) and Africa Command.1
C. Population Growth and Food Price Spikes The 21st century has seen a renewed interest in current and future global food
supply and food security. The interest has been mainly fueled by the rapid economic growth in many emerging national economies, such as China, India, and Brazil. Correspondingly, these same nations are among the most populated on the planet, and many researchers have asked whether the world’s food production will be able to keep up with the increased demands from these populations. These countries’ dramatic economic growth and their purported graduation to a “Western-style diet” of greater meat consumption and per capita caloric intake (Pica-Ciamarra and Otte 2009) have further encouraged the perception that the world food supply will not be able to keep up with demand in the future. Also, there is a perception that the prices of agricultural commodities are subject to increased volatility, and these spiking food prices may be the cause of further food crises in impoverished areas of the world. In particular, prices spiked dramatically in 2008; the underlying causes and potential future trends of agricultural prices are still debated (Alexandratos 2008; Gilbert and Morgan 2010). Rising petroleum prices, as well as supply and demand “shocks,” are attributed to the 2008 crisis. Shocks are defined as unforeseen or infrequent events that affect the global food market, such as weather-induced crop failures or increasing food demands of the emerging economies described above. Severe shocks can become widespread and affect global prices such that nations that depend on food imports can become severely hampered. The potential effects of climate change and other environmental factors such as sustainability will have a complex effect on the world food supply. The uncertainties of the contributions of the above factors to the global food market and its ability to feed a growing world population have alarmed decision-makers and have renewed an interest in global food security.
1 www.africom.mil/NewsByCategory/transcript/8881/transcript-general-ham-speaks-at-ndu-food-
security, last accessed 12 April 2016.

1-4
Food prices are increasingly dependent on a global food trade market rather than local effects. Globalization of the food trade has led to the idea of a Global Food System (GFS), where the global food trade can be represented as a network that is mapped based on FAO agricultural trade data. To understand the effects of shocks on the GFS, researchers are undertaking studies to map the GFS and perform network analyses to perturb the network and predict the effect on food production, trade, and prices (Ercsey-Ravasz et al. 2012). Researchers have now taken the GFS and subjected it to extinction modeling (Foti, Pauls, and Rockmore 2013), where a major node in a network, such as the United States, is removed for a given trade network, such as the global maize trade, and the network is then modeled to see how it adjusts (Puma et al. 2015). Extinction of a major node has effects all the way down to the receivers of food imports and aid, which are the food-insecure nations of the world. Other studies also indicate that the GFS and food prices are increasingly sensitive to food shocks (Suweis et al. 2015), and even the most food-secure nations are becoming increasingly dependent on trade in the maintenance of their food supply (Porkka et al. 2013). In the past, food-secure countries such as the United States and those in Europe were self-sufficient by producing enough food for their own populations and exporting surpluses. Today, these same countries are spurning self-sufficiency and choosing to participate more in agricultural trade, which can open these nations up to the effects of food shocks and make them less food secure.
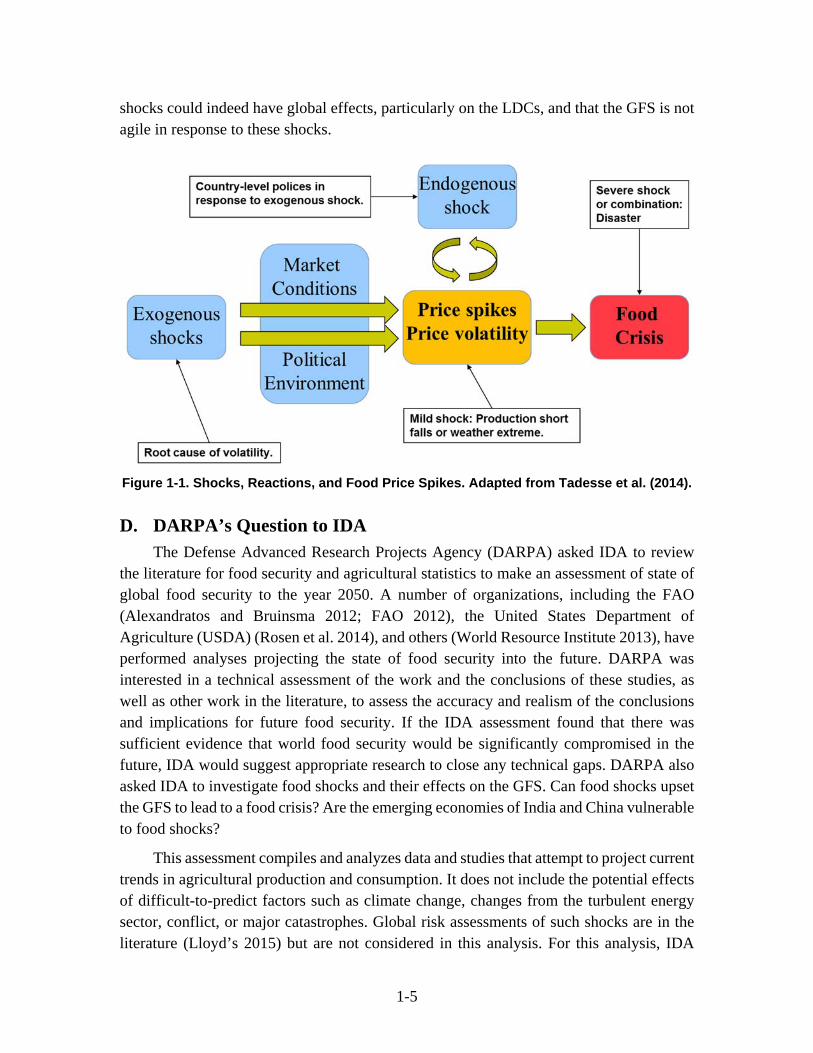
Figure 1-1 shows current thinking about how shocks and market forces of the GFS can combine to result in food price spikes and even a “food crisis” (Tadesse et al. 2014). An exogenous shock might occur to the GFS that, depending on the current world market and political conditions, could lead to a change in food prices. Individual nations then respond to protect their domestic food markets with their own individual policies, such as restrictions on food exports and imports (Andersen and Nelgen 2012). These “endogenous shocks” can then amplify the initial exogenous shock until it results in a severe shock to the GFS where prices and food availability increase and decrease, respectively, to the point that large populations are severely affected, resulting in a food crisis.
Researchers are now working with real-world data to validate the ideas of the above model by tracing the effects of a past food supply shock on the GFS (Gbegbelegbe et al. 2014; Chung et al. 2014). For example, in 2012 a severe heat wave resulted in the U.S. maize yield decreasing by 29%. The worldwide yields of maize from that year were also reduced by 6%. The United States had less surplus maize for export, and other maize producers, such as China, could not increase production in a timely manner to make up for a global reduction in maize supplies. (Note that the growing season for maize is the same for the United States and for the major maize producers in the Northern Hemisphere.) The analysis indicated that the Least Developed Countries (LDCs) of the world, which depend on the global food trade for their food supply, had a reduction of maize consumption between 5% and 10% for 2012. From this study it could be gleaned that localized food
1-5
shocks could indeed have global effects, particularly on the LDCs, and that the GFS is not agile in response to these shocks.
Figure 1-1. Shocks, Reactions, and Food Price Spikes. Adapted from Tadesse et al. (2014).
D. DARPA’s Question to IDA The Defense Advanced Research Projects Agency (DARPA) asked IDA to review
the literature for food security and agricultural statistics to make an assessment of state of global food security to the year 2050. A number of organizations, including the FAO (Alexandratos and Bruinsma 2012; FAO 2012), the United States Department of Agriculture (USDA) (Rosen et al. 2014), and others (World Resource Institute 2013), have performed analyses projecting the state of food security into the future. DARPA was interested in a technical assessment of the work and the conclusions of these studies, as well as other work in the literature, to assess the accuracy and realism of the conclusions and implications for future food security. If the IDA assessment found that there was sufficient evidence that world food security would be significantly compromised in the future, IDA would suggest appropriate research to close any technical gaps. DARPA also asked IDA to investigate food shocks and their effects on the GFS. Can food shocks upset the GFS to lead to a food crisis? Are the emerging economies of India and China vulnerable to food shocks?
This assessment compiles and analyzes data and studies that attempt to project current trends in agricultural production and consumption. It does not include the potential effects of difficult-to-predict factors such as climate change, changes from the turbulent energy sector, conflict, or major catastrophes. Global risk assessments of such shocks are in the literature (Lloyd’s 2015) but are not considered in this analysis. For this analysis, IDA

1-6
reviewed the appropriate literature and studies and used agricultural production and consumption data gathered by FAO into the FAOSTAT database2 to assess future food security. Literature studies were compared to determine if a consensus projection of future food security could be developed.
2 http://faostat3.fao.org/home/E, last accessed 12 April 2016.

2-1
2. Assessment of Global Food Security
A. UN FAO Assessment of Global Food Security
1. Food Insecurity Monitoring by the FAO
The UN has led several multinational initiatives with the goal of lessening or eradicating hunger in all countries. The World Food Summit in 1996 and the Millennium Development Goals have set goals to eradicate or halve, respectively, the number of undernourished people in the world by 2015.3 The FAO monitors progress toward these goals by analyzing food security data, which it collects, and publishes a yearly report (FAO, IFAD, and WFP 2015). Similarly, to guide agricultural policy decisions, the UN and FAO also publish projections of agricultural production, consumption, and undernourishment into the future. The latest projection, which was updated in 2012, estimates these quantities to the year 2050 (Alexandratos and Bruinsma 2012). Data from these analyses, as well as agricultural and human population projections from FAOSTAT, are used in the following analysis. Studies by the USDA and others in the literature base themselves on the FAO’s data and general methodology of determining agricultural production and consumption. As will be seen in the following sections, however, the FAO methodology has drawn criticism from the food security community.
2. FAO Metrics for Global Food Security
The main metric that FAO employs to measure food security of a population is the prevalence of undernourishment (PoU), which is the probability that a random individual of a population consumes fewer calories than what is required for an “active and healthy life.” The methodology that FAO employs to calculate PoU for a population is described in detail in Annex 2 of the FAO report The State of Food Insecurity in the World 2015 (FAO, IFAD, and WFP 2015). Briefly, the PoU depends on three quantities: the Dietary Energy Consumption, the Minimum Dietary Energy Requirement (MDER), and the coefficient of variation. If the Dietary Energy Consumption for a population is less than the MDER, the population is considered undernourished.
The Dietary Energy Consumption is loosely equated with the amount of dietary calories that are available to an individual in a population. There is currently no feasible way of surveying large populations about their caloric intake, so FAO calculates a proxy
3 www.fao.org/wfs/index_en.htm, last accessed 13 April 2016; www.un.org/millenniumgoals/, last
accessed 13 April 2016.

2-2
metric to estimate the caloric intake of the population. Countries report data on agricultural production and trade of agricultural commodities to the UN. From these data, Food Balance Sheets (FBS) are calculated. FBS for a country takes into account agricultural production, trade, and non-food (e.g., animal feed) uses to calculate a per capita of caloric intake:
FBS = (Production + Trade) – (Food Waste + Non-food Uses)
The above equation estimates the food available to a population and is the proxy metric FAO uses for caloric intake of the population.
FAO recognizes that individuals of a population do not all receive equal access to food and uses the coefficient of variation parameter to estimate this imbalance. The coefficient of variation for a population is estimated from available individual household surveys that provide information on individual consumption patterns.
The required caloric intake for a population (MDER) is the caloric requirements of a population with an assumed physical activity level. Physical activity level is determined to be a function of the basic metabolic rate of an individual added to the requirements of a certain level of physical activity. The basic metabolic rate of an adult at rest, such as an office worker, is 1300–1700 kcal/day. The physical activity level and basic metabolic rate depend on the demographics (age, sex, body weight of population) and physical activity of a particular region. For example, developing countries tend to have a younger population than the developed world, and therefore MDER can be lower than the developed world. It can be argued, however, that physical activity is higher in the developing world than the developed world, which would contribute to a higher MDER in the developing world. Examples of FAO’s calculations of MDER are given in Table 2-1.
The FAO PoU has been criticized for not adequately reflecting the state of food security (de Haen, Klasen, and Qaim 2011). Many assumptions are made in the calculation of the metric, such as the amount of physical activity of the population and whether the data used to calculate the coefficient of variation adequately reflect the distribution of food in a population. FAO recognizes these shortcomings and has been attempting to improve these assumptions through household surveys. Other groups have developed their own metrics for measuring food insecurity, and these metrics are tuned for a specific application such as calculating food insecurity on a more local level or emphasizing food access, rather than the food availability like the PoU. There are very few food security metrics that are simultaneously global, local, real time, and predictive in both the short and long term. The PoU has recognized flaws, but it is an adequate metric for measuring food security on a global and long-term scale (Jones et al. 2013) that needs perhaps further development to give a clearer picture of global food security.

2-3
Table 2-1. Examples of MDER of Developed and Developing Countries
Country
MDER (kcal/person/day)
Developed
USA 1980
UK 1940
Russia 1950
Japan 1890
Undeveloped
Guatemala 1690
Niger 1700
Cuba 1910
Vietnam 1820
Source: Data taken from FAOSTAT.
MDER = Minimum Dietary Energy Requirement.
FAO produces projections of food availability and agricultural production by using
current and past trends of production and availability, UN projections of population growth, and gross domestic product (GDP) projections from the World Bank. For food availability, FAO uses population and GDP projections to calculate demand using Engel demand functions, which is a common method to describe how household good expenditures depend on income (Chai and Moneta 2010). The resulting analysis is then reviewed by experts of a particular country or region for reasonableness. Projections of agricultural production involve analysis of past trends of crop production and livestock production, as well as expert interpretation. Finally, projections of future land use and yield levels are based on UN studies of rain-fed and irrigated land yields such as the Global Agro-Ecological Zone study (Fischer, Byerlee, and Edmeades 2011).
What should be emphasized is that the FAO’s projections are based on available data that may or may not be complete or accurate. FAO pieced together data from several studies and databases; the injection of expert judgement into the process may introduce more subjectivity and assumptions. The authors claim that this complexity in their method makes their analysis labor intensive and prevents them from running their projections with alternative sets of assumptions, variables, and future scenarios. They therefore present their projections as a single “most positive” scenario that does not take into account more complex future scenarios involving climate change, disasters, or crop uses for biofuels.
3. Global Food Availability and PoU in 2015 and 2050
Figure 2-1 and Figure 2-2 show FAO calculations of food availability to the world and to various subsections of the world. What is immediately apparent in Figure 2-1 is that

2-4
food availability in the developed world4 has remained relatively flat throughout the period. Currently, each person has approximately 3,400 kcal/person/day available in 2015, which is about 1,500 kcal above the MDER for the developed world. Food availability to the developing world is much less than that of the developed and tracks with the trends for the entire world. On average, the developing world has about 2,700 kcal/person/day. Food availability has generally improved for the developing world since 1969, and the improvement has been dominated by emerging nations like China, Brazil, and Mexico (3,108, 3,263, and 3,072 kcal/person/day in 2013, respectively). FAO projects that progress should continue for the developing world and average greater than 3,000 kcal/person/day by 2050 (Figure 2-1).
Figure 2-1. Food Availability in the Developed and Developing World. Data from
Alexandratos and Bruinsma (2012) and FAOSTAT.
Figure 2-2 shows that Latin America, East Asia, and North Africa have made the most
progress in food availability in the developing world, while Sub-Saharan Africa and South Asia lag. South Asia is dominated by the population of India, which continues to lag other emerging nations, with only 2,459 kcal/person/day available to its citizens. India’s lack of progress is a surprising case, considering its status as an emerging world power.
4 The developed world consists of the European Union, Australia, Canada, Israel, Japan, New Zealand,
Russian Federation, South Africa, and the United States.

2-5
Figure 2-2. Food Availability in Different Regions of the Developing World. Data from
Alexandratos and Bruinsma (2012) and FAOSTAT.
4. Prevalence of Undernourishment
Despite making the World Food Summit goals and Millennium Development Goals in 2015 (green line in Figure 2-3), the world still has areas where almost 25% of the population is undernourished, such as Sub-Saharan Africa, and worldwide 780 million are undernourished (12.9% of the population).
Figure 2-3. Prevalence of Undernourishment Data Trends to 2016. Taken from FAO, IFAD,
and WFP (2015).
By 2050 the FAO projects that the PoU will continue to plummet despite increases in
world population. Worldwide, 320 million will remain undernourished in a projected population of 9.7 billion (Figure 2-4). Sub-Saharan Africa and South Asia will continue to lag the world in PoU to 2050. For example, India, despite its economic status as an emerging nation, remains strangely “undeveloped” by this metric. India’s food security will be discussed at length in Chapter 5.

2-6
Figure 2-4. Top: Projected Number of Undernourished in 2030 and 2050. Bottom: Projected
Percentages of Undernourished in 2030 and 2050. Adapted from FAO (2012).
FAO gives two major reasons why the PoU is expected to continue to fall by 2050.
First, the GDP of many developing world nations is expected to improve such that they are able to acquire more agricultural products on the market. Currently, the GDP of the developed world is 12 times that of the undeveloped. By 2050 the difference is expected to be only 6 times. However, many developing nations (45 of 98 in the projection) are expected to have GDPs of less than $3,000 per capita in 2050. So, some LDCs are expected to continue to lag in food security by 2050. Second, the rate of increase in global population, which had been growing as at 2% rate per annum during the 20th century, is expected to flatten by mid-21st century (Figure 2-5). Population growth rate by 2010 was 1.4% per annum, and FAO estimates that the growth rate will be down to 0.4% in the 2040–2050 decade. The downturn in global population growth, combined with the fact that many emerging nations have already improved their food security metrics, will lead to the decreased demand for agricultural products by 2050.

2-7
Figure 2-5. UN Population Data and Projections. Data plotted from FAOSTAT
The UN assumes three fertility variants in its population projections—high, medium,
and low (UN, Department of Economic and Social Affairs, Population Division 2015). Medium assumes most households converge to 1.85 children per woman; the low and high variants assume 0.5 children below and above that value, respectively. Plotting the different variants gives vastly different projections of future population (Figure 2-6). In the high variant, the population growth rate continues as it was in the 20th century; in the low variant, population actually decreases by the end of the 21st century. High- and low-variant projections vary by 20% in 2050 (8.7–10.8 billion). Also, as Table 2-2 shows, subsequent revisions to UN population projections are trending upward. The FAO uses the medium-fertility variant in its food security projections (Figure 2-6, blue trace). The UN medium-variant population projection is a likely future for the world population, but if fertility rates end up higher in the future (high variant), or if future population projections continue to trend upward, the FAO’s assertion the PoU will continue to decrease in the future will be less likely.
Figure 2-6. World Population Projections with Three Different Fertility Variants.

2-8
Table 2-2. Revisions of UN Population Projections
Revision 2050 2100
2015 Medium Variant 9.7 billion 11.2 billion
2010 Medium Variant 9.3 billion 10.12 billion
2008 Medium Variant 9.15 billion 9.2 billion
5. Shifting Diet Structure
FAO also performed an analysis to project the source of calories for populations now and in the future for the developed (Figure 2-7) and the developing (Figure 2-8) world. What is immediately apparent is that cereals (wheat, corn, etc.) make up the vast majority of the diets of both the developed and the developing world. Cereals currently constitute 53% of the developing world diet, but that is expected to fall slowly to 47% by 2050.
The main difference between the caloric source in the developed and developing world is the high proportion of meat in the diet of the developed world (Figure 2-7). The developed world consumes 80 kg/person/year of meat, while the developing world consumes only 30 kg/person/year. The FAO projects that the amount of meat that the developing world will consume will increase to greater than 40 kg/person/year in 2050. Some see these trends indicating that the developing world will “graduate” to a more Western diet and that the developing world is undergoing a “Livestock Revolution” (Pica-Ciamarra and Otte 2009). These trends in meat consumption along with the projected increase in human population in the 21st century have led some to question whether the world can sustain this level of meat consumption predicted to occur in the developing world (Wright et al. 2012).
Figure 2-7. Distribution of Calories in the Developed World. Data taken from Alexandratos and Bruinsma (2012) and FAOSTAT.

2-9
Figure 2-8. Distribution of Calories in the Developing World. Meat consumption (orange
trace) is expected to increase for the developing World. Data taken from Alexandratos and Bruinsma (2012) and FAOSTAT.
FAO dissected its projections of meat consumption and found that the trend of
increased meat consumption may not be as pronounced as first thought. Figure 2-9 shows the meat consumption projections for the developing world as a whole (red trace) and the developing world (minus China and Brazil). As can be seen, much of the increase in meat consumption in the developing world can be traced to those two countries. In the FAO’s view, China and Brazil have already graduated to a mostly developed world level of food availability, and FAO therefore concludes that the livestock revolution may have already occurred in these countries. On the other hand, India has had very little increase in demand for meat, which may be due to religious or cultural factors. The livestock revolution has so far not occurred in India and may not at all. For these reasons, it may be simplistic to assume that the rest of the developing world may adopt a Western diet.
Figure 2-9. Meat Consumption Projections for the Developed and Developing World. Data
taken from Alexandratos and Bruinsma (2012) and FAOSTAT.

2-10
6. Room for Agricultural Expansion
FAO then asked how the world would support the increased demand for agricultural products. Agricultural production can grow by increasing arable land for additional crops or livestock, increasing cropping intensity, or increasing yield. FAO assembled data of arable land in the world and area harvested in the world, and calculated crop yields for certain commodities. The FAO projects that expansion of agriculture by using more arable land for agriculture is possible in certain areas of the world such as Africa and in Latin America, but it is difficult or impossible in some areas like East Asia (China) and the Near East/North Africa (Table 2-3). In most cases, production increases in China will need to come from yield increases equivalent to yield increases that have occurred over the past 45 years (1961–2007). South and East Asia would need to increase yields by 92% and 85%, respectively. This may be a difficult task for certain areas of the world (see Chapter 4 for more detail). For example, China has already increased yields and cropping intensities to what is considered technological and resource limits, and it is not clear how it could increase yields without major technological advancement.
Table 2-3. Sources of Growth in Crop Production. Adapted from Table 4.4 in Alexandratos
and Bruinsma (2012).
Area of World
Arable Land expansion (%)
Increased Cropping
Intensity (%) Yield Increases (%)
1961–2007
2007–2050
1961–2007
2007–2050
1961–2007
2007–2050
All Developing Countries
23 21 8 6 70 73
World 14 10 9 10 77 80
Sub-Saharan Africa 31 20 31 6 38 40
Near East/N. Africa 17 0 22 20 62 80
Latin America/Caribbean
40 40 7 7 53 53
South Asia 6 6 12 12 82 92
East Asia 28 0 -6 15 77 85
7. IDA Assessment of the FAO Study
We emphasize that the authors state that these estimates for increases in arable land, cropping intensity, and yield are based on incomplete and unreliable data and should be used as rough guides to potential increased agricultural production. If that is the case, we be should wary of the authors’ claims that “it seems that at the global level there should be no major constraints to increasing agricultural production by the amounts required to satisfy additional demand generated by population and income growth to 2050” (FAO
2-11
2012). The authors are satisfied, despite suspicions of the data quality, that there is sufficient unused arable land and potential of agricultural expansion through yield increases and cropping intensity on a global scale to overcome any shortcomings on the local scale. They acknowledge that there will be food insecurity locally in 2050. For example, the GDP in some areas of sub-Saharan Africa will not permit food security in 2050, and there may be little area for expansion of agricultural production on the local scale in some areas of Asia.
It is unclear to IDA if the combination of solely using this “positive” future scenario and the many assumptions and subjective inferences, along with dubious data that have gone into the FAO analysis, have conclusively shown that the world will be reasonably food secure by 2050. That being said, there are no indications from this FAO study that the world is heading for a Malthusian agricultural disaster by 2050. The study has reasonable data to indicate that there is room for agricultural expansion in the future. The extent to which the world will have to expand agricultural production depends on how the world’s population expands and whether developing countries mature economically and increase their GDP. It may be impossible at this time to gather more accurate data to definitively answer the question of how food secure the world will be in 2050.
B. USDA Economic Research Service Assessment
1. Methodology
The USDA assessment attempts to forecast the food security for 76 low- and middle-income countries concentrated in Sub-Saharan Africa, Latin America and the Caribbean, North Africa, and Asia between 2014 and 2024 (Rosen et al. 2014). The 76 countries were chosen since they had been identified by the World Bank as receiving food aid in the recent past or have had issues with food insecurity.
The USDA assessment calculates two measures of food insecurity—a nutrition gap and a distribution gap. The nutrition gap measures the security of the country as a whole in a manner similar to the FAO’s PoU indicator, while the distribution gap measures the lack of distribution of the food resources of a country. A nutrition gap exists in a country when the food consumption is less than a daily intake standard of 2,100 calories per capita per day (depending on the energy requirements of a particular country). Food consumption is calculated similarly to the FAO PoU metric in that it is domestic food supply minus non-food uses. The USDA daily intake standard is based on the FAO’s survey and calculation of MDER, which makes the USDA nutrition gap generally similar to the FAO’s PoU. The USDA distribution gap is based on the calculation of a nutrition gap in deciles of the economic income groups of a population. When less than 10% of the poorest decile of a population is food insecure, USDA considers the country food secure. The USDA model uses FAO food production, consumption, yields, and land-use data from FAOSTAT. The

2-12
difference between the FAO and USDA models appear to be how they treat and apply various economic indicators. Also, the USDA model emphasizes food distribution gaps and reports the number of food-insecure nations to the year 2024; FAO tries to project to 2050.
2. USDA Food Security Assessment
The USDA projects that 598 million people will be food insecure in the assessed countries in 2024, which is larger than that calculated for 2014 (490 million). Twelve countries will suffer from nutrition gaps in 2024, but 40 will see a distribution gap. Like the FAO projection, the majority of food-insecure countries are located in sub-Saharan Africa, whereas Asian, Latin American, and Caribbean nations are seeing improved security in 2024. India, despite being secure by the nutrition gap measure, will be food insecure by the nutrition gap indicator in 2024, in agreement with FAO’s assessment of India’s food security.
C. World Resource Institute Assessment The WRI assessment assumes the food-insecure nations in the FAO projections adopt
a Western-style diet and achieve consumption of 3,000 kcal/person/day in 2050. WRI then calculates that there will be a food gap by 2050, such that the world will need to increase production by 65%. It then asks what sustainable solutions could be implemented to close the gap and comes up with four solutions:
1. Reduce obesity in the developed world.
2. Reduce food loss and waste.
3. Reduce excessive consumption of animal products.
4. Control human population by achieving replacement-level fertility.
The WRI assessment is skeptical of the FAO’s conclusions that future increases of production will occur through yield increases and increased cropping intensities. WRI assumes that agricultural production would need to expand by 2050 by the same amount it expanded in the past 44 years. In the past, agricultural expansion was fueled by the “Green Revolution,” where chemical fertilizers, irrigation methods, and the scientific breeding of seeds stirred increases in agricultural production (Khush 2001). WRI does not see this occurring without a new infusion of agricultural technologies.
D. Comparison of Assessments Taking different approaches and emphasizing different outcomes, the three studies
summarized in this report attempt to project agricultural production and consumption, along with economic and population growth, to describe the state of future global food

2-13
security. The FAO assessment takes an optimistic approach to projecting these future trends. The main indicator of the FAO assessment, PoU, appears to be the leading indicator of global food security, but it is not without criticism. Researchers have purported that it is too simplistic a measure, in that it does not take an all-encompassing or a multidimensional approach to food security (Jones et al. 2013). The PoU has also been accused of not being able to describe local or real-time issues of food security. The USDA assessment takes an approach similar to that of the FAO in measuring nutrition gaps, but also tries to emphasize food distribution gaps among income classes of the countries that are studied. By emphasizing a food distribution metric, the USDA assessment is less positive than the FAO assessment of future food security. Finally, the WRI assessment uses an even less positive scenario of future agricultural demand trends by assuming that developing countries achieve a developed world diet. It updates the FAO analysis to emphasize that in 2050 there will be an agricultural production gap of 65%–70% that will need to be filled to feed a world population of 2050 and proposes ways to do this sustainably.
Studies that take the food production trends in the FAO assessment and calculate future food gap have been accused of misinterpreting the FAO analysis (Tomlinson 2013). FAO estimates future production, along with likely resource allocation and methodologies to achieve the production based on socioeconomic trends. It represents a likely future, not a policy agenda to meet a food gap to feed the future world population by 2050. The FAO assessment admits that it does not consider alternative scenarios, such as taking an approach of sustainability in the use of agricultural resources. For example, the FAO study assumes that it is likely that the rainforest will continue to be sacrificed for the current unsustainable methods of agricultural production.
The three assessments approach the future diet of the developing world in their assessments. The FAO assessment takes a conservative approach to future diets. It acknowledges that diets in the developing world are relying more and more on meat and vegetable oils, which require greater energy and resources to produce. In the case of much of the developing world, however, the switch to a Western diet has already occurred, such as with China. Where it has not yet occurred, it is less likely in the future to occur because of social and cultural forces, such as vegetarianism in India, for example. Other studies assume that economic maturity in the developing world will produce a Western-style demand for meat in the future (Wright et al. 2013), which may not be a correct assumption.
The main methodology that the FAO proposes the world will use to increase agricultural production in the future is increased yields and increased cropping intensity, especially for areas of the world that do not have adequate land resources for future agriculture expansion. The WRI assessment is critical of this assertion by the FAO, suggesting that it will require great technological innovations to achieve greater agricultural production through increased yields. This may in fact be the case—there are studies in the literature on world yield trends in many commodities, such as maize, wheat,

2-14
and soybeans, that show that current and projected yields of these crops are slowing (Ray et al. 2013).
All three assessments come up short in projecting the effects on the global food supply of less predictable variables, such as climate change, ecological disasters, or large crop failures to major breadbaskets. In addition, the carrying capacity of humans is dynamic, and how we choose to approach the future will affect the future food security. Social choices such as use of crops for the production of biofuels, the developed world adopting vegetarianism, or the developing world turning to the Western-style diet are aspects of the human carrying capacity. These global “food shocks” could conceivably alter many of these assessments. (DARPA, however, asked IDA to ignore the impacts of these unforeseeable shocks on the global food supply in the current assessment and concentrate on the current agricultural trends to assess the possibility of a Malthusian food security crisis looming for the world in 2050.)
Despite these difficult to predict food shocks, it appears to IDA that there should be enough worldwide agricultural production to ensure that the world population has adequate food supply for an “active and healthy life” in 2050. As the USDA assessment emphasizes and the FAO assessment acknowledges, food access and distribution are the major contributors to food insecurity in the future. In support of this idea, USDA projects that 40 nations will be insecure in 2024 due to their distribution gap metric. However, this number falls to 12 nations if the distribution gap is ignored and only the nutrition gap metric is applied. These numbers show that many nations will have an adequate food supply, as quantified by the nutrition gap metric, but social and economic factors prevent adequate distribution among the population. The FAO assessment supports these ideas by asserting that on a global scale, projection of production shows that there is enough future production to satisfy food demand in 2050, but on a local scale, in areas of the world that have not improved economically, food insecurity will persist.
3-1
3. Food Security in China
A. Summary of China’s Agriculture As was shown in the previous chapter, China’s economic and population expansion
has increased its demand for agricultural products. As we will see below, the population expansion led to an unprecedented increase in agricultural production within the country, but the rapid expansion of production has come at a cost. Resources for agricultural production are now strained within the country, and widespread pollution on land and groundwater is the result of fertilizer misuse (Zhang et al. 2013). Economic expansion has exacerbated the problem by polluting the environment with toxic metals. Almost all the arable land has now been occupied through habitation or used for agricultural production. China is forced to employ extensive double-cropping, which is the practice of growing two crops on the same land in the same growing season. Double cropping depletes soils of nutrients and therefore requires large amounts of chemical fertilizers, which further pollute groundwater supplies.
Further agricultural expansion to meet the needs of an expanding population is unlikely to come by expanding arable land use or other natural resources (Alexandratos and Bruinsma 2012). China has little arable land for further agricultural expansion. Human habitation is also encroaching into agricultural regions, further depleting available arable land. Unlike in the West, Chinese farms are small, with an average area of 7 m × 160 m (Zhang et al. 2013). The average citizen in China has 0.1 hectares per person; in the United States, this value is 0.7 hectares per person. Agricultural expansion in China is likely to come from increased yields, cropping intensity, and technological advancements, such as using resource-efficient cultivars and genetically modified organisms (GMOs).
DARPA was interested in the details of China’s agriculture, trade, and future prospects for food security since it appears from many reports that the country’s situation may be tenuous. IDA has used China’s agricultural statistics to create a more detailed picture of China’s food security situation today and its prospects for the future.
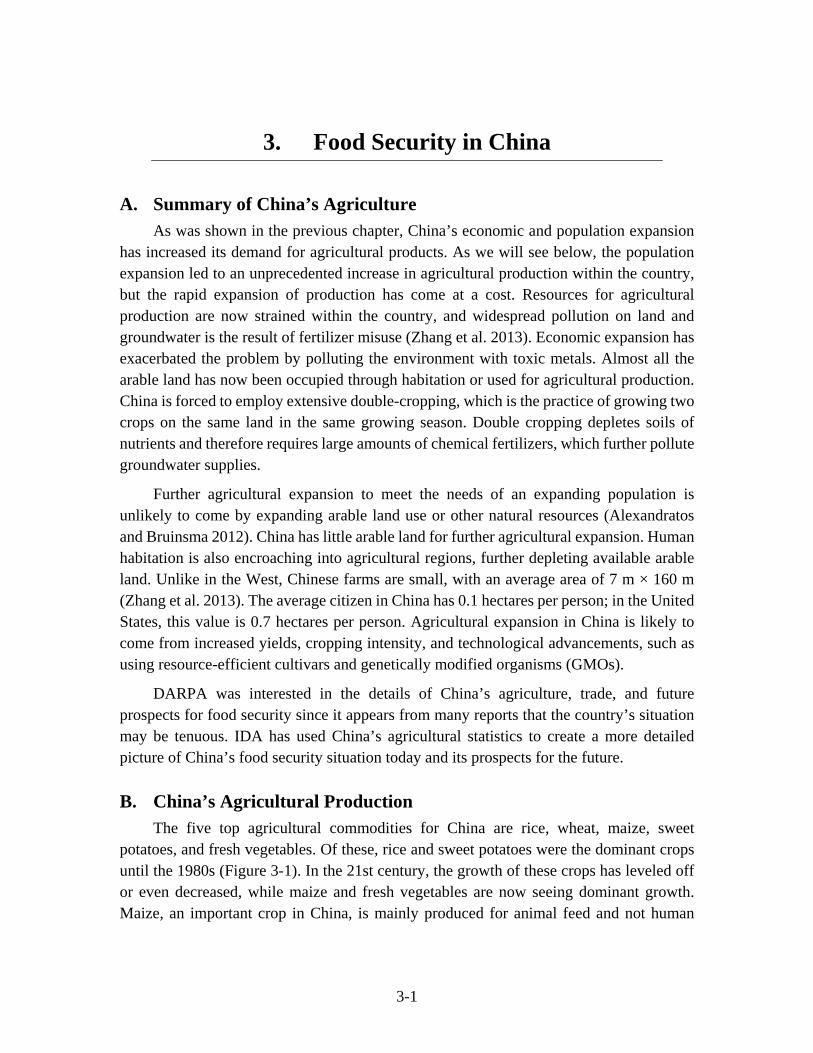
B. China’s Agricultural Production The five top agricultural commodities for China are rice, wheat, maize, sweet
potatoes, and fresh vegetables. Of these, rice and sweet potatoes were the dominant crops until the 1980s (Figure 3-1). In the 21st century, the growth of these crops has leveled off or even decreased, while maize and fresh vegetables are now seeing dominant growth. Maize, an important crop in China, is mainly produced for animal feed and not human

3-2
consumption. The increase in fresh vegetable production is seen as an indicator of China’s graduation to a more Western-like diet.
Figure 3-1. China’s Top Crop Commodities from 1961 to 2014. Data from FAOSTAT.
Further evidence of the shifting diet pattern is shown in China’s meat production
(Figure 3-2). China has been increasing meat production by 6.9% annually and produces over 50 million tons of pig meat per year, which is by far its greatest meat product. Chicken meat production has also been on the steady increase since the 1980s. Production of other meats such as cattle and mutton has been more flat in their growth rate. Demand for meat in China appears to be increasing overall.
Figure 3-2. China’s Meat Production from 1961 to 2014. Data from FAOSTAT.
Total yields across the major cereal crops have been increasing over the past several
decades (Figure 3-1). Some studies, however, indicate that yields of major cereal crops are starting to stagnate (Wei et al. 2015). Production per capita in China suggests that in many cases, consumption of many commodities per person is relatively flat. For cereals (top plot

3-3
in Figure 3-3), production per capita is flat for all cereals, while production is increasing dramatically for fresh vegetables, further indicating China’s emergence as a Western-style diet. Production of meat per capita, as well as vegetable oils, has generally been increasing since the 1980s (Figure 3-4). Vegetable oils appear to be leveling out during the last decade, but meat consumption is still rising. These data appear to contradict the FAO assessment that the livestock revolution in China has already happened (Chapter 2).
Figure 3-3. Production Per Capita of Cereals, Oil Crops, and Fresh Vegetables 1961–2014.
Data from FAOSTAT.
Figure 3-4. Production Per Capita of Vegetable Oils, and Meat 1961–2014. Data from
FAOSTAT.
3-4
C. China’s Agricultural Trade China’s emergence from isolation in the 1960s and its subsequent economic growth
has spurred a surge in international trade. The cereal trade in China expanded in the 1970s and 1980s (Figure 3-7). However, China’s import and export trends in the agricultural sector are difficult to predict (Gale 2015). Trends vary according to the policies of the Chinese government, which seeks to protect its own domestic agricultural market. In 2001, when China ascended to the World Trade Organization, where agricultural trade barriers are generally lowered, it was expected that China would increase imports of agricultural commodities, but this has not been the case. Chinese leadership insists on agricultural self-sufficiency and has enacted policies to reinforce this idea. Chinese government policy expects the country to be 95% self-sufficient in cereal grains. Chinese protectionist policies are in conflict with international agricultural market forces, and the country struggles with the tension between the two. Recently, China has changed policy and has now allowed a certain degree of supplemental trade in agriculture to close gaps in Chinese domestic supply of agricultural commodities. The United States has recently become the largest agricultural trade partner with China, being 24% of Chinese agricultural imports (Gale, Hansen, and Jewison 2015). It is the only sector of the economy where the United States has a trade surplus with China.
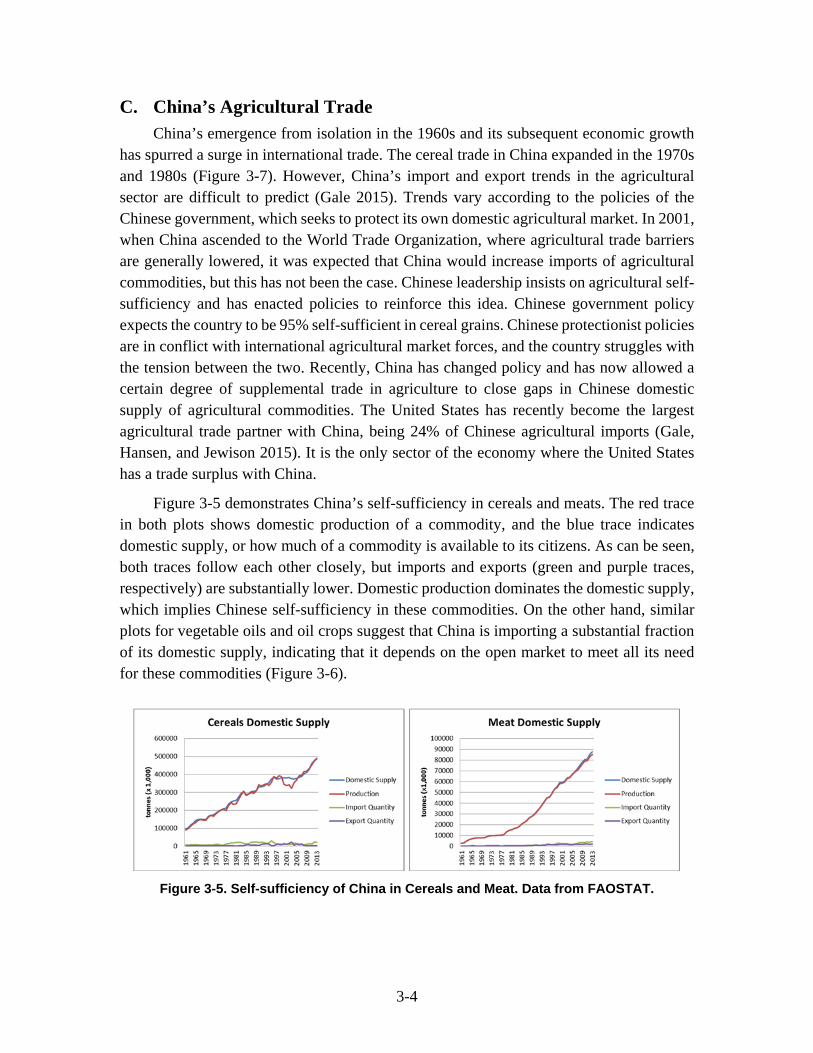
Figure 3-5 demonstrates China’s self-sufficiency in cereals and meats. The red trace in both plots shows domestic production of a commodity, and the blue trace indicates domestic supply, or how much of a commodity is available to its citizens. As can be seen, both traces follow each other closely, but imports and exports (green and purple traces, respectively) are substantially lower. Domestic production dominates the domestic supply, which implies Chinese self-sufficiency in these commodities. On the other hand, similar plots for vegetable oils and oil crops suggest that China is importing a substantial fraction of its domestic supply, indicating that it depends on the open market to meet all its need for these commodities (Figure 3-6).
Figure 3-5. Self-sufficiency of China in Cereals and Meat. Data from FAOSTAT.

3-5
Figure 3-6. Production and Domestic Supply Gap for Vegetable Oils and Oil Crops. Data
from FAOSTAT.
A close-up of imports and exports shows that for all commodities the current trend is
for increased imports with very limited areas of export for China (Figure 3-7 and Figure 3-8). From these data it appears that China is becoming a net importer of agricultural commodities.
Figure 3-7. China’s Imports and Exports of Cereals and Meat
Figure 3-8. China’s Imports and Exports of Vegetable Oils and Oil Crops
The above trends in China’s trade suggest that the nation may be relying on imports
more and more to supplement its agricultural commodity needs. If that is the case, there will be more demand from China in the future from the GFS. The GFS will then have to expand production or increase prices to compensate, which may leave some of the LDCs

3-6
more food insecure. But many researchers point out that China’s trade and agriculture policies are difficult to predict due to China’s conflicting policies of self-sufficiency and opening its agricultural markets to the world. Some have concluded that we may not be able at this point to predict trends in China’s agricultural demand and trade since China is facing unprecedented challenges in its agricultural systems (Gale 2015). Depending on how China’s gambles on agricultural production technologies pan out, it may become an overall importer, exporter, or self-sufficient nation in agricultural commodities.
D. Potential Food Security Shocks Given the precarious nature of China’s current food security, DARPA was interested
in the potential for shocks that could disrupt China’s food supply. To that end, IDA investigated China’s climate and agricultural resources that could be potentially disrupted and result in a shock that might affect its agricultural production.
China is a large country (9.6 million square kilometers) with a varied geography of mountains, valleys, plains, plateaus, and hills. China’s location in the southeast portion of the Eurasian landmass makes it susceptible to many climate influences (FAO 2012). Cold Siberian air masses in the north and subtropical monsoons in the south affect its climate. In the north and northwest of the country, the climate is arid; the west of China is dominated by desert, where livestock farming is prominent. The north-central area (dominated by the northern regions of the Huang River) is a semi-arid zone, where irrigated maize, wheat, and cotton are grown. The northeast zone, dominated by the Song-hua-Liao river basin, is more humid and better suited for growing irrigated wheat, maize, and soybeans. However, cold Siberian weather systems limit the growing season in this area of the country to the summer months. The south and southwest portions of the country have a subtropical climate. The monsoon climate of the south near the Yangtze and Zhu rivers allow double-cropping and a year-round growing season. Rice is the dominant crop of the south.
The vast majority of China’s crop production is irrigated (72%) rather than rain-fed, so fresh groundwater is an extremely important agricultural resource for China. In general, China holds 20% of the world’s population and contains the fifth largest internal renewable water resources in the world. China suffers from water scarcity and highly geographical disparity of water resources, however. On average, China has 2,079 m3/year renewable freshwater resources per capita, while the world averages 6,225m3/year (FAO 2012). Precipitation patterns concentrate water resources in the south of the country, but the majority of the irrigation-fed croplands and population are located in the north (Figure 3-9). The North China Plain, where much of the population and 30% of the agricultural production are co-located, is facing ever-increasing depletion of groundwater and water table decline. In the North China Plain the renewable freshwater per capita is only 293 m3, which is far below 1,000 m3/year, the water scarcity standards of the International Panel for Climate Change (Yang 2012). In the south, where 70% of the fresh groundwater

3-7
resources of the country are located, it is estimated that 90% of the groundwater is polluted, with 60% of the total seriously affected by industrial pollutants brought about by China’s rapid economic expansions of the past several decades (Qiu 2010).
Figure 3-9. China’s Climate and Regional Water Stress. Adapted from FAO (2012).
The Chinese government has implemented policies to alleviate the water disparity
and scarcity within the country. A canal project to direct water from the south to the north that will potentially transport 45 billion m3/year of water is expected to be completed by 2050 (Qiu 2010). Water efficiency initiatives for both drinking and irrigation have been encouraged (Qiu 2010; Yang 2012), but it is not clear if these policies will alleviate China’s ever-growing need for renewable water resources.
Arable land is the second resource that is becoming ever scarcer in China. The FAO assessment of agriculture in 2050 indicates that here will be no arable land in East Asia for expansion of agricultural production (Table 2-3). Figure 3-10 shows the amount of agricultural area in China, which is the area of land under permanent crops, temporary arable land, and permanent pastures. Despite China’s increased agricultural expansion since 1990, the agricultural area of China has not expanded. If the area harvested is plotted for the main cereal crops in China (Figure 3-11), it can be seen that wheat and rice crop areas are stagnating or decreasing over time, while the area for maize is increasing. China is essentially making trade-offs with its land resources since there is no additional land for

3-8
agricultural expansion. Any additional yield increases will have to come from increased cropping intensities.
Figure 3-10. China’s Arable Land from 1961 to 2014. Data from FAOSTAT.
Figure 3-11. Crop Area Harvested for the Three Main Cereal Crops 1961–2014. Data from
FAOSTAT.
The FAO’s Land Degradation Assessment (LADA) shows land use in East Asia
(Figure 3-12). The figure shows the concentration of agricultural land in the North China Plain. Magenta represents intensive use for cropland and livestock; orange and tan are used for grasslands and pasture for livestock. In the south, there is a mixture of high-intensity cropping and forest. The gray area in the west is bare, unused area for agriculture since it is dominated by desert.

3-9
Source: http://www.fao.org/nr/lada/images/stories/LUSMapsv1_1/high/lus_eap.jpg.
Figure 3-12. China’s Agricultural Lands and Use

3-10
E. China and Food Security Concerns It can be seen from the above data that China will definitely have challenges with a
lack of agricultural resources if it chooses to remain agriculturally self-sufficient as its population expands into the mid-21st century. Groundwater and arable land are becoming increasingly scarce, and double-cropping is already pervasive in China. The cropping intensity on irrigated land in China is 172% (FAO 2012), which means that almost all the irrigated cropland is used for two crops a season (less 28%). China has efforts to breed cultivars that are more water-efficient and tolerant of increased cropping intensity (Zhang et al. 2013). Despite import bans on GMO crops and the Chinese public’s disapproval of their use, the Communist government has made it a policy to dominate and innovate in the field (Larson 2015). There has even been suspicion of GMO seed theft that would send proprietary U.S. GMO corn technology to China (Edwards 2016).
Should China’s planned investments in technological solutions and more efficient water-management policies fail, it is possible that China will turn more and more to the global food market to make up for shortfalls. This may already be happening as China engages Africa, where there is much more land for agricultural expansion (Buckley 2013; Scoones, Cabral, and Tugendhat, 2013). Perhaps China will make up for these shortfalls through the modernization of African agriculture.

4-1
4. Food Security in India
A. Summary of India’s Agriculture Despite India’s status as a fast-growing and emergent economy, it lags many similar
economies in food security (Narayanan 2015). The 2015 FAO food insecurity assessment indicates that the PoU for India is 15.2 %, which is greater than the global PoU of 10.8%. Other so-called emerging economies, such as China and Brazil, have PoUs of 9.6% and 6.1%, respectively (FAO 2015). India has been addressing food insecurity by providing government subsidies of seed, fertilizer, and other agricultural resources to farmers (Hoda and Gulati 2013). But the main driver of food insecurity in the nation continues to be food access. Much of India’s rural population cannot achieve food security due to economic and social barriers to food. India is attempting to address this deficiency through legislation such as the National Food Security Bill, which seeks to reinforce the individual Indian’s right to food (Narayanan 2015).
As in China, India’s farms are mostly in the hands of resource-poor individuals. Farms are typically small (less than 4 hectares in area), and much of the individual population of India (49%) works at farming. About 65% of the operational farming area of India and 95% of the total farms are in this category. Most of the arable land in India has already been claimed for farming, and there is little land for additional expansion. Unlike China, however, there is room for expansion of agricultural production in the form of yield increases. Because many of the farms are in the control of resource-poor individuals, technologies spawned by the Green Revolution of the 1960s that have improved yields globally (Khush 2001) have not been leveraged by many farms in India.
B. India’s Agricultural Production India’s top agriculture commodity is sugarcane, followed by cereal grains of wheat
and rice. Vegetables and potatoes are also significant agricultural products. Sugarcane is mostly processed into commercial products and exported. Production in cereals has been steadily growing, with wheat production increasing at an annual rate of 4.2% from 1961 to 2013 (Figure 4-1). As expected, meat production in India is low compared with other emerging nations. India had produced approximately 6 million tons of total meat in 2013 (Figure 4-2) compared with China’s 70 million tons. Meat production is growing at a rate of 1% per year in India; in China, it is growing at nearly 7% per year.

4-2
Figure 4-1. India’s Top Agricultural Commodities. Data from FAOSTAT.
Figure 4-2. India’s Meat Production. Data from FAOSTAT.
Production per capita in India is also relatively flat compared with China. Cereal
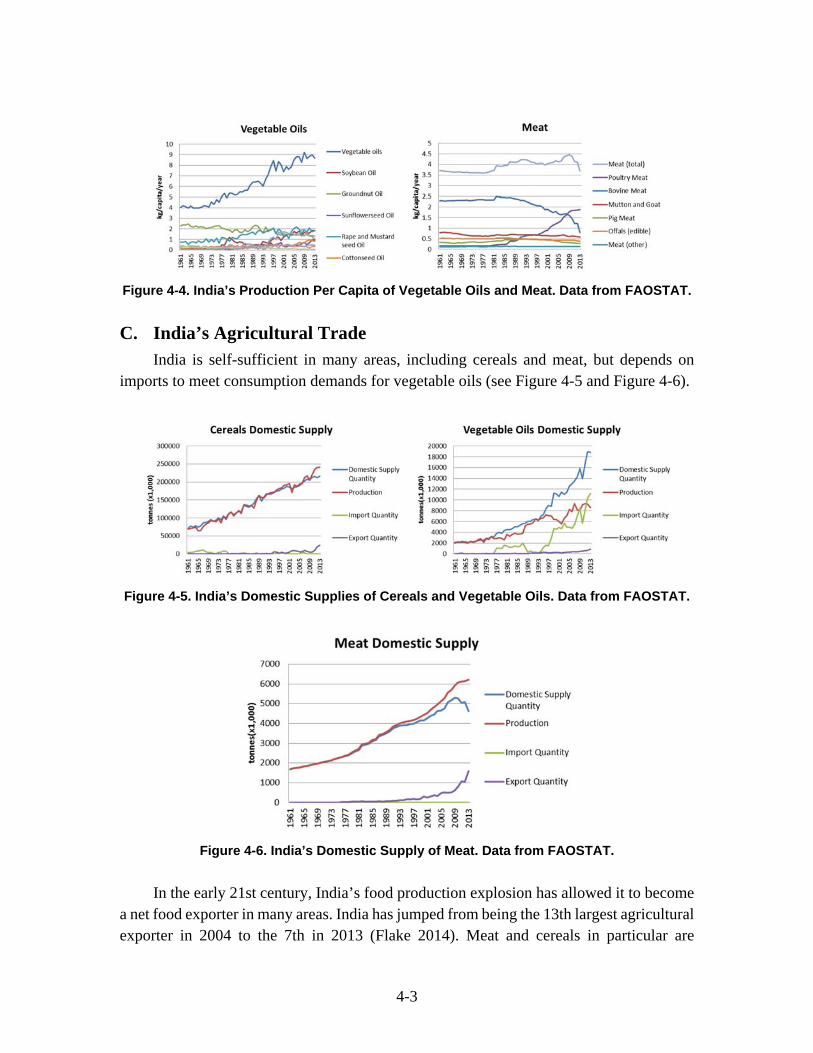
domestic supply has been flat since the mid-1980s for cereal grains (Figure 4-3) and, over the recent short term, has been decreasing for meat (Figure 4-4). The demand (domestic supply) for vegetable oil per capita, however, is increasing (Figure 4-5).
Figure 4-3. India’s Production Per Capita of Cereals. Data from FAOSTAT.
4-3
Figure 4-4. India’s Production Per Capita of Vegetable Oils and Meat. Data from FAOSTAT.
C. India’s Agricultural Trade India is self-sufficient in many areas, including cereals and meat, but depends on
imports to meet consumption demands for vegetable oils (see Figure 4-5 and Figure 4-6).
Figure 4-5. India’s Domestic Supplies of Cereals and Vegetable Oils. Data from FAOSTAT.
Figure 4-6. India’s Domestic Supply of Meat. Data from FAOSTAT.
In the early 21st century, India’s food production explosion has allowed it to become
a net food exporter in many areas. India has jumped from being the 13th largest agricultural exporter in 2004 to the 7th in 2013 (Flake 2014). Meat and cereals in particular are

4-4
contributors to India’s agricultural trade surplus (Figure 4-7). The majority of India’s agricultural exports are destined for the LDCs. Sugar, corn, and soybean meal are the major commodities that are exported to LDCs (Flake and Flake 2014).
Figure 4-7. Imports and Exports of Cereals and Meat by India. Data from FAOSTAT.
D. India and Food Security Concerns India’s climate is dominated by the monsoon seasons (FAO 2012). In the winter,
winds flow across India from the northwest, bringing cold and dry air. In the summer, the winds reverse direction and bring moist, humid air from the southwest. It is this summer monsoon that produces the majority of India’s rainfall. The country averages 1,170 mm per capita, but rainfall varies across the country. The northwest part of the country, which is relatively arid and subject to drought, averages 150 mm of rainfall per year. In the other extreme, the northeast part of the country, 10,000 mm of rain can fall in a period of a few months. The rest of India has very little variability in annual rainfall totals, and the temperatures are conducive to year-round agriculture.
Water resources for agriculture are relatively plentiful. In addition to India’s high rainfall totals, snowmelt and rainfall in the Himalayan mountains in the north provide the majority of water resources for the country. India also possesses the largest irrigation system in the world to feed its crops with the Himalayan runoff.
India possesses the second largest cropped area in the world (FAO 2012), where 52% of the total land area is arable. Arable land is distributed fairly evenly throughout the country, but as Figure 4-8 shows, the land area that contains the highest concentrated crop use is that which borders the Himalayan mountains.

4-5
Source: http://www.fao.org/nr/lada/images/stories/LUSMapsv1_1/high/lus_sas.jpg.
Figure 4-8. India’s Land Use

4-6
Several indicators point to the idea that India’s future food security may be assured.
The country has plentiful resources of land and water. Cropping intensity, which at 130% is quite low, suggests that India has adequate room for increased production this century through double-cropping and increasing the crop density. Modernizing India’s irrigation system for more efficient water use and taking advantage of achievements of the Green Revolution may increase yields of existing crops.
Meat consumption per capita in the country is not increasing and, in fact, is leveling off or decreasing. The decreasing demand for meat and increasing demand for vegetable oil may reflect India’s preference for vegetarianism and is one example where human’s carrying capacity is flexible based on social choice. India is capable of producing and exporting meat products, but chooses not to consume them internally. This trend in India may be an example of the danger of projections based on assuming that the entire world will adopt a Western-style diet of greater mean production (Alexandratos and Bruinsma 2012; FAO 2012).
India’s current growth into a net exporter of agricultural commodities is also a positive indicator of future increased food security. The expanded use of natural resources, increases in yield and cropping intensity, and low demand for meat may be sufficient to ensure that India can meet its future food demands. However, India still has internal food security deficiencies in that food access is still a problem for the country.

5-1
5. Will There Be a Food Crisis in 2050?
A. Global Food Security Conclusions IDA’s review of the literature and analysis of agricultural data has not found
overwhelming evidence that there will be a global food shortage in 2050. There is evidence however, that food security will be lacking on the local scale in 2050 just as it is today. Food shocks will persist and cause food prices to spike in certain areas of the world, which may temporarily disrupt food security, especially in LDCs. A closer look at food security in the two largest emerging economies, India and China, has revealed that there may be some cause for concern, especially in China, that these countries may start to rely more on the GFS to feed their expanding populations. China, which is facing a lack of available agricultural resources to expand domestic production, may start to import food commodities from the GFS at a higher rate. India may start to adopt a Western-style diet in the future, which may increase the world demand for meat. These possibilities will present themselves as shocks to the GFS, and it is unclear at present how they will affect the global food market in the future. The uncertainty of the future of the livestock revolution presented in this analysis may warrant DARPA to consider technologies for either the rapid production of meat or protein.
IDA was specifically asked not consider the effects of climate change in its assessment. During the analysis, however, it became clear that the effects of climate change may be the most important shock that will affect global food security in the 21st century. The subject of climate change and its effect on global food security is an extremely complex problem; there is no consensus on its future global effects (Wheeler and von Braun 2013). It is clear, however, that it will have some currently unpredictable effects on global food security that may alter assessments made in this analysis. DARPA should be aware that our assessment could change dramatically, depending on the future effects of climate change.
B. Future DARPA Investment Researchers are starting to converge on the idea that climate change has already had
significant effects on the global environment. One of the major effects already being felt by the global population is that of water scarcity (World Bank 2016). Irrigation from groundwater sources is an important aspect of modern agriculture. As we have seen in China (Chapter 4), the majority of Chinese crops are irrigation-fed rather that rain-fed. Surface and under-surface groundwater sources throughout the world are becoming stressed from overuse (Richey et al. 2015a, b) and shifting rain patterns due to climate change. Dwindling groundwater has been linked to lapses in food security that have sent

5-2
shocks through local food networks (Kelley et al. 2015). The result of these shocks can have devastating effects on local populations that can lead to conflict or even mass migrations (World Bank 2016). DARPA may wish to consider investments in technologies that could purify large quantities of water that could meet both future agricultural needs and those of the expanding population of 2050.

A-1
References
Alexandratos, N. 2008. “Food Price Surges: Possible Causes, Past Experience, and Long Term Relevance.” Popul. Dev. Rev. 34:663–97.
Alexandratos, N., and J. Bruinsma. 2012. “World Agriculture Towards 2030/2050: The 2012 Revision.” ESA Working Paper No. 12-03. Rome: FAO.
Andersen, K., and S. Neglin. 2012. “Agricultural Trade Distortions During the Global Financial Crisis.” Oxford Rev. Econ. Policy 28:235–60.
Bankus, B., and M. Ramirez. 2009. “USSOUTHCOM Interagency Meeting on Food Security.” Issue Paper, Center for Strategic Leadership, U.S. Army War College, July.
Bellemare, M. F. 2014. “Rising Food Prices, Food Price Volatility, and Social Unrest.” Amer. J. Agr. Econ.: 1–21. doi: 10.1093/ajae/aau038.
Buckley, L. 2013. “Chinese Agriculture Development Cooperation in Africa: Narratives and Politics.” IDS Bulletin 44:42–52.
Chai, A., and A. Moneta. 2010. “Retrospectives: Engel Curves.” Journal of Economic Perspectives 24: 225–40.
Chung, U., S. Gbegbelegbe, B. Shiferaw, R. Robertson, J. I. Yun, K. Tesfaye, G. Hoogenboom, and K. Sonder. 2014. “Modeling the Effect of a Heat Wave on Maize Production in the USA and Its Implications on Food Security in the Developing World.” Weather Clim. Extremes 5–6:67–77.
de Haen, H, S. Klasen, and M. Qaim. 2011. “What Do We Really Know? Metrics for Food Insecurity and Undernutrition.” Food Pol. 36:760–69.
Duncan, R. C. 2007. “The Olduvai Theory: Terminal Decline Imminent.” The Social Contract 17:141–51.
Edwards, J. 2016. “In Iowa Corn Fields, Chinese National’s Seed Theft Exposes Vulnerability.” Reuters, April 11. Accessed April 25, 2016. www.reuters.com/article/us-usa-china-seeds-idUSKCN0X80D6.
Ehrlich, P. R., and A. H. Ehrlich. 2013. “Can the Collapse of Global Civilization be Avoided?” Proc. R. Soc. B 280, issue 1754. doi:10.1098/rspb.2012.2845.
Ercsey-Ravasz, M, Z. Toroczkai, Z. Lakner, and J. Baranyi. 2012. “Complexity of the International Agro-food Trade Network and Its Impact on Food Safety.” PLoS ONE 7(5): e37810.
FAO (Food and Agricultural Organization of the United Nations). 2012. “Irrigation in Southern and Eastern Asia in Figures: Aquastat Survey 2011.” FAO Water Report 37:223–49.
A-2
FAO, IFAD, and WFP. 2015. The State of Food Insecurity in the World 2015—Meeting the 2015 International Hunger Targets: Taking Stock of Uneven Progress. Rome: FAO.
FAOSTAT, Food and Agricultural Organization of the United Nations Statistics Division. http://faostat3.fao.org/home/E. Accessed April 25, 2016.
Fischer, R., D. Byerlee, and G. Edmeades. 2011. “Can Technology Deliver on the Yield Challenge to 2050?” Chapter 10 in Looking Ahead in World Food and Agriculture: Perspectives to 2050, edited by P. Conforti. Rome: FAO. http://www.fao.org/docrep/014/i2280e/i2280e10.pdf.
Flake, L. 2014. “India’s Agricultural Exports Climb to a Record High.” USDA Foreign Agriculture Service International Agricultural Trade Report. August.
Flake, L., and O. Flake. 2014. “India Sees Surge in Agricultural Exports to Least Developed Countries.” USDA Foreign Agriculture Service International Agricultural Trade Report, September 10.
Foti, N. J., S. Pauls, and D. N. Rockmore. 2013. “Stability of the World Trade Web Over Time—An Extinction Analysis.” J Econ. Dyn. Control 37:1889–1910.
Friedrichs, J. “Who’s Afraid of Thomas Malthus?” 2014. In Understanding Society and Natural Resources, edited by M. J. Manfredo, J. J. Vaske, A. Rechkemmer, E. A. Duke, 67–92. Dordrecht, Heidelberg, New York, London: Springer.
Gale, F. 2015. “China’s Growing Participation in Agricultural Markets” Choices 30:1–6.
Gale, F., J. Hansen, and M. Jewison. 2015. “China’s Growing Demand for Agricultural Imports.” Economic Information Bulletin No. 136. U.S. Department of Agriculture, Economic Research Service, February.
Gbegbelegbe, S., U. Chung, B. Shiferaw, S. Msangi, and K. Tesfaye. 2014. “Quantifying the Impact of Weather Extremes on Global Food Security: A Spatial Bio-economic Approach.” Weather Clim. Extremes 4:96–108.
Gilbert, C. L., and C. W. Morgan. 2010. “Food Price Volatility.” Phil. Trans. R. Soc. B 365:3023–34.
Hoda, A., and A. Gulati. 2013. “India’s Agricultural Trade Policy and Sustainable Development.” ICTSD Programme on Agricultural Trade and Sustainable Development. Issue Paper No. 49. Geneva, Switzerland: International Centre for Trade and Sustainable Development. www.ictsd.org.
Jones, A. D., F. M. Ngure, G. Pelto, and S. L. Young. 2013. “What Are We Assessing When We Measure Food Security? A Compendium and Review of Current Metrics.” Adv. Nutr. 4:481–505.
Kelley, C. P., S. Mohtadi, M. A. Cane, R. Seager, and Y. Kushnir. 2015. “Climate Change in the Fertile Crescent and Implications of the Recent Syrian Drought.” PNAS 112: 3241–46.
Khush, G. S. 2001. “Green Revolution: The Way Forward.” Nat. Rev. Gen. 2:815–22.

A-3
Larson, C. 2015. “Can the Chinese Government Get Its People to Like G.M.O.S?” The New Yorker. August 31. Accessed April 25, 2016. www.newyorker.com/tech/elements/can-the-chinese-government-get-its-people-to-like-g-m-o-s.
Lloyd’s. 2015. “Food System Shock: The Insurance Impacts of Acute Disruption to Global Food Supply.” Emerging Risk Report.
Narayanan, S. 2015. “Food Security in India: The Imperative and Challenges.” Asia Pac Policy Stud. 2:197–209.
Pica-Ciamarra, U., and J. Otte. 2009. “The ‘Livestock Revolution’: Rhetoric and Reality.” Pro-Poor Livestock Policy Initiative. RR Nr. 09-05, November.
Porkka, M., M. Kummu, S. Siebert, and O. Varis. 2013. “From Food Insufficiency Towards Trade Dependency: A Historical Analysis of Global Food Availability.” PLoS ONE 8:e82714.
Puma, M. J., S. Bose, S. Y. Chon, and B. I. Cook. 2015. “Assessing the Evolving Fragility of the Global Food System.” Environ. Res. Lett. 10:024007.
Qiu, J. 2010. “China Faces Up to Groundwater Crisis.” Nature 466. doi: 10.1038/466308a.
Ray, D. K., N. D. Mueller, P. C. West. and J. A. Foley. 2013. “Yield Trends Are Insufficient to Double Global Crop Production by 2050.” PLoS ONE 8:e66428.
Richey, A. S., B. F. Thomas, M-H Lo, J. T. Reager, J. S. Famiglietti, S. Swenson, and M. Rodell. 2015a. “Uncertainty in Global Groundwater Storage Estimates in a Total Groundwater Stress Framework.” Water Resour. Res. 51:5198–5216, doi:10.1002/2015WR017351.
Richey, A.S., B. F. Thomas, M-H Lo, J. T. Reager, J. S. Famiglietti, K. Voss, S. Swenson, and M. Rodell. 2015b. “Quantifying Renewable Groundwater Stress with GRACE.” Water Resour. Res. 51:5217–38, doi:10.1002/2015WR017349.
Rosen. S, B. Meade, K. Fuglie, and N. Rada. 2014. “International Food Security Assessment, 2014–2024.” GFA-25. U.S. Department of Agriculture, Economic Research Service, June.
Scoones, I., L. Cabral, and H. Tugendhat. 2013. “New Development Encounters: China and Brazil in African Agriculture.” IDS Bulletin 44:1–19.
Suweis, S., J. A. Carr, A. Maritan, A. Rinaldo, and P. D’Odorico. 2015. “Resilience and Reactivity of Global Food Security.” PNAS 112: 6902–7.
Tadesse, G., B. Algieri, M. Kalkuhl, and J. von Braun. 2014. “Drivers and Triggers of International Food Price Spikes and Volatility.” Food Policy 47:117–28.
Tomlinson, I. 2013. “Doubling Food Production to Feed the 9 Billion: A Critical Perspective on a Key Discourse of Food Security in the UK.” J. Rural Stud. 29:81–90.

A-4
United Nations, Department of Economic and Social Affairs, Population Division. 2015. World Population Prospects: The 2015 Revision, Key Findings and Advance Tables. Working Paper No. ESA/P/WP.241.
Wei, X., Z. Zhang, P. Shi, P. Wang, Y. Chen, X. Song, and F. Tao. 2015. “Is Yield Increase Sufficient to Achieve Food Security in China?” PLOS One 10:e0116430. doi:10.1371/journal.pone.0116430.
Wheeler, T., and J. von Braun. 2013. “Climate Change Impact on Global Food Security.” Science 341:508–13.
World Bank. 2016. “High and Dry: Climate Change, Water, and the Economy.” World Bank, Washington, DC. License: Creative Commons Attribution CC BY 3.0 IGO.
World Resource Institute. 2013. Creating a Sustainable Food Future: A Menu of Solutions to Sustainably Feed More Than 9 Billion People by 2050. World Resources Report 2013-14: Interim Findings.
Wright, I. A., S. Tarawali, M. Blummel, B. Gerard, N. Teufel, and M. Herrero. 2012. “Integrating Crops and Livestock in Sub-tropical Agricultural Systems.” J Sci Food Agric 92:1010–15.
Yang, Y. 2012. “Advances in Water-saving Agriculture and its Future Strategies in North China Plain.” BCAS 26:54–58.
Zhang, F., X. Chen, and P. Vitousek. 2013. “An Experiment for the World.” Nature 497:33–35.

B-1
Abbreviations
DARPA Defense Advanced Research Projects Agency DOD Department of Defense FAO Food and Agricultural Organization FBS Food Balance Sheets GDP Gross Domestic Product GFS Global Food System GMO genetically modified organism IDA Institute for Defense Analyses IFAD International Fund for Agricultural Development LDC Least Developed Countries MDER Minimum Dietary Energy Requirement PoU prevalence of undernourishment UN United Nations USDA United States Department of Agriculture WFP World Food Program WRI World Resource Institute


REPORT DOCUMENTATION PAGE Form Approved
OMB No. 0704-0188 The public reporting burden for this collection of information is estimated to average 1 hour per response, including the time for reviewing instructions, searching existing data sources, gathering and maintaining the data needed, and completing and reviewing the collection of information. Send comments regarding this burden estimate or any other aspect of this collection of information, including suggestions for reducing the burden, to Department of Defense, Washington Headquarters Services, Directorate for Information Operations and Reports (0704-0188), 1215 Jefferson Davis Highway, Suite 1204, Arlington, VA 22202-4302. Respondents should be aware that notwithstanding any other provision of law, no person shall be subject to any penalty for failing to comply with a collection of information if it does not display a currently valid OMB control number.
PLEASE DO NOT RETURN YOUR FORM TO THE ABOVE ADDRESS. 1. REPORT DATE
June 2016 2. REPORT TYPE
Final 3. DATES COVERED (From–To)
Feb 2016 – Jun 2016 4. TITLE AND SUBTITLE
Food Security in India, China, and the World
5a. CONTRACT NUMBER HQ0034-14-D-0001
5b. GRANT NUMBER
5c. PROGRAM ELEMENT NUMBER
6. AUTHOR(S) Finnin, Michael S.
5d. PROJECT NUMBER DA-2-4015
5e. TASK NUMBER
5f. WORK UNIT NUMBER
7. PERFORMING ORGANIZATION NAME(S) AND ADDRESS(ES) Institute for Defense Analyses 4850 Mark Center Drive Alexandria, VA 22311-1882
8. PERFORMING ORGANIZATION REPORT NUMBER
IDA Document D-5823 Log: H16-000660
9. SPONSORING / MONITORING AGENCY NAME(S) AND ADDRESS(ES)
Defense Advanced Research Projects Agency 675 North Randolph Street Arlington, VA 22203-2114
10. SPONSOR/MONITOR’S ACRONYM(S) DARPA
11. SPONSOR/MONITOR’S REPORT NUMBER(S)
12. DISTRIBUTION/AVAILABILITY STATEMENT Approved for public release; distribution is unlimited (16 August 2016).
13. SUPPLEMENTARY NOTES
14. ABSTRACT IDA was asked by the Defense Advanced Research Projects Agency (DARPA) to make an assessment of the issue of global food security. There are many studies in the literature and the popular press that indicate that the world will not be able to support the expanding population of the world into the mid-21st century. It has been purported that emerging economies such as China, India, and Brazil will eventually place a large burden on the global food supply with their increasing populations and their eventual demand for a more “Western-style diet” that consists of greater proportions of meats, oils, and fresh vegetables. DARPA was interested in IDA review projections and scientific studies in the literature and make an assessment of the state-of-the art in the literature and determine if it was likely that the world would have an impending food crisis in 2050. IDA was also asked to assess specifically the food security status of China and India, which are the two largest emerging economies that may have serious food security challenges in the future that may cause shocks to the global food system. IDA found indications that food security in China may become less assured by 2050 but no overwhelming evidence that the world will face an extraordinary food crisis in 2050.
15. SUBJECT TERMS Food Security, China, India, Food crisis, Agriculture
16. SECURITY CLASSIFICATION OF: 17. LIMITATION OF
ABSTRACT
SAR
18. NUMBER OF
PAGES
52
19a. NAME OF RESPONSIBLE PERSONDr. Tyler McQuade
a. REPORT Uncl.
b. ABSTRACT Uncl.
c. THIS PAGE Uncl.
19b. TELEPHONE NUMBER (include area code)
703-248-1508 Standard Form 298 (Rev. 8-98) Prescribed by ANSI Std. Z39.18