Impact of USDA's Supplemental Nutrition Assistance Program ...
FOOD PROCUREMENT BY
USDA�s FARM SERVICE AGENCY
Economic Research Service, U.S. Department of Agriculture. AgriculturalEconomic Report No. 766.
Abstract
USDA�s Farm Service Agency (FSA) purchases food products for distributionthrough several of the Department�s food assistance programs. This report describesFSA purchase methods and compares them to procurement strategies used by otherFederal agencies and by private sector firms. It summarizes the principal policyissues faced by FSA in designing procurement strategies. Finally, it uses a detailedstatistical analysis to compare FSA prices to those realized in the private sector, andto identify the separate effects of agricultural commodity prices, seasonality, clientlocation, purchase volumes, product characteristics, and competition on FSA prod-uct prices.
Keywords: procurement, auctions, food assistance, competition
This report was prepared by James M. MacDonald [202-694-5391], Charles R.Handy [202-694-5385], and Gerald E. Plato [202-694-5383]
Washington, DC 20036-5831 September 1998
Contents
Executive Summary . . . . . . . . . . . . . . . . . . . . . . . . . . . . . . . . . . . . . . . . . . . . .iii
Introduction . . . . . . . . . . . . . . . . . . . . . . . . . . . . . . . . . . . . . . . . . . . . . . . . . . .1
An Overview of Federal Food Procurement Programs . . . . . . . . . . . . . . . . . . . . 3
USDA Domestic Food Procurement: Programs and Expenditures . . . . . . . . . . . 9
FSA Procurement Auctions: How the Process Works . . . . . . . . . . . . . . . . . . . . 15
Issues in USDA Procurement Policies . . . . . . . . . . . . . . . . . . . . . . . . . . . . . . . 21
Data for Empirical Analyses of FSA Auctions . . . . . . . . . . . . . . . . . . . . . . . . . 27
Statistical Analysis of Bid Prices for Five FSA Commodities . . . . . . . . . . . . . 33
Comparing FSA to Commercial Prices . . . . . . . . . . . . . . . . . . . . . . . . . . . . . . 43
Conclusions . . . . . . . . . . . . . . . . . . . . . . . . . . . . . . . . . . . . . . . . . . . . . . . . . . . 49
References . . . . . . . . . . . . . . . . . . . . . . . . . . . . . . . . . . . . . . . . . . . . . . . . . . . 53
Appendix A � Glossary of Acronyms . . . . . . . . . . . . . . . . . . . . . . . . . . . . . . . 54
Appendix B � Detailed Regression Results�Analyses of Low Bids . . . . . . . 55
ii
EXECUTIVE SUMMARY
The U.S. Department of Agriculture�s Farm Service Agency (FSA) purchases foodproducts for distribution through several of the Department�s food assistance pro-grams. FSA purchases food throughout the year, using methods that economistsrefer to as auctions. The food products are then delivered to States for distribution toclient agencies, such as school systems and social service organizations, which inturn distribute the products to needy households.
In the fall of 1996, FSA asked the Department�s Economic Research Service (ERS)to evaluate the agency�s procurement system. This report summarizes that work,based on three sources of information: 1) interviews with participants, includingFSA employees and clients, other government agencies with responsibilities forfood procurement, and private sector food processors and distributors; 2) summaryFSA expenditure and quantity data; and 3) an extensive statistical analysis of dataon individual FSA auctions, focusing on the determinants of FSA bid prices and oncomparisons with commercial prices for the same products.
FSA Obtains Highly Competitive Prices
FSA�s system aims to elicit low-price bids for the delivery of large volumes of alimited number of food products. The system works well in reaching those goals:FSA prices are substantially lower than those paid by private sector buyers for cor-responding products. Moreover, processing margins for FSA products are quite low;FSA stretches USDA budget dollars by purchasing substantial volumes of foodproducts for any given budget allocation.
Experience at other major Federal procurement agencies, such as the Department ofDefense and the Department of Veterans Affairs, shows that ultimate consumerswant more than low prices. Along with nutrition, they are also interested in timelydelivery and product variety. FSA does not act as a full-line food distributor for itsclients, and hence does not focus on wide variety and rapid delivery. Rather, it pro-vides clients with the opportunity to obtain large volumes of a few items at veryfavorable prices, by limiting product variety and by responding more slowly toorders than full-line distributors. Clients can more effectively spend the rest of theirbudgets on a variety of products.
But Clients Cite Four Problems in USDA Service Quality
1. Unreliable Delivery. Because of FSA�s long lead times for delivery, client agen-cies must plan meals well in advance. If deliveries arrive late, meal plans are upset,meal quality can suffer, and client agency costs can rise sharply when they mustreplace FSA�s orders quickly. Interviewees cited several sources of delivery delays:lags due to USDA inspection delays (typically at small plants), cancellation of auc-tions, and vendor noncompliance.
iii
2. Product Selection. Client agencies feel that surplus removal goals often drive theselection and distribution of bonus commodities that clients frequently have littleinterest in, although this problem relates more to the distribution of bonus commodi-ties through the Agricultural Marketing Service.
3. Product Deterioration. USDA products follow a long distribution chain betweenordering and eating. A client first places an order with USDA, which arranges forproduction. A vendor then manufactures the product, and arranges for delivery fromthe processing plant to a State warehouse or to another processing site. The productis then delivered to the client�s central facilities, before being distributed to diningfacilities, where further preparation and holding may occur before serving.Deterioration may occur at any point in the chain.
4. Problem resolution. The client may interact with State government agencies inordering and final delivery, and may be unaware that up to five different USDAagencies may be involved in their order for food, as well as private vendors, truck-ers, and warehouses.
What Drives FSA Bids? Observations and Recommendations
1. Agricultural Commodity Prices. FSA bids are far more sensitive to agriculturalprice movements than are wholesale and retail food prices. Because FSA prices areso sensitive to agricultural prices, they will fall more than wholesale and retailprices when agricultural prices decline, and they will rise more when agriculturalprices rise. The gap between FSA and corresponding retail and wholesale pricesshould therefore be largest during periods of relatively low agricultural prices, andsmallest during periods of high agricultural prices.
2. Competition. We found that competition matters in FSA auctions, but it matters alot only in some circumstances. As an approximate rule of thumb, FSA can do asmuch for its clients by attracting a second bidder to a monopoly auction (reducingprices by 4-7 percent), as by finding four more bidders for an auction that alreadyhas two. Consequently, we recommend that FSA focus its efforts on adding biddersat those auctions that typically attract only 1 or 2 bidders.
The number of bidders in FSA auctions varies substantially by product and overtime. Where are the most serious competitive problems? The data suggest that sea-sonality is important for some products: for example, over three-quarters of monop-oly auctions in flour occur in the fall, when mills operate near peak capacity.Monopoly auctions are also more likely among products with limited FSA volume,because of unusual package sizes or product characteristics.
In those cases, FSA can counteract monopoly by conveying accurate price informa-tion to clients�for example, that FSA�s price advantages over commercial flourproviders are weakest in the fall and strongest in other periods, or that FSA�s priceadvantages are strongest in high-volume products. We recommend that FSA exploreways to counteract seasonal variations in monopoly by extending the experimentwith rolling contracts, currently in use with cheese, to other products.
iv
Participation in FSA bidding has a distinctive �all or nothing� character to it�bid-ders typically commit to being active in FSA auctions, in which case they bidactively each month on auctions for a variety of locations and products. Auctionparticipation then does not typically decline because bidders reduce the number ofauctions they are active in; rather, firms decide to get out of FSA bidding entirely.Our present research has not aimed to uncover the reasons why firms decide to enteror leave FSA�s bidding process. But efforts to increase competition should empha-size research into the reasons for entry and exit by those firms, and the researchshould generate strategies to attract participation by more firms.
3. Product Volumes. Monthly FSA purchase volumes have dropped substantially asa result of changes in USDA commodity support programs. But declining volumeshave not yet had any substantive effects on FSA prices. Purchase volumes have onlysmall direct effects on prices, and those effects are not always in the same direction.Moreover, the monthly volumes that matter are total USDA purchases (foreign anddomestic), and not simply domestic purchases. The most important effects on pricesoccur in months in which large PL480 purchases are occurring�in those months,coincident large domestic purchases can lead to FSA price increases of 2-4 percent.The driving factor in these instances are PL480 purchases, which vary quite sharplyfrom month to month. FSA should initiate strategies to get better prices on domesticflour and vegetable oil, either by smoothing PL480 purchases, or by timing domes-tic purchases to avoid peaks in PL480 purchases.
Order volumes (the amount going to a specific destination in a specific order) havevery small effects on prices. Larger orders generally draw more aggressive bidding,but prices only fall by less than 1 percent�combining orders into multiple truck-loads yields very limited savings. Major gains in price likely come as one goes totruckload volumes from smaller orders, and FSA already acts to combine smallorders into orders of at least truckload sizes.
Service Quality Observations and Recommendations
FSA�s procurement system is designed to obtain good-quality products at very com-petitive prices. But at times, FSA may sacrifice service quality in the form of reli-able delivery and in the pursuit of advantageous prices:
1. Canceled Auctions. There may be a problem in Kansas City Commodity Office�s(KCCO) calculation of constructed prices, used in deciding whether to cancel anauction and shift purchases to a later month. In particular, because constructedprices seem to be less sensitive to underlying agricultural prices than actual bidprices are, constructed prices may give insufficient weight to agricultural prices.Now, the threat of cancellation can be useful� auction theory suggests that thethreat can lead to more competitive bidding, and the threat of cancellation is onlycredible if it is actually used at times. But actual cancellations lead to lags in prod-uct deliveries, and can therefore impose substantial costs on clients. We thereforerecommend that FSA review its procedures for calculating constructed prices, with aparticular focus on the weight given to agricultural prices.
2. Penalties. Vendors have traditionally faced weak penalties for failures to meetFSA delivery dates. Our statistical analysis shows that vendors are very sensitive to
v
economic incentives�they revise bids quickly to changes in materials costs, trans-port costs, and capacity utilization. Stronger penalties for noncompliance, in theform of financial penalties or suspension of later contracts, should lead to improvedvendor compliance.
3. USDA Inspection and Labels. Under existing rules, FSA products undergo onsiteUSDA inspection and must carry USDA, rather than commercial, labels. The rulesare related: reliance on USDA labels and packaging shifts some risks of poor prod-uct quality to USDA, and consequently creates a need for USDA inspection.Inspection, along with occasional unusual packaging requirements, can raise vendorcosts by 1-2 percent; USDA inspection and testing can also lead to lags in productdelivery, which clients cite as a persistent problem. Some vendors, especially rela-tively small plants, cite inspection and packaging requirements as deterrents to par-ticipation in FSA auctions, because of the effects on cost and on timely delivery ofproducts.
The current system results in very competitive prices, and the insistence on USDAlabels may contribute to the competition that leads to those prices�some firms maynot wish to bid aggressively on their own branded products. In some products, inother words, the net effect of USDA labels and inspection may be lower prices. Butthe insistence on USDA labels may, in other products, limit opportunities to obtainsurplus stocks of commercially labeled products and may deter additional biddersfrom participating.
FSA currently purchases commercially labeled products in a few commodity cate-gories. In markets with only a few vendors, FSA may be able to obtain more prod-uct variety and greater competition by opening auctions to commercially labeledproducts�the clear examples include the current experiments in ready-to-eat cerealand infant formula. Those two cases illustrate a dilemma for the agency. A principalargument made for USDA labels is that they limit brand loyalty on the part of con-sumers and therefore allow for more competitive bidding, but brand loyalty isimportant in those two products (especially ready-to-eat cereal).
FSA�s shift to purchase of commercial labels reflects the agency�s judgment that theshift may introduce greater competition into two highly concentrated markets. ButFSA also purchases products for other markets in which brand loyalty is far lessimportant, because the brands are never seen by ultimate consumers and because theproducts are used as ingredients in final servings, not as the serving itself. We rec-ommend that FSA carefully evaluate its current experiments and consider a gradualexpansion of commercial labels (especially including high-quality private label andwholesalers� own-brand products), especially in products with limited existing brandloyalty and low vendor participation.
The research for this report relied primarily on paper reports, whose data were reen-tered into an electronic format, because FSA disposes of the electronic records ofauctions after 1 year. Electronic data retention grows cheaper every year, as domethods for analyzing data. Moreover, because of steady improvements in dataretention and analysis, undergraduate business and economics majors now routinelylearn almost all of the techniques used in this report. KCCO commodity analystsshould in the future be able to easily call up 5 years� worth of past auction data (forexample); they should be able to quickly summarize key data patterns, and can easi-
vi

ly be provided with expert summaries of more subtle issues. They should be able touse that information in making auction decisions and in delivering timely informa-tion and advice to client agencies. We recommend that KCCO�s future strategy forinformation technology include steps to retain electronic auction records and todevelop those records into easily accessible databases.
vii
The U.S. Department of Agriculture�s Farm ServiceAgency (FSA) purchases food products for distributionthrough several of the Department�s food assistanceprograms. The products are then delivered to clientagencies, such as school systems and social serviceorganizations, which in turn distribute the products toneedy households. FSA purchases food productsthroughout the year, using methods that economistsrefer to as auctions. An auction is a bidding mechanismthat encompasses a set of auction rules, which in turnspecify how potential bidders may participate in theauction; how the winner is determined; and how much,in the case of procurement auctions, the winner is to bepaid (McAfee and McMillan, 1987; Wolfstetter, 1996).Auctions are widely used in government procurementactivities, and are also used to distribute oil drilling andtimber harvesting rights on Federal property, and tofinance Federal activities through the sale of Treasurybills. In the private sector, auctions are used to sell suchproducts as wine, art, flowers, fish, and tobacco, and tosolicit delivery price offers for products ranging fromoffice supplies to tires to construction jobs.
In the fall of 1996, FSA asked the Department�sEconomic Research Service (ERS) to evaluate theagency�s system for procuring and distributing foodproducts. This report summarizes that work, and isbased on three sources of information. First, ERSresearchers conducted a series of interviews with partic-ipants in the process, including FSA employees andclients, people at other government agencies withresponsibilities for food procurement, and private sectorfood processors and distributors. Second, we acquired
summary expenditure and quantity data from FSA andfrom other government agencies. Finally, we developeda large database, using FSA administrative records, onthe results of separate procurement auctions and per-formed extensive statistical analyses of those auctions.We focused particularly on the determinants of bidprices in FSA auctions and compared those prices tocommercial prices for the same products.
Chapters 2 through 4 describe the environment withinwhich FSA carries out its procurement activities. Wefirst provide an overview of the largest Federal foodprocurement agencies. In particular, we describe thedifferences among USDA, the Department of Defense,and the Department of Veterans Affairs in procurementgoals and methods, and describe recent major changesin procurement methods at the latter two Departments.We then detail, in Chapter 3, USDA�s food procurementprograms�the agencies and food assistance programsinvolved, the statutory framework that drives USDAprograms, and recent expenditure patterns. Chapter 4provides a detailed description of the actual stepsinvolved in purchases administered by FSA.
In the fifth chapter, we build on the material intro-duced earlier, and describe a set of policy issues thatrelate to FSA procurement. That is, a set of specificrules currently constrains FSA to purchase quite specif-ic products, with customized packaging, and requires anextensive system of onsite inspection of USDA�s foodproducts. We summarize those rules, identify theirinterlinkages, and discuss potential alternatives.
Food Procurement by Farm Service Agency / AER-766 USDA-ERS / 1
CHAPTER 1
INTRODUCTION
Moreover, current FSA procedures could be modified ina variety of ways. We discuss potential modificationsand their possible effects.
Chapters 6 through 8 rely on the large database of FSApurchase records. We first discuss the construction ofthe database in chapter 6, and summarize the key price,volume, competition, and product measures in the data.In chapter 7, we report the results of our statisticalanalysis of bid prices in FSA purchases. We estimatethe effects of agricultural commodity prices, productand packaging characteristics, purchase volumes, andcompetition on bid prices in five FSA commodity cate-gories over a 5-year period. The results should helpFSA to identify the major factors behind actual andforecast changes in product prices and to plan for tacti-
cal changes in policies aimed at improving perfor-mance.
We use the analyses of chapters 6 and 7 to developmeasures of average FSA prices in chapter 8, measuredat particular times and locations. The chapter then com-pares those average prices to commercial price quotesfor those products, times, and locations. The data pro-vide evidence of the price advantages that FSA candeliver to its clients, as well as the sources of thoseadvantages; in short, it summarizes FSA�s relativestrengths and weaknesses in food procurement and dis-tribution. A concluding chapter summarizes our majorpositive and negative findings, and offers some recom-mendations for FSA auction strategy.
2 /ERS-USDA Food Procurement by Farm Service Agency / AER-766
Introduction
Several government agencies administer large-scalefood procurement programs. At the U.S. Department ofAgriculture (USDA), two agencies�the Farm ServiceAgency (FSA) and the Agricultural Marketing Service(AMS)�purchase food products for domestic distribu-tion on behalf of a third�the Food and NutritionService (FNS). Those products are distributed throughdomestic food assistance programs, such as theNational School Lunch Program (NSLP) or TheEmergency Food Assistance Program, which arefinanced by FNS. About three-quarters of the food pur-chased under domestic food assistance programs is dis-tributed to school districts under the NSLP, while therest is distributed through a variety of smaller pro-grams, described more fully in chapter 3. The twoUSDA agencies spent $849 million on food purchasesfor domestic programs in 1996.
Food procurement forms a small part (less than 2 per-cent) of total FNS expenditures on domestic food assis-tance. Most of the total FNS food assistance budget of$38 billion goes to support direct cash transfers, such aspayments to foodstores for redemption of coupons andvouchers under the Food Stamp and Women, Infants,and Children Programs, or cash payments to schools forsubsidized meals under the NSLP. Schools receiveabout 20 percent of their USDA support in the form ofcommodities, with the rest in cash support.
FSA also purchases and ships food and agricultural
commodities to foreign countries under the Food forPeace program (PL480) and other international assis-tance programs. The programs are administered andfinanced by the State Department�s Agency forInternational Development (AID) or another USDAagency, the Foreign Agricultural Service (FAS), forwhich FSA acts as the buying agent. FAS expendituresfor PL480 programs were $1.21 billion in 1996. Inaddition, FAS spent another $84 million on food expen-ditures for the Food for Progress program. Under thisprogram, U.S. agricultural commodities are provided todeveloping countries and emerging democracies thathave commitments to introduce and expand free enter-prise in their agricultural economies.
At the U.S. Department of Defense (DoD), the DefensePersonnel Support Center (DPSC) purchases food formilitary bases, ships, and other military facilities.DPSC purchases for all four branches of the military,acting as the buying agent for the Defense LogisticsAgency (DLA). In addition, DPSC has contracts to actas purchasing agent for the U.S. Coast Guard, someprisons, and some school systems. DPSC food purchas-es amounted to approximately $525 million in 1996,and the agency also provided $115 million in other con-tract services.
At the Department of Veterans Affairs (VA), the Officeof Acquisition and Materials Management (OAMM)purchases food for 173 VA facilities, primarily medicalcenters. OAMM food expenditures amounted to $60million in 1996, along with another $12 million in food
Food Procurement by Farm Service Agency / AER-766 USDA-ERS / 3
CHAPTER 2
AN OVERVIEW OF FEDERAL FOOD
PROCUREMENT PROGRAMS
equipment and supplies. The agency also aims to obtaincontracts to act as purchasing agent for other entities;for example, OAMM handles food purchases for med-ical facilities in the U.S. Army Medical Command.
Program Goals
Each agency tries to reach several primary and sec-ondary goals through their procurement strategies. Forexample, the USDA agencies traditionally have haddual goals�surplus removal and food assistance.USDA has historically purchased substantial volumesof agricultural commodities in order to support pricesfor �program crops,� such as wheat, corn, and dairyproducts. The Department has then had to find ways todispose of the accumulated surpluses, and one way hasbeen to distribute them outside of normal commercialchannels through food assistance programs to low-income households and countries. Surplus removal,used for Section 32 purchases by AMS, often empha-sizes the rapid distribution of large volumes of particu-lar commodities, those that have had large harvests andfalling prices, in order to support producer prices. As aresult, AMS procurement has generally emphasizedagricultural commodities and less processed food prod-ucts because of their closer link to the farm sector.
Food assistance programs include the distribution ofemergency supplies of staple food items to areas hit bysuch natural disasters as floods, hurricanes, and earth-quakes, and the regular distribution of food products tomembers of low-income households. Assistance goalsinclude the assurance of nutritionally adequate dietsamong client groups, as well as income support forfood assistance recipients. Because most expenditureshave been aimed at staple food products that are oftenstorable for extended periods, procurement procedureshave emphasized the acquisition of simple, nutritionallysound foods at competitive prices.
DoD and VA purchasing agencies do not operate undersurplus removal expectations. Because they provide asubstantial share (up to 100 percent, for some) of thefood consumed by their clients, they are under greaterpressure to provide for product variety, and not simplynutritional adequacy. Moreover, because DoD clientfood demands may fluctuate sharply (for example,when a ship arrives at a base or when a reserve unit isactivated), DPSC�DoD�s procurement agency�mustrespond rapidly to unexpected service demands. As aresult, the agencies� procurement strategies emphasize
quick delivery of a wide variety of food products.
Food procurement agencies also aim to realize somesecondary goals that often are imposed by statute. Eachis required to support small businesses by setting asidea certain percentage of purchases for firms that are des-ignated as small businesses. USDA is required to buyfoods that use products from American farms, and theMerchant Marine Act requires FSA to arrange for oceanshipment in American ships. VA medical centers areexpected to purchase a percentage of food in local areasin order to support local economic development. USDAagencies often attempt to encourage good dietary andpurchase habits through example, by offering low-fatversions of food products and by forgoing more expen-sive commercially branded products.
Procurement Methods
USDA, DoD, and VA use different procurement meth-ods. Most USDA procurement is done through sealed-bid auctions for the delivery of a limited variety of foodcommodities to central warehouses or further proces-sors. Client agencies then generally take responsibilityfor distribution from warehouses, reprocessing somecommodities (such as cheese and flour) into more high-ly processed foods (such as pizza), delivery to points ofconsumption, and local preparation. By contrast, DoDand VA have recently introduced �prime vendor pro-grams,� in which a private firm (the prime vendor) isresponsible for ordering products from processors, pro-viding storage for an inventory of products, and deliv-ering a wide variety of food products to all facilitieswithin a region, with clients then responsible only fortheir own ordering and for local preparation.
A Brief Description of USDA Procurement Methods
FNS receives the appropriation for USDA programs; italso allocates funds to the client State and tribal distrib-uting agencies, collects food commodity and productorders from these agencies, and ensures their compli-ance with program requirements. State and tribal agen-cies use FNS program guidelines to determine if indi-viduals are eligible to receive food products and todeliver products from warehouses to the targeted popu-lation.
Client agencies place orders for food products, workingfrom product lists (with likely price ranges) provided
4 /ERS-USDA Food Procurement by Farm Service Agency / AER-766
by FNS. USDA�s procurement agencies, FSA and AMS,then aggregate the orders to truckload quantities, andproduce invitations for vendors to enter bids to producethe orders. An invitation usually includes multiple auc-tions, where each auction is for the award of an orderfor delivery of truckload quantities of a preciselydefined food product to a distribution point within adefined time period. The time period is usually a 2-week span, the distribution point is usually a warehousein reasonable proximity to the client, and food productsare defined as to type (say, all-purpose flour or breadflour), package size, and ingredient requirements.
USDA distributes invitations and runs auctions once amonth for some products, while auctions for others areheld weekly (ground beef), seasonally (some fruit prod-ucts), or annually (infant formula). Vendors (food pro-cessing firms) respond by submitting sealed bids;sealed bids are not known or observed by rivals, aswould occur in the sort of open verbal auctions used atart auction houses. Vendors typically do not offer bidson all auctions in an invitation, but frequently enterbids on more than one. A bidder may place a maximumon the total quantity that they would be willing to pro-duce from all the bids entered in an auction, and bid-ders in some auctions may also place minimum quanti-ties, below which they will accept no awards.
USDA aims to award the order to the best bid in anauction, subject to several constraints. For internationalshipments, USDA considers ocean transport charges aswell as the vendor�s quoted prices for delivery of aproduct to a domestic port�that is, the winner is deter-mined by the lowest total cost to USDA. When lowbidders are above their maximum or below their mini-mum total quantities, agencies will attempt to makeawards in ways that will minimize invitation-wide totalcosts to USDA. Finally, some orders are set aside forsmall businesses, as long as a qualified small businessenters a bid that is within 5 percent of the lowest bid.
Vendors are expected to arrange for transportation towarehouse points or, in the case of international ship-ments, to ports. Commercial freight forwarders arrangefor ocean shipping to international clients, whiledomestic clients arrange for transportation from ware-houses. USDA requires onsite inspection of all prod-ucts; inspectors for some products are employed byAMS, while another USDA agency, GIPSA (the GrainInspection, Packers and Stockyards Administration),provides inspectors for other commodities. Laboratory
testing services supplement the onsite inspectors andare supplied by AMS and GIPSA.
Prime Vendor Programs
USDA�s procurement auctions rely on competitionamong processors to obtain precisely defined foodproducts at favorable prices. Prime vendor programsalso rely on competition, but for a different sort ofaward.
Under the DoD program, the country is divided intoregions, and in each region, a single prime vendor sup-plies military facilities with food products. DoD nowhas 50 Prime Vendor contracts in the continental UnitedStates. Contracts are for a single base year, with provi-sions for three or four 1-year extensions. The primevendor is generally not itself a manufacturer; most arefoodservice wholesalers. Prime vendors offer distribu-tion facilities and choices from a wide range of fooditems. They obtain products from processors, assembleloads for clients, and deliver from the prime vendor�swarehouses directly to ships, base dining halls, andother locations. Prime vendors also provide a centralpoint of contact for problems with deliveries, productquality, or errors in orders.
Prime vendors in the VA program perform a similarfunction, but the VA divides the country into 16regions. The geographically larger VA regions are ableto combine hospital purchases into a large enoughaggregate to correspond to the business opportunitiesoffered to prime vendors in DoD regions.
Prime vendor contracts are awarded after competitivebidding among potential vendors. The contracts are forindefinite quantities because base food demands are notperfectly predictable far in advance. The DoD procure-ment agency, DPSC, provides bidders with a list ofitems wanted, along with estimated quantities and like-ly minima and maxima; the agency also estimates thelikely dollar volume of sales for each region. Inresponse to the invitation, and after pre-proposal con-ferences, bidders submit very large and extensive pro-posals. DPSC then evaluates the proposals. It considersa business segment of the proposal, in which it asks forprice quotes on a sample of items, as well as the bid-der�s fee per item. The agency also assembles a techni-cal panel to make site visits and to review the bidder�sordering systems, inventory controls, and delivery tech-nologies.
Food Procurement by Farm Service Agency / AER-766 USDA-ERS / 5
VA technical panels review the size of bidder ware-houses, the variety of products and the capability to addnew items, transport options, and purchase and account-ing systems. Price quotes are also included for evalua-tion in the business segment of bidder proposals.
Contract awards are made on the basis of the lowestpriced, technically feasible, proposal. DPSC managersexpect, however, that the basis for awards will shiftsomewhat toward best value, which would add consid-erations of past performance and service quality to theawards decision.
DPSC purchases some military-unique food items,including those with special packaging to withstandshipboard or airborne conditions as well as foods thatare prepared for field consumption. DPSC runs compe-titions to select a single manufacturer for each military-unique item, and handles orders and payment to themanufacturer. Prime vendors then assemble and delivermilitary-unique items to bases.
DoD and VA procurement agencies do not rely onextensive onsite inspection to provide quality controlsas USDA does. Instead, pressures to maintain qualityand to meet contractual obligations arise from severalsources. First, contracts are renewable, and past perfor-mance becomes a factor in competitions for renewedawards. Second, military facilities are not obliged tospend all of their food dollars at prime vendors; theymay also purchase from local vendors. Third, messhalls and other dining facilities are not obliged toaccept deliveries from prime vendors; they may rejectand return unacceptable products. Fourth, the agenciesretain the right to audit the relevant records of primevendors during the course of the contract. Finally, mostprime vendor food products are identical to those thevendor supplies to its other commercial clients. Vendorshave incentives to maintain and assure the quality oftheir private-label brands and services; if quality deteri-orates, they risk losing not only DoD and VA business,but commercial sales as well.
Causes of the Shift to Prime Vendor Programs
DoD prime vendors supplanted a system of militarydepots. Prior to the shift to prime vendors in 1995,DPSC ordered food products on behalf of military facil-ities, much as USDA�s agencies now order on behalf ofschool districts and other clients. Food products were
then delivered to depots operated by the DefenseLogistics Agency (DLA), and from there were distrib-uted to base warehouses. Finally, products were deliv-ered to mess halls, ships, and other dining facilitiesfrom the base warehouses.
Two problems drove the shift to a prime vendor system.First, aging military depots and warehouses were inneed of substantial investments in construction andmaintenance. Second, food deliveries required longlead times, 45 days between order and delivery. Primevendors provide substantially improved service to din-ing facilities; over 99 percent of orders are deliveredwithin 2 days, if substitution among brands and pack-age sizes is allowed. Vendors operate 7 days a week,and offer a wide variety of products. The military hasbeen able to consolidate depots and warehouses, and torealize substantial savings in the costs of carrying foodinventories, which fell from $230 million prior to initia-tion of the program to $69 million in late 1996, with agoal of $15 million after full implementation.
Of course, the need for warehouse space does not dis-appear with the introduction of the program�primevendors now provide services of storage, repackaging,delivery, and administration that the military used to doby itself. DPSC managers estimate that vendor fees forthese services amount to 11-12 percent of commoditysales. DPSC receives additional payments equal to 6percent of total expenditures for prime vendor com-modities and services. DPSC provides translation soft-ware to enable the different services to order through aconsistent computer system, advises facility managerson sound purchasing strategies, handles the flow ofpayments from bases and DLA through DPSC to thevendors, and administers the system of prime vendorcontracts.
Procurement agencies and clients must make someadjustments under prime vendor programs. With awider range of available products, clients must learnmore about the products that are commercially avail-able, and they need to invest in learning about electron-ic ordering and tracking systems. Agencies assumegreater responsibility for advising clients and forreviewing and supervising vendors.
The VA�s 1995 shift to a prime vendor program cameslightly before DoD�s did. Before then, VA purchasedabout 300 different food items distributed through adepot system. In the view of VA managers, vendor
6 /ERS-USDA Food Procurement by Farm Service Agency / AER-766
prices were relatively high, and delivery times throughthe depot system were poor. Food item distributioncosts appear to have been subsidized by pharmaceuticalitems in the VA depot system. When pharmaceuticalprocurement was pulled out of the depot system, thefood procurement program came under substantialfinancial pressure, leading to a search for alternatives.In the VA case, managers cite lower product prices,wider variety, more timely delivery, and the eliminationof depot facilities, along with their associated expenses,as advantages of the new system. Prime vendor feesaverage 9-12 percent of food product costs, and theVA�s procurement office, the Office of Acquisition andMaterial Management (OAMM), charges a one-half-percent fee for its services.
The VA provides some volume guarantees to primevendors by committing at least half of a region�s pur-chases to the prime vendor. Clients may also reducecosts on some items by providing volume commitmentson specific products to the manufacturer/vendor fromwhich the prime vendor purchases.
Conclusions
USDA�s procurement programs are designed to obtain alimited variety of precisely defined food products at thelowest possible cost to USDA for delivery to warehous-es. As we shall see in later sections, USDA relies ontight specifications and direct inspection to ensure prod-uct quality. The system is decentralized in that finaldelivery, reprocessing, and distribution to dining facili-ties are the responsibility of the client. The prime ven-dor programs used by DoD and the VA are designed toobtain important services, such as variety (and associat-ed inventory) and rapid delivery, in addition to foodcommodities. Vendors are expected to compete to offerpackages of service and price. DoD and VA aim toensure product quality through reliance on commerciallabels and continued competition among vendors forcontract renewals.
Food Procurement by Farm Service Agency / AER-766 USDA-ERS / 7
Introduction
USDA purchases and distributes food commoditiesthrough 13 food assistance programs. Purchase and dis-tribution activities are essentially the same for each pro-gram, but spending authorities, target populations, andprogram goals differ. The collective goals of the pro-grams are to provide needy people with access to amore nutritious diet, to improve the eating habits of theNation�s children, and to stabilize farm prices throughthe distribution of surplus foods. This chapter summa-rizes USDA�s food procurement programs, identifiestheir authorizing legislation, and details the recent his-tory of annual expenditures under these programs.
Programs and Supporting Legislation
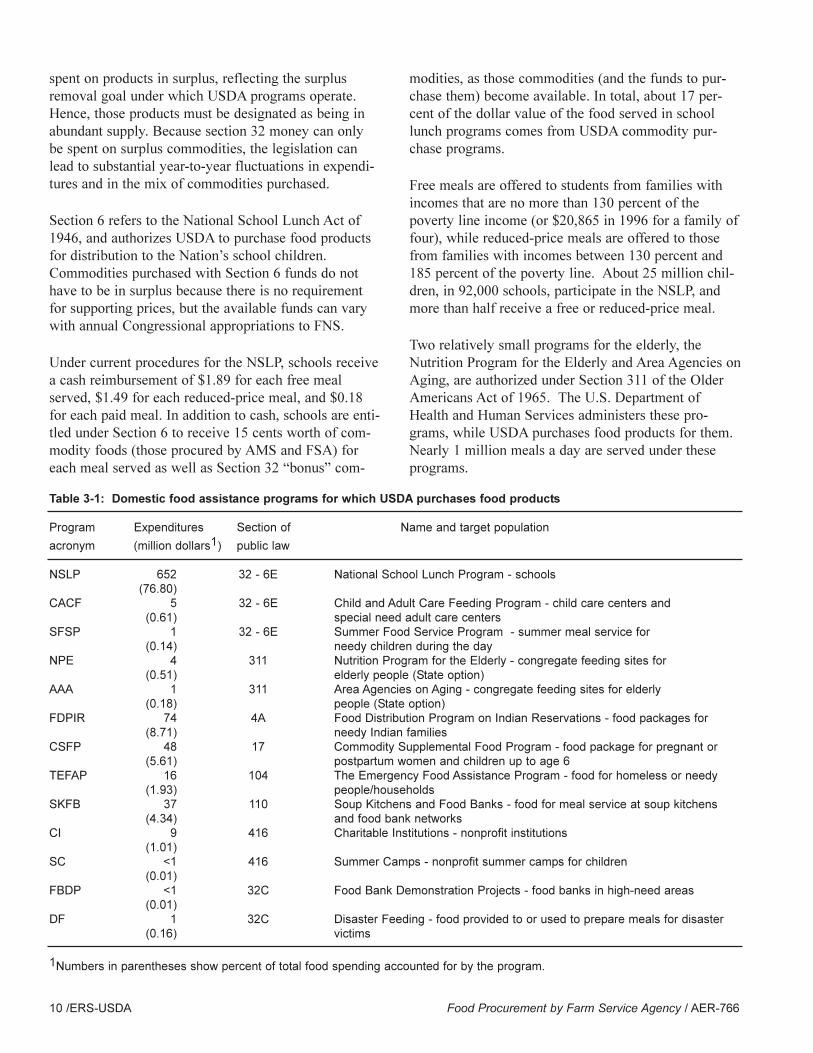
Table 3-1 lists the 13 programs, identifies their targetpopulations, links them to their supporting legislation,and shows the amounts spent on food procurement infiscal 1996. The column headed �Section of publiclaw� lists numbers that refer to the sections of the origi-nal legislation that authorize each program�s procure-ment activity; those numbers are common referencesfor program administrators.
The 13 programs spent a total of $849 million on foodprocurement in fiscal 1996. The four largest pro-grams�the National School Lunch Program (NSLP),the Food Distribution Program on Indian Reservations,the Commodity Supplemental Food Program, and Soup
Kitchens and Food Banks�purchased more than 95percent of the total, about $811 million. The NSLPalone accounted for almost 77 percent of the 1996 total,or $652 million.
The 13 programs are authorized under several differentstatutes, which create a variety of funding sources andfunding constraints for USDA. The first three programsin table 3-1, including the NSLP, are primarily support-ed by two separate congressional laws and subsequentamendments to these laws.
Section 32 refers to that section of the AgriculturalAdjustment Act of 1935. The Section authorizesUSDA to support prices of commodities in surplus bypurchasing them in the marketplace, and also authorizesUSDA to distribute commodities domestically. The leg-islation authorizes the funding of these activities withmoney collected from customs receipts; this funding isprimarily administered by AMS to purchase meat andlivestock, fruit and vegetable commodities, usuallyabout $400 million annually.
Funds used under section 32 are designed to supportagricultural markets. As a result, the funds are to beapplied to the purchase of relatively unprocessed foodproducts that are close to agricultural commodities inthe distribution chain. That is, the funds can be used topurchase pork but not frozen sausage pizza, and theycan be used to purchase chicken but cannot be appliedto paying for processing the chicken into chickennuggets. In addition, section 32 money is intended to be
Food Procurement by Farm Service Agency / AER-766 USDA-ERS / 9
CHAPTER 3
USDA DOMESTIC FOOD PROCUREMENT: PROGRAMS AND EXPENDITURES
spent on products in surplus, reflecting the surplusremoval goal under which USDA programs operate.Hence, those products must be designated as being inabundant supply. Because section 32 money can onlybe spent on surplus commodities, the legislation canlead to substantial year-to-year fluctuations in expendi-tures and in the mix of commodities purchased.
Section 6 refers to the National School Lunch Act of1946, and authorizes USDA to purchase food productsfor distribution to the Nation�s school children.Commodities purchased with Section 6 funds do nothave to be in surplus because there is no requirementfor supporting prices, but the available funds can varywith annual Congressional appropriations to FNS.
Under current procedures for the NSLP, schools receivea cash reimbursement of $1.89 for each free mealserved, $1.49 for each reduced-price meal, and $0.18for each paid meal. In addition to cash, schools are enti-tled under Section 6 to receive 15 cents worth of com-modity foods (those procured by AMS and FSA) foreach meal served as well as Section 32 �bonus� com-
modities, as those commodities (and the funds to pur-chase them) become available. In total, about 17 per-cent of the dollar value of the food served in schoollunch programs comes from USDA commodity pur-chase programs.
Free meals are offered to students from families withincomes that are no more than 130 percent of thepoverty line income (or $20,865 in 1996 for a family offour), while reduced-price meals are offered to thosefrom families with incomes between 130 percent and185 percent of the poverty line. About 25 million chil-dren, in 92,000 schools, participate in the NSLP, andmore than half receive a free or reduced-price meal.
Two relatively small programs for the elderly, theNutrition Program for the Elderly and Area Agencies onAging, are authorized under Section 311 of the OlderAmericans Act of 1965. The U.S. Department ofHealth and Human Services administers these pro-grams, while USDA purchases food products for them.Nearly 1 million meals a day are served under theseprograms.
10 /ERS-USDA Food Procurement by Farm Service Agency / AER-766
Table 3-1: Domestic food assistance programs for which USDA purchases food products
Program Expenditures Section of Name and target population
acronym (million dollars1) public law
NSLP 652 32 - 6E National School Lunch Program - schools(76.80)
CACF 5 32 - 6E Child and Adult Care Feeding Program - child care centers and(0.61) special need adult care centers
SFSP 1 32 - 6E Summer Food Service Program - summer meal service for (0.14) needy children during the day
NPE 4 311 Nutrition Program for the Elderly - congregate feeding sites for (0.51) elderly people (State option)
AAA 1 311 Area Agencies on Aging - congregate feeding sites for elderly (0.18) people (State option)
FDPIR 74 4A Food Distribution Program on Indian Reservations - food packages for (8.71) needy Indian families
CSFP 48 17 Commodity Supplemental Food Program - food package for pregnant or (5.61) postpartum women and children up to age 6
TEFAP 16 104 The Emergency Food Assistance Program - food for homeless or needy (1.93) people/households
SKFB 37 110 Soup Kitchens and Food Banks - food for meal service at soup kitchens (4.34) and food bank networks
CI 9 416 Charitable Institutions - nonprofit institutions(1.01)
SC <1 416 Summer Camps - nonprofit summer camps for children(0.01)
FBDP <1 32C Food Bank Demonstration Projects - food banks in high-need areas(0.01)
DF 1 32C Disaster Feeding - food provided to or used to prepare meals for disaster (0.16) victims
1Numbers in parentheses show percent of total food spending accounted for by the program.
Sections 4A and 17 refer to those sections in theAgriculture and Consumer Protection Act of 1973.This law authorizes the Food Distribution Program onIndian Reservations and the Commodity SupplementalFood Program. Each distributes food packages; about115,000 people participate in the first, and about400,000 in the second. These programs received thesecond and third largest amounts spent for commodityand product in fiscal 1996, over $120 million.
Two programs were authorized through the HungerPrevention Act of 1988. Section 104 authorizes USDAto distribute surplus commodities to needy individualsor households, while Section 110 authorizes USDA topurchase and distribute commodities and food productsto soup kitchens and food banks.
Section 416 of the Agricultural Adjustment Act of 1949authorizes the Commodity Credit Corporation (CCC) tomake available CCC-owned commodities for distribu-tion. FSA administers the CCC�a public corporationthat supports the prices of commodities through nonre-course commodity loans and manages commoditiesacquired by the agency. The commodities providedunder Section 416 may be in private stocks or in publicstocks that were acquired through forfeiture of nonre-course commodity loans. Commodities donated underthis legislation are known as bonus commodities, and
may be used in any of these programs.
Section 32C also refers to Section 32 in the AgriculturalAdjustment Act of 1935. Section 32C funds are fundsset aside by the Secretary for use in extreme surplus orto provide for disaster relief. These funds also comefrom customs receipts, and may also be used in any ofthe other programs in table 3-1. They are the primarysource for the Food Demonstration Projects andDisaster Feeding Programs. Section 32C funds areused primarily for purchasing and distributing AMScommodities.
Program Expenditures
FSA and AMS purchase different products. AMS isresponsible for purchasing �Group A� commodities,which include poultry, red meat, fish, eggs, and freshand processed fruits and vegetables. FSA purchases�Group B� commodities, which include dairy products(primarily cheese but also including butter and evapo-rated milk), grain-based products (such as wheat flour,corn products, pasta and ready-to-eat cereal), peanutproducts, honey, vegetable oil, rice, and infant formula.Most Group B products are derived from agriculturalproducts that are or have been subject to agriculturalsupport programs also administered by FSA.
Food Procurement by Farm Service Agency / AER-766 USDA-ERS / 11
Million dollars
Total
Group A
Group B
1979 80 81 82 83 84 85 86 87 88 89 90 91 92 93 94 95 960
200
400
600
800
1,000
1,200
1,400
1,600
1,800
2,000
2,200
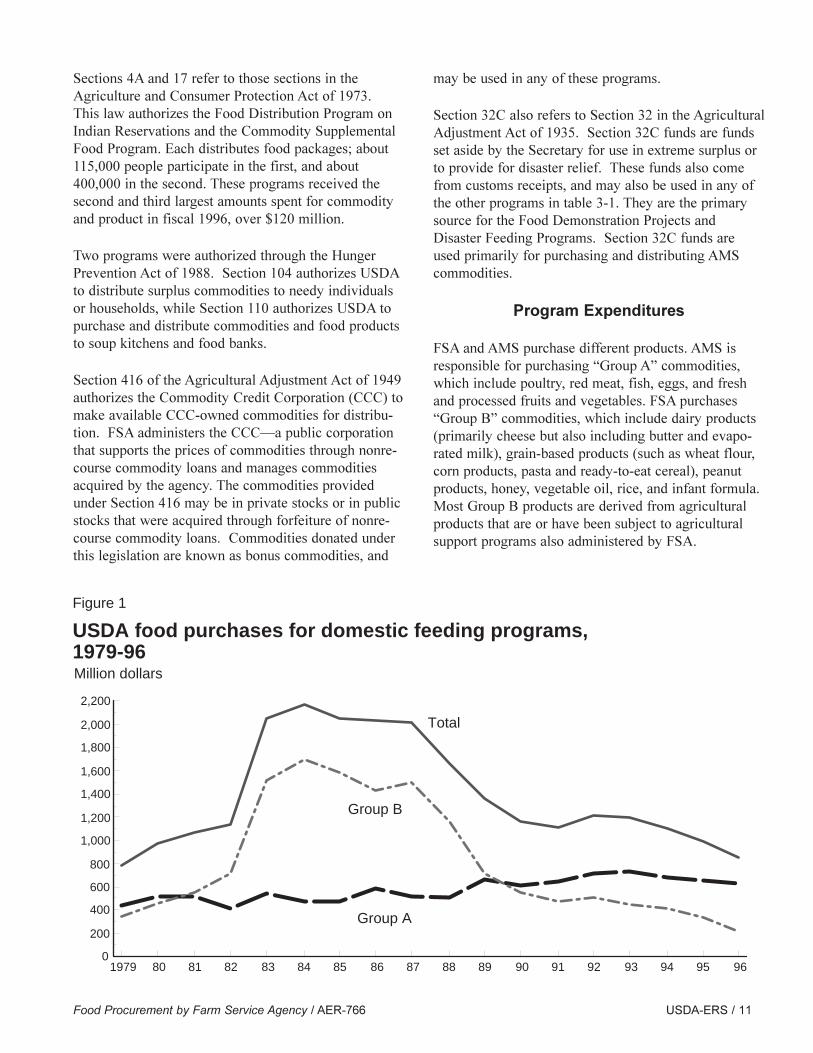
Figure 1
USDA food purchases for domestic feeding programs, 1979-96
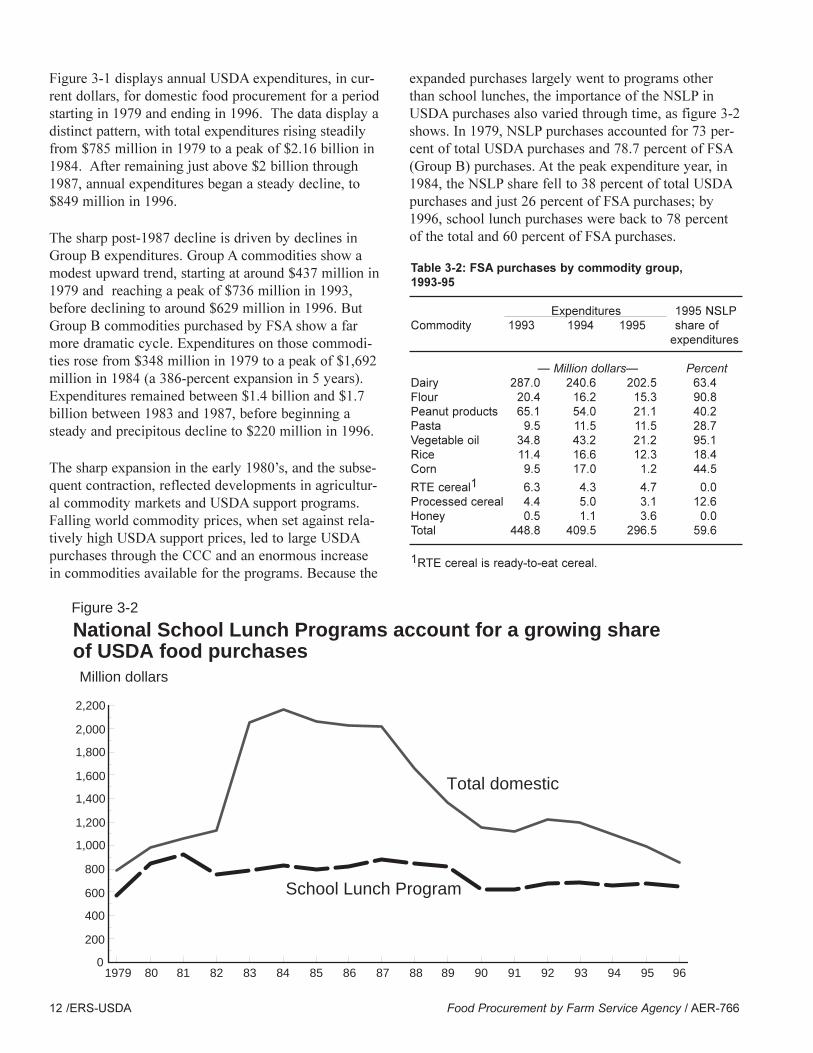
Figure 3-1 displays annual USDA expenditures, in cur-rent dollars, for domestic food procurement for a periodstarting in 1979 and ending in 1996. The data display adistinct pattern, with total expenditures rising steadilyfrom $785 million in 1979 to a peak of $2.16 billion in1984. After remaining just above $2 billion through1987, annual expenditures began a steady decline, to$849 million in 1996.
The sharp post-1987 decline is driven by declines inGroup B expenditures. Group A commodities show amodest upward trend, starting at around $437 million in1979 and reaching a peak of $736 million in 1993,before declining to around $629 million in 1996. ButGroup B commodities purchased by FSA show a farmore dramatic cycle. Expenditures on those commodi-ties rose from $348 million in 1979 to a peak of $1,692million in 1984 (a 386-percent expansion in 5 years).Expenditures remained between $1.4 billion and $1.7billion between 1983 and 1987, before beginning asteady and precipitous decline to $220 million in 1996.
The sharp expansion in the early 1980�s, and the subse-quent contraction, reflected developments in agricultur-al commodity markets and USDA support programs.Falling world commodity prices, when set against rela-tively high USDA support prices, led to large USDApurchases through the CCC and an enormous increasein commodities available for the programs. Because the
expanded purchases largely went to programs otherthan school lunches, the importance of the NSLP inUSDA purchases also varied through time, as figure 3-2shows. In 1979, NSLP purchases accounted for 73 per-cent of total USDA purchases and 78.7 percent of FSA(Group B) purchases. At the peak expenditure year, in1984, the NSLP share fell to 38 percent of total USDApurchases and just 26 percent of FSA purchases; by1996, school lunch purchases were back to 78 percentof the total and 60 percent of FSA purchases.
12 /ERS-USDA Food Procurement by Farm Service Agency / AER-766
National School Lunch Programs account for a growing share of USDA food purchases
1979 80 81 82 83 84 85 86 87 88 89 90 91 92 93 94 95 960
200
400
600
800
1,000
1,200
1,400
1,600
1,800
2,000
2,200
Million dollars
Total domestic
School Lunch Program
Figure 3-2
Table 3-2: FSA purchases by commodity group, 1993-95
Expenditures 1995 NSLPCommodity 1993 1994 1995 share of
expenditures
� Million dollars� PercentDairy 287.0 240.6 202.5 63.4 Flour 20.4 16.2 15.3 90.8 Peanut products 65.1 54.0 21.1 40.2 Pasta 9.5 11.5 11.5 28.7 Vegetable oil 34.8 43.2 21.2 95.1 Rice 11.4 16.6 12.3 18.4 Corn 9.5 17.0 1.2 44.5
RTE cereal1 6.3 4.3 4.7 0.0 Processed cereal 4.4 5.0 3.1 12.6 Honey 0.5 1.1 3.6 0.0 Total 448.8 409.5 296.5 59.6
1RTE cereal is ready-to-eat cereal.
At present, FSA purchases of Group B commodities areincreasingly concentrated on one major program, andare also concentrated on a major commodity group.Table 3-2 shows that dairy purchases now account forover 68 percent of FSA purchases, and for nearly two-thirds of the agency�s NSLP purchases. In turn, cheeseaccounts for the major share of dairy purchases.
U.S. agricultural policy, as set in 1996 farm legislation,has moved away from a reliance on price supports forprogram commodities. If that policy continues, thenprocurement of bonus commodities under Section 416legislation will become a less important driver ofUSDA procurement. In turn, annual entitlement appro-priations will become more important, and the NSLPwill continue to be the primary recipient of USDAfoods.
Food Procurement by Farm Service Agency / AER-766 USDA-ERS / 13
Introduction
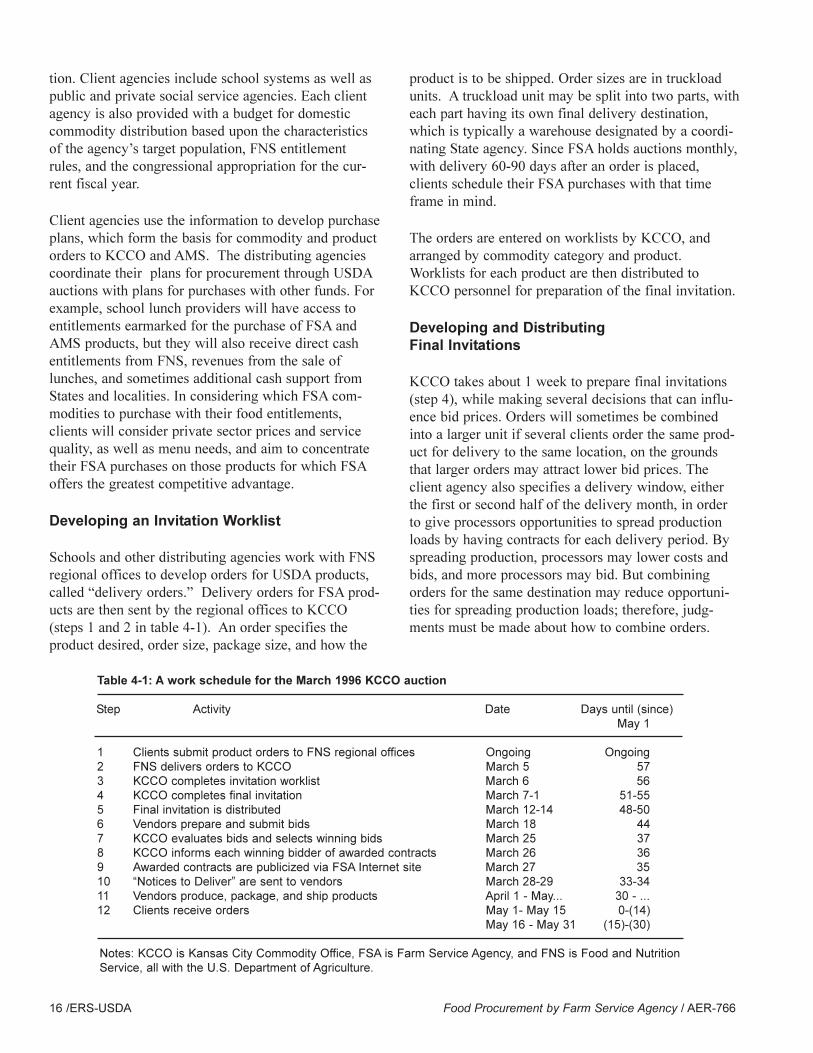
To understand the issues involved in structuring FSAauctions, one needs to understand how the existingprocess works. This chapter describes the stepsinvolved in administering an FSA auction, using as anexample an auction held by FSA�s Kansas CityCommodity Office (KCCO) in late March 1996 forproducts to be delivered to distributing agencies duringMay 1996. That auction is representative of most FSAauctions, but, at the close of the chapter, we discussrecent auction changes for some commodities.
Table 4-1 summarizes the auction; column 2 defines thekey steps in the auction, while column 3 lists the asso-ciated dates. Column 4 lists the time remaining, at eachstep, until the beginning of the delivery month (May 1,in this case). Auctions for other months frequently haveslightly different days of the month for the procurementactivities, but essentially the same time remaining, afteraccounting for weekends and holidays, until the begin-ning of the delivery month. In a typical auction, KCCOaims to schedule dates for each step by working back-ward from the beginning of the delivery month. Forexample, KCCO aims to receive bids and select andinform auction winners during a period that is typically5 to 6 weeks prior to the opening of the delivery month.Actual deliveries can be scheduled for two periods�thefirst or second half of the delivery month.
KCCO aims to prepare final invitations about 8 weeks(55 days) before the beginning of a delivery month. A
final invitation is FSA�s notice of intent to purchaseproducts, and is sent to vendors and the trade; it is a listof the tendered contracts for purchasing products. The55-day span reflects auction experience: a shorter spanwould result in more failures to complete the remainingsteps on time and could increase the cost of completingthese activities.
FSA excludes product orders that do not arrive by thedeadline. Excluded orders may sometimes be includedin a special supplemental invitation and auction, withdelivery in the same month as the current auction.Otherwise, late orders are held for the next month�sauction.
A supplemental auction includes all the steps in otherauctions, but with the time until the beginning of thedelivery month compressed for steps 4 through 11.Generally, deliveries for a supplemental auction are inthe latter half of the delivery month to ease the schedul-ing problems caused by missing the 55-day deadline.The current or regular auction has deliveries in both thefirst and second halves of the delivery month.
The FSA Auction Process
Information and Client Planning
USDA�s Food and Nutrition Service (FNS) providesclient agencies with a list of products that can beobtained from FSA and AMS auctions along with theirexpected prices, based on experience and forecast infla-
Food Procurement by Farm Service Agency / AER-766 USDA-ERS / 15
CHAPTER 4
FSA PROCUREMENT AUCTIONS: HOW THE PROCESS WORKS
tion. Client agencies include school systems as well aspublic and private social service agencies. Each clientagency is also provided with a budget for domesticcommodity distribution based upon the characteristicsof the agency�s target population, FNS entitlementrules, and the congressional appropriation for the cur-rent fiscal year.
Client agencies use the information to develop purchaseplans, which form the basis for commodity and productorders to KCCO and AMS. The distributing agenciescoordinate their plans for procurement through USDAauctions with plans for purchases with other funds. Forexample, school lunch providers will have access toentitlements earmarked for the purchase of FSA andAMS products, but they will also receive direct cashentitlements from FNS, revenues from the sale oflunches, and sometimes additional cash support fromStates and localities. In considering which FSA com-modities to purchase with their food entitlements,clients will consider private sector prices and servicequality, as well as menu needs, and aim to concentratetheir FSA purchases on those products for which FSAoffers the greatest competitive advantage.
Developing an Invitation Worklist
Schools and other distributing agencies work with FNSregional offices to develop orders for USDA products,called �delivery orders.� Delivery orders for FSA prod-ucts are then sent by the regional offices to KCCO(steps 1 and 2 in table 4-1). An order specifies theproduct desired, order size, package size, and how the
product is to be shipped. Order sizes are in truckloadunits. A truckload unit may be split into two parts, witheach part having its own final delivery destination,which is typically a warehouse designated by a coordi-nating State agency. Since FSA holds auctions monthly,with delivery 60-90 days after an order is placed,clients schedule their FSA purchases with that timeframe in mind.
The orders are entered on worklists by KCCO, andarranged by commodity category and product.Worklists for each product are then distributed toKCCO personnel for preparation of the final invitation.
Developing and Distributing Final Invitations
KCCO takes about 1 week to prepare final invitations(step 4), while making several decisions that can influ-ence bid prices. Orders will sometimes be combinedinto a larger unit if several clients order the same prod-uct for delivery to the same location, on the groundsthat larger orders may attract lower bid prices. Theclient agency also specifies a delivery window, eitherthe first or second half of the delivery month, in orderto give processors opportunities to spread productionloads by having contracts for each delivery period. Byspreading production, processors may lower costs andbids, and more processors may bid. But combiningorders for the same destination may reduce opportuni-ties for spreading production loads; therefore, judg-ments must be made about how to combine orders.
16 /ERS-USDA Food Procurement by Farm Service Agency / AER-766
Table 4-1: A work schedule for the March 1996 KCCO auction
Step Activity Date Days until (since) May 1
1 Clients submit product orders to FNS regional offices Ongoing Ongoing2 FNS delivers orders to KCCO March 5 573 KCCO completes invitation worklist March 6 564 KCCO completes final invitation March 7-1 51-555 Final invitation is distributed March 12-14 48-506 Vendors prepare and submit bids March 18 447 KCCO evaluates bids and selects winning bids March 25 378 KCCO informs each winning bidder of awarded contracts March 26 369 Awarded contracts are publicized via FSA Internet site March 27 3510 �Notices to Deliver� are sent to vendors March 28-29 33-3411 Vendors produce, package, and ship products April 1 - May... 30 - ...12 Clients receive orders May 1- May 15 0-(14)
May 16 - May 31 (15)-(30)
Notes: KCCO is Kansas City Commodity Office, FSA is Farm Service Agency, and FNS is Food and Nutrition Service, all with the U.S. Department of Agriculture.
Some orders are selected as small-business set asides.Set-aside contracts give qualified small businesses a 5percent bidding advantage; that is, the award will bemade to a small firm if its bid is no more than 5 percentgreater than the best bid.
A final invitation for a particular commodity group,such as flour, will often cover many specific orders.That is, it will separately list each delivery of a specificproduct, distinguished by package size and precisecharacteristics. For each product order, it will list a cityor town to which the product is to be delivered (some-times, two will be listed for a split load). The invitationwill specify the quantity being sought for each productand destination, and it will identify any specific trans-portation or distinctive packaging requirements.
KCCO solicits bids by sending the final invitation foreach commodity category to the appropriate vendors(step 5). The agency also publicizes the final invitationto the trade and to the public for each product throughmailings and through electronic postings on the Inter-net. After receiving the solicitation, vendors have about1 week to prepare their bids and return them to KCCO.
Bid Preparation and Selection
In preparing bids (step 6), vendors account for expectedcompetition as well as product costs. Costs include theexpected costs of processing, including labor, energy,and packaging materials, and also must reflect expectedprices for the agricultural commodities that will beprocessed into FSA products. Bidders are generallyfairly certain of future agricultural prices because bid-ding occurs only 1 to 6 weeks before processing andbecause many FSA products are based on agriculturalcommodities that have deep futures markets.
Bid prices are FOB destination at the warehouse andprocessor locations are specified by distributing agen-cies. Vendors pay transportation costs to receiving loca-tions and, therefore, account for likely transportationcosts when preparing bids. Bids also reflect distinctiveUSDA requirements, such as USDA labels, unusualpackaging or product standards, and inspections.
Finally, bidders consider likely capacity utilizationwhen preparing bids. Those who expect to have excesscapacity at the time of processing are likely to bidaggressively (low). Since they will need to pay capitaland other fixed costs whether they win the bid or not,
they will seek to win the bid as long as the revenuesfrom winning exceed only the additional variable costsassociated with filling an order. By contrast, firms thatexpect to be producing near full capacity will bid high-er; for a winning bid to be worthwhile, it will have toreturn more to the firm than the production that it sup-plants. In short, firms will be more likely to add�capacity charges� to the bid when they are alreadyproducing near full capacity.
A vendor can specify a total quantity restriction; that is,the vendor can be awarded contracts only up to therestriction quantity, even if the vendor is the low bidderon other contracts. In addition, a vendor may submit aminimum quantity restriction that specifies the lowestquantity of product the vendor is willing to supply. Theminimum restriction means that the vendor chooses notto be awarded any contracts if the total quantity won isless than the specified minimum.
Bids submitted by a vendor can vary among contracts,even among contracts for the same product to the samedestination. However, a vendor can bid only one pricefor an entire contract. Frequently, bidders submitrevised bids just before they are opened to reflect thelatest market information.
Bid Evaluation and Selection of Winners
KCCO opens all the bids at the same time (step 7). Norevised bids are accepted after the envelopes areopened. The bids are evaluated and winners are select-ed on the day the envelopes are opened so that vendorscan be notified the next day. Bids are binding contracts;selection of a winner obligates the winner to fulfill thecontract even before being notified.
The bid evaluation is complicated because of the mini-mum and maximum quantity restrictions and the 5-per-cent bidding advantage given to small businesses. Asearch procedure implemented on the KCCO computer,known as linear programming, is used to select thecombination of contract winners that yields the lowesttotal procurement costs while satisfying the restrictions.
Winning bids that are greater than a maximum purchase(constructed) price are reviewed. Constructed prices arebased on prior experience and expectations of inflation,and are developed by KCCO commodity analysts priorto bid evaluation. KCCO may decide to accept the bid,
Food Procurement by Farm Service Agency / AER-766 USDA-ERS / 17
or they may approach the winning bidder and attemptto get the bid reduced, or they may reject the bid andcancel the contract. Orders in canceled contracts maybe reintroduced in the next auction round, and thoseorders are delivered late to clients, or KCCO may issuea supplemental invitation to purchase the orders for thesame delivery period.
Announcement of Awards
Winning vendors are notified quickly, the day afterselection, since those who have not already purchasedmaterials (step 8) may consequently be placed in specu-lative positions. The price risks from these speculativepositions increase in direct proportion to the elapsedtime between bid submission and notification of con-tract awards. Winning bidders then have about 5-7weeks to fulfill contracts with delivery in the first halfof the delivery month, and about 7-9 weeks for con-tracts with delivery in the second half.
KCCO provides public notice of the auction results 2days after bid openings and evaluations (step 9). Theresults revealed include the price and winning bidder oneach contract. Releasing this information helps ensurethe public that the auction is competitive and providesvendors that did not win with information about howmuch they must lower their bids to win at the next auc-tion. It is important to release the information quicklybecause some losing bidders may have purchased mate-rials in anticipation of winning contracts, and quickrelease allows for easier reallocation of materials.Finally, quick public release via electronic means savesresources for FSA and KCCO; agency personnel nolonger have to respond directly to frequent requests forinformation.
Notices to Deliver
KCCO produces a document for each contract, calledthe Notice to Deliver, and sends it to the winning bid-der (step 10). The notice includes the product descrip-tion (for example, rice, milled U.S. No. 2 medium), aswell as the contract number, invitation number, deliveryorder number, commodity code, contract size, packagesize, and shipment mode. Notices also list the name,address, and telephone number of the vendor, the dis-tributing agency, and the designated agency personresponsible for receiving the product (the consignee).The notice to deliver provides the vendor with all theinformation necessary for fulfilling the contract.
Production and Shipping
The vendor produces the product and ships it to theconsignee (step 11). Contracts call for USDA inspectorsto be on site at the plant during production runs forUSDA commodities. Vendors must, therefore, arrangefor inspection by personnel from AMS (peanut anddairy products and salad dressing) or GIPSA (all otheritems), and must generally time production runs fortheir presence. For remote or small plants, this cansometimes lead to delays. Inspectors monitor produc-tion processes and may perform some onsite tests. Theycertify product type, quality (through lab tests), andweight, and also certify that packaging meets contractstandards for information, strength, and sanitaryrequirements. Most USDA products must be shippedwith USDA labels, instead of the processor�s normalbrands or private labels.
Contracts also require that product samples be sent toUSDA-approved labs for testing. Required tests varywith the product. For example, USDA aims for certainnutritional goals in cheese purchases, and also prefers aproduct that will melt properly when cooked, whilestretching across a pizza or hamburger. Precise lab testsfor cheese include tests of fat, moisture, salt, and acidcontent. Inspection procedures can also sometimes leadto delays, and products are sometimes shipped pendingreceipt of test results, at the vendor�s risk.
Delays are not always due to USDA inspection andtesting requirements. Sometimes processors will delib-erately delay production because an unexpected, morelucrative, order came in. USDA can impose fines forlate delivery, and can also suspend contracts for ven-dors that are chronically late. If USDA does not use thetools at its disposal, vendors can have strong incentivesfor late delivery, especially when vendors are producingnear full capacity.
Distribution
The vendor informs the distributing agency by fax thatthe product order is being shipped (step 12). This noti-fication must be given on the date the product isshipped. The trucker or a rail employee calls the con-signee, at least 24 hours prior to delivery, to scheduledelivery. FSA products are often shipped to a manufac-turing plant for further processing. For example, schooldistricts often use FSA entitlements to purchase flourand cheese, which are then shipped to nearby proces-
18 /ERS-USDA Food Procurement by Farm Service Agency / AER-766
sors who make them into frozen pizza or other morehighly processed foods.
Title to the product is transferred from vendor to dis-tributing agency at the receiving location when the con-signee signs for the product. At this stage, USDA�sresponsibility for product quality ends. The consignee isthen responsible for any further processing, as well asproduct transportation to client facilities and handling atdining facilities.
Recent Variants on the FSAAuction Process
FSA has altered the typical process in recent auctionsfor several commodities. The alterations affect the tim-ing of the auction process, the use of USDA labels, andthe reliance on USDA inspection.
Commercially labeled items in five product cate-gories�infant formula, evaporated milk, instant nonfatdry milk, ready-to-eat cereal, and rice cereal�are beingpurchased under a 5-year pilot program. The productsare purchased not for the school lunch program but fortwo smaller programs�the Commodity SupplementalFood Program (CSFP) and the Food DistributionProgram on Indian Reservations (FDPIR).
By purchasing commercially labeled products, vendorsmay supply USDA programs out of existing inventory,thus altering the production process outlined in step 11.Moreover, with commercial labels, FSA now relies onvendor certification of quality, since the vendor�s brandis on the package. As a result, USDA inspection (also instep 11) is forgone.
The process outlined in table 4-1 uses a series ofmonthly auctions to procure products to be delivered toclients 5-9 weeks after the selection of winning bids. In
infant formula, KCCO has lengthened the contract to afull year, while at the same time allowing commerciallabels on formula. Invitations now specify an indefinitequantity to be delivered throughout the year, instead ofspecifying precise quantities to be delivered to specificlocations each month. Contracts can be less precise ininfant formula because bids show no geographic varia-tion. Because of the longer contract duration, the vol-ume at bid is considerably larger, and KCCO hopes thatlarger volume will induce more competitive biddingamong the small number of manufacturers. Similarly,KCCO has lengthened contract durations for ready-to-eat cereal purchases as part of the experiment in pur-chasing commercially labeled products.
KCCO has altered the bidding process in another wayfor cheese purchases. It now issues rolling invitations,covering several months, for deliveries of cheese. Forexample, KCCO will issue an invitation in July to bidon deliveries of cheese in specified 2-week windowsfrom September through December. The August invita-tion will then include any new school orders forOctober through January deliveries. In essence, the newcheese process adds certain elements of flexibility:firms can now place bids further in the future than theydid under the prior system, and they can achieve morecertainty, in that they can commit to USDA productionfor a quarter of a year at a time instead of a month.Rolling contracts also provide KCCO with the opportu-nity to reject winning bids that are above constructedprices, and still deliver products on time.
Under the cheese experiment, KCCO enters orders asthey come in. Clients now have some reason to enterearly orders, since KCCO will act upon them. In addi-tion, KCCO can use rolling contracts to encourageclient agencies to shift the temporal pattern of theirorders, away from peak and toward off-peak periods, totake advantage of seasonal price fluctuations.
Food Procurement by Farm Service Agency / AER-766 USDA-ERS / 19
Introduction
FSA sets precise requirements for the commodities thatit buys for food assistance programs. Those require-ments include product specifications (such as nutrition-al guidelines), packaging and labeling standards, andrules for product testing and onsite product inspectionto ensure compliance with specifications. From thoseprocessors who are willing to offer products that meetFSA requirements, the agency then chooses vendors byusing a bidding process, as outlined in chapter 4, that isdesigned to use competition to purchase products at thelowest feasible prices.
When FSA chooses a specific bidding process, it makesseveral other choices. It specifies the timing of theprocess: FSA decides when invitations to bid will beannounced, when they will be closed, how quickly theaward will be made upon closure, and how quickly theproduct must be delivered upon award. In defining theaward and the bidding process, FSA also specifies anytransportation requirements, plans solicitation of poten-tial bidders, formulates procedures for aiding smallbusinesses, sets damages for noncompliance with awardrequirements, and sets policies for cancellation of aninvitation if bids appear to be noncompetitive.
Most awards are for precisely defined quantities (say,42,800 pounds) of a precisely defined product (all-pur-pose bleached wheat flour in 50-pound bags) to bedelivered to a precise location (a warehouse in Omaha,Nebraska) during a set time (between November 1 and
November 15). But in principle, the award could alsobe for the delivery of an indefinite quantity (with, forexample, a minimum of 1 million pounds and a maxi-mum of 25 million) throughout a year. In other words,FSA can also choose the duration and quantity of theaward at bid.
FSA acts on behalf of other clients, such as State dis-tributing agencies. When it designs the bidding process,FSA must also specify the timing that clients must fol-low to place orders. That is, client agencies must deliv-er food orders to FSA 55 days prior to the deliverymonth in order to be included in an invitation order toreceive delivery in a specified time window. FSA�s pol-icy choices for order, auction, and delivery timing ulti-mately drive one dimension of service quality�tempo-ral responsiveness to client orders.
These are all policy choices. FSA could choose otherproduct requirements or other auction designs; alterna-tive choices could affect processor costs, productprices, product quality, and FSA service quality. Actualchoices often can involve a tradeoff of a gain in onedimension of performance against a loss in another(McAfee and McMillan, 1987; Laffont and Tirole,1993; Wolfstetter, 1996). Key FSA decisions revolvearound four interlinked areas: product packaging andlabeling requirements, inspection requirements, the tim-ing of order, bid, and delivery stages, and the design ofprocurement auctions. We discuss the issues surround-ing these areas in this chapter, and begin by showingwhy we say these issues are interlinked.
Food Procurement by Farm Service Agency / AER-766 USDA-ERS / 21
CHAPTER 5
ISSUES IN USDA PROCUREMENT POLICIES
Labels Require Inspection: The Need for Quality Certification
in USDA Procurement
FSA food procurement procedures are not unique, butthey do differ in important ways from those used bycommercial buyers, as well as some other governmentagencies. For example, some private firms (such asnational fast food chains, retail supermarket firms, orwholesalers arranging for private-label products) willselect a small set of qualified suppliers through anintense search. Once selected, a qualified supplier willreceive a large volume of orders from the firm, at rela-tively profitable prices. Because the status of qualifiedsupplier is so important to a supplier�s profits, the sup-plier will have strong incentives to maintain agreed lev-els of quality and therefore to retain qualified supplierstatus. Firms using that procurement strategy, which isquite similar to prime vendor programs, trade off higherproduct prices to gain greater supplier efforts to main-tain product quality and to provide timely service.
FSA uses auctions to procure food commodities, andthe auctions are designed to get favorable prices forFSA clients by relying on price competition among bid-ders. That is, FSA does not form long-term relationswith suppliers. Moreover, FSA generally does not pur-chase products with commercial labels (that is, com-mon supermarket brands). Instead, USDA requires thatall USDA products be packaged according to specificUSDA directions and carry USDA labels. While theprocedure can generate strong price competition amongbidders, resulting in lower FSA costs, it also providesbidders with incentives to reduce their own costs bydelivering low-quality products. Since the products donot carry commercial labels, quality problems will notdamage the reputations of vendors� commerciallylabeled products; instead, USDA and its client agenciesbear the risks of poor product quality.
FSA aims to control those risks by setting precise prod-uct specifications, by requiring the presence of USDAinspectors on site during production of USDA products,and by performing laboratory tests of product samples,to ensure that delivered products adhere to contractspecifications. In short, FSA�s inspection requirementsfollow from the use of USDA labeling requirementsand a competitive bidding process.
Critics note four potential problems with current USDAproduct requirements. They may increase costs, both to
processors and to USDA, compared with commercialpractices that realize the same quality goals. They mayerode one dimension of service quality�the timelinesswith which commodities are delivered to the warehous-es designated by States, and ultimately to client agen-cies. They may limit competition for USDA awards,and thereby raise bidder prices, if some processorsdecide not to participate because of the requirements.Finally, they may limit the range of products availableto school lunch programs and other USDA clients.
Some consumers associate the USDA label with lowproduct quality, but in fact, FSA typically sets relativelyhigh product specifications (for example, apples mustbe grade A, and rice must be U.S. No. 1). Actual quali-ty problems rarely stem from poor product specifica-tions or from lax inspection standards. Problems occa-sionally arise from poor vendor compliance with prod-uct specifications, and from inspector failures to imme-diately detect noncompliance. More often, quality prob-lems can arise in the distribution channel. FSA�sresponsibility for product quality ends when commodi-ties are delivered to warehouses; from there, responsi-bility for products falls to States and school districts.After being held in warehouses, products may beshipped to schools (using a variety of different forms oftransportation) or they may be shipped to other plantsfor further processing before being shipped to schooldistricts. At a district, products may be held in invento-ry and then prepared into meals at schools, or they maybe prepared at a district�s central kitchens before mealsare transported to schools. Once meals are at a schoolcafeteria line, they may be on a serving line for a sig-nificant period of time before consumption. Productquality can deteriorate at each stage. Because of thetime lags at each stage of delivery, unacceptable qualityin a package of cheese or a can of peanut butter maynot be detected until opened at a cafeteria. By then,several weeks or even months may have passed fromthe date the product was shipped from the manufactur-er. In many cases, this sort of lag makes it difficult toassign accountability for quality problems.
USDA Inspection Requirements
The Agency maintains a distinctive and relativelydemanding set of inspection requirements. Contractscall for USDA inspectors to be on site at the plant dur-ing production runs for USDA commodities. Vendorsmust arrange for inspection by personnel from the Foodand Drug Administration (FDA) for infant formula,
22 /ERS-USDA Food Procurement by Farm Service Agency / AER-766
AMS (peanut and dairy products and salad dressing), orGIPSA (all other items), and must generally time pro-duction runs for their presence. Inspectors monitor pro-duction processes, assemble product samples for labtests, and may perform some onsite tests. They certifyproduct type, quality, and weight, and also certify thatpackaging meets contract standards for strength, infor-mation, and sanitary requirements.
Contracts also require that product samples be sent toUSDA labs, or USDA-approved labs, for testing. Re-quired tests vary with the product. For example, USDAaims for certain nutritional goals in cheese purchases,and also prefers a product that will melt properly whencooked, while stretching across a pizza or hamburger.Precise lab tests for cheese include tests of fat, mois-ture, salt, and acid content. Vendors pay fees for inspec-tion and lab tests, fees that are ultimately recovered inproduct prices at auctions. Because USDA�s tests areunique (some would not be done except for USDArequirements), they can increase bid prices by amountsranging from 0.5 percent to 2.0 percent.
Inspection also can impose indirect costs on the pro-grams. Some vendors, typically small plants in moreremote locations, complain of problems in gettinginspectors to come to the plant on a timely basis toinspect the USDA production run. Other vendors com-plain of lags in performing tests at USDA labs andreporting results back in a timely fashion. Some com-plain that specific required tests are not reliable or notuseful. Such indirect costs show up as delays in deliv-ery of products to State warehouses, and as reductionsin the number of firms participating in FSA auctions.
Inspection is closely tied to USDA labeling; USDAlabels place risks on the Department for product qualityfailures. A shift to more commercial labeling wouldalso likely imply a shift to vendor certification of quali-ty, with an attendant shift of responsibility to the ven-dor. That would not imply a cessation of USDA qualitycontrol activities, but rather a shift toward more randominspection of products, with a schedule of penalties andincreased probabilities of inspection for noncompliantplants.
Commercial Labeling of USDA Products
Reliance on USDA labels creates several kinds of coststo the system. USDA packages and labels are not free,
and there is some direct cost associated with them. Butfor regular participants in USDA programs, these donot necessarily increase final product costs comparedwith the use of commercial packaging and labeling.However, several types of indirect costs may be rele-vant. First, specific USDA packaging requirements cansometimes raise product costs if production lines arenot designed for USDA packages. Second, firms that donot typically sell large volumes to USDA may have toplace special orders for USDA packaging and labels,and that may either slow their delivery times or limittheir participation in FSA bidding. Third, reliance oncommodities that are USDA labeled prevents theDepartment from accessing excess inventories of com-mercially branded product that from time to timebecome available at low prices. Most important,reliance on USDA brands means that USDA bears theonus for poor quality control. Hence USDA labelingcreates the need for reliance on government inspectionfor quality control, and that reliance does impose sig-nificant costs.
Our empirical research (described more fully in chapter7) shows that FSA attracts only a few bidders for low-volume products. That is, more firms bid in auctions forflour in 10-pound packages (the most common type andthe most common FSA flour purchase) than in auctionsfor flour in 50- or 100-pound packages, and more bid inauctions for bleached than for unbleached flour. Fewerbid in pasta auctions for rotini than for spaghetti, andfewer firms bid in auctions for low-fat peanut butterthan for other kinds. Now, there may simply be fewerfirms producing relatively unusual items, but the indi-rect costs of USDA requirements (the need to arrangefor USDA labels and packaging, and to time runs forthe presence of inspectors) may be more onerous fordistinctive products, and may therefore limit the num-ber of potential bidders. In turn, few bidders meanhigher bid prices (also shown in chapter 7), thus limit-ing FSA�s price advantage over other forms of procure-ment. If FSA�s advantage is smallest in unusual andlow-volume products, then FSA will be unable to offera wide variety of products economically.
Proponents of restrictions on commercial labelsadvance three reasons for relying exclusively on USDApackaging and labeling. First, they assert that commer-cial labels can induce brand loyalty on the part ofUSDA clients. If clients insist on particular brands, thenFSA buying power will be eroded as commodity vol-umes are split among brands, and FSA and its clients
Food Procurement by Farm Service Agency / AER-766 USDA-ERS / 23
will ultimately pay more for food. Second, most Statesnow route USDA shipments through commercial ware-houses before distribution to schools. Some argue thatcommercial warehouses with ties to particular brandswill offer poor service on rival brands, or will refuse tocarry them. Third, they argue that firms will be unwill-ing to offer their branded products at substantial dis-counts compared with normal commercial prices, andhence reliance on commercial brands will result inhigher prices to FSA.
The third objection becomes irrelevant if processors aregiven the option of providing either commercial orUSDA brands. The second objection should apply onlyin States in which a commercial warehouse has marketpower and the State has limited warehousing and distri-bution alternatives. With alternatives, States can simplycancel contracts for poor performers and shift to ware-housers who are willing to earn money by distributingthe State�s products. Warehousing is not generallythought of as a market activity where firms can main-tain monopoly power; hence, all States should be ableto develop alternatives to poor performers. As a result,the important issues for commercial labeling comedown to brand loyalty.
Brand loyalty is an important issue. Research by ERSshows that leading branded food products in supermar-kets often sell at prices that are substantially higherthan corresponding nonbranded products, by over 30percent, on average, for a sample of 30 staple products,such as rice, spaghetti, peanut butter, and flour�allproducts purchased by FSA (Kaufman et al., 1997).Given the price advantages held by strong brands,many firms will want to sell branded products toschools in hopes of developing brand loyalties that willpersist as school children grow into adults.
USDA officials (as well as producers of nonbrandedproducts) may react in a different way to the same data.They argue that USDA purchase policies shoulddemonstrate wise shopping practices to schoolchildrenby ignoring product differences based solely on imageand aggressively seeking high-quality products at lowprices. Bans on commercial labels would be the prima-ry demonstration of that strategy, but not the onlydemonstration. USDA could alternatively pursue thepurchase of private-label products generally producedfor wholesalers and retailers, but under USDA specifi-cations.
It is important to recognize that brand loyalty can meandifferent things for different FSA products, and it ispossible that decisionmakers can improve program per-formance by a more discriminating use of commerciallabels. For most FSA products, clients are not ultimateconsumers, such as schoolchildren in school lunch pro-grams, but rather school lunch administrators and cookswho prepare foods using USDA commodities. FSA�sultimate consumers see the package for only a fewproducts. Moreover, only some products carry the dis-tinctive flavoring or advertising images that createbrand loyalty. In short, only some products carry therisk that use of commercially labeled product mayinduce later brand loyalty on the part of schoolchildren.
For example, several interviewees remarked thatschoolchildren appeared to have strong taste prefer-ences in some types of chicken products (nuggets, fin-gers): they wanted products to taste like those offeredby leading fast food chains. Schoolchildren also clearlyform strong preferences for different brands of ready-to-eat cereal. But many products do not carry strongbrand attachments�for example, ground beef, pasta,flour, and many cheese products. FSA may need toidentify those commodities where labeling and brandloyalty concerns are strongest, and discriminatebetween those and other commodities.
Issues of Timing and FSAService Reliability
We can think of quality in two dimensions. The first isproduct quality, which concerns the taste, nutritionaladequacy, and deterioration of the products that FSApurchases on behalf of school districts and other clients.The second is FSA service quality, which concerns thespeed with which the agency can respond to clientrequests for food products, the reliability of FSA deliv-eries (that is, the extent to which deliveries arrive whenthey are supposed to arrive), and the variety of FSAproduct offerings.
In considering FSA service quality, recall the timing oforder and delivery from the point of view of clients inschool districts. In the spring (March and April), Statecoordinators release information to school districts forthe following school year. Included in the informationis the likely size of district entitlements as well as therange of allocation among cash, AMS (Group A) com-modities, and FSA (Group B) commodities. Alsoincluded is a listing of likely FSA and AMS commodi-
24 /ERS-USDA Food Procurement by Farm Service Agency / AER-766
ties, and projected prices for those commodities. Manycoordinators also offer advice on the most effectiveways to spend entitlement dollars, and work with dis-tricts to identify cooperative purchasing arrangementsthrough private vendors. Armed with this information,along with additional information on other revenueflows, prices for non-USDA food products, and mealrequirements, school district administrators begin toplan food purchases and to place monthly orders withFSA, AMS, and private vendors for deliveries to sup-port meals beginning in September.
By the time administrators place orders, school districtplans have become relatively inflexible. Districts havetypically designed menus by that time, and have placedorders for non-USDA commodities on the assumptionthat they will be receiving known combinations ofUSDA commodities at known dates. Failure to receivetimely deliveries means that districts will often have toreplace the USDA commodity with the same productpurchased under unfavorable conditions from a privatevendor. Late deliveries, therefore, impose substantialcosts on school districts, and are a primary source ofschool district complaints about FSA service reliability.
Deliveries can be late because a vendor failed to meetthe contractual delivery date in the award. They canalso be late because FSA canceled an auction becausebids were too high. Typically, FSA will issue a supple-mental invitation and attempt to purchase the productfor the same delivery period at a lower price. If this isnot successful, KCCO will place the order and awardup for bid again in the following month, so that cancel-lation then works out to late delivery. In FSA�s view,cancellation is an important tool because it provides ameans to induce bidders to bid more aggressively (thatis, a low bidder is not guaranteed an award), it serves asa tool to police possible collusion among bidders, and itallows FSA to shift purchases in response to unexpect-ed increases in prices.
From the point of view of school districts, cancellationsimpose significant immediate costs on them in returnfor uncertain and hard-to-document future gains inprices. Moreover, to the extent that the gains arise fromreduced collusion and more aggressive bidding, theyare shared by all districts, while the costs are borne bythose whose auctions were canceled. Because of thecosts imposed, FSA needs to do more to identify thesize of any benefits in order to justify this strategy.
Vendor failures can occur for several reasons. At peakproduction periods, vendors may win an award, andthen receive an unexpected order from a higher payingclient. The vendor may then choose to ignore theagreed delivery date and accept an FSA fine for latedelivery. During fall harvest periods, transportationmay at times be difficult to arrange, and during the win-ter, deliveries may be held up because of bad weather.Deliveries can also be late because vendors had diffi-culty arranging for inspectors, or because AMS labswere slow in performing tests.
Adjustments in the Bidding Process
Commodity volumes, competition, and seasonality allseem to affect bid prices. KCCO purchase strategiesmight be able to affect bid prices by influencing thesefactors.
KCCO argues that competition, measured by the num-ber of bidders for an award, is an important determinantof prices. That view is supported by the economic theo-ry of auctions, by a considerable amount of empiricalresearch on procurement through auctions, and by ourown analyses of auctions carried out by KCCO (chapter7). KCCO also believes that the number of bidders is inturn influenced by the size of the contract�that is, thevolume being purchased. Chapter 3 shows that KCCOvolumes have fallen sharply in recent years. But ERSresearch suggests that monthly volumes have onlysmall effects on bidder numbers and bid prices. Webelieve that product characteristics and expected capac-ity utilization in the industry have more importantimpacts on bidder numbers. Moreover, our analysesshow that bidder numbers have large effects on pricesonly when the number of bidders is very small. Inother words, losing a competitor has a much moreimportant effect on price when there are only two com-petitors to begin with than when there are four or five.
KCCO does face tight oligopolies: for example, ready-to-eat cereals and infant formula are each produced bya very small number of firms. Moreover, governmentprocurement is subject to collusive bid-rigging amongparticipants, as well as more tacit (and legal) attemptsby vendors to refrain from strong price competition(Brannman, 1996). This is more likely to occur whenthe same few bidders respond to the monthly invitationsto bid. Some of the commodities that USDA purchaseshave strong seasonal demand patterns. For example,
Food Procurement by Farm Service Agency / AER-766 USDA-ERS / 25
retail sales of flour surge in the late fall, so flour millsoperate near their production capacities in early andmid-fall, preparing to meet the seasonal increase inretail purchases. Mills will bid higher prices when theyoperate near capacity than when they have substantialexcess capacity. Consequently, flour bids show a sea-sonal pattern of increases during the peak fall seasonand offpeak declines. KCCO thus realizes better pricesand more competition for invitations during offpeakseasons.
KCCO has altered the bidding process for several com-modities in hopes of reducing bid prices. For example,the contract duration for infant formula has beenlengthened to a full year, from 3 months, at the sametime that commercial labels for formula have been al-lowed. A longer duration contract increases the volumeat stake in a bid; KCCO hopes that longer duration,higher volume contracts will induce more competitivebidding among the small number of formula vendors.Similarly, KCCO has lengthened contract durations forready-to-eat cereal purchases as part of an experimentin purchasing commercially labeled products.
KCCO has altered the bidding process in another wayfor cheese purchases. It now issues rolling invitations,covering several months, for deliveries of cheese. Forexample, the office will offer an invitation in July tobid on deliveries of cheese in specified 2-week win-dows from September through December. The Augustinvitation will then include any new school orders forOctober through January deliveries. In essence, the newcheese process adds certain elements of flexibility:firms can now place bids further in the future than theydid under the prior system, and they can achieve morecertainty in that they can commit to USDA productionfor a quarter of a year at a time instead of a month.
Under the cheese experiment, KCCO enters schoolcheese orders as they come in. Schools now have somereason to enter early orders, since KCCO will act uponthem. These rolling contracts may also allow KCCO toimprove timeliness in product delivery, by providingthe office with the flexibility to reject contracts andreopen auctions while still meeting desired deliverydates. For other commodities, KCCO would like toencourage schools to shift the temporal pattern of theirorders away from peak and toward offpeak periods totake advantage of seasonal price fluctuations. Toexpand this experiment, FSA and its clients may needchanges in spending authority to shift expendituresfrom one fiscal year to another.
Longer contract durations, in which firms place bids ondeliveries further in the future, will introduce some newrisks into USDA procurement. When bidding on ashort-duration contract (for example, bidding inOctober for the November delivery of flour), firms maybe quite confident that input price risks are low; that is,vendors bid with firm knowledge of the likely level ofwheat prices when placing bids to deliver flour. Theymay also be quite confident that capacity risks are low;that is, vendors bid with firm knowledge that plantcapacity will be lightly utilized (in which case they willbid low) or heavily utilized (leading to a higher bid).With contracts of longer duration (bidding in Octoberfor March delivery), firms will have less certainty aboutinput prices and capacity utilization well into the future.Because of greater uncertainty, longer contract dura-tions could lead to higher prices for USDA commodi-ties, even if the greater volumes in longer duration con-tracts attracted more bidders. USDA could reduce therisks from input price uncertainty, and could thereforeinduce lower bids, by allowing bids to be indexed to ameasure of input prices.
26 /ERS-USDA Food Procurement by Farm Service Agency / AER-766
Introduction
FSA amasses data while administering auctions, datathat can be used to investigate the factors driving bidsand to compare FSA bids with private sector prices forcomparable items, as a step in evaluating auction strate-gy. To perform that evaluation, FSA provided ERS withauction records for five commodity categories�all-pur-pose flour, bakery flour, pasta products, vegetable oil,and peanut butter�for the 5 years covering January1992 through December 1996.
This initial analysis focused on just five commoditycategories because that seemed like a manageable num-ber for a new project. The records were not kept inelectronic format, but in paper archives, and includedseparate records for approximately 2,000 to 6,000 auc-tions for each commodity category. Coding the recordsinto electronic format was a major task, and limited ouroriginal commodity coverage.
The five chosen were important FSA commodities thatwere closely linked to related agricultural commodities(wheat, peanuts, and soybean and cottonseed oils) withreliable data on prices. The major omitted category,cheese, is a large category undergoing substantialchanges in agricultural commodity pricing. ERS willinvestigate cheese auctions in later analyses.
Data Sources and Definitionsof Variables
Auction Records
Much of the data are derived from records (�PPCR30forms�) generated by FSA during the bidding process.Each record refers to an auction of a specific commodi-ty on a specific date for delivery to a warehouse withina State (or to a plant for further processing) during aspecified 2-week time window, generally 5-8 weeksafter the auction (see table 4-1).
Each record specifies the commodity up for bid, with aprecise description of package size and distinguishingproduct characteristics. It specifies the quantity up forbid (usually between one and five truckloads, but speci-fied in pounds), as well as the place and the State towhich the product is to be delivered. Separate biddercodes identify each bidder, the bidder�s price, whether abidder is a qualified small business, and the �construct-ed price� developed by FSA prior to the auction. Thefile also identifies the date of the auction and the monthand 2-week time window (first or second half of amonth) for delivery.
Most of our discussion in this report emphasizes thelowest bid in FSA auctions, which also is usually, butnot always, the winning bid (see chapters 2 and 4 for anoverview of the process and the determination of win-ning bids). Some analyses investigate a dataset consist-
Food Procurement by Farm Service Agency / AER-766 USDA-ERS / 27
CHAPTER 6
DATA FOR EMPIRICAL ANALYSES
OF FSA AUCTIONS
ing of all bids in a commodity category, although wecan say that the general factors driving low bids alsodrive other bids. In the sections that follow, we discussthe explanatory variables that we think account for fluc-tuations in bids.
Specific Agricultural Price Measures
We expected that FSA bids would be closely linked toprice movements in related underlying agriculturalcommodities. Moreover, key agricultural prices showeda strong pattern during the period: wheat and oilseedprices rose sharply from 1992 through 1995, beforeabating somewhat in late 1996. To analyze that link-age, we obtained monthly USDA price data for keycommodities. We generally developed price series forthree variables: the average cash price in the month ofdelivery, the change in the average cash price betweenthe delivery month and the following month, and thechange in the average cash price between the deliverymonth and the prior month. By using these measures,we can distinguish the effects of longrun shifts in pricefrom shortrun shocks. That distinction turns out to beuseful (chapter 7) because it appears that month-to-month price fluctuations have little or no effect on FSAprices, while longer run shifts have large effects.
All-purpose flour uses a variety of different wheats. Inour statistical analysis, we found that one wheat priceseries fit the data best, and that other price series addedno additional explanatory power to our models.Consequently, we relied on the series for No. 2 SoftRed Winter Wheat (St. Louis). For bakery flour, wefound that a different series fit the data best, so werelied on prices for No. 1 Hard Red Winter Wheat,Ordinary Protein (Kansas City). Pasta uses durumwheat, so we relied on the price series for No. 1 HardAmber Durum (Minneapolis). All three monthly wheatprice series are reported in the 1997 Wheat Yearbook(ERS/USDA).
In contrast to flour and pasta, we found that two agri-cultural price series were important in explaining FSAvegetable oil bids. Soybean oil is the primary ingredi-ent, but cottonseed oil is also important and statisticallyrelevant. We consequently used wholesale prices forCrude Soybean Oil (Decatur) and the Crude CottonseedOil (Mississippi Valley points), as reported in the OilCrops Yearbook (ERS/USDA).
Peanut butter presented more of a challenge. Peanut
butter is purchased throughout the year, so we haveFSA monthly prices for the product, but peanuts aremarketed only in part of the year, so peanut prices aregenerally available for the period from August throughJanuary. We tried several approaches to handle monthsoutside of the marketing year. First, we dispensed withmonthly peanut price data and used average annual(marketing year) prices for each month, but found thatthey fit the data poorly. We then used monthly data, andassigned the price for January (the last observed price)to the remaining months before a new marketing year.Finally, the best specification used that secondapproach, but allowed the regression coefficient on theJanuary price to vary by month during the rest of theyear. In other words, the third approach added interac-tion terms between the assigned monthly price and themonth. Monthly peanut prices were also taken from theOil Crops Yearbook.
Specific Measures of Purchase Scale
Chapter 3 showed that FSA commodity purchasesdeclined sharply during the 1992-96 period. We wantedto assess the effect of that decline, if any, on prices. Todo that, we used the PPCR30 records and calculatedmonthly sums of FSA purchases; we refer to that mea-sure as the monthly �FSA volume� in a commodity cat-egory.
FSA volumes are not the only �volume effect� worthyof study. FSA also purchases quantities of commoditiesfor delivery overseas, and these vary widely frommonth to month. We wanted to know whether FSA for-eign purchase volumes affect domestic purchase prices.We obtained data on monthly commodity volume ininternational (PL480) auctions for flour and vegetableoil products, and designated these as �PL480 volume.�We matched PL480 volumes to the delivery months ofFSA domestic auctions, but our analysis is limited byan important problem of timing. Our domestic volumesmeasure the amount to be delivered in any month, butthe PL480 variable measures the amount that is con-tracted for in any month�and contracting occurs sometime before delivery. As a result, the two volume mea-sures may not match up appropriately.
The amount of a product to be delivered to any specificdomestic location in any particular auction also variesin the data; generally, from one to five truckloads areup for bid for delivery to a particular location in a par-ticular time window. We wanted to know whether these
28 /ERS-USDA Food Procurement by Farm Service Agency / AER-766
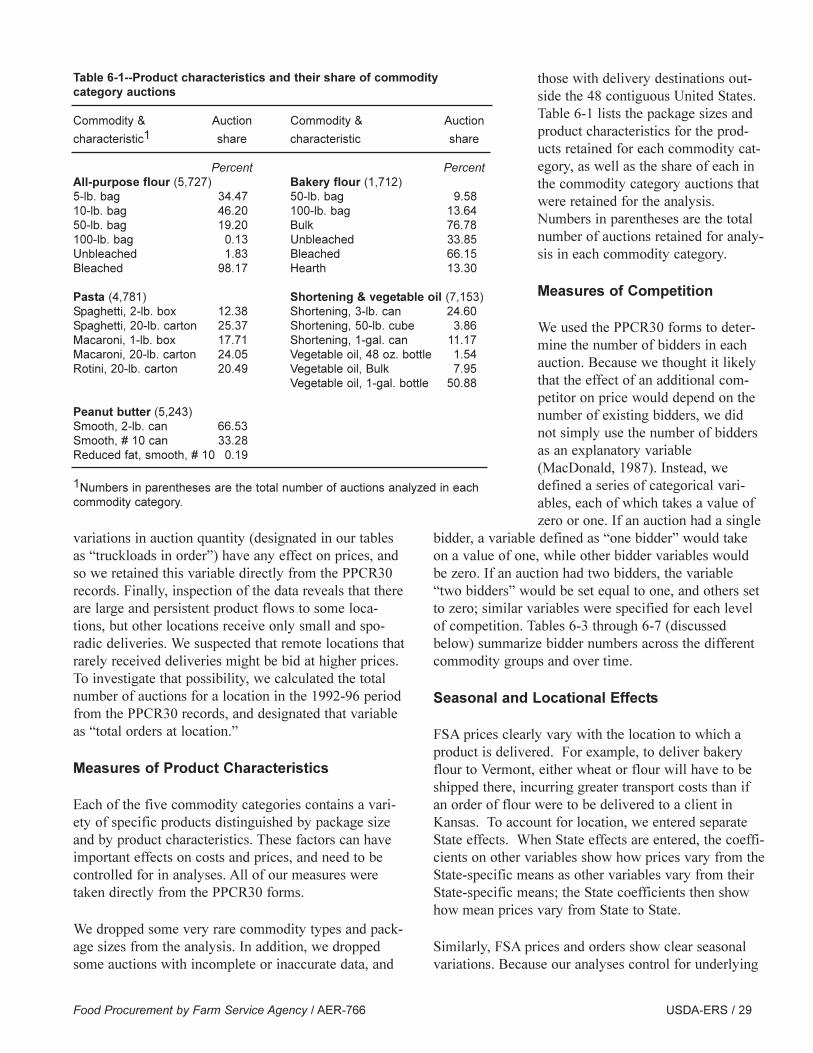
variations in auction quantity (designated in our tablesas �truckloads in order�) have any effect on prices, andso we retained this variable directly from the PPCR30records. Finally, inspection of the data reveals that thereare large and persistent product flows to some loca-tions, but other locations receive only small and spo-radic deliveries. We suspected that remote locations thatrarely received deliveries might be bid at higher prices.To investigate that possibility, we calculated the totalnumber of auctions for a location in the 1992-96 periodfrom the PPCR30 records, and designated that variableas �total orders at location.�
Measures of Product Characteristics
Each of the five commodity categories contains a vari-ety of specific products distinguished by package sizeand by product characteristics. These factors can haveimportant effects on costs and prices, and need to becontrolled for in analyses. All of our measures weretaken directly from the PPCR30 forms.
We dropped some very rare commodity types and pack-age sizes from the analysis. In addition, we droppedsome auctions with incomplete or inaccurate data, and
those with delivery destinations out-side the 48 contiguous United States.Table 6-1 lists the package sizes andproduct characteristics for the prod-ucts retained for each commodity cat-egory, as well as the share of each inthe commodity category auctions thatwere retained for the analysis.Numbers in parentheses are the totalnumber of auctions retained for analy-sis in each commodity category.
Measures of Competition
We used the PPCR30 forms to deter-mine the number of bidders in eachauction. Because we thought it likelythat the effect of an additional com-petitor on price would depend on thenumber of existing bidders, we didnot simply use the number of biddersas an explanatory variable(MacDonald, 1987). Instead, wedefined a series of categorical vari-ables, each of which takes a value ofzero or one. If an auction had a single
bidder, a variable defined as �one bidder� would takeon a value of one, while other bidder variables wouldbe zero. If an auction had two bidders, the variable�two bidders� would be set equal to one, and others setto zero; similar variables were specified for each levelof competition. Tables 6-3 through 6-7 (discussedbelow) summarize bidder numbers across the differentcommodity groups and over time.
Seasonal and Locational Effects
FSA prices clearly vary with the location to which aproduct is delivered. For example, to deliver bakeryflour to Vermont, either wheat or flour will have to beshipped there, incurring greater transport costs than ifan order of flour were to be delivered to a client inKansas. To account for location, we entered separateState effects. When State effects are entered, the coeffi-cients on other variables show how prices vary from theState-specific means as other variables vary from theirState-specific means; the State coefficients then showhow mean prices vary from State to State.
Similarly, FSA prices and orders show clear seasonalvariations. Because our analyses control for underlying
Food Procurement by Farm Service Agency / AER-766 USDA-ERS / 29
Table 6-1--Product characteristics and their share of commodity category auctions
Commodity & Auction Commodity & Auction
characteristic1 share characteristic share
Percent PercentAll-purpose flour (5,727) Bakery flour (1,712)5-lb. bag 34.47 50-lb. bag 9.5810-lb. bag 46.20 100-lb. bag 13.6450-lb. bag 19.20 Bulk 76.78100-lb. bag 0.13 Unbleached 33.85Unbleached 1.83 Bleached 66.15Bleached 98.17 Hearth 13.30
Pasta (4,781) Shortening & vegetable oil (7,153)Spaghetti, 2-lb. box 12.38 Shortening, 3-lb. can 24.60Spaghetti, 20-lb. carton 25.37 Shortening, 50-lb. cube 3.86Macaroni, 1-lb. box 17.71 Shortening, 1-gal. can 11.17Macaroni, 20-lb. carton 24.05 Vegetable oil, 48 oz. bottle 1.54Rotini, 20-lb. carton 20.49 Vegetable oil, Bulk 7.95
Vegetable oil, 1-gal. bottle 50.88
Peanut butter (5,243)Smooth, 2-lb. can 66.53Smooth, # 10 can 33.28 Reduced fat, smooth, # 10 0.19
1Numbers in parentheses are the total number of auctions analyzed in each commodity category.
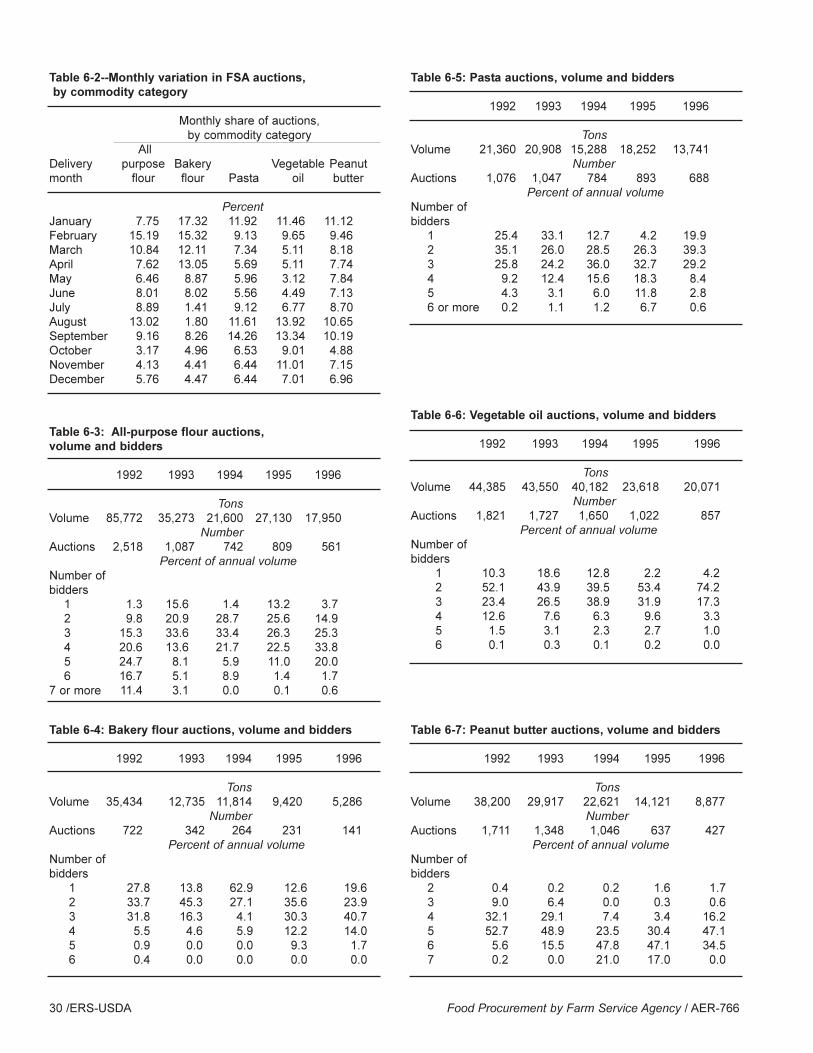
30 /ERS-USDA Food Procurement by Farm Service Agency / AER-766
Table 6-2--Monthly variation in FSA auctions,by commodity category
Monthly share of auctions,by commodity category
AllDelivery purpose Bakery Vegetable Peanutmonth flour flour Pasta oil butter
PercentJanuary 7.75 17.32 11.92 11.46 11.12 February 15.19 15.32 9.13 9.65 9.46 March 10.84 12.11 7.34 5.11 8.18 April 7.62 13.05 5.69 5.11 7.74 May 6.46 8.87 5.96 3.12 7.84 June 8.01 8.02 5.56 4.49 7.13 July 8.89 1.41 9.12 6.77 8.70 August 13.02 1.80 11.61 13.92 10.65 September 9.16 8.26 14.26 13.34 10.19 October 3.17 4.96 6.53 9.01 4.88 November 4.13 4.41 6.44 11.01 7.15 December 5.76 4.47 6.44 7.01 6.96
Table 6-3: All-purpose flour auctions, volume and bidders
1992 1993 1994 1995 1996
Tons Volume 85,772 35,273 21,600 27,130 17,950
NumberAuctions 2,518 1,087 742 809 561
Percent of annual volumeNumber of bidders
1 1.3 15.6 1.4 13.2 3.7 2 9.8 20.9 28.7 25.6 14.9 3 15.3 33.6 33.4 26.3 25.3 4 20.6 13.6 21.7 22.5 33.8 5 24.7 8.1 5.9 11.0 20.0 6 16.7 5.1 8.9 1.4 1.7
7 or more 11.4 3.1 0.0 0.1 0.6
Table 6-4: Bakery flour auctions, volume and bidders
1992 1993 1994 1995 1996
TonsVolume 35,434 12,735 11,814 9,420 5,286
NumberAuctions 722 342 264 231 141
Percent of annual volume Number of bidders
1 27.8 13.8 62.9 12.6 19.62 33.7 45.3 27.1 35.6 23.93 31.8 16.3 4.1 30.3 40.74 5.5 4.6 5.9 12.2 14.05 0.9 0.0 0.0 9.3 1.76 0.4 0.0 0.0 0.0 0.0
Table 6-5: Pasta auctions, volume and bidders
1992 1993 1994 1995 1996
TonsVolume 21,360 20,908 15,288 18,252 13,741
NumberAuctions 1,076 1,047 784 893 688
Percent of annual volumeNumber of bidders
1 25.4 33.1 12.7 4.2 19.9 2 35.1 26.0 28.5 26.3 39.3 3 25.8 24.2 36.0 32.7 29.2 4 9.2 12.4 15.6 18.3 8.4 5 4.3 3.1 6.0 11.8 2.8 6 or more 0.2 1.1 1.2 6.7 0.6
Table 6-6: Vegetable oil auctions, volume and bidders
1992 1993 1994 1995 1996
TonsVolume 44,385 43,550 40,182 23,618 20,071
NumberAuctions 1,821 1,727 1,650 1,022 857
Percent of annual volumeNumber of bidders
1 10.3 18.6 12.8 2.2 4.2 2 52.1 43.9 39.5 53.4 74.2 3 23.4 26.5 38.9 31.9 17.3 4 12.6 7.6 6.3 9.6 3.3 5 1.5 3.1 2.3 2.7 1.0 6 0.1 0.3 0.1 0.2 0.0
Table 6-7: Peanut butter auctions, volume and bidders
1992 1993 1994 1995 1996
TonsVolume 38,200 29,917 22,621 14,121 8,877
NumberAuctions 1,711 1,348 1,046 637 427
Percent of annual volumeNumber of bidders
2 0.4 0.2 0.2 1.6 1.7 3 9.0 6.4 0.0 0.3 0.6 4 32.1 29.1 7.4 3.4 16.2 5 52.7 48.9 23.5 30.4 47.1 6 5.6 15.5 47.8 47.1 34.5 7 0.2 0.0 21.0 17.0 0.0
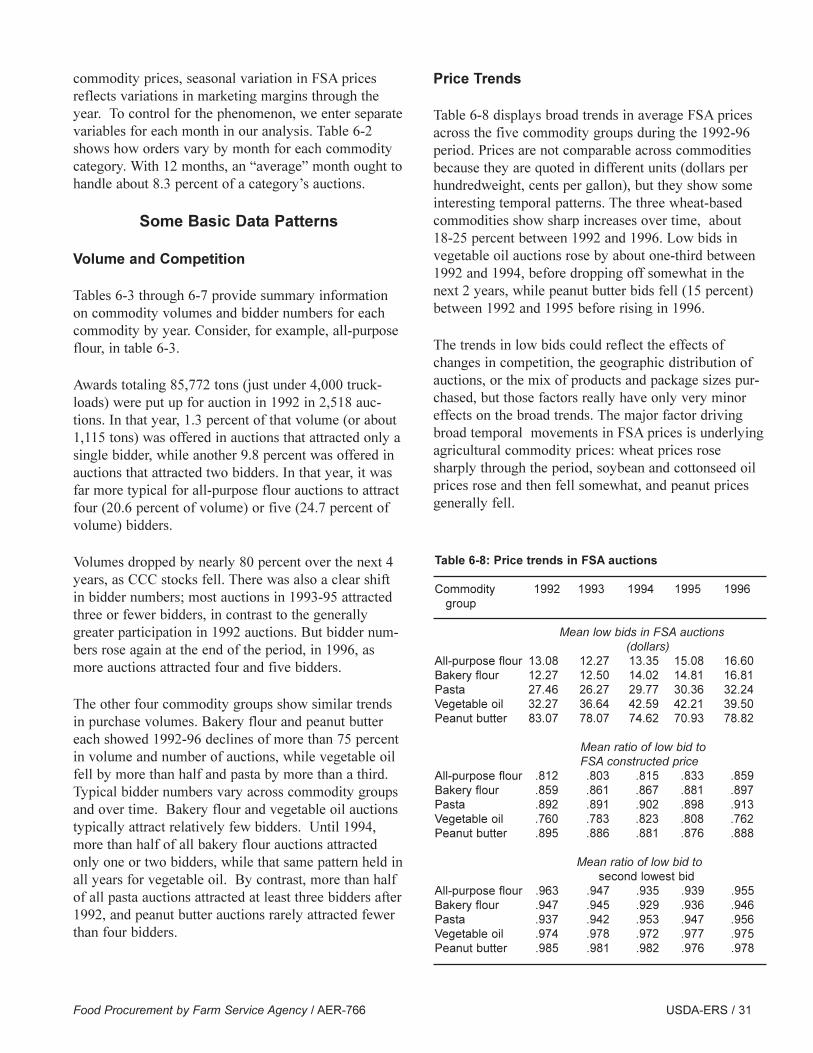
commodity prices, seasonal variation in FSA pricesreflects variations in marketing margins through theyear. To control for the phenomenon, we enter separatevariables for each month in our analysis. Table 6-2shows how orders vary by month for each commoditycategory. With 12 months, an �average� month ought tohandle about 8.3 percent of a category�s auctions.
Some Basic Data Patterns
Volume and Competition
Tables 6-3 through 6-7 provide summary informationon commodity volumes and bidder numbers for eachcommodity by year. Consider, for example, all-purposeflour, in table 6-3.
Awards totaling 85,772 tons (just under 4,000 truck-loads) were put up for auction in 1992 in 2,518 auc-tions. In that year, 1.3 percent of that volume (or about1,115 tons) was offered in auctions that attracted only asingle bidder, while another 9.8 percent was offered inauctions that attracted two bidders. In that year, it wasfar more typical for all-purpose flour auctions to attractfour (20.6 percent of volume) or five (24.7 percent ofvolume) bidders.
Volumes dropped by nearly 80 percent over the next 4years, as CCC stocks fell. There was also a clear shiftin bidder numbers; most auctions in 1993-95 attractedthree or fewer bidders, in contrast to the generallygreater participation in 1992 auctions. But bidder num-bers rose again at the end of the period, in 1996, asmore auctions attracted four and five bidders.
The other four commodity groups show similar trendsin purchase volumes. Bakery flour and peanut buttereach showed 1992-96 declines of more than 75 percentin volume and number of auctions, while vegetable oilfell by more than half and pasta by more than a third.Typical bidder numbers vary across commodity groupsand over time. Bakery flour and vegetable oil auctionstypically attract relatively few bidders. Until 1994,more than half of all bakery flour auctions attractedonly one or two bidders, while that same pattern held inall years for vegetable oil. By contrast, more than halfof all pasta auctions attracted at least three bidders after1992, and peanut butter auctions rarely attracted fewerthan four bidders.
Price Trends
Table 6-8 displays broad trends in average FSA pricesacross the five commodity groups during the 1992-96period. Prices are not comparable across commoditiesbecause they are quoted in different units (dollars perhundredweight, cents per gallon), but they show someinteresting temporal patterns. The three wheat-basedcommodities show sharp increases over time, about18-25 percent between 1992 and 1996. Low bids invegetable oil auctions rose by about one-third between1992 and 1994, before dropping off somewhat in thenext 2 years, while peanut butter bids fell (15 percent)between 1992 and 1995 before rising in 1996.
The trends in low bids could reflect the effects ofchanges in competition, the geographic distribution ofauctions, or the mix of products and package sizes pur-chased, but those factors really have only very minoreffects on the broad trends. The major factor drivingbroad temporal movements in FSA prices is underlyingagricultural commodity prices: wheat prices rosesharply through the period, soybean and cottonseed oilprices rose and then fell somewhat, and peanut pricesgenerally fell.
Food Procurement by Farm Service Agency / AER-766 USDA-ERS / 31
Table 6-8: Price trends in FSA auctions
Commodity 1992 1993 1994 1995 1996group
Mean low bids in FSA auctions (dollars)
All-purpose flour 13.08 12.27 13.35 15.08 16.60Bakery flour 12.27 12.50 14.02 14.81 16.81Pasta 27.46 26.27 29.77 30.36 32.24Vegetable oil 32.27 36.64 42.59 42.21 39.50Peanut butter 83.07 78.07 74.62 70.93 78.82
Mean ratio of low bid to FSA constructed price
All-purpose flour .812 .803 .815 .833 .859Bakery flour .859 .861 .867 .881 .897Pasta .892 .891 .902 .898 .913Vegetable oil .760 .783 .823 .808 .762Peanut butter .895 .886 .881 .876 .888
Mean ratio of low bid to second lowest bid
All-purpose flour .963 .947 .935 .939 .955Bakery flour .947 .945 .929 .936 .946Pasta .937 .942 .953 .947 .956Vegetable oil .974 .978 .972 .977 .975Peanut butter .985 .981 .982 .976 .978
FSA develops a �constructed� price for comparisonpurposes for each auction. The constructed price is usedas a forecast tool to develop expectations about likelybid ranges, and it can also be used as a decision tool inthat FSA may cancel auctions in which the low bidexceeds the constructed price. The middle panel in table6-8 shows annual average ratios of low bids to con-structed prices. Two factors stand out. First, the ratiosclearly vary systematically, and by quite a bit, acrosscommodity categories. Pasta ratios are always the high-est, around 0.90, while vegetable oil ratios are generallythe lowest, around 0.80. Second, the ratios seem tomove up, sometimes sharply, as commodity prices rise.That pattern raises the question of whether FSA proper-
ly accounts for the effects of changes in agriculturalprices when calculating constructed prices; there issome evidence in this pattern that the agency underesti-mates the sensitivity of bid prices to agricultural prices.
Finally, the bottom panel reports average ratios of lowbids to the second lowest bid in FSA auctions (clearly,this ratio can only be calculated when there are at leasttwo bidders). That ratio shows no particular time pat-tern, suggesting that all bids rise in unison as agricul-tural prices rise. They also show some distinctive dif-ference across commodity groups. Peanut butter lowbidders beat the number two bidder by only about 2percent, for example, while, on average, low bidders inpasta are 5-7 percent below the second lowest bidder.
32 /ERS-USDA Food Procurement by Farm Service Agency / AER-766
Introduction
The statistical analysis aimed to answer the followingquestions:
◆ How do variations in related agricultural commodityprices affect FSA bids?
◆ Are FSA bid prices affected by declining FSA auc-tion volumes?
◆ Do PL480 (international) shipments affect FSAdomestic bids?
◆ Do FSA bid prices vary with requested packagesizes? By how much?
◆ Do other product characteristics affect bid prices? Byhow much?
◆ Do bid prices show important seasonal variations?
◆ How important are transport costs?
◆ Do changes in the number of bidders affect FSA bidprices? By how much?
◆ What factors drive changes in bidder numbers?
The first question, the relationship of agricultural com-modity prices to FSA bid prices, relates to FSA�s abilityto predict likely bid prices and to agency decisions to
cancel auctions when prices are unacceptably high. Formost commodities, changes in related agricultural com-modities are the most important factor driving temporalchanges in FSA bid prices, and many agricultural com-modity prices fluctuate sharply through time. Theanalysis aims to identify typical responses of FSA bidsto changes in commodity prices; with that information,FSA should be better able to identify those cases inwhich bid prices are unusually high.
The other questions relate to issues that FSA has someinfluence over. There have been fairly large changesover time in FSA monthly purchase volumes for bothdomestic and foreign (PL480) programs. In principle,if monthly volumes had a large effect on prices, FSAcould consider altering purchase strategies in an attemptto reach volumes associated with the lowest prices. Ifthe data were to show strong seasonal effects, FSAcould move to shift the temporal pattern of purchases tolow-priced months. Either decision would impose stor-age and transactions costs on clients, such as schoollunch programs; the information from the analysescould help clients decide whether the price gains fromvolume shifting were large enough to offset any addedcosts.
Similarly, clients purchase a variety of specific products(for example, pasta can be spaghetti, macaroni, or roti-ni) in a variety of package sizes. Statistical informationon the price effects of these choices can guide clients inmaking better decisions.
Food Procurement by Farm Service Agency / AER-766 USDA-ERS / 33
CHAPTER 7
STATISTICAL ANALYSIS OF BID PRICES
FOR FIVE FSA COMMODITIES
Over time, the typical number of bidders in FSA auc-tions has generally declined; moreover, during anygiven year, there are often large variations in the num-ber of bidders participating in different auctions. Ouranalysis attempts to identify the effect of the number ofbidders on prices, and to identify the factors affectingvariations in the number of bidders. Information on theissues can help FSA to better identify those commodi-ties, locations, and periods in which actions to increasecompetition would be most effective.
Methods
ERS investigated the above issues with regressionanalyses of FSA bid prices. Most regressions focusedon the low bids in FSA auctions, although some ana-lyzed all bids. The regression analyses aim to estimatethe effect of variations in particular variables (forexample, the number of bidders) on FSA bid prices,while controlling for other variables. For example, sup-pose that, on average, low bids in FSA auctions werehigher in those auctions in which only a single bidderparticipated. That pattern could appear because of alack of competition, but it could also appear if single-bidder auctions were more likely in auctions for deliv-ery to high-cost, remote locations, or if single-bidderauctions were more likely during periods of high agri-cultural commodity prices. In regression analyses, wetry to control for those other factors so we can moreprecisely identify the reasons for observed statisticalrelations. In other words, our analyses are designed toask whether prices are higher in single-bidder auctionsfor given levels of agricultural prices and transportcosts.
Regression analyses can be flexible in the sense that wecan use them to see whether effects are linear or nonlin-ear. For example, it is reasonable to think that addingan extra bidder in a market with a single bidder mighthave a bigger effect on prices than adding another bid-der in a market that already has six bidders; in short,the effect of adding a bidder varies with the number ofbidders. Our analyses are designed to assess alternativespecifications of how one variable might affect another.
No analysis is perfect. We will not be able to controlfor all possible factors that affect bid prices, and wewill not be able to test among all possible (or even like-ly) ways in which the variables affect price. But we canprovide a substantial amount of useful information.This chapter summarizes the key findings. Data sources
and variable definitions were summarized in chapter 6.
Summary of Results from the Regression Analysis
We summarize the key findings below. Our discussionis organized around groupings of key related variables,and we attempt to emphasize the size of our reportedeffects and their implications in our discussions. Exactregression results, which contain a large number of sep-arate coefficients and associated statistical tests, arereported in appendix B.
Linkages Between FSA Prices and Agricultural Commodity Prices
FSA purchases basic products that are closely linked toagricultural commodities. Some agricultural commodi-ties display wide price swings through time, and theseswings can have strong impacts on FSA product prices.Our statistical analysis allows us to identify the effectsof agricultural commodity price changes on FSA bidprices. For this analysis, and those that follow, weregressed low bids in FSA auctions on the averagedelivery month spot price of the agricultural product, aswell as the change in the agricultural price for 1 monthback and 1 month forward. Other controls includedproduct characteristics, the number of bidders, mea-sures of auction volume, fixed monthly effects, andfixed State effects. Table 7-1 shows the results.
We list the related agricultural commodity for each ofour five FSA products. The list is not exhaustive; forexample, all-purpose flour uses wheats other than No. 2soft white, but that price series gave the best fit to ourdata. In vegetable oil, two price series, for cottonseedoil and for soybean oil, gave the best statistical fit tothe data when they were both used.
We represent the effect of agricultural price changes intwo ways. First, we show the estimated effect on FSAprices of 10-percent increases in agricultural prices. Thetwo flour products (bakery and all-purpose) show thestrongest responses, 7.0 percent and 7.9 percent. Bycontrast, pasta prices are noticeably less responsive towheat price changes, with a 3.4-percent increase inpasta prices following a 10-percent increase in durumwheat prices. Pasta requires more processing than flour,with the result that durum wheat is a smaller part oftotal pasta costs; hence wheat price changes have weak-er effects on pasta prices than on flour prices.
34 /ERS-USDA Food Procurement by Farm Service Agency / AER-766
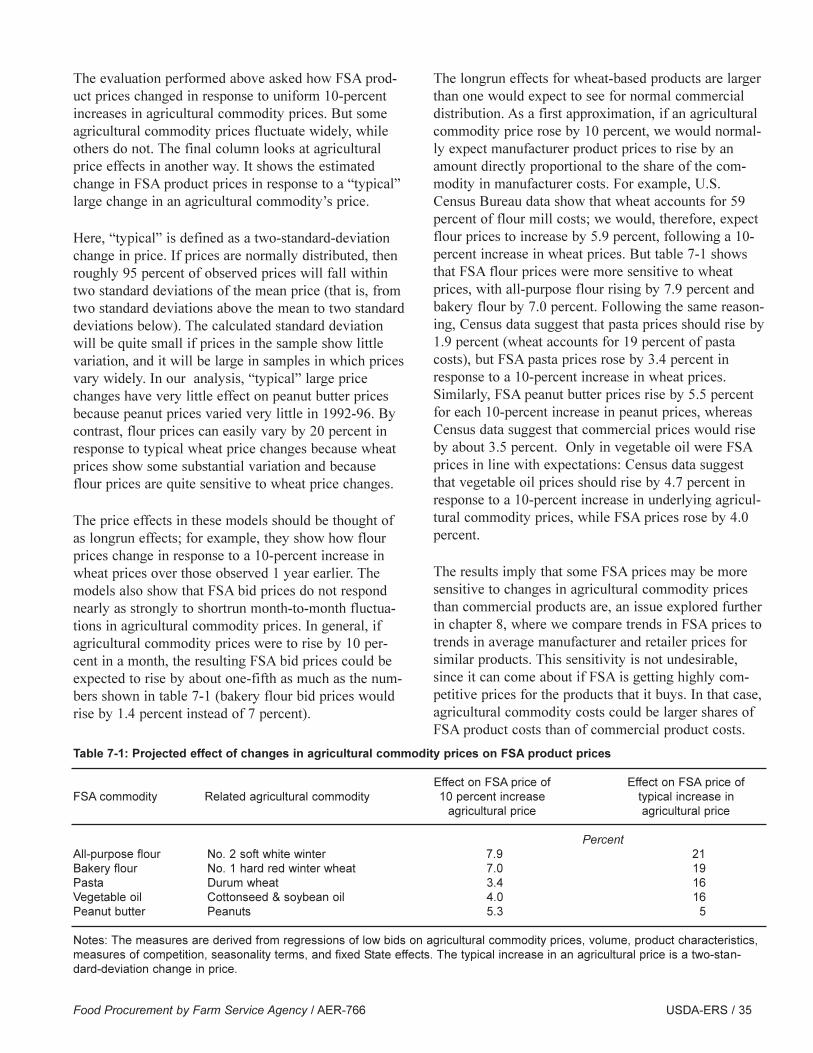
The evaluation performed above asked how FSA prod-uct prices changed in response to uniform 10-percentincreases in agricultural commodity prices. But someagricultural commodity prices fluctuate widely, whileothers do not. The final column looks at agriculturalprice effects in another way. It shows the estimatedchange in FSA product prices in response to a �typical�large change in an agricultural commodity�s price.
Here, �typical� is defined as a two-standard-deviationchange in price. If prices are normally distributed, thenroughly 95 percent of observed prices will fall withintwo standard deviations of the mean price (that is, fromtwo standard deviations above the mean to two standarddeviations below). The calculated standard deviationwill be quite small if prices in the sample show littlevariation, and it will be large in samples in which pricesvary widely. In our analysis, �typical� large pricechanges have very little effect on peanut butter pricesbecause peanut prices varied very little in 1992-96. Bycontrast, flour prices can easily vary by 20 percent inresponse to typical wheat price changes because wheatprices show some substantial variation and becauseflour prices are quite sensitive to wheat price changes.
The price effects in these models should be thought ofas longrun effects; for example, they show how flourprices change in response to a 10-percent increase inwheat prices over those observed 1 year earlier. Themodels also show that FSA bid prices do not respondnearly as strongly to shortrun month-to-month fluctua-tions in agricultural commodity prices. In general, ifagricultural commodity prices were to rise by 10 per-cent in a month, the resulting FSA bid prices could beexpected to rise by about one-fifth as much as the num-bers shown in table 7-1 (bakery flour bid prices wouldrise by 1.4 percent instead of 7 percent).
The longrun effects for wheat-based products are largerthan one would expect to see for normal commercialdistribution. As a first approximation, if an agriculturalcommodity price rose by 10 percent, we would normal-ly expect manufacturer product prices to rise by anamount directly proportional to the share of the com-modity in manufacturer costs. For example, U.S.Census Bureau data show that wheat accounts for 59percent of flour mill costs; we would, therefore, expectflour prices to increase by 5.9 percent, following a 10-percent increase in wheat prices. But table 7-1 showsthat FSA flour prices were more sensitive to wheatprices, with all-purpose flour rising by 7.9 percent andbakery flour by 7.0 percent. Following the same reason-ing, Census data suggest that pasta prices should rise by1.9 percent (wheat accounts for 19 percent of pastacosts), but FSA pasta prices rose by 3.4 percent inresponse to a 10-percent increase in wheat prices.Similarly, FSA peanut butter prices rise by 5.5 percentfor each 10-percent increase in peanut prices, whereasCensus data suggest that commercial prices would riseby about 3.5 percent. Only in vegetable oil were FSAprices in line with expectations: Census data suggestthat vegetable oil prices should rise by 4.7 percent inresponse to a 10-percent increase in underlying agricul-tural commodity prices, while FSA prices rose by 4.0percent.
The results imply that some FSA prices may be moresensitive to changes in agricultural commodity pricesthan commercial products are, an issue explored furtherin chapter 8, where we compare trends in FSA prices totrends in average manufacturer and retailer prices forsimilar products. This sensitivity is not undesirable,since it can come about if FSA is getting highly com-petitive prices for the products that it buys. In that case,agricultural commodity costs could be larger shares ofFSA product costs than of commercial product costs.
Food Procurement by Farm Service Agency / AER-766 USDA-ERS / 35
Table 7-1: Projected effect of changes in agricultural commodity prices on FSA product prices
Effect on FSA price of Effect on FSA price ofFSA commodity Related agricultural commodity 10 percent increase typical increase in
agricultural price agricultural price
PercentAll-purpose flour No. 2 soft white winter 7.9 21 Bakery flour No. 1 hard red winter wheat 7.0 19 Pasta Durum wheat 3.4 16 Vegetable oil Cottonseed & soybean oil 4.0 16 Peanut butter Peanuts 5.3 5
Notes: The measures are derived from regressions of low bids on agricultural commodity prices, volume, product characteristics,measures of competition, seasonality terms, and fixed State effects. The typical increase in an agricultural price is a two-stan-dard-deviation change in price.
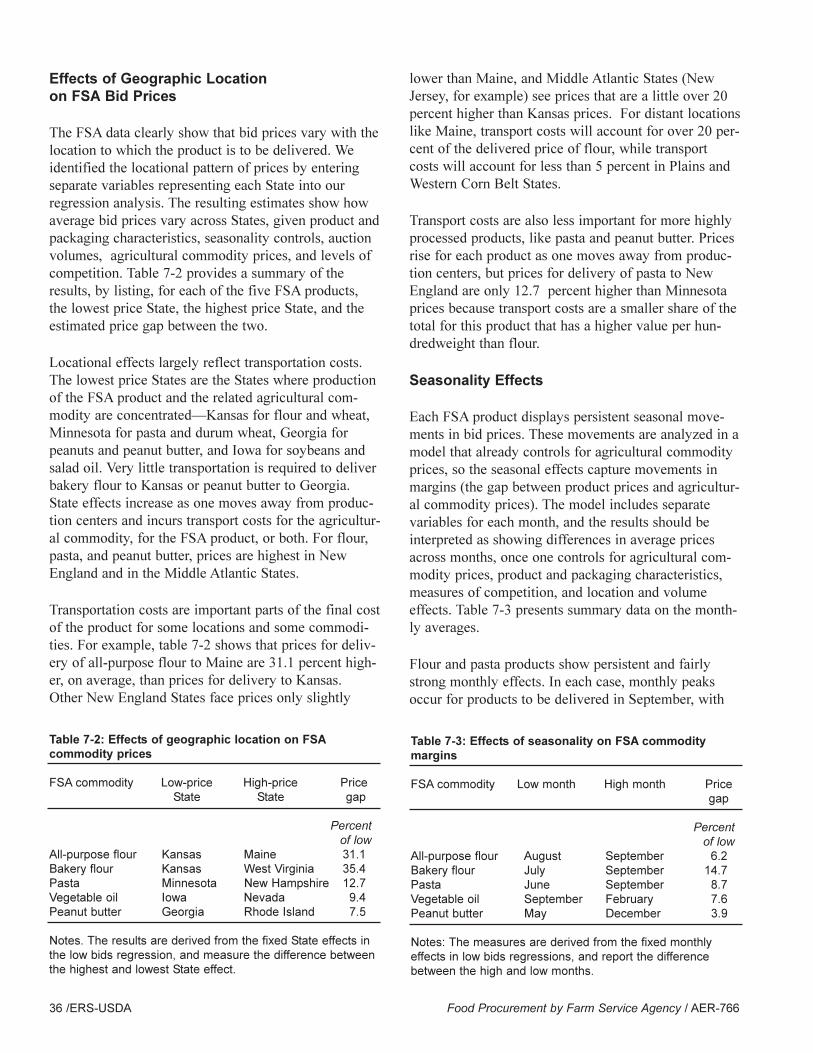
Effects of Geographic Location on FSA Bid Prices
The FSA data clearly show that bid prices vary with thelocation to which the product is to be delivered. Weidentified the locational pattern of prices by enteringseparate variables representing each State into ourregression analysis. The resulting estimates show howaverage bid prices vary across States, given product andpackaging characteristics, seasonality controls, auctionvolumes, agricultural commodity prices, and levels ofcompetition. Table 7-2 provides a summary of theresults, by listing, for each of the five FSA products,the lowest price State, the highest price State, and theestimated price gap between the two.
Locational effects largely reflect transportation costs.The lowest price States are the States where productionof the FSA product and the related agricultural com-modity are concentrated�Kansas for flour and wheat,Minnesota for pasta and durum wheat, Georgia forpeanuts and peanut butter, and Iowa for soybeans andsalad oil. Very little transportation is required to deliverbakery flour to Kansas or peanut butter to Georgia.State effects increase as one moves away from produc-tion centers and incurs transport costs for the agricultur-al commodity, for the FSA product, or both. For flour,pasta, and peanut butter, prices are highest in NewEngland and in the Middle Atlantic States.
Transportation costs are important parts of the final costof the product for some locations and some commodi-ties. For example, table 7-2 shows that prices for deliv-ery of all-purpose flour to Maine are 31.1 percent high-er, on average, than prices for delivery to Kansas.Other New England States face prices only slightly
lower than Maine, and Middle Atlantic States (NewJersey, for example) see prices that are a little over 20percent higher than Kansas prices. For distant locationslike Maine, transport costs will account for over 20 per-cent of the delivered price of flour, while transportcosts will account for less than 5 percent in Plains andWestern Corn Belt States.
Transport costs are also less important for more highlyprocessed products, like pasta and peanut butter. Pricesrise for each product as one moves away from produc-tion centers, but prices for delivery of pasta to NewEngland are only 12.7 percent higher than Minnesotaprices because transport costs are a smaller share of thetotal for this product that has a higher value per hun-dredweight than flour.
Seasonality Effects
Each FSA product displays persistent seasonal move-ments in bid prices. These movements are analyzed in amodel that already controls for agricultural commodityprices, so the seasonal effects capture movements inmargins (the gap between product prices and agricultur-al commodity prices). The model includes separatevariables for each month, and the results should beinterpreted as showing differences in average pricesacross months, once one controls for agricultural com-modity prices, product and packaging characteristics,measures of competition, and location and volumeeffects. Table 7-3 presents summary data on the month-ly averages.
Flour and pasta products show persistent and fairlystrong monthly effects. In each case, monthly peaksoccur for products to be delivered in September, with
36 /ERS-USDA Food Procurement by Farm Service Agency / AER-766
Table 7-2: Effects of geographic location on FSAcommodity prices
FSA commodity Low-price High-price PriceState State gap
Percent of low
All-purpose flour Kansas Maine 31.1 Bakery flour Kansas West Virginia 35.4 Pasta Minnesota New Hampshire 12.7 Vegetable oil Iowa Nevada 9.4 Peanut butter Georgia Rhode Island 7.5
Notes. The results are derived from the fixed State effects inthe low bids regression, and measure the difference betweenthe highest and lowest State effect.
Table 7-3: Effects of seasonality on FSA commoditymargins
FSA commodity Low month High month Pricegap
Percent of low
All-purpose flour August September 6.2 Bakery flour July September 14.7 Pasta June September 8.7 Vegetable oil September February 7.6 Peanut butter May December 3.9
Notes: The measures are derived from the fixed monthlyeffects in low bids regressions, and report the differencebetween the high and low months.
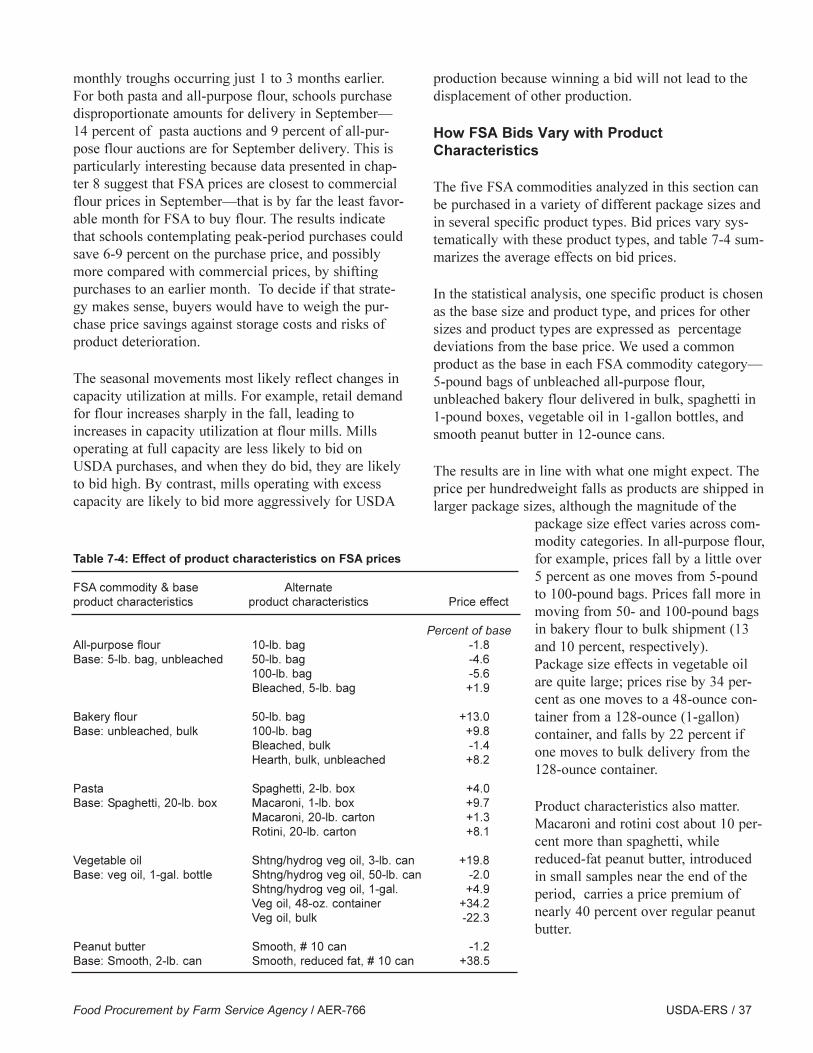
monthly troughs occurring just 1 to 3 months earlier.For both pasta and all-purpose flour, schools purchasedisproportionate amounts for delivery in September�14 percent of pasta auctions and 9 percent of all-pur-pose flour auctions are for September delivery. This isparticularly interesting because data presented in chap-ter 8 suggest that FSA prices are closest to commercialflour prices in September�that is by far the least favor-able month for FSA to buy flour. The results indicatethat schools contemplating peak-period purchases couldsave 6-9 percent on the purchase price, and possiblymore compared with commercial prices, by shiftingpurchases to an earlier month. To decide if that strate-gy makes sense, buyers would have to weigh the pur-chase price savings against storage costs and risks ofproduct deterioration.
The seasonal movements most likely reflect changes incapacity utilization at mills. For example, retail demandfor flour increases sharply in the fall, leading toincreases in capacity utilization at flour mills. Millsoperating at full capacity are less likely to bid onUSDA purchases, and when they do bid, they are likelyto bid high. By contrast, mills operating with excesscapacity are likely to bid more aggressively for USDA
production because winning a bid will not lead to thedisplacement of other production.
How FSA Bids Vary with ProductCharacteristics
The five FSA commodities analyzed in this section canbe purchased in a variety of different package sizes andin several specific product types. Bid prices vary sys-tematically with these product types, and table 7-4 sum-marizes the average effects on bid prices.
In the statistical analysis, one specific product is chosenas the base size and product type, and prices for othersizes and product types are expressed as percentagedeviations from the base price. We used a commonproduct as the base in each FSA commodity category�5-pound bags of unbleached all-purpose flour,unbleached bakery flour delivered in bulk, spaghetti in1-pound boxes, vegetable oil in 1-gallon bottles, andsmooth peanut butter in 12-ounce cans.
The results are in line with what one might expect. Theprice per hundredweight falls as products are shipped inlarger package sizes, although the magnitude of the
package size effect varies across com-modity categories. In all-purpose flour,for example, prices fall by a little over5 percent as one moves from 5-poundto 100-pound bags. Prices fall more inmoving from 50- and 100-pound bagsin bakery flour to bulk shipment (13and 10 percent, respectively).Package size effects in vegetable oilare quite large; prices rise by 34 per-cent as one moves to a 48-ounce con-tainer from a 128-ounce (1-gallon)container, and falls by 22 percent ifone moves to bulk delivery from the128-ounce container.
Product characteristics also matter.Macaroni and rotini cost about 10 per-cent more than spaghetti, whilereduced-fat peanut butter, introducedin small samples near the end of theperiod, carries a price premium ofnearly 40 percent over regular peanutbutter.
Food Procurement by Farm Service Agency / AER-766 USDA-ERS / 37
Table 7-4: Effect of product characteristics on FSA prices
FSA commodity & base Alternateproduct characteristics product characteristics Price effect
Percent of baseAll-purpose flour 10-lb. bag -1.8Base: 5-lb. bag, unbleached 50-lb. bag -4.6
100-lb. bag -5.6Bleached, 5-lb. bag +1.9
Bakery flour 50-lb. bag +13.0Base: unbleached, bulk 100-lb. bag +9.8
Bleached, bulk -1.4Hearth, bulk, unbleached +8.2
Pasta Spaghetti, 2-lb. box +4.0Base: Spaghetti, 20-lb. box Macaroni, 1-lb. box +9.7
Macaroni, 20-lb. carton +1.3Rotini, 20-lb. carton +8.1
Vegetable oil Shtng/hydrog veg oil, 3-lb. can +19.8Base: veg oil, 1-gal. bottle Shtng/hydrog veg oil, 50-lb. can -2.0
Shtng/hydrog veg oil, 1-gal. +4.9Veg oil, 48-oz. container +34.2Veg oil, bulk -22.3
Peanut butter Smooth, # 10 can -1.2Base: Smooth, 2-lb. can Smooth, reduced fat, # 10 can +38.5
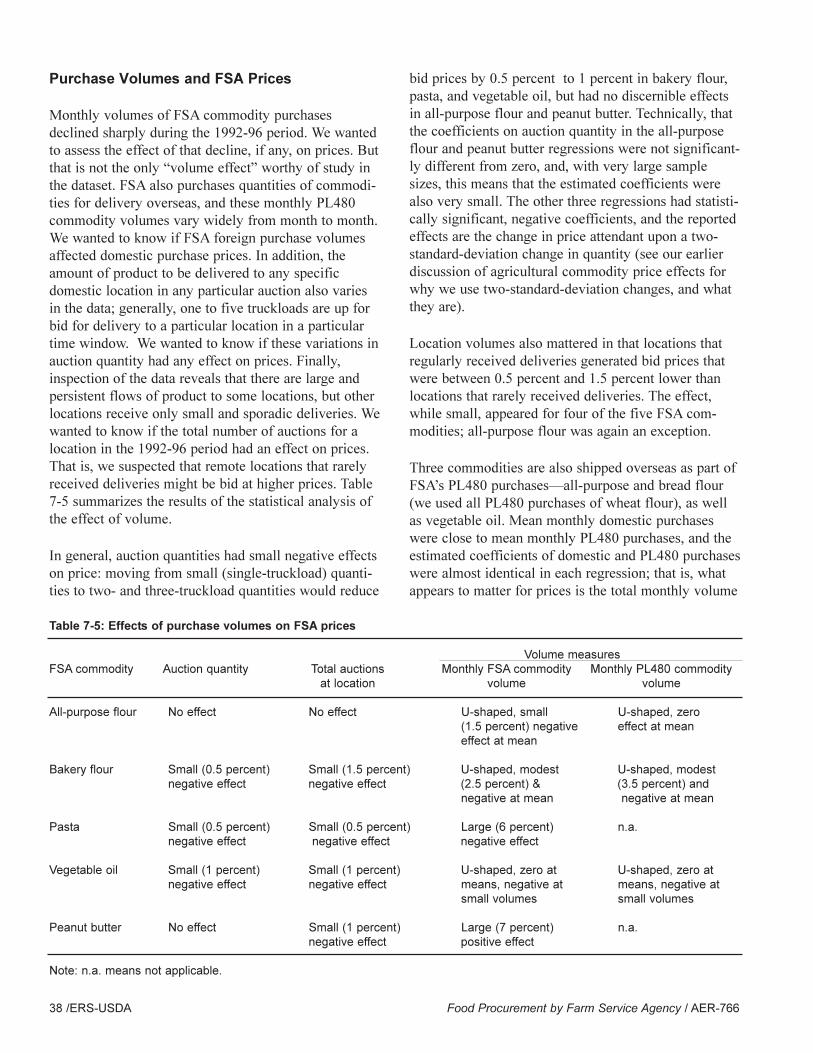
Purchase Volumes and FSA Prices
Monthly volumes of FSA commodity purchasesdeclined sharply during the 1992-96 period. We wantedto assess the effect of that decline, if any, on prices. Butthat is not the only �volume effect� worthy of study inthe dataset. FSA also purchases quantities of commodi-ties for delivery overseas, and these monthly PL480commodity volumes vary widely from month to month.We wanted to know if FSA foreign purchase volumesaffected domestic purchase prices. In addition, theamount of product to be delivered to any specificdomestic location in any particular auction also variesin the data; generally, one to five truckloads are up forbid for delivery to a particular location in a particulartime window. We wanted to know if these variations inauction quantity had any effect on prices. Finally,inspection of the data reveals that there are large andpersistent flows of product to some locations, but otherlocations receive only small and sporadic deliveries. Wewanted to know if the total number of auctions for alocation in the 1992-96 period had an effect on prices.That is, we suspected that remote locations that rarelyreceived deliveries might be bid at higher prices. Table7-5 summarizes the results of the statistical analysis ofthe effect of volume.
In general, auction quantities had small negative effectson price: moving from small (single-truckload) quanti-ties to two- and three-truckload quantities would reduce
bid prices by 0.5 percent to 1 percent in bakery flour,pasta, and vegetable oil, but had no discernible effectsin all-purpose flour and peanut butter. Technically, thatthe coefficients on auction quantity in the all-purposeflour and peanut butter regressions were not significant-ly different from zero, and, with very large samplesizes, this means that the estimated coefficients werealso very small. The other three regressions had statisti-cally significant, negative coefficients, and the reportedeffects are the change in price attendant upon a two-standard-deviation change in quantity (see our earlierdiscussion of agricultural commodity price effects forwhy we use two-standard-deviation changes, and whatthey are).
Location volumes also mattered in that locations thatregularly received deliveries generated bid prices thatwere between 0.5 percent and 1.5 percent lower thanlocations that rarely received deliveries. The effect,while small, appeared for four of the five FSA com-modities; all-purpose flour was again an exception.
Three commodities are also shipped overseas as part ofFSA�s PL480 purchases�all-purpose and bread flour(we used all PL480 purchases of wheat flour), as wellas vegetable oil. Mean monthly domestic purchaseswere close to mean monthly PL480 purchases, and theestimated coefficients of domestic and PL480 purchaseswere almost identical in each regression; that is, whatappears to matter for prices is the total monthly volume
38 /ERS-USDA Food Procurement by Farm Service Agency / AER-766
Table 7-5: Effects of purchase volumes on FSA prices
Volume measures FSA commodity Auction quantity Total auctions Monthly FSA commodity Monthly PL480 commodity
at location volume volume
All-purpose flour No effect No effect U-shaped, small U-shaped, zero (1.5 percent) negative effect at mean effect at mean
Bakery flour Small (0.5 percent) Small (1.5 percent) U-shaped, modest U-shaped, modest negative effect negative effect (2.5 percent) & (3.5 percent) and
negative at mean negative at mean
Pasta Small (0.5 percent) Small (0.5 percent) Large (6 percent) n.a.negative effect negative effect negative effect
Vegetable oil Small (1 percent) Small (1 percent) U-shaped, zero at U-shaped, zero atnegative effect negative effect means, negative at means, negative at
small volumes small volumes
Peanut butter No effect Small (1 percent) Large (7 percent) n.a.negative effect positive effect
Note: n.a. means not applicable.
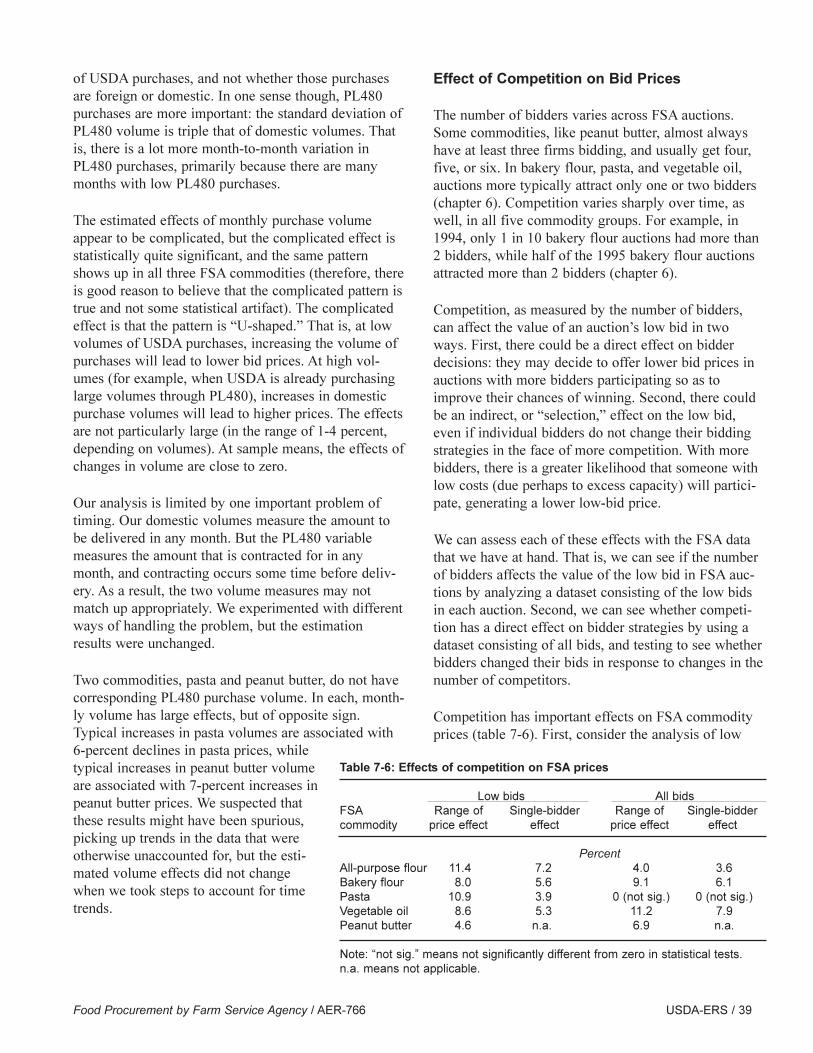
of USDA purchases, and not whether those purchasesare foreign or domestic. In one sense though, PL480purchases are more important: the standard deviation ofPL480 volume is triple that of domestic volumes. Thatis, there is a lot more month-to-month variation inPL480 purchases, primarily because there are manymonths with low PL480 purchases.
The estimated effects of monthly purchase volumeappear to be complicated, but the complicated effect isstatistically quite significant, and the same patternshows up in all three FSA commodities (therefore, thereis good reason to believe that the complicated pattern istrue and not some statistical artifact). The complicatedeffect is that the pattern is �U-shaped.� That is, at lowvolumes of USDA purchases, increasing the volume ofpurchases will lead to lower bid prices. At high vol-umes (for example, when USDA is already purchasinglarge volumes through PL480), increases in domesticpurchase volumes will lead to higher prices. The effectsare not particularly large (in the range of 1-4 percent,depending on volumes). At sample means, the effects ofchanges in volume are close to zero.
Our analysis is limited by one important problem oftiming. Our domestic volumes measure the amount tobe delivered in any month. But the PL480 variablemeasures the amount that is contracted for in anymonth, and contracting occurs some time before deliv-ery. As a result, the two volume measures may notmatch up appropriately. We experimented with differentways of handling the problem, but the estimationresults were unchanged.
Two commodities, pasta and peanut butter, do not havecorresponding PL480 purchase volume. In each, month-ly volume has large effects, but of opposite sign.Typical increases in pasta volumes are associated with6-percent declines in pasta prices, whiletypical increases in peanut butter volumeare associated with 7-percent increases inpeanut butter prices. We suspected thatthese results might have been spurious,picking up trends in the data that wereotherwise unaccounted for, but the esti-mated volume effects did not changewhen we took steps to account for timetrends.
Effect of Competition on Bid Prices
The number of bidders varies across FSA auctions.Some commodities, like peanut butter, almost alwayshave at least three firms bidding, and usually get four,five, or six. In bakery flour, pasta, and vegetable oil,auctions more typically attract only one or two bidders(chapter 6). Competition varies sharply over time, aswell, in all five commodity groups. For example, in1994, only 1 in 10 bakery flour auctions had more than2 bidders, while half of the 1995 bakery flour auctionsattracted more than 2 bidders (chapter 6).
Competition, as measured by the number of bidders,can affect the value of an auction�s low bid in twoways. First, there could be a direct effect on bidderdecisions: they may decide to offer lower bid prices inauctions with more bidders participating so as toimprove their chances of winning. Second, there couldbe an indirect, or �selection,� effect on the low bid,even if individual bidders do not change their biddingstrategies in the face of more competition. With morebidders, there is a greater likelihood that someone withlow costs (due perhaps to excess capacity) will partici-pate, generating a lower low-bid price.
We can assess each of these effects with the FSA datathat we have at hand. That is, we can see if the numberof bidders affects the value of the low bid in FSA auc-tions by analyzing a dataset consisting of the low bidsin each auction. Second, we can see whether competi-tion has a direct effect on bidder strategies by using adataset consisting of all bids, and testing to see whetherbidders changed their bids in response to changes in thenumber of competitors.
Competition has important effects on FSA commodityprices (table 7-6). First, consider the analysis of low
Food Procurement by Farm Service Agency / AER-766 USDA-ERS / 39
Table 7-6: Effects of competition on FSA prices
Low bids All bids FSA Range of Single-bidder Range of Single-biddercommodity price effect effect price effect effect
PercentAll-purpose flour 11.4 7.2 4.0 3.6Bakery flour 8.0 5.6 9.1 6.1Pasta 10.9 3.9 0 (not sig.) 0 (not sig.)Vegetable oil 8.6 5.3 11.2 7.9Peanut butter 4.6 n.a. 6.9 n.a.
Note: �not sig.� means not significantly different from zero in statistical tests.n.a. means not applicable.
bids. In the first row, the �range of price effect� for all-purpose flour is reported to be 11.4 percent. The statis-tic means that, on average, low bids in all-purpose flourauctions with a single bidder are 11.4 percent higherthan low bids in all-purpose flour auctions with themaximum number of bidders specified in the model,which in all-purpose flour is seven. The estimated �sin-gle-bidder effect� in all-purpose flour is 7.2 percent;that is, low bids rose by 7.2 percent as the number ofbidders falls from two bidders to one. Combined, thosetwo statistics suggest that some competition matters alot: most of the effect of reducing the number of bid-ders (7.2 of 11.4 percent) occurs as we move betweentwo bidders and one, while the effect of moving fromseven to two is much smaller (4.2 percent).
Results in the other four FSA commodity groups aresimilar. As the number of bidders goes from two to one,low bids rose by 5.6 percent and 5.3 percent in bakeryflour and vegetable oil, respectively. As the number ofbidders goes from five (the maximum in each) to two,low bids rose modestly, by 2.4 percent and 3.3 percentrespectively. Peanut butter had no single-bidder auc-tions: there, low bids rose (by 4.6 percent) as the num-ber of bidders fell from six to two. Pasta shows somedistinction in that prices rose more sharply (by 7 per-cent) as the number of bidders fell to two from five.Pasta low bids increased again, by 3.9 percent, as thenumber of bidders fell from two to one.
The results thus far suggest that changes in bidder num-bers matter, but that such changes generally mattermost where there are a small number of bidders. Thatis, the number of bidders affects auction prices mostwhen there are only two or three bidders to begin with;when there are four or five bidders, auction prices areaffected less by the number of bidders.
The results reported so far are based on an analysis ofthe low bids in each auction. We can try to gain addi-tional information with an analysis of all bids in FSAauctions (sample sizes in the all-bids analyses are threeto four times larger than in the low-bids analysis).Consider the all-purpose flour results first. When thereis a single bidder, that bidder typically bids a price 3.6percent higher than the bidder would bid in a situationthat was identical except for the presence of two bid-ders. In other words, bidders do appear to change theirstrategies in response to changes in the number of bid-ders, but the effect is small; selection appears to domi-nate changes in bidder behavior.
The results in pasta provide stronger support for selec-tion. There, the number of bids has no significant effecton bidder behavior (a bidder does not change a bid asthe number of bidders changes). But low bids are sub-stantially lower when there are many bidders. Takentogether, the two results suggest that selection effectsaccount entirely for the effects of competition on lowbids in pasta.
Results differ in the other three FSA commodities. Inbakery flour, vegetable oil, and peanut butter, biddersreduce their bids as the number of bidders rises, and theeffects are larger than in the low bids dataset. Selectiondoes not appear to be a driving force here, and thedirect effects of competition matter most.
The effects of competition appear to be quite robustbecause of the regression specification that we use. Inearly models with few other controls, bid pricesappeared to be higher where there were few bidders.We were concerned that the observed effects might bespurious. Specifically, we were concerned that remotelocations that were more costly to serve might attractfew bidders and might also generate high bid pricesbecause they were costly to serve. But the final modelreported here has an extensive set of controls, includingthe State that the product is to be delivered to, the flowof product to specific locations, and the characteristicsof the items being auctioned. Holding all those con-stant, the results still show the number of bidders tohave strong effects on bid prices.
Tables 6-3 through 6-7 show that competition appearsto vary sharply over time, while table 7-6 shows thatcompetition strongly affects bid prices. What factorsdrive the extent of competition? We have not been ableto perform a complete analysis, but several factorsstand out. Product volumes only modestly affect thenumber of bidders. As changes in national policyreduced CCC stocks, tables 6-3 through 6-7 show thatFSA product volumes fell dramatically for each com-modity between 1992 and 1996, by amounts rangingfrom 36 percent of 1992 pasta volume to 85 percent forbakery flour. Bidder numbers showed no such steadydecline, but rather a mixed pattern of increases anddecreases.
In interviews, some vendors stressed the importance ofcapacity utilization in manufacturing plants. Theyargued that, during periods of low utilization, vendorsare more likely to bid on USDA products, and are more
40 /ERS-USDA Food Procurement by Farm Service Agency / AER-766
likely to bid aggressively. They asserted that this wasbecause USDA auction procedures generated competi-tive prices and, therefore, relatively low margins forvendors; they would, therefore, only aim to win auc-tions when USDA production was unlikely to replaceother, high-margin, business. The data offer some sup-port for this hypothesis. For example, in flour mills,capacity utilization peaks in the late summer and fall(August through November, for delivery to FSA clientsin September through December). Those 4 monthsaccount for a roughly proportional share (34.7 percent)of all FSA all-purpose flour auctions but a hugely dis-proportionate share (84.8 percent) of the auctions thatattract only a single bidder. In short, competition has aclear seasonal pattern, and the risks of attracting a sin-gle bidder rise sharply in the fall.
The data also show annual fluctuations in competitionthat do not necessarily follow patterns of capacity uti-lization. Our inspection of bidding records shows con-siderable persistence in patterns of bidding. That is,
once a firm enters bidding, it tends to stay in, offeringbids every month from at least some plants on at leastsome auctions. Similarly, once a firm drops out of bid-ding for USDA products, it tends to stay out, rarelycoming back in. Very few firms come in and out of bid-ding status. Those patterns appear to suggest that FSAmarketing of their auction programs may have hadsome effects on firms� decisions to participate. Further,each commodity had sharp reductions in bidder num-bers in one year during the study period (all-purposeflour in 1993, bakery flour in 1994, pasta in 1993, veg-etable oil in 1993, and peanut butter in 1992). None ofthe reductions held: average bidder numbers increasedsharply in the year after the reduction for each com-modity. That pattern may reflect simple market entry(declines in bidder numbers drove up prices and profits,thereby attracting more bidders), or it may reflect posi-tive actions taken by FSA to attract more players. FSAneeds to review their actions here in order to identifyeffective strategies.
Food Procurement by Farm Service Agency / AER-766 USDA-ERS / 41
Introduction
We perform two types of price comparisons in thischapter. First, we compare price levels by matching theprices that FSA receives in auctions for several com-modities with prices quoted by manufacturers to privatesector clients for closely related commodities. Second,we compare price trends by matching changes in FSAprices over the 1992-96 period to well-known indexesof food price inflation for related commodities.
Comparisons of FSA Price Levels with Comparable
Private Sector Prices
Method of Comparing Prices
One of our major goals was to compare the prices real-ized in FSA auctions with those that could be obtainedthrough private sector purchasing. To do that, wesolicited the cooperation of a major foodservice whole-saler. Foodservice firms take deliveries to their ownwarehouses from food manufacturers, and provide foodproducts and support services to restaurant and fastfood chains, schools, commercial kitchens, hospitals,and other large providers. Such firms operate as primevendors in the VA and DoD food procurement systems.Foodservice warehouses are the appropriate point ofprice comparison for FSA because the firms order largevolumes of products from manufacturers, take deliveryin truckload lots, and are located at the same level ofthe distribution chain as the State and commercialwarehouses that receive FSA commodities.
The cooperating firm provided us with data on 1996manufacturer prices for delivery to the firm�s warehous-es. We asked the firm to provide price data for theirhighest quality private-label product because we feltthat was most comparable with USDA products. Insome cases, we received branded product prices ratherthan private-label, and we note those cases in our dis-cussion. We strove to compare identical package sizesand product characteristics, but at times, had to com-pare closely related (rather than identical) products; wedefine product characteristics, and any adjustments thatwe made, in the discussion below.
Some FSA product prices can vary sharply by geo-graphic region. Consequently, we asked for prices fordelivery to several different States served by the food-service firm�California, Texas, Illinois, andMassachusetts. Because FSA prices show some season-al variability, we also asked for two time periods�April and September 1996.
The cooperating foodservice firm was able to provideus only with September data for peanut butter andpasta, and only on a nationwide price quote. We there-fore compared those prices to nationwide average FSAprices for September 1996. In addition, FSA data showfew 1996 auctions for delivery to two of the coopera-tor�s States, Illinois and Massachusetts, so we usedmean FSA prices for points in Illinois, Indiana, andWisconsin for comparison with foodservice prices inthe firm�s Illinois district. We also used mean FSAprices for delivery throughout New England for com-parison to the Massachusetts District. FSA prices vary
Food Procurement by Farm Service Agency / AER-766 USDA-ERS / 43
CHAPTER 8
COMPARING FSA TO COMMERCIAL PRICES
little (1-2 percent) within each region, and FSA meanprices, therefore, are not driven by any unusual pricequotes from remote locations.
Results of Price Comparisons
Table 8-1 reports the results of our price comparisons.In general, FSA prices were substantially below thosereported by the private sector firm, with a gap of about30 percent being most common. We discuss each com-modity in turn; we discuss flour last, since it presents amore complicated pattern.
Liquid Shortening and Vegetable Oil. We obtained pri-vate-sector prices for truckload delivery in cases con-taining six 1-gallon containers, and compared themwith FSA auction prices for identical package sizes. Wehad only limited FSA California data (for Septemberdelivery of vegetable oil), but could perform price com-parisons for both months for all other locations. Ourresults show substantial price advantages for FSA, larg-er in the fall than in the spring. On average, FSA short-ening prices were 31.5 percent below private sectorprices in September and 26.5 percent lower in April.Vegetable oil prices averaged 34.9 percent lower inSeptember (excluding those for California, whichwould expand the gap more) and were 28.8 percentlower, on average, in April.
Pasta. We compared prices for truckload delivery of20-lb. cartons of three products�spaghetti, elbow mac-aroni, and rotini. We used nationwide average prices forFSA data, for September 1996, and the results werequite consistent across the three products (table 8-1):FSA prices were consistently 37-38 percent lower thanprivate sector prices. Our cooperator did not specifywhether the price quotes were for a branded or private-label product, but branding should not be an importantprice factor in this (20-pound) package size.
Peanut Butter. The cooperator provided price quotesfor delivery of truckload quantities of a branded smoothpeanut butter in cases of 12 24-ounce containers. FSAprices are quoted for delivery of truckload quantities ofsmooth peanut butter in cases of 24 32-ounce contain-ers. Our data show that FSA prices were, on average,17.6 percent below those of the private sector productin September 1996. Because the private sector contain-ers are slightly smaller, they should carry a higher pricefor the added convenience, but we did no direct adjust-ment because we had no basis for one. Based on our
experience with other price comparisons, we wouldestimate that the container difference accounts for about2 percent of the 17.6 percent gap. Another point of dif-ference in this comparison was that we had to match aUSDA-labeled product with a branded product, andmany purchasers might prefer to pay a price gap of thissize in exchange for the greater perceived quality assur-ance associated with the branded product.
All-Purpose and Bakery Flour. The flour results showa strong temporal shift consistent with other ERSresearch on flour pricing. The cooperator provided uswith data for the delivery of all-purpose flour in truck-load quantities of cases containing eight 5-pound bags,and for delivery of truckload quantities of bread flour in50-pound bags. The quoted prices were for a brandedproduct, and branded products carry a modest price pre-mium at small package sizes (5-pound bags) in flour.Prices for three locations (California, Texas, andIllinois) and 2 months (April and September) werecited. FSA runs some auctions for delivery of all-pur-pose flour in 5-pound bags, but 10-pound bags were farmore common in 1996, so we also used FSA 10-poundauctions and adjusted those prices up by 2 percent, thepackage size premium estimated in our price regres-sions. FSA purchases bread flour in 50-pound bags, thesame size as the cooperator.
FSA all-purpose flour prices were substantially belowprivate sector prices in April: by 31.5 percent for Texasdelivery, 31.1 percent for Illinois, and 7.8 percent forCalifornia (the cooperator�s California prices were esti-mated and are considerably less reliable). But inSeptember, FSA prices were only 14.3 percent belowprivate sector prices in Texas and California and 17.4percent lower in the upper Midwest.
Bread flour is a far thinner FSA market; there were noFSA auctions for the relevant months in Texas andCalifornia. In Illinois, FSA prices were 21.7 percentbelow corresponding private sector prices in April, butin September, were quite close to private sector quotes(3.5 percent lower), consistent with the all-purposeflour results. Finally, FSA prices rose sharply inOctober and November 1996 to levels above theSeptember private sector prices (we do not have accessto the cooperator�s later prices).
Why are September prices so much closer? In brief, thedata show that FSA prices rise during the fall, whileprivate sector prices decline. Three factors drive the
44 /ERS-USDA Food Procurement by Farm Service Agency / AER-766
seasonal increase in FSA prices. First, wheat prices (theprimary material cost) show some seasonal variation,and typically rise slightly in the fall. Second, flourdemand rises quite sharply during the fall. FSA biddersbid more aggressively when they expect to have excessproduction capacity, and they have little excess capacityat that time; as a result, they include capacity charges intheir fall bids. Finally, and also because of capacity lim-its, fewer firms bid in fall FSA auctions, leading tohigher bids. In short, FSA prices rise because costs riseand also because FSA auctions become less competitivein the fall.
In contrast to FSA price patterns, retail prices for flourtypically drop sharply in the fall, by as much as 20 per-cent, just as demand is increasing sharply. Other ERSresearch has identified patterns of falling prices in theface of seasonal demand surges for most retail foodproducts with strong seasonal demand swings, and thepattern appears to be quite strong for flour. Prices inretail markets move closer to costs in the fall apparentlybecause seasonal demand surges lead to greater compe-tition among flour manufacturers for retail markets.This results in prices that fall quite sharply relative toFSA prices.
Some Caveats
Table 8-1 shows that FSA prices fall substantiallybelow corresponding private sector prices in mostcases. We should keep three cautions in mind.
First, representatives from the cooperating foodservicefirm feel that their quoted prices are not the minimumthat a client could receive from manufacturers. In par-ticular, clients wishing to make significant volumecommitments can sometimes obtain lower manufacturerprices, and manufacturers sometimes offer lower pricesto certain classes of buyers, including governmentagencies. We did not seek out those sorts of pricesbecause they are substantially more difficult to obtain,being quoted on a case-by-case basis. In addition, wecompared cooperator prices with average FSA prices ina given month, not to the lowest obtainable FSA prices,and we compared with FSA auctions that did not entaillong-lasting volume commitments (such as are current-ly done in FSA infant formula auctions). Therefore, wedecided that the cooperator prices that we did have rep-resented an appropriate basis for comparison.
The second caution is that we compared prices for com-modity categories in which FSA currently does a signif-icant amount of purchasing, and which therefore havepassed a type of market test. That is, clients whochoose to purchase these products through FSA pre-sumably do so because they find that FSA can obtainthese products at substantial discounts compared withwhat the clients can do for themselves. Our compar-isons, therefore, have focused on those products whereFSA�s buying advantages may be the greatest, and oneshould be cautious about extending these results toproducts that are not currently purchased by FSA.
Finally, we remind readers that FSA and prime vendorsystems are designed to do different things. FSA�s foodprocurement strategies are designed to obtain largequantities of a few basic food products, and to obtainthem at the lowest possible manufacturers� prices, sub-ject to USDA product specifications. Foodservice firmsare in the business of delivering a wide variety of foodproducts to clients on a timely basis; in other words,
Food Procurement by Farm Service Agency / AER-766 USDA-ERS / 45
Table 8-1: Comparing FSA prices with comparable private sector prices
FSA priceProduct and divided by private sector pricelocation April 1996 September 1996
Liquid shortening:Texas 0.734 0.683IL/IN/WI 0.733 0.685New England 0.737 0.685
Vegetable oil:California n.r. 0.585Texas 0.712 0.683IL/IN/WI 0.764 0.718New England 0.670 0.552
All-purpose flour: California 0.932 0.867Texas 0.685 0.867IL/IN/WI 0.689 0.826
Bread flour:IL/IN/WI 0.793 0.965
Pasta�nationwide: Spaghetti n.r. 0.629Macaroni n.r. 0.621Rotini n.r. 0.622
Peanut butter:Nationwide n.r. 0.824
Note: �n.r.� means that no cooperator price was reported forthat month.
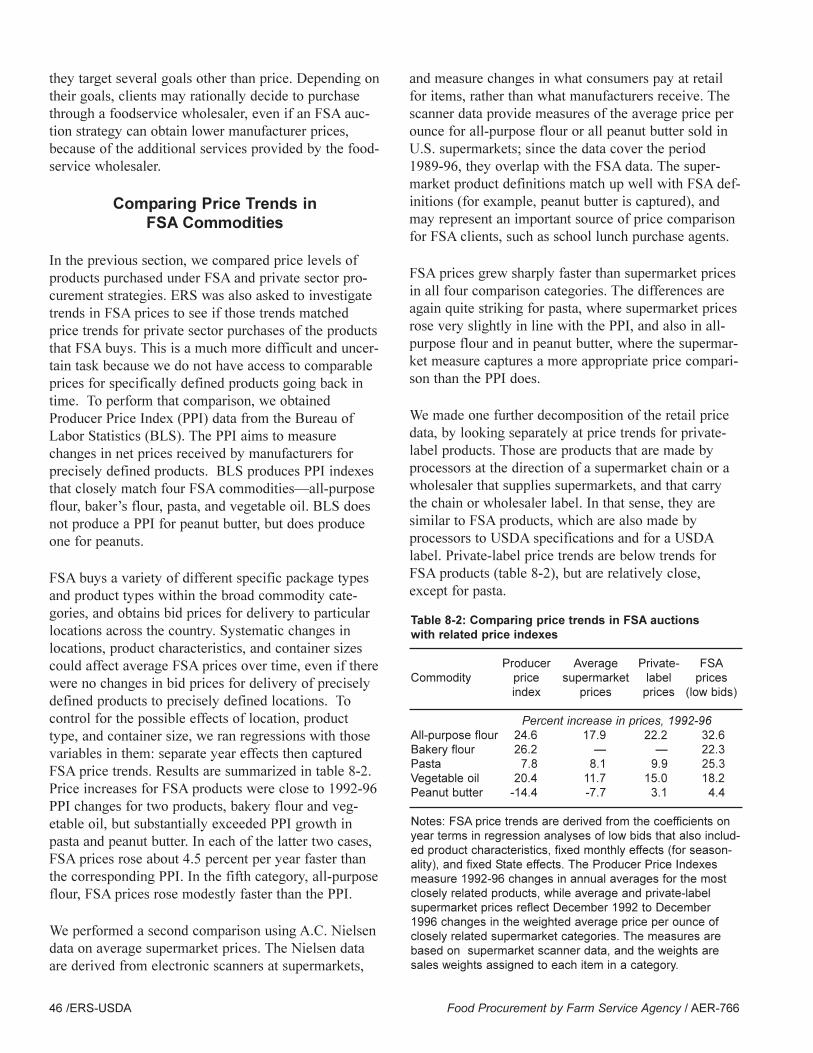
they target several goals other than price. Depending ontheir goals, clients may rationally decide to purchasethrough a foodservice wholesaler, even if an FSA auc-tion strategy can obtain lower manufacturer prices,because of the additional services provided by the food-service wholesaler.
Comparing Price Trends in FSA Commodities
In the previous section, we compared price levels ofproducts purchased under FSA and private sector pro-curement strategies. ERS was also asked to investigatetrends in FSA prices to see if those trends matchedprice trends for private sector purchases of the productsthat FSA buys. This is a much more difficult and uncer-tain task because we do not have access to comparableprices for specifically defined products going back intime. To perform that comparison, we obtainedProducer Price Index (PPI) data from the Bureau ofLabor Statistics (BLS). The PPI aims to measurechanges in net prices received by manufacturers forprecisely defined products. BLS produces PPI indexesthat closely match four FSA commodities�all-purposeflour, baker�s flour, pasta, and vegetable oil. BLS doesnot produce a PPI for peanut butter, but does produceone for peanuts.
FSA buys a variety of different specific package typesand product types within the broad commodity cate-gories, and obtains bid prices for delivery to particularlocations across the country. Systematic changes inlocations, product characteristics, and container sizescould affect average FSA prices over time, even if therewere no changes in bid prices for delivery of preciselydefined products to precisely defined locations. Tocontrol for the possible effects of location, producttype, and container size, we ran regressions with thosevariables in them: separate year effects then capturedFSA price trends. Results are summarized in table 8-2.Price increases for FSA products were close to 1992-96PPI changes for two products, bakery flour and veg-etable oil, but substantially exceeded PPI growth inpasta and peanut butter. In each of the latter two cases,FSA prices rose about 4.5 percent per year faster thanthe corresponding PPI. In the fifth category, all-purposeflour, FSA prices rose modestly faster than the PPI.
We performed a second comparison using A.C. Nielsendata on average supermarket prices. The Nielsen dataare derived from electronic scanners at supermarkets,
and measure changes in what consumers pay at retailfor items, rather than what manufacturers receive. Thescanner data provide measures of the average price perounce for all-purpose flour or all peanut butter sold inU.S. supermarkets; since the data cover the period1989-96, they overlap with the FSA data. The super-market product definitions match up well with FSA def-initions (for example, peanut butter is captured), andmay represent an important source of price comparisonfor FSA clients, such as school lunch purchase agents.
FSA prices grew sharply faster than supermarket pricesin all four comparison categories. The differences areagain quite striking for pasta, where supermarket pricesrose very slightly in line with the PPI, and also in all-purpose flour and in peanut butter, where the supermar-ket measure captures a more appropriate price compari-son than the PPI does.
We made one further decomposition of the retail pricedata, by looking separately at price trends for private-label products. Those are products that are made byprocessors at the direction of a supermarket chain or awholesaler that supplies supermarkets, and that carrythe chain or wholesaler label. In that sense, they aresimilar to FSA products, which are also made byprocessors to USDA specifications and for a USDAlabel. Private-label price trends are below trends forFSA products (table 8-2), but are relatively close,except for pasta.
46 /ERS-USDA Food Procurement by Farm Service Agency / AER-766
Table 8-2: Comparing price trends in FSA auctions with related price indexes
Producer Average Private- FSACommodity price supermarket label prices
index prices prices (low bids)
Percent increase in prices, 1992-96All-purpose flour 24.6 17.9 22.2 32.6 Bakery flour 26.2 � � 22.3 Pasta 7.8 8.1 9.9 25.3 Vegetable oil 20.4 11.7 15.0 18.2 Peanut butter -14.4 -7.7 3.1 4.4
Notes: FSA price trends are derived from the coefficients onyear terms in regression analyses of low bids that also includ-ed product characteristics, fixed monthly effects (for season-ality), and fixed State effects. The Producer Price Indexesmeasure 1992-96 changes in annual averages for the mostclosely related products, while average and private-labelsupermarket prices reflect December 1992 to December1996 changes in the weighted average price per ounce ofclosely related supermarket categories. The measures arebased on supermarket scanner data, and the weights aresales weights assigned to each item in a category.
There is one strong explanation for more rapidly risingFSA prices. Agricultural commodity prices generallyrose sharply during 1992-96. For example, prices fordurum wheat, the major pasta ingredient, were 75 per-cent higher in the spring of 1996 than in 1992. Pricesfell by the fall of 1996, but were still 40 percent higherthan they had been 4 years before. By mid- to late1996, prices for the hard and soft wheats used in flouraveraged 30 percent above their levels 4 years earlier,in 1992.
Millers pay the same prices for wheat, whether they areproducing for FSA purchases or for private sector pur-chases. Could agricultural price increases neverthelesshave stronger effects on FSA prices? Yes, if wheataccounts for a greater share of the costs of manufactur-ing FSA products. If FSA prices are lower (and theyappear to be) and if FSA products use the sameamounts of wheat as private sector products (also true),then wheat costs will be a larger share of the total costsof producing FSA products than others. Increases inwheat prices ought to lead to greater percentageincreases in FSA product prices than in average manu-facturer or retail prices for the corresponding products.Retail prices also include the costs of providing retailservices, which means that ingredient costs will have astill smaller percentage impact on retail prices than onFSA prices. By the same reasoning, FSA prices oughtto fall more sharply when wheat prices are falling thanaverage manufacturer and retail prices. In short, FSAprices should be noticeably more sensitive to inputcosts, both temporally in response to fluctuations inagricultural prices and spatially in response to differ-ences in transport costs. The data in table 8-2 are con-sistent with that interpretation; we could have more
confidence in it if we could also compare FSA pricetrends with manufacturer and retail price indexes duringperiods of agricultural price declines.
Conclusion
FSA appears to be able to obtain substantial price sav-ings on the five commodities that we investigated, with30-40 percent gains being common. We caution, how-ever, that the comparison is at present based on a limit-ed sample of commodities and on comparison to pricesquoted by manufacturers to one large foodservicewholesaler.
Because FSA prices appear to be more sensitive thanprivate sector prices to geographic location and tomovements in underlying agricultural commodityprices, the FSA price advantage will also vary tempo-rally and geographically. FSA prices will be lowest, rel-ative to comparable private sector prices, near produc-tion centers and during periods of low agricultural com-modity prices. Moreover, FSA�s advantage is likely tobe greater on common package sizes and product types,where the agency can induce greater competition inauctions.
Recent price trends suggest that FSA prices for pastaand peanut butter products have risen sharply comparedwith average manufacturer prices. In the case of pasta,FSA prices still appear to be far below private sectorprices; however, FSA peanut butter prices are movingcloser to private sector levels. When combined withperceived quality problems, many clients may not viewFSA peanut butter as an attractive purchase.
Food Procurement by Farm Service Agency / AER-766 USDA-ERS / 47
USDA�s Farm Service Agency operates a systemdesigned to elicit low bids for the delivery of large vol-umes of a limited number of food products. The systemlargely reaches those goals. The evidence in chapter 8shows that FSA prices are substantially below thoseobtained by private sector buyers; chapter 7 supportsthose findings by showing that agricultural commoditypurchase costs represent high shares of the prices forFSA food product purchases, suggesting that processingmargins are quite low. By implication, FSA stretchesUSDA budget dollars by purchasing substantial vol-umes of food products for any given budget allocation.
As the experience of DoD and the VA show, low pricesare only one of the things that ultimate consumers wantfrom their food distribution system. Along with nutri-tional needs, they are also interested in timely deliveryand product variety. FSA does not act as a full-line fooddistributor for its clients, and hence, does not focus onwide variety and rapid delivery. Rather, it fills a nicheby providing the opportunity for clients to obtain largevolumes of a few items at very favorable prices, and itfills that niche by limiting product variety and byresponding more slowly to orders than a full-line dis-tributor would. By saving clients money on USDAproducts, FSA can allow them to more effectivelyspend the rest of their budgets on a variety of products.
Nevertheless, FSA�s actions can affect clients� realiza-tion of their several goals. Because of FSA�s long leadtimes for delivery, client agencies must plan meals wellin advance. When FSA deliveries arrive later thanexpected, meal plans are upset, meal quality can suffer,
and client agency costs can rise sharply when they mustreplace FSA�s orders quickly. Moreover, USDA�s prod-uct offerings, sometimes devised with a view towardsurplus removal, do not always match client needs orexpectations from USDA�s niche service. As a result,even though FSA�s strengths lie in the provision oflarge volumes of a relatively few low-priced items, reli-able delivery and product variety still matter to clients,and the agency must be concerned with meeting clientexpectations of FSA in those areas.
The Role of Agricultural Prices
FSA bids are quite sensitive to movements in agricul-tural prices�far more sensitive to agricultural pricemovements than are general wholesale and retail foodprices. There is an important implication of that find-ing: because agricultural prices tend to fluctuate widely,FSA�s prices will fluctuate more widely over time thancorresponding wholesale and retail prices. FSA priceswill fall more than wholesale and retail prices whenagricultural prices decline, and they will rise morerapidly than wholesale and retail prices when agricul-tural prices rise sharply. The gap between FSA and cor-responding retail and wholesale prices, therefore,should be largest during periods of relatively low agri-cultural prices and smallest during periods of high agri-cultural prices. Because our data also suggest that FSAprices may be more sensitive to transport costs, the gapbetween FSA and corresponding retail and wholesaleprices should also be highest in those regions that areclose to agricultural production regions.
Food Procurement by Farm Service Agency / AER-766 USDA-ERS / 49
CHAPTER 9
CONCLUSIONS
Chapter 6 shows that bids for FSA products rose alongwith agricultural prices in the later part of our studyperiod, and that bids rose relative to FSA�s constructedprices. That pattern suggests a possible problem inKCCO�s calculation of constructed prices: in particular,because constructed prices seem less sensitive to under-lying agricultural prices than bid prices are, constructedprices may not give enough weight to agriculturalprices. The issue is important because KCCO uses itsconstructed prices to decide whether to cancel an auc-tion, and shift orders to later auctions. While, the threatof cancellation can be useful (auction theory suggeststhat the threat can lead to more competitive bidding,and the threat of cancellation is credible only if it isused at times), but actual cancellations lead to lags inproduct deliveries, thereby imposing substantial costson clients. FSA needs to guard against cancellation ofauctions when constructed prices are unreliable guides.We therefore recommend that FSA review its proce-dures for calculating constructed prices, with a particu-lar focus on the weight given to agricultural prices.
Competition
Competition matters, but it matters a lot only in somecircumstances. Our statistical analysis of bidding showsthat more bidders are consistently associated with lowerprices on FSA products, but the effect of more biddersbecomes rather small once an auction has two and threebidders. Most of the gains for FSA from competitioncome from adding a bidder in auctions where therewould otherwise be only one bidder. As an approximaterule of thumb, FSA can do as much for its clients byfinding a second bidder for a monopoly auction (reduc-ing prices by 4-7 percent) as by finding four more bid-ders for an auction that already has two. Consequently,FSA should be most concerned about competition inthose auctions that consistently attract a very smallnumber of bidders. We recommend that FSA focus itsefforts to add bidders for auctions that typically attractonly one or two bidders.
Chapter 6 shows that the number of bidders in FSAauctions varies substantially by product and over time.Where are the most serious competitive problems?Seasonality is important for some products: for exam-ple, over three-quarters of monopoly auctions in flouroccur in the fall, when mills operate near peak capacity.Monopoly auctions are also more likely among prod-ucts with limited FSA volume�unusual package sizesand product characteristics.
In those cases, FSA can counteract monopoly by con-veying accurate price information to clients�for exam-ple, that FSA�s price advantages over commercial flourproviders are weakest in the fall and strongest in otherperiods, or that FSA�s price advantages are strongest inhigh-volume products. We recommend that FSA ex-plore ways to counteract seasonal variations in monop-oly by extending the experiment with rolling contracts,currently in use with cheese, to other products. At pre-sent, funding authorizations can constrain FSA�s abilityto use rolling auctions because money appropriated inone fiscal year must usually be spent in that year.
Participation in FSA bidding has a distinctive �all ornothing� character to it; bidders typically commit tobeing active in FSA auctions, in which case they bidactively each month on auctions for a variety of loca-tions and products. Auction participation then does nottypically decline because bidders reduce the number ofauctions they are active in; rather, firms decide to getout of FSA bidding entirely. Our present research hasnot tried to uncover the reasons that firms decide toenter or leave FSA�s bidding process, but the data wehave developed do allow us to identify the firms thathave entered and left the process during the period.Efforts to increase competition should inquire into thereasons for entry and exit by those firms, and theresearch should generate strategies to attract participa-tion by more firms.
Effects of Purchase Volumes
Monthly FSA purchase volumes have dropped substan-tially as a result of changes in USDA commodity sup-port programs. But declining volumes have not as yethad any substantive effects on FSA bids. Purchase vol-umes have only small direct effects on prices, and thoseeffects are not always in the same direction. Moreover,changes in purchase volumes for individual productsappear to have had little effect on competition (typical-ly, bidder numbers fell and then rose during the period,while volumes fell consistently and sharply).
Monthly volumes have small effects on bids, and thedirection of the effect varies with volume; increases involume are first associated with declining prices, butthen drive prices up slightly in very high-volumemonths. The data also show that markets respond tototal USDA purchases (foreign and domestic), and notsimply to domestic buys. The most important effects onprices occur in months in which there are large PL480
50 /ERS-USDA Food Procurement by Farm Service Agency / AER-766
purchases; in those months, coincident large domesticpurchases can lead to FSA price increases of 2-4 per-cent. The driving factor in these instances are PL480purchases, which vary sharply from month to month.We recommend that FSA initiate strategies to get betterprices on domestic flour and vegetable oil, either bysmoothing PL480 purchases or by timing domestic pur-chases to avoid peaks in PL480 purchases.
Order volumes (the amount going to a specific destina-tion in a specific order) have very small effects onprices. Larger orders generally draw more aggressivebidding, but prices only fall by less than 1 percent;combining orders into multiple truckloads yields verylimited savings. Major gains in price likely come asone goes to truckload volumes from smaller orders, andFSA already acts to combine small orders into orders ofat least truckload sizes.
We also recommend that FSA advise client agenciesthat they can generally save 1-2 percent on purchaseprices if they are willing to accept delivery to majordestination points within a State, rather than to loca-tions that are rarely used for FSA deliveries.
Commercial Labels and USDA Inspection
The reliance on USDA labels and packaging shiftssome risks of poor product quality away from the ven-dor and toward USDA, and consequently creates a needfor USDA inspection. USDA inspection, along withoccasional unusual packaging requirements, can raisevendor costs by 1-2 percent; USDA inspection and test-ing can also occasionally lead to lags in product deliv-ery, which clients cite as a persistent problem. Somevendors, especially relatively small plants, cite inspec-tion and packaging requirements as deterrents to partic-ipation in FSA auctions because of the effects on costand on timely delivery of products.
The current system results in very competitive prices,and the insistence on USDA labels may contribute tothe competition that leads to those prices; some firmsmay not wish to bid aggressively on their own brandedproducts. In some products, in other words, the neteffect of USDA labels and inspection may be lowerprices. But insistence on USDA labels may, in otherproducts, limit opportunities to obtain surplus stocks ofcommercially labeled products and may deter additionalbidders from participating.
FSA currently purchases commercially labeled productsin a few commodity categories. In highly oligopolisticmarkets with only a few vendors, FSA may be able toobtain more product variety and greater competition byopening auctions to commercially labeled products. Theclear examples include the current experiments inready-to-eat cereal and infant formula. Those two casesillustrate a dilemma for the agency. A principal argu-ment for USDA labels is that they limit brand loyaltyon the part of consumers and, therefore, allow for morecompetitive bidding, but brand loyalty is important inthose two products (especially ready-to-eat cereal).
FSA�s shift to purchase of commercial labels reflectsthe agency�s judgment that the shift may introducegreater competition into two highly concentrated mar-kets. But FSA also purchases products for other mar-kets in which brand loyalty is far less importantbecause the brands are never seen by ultimate con-sumers and because the products are used as ingredientsin final servings, not as the serving itself. We recom-mend that FSA carefully evaluate its current experi-ments and consider a gradual expansion of commerciallabels (especially including high-quality private-labeland wholesalers� own-brand products), especially inproducts with limited existing brand loyalty and lowvendor participation.
Service Quality
Client agencies cited four common complaints. Theprimary complaint, referred to earlier, related to unreli-able delivery of products. This complaint has threemajor components: lags due to USDA inspectiondelays (typically at small plants), cancellation of auc-tions, and vendor noncompliance. FSA can improvereliability by reviewing procedures for cancellation andinspection (including labeling requirements), and byinstituting a more effective system of contractual penal-ties for noncompliance.
A second common complaint referred to product selec-tion: client agencies feel that surplus removal goalsdrive the selection and distribution of bonus commodi-ties that clients frequently have little interest in. Third,complaints sometimes referred to deterioration of someproducts. Finally, and related to the first three, clientscited barriers to problem resolution.
USDA products follow a long distribution chainbetween ordering food and serving a meal: a client
Food Procurement by Farm Service Agency / AER-766 USDA-ERS / 51
places an order with USDA, which then arranges forproduction. A vendor manufactures the product, andarranges for delivery from the processing plant to aState warehouse or to another processing site. Theproduct is then delivered to the client�s central facilitiesbefore being distributed to dining facilities, where fur-ther preparation and holding may occur before serving.The client may interact with State government agenciesin ordering and final delivery, and may be unaware thatup to five different USDA agencies may be involved intheir order for food.
FNS is developing a hotline system in an attempt torespond better to immediate client problems withagency deliveries. Larger issues, relating to programgoals and design, are likely to arise in response toongoing changes to Federal farm and food assistancepolicies.
Retention and Use of FSA Auction Data
FSA disposes of the electronic records of auctions after1 year. The research for this report relied primarily onpaper reports, the data from which were re-entered intoan electronic format. Electronic data retention growseasier and cheaper every year, and so do methods foranalyzing data. Moreover, because of steady improve-ments in the electronic retention and analysis of data,undergraduate business and economics majors now rou-tinely learn almost all the techniques that were used inthis analysis, and high school students are being intro-duced to techniques of graphing and summarizing sta-tistical data. In short, KCCO commodity analystsshould, in the future, be able to easily call up 5 years�worth of past auction data (for example); they shouldbe able quickly to summarize key data patterns, and caneasily be provided with expert summaries of more sub-tle issues. They should be able to use that informationin making auction decisions and in delivering timelyinformation and advice to client agencies. We recom-mend that KCCO�s future strategy for information tech-nology include steps to retain electronic auction recordsand to develop those records into easily accessible data-bases.
52 /ERS-USDA Food Procurement by Farm Service Agency / AER-766
Brannman, Lance, �Potential Competition and PossibleCollusion in Forest Service Timber Auctions.�Economic Inquiry 34 (October, 1996): 730-745.
Durham, Catherine A., and Emerson M. Babb, �TheImpact of the Number of Bidders and Costs on SchoolMilk Prices.� Unpublished Manuscript. PurdueUniversity. January 1997.
Kaufman, Philip R., James M. MacDonald, Steven M.Lutz, and David M. Smallwood, Do the Poor Pay Morefor Food? Item Selection and Price Difference AffectLow Income Household Food Costs. EconomicResearch Service, U.S. Department of Agriculture,Agricultural Economic Report No. 759. November1997.
Kuhlman, John M., and Stanley R. Johnson, �TheNumber of Competitors and Bid Prices.� SouthernEconomics Journal 51 (January 1985): 924-926.
Laffont, Jean-Jacques, and Jean Tirole, A Theory ofIncentives in Procurement and Regulation (Cambridge:The MIT Press, 1993).
MacDonald, James M., �Competition and Rail Ratesfor the Shipment of Corn, Soybeans, and Wheat.� TheRAND Journal of Economics 18 (Spring, 1987): 151-163.
McAfee, R. Preston, and John McMillan, �Auctionsand Bidding.� Journal of Economic Literature 25 (June1987): 699-738.
Meyer, Donald J., �Competition and Bidding Behavior:Some Evidence From The Rice Market.� EconomicInquiry 26 (January, 1988): 123-132.
Porter, Robert H., and J. Douglas Zona, �Ohio SchoolMilk Markets: An Analysis of Bidding.� NationalBureau of Economic Research Working Paper No.6037. May 1997.
U.S. General Accounting Office, �Best PracticesMethodology: A New Approach for Improving Government Operations.� GAO/NSIAD-95-154. May1995.
Wolfstetter, Elmar, �Auctions: An Introduction.�Journal of Economic Surveys 10 (December, 1996):367-420.
Food Procurement by Farm Service Agency / AER-766 USDA-ERS / 53
REFERENCES
AID � Agency for International Development, StateDepartment
AMS � Agricultural Marketing Service, USDA
BLS � Bureau of Labor Statistics, Department ofLabor
CCC � Commodity Credit Corporation, FNS/USDA
CSFP � Commodity Supplemental Food Program,FNS/USDA
DLA � Defense Logistics Agency, DoD
DoD � Department of Defense
DPSC � Defense Personnel Support Center,DLA/DoD
ERS � Economic Research Service, USDA
FAS � Foreign Agricultural Service, USDA
FNS � Food and Nutrition Service, USDA
FDIR � Food Distribution Program on IndianReservations, FNS/USDA
FSA � Farm Service Agency, USDA
GIPSA � Grain Inspection, Packers and StockyardsAdministration, USDA
KCCO � Kansas City Commodity Office, FSA/USDA
NSLP � National School Lunch Program, FNS/USDA
OAMM � Office of Acquisition and MaterialsManagement, VA
TEFAP � The Emergency Food Assistance Program,FNS/USDA
USDA � United States Department of Agriculture
VA � Department of Veterans Affairs
Food Procurement by Farm Service Agency / AER-766 USDA-ERS / 55
APPENDIX AGLOSSARY OF ACRONYMS
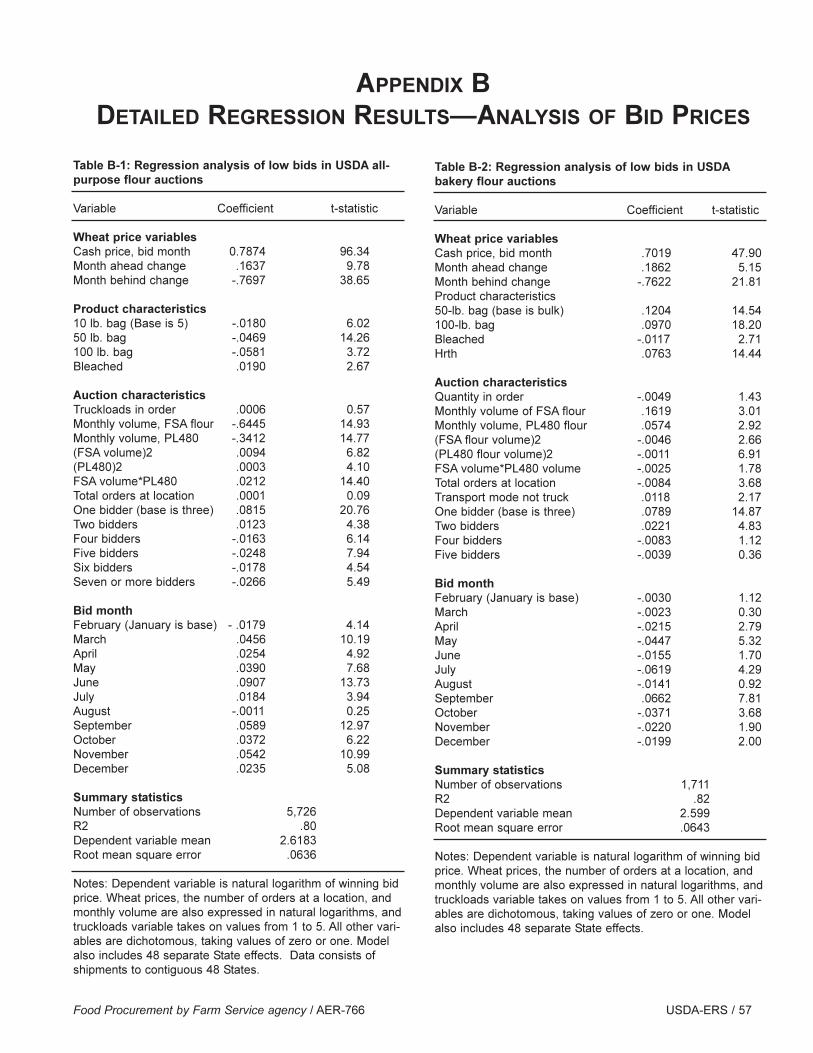
Food Procurement by Farm Service agency / AER-766 USDA-ERS / 57
Table B-1: Regression analysis of low bids in USDA all-purpose flour auctions
Variable Coefficient t-statistic
Wheat price variablesCash price, bid month 0.7874 96.34 Month ahead change .1637 9.78 Month behind change -.7697 38.65
Product characteristics10 lb. bag (Base is 5) -.0180 6.02 50 lb. bag -.0469 14.26 100 lb. bag -.0581 3.72 Bleached .0190 2.67
Auction characteristicsTruckloads in order .0006 0.57 Monthly volume, FSA flour -.6445 14.93 Monthly volume, PL480 -.3412 14.77 (FSA volume)2 .0094 6.82 (PL480)2 .0003 4.10 FSA volume*PL480 .0212 14.40 Total orders at location .0001 0.09 One bidder (base is three) .0815 20.76 Two bidders .0123 4.38 Four bidders -.0163 6.14 Five bidders -.0248 7.94 Six bidders -.0178 4.54 Seven or more bidders -.0266 5.49
Bid monthFebruary (January is base) - .0179 4.14 March .0456 10.19 April .0254 4.92 May .0390 7.68 June .0907 13.73 July .0184 3.94 August -.0011 0.25 September .0589 12.97 October .0372 6.22 November .0542 10.99 December .0235 5.08
Summary statistics Number of observations 5,726 R2 .80 Dependent variable mean 2.6183 Root mean square error .0636
Notes: Dependent variable is natural logarithm of winning bidprice. Wheat prices, the number of orders at a location, andmonthly volume are also expressed in natural logarithms, andtruckloads variable takes on values from 1 to 5. All other vari-ables are dichotomous, taking values of zero or one. Modelalso includes 48 separate State effects. Data consists ofshipments to contiguous 48 States.
Table B-2: Regression analysis of low bids in USDAbakery flour auctions
Variable Coefficient t-statistic
Wheat price variablesCash price, bid month .7019 47.90 Month ahead change .1862 5.15 Month behind change -.7622 21.81 Product characteristics 50-lb. bag (base is bulk) .1204 14.54 100-lb. bag .0970 18.20 Bleached -.0117 2.71 Hrth .0763 14.44
Auction characteristicsQuantity in order -.0049 1.43 Monthly volume of FSA flour .1619 3.01 Monthly volume, PL480 flour .0574 2.92 (FSA flour volume)2 -.0046 2.66 (PL480 flour volume)2 -.0011 6.91 FSA volume*PL480 volume -.0025 1.78 Total orders at location -.0084 3.68 Transport mode not truck .0118 2.17 One bidder (base is three) .0789 14.87 Two bidders .0221 4.83 Four bidders -.0083 1.12 Five bidders -.0039 0.36
Bid monthFebruary (January is base) -.0030 1.12 March -.0023 0.30 April -.0215 2.79 May -.0447 5.32 June -.0155 1.70 July -.0619 4.29 August -.0141 0.92 September .0662 7.81 October -.0371 3.68 November -.0220 1.90 December -.0199 2.00
Summary statisticsNumber of observations 1,711 R2 .82 Dependent variable mean 2.599 Root mean square error .0643
Notes: Dependent variable is natural logarithm of winning bidprice. Wheat prices, the number of orders at a location, andmonthly volume are also expressed in natural logarithms, andtruckloads variable takes on values from 1 to 5. All other vari-ables are dichotomous, taking values of zero or one. Modelalso includes 48 separate State effects.
APPENDIX B DETAILED REGRESSION RESULTS�ANALYSIS OF BID PRICES
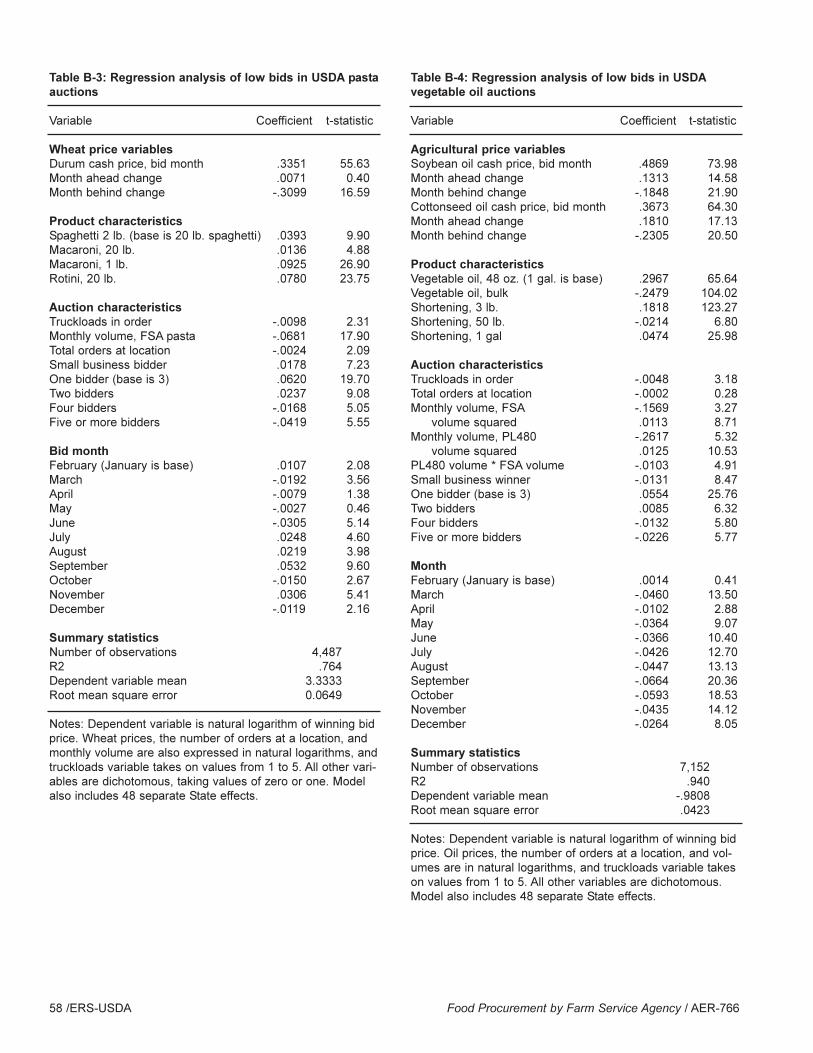
58 /ERS-USDA Food Procurement by Farm Service Agency / AER-766
Table B-3: Regression analysis of low bids in USDA pastaauctions
Variable Coefficient t-statistic
Wheat price variablesDurum cash price, bid month .3351 55.63 Month ahead change .0071 0.40 Month behind change -.3099 16.59
Product characteristics Spaghetti 2 lb. (base is 20 lb. spaghetti) .0393 9.90 Macaroni, 20 lb. .0136 4.88 Macaroni, 1 lb. .0925 26.90 Rotini, 20 lb. .0780 23.75
Auction characteristicsTruckloads in order -.0098 2.31 Monthly volume, FSA pasta -.0681 17.90 Total orders at location -.0024 2.09 Small business bidder .0178 7.23 One bidder (base is 3) .0620 19.70 Two bidders .0237 9.08 Four bidders -.0168 5.05 Five or more bidders -.0419 5.55
Bid monthFebruary (January is base) .0107 2.08 March -.0192 3.56 April -.0079 1.38 May -.0027 0.46 June -.0305 5.14 July .0248 4.60 August .0219 3.98 September .0532 9.60 October -.0150 2.67 November .0306 5.41 December -.0119 2.16
Summary statisticsNumber of observations 4,487 R2 .764 Dependent variable mean 3.3333 Root mean square error 0.0649
Notes: Dependent variable is natural logarithm of winning bidprice. Wheat prices, the number of orders at a location, andmonthly volume are also expressed in natural logarithms, andtruckloads variable takes on values from 1 to 5. All other vari-ables are dichotomous, taking values of zero or one. Modelalso includes 48 separate State effects.
Table B-4: Regression analysis of low bids in USDAvegetable oil auctions
Variable Coefficient t-statistic
Agricultural price variablesSoybean oil cash price, bid month .4869 73.98 Month ahead change .1313 14.58 Month behind change -.1848 21.90 Cottonseed oil cash price, bid month .3673 64.30 Month ahead change .1810 17.13 Month behind change -.2305 20.50
Product characteristicsVegetable oil, 48 oz. (1 gal. is base) .2967 65.64Vegetable oil, bulk -.2479 104.02 Shortening, 3 lb. .1818 123.27 Shortening, 50 lb. -.0214 6.80 Shortening, 1 gal .0474 25.98
Auction characteristicsTruckloads in order -.0048 3.18 Total orders at location -.0002 0.28 Monthly volume, FSA -.1569 3.27
volume squared .0113 8.71 Monthly volume, PL480 -.2617 5.32
volume squared .0125 10.53 PL480 volume * FSA volume -.0103 4.91 Small business winner -.0131 8.47 One bidder (base is 3) .0554 25.76 Two bidders .0085 6.32 Four bidders -.0132 5.80 Five or more bidders -.0226 5.77
Month February (January is base) .0014 0.41 March -.0460 13.50 April -.0102 2.88 May -.0364 9.07 June -.0366 10.40 July -.0426 12.70 August -.0447 13.13 September -.0664 20.36 October -.0593 18.53 November -.0435 14.12 December -.0264 8.05
Summary statisticsNumber of observations 7,152 R2 .940 Dependent variable mean -.9808 Root mean square error .0423
Notes: Dependent variable is natural logarithm of winning bidprice. Oil prices, the number of orders at a location, and vol-umes are in natural logarithms, and truckloads variable takeson values from 1 to 5. All other variables are dichotomous.Model also includes 48 separate State effects.
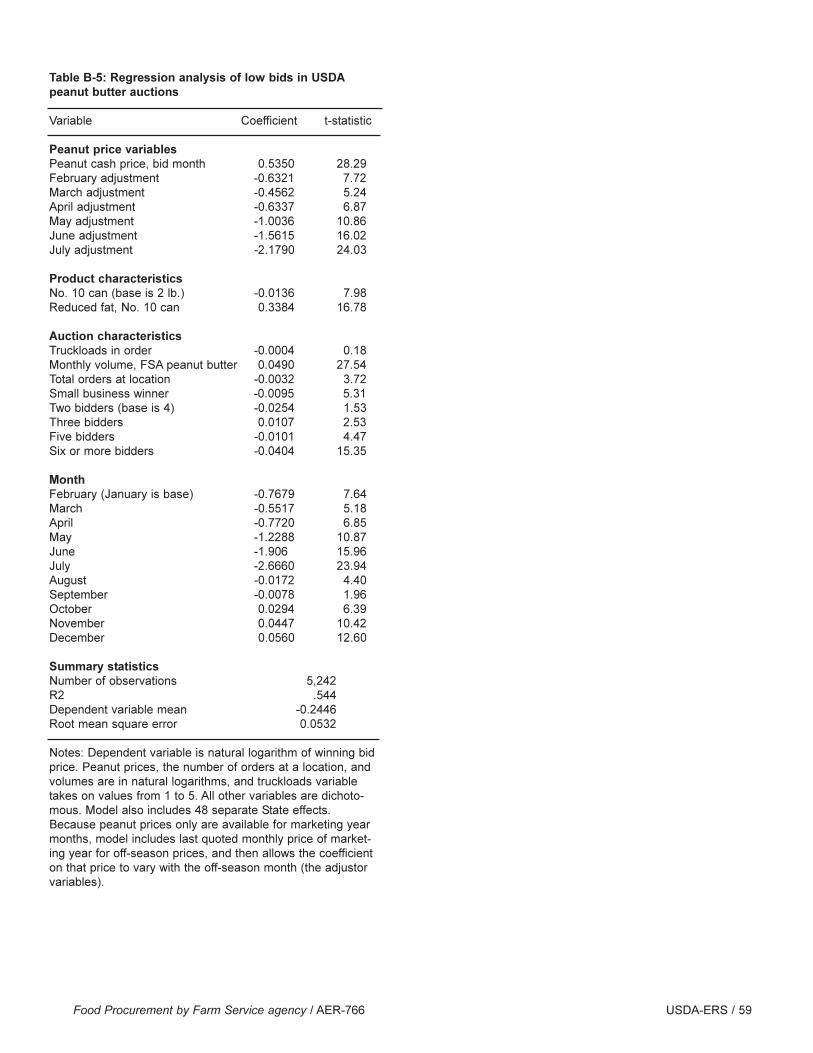
Food Procurement by Farm Service agency / AER-766 USDA-ERS / 59
Table B-5: Regression analysis of low bids in USDApeanut butter auctions
Variable Coefficient t-statistic
Peanut price variablesPeanut cash price, bid month 0.5350 28.29 February adjustment -0.6321 7.72 March adjustment -0.4562 5.24 April adjustment -0.6337 6.87 May adjustment -1.0036 10.86 June adjustment -1.5615 16.02 July adjustment -2.1790 24.03
Product characteristicsNo. 10 can (base is 2 lb.) -0.0136 7.98 Reduced fat, No. 10 can 0.3384 16.78
Auction characteristicsTruckloads in order -0.0004 0.18 Monthly volume, FSA peanut butter 0.0490 27.54 Total orders at location -0.0032 3.72 Small business winner -0.0095 5.31 Two bidders (base is 4) -0.0254 1.53 Three bidders 0.0107 2.53 Five bidders -0.0101 4.47 Six or more bidders -0.0404 15.35
MonthFebruary (January is base) -0.7679 7.64 March -0.5517 5.18 April -0.7720 6.85 May -1.2288 10.87 June -1.906 15.96 July -2.6660 23.94 August -0.0172 4.40 September -0.0078 1.96 October 0.0294 6.39 November 0.0447 10.42 December 0.0560 12.60
Summary statisticsNumber of observations 5,242 R2 .544 Dependent variable mean -0.2446 Root mean square error 0.0532
Notes: Dependent variable is natural logarithm of winning bidprice. Peanut prices, the number of orders at a location, andvolumes are in natural logarithms, and truckloads variabletakes on values from 1 to 5. All other variables are dichoto-mous. Model also includes 48 separate State effects.Because peanut prices only are available for marketing yearmonths, model includes last quoted monthly price of market-ing year for off-season prices, and then allows the coefficienton that price to vary with the off-season month (the adjustorvariables).

60 /ERS-USDA Food Procurement by Farm Service Agency / AER-766