Food Processing and Technology 1978: A Summary of Research
72
RESEARCH CI RCULAR 240 AUGUST 1978 Food Processing and Technology 1978 : A Summary of Research OHIO AGRICULTURAL RESEARCH AND DEVELOPMENT CENTER U. S. 250 and Ohio 83 South Wooster, Ohio
Transcript of Food Processing and Technology 1978: A Summary of Research

RESEARCH CIRCULAR 240 AUGUST 1978
Food Processing and Technology 1978: A Summary of Research
OHIO AGRICULTURAL RESEARCH AND DEVELOPMENT CENTER U. S. 250 and Ohio 83 South
Wooster, Ohio

CONTENTS ***** **** **** *****
Evaluation of Tomato Cultivars for Processing, by W. A. Gould, W. Stone, J. Mount, L. Witt, Y. Yamada, and S. Z. Berry ______________ _
Geotrichum candidum in Midwestern Tomato Processing Plants and Various Methods of Inhibiting its Growth, by James G. Fox and Wilbur A. Gould __ 7
Effects of Various Qualities of Raw Tomatoes (Subjective Evaluation) on Color of Extractable Juice (Objective Evaluation), by Yasunori Yamada and Wilbur A. Gould ______________ JO
Protein Content of Seeds Taken from Tomatoes at Various Stages of Ripeness, by Daniel Brodowski and J. R. Geisman ____________ 16
Effects of Cultivar, Break Temperature, and Extraction Methods on the Viscosity of Tomato Juice, by Hashmy Bel-Haj and Wilbur A. Gould _____ 18
A Study of Some Factors Affecting the Solid Content of Canned Tomatoes, by J. R. Mount and W. A. Gould ________________ 25
Prediction of Ascorbic Acid Stability in Canned Apple Juice, by Mohamed I. Mahmoud and Wilbur A. Gould _____________________ 29
Investigation of Protein Content of Ohio Grown Soybeans, by Girish N. Desai and Andrew C. Peng ____________________________ 37
Recovery and Functionality of Soybean Leaf Proteins, by Mohammed H. Ali and Andrew C. Peng ________________________ 39
Carotene Content of Green Snap Beans, by H. Fenercioglu and D. E. Crean _______________________________ -44
Effect of Reconditioning on the Ascorbic Acid Content of Potato Cultivars, by I. S. Arkoudilos and D. E. Crean _______________ _46
Kinetic Studies of Polyphenol Oxidase from HiDri Cabbage, by Ling-May Chen and Andrew C. Peng ___________________________ _48
Refinements in Pickle Brine Recycling, by T. Glares and J. R. Geisman ________ 53
Use of Ultraviolet Light to Inhibit Staphylococcus aureus Growth on the Surface of Baked Pumpkin Pie, by Nicholas N. Kallas and Wilbur A. Gould ________________________ 56
Development of a Nutritionally Improved Corn Maso, by Thomas H. Rieman and Wilbur A. Gould ________________________ 59
Mechanical Deboning of Lake Erie Freshwater Drum, by W. E. Stone and W. A. Gould __________________________________ 62
Lake Erie Freshwater Drum Fillet Processing, Storage, and Evaluation, by W. E. Stone and W. A. Gould ______________ 66
ON THE COVER: The product quality of OARDC-originated tomato selections and cultivars is evaluated to determine their merit and response to cultural treatments by Brad Hair and Mike Huber, graduate research associates, and Bill Stone, lab supervisor in the Food Processing Pilot Plant.
All publications of the Ohio Agricultural Research and Development Center are available to all on a nondiscriminatory basis without regard to race, color, national origin, sex, or religious affiliation.
AGDEX 141-l 61-211-252·253-255·256-257-485/73-76-78 8-78-2M

Evaluation of Tomato Cultivars for Processing W. A. GOULD, W. STONE, J. MOUNT, L. WITT, Y. YAMADA, and S. Z. BERRY1
INTRODUCTION In Ohio tomatoes continue to be the most im
portant processed crop with planted acreage of 22,000 acres and one-half million ton production. Ohio ranks second only to California in processed tomato production.
The transition to new field production methods and new processing practices continues to create needs for a choice of better suited cultivars. This research continues to be especially directed toward improvement of the whole-pack product. Also of importance is the development of improved types for use in juice, sauce, and paste.
The objective of this study was to determine the suitability of 20 Ohio-grown tomato cultivars for processing and the quality of the canned products. The cultivars included were classified as established and/ or new cultivars to Ohio tomato growers.
MATERIALS AND METHODS The 1977 processing tomato project included 20
cultivars grown in replicated plots under acceptable commercial practices at the Ohio Agricultural Research and Development Center's Northwestern Branch near Hoytville. Each cultivar was machine harvested (with FMC Western Model) with little or no sort on the harvester and bulk handled. Following harvest the tomatoes were transported by truck (approximately 100 miles) to the Food Processing Pilot Plant at The Ohio State University, Columbus, for processing. AU lots were processed after 24 hours' hold following harvest as peeled whole tomatoes. A. About 10 to 12 field-run tomatoes were random
ly selected and used for objective and subjective raw quality evaluation. 1. Size was determined by weighing the sample
and then calculating the number for a 1 lb sample. In addition, the tomatoes were subjectively classed for shape, fruit surface, core, firmness, defects, and number and size of locules.
2. Objectively, stem scar length, stylar scar length, and stem length were determined by measuring the average length in inches and wall thickness in centimeters.
3. Percent red color was determined by countipg the number of tomatoes with full red color in the sample.
'Professor, Technical Assistant, Graduate Research Associate, Technical Assistant, Visiting Research Associate, and Professor, respectively, Dept. of Horticulture, The Ohio State University and Ohio Agricultural Research and Development Center.
3
4. E-5 cut surface color was determined on an Agtron E-5 instrument after making a crosswise cut into the tomato and reading the values after standardizing the instrument at 48.
5. The sample was then quartered, extracted in a Food Processing Equipment Co. laboratory pulper, and deaerated. a) The deaerated pulp was presented to
the Agtron E-5 instrument in a sample cup with the instrument calibrated at 48. The color reading was taken directly and recorded as such.
b) The deaerated pulp was also presented to the Hunter Color Difference Meter D25D3A in a standard plastic sample cup and the Hunter L, a, b values and TCM value were taken directly and recorded as such.
c) Percent soluble solids: An Abbe refractometer was used for direct determinations of percent soluble solids. The instrument was standardized with distilled water and all readings were converted to 70° C.
d) pH: The pH was determined by the glass electrode method (Beckman Zeromatic pH meter) using 10 ml of tomato juice diluted with 90 ml of distilled water.
e) Percent total acid as citric: The sample used for pH determination was directly titrated using 0.1 normal sodium hydroxide solution to a pH of 8.1. Calculations using the following equation were made:
(No. of ml of 0.1 N NaOH) (.0064) % acid = ------------- x 100
10 ml sample
f) Ascorbic acid: Ten ml aliquots of tomato juice were diluted with 90 ml of 1 % metaphosphoric acid and filtered. A 10 ml aliquot of the filtrate was titrated with 0.2% 2,6-dichlorophenolindophenol indicator solution. Milligrams of Vitamin C were determined by the following formula:
mg Vitamin C Dye factor x ml of dye x 100 = ------
100 g

Score Chart for Canned Tomatoes
Maximum Grade A Grade A Grade B Grade C Sub-Factors Points (Fancy) (Whole) (Ex. Std.) (Std.) standard
Drained Wt. 20 18·20 16-20*** 16-17 14-15* 0-13* Wholeness 20 18-19 20 16-17 14-15*
Color 30 27-30 27-30 24-26* 21-23* 0-20*
Defects 30 27-30 27-30 24-26 21-23* 0-20*
Minimum Score 90 90 80 70
*Limiting rule. Conned tomatoes falling into these classifications may not be graded higher regardless of total score. **Special limiting rule. Sample units of canned tomatoes falling into this classification may not be graded higher than U. S. Grade B,
regardless of the total score. ***Applicable to individual sample units only. To apply drained weight schedule for "Grode A Whole" provided, lot must also meet pro·
vision for Grade A for the factors of color and defects. Lot compliance requires minimum drained weight index of entire sample to score no less than 1 8 points for GRADE A WHOLE.
B. Preparation and processing of the tomato: All tomatoes were prepared for canning by washing, lye peeling ( 18% caustic soda and Faspeel at 88° C for 20 seconds) and processed as whole tomatoes. Each lot of whole tomatoes was filled to 10.0-10.5 oz. in No. 303 x 406 size fruit enamel tin cans with a 50-grain salt tablet containing 44.5% NaCl, 15% CaSo,.H20, 37% citric acid, and 3 .5 % sodium bicarbonate.
C. Grades of Canned Tomatoes: Grades were determined in accordance with the U. S. Standards for Grades of Canned Tomatoes ( 1).
RESULTS AND DISCUSSION The results are presented in Table 1. Of the 20
cultivars in the 1977 trials, 11 were rated Grade A for
4
canned tomatoes. Of these 11 cultivars, five had pH above 4.6, indicating a definite need for acidification. Outstanding cultivars for processing were Chico III, 07664, 07667, 07678, 07612~ 076121, 076122, 076170, and 076156.
With these new cultivars, a processor now has a choice based on maturity for tomatoes of variable size with no or little core for packing Fancy or Grade A tomatoes.
REFERENCE 1. Judge, E. E. and Sons (Ed.). 1977. The Al
manac of the Canning, Freezing, Preserving Industries. E. E. Judge & Sons, Inc., Westminister, Md., p. 381.

TABLE 1.-Tomato Cultivar Evaluation, Raw Product and Canned Whole Pack, 1977.
Cultivar C-37 Chico Ill Wakefield Pu-74-74 07630
RAW Fruit shape Oblong Pear Oblong Oblong Oblong No./ lb 5 6-7 6 7 4 Stem scar - '!. -'!. - 'I· - '!. -v. Stylar scar 'le None None None 'la Firmness Hard Medium Medium Medium Hard
E5 pulp color 35.5 31.0 53.5 47.0 30.0 TCM color 68.1 76.6 65.4 77.6 75.3 pH 4.6 4.48 4.60 4.66 4.5 TA 0.32 0.36 0.28 0.31 0.33 S.S. 4.8 4.6 3.8 4.6 4.1 Vitamin c 18.3 22.6 15.4 20.1 16.6
CANNED Ct./ can 6 7 7 6 4
Drained wt. 17 18 16 17 17 Wholeness 19 20 18 20 19
Color ~7 28 27 27 26*
Defects 25* 30 28 29 25* Total score 88* 96 89 93 87* Grade B A B A B
Comments Large core, Soft Blotchy Stem scar stem scar excessive excessive
Cultivar
07635 07663 07664 07667 07668
RAW Fruit shape Globe Variable Variable Globe Oblong
No./ lb 4 6 5 7 12
Stem scar 1;, . '/, '!.-'Is v. -'/, -1/, - '!. Stylar scar '!. Ve None None 'Is Firmness Hard Hard Medium Hard Hard
E5 pulp color 32.0 49.0 37.5 34.0 42.0
TCM color 74.6 61.2 75.0 75.9 80.3
pH 4.5 4.55 4.55 4.3 4.62
TA 0.36 0.35 0.34 0.31 0.44
S.S. 4.3 4.1 3.8 4.6 4.3
Vitamin c 11.6 20.1 18.9 17.4
CANNED Ct.lean 5 6 7 5 7
Drained wt. 16 15** 17 16 17
Wholeness 19 20 20 19 20
Color 26* 28 29 28 29
Defects 25* 30 29 29 29
Total score 86* 93** 95 92 95
Grade B B A A A
Comments Stem scar Dark core excessive
*Limiting rule. **Partial limiting rule.
5

TABLE 1. (Continued)-Tomato Cultivar Evaluation, Raw Products and Canned Whole Pack, 1977.
Cultivar
07678 07681 076120 076121 076122
RAW Fruit shape Oblong Glo-Obl Oblong Oblong Obl-Glo No./lb 9 3 7 6 5 Stem scar -11. '!. - '12 '!. -'/, 'I• -v, '!• -'/, Stylar scar None 'la 1/s 'la None Firmness Hard Hard Hard Hard Medium E5 pulp color 31.5 47.0 26.0 32.0 28.0 TCM color 77.3 69.4 78.2 77.1 pH 4.5 4.6 4.61 4.57 4.5
T.A. 0.34 0.27 0.40 0.42 0.40 S.S. 4.0 4.2 4.6 4.3 4.2 Vitamin c 23.3 13.0 17.4 13.5 16.2
CANNED Ct./ can 7 3 6 7 6 Drained wt. 17 17 16 16 18
Wholeness 20 20 20 20 20 Color 28 27 28 28 28 Defects 29 26* 29 29 29 Total score 94 90* 93 93 95 Grade A B A A A Comments Firm core Stem scar Soft Dark stem
excessive, scar needs coring
Cultivar
076123 076156 076170 076GI069 076Gl034
RAW Fruit shape Oblong Oblong Globe Oblong Glo-Obl
No./ lb 4-7 8 8 6 6
Stem scar 1/, - '12 '!. -'/, -'I• -11. -11. Styler scar 'la 'la None None None Firmness Medium Hard Soft Hard Hard E-5 pulp color 43.0 30.0 25.5 31.0 38.0 TCM color 71.3 81. l 81.3 84.6 70.8 pH 4.6 4.58 4.6 4.36 4.6 T.A. 0.31 0.37 0.31 0.28 0.30 S.S. 3.5 4.2 4.4 4.3 4.4 Vitamin c 17.5 18.7 22.6 17.7 14.2
CANNED Ct./ can 4 6 6 4 6 Drained wt. 16 16 18 16 16 Wholeness 20 20 20 19 19
Color 21 29 29 28 26* Defects 28 29 30 25* 27 Total Score 91 94 97 90* 88* Grade A A A B B Comments Stem scar Stem scar Soft
excessive excessive, veiny
*Limiting rule. **Partial limiting rule.
6

Geotrichum candidum in Midwestern Tomato Process'ing Plants and Various Methods of Inhibiting its Growth
JAMES G. FOX and WILBUR A. GOULD1
INTRODUCTION For many years sanitation was only a major con
cern in the home, but with the increasing number of people depending upon others to process their foods, government agencies have enacted regulations establishing sanitation guidelines for the food processing industry. The Good Manufacturing Practices, Part 128-Sanitation (Recodified 110, 3/15/77), which were promulgated in 1969 are an example.
Through the years, sanitation has often been defined in terms of what was not sanitary rather in terms of what was sanitary. Also, according to R. K. Guthrie, "The Act (The Food, Drug, and Cosmetic Act of 1938) considers food sanitation in terms which appear to make 'unsanitary' and adulterated almost synonymous." This usage is a result of the recognition that sanitation is concerned with the prevention of the spread of infectious disease, and is also concerned with chemical and physical characteristics of the food which may affect health. Further, the Food and Drug Act defines (in part) food as being adulterated if it " ... consists in whole or in part of any filthy, putrid, or decomposed substance, or if it is otherwise unfit for food; or if it has been prepared, contaminated with filth, or whereby it may have been rendered injurious to health ... " The phrases "may have become" or "may have been" are key phrases because they infer that only the possibility of contamination need be shown by regulatory agencies.
Geotrichum candidum or machinery mold is an example of an organism being utilized by the U. S. Food and Drug Administration and other regulatory agencies as an indicator of whether a food may have been prepared, packed, or held under unsanitary conditions whereby it may have been contaminated with filth. Therefore, the objectives of this study were: 1) to determine whether machinery mold was present in mid western tomato processing plants, 2) to monitor the growth of machinery mold on various plant areas over a 5-week period to determine possible critical points in the processing operation, and 3 ) to determine the effect of temperature and chlorine inhibitory effects on the growth of Geotrichum candidum.
MATERIALS AND METHODS The study involved monitoring the growth of
machinery mold in two tomato processing plants over a 5-week period for various unit operations. The two processing facilities were chosen partially on the
7
basis of their size and product line and also on the basis of the management's concern for improving potential deficiencies which might exist in their sanitation program.
One processing plant (Plant A) was a whole pack tomato processor who operated for one shift a day at a rate of approximately 15 tons per hour. The other processor (Plant B) was a concentrated tomato product processor operating three shifts a day at a rate in excess of 100 tons per hour.
The area monitored at the smaller processing facility (Plant A) included:
Site 1-The elevator coming out of the receiving tank
Site 2-The inside of a flume at water level Site 3-The angle iron framework of the in
spection table Site 4-The conveyor belt on the inspection
table Site 5-The chopper used for comminuting
the tomatoes for juice. The areas monitored at the larger processing fa
cility (Plant B) were identical except for three changes:
Site 2 (a-d)-Four flumes were monitored instead of one
Site 4-The inspection table used rollers instead of a rubber conveyor belt
Site 6-A sixth sample site was added-the wooden retaining boards present on one inspection table.
Samples were drawn hourly at each sample site by using a swab technique with a I-square-inch template, and enumerating with the FDA's official staining procedure as described in the J. AOAC 57:957. At Plant A, duplicate samples were drawn hourly at each sample site for an 8-hour period while at Plant B, duplicate samples were drawn at each sample site for a 12-hour period.
RESULTS AND DISCUSSION As the data in Figure 1 indicate, growth of ma
chinery mold was found at all monitored areas in Plant A. The 5-week average after 8 hours' operation at the elevator coming out of the receiving tank (Site 1 ) was approximately 60 mycelial fragments
1Graduate Research Associate and Professor, Dept. of Horticulture, The Ohio State University and Ohio Agricultural Research and Development Center.

('lj 5000 :c
4500 CJ z I
I ....... • en 4000 I ...
z I w I :E I 0 3000 I o( I a: I u. I .... I o( 2000 I • ..I I w I CJ > I ~ 1000 I
I I • 85
I 0
2 3 4
MONITORING SITE
FIG. 1.-Growth levels at Plant A.
50000 48000
I I • "' • :
CJ I z 37500 • ... • ...... • en I I- • z • w • I: • c:I 25000 I cc I 22450
a: • I u. • 18400 • I ..I I 17200 • cc • I 16500 • • I I • • - I ..I • I I I II.I 12500 • • • I • u • I • I > • I • I • I I
I I I I I
• I I I I I I I I I 1350 • I I • • I 2
0 2 2 2 2 3 4 5
MONITORING SITE
FIG. 3.-Growth levels at Plant B.
5
46000 I • • • • • I • • • • • I • I • I I I • I I
6
8
per square inch. On the inside of the flume (Site 2), approximately 4,500 mycelial fragments per square inch were enumerated; on the angle iron framework (Site 3), about 70 mycelial fragments per square inch were found. On the conveyor belt (Site 4), about 85 mycelial fragments per square inch, and on the chopper (Site 5) approximately 13 mycelial fragments per square inch were enumerated. However, it must be remembered that these figures represent the average of results obtained over a 5-week period. As the data in Figure 2 indicate, the total count after 8 hours steadily increased over the period of the season, indicating that the processor's control measures were less effective as the processing season continued. The exact reason for this effect could not be determined, although the lack of a separate and trained sanitation crew probably had some effect.
The data in Figure 3 indiate that machinery mold was found on all monitored areas at Plant B. The 5-week average growth after 12 hours operation on Site 1 was approximately 48,000 mycelial frag-
20000
17000 I
('lj I ::c CJ 15000 I z I
I ....... I en I ~ I z I w • I 10000 I
I c,, I cc • i:::
u. I I ....
cc I - 5200 I .... 5000 • • w • I 4500
CJ
I I > I I :E I I • • s I I 0
2 3 4 s 6
WEEI<
FIG. 2.-Weekly increase of growth on flume of Plant A.

ments per square inch. The level of growth on the four monitored flumes fluctuated as indicated by the following results of 620 at Site 2a, 1 7 ,200 at Site 2b, 18,400 at Site 2c, and 16,500 mycelial fragments per square inch at Site 2d. The samples collected at Site 3 averaged 22,450 mycelial fragments per square inch and Site 4 had an average of 1,350 mycelial fragments per square inch. The average for Site 5 was only 2 mycelial fragments per square inch, and the wooden retaining walls of the conveyor (Site 6) had approximately 46,000 mycelial fragments per square inch. These wooden boards were removed after 2 weeks by the management and replaced with stainless steel material. While the weekly averages fluctuated for all areas monitored, there was no steady increase of mold growth as observed at Plant A. However, except for the chopper, all total levels of growth were higher at Plant B than at Plant A.
It was also determined that machinery mold ( isolated from a Plant B sample) grew well at temperatures of 20 to 40° C (in vitro) ; growth was retarded at 15 and 42° C and attenuated by 5 minutes' exposure to 5 ppm free residual chlorine (from calcium hypochlorite).
Geotrichum candidum is an ubiquitous organism that will grow on the surface of food processing equipment in midwestern tomato processing plants, as indicated in the results previously presented. The level of growth varied between sampling areas within the two processing plants, with Plant B having higher total growth levels at all but one sampling area. However, Plant A had an increase of growth as the processing season continued, while Plant B maintained relatively stable levels of growth throughout the season. The large difference in mold growth at Sites 2b-d at Plant B was believed to have been due to the inefficient
9
counterflow recycled water system vs. a more efficient filtering system to remove settleable solids in the Site 2a flume. All other observed factors such as flow rate, water temperature, cleaning schedule, and tomato tonnage were the same.
The in vitro study of temperature growth range indicates that the organism will grow quite well at ambient temperatures normally associated with processing facilities and therefore cannot be viewed as a mechanism for general control, although some specific applications might exist for temperature control of the organism. Use of in-plant chlorination of water supplies during 1976 essentially eliminated the machinery mold problem at these two plants. Plant B found 2.5 ppm and 1.0 ppm residual chlorine effective in controlling machinery mold in water spray areas and the flume system respectively.
REFERENCES 1. Cichowicz, S. M. and Eisenberg, W. V. 1974.
Collaborative study of the detection of Geotrichum mold in selected canned fruits and vegetables. J. AOAC, 57:957.
2. Guthrie, R. K. 1972. Food Sanitation. Avi Publishing Co., Westport, Conn.
3. Howard, B. J. 1917. The sanitary control of tomato-canning factories. U.S.D.A. Bull. 569.
4. Somers, I. I. 1951. Studies on in-plant chlorination. Food Technol., 5 ( 2) :46.
5. The Almanac of the Canning, Freezing, and Preserving Industries. 1974. Edward E. Judge & Sons, Inc., W estminister, Md.
6. Wildman, J. D. and Clark, P. B. 1947. Some examples of the occurrence of machinery slime in canning factories. J. AOAC, 30(3) :582.

Effects of Various Qualities of Raw Tomatoes CSubiective Evaluation) on Color of Extractable Juice CObiective Evaluation)
YASUNORI YAMADA and WILBUR A. GOULD1
INTRODUCTION Color of tomato juice is one of the most impor
tant factors in quality determination according to U. S. Standards for grades and inspection manuals ( 1 ) for both raw and final processed products. The segregation of raw tomatoes by the evaluation of color before processing is necessary to establish final product quality. For this reason, contracts between growers and processors involve quality criteria based on color and other factors for the acceptance of raw materials going to the processing plant.
An accurate and reliable method of evaluating raw tomato color is needed. There are several instruments and methods of juice extraction in use for raw tomato color determination. The extraction method and maturity of the fruit are considered the greatest factors influencing the color of the extracted juice.
The purpose of this study was to evaluate the effects of method of extraction of raw tomatoes on level of quality and to objectively measure color with the aid of the Hunter Color Difference Meter and Agtron E-5.
The specific objectives of this study were: a) To study the effects of method of extraction
of raw tomatoes on color of juice b) To study the effects of method of color
evaluation (instruments) on raw product color
c) To study the effects of various blends of red, pink, and green mature fruit on the color of extractable juice with and without application of heat to the raw tomatoes prior to extraction
d) To determine the effects of deaeration on the color of extractable juice.
MATERIALS AND METHODS Raw tomatoes used for this study were mechani
cally harvested, delivered to the Food Processing Pilot Plant at Ohio State University, and held for up to 24 hours before evaluation. Several cultivars were mixed and then sorted into full red, mature pink, and green (grass green to partially pink) fruits. After sorting and washing by hand, blends of red, pink, and green tomatoes ( 20 lb total each blend) of known
1Visiting Research Associate and Professor, Dept. of Horticulture, The Ohio Stote University and Ohio Agricultural Research and Development Center.
10
percentages were made (Table 1). Tomatoes of each blend were cut into quarters, stem end to blossom end, each quarter being used for the following extraction methods:
1) Berkle extractor (B) with a 0.033 inch screen, half of each sample was evaluated directly and half deaerated under vacuum before evaluation (B/D)
2) OSU (Ohio State University) Century pulper and deaeration (OSU/D) for 2 minutes under vacuum
3) California Blender method (CB )-tomatoes were blended for 1 minute under 27 inch vacuum in 'a Waring Blendor and screened with a 14 mesh screen
4) Microwave heating (M) of the tomatoes to 190° F followed by extracting with M/ OSU and M/B methods.
Color evaluation was performed with a Hunter Color and Color Difference Meter D25D3A standardized on Hunter tile D33C-1585 (L 25.6, a 27.7, b 12.10, and TC 71.58), and an Agtron E-5 standardized at 48 on a scale of 0-100. Linear regression analyses were used to determine the relationship of the various extraction methods to color.
RESULTS AND DISCUSSION The results indicate that the B/D extraction
method resulted in the best scores as indicated by lower E-5, higher a/b ratios, and higher TC values. However, the CB method appeared to result in the least amount of incorporated air, although objective evaluation indicated no advantage. The OSU method was found to definitely require the deaeration step due to incorporation of air by the Century extractor used in this method. Microwave heating of tomatoes appeared to have adverse effects on tomato color as indicated by the data for the M/OSU and M/B methods and resulted in lower a/b ratios and E-5 values (Tables 1 and 2).
Regression analyses of extraction methods for color values showed that the method correlated best when using the E-5 or a/b values, but correlated poorly when TC values were used (Table 3, Figures 1 and 2).
The percentage of mature pink and green tomatoes had a definite effect upon the color of extracted juice (Figure 3). As either mature pink or green

tomato percentages were increased, the a/b ratio decreased and E-5 values increased.
Thus, in summary, the Berkle (B) or Berkle/Deaeration (B/D), CB, and OSU/D were found to be satisfactory extraction methods when used in conjunction with a/b and E-5 values. However, microwave heating used with M/OSU and M/B methods was found to be undesirable. Higher correlation of (B) and (B/D) methods indicated that deaeration
may not be necessary with these methods to obtain a reliable color index. It also was found that full red, mature pink, and green tomatoes could be used in various combinations to obtain a target color index.
REFERENCE 1. Gould, W. A. 1974. Tomato Production, Pro
cessing and Quality Evaluation. Avi Publishing Co., Westport, Conn.
TABLE 1.-Effects of Tomato Maturity Blends and Extraction Method on Color of Extracted1 Juice.
Percent Fruits (by Maturity)
Blend Red Pink Green
100
2 90 10
3 90 5 5
4 80 20
5 80 10 10
6 70 30
7 70 20 10
*See text for definitions.
Extraction Method*
B B/D CB OSU/D M/OSU M/B
B
B/D CB OSU/D M/OSU M/B
B B/D CB OSU/D M/OSU
M/B
B
B/D CB OSU/D M/OSU M/B
B B/D CB OSU/D M/OSU M/B
B B/D CB OSU/D M/OSU M/B
B B/D CB OSU/D M/OSU M/B
11
a/b
2.60 2.60 2.67 2.72 2.36
2.71 2.75 2.72 2.73 2.29 2.38
2.63 2.69 2.61 2.63 2.18 2.17
2.61 2.70 2.65 2.59 2.20 2.21
2.58 2.60 2.50 2.54 2.08 2.16
2.70 2.74 2.66 2.80 2.39 2.37
2.53 2.57 2.21 2.54 1.87 2.02
Color Values
E-5
27.0 22.5 24.5 27.0 27.0
25.0 23.5 27.0 30.5 30.0 25.5
28.3 27.8 30.8 35.3 48.5 31.0
29.3 27.3 30.3 36.5 33.5 31.5
31.3 28.5 32.3 34.3 37.0 33.0
27.5 24.5 29.5 27.5 32.5 28.5
31.8 29.5 34.0 35.8 47.5 38.5
T.C.
79.71 83.24 79.12 70.76 72.76
76.88 79.90 77.32 70.03 72.76 78.88
75.39 78.38 78.88 66.42 65.97 76.02
75,01 77.97 77.45 65.93 68.45 75.30
75.87 80.65 78.52 69.35 67.82 76.65
74.73 79.36 75.70 73.47 70.52 73.81
75.47 79.06 75.57 70.86 64.62 73.28

TABLE 2.-Effects of Various Blends of Mature Fruits on Color Values With and Without Heating for Extraction.
Blend Composition
% Red % Pink % Green Hunter a/b Agtron E-5
Without Heat 90 10 10 2.73 26.5 80 20 0 2.64 30 8 90 5 5 2.64 30.5
80 10 10 2.56 31.6
70 20 10 2.46 32.7
With Heat by Microwave Oven
90 10 0 2.36 28.9 80 20 0 2.27 33.3
90 5 5 2.26 32.5 80 10 10 2.21 36.3
70 20 10 2.11 39.9
TABLE 3.-Correlation of Extraction Methods.
Hunter a/b Agtron E-5 Hunter T.C.
x y y= y= y=
B B/D 0 987 l .08X - 0 18 0.845 o 85X + 2.13 0.676 0.55X + 37.55 B CB 0.811 l.41X - 1.15 0.872 121X - 4.66 0.663 0.81X + 15.98 B OSU/D 0.941 1.43X - 1.10 0.746 l.29X - 3.97 0.234 0.43X + 101.65 CB B/D 0.781 0.49X + 1.40 0.896 0 65X + 7.01 0.271 0.18X + 65.49 CB OSU/D 0 756 0.87X + 0.27 0.843 0 68X + 7.75 0.654 -0.44X + 107.70 B/D OSU/D 0.919 0.67X + 0.91 0.824 0.48X + l 0.73 0.225 O.lOX + 72.60
B = Berkie Method B/D = Berkie and Deaeration CB = California Blender Method OSU/D = OSU Pulp Method and Deaeration
12

3.0
2.9
2.8
2.7
2.6
2.5
2.4
2.4 2.5 2.6
BERKLE EXTRACTION METHOD HUNTER a/b RATIO
2.7 2.8
FIG. 1.-Relationship of Hunter a/b ratios of tomato juice extracted by Berkie (BJ and Berkle-Deaeration (B/DJ methods.
13

§ ::c: H
r.:r:I ~ :::i
~ s H H
LI')
~ I r.:r:I ~ z r.:r:I
~ .e H r.:r:I
~ ~ i:i::: r.:r:I P::i
45
40
35
30
25
25
Y = 0.85X + 2.13
r = 0.845
3 35
BERKLE EXTRACTION METHOD AGTRON E-5 VALUE
I 40
FIG. 2.-Relationship of Agtron E-5 values of tomato juice extracted by Berkie (B) and Berkie-Deaeration (B/D) methods.
14

2.8
2.7 ., • • With heat - Microwave . , . 2.6 • Without heat
r:i::i 2.5 . , ~ x ,.Q 2.4 - ., m iZ 2.3 r:i::i H • z § 2.2
2.1
90/ 80/ 90/ 80/ 70/ % Red 10/ 20/ 5/ 10/ 20/ % Pink 0 0 5 10 10 % Green
MATURITY
40
/. • • With heat -
Microwave
35
•-. /. JC )( Without heat
I.I"\ I
r:i::i
z ~ ~. ,_. ~ H ,,... M
~ 30 'Ix x~
)(
25
90/ 80/ 90/ 80/ 70/ % Red 10/ 20/ 5/ 10 20/ % Pink 0 0 5 10 10 % Green
MATURITY
FIGURE 3
15

Protein Content of Seeds Taken from Tomatoes at Various Stages of Ripeness
DANIEL BRODOWSKI and1 J. R. GEISMAN1
INTRODUCTION A majority of the processing tomatoes are made
into liquid products such as juice, catsup, paste, and puree. The solid waste remaining after the extraction process consists of culls, peels, cores, seeds, and trimming~. The utilization of these solid waste products as a food source has only recently begun to he explored.
Solid waste is one of the few readily availahlr and untapped resources in this country. Tomato pomace is now landfilled, incinerated, or fed to animals. Since tomato seeds comprise a majority of the solid waste generated, the utilization of tomato seedq as a protein source is an intriguing proqpcct for hath limiting environmental pollution and feeding the world's expanding population. With this in mind, a project was undertaken to provide preliminary information which will be necessary in the eventual use of tomato seed protein. The main purpose was to determine the protein content and amino acid profile of tomato seeds at various stages of ripening in the tomato and also to determine the lipid content of tomato se;ds at these stages.
MATERIALS AND METHODS Two cultivars of tomatoes, Campbell 28 and
Heinz 1350, were hand picked from The Ohio State University horticultural plot in Columbus. These cultivars were selected because of their popularity with the industry and were grown under accepted commercial practices for this area.
The tomatoes were sorted for maturity based on color observations. The Michigan State University classification for grading fresh market tomatoes was used ( 2). This includes six categories as follows: green-complete green in color; breakers-a definite change in color from green to tannish yellow, pink, or red on not more than 10% of the surfaces; turningmore than 10'.)( but not more than 30% of the total surface shows a definite color change from green to tannish yellow, pink, red or combination thereof; pink-more than 30% but not more than 60% of the total surface shows pink or red; light red-more than 60% of the total surface shows pinkish red or re<l provided that not more than 90% of the surface is red; red-90% or more of the total surface shows red color.
1Former Graduate Student and Professor, Dept. of Horticulture, The Ohio State University and Ohio Agricultural Research and Development Center.
16
After sorting the tomatoes according to color, the seeds were removed by cutting each fruit in half, squeezing the seeds and the surrounding gel into a large beaker. Approximately 25 ml of water were added to 200 ml of seeds and gel to decrease the consistency. This mixture was then blended in a Waring Blendor at low speed for 5 seconds to separate the gel from the seeds ( 1). The mixture was filtered and washed with water through a 12 mesh screen to remove the gel.
The seeds were then placed in containers and allowed to dry for 72 hours at 30° C. After drying, the seeds were ground in a Wiley mill fitted with a 20 mesh screen. Half of the ground seed meal was stored in sealed containers at 22° C until analyzed for amino acids and protein. The remainder was defatted with a 2: I ( v Iv) ratio of chloroform and methanol. This defatted seed meal was dried in a Forester oven for 48 hours at 30° C.
Micro-Kjeldahl was used to determine the amount of crude protein in the dried whole and defatted seed samples. The amino acid profile was determined with the aid of a Durrum D-500 amino acid analyzer. The solvent used to defat the seed meal was filtered and filtrate placed in preweighed 250 ml beakers. The solvent was evaporated in a water bath at 60° C. Beakers were dried and weighed to determine the amount of lipid present in each sample.
RESULTS AND DISCUSSION The results of the protein determinations are
shown in Table 1 for both whole and defatted tomato seed meal. These results indicated that defatted tomato seed meal was slightly higher in protein content than the whole tomato seed meal. There was no dif-
TABLE 1.-Average Percent Protein Content of Whole and Defatted Tomato Seed Meal by Stage of Ripeness for Campbell 28 and Heinz 1350 Cultivars.
Campbell 28 Hein:. 1350 Ripeness Whole De fatted Whole Defatted
Percent Protein* Green 23.4 27.5 23.2 27.4 Breaking 23.7 27.4 23.4 26.9 Turning 23.3 26.7 22.9 26.7 Pink 23.5 27.l 23.5 27.0 Light Red 23. l 27.0 22.9 27.5 Red 23.l 27.2 23.2 27.0
*Dry weight basis, gm/l 00 gm.

TABLE 2.-Average Amino Acid Content of Defatted Campbell 28 Tomato Seed Meal at Various Stages of Ripeness.
Amino Acid Stage of Ripeness
Green Breaking
Percent* Aspartic Acid 5.06 4.98 Threonine 1.39 1.46 Serine 2.08 2.02 Glutamic Acid 6.76 6.68 Proline 2.02 1.99 Glycine 1.82 1.74 Alanine 1.61 1.57 Cystine 0.56 0.54 Valine 1.63 1.62 Methionine 0.51 0.49 lsoleucine 1.39 1.36 Leucine 2.33 2.30 Tyrosine 1.75 1.66 Phenyla Ian ine 1.77 1.72 Histidine 0.86 0.80 Lysine 2.48 2.31 Arginine 3.72 3.64 Ammonia 0.83 0.81
Total 38.57 37.71
*Dry weight basis, gm/1 00 gm.
ference in protein content between cultivars. However, the most important conclusion from these data was that the change in stage of ripeness does not affect the protein content of the seeds. This means that any stage of maturity could be used for seed collection and would allow green tomatoes from mechanically harvested fields to be utilized as a source of seed protein.
Defatted tomato seed meal was found to be high in both glutamic acid and aspartic acid (Table 2). In general there was little change in amino acid composition of the seed as the tomato rip..:.ned. These results also indicated the same trend as pointed out for the data in Table 1. The higher total protein content (Table 2) is due to the utilization of a more purified protein sample. It should also be noted that tomato seeds were found to be an excellent source of lysine.
TABLE 3.-Average Percent lipid from Campbell 28 Tomato Seeds at Various Stages of Ripeness.
Ripeness
Green Breaking
Turning
Pink
Light Red
Red
*Dry weight basis, gm/1 00 gm.
Percent Lipid*
28.1 28.4 28.3 30.l 31.3 31.7
17
Turning Pink Light Red Red
4.06 4.76 4.02 4.06 1.30 1.30 1.21 1.20 1.88 1.90 1.82 1.81 6.41 6.50 6.47 6.45 1.85 1.85 1.86 1.87 1.61 1.69 1.62 1.65 1.45 1.48 1.42 1.43 0.55 0.55 0.56 0.56 1.49 1.53 1.42 1.41 0.52 0.49 0.56 0.55 1.28 1.28 1.26 1.27 2.17 2.14 2.07 2.09 1.63 1.57 1.66 1.65 1.62 1.63 1.58 1.60 0.77 0.77 0.82 0.81 2.14 2.16 2.19 2.19 3.39 3.49 3.31 3.37 0.72 0.80 0.74 0.72
34.82 35.89 34.54 34.68
The results of the lipid composition indicate that the lipid content of tomato seed increases as the tomato ripens (Table 3). Since high quantities of lipid may interfere with protein extraction, it would be desirable to extract lipid material prior to grinding or milling for protein recovery. The lipid content that exists in red tomatoes would indicate that protein from green tomatoes could be extracted more readily than protein from the ripe tomatoes.
SUMMARY AND CONCLUSIONS Disposal of solid waste is a major problem for
tomato processors. One solution is to reduce the amount of tomato pomace by converting tomato seeds into usable by-products. Relatively high protein content of the seeds suggests their possible value as a food source.
The protein content and amino acid profile of tomato seeds indicated that there was little change as the fruit ripened. This is most beneficial in that culls from mechanical harvest as well as immature fruit can be used as a source of tomato seeds for protein extraction.
The lipid content of seeds increased slightly as the tomato ripened. Lipid accumulates to provide energy for the rapidly growing seedling during germination. Tomato seed oil is similar chemically and physically to a number of commercial vegetable oils ( 3). It is pale yellow in color and has a fatty nutlike taste with no bitter aftertaste. These character-

istics would allow tomato seed oil to also be used as a food product.
Solid waste has been described as a resource out of place. With current waste disposal and food problems, it is important to investigate the use of new resources. The study has described some basic information about tomato seed protein, amino acids, and lipids. These products could be utilized for human food, which would alleviate the disposal problem for a tomato processor as well as provide additional resources to feed the expanding world population.
REFERENCES 1. Brodowski, Daniel. 1977. Protein content of
seeds taken from tomatoes at various stages of ripeness. M.S. Thesis, The Ohio State University.
2. Michigan State University. 1973. Tomato graders manual. Cooperative Extension Service, Bull. 767.
3. Rabak, Frank. 1917. tomato seeds and skins.
The utilization of waste U.S.D.A., Bull. 632.
Effects of Cultivar, Break Temperature, and Extraction Methods on the Viscosity of Tomato Juice
HASHMY BEL-HAJ and WILBUR A. GOULD1
INTRODUCTION Viscosity or consistency is one of the most im
portant factors to be considered in determining the overall quality and acceptability of many tomato products. Viscosity is paramount as a quality attribute in determining the acceptability of tomato products by the consumer and is an integral part of the quality grade standard requirements ( 2).
Several factors have a great influence on the viscosity of tomato juice. Both the serum and the suspended solid particles contribute to the viscosity; the viscosity is further influenced by the character, size, and proportion of the suspended particles. In addition, many variations are possible in the chemical composition of the suspended solids, which will be partly governed by maturity and other characteristics of the tomato used and/ or by the method of manufacture. Thus, the possible variations in the consistency and viscous particles of tomato juice are practically unlimited ( 2) .
It has been shown that pectic substances are of considerable importance in determining consistency in tomato juice. In tomato juice manufacture, the freshly crushed tomato fruit (macerate) must be quickly heated to 180° Fin order to inactivate pectic enzymes ( 2) . If a lower temperature than this is employed, pectic enzymes remain active and rapidly alter the pectic substances and the resulting tomato juice is characteristically thin and watery.
McColloch et al. ( 7) found that there is a considerable loss in pectic substances when preheating
1Graduate Student and Professor, Dept. of Horticulture, The Ohio State University and Ohio Agricultural Research and Development Center.
18
temperatures are too low and the pectic enzymes are not inactivated, which leads to lower consistency. Luh et al. (6) reported that tomato pulp consistency depends on tomato variety and the quantity of pectic materials present in the puree. Luh et al. ( 5) reported that juices made from soft-ripe tomatoes were thinner in consistency than those made from firm-ripe fruits. This might be partially explained by the higher protopectic content in firm-ripe tomatoes.
Juice with proper consistency should have a smooth mouth feel and its solids should not separate readily from the serum. Consequently, the objectives of this study were to determine the effect of the following on consistency:
a) New cultivars b) Break temperature c) Extraction and pulping methods using dif
ferent screen size openings at different extractor speeds.
MATERIALS AND METHODS The experimental work described in this study
was carried out in the Food Processing Pilot Plant and laboratories of the Department of Horticulture, The Ohio State University.
Tomato cultivars ( C-37, 07667, 076170, 076-G 1069, and 076G 1034) were produced under the direction of the Vegetable Crops staff of the Department of Horticulture and were mechanically harvested at the OARDC Northwestern Branch near Hoytville. They were transported to the Pilot Plant in Columbus for processing.
Upon arrival, the tomatoes were sorted for quality (removal of defected and grass green fruits only)

and were placed in an agitated soaker wash at 105 ° F. After approximately 3 minutes in the soak tank, fruits were moved on a roller conveyor under high pressure sprays ( 130 psi, square spray pattern) with each fruit turning about twice under the spray. After washing, the fruits were sorted to remove any other defective fruits. After sorting, the tomatoes were chopped or crushed followed by hot break at three different temperatures, 200° F, 175° F, and 150° F for 15, 36, and 45 seconds, respectively.
Following the heat treatment (hot break), the juice was extruded in a Langsenkamp extractor (screw type) with 0.023 screen size and a Langsenkamp pulper at different screen sizes and paddle speeds, ranging from 0.023 to 0.033 with varying speeds between 1150 to 1650 rpm. Following extraction, the juice was pumped to a holding tank where a sample of the juice was immediately filled in No. 303 plain tin cans and frozen at -17° F for extraction and detection of enzyme activity.
The remainder of the juice was then pumped to a Walker-Wallace paraflow heat exchanger (Model HT-four pairs of stainless steel plates HTST sterilization in which the juice was held at 250° F for 42 seconds). The juice was then filled in No. 303 fruit enamel cans with a 50 gram NaCl tablet added. After closing and holding for 2 minutes, they were spin cooled to a temperature of 100-105 ° F and then cased and stored for analysis of the following:
1 )
2)
Gross Viscosity: Gross viscosity was measured with a GOSUC efflux-tube viscometer which has been described by Kluter ( 3). Viscosity values were expressed as time in seconds.
Serum Viscosity: Serum was obtained from juice by centrifugation at 10,000 rpm for 30 minutes. The serum viscocity was measured using an Ostwald-Cannon-Fenske viscometer. Viscosity wa<i expressed as the ratio of the flow rate of serum to flow rate.
3) pH: The pH was measured by the glass electrode method (Beckman Zeromatic pH Meter), using 10 ml of tomato juice diluted with 90 ml of distilled water.
4) Percent Total Acid as Citric: The sample which was used for pH determination was titrated directly using O.lN NaOH to a pH of 8.1 and calculating the total acid using the formula:
(No. ml of 0.1 N NaOH) x 0.0064 % Acid= x 100
10 ml sample
Correlations were calculated and standard statistical methods ( 4) for viscosity by the Ostwald and GOSUC.
19
TABLE 1.-Effects of Break Temperature on Tota) Acidity and pH of Tomato Juice from Different Culti-vars.
150° F 175° F 200° F
Cultivar pH T.A. pH T.A. pH T.A.
22 4.44 0.347 4.45 0.341 4.5 0.301 21 4.41 0.385 4.43 0.373 4.55 0.291 20 4.48 0.362 4.50 0.351 4.51 0.315 10 4.30 0.371 4.31 0.360 4.5 0.310
RESULTS AND DISCUSSION Reported in Table 1 are pH and total acid values
for the three break temperatures from four different cultivars. In every instance, the total acidity for the 200° F break temperature was lower than that for the 175° F or 150° F break temperatures. The difference in total acidity for the three different break juices may be explained by the enzymatic deesterification of pectin in the tomato pulp to form pectic and galacturonic acid by pectin esterase (PE) and polygalacturonase (PG). Preheating at 200-220° F causes rapid heat inactivation of PE and PG and this resulted in lower titratable acidity values in the product.
The effects of cultivar and break temperature are presented in Figure 1. The observed variation between cultivars is due to the nature of the chemical composition. The decrease of total pectin at lower break temperature was caused by the action of the enzyme PG on the pectic materials during maceration ( 5) . The sample extracted at the highest break temperature ( 200° F) was higher in pectin retention due to the efficient heat inactivation of PG.
The effects of cultivar on gross viscosity and serum viscosity are presented in Figure 2. Juice from cultivars with high gross viscosity showed high serum viscosity; however, variation was observed between the cultivars. The relationship between gross viscosity and serum viscosity is presented in Figure 3. There was a good correlation between gross and serum viscosity.
Finisher screen size and paddle speed also had an apparent effect on gross and serum viscosity. The data in Figures 4 and 5 indicate that, in general, the higher the paddle speed and the smaller the screen size, the higher the gross and serum viscosity. This may be explained on the basis of relative numbers of particles present in the juice. When the finisher was operated at low speed ( 1150 rpm), fewer particles were incorporated into the juice (most of which were spherical) and the juice obtained was of low viscosity. Conversely, when the finisher speed was high ( 1650 rpm), greater numbers and concentrations of

tlllllllllllllllllllllllllllllllllll
JlllllllllllllllJlllllllJlllllll'
lllllllllllllllllllllJllllllllll
LI I I LI 11111 U 11111111 I 111IU11JJ11
111 Ill ll ll ll ll llll 1111111111111111111
111 II Lii ll Ill I I I I I I I I I I IJ 1111IJ1111111
I I I lll 1111 IJ 1111111111111111 J 111111
,lllfllJllllJllllllllllllllllllllllll
illllllllllllllllllllllllllllllllllllllll
I I I ll l I I I I I I l I l I I I I I I I I I I l I I I l l I I I I ll I
'I 1111111111 U I 11 UJ JI I I I I I I I I I I I I I I U 1 IJ 1111IJIll11
lllJlllllllllllllJJJJlllllllllllllllllll
ll I I l I I l I I I I I I I I I I I I I l J 111LIJ11111 lll LU LI I
IJlllllllllJllllllllllJlllllllllllllllllllllllllllllllll
l1J 111HI111111111111111 IJ 1111111111111LI1111111'
I
90 80 70 60 50 40 30 20 10 GROSS VISCOSITY (GOSUC)
01
10
20
21
22
01
10
~ 0
0 L() ...;
~
20 °o 0
21 N
22
FIG. 1.-Effects of cultivar and break temperature on the gross viscosity of tomato juice.
20

2.1 .. ...... >$f . ·--. •.. ,f ,
f .t»
100 • ·-····· Gross Viscosity 2.0
90 -1 Serum Viscosity • 1.9
80 I L 1.8 C/l l:tj ~
70 • 1. 7 §! Ci) - • • ~ I • <I 0
H C/l I I C/l C/l 60 • CJ <I - I I I 1.6 ~ H
I • • • H C/l • ~ CJ
I\.) ~ 50 I • I I I 1.5 8 ....... H '"" I • I • ~ I C/l ~
s 40 I I • I I ~ 0 I • I I I 1.4 8 C/l
I I I "-/ c::: I I CJ
"-/ 30 I I I • I I L 1.3 I I I I • I I I I I 20 .. I I • I I L i.2 I • I I I I
10 -I I I I I I I L i.1 I • • • I
I • - • I
' 22 21 20 10 01
CULTIVARS -...:..,
FIG. 2.-Effects of cultivar on the gross viscosity and serum viscosity of tomato iuice.

Y = 0.018X + 0.386 I r = 0.83 •# •• 2.2 •• ••
2.0 - • '!t •
•• Cl • • •• ~ • •• E-1 l:t.l 1.8 0 •• ~ • ~ ••• • E-1 H (/j
0 •• t..,) l:t.l 1. 6 H ::> .1 ~ • IJ:J • l:t.l ••• r:i::l ::> H 1.4 -j • •• r:i::l P::i •• • •
1.2 - ••• • • ¥'_ ••
•* 1.0
20 40 60 80 100
GROSS VISCOSITY BY GOSUC (SEC.)
FIG. 3.-Relation between serum viscosity and gross viscosity.
22

particles were incorporated into the juice (most of which were elongated) resulting in higher viscosity. In addition, the finisher operated at 1650 rpm gave a higher gross and serum viscosity than the extractor operated at the same speed and screen size (0.023 inch).
REFERENCES 1. Gould, W. A. 1974. Tomato Production, Pro
cessing and Quality Evaluation. Avi Publishing Co., Westport, Conn.
2. Kertesz, Z. T. and J. D. Laconti. 1944. Factors determining the consistency of commercial canned tomato juice. N. Y. State Agr. Exp. Sta., Geneva, N. Y., Tech. Bull. No. 272, pp. 3-36.
3. Kluter, R. A. 1959. The objective measurement of tomato juice consistency. Unpublished
100 .. 90 •
80 ..
- 70 .. t) :::> tf.l • 8 60 .._,, -.. • ~ H
-I tr.I 50 0 u tr.I H > tr.I 40
• -I -• - -tr.I
~ C!l
30
I -I .. -I 20 -...
I -10 • "" -I --
• -• -• -• -• -• -• -• -• -• -• -• 0.023 0.027
M. S. Thesis, The Ohio State University. 4. Little, T. M. and F. J. Hills. 1975. Statistical
methods in agricultural research. UCD Book Store, University of California, Davis, pp. 121-136.
5. Luh, B. S., S. Leonard, and W. H. Dempsey. 1945. Pectic substances of Pearson and San Marzano tomatoes. Food Research, 19:146.
6. Luh, B. S., W. H. Dempsey, and S. Leonard. 1954. Consistency of pastes and puree from Pearson and San Marzano tomatoes. Food Tech., 8:576.
7. McColloch, R. J., B. W. Nielson, and E. A. Beaven. 1950. Factors influencing the quality of tomato paste. 2. Pectic changes during processing. Food Technol., 4:339.
1650 rpm
•1•1• 11so rpm
• -• -• -I -I -• -I -• -• ~ -
0.033 0.023
-----•Finisher -----•
SCREEN SIZE (IN)
Extractor
FIG. 4.-Effects of screen size and operating speed on gross viscosity of tomato juice.
23

1650 rpm 2.2 ..
• •••• 1150 rpm 2.1 ..
2.0 ii>
1. 9 "' ......_ Q ....:i 1.8 g Cf,)
0 1. 7 ..,..,
"'
• • .... - -:>-< • I ~
1. 6 H Cf,)
0
- -.. • I -0 Cf,)
1.5 H l>
~ 1. 4 fl'l Cf,)
I -~ I -• -• -~ • -I -
1. 3 • -"' I -1. 2
1.1
I -I - - • • -I -- • .. • -• -- • - -0.023 0.027 0.033 0.023
-----Finisher ----- Extractor
SCREEN SIZE (IN)
FIG. 5.-Effects of screen size and operating speed on serum viscosity of tomato juice.
24

A Study of Some Factors Affecting the Sol'id Content of Canned Tomatoes
J. R. MOUNT and W. A. GOULD1
INTRODUCTION The Food and Drug Administration published
a drained weight or solid content weight labeling proposal for canned fruits and vegetables in the Dec. 9, 1977, Federal Register ( 1). This proposal would require canned tomatoes, when packed in containers whose capacity is equal to or less than a No. 10 can, to bear on their label the net weight and a statement of the drained weight of the solid tomato content except that the solid content weight (fill weight) may be used in place of the drained weight.
The FDA also decided to evaluate the proposal during the 1977 and 1978 processing seasons by determining the variations occurring in the fill weights and drained weights within different processing plants and among different processing plants. The FDA was also going to look at the control procedures used by a packer to minimize the variation of the actual fill weight.
This study was initiated to determine the amount of variation occurring in fill weights and drained weights of 303x406 cans of whole tomatoes in Ohio tomato processing plants. The study also evaluated some of the factors affecting the variability of fill weights and drained weights of canned tomatoes.
MATERIALS AND METHODS The study was divided between the Food Proces
sing Pilot Plant at Ohio State University and several Ohio tomato processing plants.
During the summer of 1977, 20 cultivars of tomatoes were grown at the OARDC Northwestern Branch near Hoytville. They were mechanically harvested into bulk bins and transported to the Pilot Plant. Each tomato cultivar was processed separately within 24 hours after being delivered to the Pilot Plant. The tomatoes were initially separated in a water separator into two lots, one of red tomatoes and the other of green and overripe tomatoes. A portion of the red tomatoes was then processed as canned whole tomatoes. The tomatoes were prepared for canning by washing, lye peeling ( 18% caustic soda and Faspeel at 205° F for 35 seconds), and inspection for extra standard or fancy grade fruit.
The tomatoes were then filled at 9.0 to 9.5, 10.0 to 10.5, or 11.0 to 11.5 ounces into 303x406 fruit
1Graduate Research Associate and Professor, Dept. of Horticul· ture, The Ohio State University and Ohio Agricultural Research and Development Center.
25
enamel tin cans. A 50-grain salt tablet contammg 44.5% sodium chloride, 15j1r calcium sulfate, 37~?citric acid, and 3.5% sodium bicarbonate was then added to each can and the tomatoes wen' covered with tomato juice at a temperature of 200° F. The cans were exhausted for 3 )IS minutes and then steam flow closed at 15 psi. The cans of tomatoes werr prcces5ed at 210° F for 25 minutes, water cooled, and stored for 30 days before being opened and graded.
Eight Ohio tomato processing plants were selected on the basis that they packed whole tomatoes into 303x406 cans and each was given a code number with which to be identified. Twenty-one separate lots of canned tomatoes were evaluated from the eight plants during the 1977 processing season. Each lot of tomatoes evaluated had the following data recorded:
a) The cultivar and/or size of tomatoes being processed
b) The concentration, temperature, and time immersed in the caustic peeling solution
c) The filling method d) The exhaust method e) The initial temperature f) The type, time, and temperature of the
heating and cooling processes g) The code on the cans of tomatoes h) The grade of tomatoes being packed. Fill weights were determined for groups of six
cans at a time which were randomly selected every 10 to 20 minutes over a period of 2 to 3 hours for each lot of tomatoes. The fill weights were determined by allowing the cans of tomatoes to drain for 1 minute on a No. 2 size sieve and recorded to the nearest 0.1 ounce. Sample cans of tomatoes were obtained after they had been processed for determining the drained weights. These cans were transported to the Pilot Plant and stored for 30 days and then opened and graded.
RESULTS AND DISCUSSION Cultivars: The cultivar of tomato processed was
found to have a significant influence on the drained weight of cans of tomatoes. The average drained weights of the 20 cultivars of tomatoe-s processed in the Pilot Plant were found to be significantly different (PS 0.01) at each of the three fill weights at which they were packed (Table 1). The cultivars Chico III,

TABLE 1.-Average Drained Weights of 20 Cultivars of Tomatoes Packed into 303 x 406 Cans at Three Fill Weights-9.0 to 9.5, 10.0 to 10.5, and 11.0 to 11 .5 Ounces During 1977.
Average Drained Weights*
Fill Wt. (oz) Fill Wt. (oz) Fill Wt. (oz) Cultivar Cultivar 9.0-9.S 10.0-10.5 11.0-11.5 Average
Chico Ill 9.24 at 10.30 a 11.21 a 10.25 a 07668 9.10 ab 10.21 ab 10.99 abc 10.10 ab 076170 8.89 a-d 10.16 ab 11.13 ab 10.06 ab 07664 8.99 abc 9.99 abc 10.63 a·e 9.87 abc 07681 8.61 c-f 9.91 a-d 10.97 abc 9.83 abc 07678 8.58 c-f 9.78 b-e 10.76 a-d 9.70 bed 076156 8.88 a-d 9.57 c-f 10.37 d-g 9.61 cde 076122 8.34 efg 9.40 e-h 11.20 a 9.61 cde 07630 8.61 c-f 9.51 d-g 10.56 b-f 9.56 cde PU-74-74 8.50 def 9.62 c-f 10.54 b-f 9.55 c-f C-37 8.50 def 9.54 c-g 1 0.49 c-g 9.51 c-g 076123 8.72 b-e 9.53 c-g 10.24 d-g 9.50 c-g 076121 8.63 c-f 9.37 e-i 9.98 fgh 9.33 d-h 076120 8.50 def 9.22 ghi 10.01 fgh 9.24 e-h 07635 8.29 efg 9.10 ghi 10.14 efg 9.18 fgh Wakefield 8.03 g 9.22 ghi 10.30 d-g 9.18 fgh 076G1069 7.97 g 9.26 f-i 10.06 fg 9.10 fgh 076Gl 034 8.04 g 8.96 i 10.18 d-g 9.06 gh 07663 8.27 fg 9.09 ghi 9.49 h 8.95 h 07667 7.37 h 9.00 hi 9.95 gh 8.77 h
Average:!: 8.50 x 9.54 y 10.48 z
* 10 cans of tomatoes were analyzed to determine each average drained weight. tValues in a column followed by a common letter are not significantly different at P s .01. :!:Values in this row followed by a common letter are not significantly different at P s .01.
07668, and 076170 had significantly higher drained weights at all three fill weights than cultivars 07635, Wakefield, 076G1069, 076Gl034, 07663, and 07667.
The size of the tomatoes being processed in the commercial processing plants varied and resulted in significant variations occurring in the average fill weights. Six lots of canned tomatoes from Plant 110 were evaluated and the four lots in which tomatoes size 6-7 tomatoes per pound were packed had an average fill weight of 10.49 ounces. The two lots in whi.ch tomatoes size 7-9 per pound were packed had an average fill weight of 11.24 ounces. The difference in fill weights resulted from more of the smaller tomatoes being packed into the cans when the same filling operations were used.
Plants 107 and 108 both had lots of canned tomatoes in which the size of the tomatoes varied in the middle of the lot. Both plants cored all of their tomatoes and hand filled them. The fill weights of the cans of tomatoes averaged 9.76 ounces when tomatoes size 5-6 tomatoes per pound were being filled. The fill weights decreased to an average of 8. 70 ounces when tomatoes size 7-9 per pound were being filled. This resulted because the same number of tomatoes continued to be filled into the cans for the entire period of time; as the size of the tomatoes decreased, so did the fill weights.
26
P,eeling Conditions: All of the tomato processing plants used approximately the same lye peeling conditions for the lots evaluated except for Plant 101. This plant increased the concentration and temperature of the caustic solution between the times when the fir~t and second lots were evaluated. This resulted in the tomatoes in lot 2 being softer, which in turn resulted in the average fill weight for lot 2 being higher ( 12.04) than the fill weight for lot 1 ( 10.93). The percent of solid tomato material lost during processing was also affected, with the percent loss of lot 2 being 5.99% and for lot 1, 4.87%.
Filling Method: Four different methods were used to fill the cans with tomatoes in the processing plants. They were: hand filling, machine filling by volume with a hand top, machine filling by overflowing the cans with tomatoes and then a hand top, and machine filling by overflowing the cans but then vibrating the excess tomatoes out of the cans. The average fill weights obtained from the four methods were not significantly different ( P ~ 0.05). The average fill weights from the different plants, however, were significantly different (P ~ 0.01). This was due to the differences in desired fill weights and to the amount of tomatoes the person or persons hand topping added to the cans. The average fill weights and drained weights for the plants are shown in Table 2.

Trimming Method: The two trimming treatments observed were coring of the tomatoes and not coring. The trimming method did not have an effect upon the fill weights but did influence the drained weights. The percent loss of solid tomato content in the cans which contained tomatoes that had not been cored was an average of 4.41 % and was significantly higher (P::; 0.01) in the cans which contained tomatoes that had been cored, where it was an average of 8.22%.
Thermal Process Method: The cans of tomatoes processed in the commercial plants were thermal processed in either a drag cooker or a rotary cooker. The processing methods did not significantly affect (P::; 0.05) the average drained weights for the different lots of canned tomatoes.
Fill and Drained Weight Variations: The average fill weights, variances, and medians for the 21 lots of canned tomatoes evaluated during 1977 are shown in Table 3 and the average drained weights and variances are shown in Table 4. The average fill and drained weights are considerably different when all the plants are evaluated. However, when Plants 104 and 107 are disregarded since they did not attempt to pack extra standard tomatoes, the difference in fill weights is 9.89 to 12.04 ounces, a range of 2.15 ounces, and in drained weights is 9.11 to 10.99, a range of 1.88 ounces. These differences are approximately one average sized tomato and are mainly due to whether
TABLE 2.-Average Fill Weights and Drained Weights for 303 x 406 Cans of Tomatoes from Ohio Tomato Processing Plants.
Average Average Plant Fill Wt. (oz) Drained Wt. (oz)
104 13.70 a* 12.52 a* 103 11.88 b l 0.79 b l 01 11.56 b 10.67 b 11 O·ft 11.13 c 10.56 b 109 10.97 c 10.57 b 11 0-e:j: 10.91 c 10.40 b 108 10.48 d 9.59 c 111 10.45 d 10.19 be 110-s** 10.41 d l 0.26 b 107 8.80 e 8.40 d
•Values in a column followed by a common letter are not significantly different at P ~ 0.01.
tPlant 11 0 packing fancy tomatoes. :j:Plant l 1 0 packing extra standard tomatoes.
**Plant 110 packing standard tomatoes.
or not the person hand checking the fill of the can added an extra tomato.
The average fill weights of the lots of tomatoes can be used to fairly accurately predict the average drained weight, as shown in Figure 1. The relationship of the two factors has a correlation coefficient of 0.961 which is significant at P::; 0.01. The equation for estimating the drained weights from the fill weight 1s:
drained weight = 0.790 (fill weight) + 1.677.
TABLE 3.-Average Fill Weights and the Variances of the 21 Lots of Canned Tomatoes from Ohio Tomato Processing Plants.
Lot Average Lot Lot Median Plant Week Fill Weight (ox)* Variance* Fill Weight (ox)
104 3 14.37 a 1.318 b-e 14.20 104 1 12.95 b 2.427 a 12.90 101 2 12.04 c 2.094 ab 12.05 103 2 11.88 c 1.479 a-e 12.20 110-a 3 11.34 d 1.363 a-e 11.30 110-f 3 11.13 de 1.134 def l 0.80 108 2 11.13 de 2.405 a 11.15 109 2 11.09 de 1.301 b-e 11.15 109 3 10.97 def 0.976 ef 11.00 l 01 1 10.93 def 0.984 ef 11.00
109 l 0.80 efg 0.851 ef 10.70 111 1 10.74 e-h 0.582 f 10.65
110-e 2 10.65 e-h 1.315 b-e 10.70
111 2 l 0.57 fgh 1.238 b-e 10.50
110-e 1 10.53 fgh 0.747 ef 10.60
110-s 2 10.49 fgh 1.794 a-d 10.30
110-s 10.30 ghi 1.1 00 def 10.30
111 3 10.23 hi 1.188 C·f 10.30
108 1 9.89 i 1.999 abc 9.80
107 8.85 i 1.048 ef 8.60
107 2 8.81 i 1.324 b-e 8.60
*Values in a column followed by a common letter are not significantly different at P S: 0.01.
27

14.5
14.0
13.5
13.0
12.5
12.0 FILL
WT.
(oz) 11.5
11. 0
10.5
10.0
9.5
9.0
8.5
8.0 8.0
TABLE 4.-Average Drained Weights and the Variances of the 21 Lots of Canned Tomatoes from Ohio Tomato Processing Plants.
Lot Average Lot Plant Week Drained Weight (oz)* Variance*
104 3 13.03 a 0 456 b 104 12.00 b 1.626 a
101 2 10.99 c 1.470 a 103 2 10.79 cd 1.954 a 109 3 10.78 cd 0 485 b
109 10.61 cd 0.544 b 11 0-f 10.56 cd 0.826 ab
11 O·e 2 10.54 cd 0.960 ab 110-e 10.39 cd 0.664 ab 101 10.35 cd 0.936 ab 109 2 10.32 cd 0.789 ab 110-s 10.31 cd 0.550 ab 111 l 10.28 cd 0.487 b 110-e 3 10.28 cd 0.496 b 111 3 10.20 cd 1.520 a 110-s 2 10.20 cd 1.953 a 111 2 10.10 d 0.873 ab 108 2 10.06 d 2.239 a 108 9.11 e 1.539 ab 107 8.45 ef 0.355 b 107 2 8.19 f 0.794 ab
*Values in a column followed by a common letter are not sign1f1cantly different at P ::; 0.01.
D.W.:O. 790 ( F.W.)+1.67 7
r: 0.961
9.0 10,0 11.0 12.0 13.0
DRAINED WT. (oz)
28
This indicates that the main factor influencing the drained weight of canned tomatoes is the fill weight.
The evaluation of the Ohio tomato processing plants showed that the fill weights of 303x406 cans of tomatoes are affected by tomato size, lye peeling conditions, and the filling operation. Changes in these factors will result in increased variation in the fill weights. The drained weights of 303x406 cans of tomatoes were affected by tomato cultivar, lye peeling conditions, trimming requirements, and fill weights. Changes in any of these factors will result in increased variation in drained weights.
The variation occurring in the fill and drained weights needs to be held to a minimum to be able to accurately label the cans of tomatoes with the fill or drained weight. Variations occurring due to changes in the processing factors can be kept under control by adequate auditing of the fill weights and making the necessary adjustments in the filling operations to maintain the fill weights at the declared label weight.
REFERENCE 1. Anonymous. 1977. Drained weight or solid con
tent weight for fruits and vegetables; label statement, standards of fill of containers, and temporary labeling exemption. Fed. Register, 42 ( 237): 66282-62305.
FIG. 1.-Regression line for comparison of average fill weights vs. average drained weights of 21 lots of commercially processed canned tomatoes.

Prediction of Ascorbic Acid Stab'ility in Canned Apple Juice
MOHAMED I. MAHMOUD and WILBUR A. GOULD1
INTRODUCTION Several researchers have proposed the fortifica
tion of apple juice with ascorbic acid since apple juice is naturally low in this vitamin and is used interchangeably in the diet with juices high in ascorbic acid ( 1, 2, 3, 9, 13, 21). Few studies, however, have been conducted for the purpose of predicting the retention of ascorbic acid in fortified apple juice. Strachan ( 21) indicated that a storage loss of at least 8 to 10 mg of added ascorbic acid is expected per 100 ml of apple juice processed under commercial methods and stored for 3 months. He pointed out that this loss occurs irrespective of the quantity of added ascorbic acid without presenting evidence on actual trials. Andreae ( 2) showed that 20-25 % loss of ascorbic acid in fortified apple juice is expected after 4 months' storage at room temperature and predicted no additional loss would take place during further storage. Johnston ( 13) also predicted 30% loss of ascorbic acid in fortified apple juice after processing and 1 year storage at room temperature.
Other researchers have previously reported the loss of ascorbic acid in canned fruit and vegetable juices held in storage ( 10, 11, 12, 14, 15, 19). These investigators have observed varying decreases in the percentage of retained vitamin C with increased storage time and temperature. The reports of Semmelman ( 18) and Pope ( 16) suggested that ascorbic acid retention in fortified tomato juice may also be different depending on the level of fortification. Nevertheless, the most common method of reporting losses of ascorbic acid has been simply to express the vitamin content as a percentage of the initial amount present. These data do not allow the determination of kinetic parameters necessary to describe the effects of time and temperature on this nutrient.
Currently there is a dearth of information on the loss of nutritional value during storage from a kinetic standpoint. Knowledge of the reaction rate and kinetics of storage-induced losses is needed in order to predict the shelf life of important nutrients. This investigation was undertaken to study: 1) the effects of time, temperature, and fortification level on the retention of ascorbic acid; and 2) the degradation kinetics of ascorbic acid in apple juice in order to predict the retention of the vitamin in the fortified juice.
'Former Graduate Student and Professor, Dept. of Horticulture, The Ohio State University and Ohio Agricultural Research and Development Center.
29
MATERIALS AND METHODS Materials
Grimes Golden and Jonathan apples (Malus sylvestris, L.) were grown and harvested at the Horticulture Farm of The Ohio State University and transported to the Food Proce<i<iing Pilot Plant in the Dept. of Horticulture.
Juice Processing The two apple cultivars were blended at the
ratio of 1 : 1 by weight. The apples were sorted, washed, and ground in a hammer mill with a 0?-inch screen to a pulp suitable for juice extraction. The juice was then extracted in a hydraulic pres<i by the rack-and-cloth procedure. It was immediately flash pasteurized at 250° F for 30 seconds, cooled to 210° F, fortified with ascorbic acid in an 8-gallon filler bowl, and hot filled at 195° Finto No. 303 cans.
Ascorbic Acid Fortification To each 8 gallons of the juice were added 0, 50,
75, 100, or 150 ml of a solution of 90 g ascorbic acid (Merck U .S.P.) in 500 ml of the previously pasteurized and cooled apple juice. The added solution was calculated to increase the ascorbic acid concentration of the juice by 0, 30, 45, 60, or 90 mg/100 ml.
The juice was then carefully mixed and filled in No. 303 fruit enamel cans. The cans were sealed and coded to identify the fortification levels referred to hereafter as level 0, 30, 45, 60, or 90. The cam were inverted and then held for 3 minutes prior to spin cooling in water to 100° F. The cans within each fortification level were then divided into five groups and stored at 32, 50, 68, 86 and 104° F.
Sampling and Measurement Two random samples from each fortification
level were taken after cooling prior to storage. In addition, two other random samples from each fortification level were drawn at 3, 6, 9, and 12 months storage at each storage temperature. All measurements were made after the samples had been equilibrated at room temperature.
Reduced ascorbic acid content was determined colorimetrically according to the method of Strohecker and Henning ( 22). The absorbancc of the sample, sample blank, and a<icorbic acid standard solutions was measured at 5 70 nm on a Bausch and Lomb spectronic 20 spectrophotometer. Concentration of ascorbic acid in the sample was calculated

from a standard curve and is reported in mg/100 ml of the juice.
RESULTS AND DISCUSSION Unfortified Juice
Ascorbic acid content of unfortified apple juice was 1.5 mg/100 ml after processing (Table 1). At all storage temperatures there was a very rapid loss of ascorbic acid in a very short time. These results arc in general agreement with the reports of Bunnel ( 6), Esselen et al. ( 9), and Strachan ( 21). Strachan ( 21) found 0.2 mg/100 ml of unfortified canned apple juice after 2 weeks' storage at room temperature. It is evident from these data that ascorbic acid content of processed apple juice is negligible and ordinary canned apple juice is thus apparently valueless as an antiscorbutic product. Fortified Juice
Results in Table 1 show that ascorbic acid content of fortified apple juice consistently decreased with time at all fortification levels. The retention of this vitamin was also adversely affected by higher temperature storage. The drastic effect of storage at 104° F was seen after 9 months' storage: no ascorbic acid wa~ found in any juice even when fortified to 93 mg/100 ml. Juices stored at refrigerated and room tempera-
TABLE 1.-Effects of Fortification Level, Storage in Apple Juice.
Fortification Temperature 0 Level OF
0 32 1.5 50 1.5 68 1.5 86 1.5
104 1.5
32 32 28.5 50 28.5 68 28.5 86 28.5
104 28.5
45 32 47.5 50 47.5 68 47.5 86 47.5
104 47.5
60 32 66.5 50 66.5 68 66.5 86 66.5
104 66.5
90 32 93.0 50 93.0 68 93.0 86 93.0
104 93.0
tures also lost a~corbic acid, although not as rapidly as those stored at higher temperatures. These finding~ are consistent with the observations of several other workers. Bender ( 5), Guerrant et al. ( 12), and Pope ( 16) reported decreased ascorbic acid retention in fruit and vegetable ju:ces with increase in storage time and temperature.
A factorial analysis of variance ( 20) of the results indicated that fortification level, in addition to storage time and temperature, significantly ( P < 0.01) influenced ascorbic acid retention. As the fortification level increased, the retention of the vitamin decreased.
To illustrate the effect of fortification level, linear regressions were used to determine the relationship between ascorbic acid loss and time at each temperature, using the linear function y = a + bx. The results of the linear regression fit and correlation coefficients are presented in Table 2. The high correlation coefficients obtained indicate that a linear relationship between loss of ascorbic acid and time exists. Using the F value test, the relationships are all shown to be significant at the 1 % level.
Results in Table 2 show that the rate of ascorbic acid loss, expressed as mg/100 ml/month, increased
Time, and Temperature on Concentration of Ascorbic Acid
Storage Time in Months
3 6 9 12 mg. Ascorbic Acid/ 100 ml Juice
1.0 0.0 0.0 0.0 1.0 0.0 0.0 0.0 0.0 0.0 0.0 0.0 0.0 0.0 0.0 0.0 0.0 0.0 0.0 0.0
28.0 27.5 26.5 24.0 26.5 25.0 24.5 22.0 24.0 22.5 22.0 19.5 23.5 21.0 16.0 12.5 22.0 9.5 0.0 0.0
46.0 43.5 42.0 39.5 43.0 40.5 38.0 35.0 38.5 37.5 35.5 31.0 38.0 33.5 28.0 19.5 32.0 14.0 0.0 0.0
65.0 59.0 60.5 54.0 62.0 58.0 53.0 48.5 54.5 54.0 48.5 42.5 55.0 46.5 38.0 25.0 44.0 15.0 0.0 0.0
84.5 82.0 78.0 73.5 80.0 75.5 74.5 66.0 71.5 70.5 67.0 58.5 71.5 58.5 46.5 30.5 57.0 18.0 0.0 0.0
30

1 o.o
.: .... c 0
IE
"' E 0 0 .....
"' bl)
E
en en Q
1.0 ..I
Cl
(,)
cc (,)
a:I Cl:: Q (,)
en cc
0.1 0
.. •
.. .. .. •
.. ,
+
0
I I I 3 0
.. .. .. .. .. .. .. . . .. .. . .
40
.. ..
•
. .. .. ·· .. .. ..
50
.. .. .. .. .. ..
0
+
...
• •
..
60
.. ..
0
+
...
• •
•
. ..... ··· .. .. .. ..
, , +,, ,
.. .. .. .. .. .. .. ..
.. .. .. .. ..
,
•
. . .. ... ···· . ..
, .. +
TEMPERATURE
-- - 32 °F 0
... ,,,,,.,,,.,, ... 50 F
68 °F
. ................... 0 86 F
. . - - . - -104 °F
70 90
mg ASCORBIC ACID/ 100 ml
10 0
FIG. 1.-Relationship between rate of ascorbic acid loss expressed as mg/100 ml/month and initial ascorbic acid concentration in fortified apple juice.
31

TABLE 2.-Coefficients Describing Relationship Between Rate of Ascorbic Acid Loss and Temperature of Storage in Fortified Apple Juice.
Fortification Level
30
45
60
90
a = intercept.
Temperature OF
32 50 68 86
104
32 50 68 86
104
32 50 68 86
104
32 50 68 86
104
a
29.0 28.3 27.3 28.2 27.8
47.7 46.8 45.2 46.5 44.1
66.9 66.6 64.0 66.3 60.5
91.3 89.7 86.8 90.0 82.2
b = rate at ascorbic acid loss, mg per l 00 ml per month. r = correlation coefficient. S.E.E. = standard error of estimate. * = significant at the 1 % level.
with increasing fortification level. By plotting the rate of ascorbic acid loss (mg/100 ml/month) on logarithmic scale vs. initial ascorbic acid concentration (Fig. 1), the results indicate that the rate of loss is also a logarithmic function of initial ascorbic acid concentration. These findings support the results of Beattie et al. ( 4) and Pope ( 16), who reported increased ascorbic acid loss with increasing the initial concentration of the vitamin.
Order of Ascorbic Acid Destruction Semilogarithmic plots of ascorbic acid concen
tration in fortified juice vs. time yielded straight lines, indicating that the relationship could be described by a first-order reaction mechanism. The slope of
TABLE 3.-Destruction Rate Constants and Halflives of Ascorbic Acid in Fortified Apple Juice at Constant Temperature.
Temperature k Half-life* (°F) (Months·lj (Months)
32 0.01588 43.6 50 0.02410 28.8 68 O,Q315B 21.9 86 0.07606 9.1
104 0.22877 3.0
*Half-life = 0.693/k
F b S.E.E. Value
-0.350 -0.85 .07615 21.12* -0.500 -0.88 .09354 28.57• -0.667 -0.93 . 09538 48.85 • -1.317 -0.97 .10721 150.84* -2.633 -0.97 .24552 115.04*
-0.667 -0.89 .12388 28.95* -1.000 -0.94 .13202 57.37* -1.200 -0.92 .18690 41.22 * -2.200 -0.98 .14884 218.48* -4.233 -0.96 .41020 l 06.50*
-0.983 -0.92 .15241 41.62• -l.500 -0.98 .10992 186.20* -1.800 -0.95 .20983 73.59* -3.342 -0.99 .11818 799.50* -5.900 -0.95 .65490 81.16*
-1.517 -0.94 .19284 61.85* -l.983 -0.93 .28019 50.10" -2.450 -0.90 .42894 32.62* -5.000 -0.99 .19983 626.08* -8.100 -0.95 .97365 69.21 *
the resulting line is k/2.303 according to the firstorder reaction equation:
32
k = 2. 303
t
log
where k is the rate constant of ascorbic acid destruction, Co is the initial ascorbic acid concentration, and C is the vitamin concentration at time t in months.
The results in Fig. 2 illustrate a typical firstorder reaction between ascorbic acid concentration and time at 68° F. Plots of first-order reaction at other storage temperatures gave the same linear relationship. As shown in Fig. 2, the regression lines were nearly parallel for all fortification levels stored at the same temperature and had almost the same slopes. The rates of ascorbic acid destruction were computed from equation ( 1). No significant difference was observed between the rate constants of ascorbic acid destruction at all fortification levels stored at the same temperature.
The values of k (Table 3) indicate that the rate constants of ascorbic acid destruction in fortified apple juice are relatively small at refrigerated and room temperature ( 68° F), while the reverse is true at accelerated storage temperatures. This suggests

10 0
•
10~ .................................................. .. 0 3 6 9 12
MONTHS
FIG. 2.-First order plots of ascorbic acid destruction in fortified apple juice stored at 68° F.
33

negligible loss of the vitamin at lower temperatures of storage.
Half-life of Ascorbic Acid The half-lives ( 0.693/k) of ascorbic acid in for
tified apple juices are presented in Table 3. These values represent the time required to destroy 50'/'r of ascorbic acid originally present, thus yielding useful information as to the shelf life of the vitamin C in this product. The estimated half-life data clearly demonstrate the expected excellent shelf life of ascorbic acid in juice at refrigerated temperatures.
Favorable shelf life would also be anticipated when the juice is held at room temperature; slightly less than 2 years will be required to reduce the original ascorbic acid content by 50%. Projections from accelerated temperatures show a sharp decrease in the shelf life. It is interesting to note that calculated half-lives at high temperature give a shorter shelf life than observed. This gives a safety factor for the juice processor since shelf life is actually longer. For example, at 86° F the actual shelf life is about 1.7 months longer than that predicted for 50% destruction of the vitamin.
Q 10 of the Rate of Ascorbic Acid Destruction
The temperature coefficient ( Q10 ) of the rate of ascorbic acid degradation was calculated from the relationship:
=
k(T-10) where k(T) is the reaction rate constant
at temperature r1 and k(T-lO) is the reaction rate constant at loo C (18o F) be-low T 1.
The calculated Qio values (Table 4) show that between 32° and 68° F, the rate of ascorbic acid destruction increases approximately one and a half times for each 18° F ( 10° C) rise in temperature. It can also be seen that by raising the storage temperature from 68° to 86° F, the rate slightly more than doubles; increasing the temperature from 86° to 104° F triples the rate at which ascorbic acid is lost from the product.
Again, the dramatic effect of increased storage temperature on the rate of ascorbic acid degradation can be readily seen. The present findings compare favorably with those reported by Bender ( 5) for the rate of ascorbic acid degradation in fruit squash. Ross ( 17), however, indicated that increasing the storage temperature from 80.5° to 98.6° F (27° to 37° C) quadrupled the rate of ascorbic acid loss (mg/ml/month) in orange juice.
Rate of Ascorbic Acid Destruction as a Function of Temperature
The calculated rate constants were plotted on an Arrhenius type plot (Fig. 3) vs. the reciprocal of absolute temperature. The corresponding activation energy (Ea) was then computed from the Arrhenius plot. The results, illustrated in Fig. 3, show that the data do not fit exactly on a straight line; two rather distinct curves are obtained. It appears that a change in the kinetics of the reaction occurs between 68° and 86° F, as evidenced by the break in the curve at approximately 75° F. Above 75° F, the activation energy is almost four times as much as that below 75° F. This demonstrates that changes in temperature above 75° F have a more significant influence on the rate at which ascorbic acid is lost from the product.
This change in observed kinetics between 68° and 86° F suggests that another mechanism, which
TABLE 4.-lnitial Concentration (C0) Required to Produce 60 mg Ascorbic Add per 8-Fluid-Ounce Serving of Apple Juice.
Time (Months)
2 3 4 5 6 7 8 9
10 11 12
50
61.4 63.0 64.5 66.1 67.7 69.3 71.0 72.8 74.5 76.3 78.2 80.1
55 60
61.5 61.7
63.1 63.5 64.8 65.4 66.4 67.2 68.2 69.2 69.9 71.2 71.7 73.2 73.6 75.4 75.5 77.5 77.4 79.8 79.4 82.1 81.5 84.5
34
Temperature (°F)
65 70 75 80 85
61.9 62.1 62.3 63.3 64.7 63.8 64.2 64.6 66.7 69.7 65.8 66.4 67.0 70.3 75.1 67.9 68.7 69.6 74.2 81.0 70.1 71.1 72.2 78.2 87.3 72.3 73.6 74.9 82.5 94.1 74.5 76.1 77.7 86.9 101.4 76.9 78.8 80.7 91.7 109.3 79.3 81.5 83.7 96.7 117.8 81.8 84.3 86.9 101.9 127.0 84.4 87.2 90.1 107.5 136.9 87.0 90.2 93.5 113.2 147.6

has a less limited reaction step, may be governing the rate of change here. The finding that the mode of ascorbic acid destruction in fortified apple juice deviated from an Arrhenius relationship is similar to that observed by Charm (7) when analyzing data
.50
\ •
collected by Dietrich et al. ( 8). Charm ( 7) observed a change in kinetics of ascorbic acid destruction in frozen spinach betwen 59° and 68° F ( 15° and 20° C). Pope ( 16) also indicated that the rates of ascorbic acid degradation in fortified tomato juice did not sat-
4 Ea 2.3X10 calories/ mole
.... I.fl :r: .... z Q
:E
.10 -
3 Ea: 5.42X10 calories/ mole
· 01 •3·1·0 .... 3.2~0 .... 11111!!13~3~0 .... ~3~4~0----~3~5~0~--~3~6~0~--~3~7~0~----
FIG. 3.-Effect of storage temperature on t'he rate of ascorbic acid destruction in fortified apple juice (Arrhenius plot).
35

isfactorily fit an Arrhenius equation. It should be noted that fortified apple juice held
at 104° F developed a dark brown color and a caramelized flavor. Therefore, k values for ascorbic acid destruction above 86° F, while valid, do not give any information about the acceptability of apple juice.
The above discussion illustrates that various kinetic parameters can be used to compare degradation of ascorbic acid under different storage conditions and that the kinetic analysis is particularly useful in predicting the shelf life of ascorbic acid in the fortified juice. By measuring the concentration of ascorbic acid over a period of time, parameters such as reaction rate constants and activation energies can be calculated. Thus, the initial concentration of ascorbic acid can be calculated knowing the desired vitamin level at the end of shelf life when storage time and temperature conditions are specified.
For example, rearranging equation ( 1) yields:
2.303 log Co= kt c kt
Co = 102.303
c
= c
kt
102. 303
The initial concentration ( C0 ) required to give 100% of the recommended daily allowance (RDA) of ascorbic acid per 8-fluid-ounce serving of fortified apple juice under given storage conditions and duration have been calculated from the data obtained in this study and appear in Table 4. Similarly, an apple juice processor can determine the necessary initial concentration of ascorbic acid required to meet his label claim after specific storage time and temperature.
REFERENCES 1. Aitken, H. C. 1942. Fortified apple juice.
Canad. Food Packer, 13 :20 2. Andreae, W. A. 1943. Recent developments
of fortification of apple juice with vitamin C. Canad. Food Packer, 14:13.
3. Bauernfeind, J. C. 1953. The use of ascorbic acid in processed foods. Adv. Food Res., 4: 359.
4. Beattie, H. G., K. A. Wheeler, and C. S. Pederson. 1943. Changes occurring in fruit juices during storage. Food Res., 8 :395.
5. Bender, A. E. 1958. The stability of vitamin C in commercial fruit squash. J. Sci. Food
Agri., 9:754.
36
6. Bunnel, R. H. 1968. Enrichment of fruit products and fruit juices. J. Agri. Food Chem., 16:177.
7. Charm, S. E. 1971. The fundamentals of food engineering. Avi Publishing Co., Westport, Conn., 2nd ed.
8. Dietrich, W. C., M. M. Boggs, M. D. Nutting, and N. E. Weinstein. 1960. Time-temperature tolerance of frozen foods. XXII. Quality changes in frozen spinach. Food Technol., 14:527.
9. Esselcn, W. B., Jr., ]. J. Powers, and C. R. Fellers. 1946. The fortification of fruit juices with ascorbic acid. Fruit Products J., 22: 195.
10. Feaster, J. F., 0. G. Brown, D. W. Riester, and P. E. Alexander. 1950. Influence of storage conditions on ascorbic acid content and quality of canned orange juice. Food Technol., 4: 190.
11. Feaster, J. F., M. D. Tompkins, and W. E. Pearce. 1949. Effect of storage on vitamins and quality in canned foods. Food Res., 14:25.
12. Guerrant, N. B., M. G. Vavich, and R. A. Dutcher. 1945. Nutritive value of canned foods. Influence of temperature and time of storage on vitamin content. Ind. Eng. Chern., 37:1240.
13. Johnston, F. P. 1943. Vitamin C fortification of apple juice. Fruit Products]., 22:195.
14. Lamb, F. C. 1946. Nutritive value of canned foods. Factors affecting ascorbic acid content of canned grapefruit and orange juice. Ind. Eng. Chem., 38:860.
15. Moschette, D. S., W. F. Hinman, and E. G. Holliday. 1947. Nutritive value of canned foods. Effect of time and temperature of storage on vitamin content of commercially canned fruits and fruit juices. Ind. Eng. Chem., 39: 994.
16. Pope, G. 1972. Effect of time, temperature, and fortification level on the retention of ascorbic acid in fortified tomato juice. Unpublished Ph.D. Dissertation, The Ohio State University.
17. Ross, E. 1944. Effect of time and temperature of storage on vitamin C retention in canned citrus Jmces. Food Res., 9:27.
18. Semmelman, ]. 1961. Factors affecting the stability of tomato juice fortified with ascorbic acid. Unpublished Ph.D. Dissertation, The Ohio State University.
19. Sheft, B. B., R. M. Griswold, E. Tarlowsky, and E. G. Holliday. 1949. Nutritive value of canned foods. Effect of time and temperature

of storage on vitamin content of commercially canned fruits and fruit juices stored 18 and 2,1 months. Ind. Eng. Chem., 41 :144.
20. Snedecor, G. W. and W. K. Cochran. 1971. Statistical methods. The Iowa State University Press, Ames, 6th ed.
21. Strachan, C. C. 1942. Factors influencing ascorbic acid retention in apple juice. Canad. Dept. Agr., Tech. Bull. 40.
22. Strohecker, R. and H. M. Henning. 1965. Vitamin assay-tested method. Verlag Chemie, G MBH, W einheim, Germany.
lnvest'igation of Protein Content of Ohio Grown Soybeans GIRISH N. DESAI and ANDREW C. PENG1
INTRODUCTION Soybean has been the number one cash crop in
the U. S., surpassing both wheat and corn for several years. This year, according to a USDA report ( 5), soybean plantings will set a new high, 63.9 million acres. This is also expected to set a new production record, 1. 74 billion bushels as compared to 1. 72 billion bushels in 1977.
Soybeans in the United States were originally mainly used as hay and silage before their value with respect to oil and protein content was realized. The good quality of oil and proteins and high quantity of unit production made the soybean itself a success in the food and feed market.
The protein content of soybeans is affected by many factors, such as variety, cultural practices, environment, etc. This study was undertaken to investigate the protein content of 30 varieties of Ohiogrown soybeans and their milk derivatives in order to provide such information to the Ohio soybean food industry and others who are interested. Soybean milk has been adopted by the food industry as a milk substitute for infants who are allergic to cow's milk, or where cow's milk is either unavailable or too expensive.
MATERIAL AND METHODS Thirty varieties of soybeans were obtained from
the Department of Agronomy, The Ohio State University (Table 1).
Soybean samples weighing about 250 g were ground in a Wiley mill. The moisture content and crude protein were determined in duplicate.
Moisture was determined by weight difference in such a way as to dry a predetermined sample in a recirculating air oven at 100 + 2° C for 12 to 14 hours. After cooling in a desiccator, the sample was reweighed and the percentage of moisture was calculated.
1Former Graduate Student and Professor, Dept of Horticulture, The Ohio State University and Ohio Agricultural Research and De· velopment Center.
37
Crude protein was determined by a modified Kjeldahl method ( 1) and multiplied by the factor 6. 25.
Soybean milk was prepared from 100 g of representative, clean, full fat soybeans. The sample was soaked in about 350 ml of tap water overnight. The water was drained off and the sample reweighed to determine the amount of water absorbed. The beans were blended for 3 minutes with 500 g of tap water in a Waring Blender. This slurry was filtered through four layers of cheesecloth and the residue was extracted again with 400 g of tap water. The final bean:water ratio was 1: 10 (w/w).
Both the residue and the milk were weighed. The soybean milk was boiled for 10 minutes to destroy antinutritional factors, and cooled to room temperature. The loss of weight during boiling was readjusted by adding water back. The moisture content and crude protein were again determined as mentioned above.
RESULTS AND DISCUSSION The moisture content of soybeans was in the
range of 8.5% to 10.7% (Table 1), with a mean value of 9.3%. This is not consistent with the findings of DeMan et al. (3), 4.2% to 7.8%; and Bourne et al. (2), 9.7% to 14.7%. This discrepancy indicates that the moisture content depends upon many factors, such as variety, growing conditions, precipitation, harvesting, handling, and storage conditions.
The moisture content of soybean milk ranged from 93.1 % to 94.7% (Table 1) with a mean value of 93.6%, which reflects total solids ranging from 5.3% to 6.9%. DeMan et al. (3) investigated the total solids of soybean milk of 55 varieties of Ontariogrown soybeans and found they averaged 4.7% to 7.1 %, which agrees with this study.
The crude protein content ranged from 36.9% to 44.1 ;k (Table 1), which was lower than that reported by Hymowitz et al. ( 4), 33.1 <fr to 49.2%; and DeMan et al. (3), 30.3% to 46.1%. This variation

could be attributed to the fact that a large sample population was used by these investigators. But the re~ults of this study were higher than those reported by Bourne et al. ( 2), who examined 30 Philippine-grown soybeans and found a range of protein content from 27.3% to 36.2%. The four highest protein varieties were Galland ( 44.1 'fr), Wells ( 43.5%), FFR 223 (43.5%), and Wayne (43.5%). French 2150 (36.9% ), Asgrow 2625 (37.8% ), and Cutler 71 ( 38.8%) were the varieties with lowest crude protein levels.
Soybean milk was found to have a crude protein content, on a fresh weight basis, of 2.3% to 3.5% (Table 1). Of course, this varies with different soybean :water ratios when soybean milk is made. This value is slightly higher than that found by DeMan et al. ( 3), whose protein range was 1.8% to 3.6%; and about the same as reported by Bourne et al. ( 2), 2.3% to 3 .5 % . The varieties Galland ( 3 .5 % ) , SKB 400 (3.4% ), Wells (3.4% ), Wayne (3.4% ), and FM 1220 ( 3.4%) were highest in protein, whereas French
2150 (2.3%), FFR 223 (2.7%), Asgrow 2625 ( 2.8%), and Clemens ( 2.91() ranked lowest in protein content in the soybean milk.
The amount of water absorbed by 100 g of soybeans during an overnight soaking with tap water was 122 to 144 (Table 1). This information would eliminate an unnecessary step of weighing the soaked beans and adjusting to the right bean:water ratio in order to control the exact solids content.
Most varieties were of a light yellow color. The exceptions were Washington II, Shawnee, FM 1220, Cherokee, and Anderson, which were green or light green, and Peterson 3105, SKB 400, Peterson 3125, and Voris B 350, which were pink colored. The green and pink pigments, although soluble in water and partially removed in the soaking water, were still retained to certain degree in the soybean milk.
Except for the varieties French 2150, FFR 223, and Asgrow 2625, this study revealed that all other varieties tested were suitable for soybean milk production as far as protein content was concerned.
TABLE 1.-Protein and Moisture Content of Soybeans and Soymilk (%).
Soybeans Soymilk
Ohio-Grown Protein Protein Water Absorbed Cultivar Moisture (dry wt basis) Moisture (fresh wt basis) g/100 g sample
French 2150 10.1 36.9 94.2 2.3 135 Clemens 9.3 39.2 93.9 2.9 134 Asgrow 2625 9.1 37.8 94.0 2.8 130 FFR 223 10.2 43.5 94.7 2.7 126 Agripro 20 9.5 40.1 93.9 3.0 135 Amsoy 71 10.7 40.7 93.9 3.1 137 Shawnee 8.7 41.9 93.4 3.4 130 Corsoy 9.0 40.4 93.4 3.2 136 Wells 8.6 43.5 93.4 3.4 138 CX 215 Pfizer 8.8 40.7 93.3 3.3 130 Peterson 31 05 8.8 41.3 93.3 3.3 134 SKB 400 8.5 41.6 93.1 3.4 130 Gries 8.5 39.5 93.5 3.1 136 FM 1220 8.5 42.9 93.6 3.4 131 Beeson 9.2 42.9 93.2 3.3 138 Cherokee 8.5 40.8 93.7 3.2 139 Wayne 9.3 43.5 93.5 3.4 135 SRF 307 P 9.1 40.6 93.4 3.2 132 Woodwor1h 9.4 41.1 93.5 3.2 132 Cal land 10.3 44.1 93.3 3.5 144 101644 10.0 41.9 93.6 3.2 128 Anderson 9.4 42.3 93.5 3.3 137 Washington II 9.4 41.3 93.6 3.2 136 Funks seed 8.5 40.5 93.8 3.0 131 Ruff RB 34 9.7 42.6 93.2 3.3 126 Williams 9.9 40.4 93.6 3.2 124 Peterson 31 25 9.8 41.2 93.3 3.3 122 Cutler 71 9.0 38.8 93.4 3.1 131 Mitchell 9.6 39.0 93.7 3.0 134 Voris B 350 10.0 40.8 93.6 3.2 125
Mean Value 9.3 41.1 93.6 3.2 133 Range 8.5-10.7 36.9. 44.1 93.l • 94.7 2.3. 3.5 122. 144
38

1.
2.
3.
REFERENCES A.A.C.C. 1968. Approved methods. Am. Assoc. Cereal Chemists, St. Paul, Minn. Bourne, M. C., M. G. Clemente, and J. Bazon. 1976. Survey of suitability of 30 cultivars of soybeans for soymilk manufacture. J. Food Sci., 41:1204. DeMan, J. M., D. W. Stanley, and V. Rasper.
4.
5.
1975. Composition of Ontario soybeans and soymilk. Can. Inst. Food Sci. Technol. J. 8: 1. Hymowitz, T., F. I. Collins, J. Panczner, and W. M. Walker. 1972. Relationship between the content of oil, protein, and sugar in soybean seed. J. Agron., 64:613. U. S. Dept. of Agriculture. 1978. Commodity outlook for farmers-oilseeds. 0-1/Fcb. 78.
Recovery and Functionality of Soybean Leaf Proteins MOHAMMED H. ALI and ANDREW C. PENG1
INTRODUCTION As the world population continues to expand
almost exponentially to an anticipated 7 billion by the year 2000, the need for all nutrients, especially protein, will be acute ( 7). The rate of world food production is falling behind the rate of population growth in many of the developing countries. Protein-ralorie malnutrition has drawn international recognition. Surveys made by the Food and Agriculture Organization ( F AO), World Health Organization ( WH 0) , and other agencies indicate that protein-calorie malnutrition prevails in developing countries. This problem has escalated manyfold and an estimated 50% of the world's population suffers from malnutrition.
Worldwide protein needs for today's population arc estimated at 70 million metric tons of good quality animal protein, and by the year 2000 this need will exceed 110 million metric tons ( 10). Proteincalorie deficiency combined with infections of the acute and fatal protein deficiency disease, kwashiorkor, retard physical growth and development and impair learning capacity and behavior ( 11).
Leaf protein is the most abundant protein source. Amino acids are translocated from leaves to seeds. Both leaves and seeds are consumed by animals but a great deal of potentially usable protein is lost due to poor conversion efficiency. Although the nutritional quality of animal foods is rated high, animal protein production is intrinsically inefficient, involving a waste of about 75% of the calories and proteins supplied ( 1).
The protein problem cannot be solved through a single source of protein, conventional or unconventional. Interest in leaf protein concentrates for ani-
'Graduate Student and Professor, Dept. of Horticulture, The Ohio State University and Ohio Agricultural Research and Development Center.
39
mal and human consumption has increased in recent years as a result of an expected worldwide need for alternate protein sources and a desire to derive maximum usefulness from agricultural crops.
In developing a new protein source, consideration should be given to yield, nutritive value, and functionality. A protein having higher yield with poor functionality is of little value to a food industry. Preparation of protein in soluble form is most desirable since solubility and other functional properties of undenatured proteins are interrelated and important for food application. Processing treatments, e.g., extraction, precipitation, drying, inactivation of various antinutritive factors or deleterious enzymes may produce protein denaturation and subsequent insolubilization.
Soybean (Glycine max. ( L.), Merr) is the number one cash crop in the U. S. Therefore, a study of soybean leaf proteins was undertaken to evaluate: 1 ) yield, 2) functionality, and 3) mineral and amino acid composition of leaf protein concentrates ( LPC).
MATERIALS AND METHODS Phase I. Extraction and Recovery of Soybean Leaf Protein Concentrates
At 45 days after planting, soybean leaves of cultivar Beeson were collected from the agronomy plots at Don Scott Field in August 1976. The leaves were stripped from the first branch down the middle axis of the plant. Approximately 40 lb of leaves were collected and processed as follows ( 5). In the treatment, all operations were the same as in the control except a 250 ppm S02 equivalent sodium metabisulfite solution was added to the fresh leaves after washing ( 5). Phase II. Functional Properties
l. Nitrogen Dispersibility. This functional property at pH 5, 7, and 10 was studied by a modified procedure of Betschart and Kohler ( 3).

2. Wat1er Absorption. The water absorption ability of the concentrates was evaluated using the modified procedure of Sosulski ( 12) .
3. Fat Absorption. The procedure of Betschart and Kohler ( 3) was modified to determine this property of the LPC using cottonseed oil and corn oil.
4. Foaming Ability. This experiment was performed according to the procedure of Yasumatsu et al. ( 14).
TABLE 1.-Extraction and Recovery of Soybean Leaf Protein Concentrates (%).
Protein Yield
Sample* by Weight by Kjeldahl -
CA l.09t 0.77 CH 0.89 0.76 MA l.1ot 0.78 MH 0.91 0.78
*C = control, A = ocid pptd, H = heot coogd, M = metabisulfite.
tP < 0.01.
TABLE 2.-Nitrogen Dispersibility of Soybean Leaf Protein Concentrates(%).
pH
Sample* 5 7
CA Ft 1.26 0 1.28 0
CAO 0.82 b 0.84 b CHF 0.91 b 0.94 b CHO 0.80 b 0.79 b MA Ft 1.33 0 1.40 0
MAO 0.83 b 0.78 b MHF 0.92 b 0.97 b MHO 0.79 b 0.81 b
*C = control, A = ocid pptd, F = freeze dried, M = metabisulfite, H = heot coagd, 0 = oven dried.
tP < 0.Ql. Means in columns with different letters ore sign ificontly dif
ferent {P < 0.01).
TABLE 3.-Water Absorbed by Soybean leaf Protein Concentrates (o/o).
pH
Sample* 5 6 7
CA Ft 275.3 a 301.7 b 294.0 b CH Ft 302.7 b 324.3 d 355.7 e MA Ft 285.3 a 300.0 ab 294.3 ab MHFt 309.0 b 337.0 d 362.3 e CAO 93.7 c 91.0 c 94.3 c CHO 89.0 c 90.7 c 88.3 c MAO 91.3 c 96.0 c 94.3 c MHO 84.3 c 90.7 c 90.0 c
*C = control, A = acid pptd, F = freeze dried, M = metabisulfite, H = heat coogd, 0 = oven dried.
tP < 0.01. Meons in both columns and rows with different letters are sig
nificantly different (P < 0,01 ).
40
5. Emulsifying Ability. The modified procedure of Yasumatsu et al. ( 14) was employed to determine the emulsifying capacity of the protein concentrates. Phase Ill. Minerals and Amino Acids
1. Mineral Determination. Samples were ashed using a modified procedure of Chapman and Pratt ( 4). Elements of Ca, Mg, and Fe were determined by atomic absorption spectrophotometry, Varian Atomic Absorption Spectrophotometer, while P was determined by a modified molybdate-vanadate procedure (2).
2. Amino Acid Composition. The samples were hydrolyzed following the procedure of Ishino and Ortega ( 9) and analyzed by ion exchange chromatography on a Durrum D-500 amino acid analyzer.
RESULTS AND DISCUSSION Phase I. Extraction and Recovery of Soybean Leaf Protein Concentrates (LPC)
Recovered and dried soybean LPC were expressed as percent on a fresh leaf weight basis. Data in Table 1 show that acid precipitation had significantly (P < .01) influenced protein recovery by weight, while Kjeldahl nitrogen was statistically insignificant due to the recovery method. All oven-dried samples were hard, dark, and gritty mixtures upon milling, while freeze drying produced soft, spongy, nongritty, bland, and off-white to light tan colored concentrates. Similar observations were made in alfalfa and pine LPC ( 3, 8). The difference in protein yield by weight was attributed to the coprecipitation of acidic polysaccharides ( 3).
L Nitrogen Dispersibility. Data in Table 2 reveal that recovery and drying methods significantly (P < .01) influenced nitrogen dispersibility. All freeze dried, acid precipitated samples had higher dispersibility than the samples recovered or dried by heat. An important functional property of recovered proteins is their dispersibility at various pH values. In addition to serving as a useful indicator of protein denaturation, the dispersibility may also suggest possible uses, especially in liquid based products. Similar findings were also recorded in alfalfa LPC ( 3) . In spite of poor dispersibility, these protein concentrates can be used by dispersing in a solid food system.
2. Wat er Absorption. This test showed that all freeze dried samples, irrespective of recovery method and pH, had a significantly (P < .01) higher water absorbing capacity (Table 3). All heat coagulated, freeze dried samples showed consistently higher absorption due to pH increment. Acid precipitated samples had lower absorption capacity at pH 7.0. However, heat drying reduced this property to onethird that of the freeze dried concentrates. The grit-

tiness due to heating reduced the effective surface area of the samples, while freeze drying resulted in porous concentrates having more surface area which displayed this difference among the samples. Similar results were obtained in alfalfa LPC from freeze and spray drying ( 3).
3. Fat Absorption. Data presented in Table 4 show a statistical significance ( P < .01 ) in oil absorption due to recovery and drying methods. All freeze dried samples had about three to four times higher oil absorbing tendency than the oven dried concentrates. Betschart and Kohler ( 3) found similar behavior in alfalfa LPC. A similar explanation can be offered as described for water absorption capacity.
4. Foaming Ability. Data are presented graphically in Fig. 1. Analysis of variance disclosed that recovery and drying methods and pH significantly ( P < .01) influenced foaming property. Freeze dried, acid precipitated samples displayed ability superior to the concentrates prepared by other methods. Increased foaming was associated with the alkaline pH. Such a property was noticed in alfalfa LPC ( 3).
5. Emulsifying Ability. Data in Fig. 2 reveal that recovery and drying methods and pH all significantly ( P < .01) influenced the emulsion formation ability. Maximum emulsifying ability was obtained
TABLE 4.-0il Absorbed by Soybean Leaf Protein Concentrates (%).
Source of Oin
Sample* Cottonseed Corn
CA Ft 264.4 a 266.8 a CH Ft 236.8 b 238.2 b MA Ft 265.4 a 268.9 a MHFt 234.8 b 235.7 b CAO 89.8 c 86.2 c CHO 86.6 c 87.2 c MAO 93.3 c 92.7 c MHO 85.5 c 84.2 c
*C = control, A = acid pptd, F = freeze dried, M = metabisulf1te, H = heat coagd, 0 = oven dried.
tP < 0.01. Means in columns with different letters are significantly dif
ferent IP < 0.01 ).
at all pH levels from the acid precipitated, freeze dried samples of both control and treatment. Alkaline pH exhibited increased emulsifying ability. However, oven dried samples were not affected by pH. Vananuvat and Kinsella ( 13) also found higher emulsion in alkali treated proteins and lower values due to heat treatment during processing of single cell proteins.
7. Mineral Cont1ent. Calcium, Mg, and Fe contents of the protein concentrates were significantly
..._ __ I pH 2
--pH 7 V/ZJ pH 9
C=Control A=Acid pptd. F=Freeze dried
M=Metabisul fi te H=!leat coagd. O=Oven dried
,...... o\O .......,
35
30
Cl) 25 I/)
c1'
~ 20 (.)
i::: H
Cl) 15 s ;::l ~
g 10
5
CAF CAO CHF CHO MAF MAO Mff MHO
Protein Concentrates
FIG. 1.-Foaming ability of soybean leaf protein concentrates.
41

i iiiiil pH 2 pH 7
[?:ZZa pH 9
C=Control A=Acid pptd. F=Freeze dried
M=Metabisul fi te H=Heat coagd. O=Oven dried
CAF CAO CHF CHO MAF MAO Ml-IF M-IO
Protein Concentrates
FIG. 2.-Emulsifying ability of soybean leaf protein concentrates.
higher (P < .01) in the heat coagulated than in the acid precipitated samples as shown in Table 5, while P occurred in a significantly ( P < .01 ) greater amount in the acid precipitated samples both in control and sulfite treatments. The low mineral content in these concentrates is not a problem in food use. Minerals can be easily supplemented by some other means.
8. Amino Acid Composition. Essential amino acid composition was analyzed in duplicate and is presented in Table 6. Heat coagulated LPC contained less lysine and methionine compared to the acid precipitated samples. However, the essential amino acid content in both concentrates looks very promising com-
TABLE 5.-Mineral Content of Soybean Leaf Protein Concentrates (ppm).
Sample* Calcium Magnesium Iron Phosphorus
CAF 1.75 4.90 4.95 48.35t CAO 1.70 4.92 4.82 48.15t CHF 12.50t s.oot 6.92t 12.18 CHO 12.40t 8.oot 6.8ot 11.85 MAF 1.65 4.90 4.98 48.75t IMO 1.75 4.98 4.95 47.lOt MHF 12.60t 8.oot 6.s5t 11.86 MHO 12.30t a.oot 6.8Dt 11.63
*C = control, M = metabisulfite, A = acid pptd, H = heat coagd, F = freeze dried, 0 = oven dried.
tP < 0.01.
42
pared to the F AO ( 6) recommendations, except that S-containing amino acids were low in both protein concentrates.
CONCLUSION The leaf protein studies showed that recovery and
drying methods are important factors to obtain undenatured or reversible denatured protein concentrates which influence protein solubility. Functional properties were correlated with the solubility of the protein
TABLE 6.-Essential Amino Acid Composition of Soy Leaf Protein Concentrates and FAQ Recommendation.*
Heatt Aciclt FAO (6) Amino Acid LPC LPC Recommendation
Threonine 4.44 5.49 4.00 Valine 5.85 7.02 5.00 Cystine 1.37 1.58 Methionine 1.71 2.18 3.50:!: lsoleucine 4.52 5.25 4.00 Leucine 8.22 l 0.37 7.00 Tyrosine 4.49 5.74 Phenyla Ian ine 5.35 6.73 6.00** Lysine 6.31 7.45 5.50
*Gram amino acid/l 00 g protein. tMeans of duplicate analyses. :!:Methionine + cystine.
**Phenylolan ine + tyrosine.

samples. Finally, amino acid compos1t1on indicated LPC was a very good source of essential amino acids and thus proper utilization by supplementation or complementation will provide good nutrition.
REFERENCES 1. Anonymous. 1975. Leaf protein: scant re
search despite economic potential. Food Prod. Dev., 9:62.
2. A.O.A.C. 1975. Official methods of analysis. Assoc. Offic. Anal. Chem., Washington, D. C., 12th ed., p. 34.
3. Betschart, A. A. and G. 0. Kohler. 1975. Certain functional properties of alfalfa protein isolates prepared and dried by various methods. Proc. Twelth Technol. Alfalfa Conf., Nov. 1974, Overland Park, Kan.
4. Chapman, H. D. and P. F. Pratt. 1961. Methods of analysis for soils, plants and waters. Division of Agricultural Sciences, University of California, Davis.
5. deFremery, D., R. E. Miller, R. H. Edwards, B. E. Knuckles, E. M. Bickoff, and G. 0. Kohler. 1973. Centrifugal separation of white and green protein fraction from alfalfa juice foeowing controlled heating. J. Agri. Food Chem., 21 :866.
43
6. F.A.O. 1973. Energy and Protein Requirements. F AO Nutr. Meeting Report Series, No.
52 (Rome). 7. Franzen, K. Unpublished data. 8. Frenich, R. A. and G. W. Lindsay. 1976. Pro
tein in foliage leachates of Pinus radiata. Phytochem., 15:1595.
9. Ishino, K. and D. M. L. Ortega. 1975. Fractionation and characterization of major reserve proteins from seeds of Phaseolus vulgaris. J. Agri. Food Chem., 23 :529.
10. Klis, J. E. 1973. Fabricated food market by 1980. Food Technol., 27 :46.
11. Oomen, H. A. P. C. 1961. An outline of xerophthalmia. Int. Rev. Trop. Med., 1 :131.
12. Sosulski, F. W. 1962. The centrifuge method for determining flour absorption in hard red spring wheats. Cereal Chem., 39 :344.
13. Vananuvat, P. and J.E. Kinsella. 1975. Some functional properties of protein isolates from yeast, Saccharomyces fragilis. J. Agri. Food Chem., 23:613.
14. Y asumatsu, K., K. Sawada, S. Moritaka, M. Misaki, J. Toda, T. Wada, and K. Ishi. 1972. Whipping and emulsifying properties of soybean products. Agri. Biol. Chem., 36:719.

Carotene Content of Green Snap Beans
H. FENERCIOGLU and D. E. CREAN1
INTRODUCTION One of the most important factors for consider
ation in processed foods is that of nutritive value on which great emphasis is being placed today. Information relative to the nutritional evaluation of food processing has been published by Harris and Loe-8eeke (7).
It has been estimated that vegetables and fruits supply two-thirds of the vitamin A content in the U. S. diet ( 1). Vitamin A is known to maintain healthy mucous membranes, to protect against infection, to be essential for light/ dark adaptation of vision, to promote normal skin and tooth growth, to stimulate reproduction and lactation, and to be involved in bone protein formation ( 10).
Green beans are considered a good source of betacarotene (pro vitamin A) ( 8) . Although there are a number of studies concerning the effects of processing on the carotene content of vegetables ( 2, 4, 6, 9, 11 ) , the recent release of new cultivars, coupled with advances in post-harvest storage conditions, have rendered many of these early data unreliable. Moreover, new analytical techniques have been developed since these were reported.
The present study was designed to investigate the effect of cultivar, maturity, processing, and storage time on the content and retention of beta-carotene in green snap beans.
MA TE RIALS AND METHODS The cultivars selected for this study were: Ten
der Blue (Ferry Morse), GP 467 (Rogers Brothers Co.), Greenpak (Rogers Brothers Co.), Coloma (Rogers Brothers Co.), and Slim Green. These were grown under normal, commercial growing conditions in Columbus and hand harvested at maturity.
The beans were size graded into two grades depending upon the thickness of the pod, the division being made at 21/64-inch. These size grades were taken as being representative of beans of different maturities.
After grading, the beans were prepared for processing in the pilot plant of the Department of Horticulture. They were cut into sections 1 to 114 inches in length, and blanched at 170° F for 20i minutes. For canning, the beans were filled into No. 303 cans, exhausted under steam flow, sealed, and processed at 240° F for 20 minutes in a still retort. After proces-
'Graduate Student and Associate Professor, Dept. of Horticulture, The Ohio State University and Ohio Agricultural Research and Development Center.
44
sing, the beans were cooled to 100° F and stored at room temperature until analysis. For freezing, the beans were filled into polyethylene pouches which were heat sealed. Freezing was carried out at -20° F and the frozen beans were stored at 0° F until analyzed.
Determination of carotene was done using a modification of the procedure of Bickoff et al. ( 3). A sample of beans was homogenized with acetone. This slurry was filtered and the residue further extracted with acetone. An aliquot of this extract was added to an equal volume of hexane in a separatory funnel together with a little water. After gentle swirling, the hypophase was withdrawn and discarded.
The hexane layer containing the carotenes was dried with anhydrous sodium sulfate and added to a column 25 x 7 mm composed of equal parts (w/w) of magnesium oxide and diatomaceous earth (JohnsManville Super Ce!, Fisher Scientific Company). The carotene was eluted from the column with a hexaneacetone mixture (9:1, v/v), the chlorophylls and xanthophylls being retained. The eluate containing the carotene was collected in a 25 ml volumetric flask.
The absorbance of the solution was measured at 440 nm on a Bausch and Lomb Spectronic 20 colorimeter and the carotene measured by comparison with a standard curve prepared from pure beta-carotene. Analyses were made in duplicate.
RESULTS The results of this investigation are summarized
in Table 1. The following conclusions can be drawn from
these data: 1. There was a significant difference in carotene
content between cultivars. Regardless of maturity, GP 467 and Coloma were significantly higher in betacarotene than the other cultivars.
2. The carotene content of beans decreased with increasing maturity, as measured by sieve size. This is in accordance with the observations of Hayden et al. ( 8).
3. A decrease in the carotene content with storage time was observed for both canned and frozen beans. This was more marked, however, with the frozen beans. Canned beans retained, on average, 76% of their original carotene content, while frozen beans retained 71 % .
DISCUSSION The study showed that green beans are a good
source of vitamin A based on the carotene content.

TABLE 1.-Carotene Content of Fresh and Processed Green Beans Stored for 2 Weeks, 3 Months, and 6 Months.
Sieve Size
1-3
1-3
4-6
4-6
Process
can
freeze
can
freeze
Storage
0 2 wk 3 mo 6 mo
0 2 wk 3 mo 6 mo
0 2 wk 3 mo 6 mo
0 2 wk 3 mo 6 mo
Tender Blue
1.293 1.035* 0.951. 0.887*
0.865 0.874 0.988* 0.701 *
0.865 0.569* 0.651 * 0.687*
*Significantly different from fresh (0-storage) at the 0.05 level.
It is likely, however, from the analytical technique used, that the vitamin A content was overestimated. Gebhardt et al. ( 5), in a critical study, have shown that not all isomers of beta-carotene measured by this procedure have vitamin A activity and they found that the vitamin A content of canned peaches was some 50% of that originally reported.
Preliminary investigations based on their procedure have shown that most of the carotene measured by the authors' procedure was indeed beta-carotene or provitamin A. A preliminary figure of between 60% and 80%, based on cultivar, has been estimated.
The fact that the carotene content of frozen beans is depleted more rapidly than that of canned beans is not really surprising. It is believed that the incomplete inactivation of oxidizing enzymes in the frozen beans is responsible. The fact that the authors were able to demonstrate the presence of peroxidase in frozen stored beans lends credence to this hypothesis.
REFERENCES 1. Anonymous. 1958. Recommended Dietary
Allowances. National Research Council, Washington, D. C., Pub. No. 589_
2. Bedford, C. L. and M. M. Hard. 1950. The effect of cooling method on the ascorbic acid and carotene content of spinach, peas, and snap beans. Proc., Amer. Soc. Hort. Sci., 55:403.
3. Bickoff, E. M. 1957. Determination of carotene. In Methods of Biochemical Analysis, ed. by D. Glick. Interscience, New York, N. Y., Chapter I.
45
Carotene Content (mg/ l 00 g)
GP 467 Green Pak Coloma
Slim Green
1.366 1.1 33 1.001 0.897* 0.728. 0.737*
0.881 * 1.047 1.211 * 1.177 0.901 * 0.960*
1.366 1.133 0.693* 1.161 0.897* 1.165 0.746* 0.956*
1.072 0.976 1.024 0.656 0.951 1.274* 1.092 0.733 1.097 0.961 1.033 0.633 0.77 4* 0.751 * 0.687* 0.560*
1.072 0.976 1.024 0.656 0.583* 0.817 0.851 0.587 0.833* 0.901 0.911 0.646 0.637* 0.687* 0.724* 0.533
4.
5.
6.
7.
8.
9.
10.
11.
Brenner, S., V. 0. Wodicka, and S. G. Dunlop. 1948. Effect of high temperature storage on the retention of nutrients in canned foods. Food Technol., 2:207. Gebhardt, S. E., E. R. Elkins, and J. Humphrey. 1977. Comparison of two methods for determining the vitamin A value of clingstone peaches. J. Agri. Food Chem., 25 :629. Guerrant, N. B., 0. B. Fardig, and H. E. Ellenberg. 1948. Nutritive value of canned foods. Ind. Eng. Chem., 40:2258. Harris, R. S. and H. V. Loesecke. 1960. tional evaluation of food processing. New York, N. Y.
NutriWiley,
Hayden, F. R., P. H. Heinze, and B. L. Wade. 1948. Vitamin content of snap beans grown in South Carolina. Food Research, 13 : 143.
Kreh!, W. A. and R. W. Winters. 1950. Effect of cooking methods on retention of vitamins, minerals in vegetables. J. Amer. Dietet. Assoc., 26:966. Salunkhe, D. K., G. G. Dull, and S. K. Pao. 1973. Assessment of nutritive value, quality and stability of crucif erous vegetables during storage and subsequent to processing_ Critical Reviews in Food Technology, CRC Press, Cleveland, Ohio, Vol. 4. Zimmerman, W. I. and D. K. Tressler. 1940. Determination of carotene in fresh and frozen vegetables. I. Carotene content of green beans and sweet corn. Food Res., 5 :93.

Effect of Reconditioning on the Ascorbic Acid Content of Potato Cultivars
I. S. ARKOUDILOS and D. E. CREAN1
INTRODUCTION The potato is an important food crop, not only
because of its caloric content and food protein content, but also because it is an excellent source of vitamin C. It has been estimated that some 507c of the vitamin C in the European diet is derived from potatoes. Less of the U.S. vitamin C requirement come~ from potatoes hut, in a survey conducted in 1965, it was shown that more than 10% of the dietary vitamin C in the households surveyed came from potatoes. In the nation's food supply, as a whole, it has been estimated that potatoes contribute almost the same proportion of vitamin C as citrus fruits and nearly twice as much as tomatoes ( 8).
The palatability, cheapness, ready availability, and keeping quality of the potato enhance its importance in the diet. When freshly harvested, potatoes contain, on average, about 35 mg of ascorbic acid per 100 g fresh weight ( 6). However, there are considerable varietal differences in ascorbic acid content. Moreover, storing potato tubers has been shown to significantly deplete the ascorbic acid content ( 1, 2).
Storing potatoes at relatively cool temperatures has long been a standard practice. During this storage, the starches are broken down to reducing sugars, principally glucose. This can give rise to problems in subsequent processing of the potato tubers, especially when made into chips. The excessive brown color of chips made from potatoes with a high sugar content is an undesirable quality factor. To lower the sugar content, it is customary to store the potatoes for a period of time at room temperature, a process known as reconditioning.
Chemically, ascorbic acid is very similar to sugars, and it was felt that, in metabolically active tissue such as a potato tuber, changes in the ascorbic acid content were bound to occur. This study was thus undertaken to determine the changes in ascorbic acid content of potatoes during the reconditioning process.
MATERIALS AND METHODS Potatoes of Kennebec, Shurchip, and Norchip
cul ti vars were stored at constant temperatures ( 40°, 45°, 50°, and 55° F) at the Department of Horticulture facilities at Columbus After 6 months' storage time, samples were removed from storage and left at room temperature for varying periods of time to re-
'Former Graduate Student and Associate Professor, Dept. of Horticulture, The Ohio State University and Ohio Agricu:tural Re· search and Development Center.
46
condition. Samples were taken for analysis immediately after corning out of storage and after 1, 10, and 20 days' reconditioning time.
Cores ( Yt" diameter) were removed from two potatoes with a cork borer. These were then weighed and placed in a known volume of metaphosphoric acid. The samples were macerated in this solution and then filtered. An aliquot of the filtrate was taken for ascorbic acid analysis which was done titrimetrically using the 2,6-dichlorophenolindophenol method ( 3). Analyses were carried out in duplicate.
The results were statistically analyzed using analysis of variance ( 7).
RESULTS The results of the experiment are presented in
Tables 1 and 2. The temperature of storage had no significant
effect on the ascorbic acid content of the tubers. In view of the dependence of biochemical reaction on temperature, this result was somewhat unexpected. It is known, for example, that the lower the storage temperature, the greater the sugar content of the resulting tuber and, if ascorbic acid was to be metabolized in a manner analogous to other carbohydrates, it seemed reasonable to expect that temperature would have some significant effect on the ascorbic acid content of the tubers.
TABLE 1.-Effect of Storage Temperature on Ascorbic Acid Content of Potatoes.
Cultivar Storage Temperature (°F)
40 45 50 55 Ascorbic Acid (mg/100 g)
Kennebec 6.12 5.51 5.53 5.55 Shurchip 6.19 6.48 6.39 6.43 Norchip 6.04 6.39 7.02 6.18
L.S.D." = 0.626
TABLE 2.-Effect of Reconditioning Time on Ascorbic Acid Content of Potatoes.
Cultivar Reconditioning Time Days
0 10 20 Ascorbic Acid (mg/100 g)
Kennebec 5.36 5.32 5.43 6.60 Shurch1p 5.05 6.30 6.64 7.51 Norchip 6.14 5.85 6.90 6.74
L.S.D. " = 0.626

0 0 0 OH
" '\_ \I HO-!l O=!l
c I
O=C II o I o I
HO-r_J 0=1j +H20 O=C I
HC HC HC-OH I I I
HO-CH HO-CH HO-CH I I I CH20H CH20H CH20H
I II III
I = L-Ascorbic acid II = L-Dehydroascorbic acid III = 2,3-Diketo-L-gulonic acid
FIG. 1.-Breakdown of ascorbic acid.
It was noted, however, that there were significant differences among the different cultivars used in this study. Kennebec was the lowest while Norchip was the highest. This result was expected in the light of earlier work ( 4).
Of more interest, and of greater significance, was the fact that the ascorbic acid content of the tubers significantly increased with reconditioning time (Table 2). There was some variation among the cultivars, with Norchip increasing by 10%, Kennebec by 23%, and Shurchip by 49% over a 20-day period.
The interesting question raised by these data is, where is this 'new' ascorbic acid coming from? Two hypotheses suggest themselves. The first deals with the breakdown and disappearance of ascorbic acid during storage where it is oxidized to dehydroascorbic acid ( DHA) . This is an unstable compound and breaks down by hydrolysis to diketogulonic acid as shown in Figure 1.
It is possible that unhydrolyzed DHA may be reduced to ascorbic acid during reconditioning. This is of some importance since DHA also possesses vitamin C potency.
The other hypothesis is that the regeneration of the ascorbic acid occurs de novo by synthesis from sugars. This, too, is not unlikely since there is intense metabolic activity during the reconversion of sugars to starch and it is possible that a fraction could be synthesized to ascorbic acid ( 5) .
One problem attending the resolution of these hypotheses is that the analytical procedure used determines only the reduced ascorbic acid. Work is pro-
47
ceeding on measuring the dehydroascorbic acid of the potatoes and initial results suggest that the reduction of some of this chemical may occur during reconditioning. However, the amounts of dehydroascorbic acid found do not make this hypothesis particularly likely and it would seem that some enzyme system for the de novo synthesis is the more likely.
REFERENCES 1. Augustin, J. R. E., R. E. McDole, G. M. McMas
ter, C. G. Painter, and W. C. Sparks. 1975. Ascorbic acid content in Russet Burbank potatoes. J. Food Sci., 40 :415.
2. Barker, J. 1950. The ascorbic acid content of potato tubers. 1. The relation between ascorbic acid and the sugar content as influenced by the maturity at lifting and storage. New Phytol., 49:11.
3. Horwitz, W. (ed.) 1970. Official methods of analysis, 11th Ed. Assoc. Offic. Anal. Chemists, Washington, D. C.
4. Hyde, R. B. 1962. Variety and location effects on ascorbic acid in potatoes. Food Res., 27 :373.
5. Mapson, L. W. 1967. Biogenesis of L-a&corhic acid in plants and animals. In The vitamins. Ed. by W. H. Sebrell and R. S. Harris. Academic Press, New York, N. Y.
6. Oliver, M. 1967. Ascorbic acid: occurrence in foods. In The vitamins. Ed. by W. H. Sebrell and R. S. Harris. Academic Press, New York, N. Y.
7. Snedecor, G. W. and W. G. Cochran. 1967.

Statistical Methods. The Iowa State Univ. Press, Ames.
8. Swope, D. A. 1971. Nutrition as a tool for po-
tatoes. Proc., Twentieth .\nnual Natl. Potato Utilization Conf., A.RS 74-55, U. S. Dept. of A~riculture, Washington, D. C.
Kinetic Studies of Polyphenol Oxidase from HiDri Cabbages LING-MAY CHEN and ANDREW C. PENG1
INTRODUCTION The discoloration of many fruits and vegetables
resulting from mechanical and physiological injury during harvesting, post-harvesting storage, or proces~ing has been recognized as an oxidation of polyphenols present in the plant tissue, followed by subsequent polymerization through either enzymatic or non-enzymatic reactions. Two reactions are involved in the enzymatic browning and are catalyzed by a copper-containing enzyme, known as polyphenol oxidase ( E. C. 1.10.3.l; catecholase, tyrosinase) in the presence of molecular oxygen ( 14) . These two reactions are:
1. Hydroxylation of monophenols to 0-dihydroxyphenols.
2. Oxidation of 0-diphenols into quinones. Activities of polyphenol oxidase ( PPO), as well
as other enzymes, may be associated with more than one protein but have differences in their chemical, physical, kinetic, and electrophoretic properties ( isozymes). This multiplicity of enzyme system plays an important role not only in the biochemical regulation ( 19), but also in species differentiation ( 3).
PPO has been isolated and purified from a wide variety of fruits and vegetables, such as potatoes ( 3, 16), lettuce (12), broad bean leaves (18), peache.;; (21), apples (3), cherries (1), bananas (13, 15), pears ( 17, 20), and cranberries ( 2). Their physical, chemical, kinetic properties, and electrophoretic patterns were also studied.
Discoloration of cabbage on the cut surface of coleslaw may be related to enzymatic browning, reaction between PPO and phenolic substrates in the cabbage. The purpose of this study was to isolate the enzyme from three hybrids of high solid cabbages and to determine its kinetic and electrophoretic properties. The information will be applied to further studies on the factors affecting enzymic activities in the coleslaw production.
MATERIAL AND METHODS The three HiDri cabbage lines obtained from
Moreton Farm (Rochester, NY) were #1: 6428 =
48
HD 364 x HD 328, #2: 6426 =HD 364 x HD 326, and #3: 1464 =HD 314 x HD 364.2
Preparation of Acetone Powder
A 100 g sample of shredded cabbage was blended with 300 ml of chilled acetone with (or without) addition of 20 ml polyethylene glycol 400 ( 20%-) for 1 minute, filtered, the wet cake washed with chilled acetone twice or more, and then filtered to dryness. The powder was then stored at -20° C for analysis.
Preparation of Enzyme Extract
Acetone powder was mechanically stirred with 0.1 M citrate - 0.2 M phosphate buffer at pH 6.8 for 30 minutes and allowed to stand in the refrigerator overnight. The slurry was then strained and centrifuged. The clear solution was the source of crude enzyme.
The enzyme extract was further purified by precipitating with 65% saturated ammonium sulfate. This mixture was stirred for 30 minutes and centrifuged at 14,000 rpm for 30 minutes. After decanting the supernatant, the precipitate was dissolved in a minimum volume of citrate-phosphate ( Ci-P) buffer at pH 6.8 and dialyzed against the same huff er for at least 24 hours. All operations were carried out in an ice bath and all reagent solutions were chilled before use.
PPO Assay Procedure
Enzyme activity was determined by measuring the increase in absorbance at 410 nm with a Beckman DU-2 spectrophotometer. The reference cuvette contained 6 ml of Ci-P buffer at pH 6.5 and 4 ml of substrate. The sample mixture consisted of 5 ml 0.1 M Ci - 0.2 M P at pH 6.5, 4 ml of 0.02 M pyrogallol freshly prepared with Ci-P buffer (at pH 7), and 1 ml of enzyme extract. The final pH of this mixture was 6.8. The experiment was carried out at room temperature and the absorbance was read every 30
'Graduate Student and Professor, Dept. of Horticulture, The Ohio State University and Ohio Agricultural Research and Development Center.
'HD 364, 328, 314, 326 are high dry matter inbred cabbage lines bred by the New York State Agricultural Experiment Station.

seconds. Under these conditions, linearity can be maintained within 4 minutes. The initial velocity wa<; proportional to the concentration of the enzyme.
Protein content of each sample was determined hy Lawry's method ( 11).
One unit of enzyme activity is defined as the change in absorbance of 0.001 per minute at 410 nm. Specific activity is the units of activity per mg of protein.
Polyacrylamide-Gel Electrophoresis
Polyacrylamide-gel electrophoresis was performed hy modification of the Davis ( 4) method. A 12 %· gel was used as a spacer gel, 40 ,ul of enzyme soluticn containing 40% sucrose and one drop of 0.01 % hromophenol hlue was placed in the sample gel. PPO activity was detected by immersing the gel strips in Ci-P buffer (at pH 6.8) for 30 minutes before reacting with 100 ml of 0.02 M pyrogallol which contained 0.02% p-phenylenediamine.
The activity bands were detected within 1 hour, stained with Coommassie-blue, and destained with methyl alcohol-acetic acid until all the background was clear. Each gel was scanned in a scanning densitometer to detect the number and location of PPO bands.
RESULTS AND DISCUSSION Effect of Extraction Method on PPO Activity
Several factors could affect the extraction of PPO. PEG (polyethylene glycol) and PVP (polyvinylpyrolidone) were suggested to effectively extract PPO from plant tissue by virtue of their strong potential as hydrogen acceptors ( 10). The addition of PEG to cold acetone during the preparation of acetone powder gave higher specific activity of PPO in Royal Anne cherries than when the chilled acetone was used alone ( 1), and the protein content was also doubled ( 2). However, PEG-acetone buffer extraction was not significant in this experiment in terms of increasing enzyme activity and protein content (Table 1).
Duration of buffer extraction is critical in obtaining higher specific activity. Twenty-four hours with continuous stirring at 4° C could double the specific activity ( 7). Setting overnight without continuous stirring as in this study may result in lower activity.
TABLE 1.-Effect of PEG on PPO Activity and Protein Concentration in # 1 Cabbage.
Preparation
Acetone-Buffer PEG-Acetone-Buffer
Protein (mg)
0.135 0.14
Vo (unit)*
7 9
Km (mM)
6.1 8.05
*Changes of absorbance 0.001 per minute at pH 6.8 at room temperature = 1 unit.
49
Increasing the proportion of acetone powder to buffer ~lightly increased the Vo (initial velocity) and Vrn," in all three hybrids (Tables 2, 3, and 4). Vo and Vrn,>< are proportional to enzyme concentration; however, the enzyme concentration in the acetone powder was not estimated. The relationship between the ratio of acetone powder to buffer and enzyme activity cannot be eliminated from these results.
PPO activity can be further concentrated hy precipitating with 30% to 90% saturated ammonium sulfate. It has been found that less than 10~'(. of the PPO activity could he precipitated at 0-30% saturated ammonium sulfate, 20% of PPO activity increased at 30% precipitation, while a nine-fold increase could be reached at 901/c precipitation ( 8). In these experiments, two to three-fold increases in specific activity (which is usually an index of purification) were shown at 65% saturated ammonium sulfate precipitation (Table 5). Difficulties in collecting the precipitates and redissolving in buffer were observed. Precipitating with acetone ( 13) instead of ammonium sulfate in purification of PPO is recommended in future studies.
Kinetic Studies Km (Michaelis constant) is equal to the sub
strate concentration at semi-maximum rate ([SJ == Km; v = Vrn.ix/2). Therefore, a high Km means a high substrate concentration is necessary to obtain semi-saturation because of its low affinity to the enzyme. Km is an absolute constant for a given substrate but depends on pH, temperature, and affectors. In this study, Km was determined by the LineweaverBurk method. Km obtained from cabbage lines # 1 and #2 did not significantly differ from each other (Tables 2 and 3), but Km from #3 (Table 4) was comparatively lower than the others. Increasing the proportion of acetone powder in the extracting buffer didn't significantly change the Km. However, Km varied with degree of purification ( 9). Generally speaking, it is smaller in partially purified enzyme extract. Comparing the Km from this study to the Km obtained from broad bean leaves ( 2 .3 mM) which was determined by oxygen consumption method ( 18), it can be said the PPO from cabbage ha~ lower affinity for pyrogallol than the PPO from broad bean leaves.
Several parameters which may result in a large standard deviation should be of concern. One of these is temperature. It is well known that the rate of enzymatic reaction will usually increase 50% to 100% if the reaction temperature is raised 10° C. Electronic compartments and lamps in the spectrophotometer could raise the cuvette compartment temperature by 5-10° C over room temperature. This lack of stable accurate temperature control during

TABLE 2.-Kinetic Characteristics of PPO Extracted from :f:/:1 Hi-Ori Cabbage Line.
Source Crude Enzyme Partially Purified
Acetone Powder/ No. of No. of ml Buffer Trials Vo {Unit)* Vwa11 Km {mM) Trials Vo (Unit)* Vmar Km {mM)
20 mg 3 8 l 0 6 6.51 ± 1.38 4 8 75 l 0.4 5.65 ± l .4
50 mg 2 11 15.3 7.804t 2 10 12.1 4.26t
100 mg 2 14 18.3 6.107t 2 12 14.l 3.54t ----- -------------
*Changes of absorbance 0.001 /min at pH 6.8 at room temperature = l unit. tAverage of two trrals.
TABLE 3.-Kinetic Characteristics of PPO Extracted from #2 Hi-Ori Cabbage Line.
Source Crude Enzyme Partially Purified
Acetone Powder/ No. of No. of ml Buffer Trials v., (Unit)* V111a11 Km (mM) Trials Vo {Unit}* Vmac Km (mM)
20 mg 4 8.75 11 8 6.713 ± 1.94 4 9.25 11.2 4.27 ± 1.53
50 mg 2 10 13 2 6.42t 2 8 10.3 5.33t
100 mg 2 14 18 6.11t 2 8 11.22 B.06t
*Changes of absorbance tAverage of two trials.
0.001/min at pH 6.8 at room temperature = 1 unit.
TABLE 4.-Kinetic Properties of PPO Extracted from :f:/:3 Hi-Ori Cabbage Line. ----
Source Crude Enzyme Partially Purified
Acetone Powder/ No. of No. of ml Buffer Trials Vo (Unit)* Vma;:r Km (mM) Trials Vo {Unit)* Vma:r Km (mM)
20 mg 3 6 7.8 5.835 ± 1.463 3 5.3 6.8 5.47 ± 2.74 50 mg 2 8 l 0.7 6.69t 2 2.5 10 08 4.1 Bt
100 mg 2 10 12.1 4.26i• 2 11 12.06 l.92t
*Changes of absorbance 0.001/min tAverage of two trials.
at pH 6.8 at room temperature = l unit.
TABLE 5.-Purification Factor of PPO from Three Hi-Ori Cabbage Lines.
Acetone Powder/ Protein ml Buffer Vo (Unit)* {mg/ml) Sp. At Factor:j:
Line #2 20 mg crude 8.75 0.14 62.5 purified 9.25 0.05 185 2.96
50 mg crude 10 0.17 58.9 purified 8 0.04 200 3.396
100 mg crude 14 0.23 61 1 purified 8 0.08 100 1.64
Line #1 20 mg crude 8 0.135 59.3 purified 8.75 0.05 175 2.953
50 mg crude 11 0.16 68.8 l purified 10 0.055 182 2.65
100 mg crude 14 0.21 67 l purified 12 0.08 150 2.24
Line #3 20 mg crude 6 0.15 40 purified 5.3 0.055 97 2.41
50 mg crude 8 0.17 47 1 purified 7.5 0.055 137 2.9
1 00 mg crude 10 0.22 46 1 purified 11 0.07 158 3.42
*Changes of absorbance 0.001 /min at pH 6.8 at room temperature = I unit. tSpecific activity = Vo/protein content. :j:Factor =specific activity af crude enzyme
specific activity of partially purified enzyme.
50

0
0.2
0.4
0.6
0.8
1.0
2 3 4 5 6 7 8 9 10 ll 12
....... A ..... B ..... 8
FIG. 1.-Polyacrylamide gel electrophoretic patterns of polyphenol oxidase of three Hi-Ori cabbages. substrate: 1-5 dopamine
6-12 pyrogallol 1 and 6 - #1 cabbage 2 and 7 - #2 cabbage 3 and 8 #3 cabbage 4 and 9 - # 1 partially purified with acetone 5 and 10 = #2 partially purified with acetone
11 - #2 partially purified with 65% sat. ammonium sulfate 12 = #2 inhibited by 1 f<m potassium metabisulfite
assay may lead to unreproducible data from each laboratory. Either a water bath or electronic temperature control to maintain constant reaction temperature was recommended ( 5) .
Reaction rate data, if followed continuously hy recorder, arc advantageous in determining the initial velocity. Due to the limitation of the equipment, the sample readings in this study were taken at a dcfinitt' time (every 30 seconds), a so-called fixed time assay which may lead to a false initial rate. Nevertheless, this preliminary study gives valuable information for future studies.
Electrophoretic Studies Four active bands were separated in the crude
enzyme extract reacting with pyrogallol, dopamine, and chlorogenic acid. Their relative mobilities are 0.06, 0.13, 0.18, and 0.23, respectively. Although the multiple form of PPO was highly characteristic for each species and variety, as was seen in mushroom, apple ( 3), pear ( 6, 17), or avocado ( 8), there was a similar pattern exhibited among the three cabbage hybrids for substrate specificity (Fig. 1). However, the isozymes B and C were less sensitive to pyrogallol than to dopamine and chlorogenic acid. Only three bands were observed after partially purifying with 65% ammonium sulfate, while four bands were obtained when acetone was used in purifying the enzyme extract. This might be due to the loss of activity during preparation; otherwise, ammonium sulfate might alter the electrophoretic properties of the enzyme. Gel concentration plays an important role
51
in separating isozymes. A 10% or 12% gel was required to obtain better resolution in this study.
Inhibition of PPO by potassium metabisulfite was also studied. The gels were immersed in 10 mM and 1 mM potassium metabisulfite for 30 minutes before reacting with pyrogallol. A concentration of 10 mM completely inhibited PPO activities (no bands were observed), while 1 mM diminished the intensity of the four active hands without changing the electrophoretic pattern.
This study showed that the polyphenol oxidase extracted from cabbage is different from that of apples, potatoes, cherries, pears, and avocados in terms of substrate specifically and electrophoretic properties. The PPO system of cabbage appears to be composed of four isozymes. Further work should be done in studying the physical, chemical, and kinetic properties of these fractions.
REFERENCES l. Benjamin, N. D. and M. W. Montgomery. 1973.
Polyphenol oxidase of Royal Ann cherries. Purification and characterization. J. Food Sci., 38: 799.
2. Chan, H. T. and H. Y. Yang. 1971. Identification and characterization of some oxidizing enzymes of the MacFarbin cranberry. ]. Food Sci., 35: 109.
3. Constantinidcs, S. H. and C. L. Bedford. 1967. Multiple forms of phcnolase. J. Food Sci., 32: 446.

4. Davis, B. J. 1964. Disc electrophoresis. II. Method of application to human serum proteins. Ann. N. Y. Acad. Sci., 121 :404.
5. Douglas, S. A. 1978. Temperature accuracy and control in spectrophotometric enzyme assays. Am. Lab., 123:123.
6. Halim, D. H. and M. W. Montgomery. 1978. Polyphenol oxidase of d' Anjou pears. J. Food Sci., 143:603.
7. Kahn, V. 1975. Polyphenol oxidase activity and browning of three avocado varietie5. J. Sci. Food Agr., 26:1319.
8. Kahn, V. 1976. Polyphenol oxidase isozymes in avocado. Phytochemistry, 15:269.
9. Knapp, F. W. 1965. Some characteristics of eggplant and avocado polyphenolase. J. Food Sci., 301 :936.
10. Loomis, W. D. and J. Battoille. 1966. Plant phenolic compounds and the isolation of the plant enzymes. Phytochemistry, 5 :423.
11. Lowry, 0. H., N. J. Rosebrough, A. L. Farr, and R. J. Randall. 1951. Protein measurement with the Folin phenol reagent. J. Biol. Chem., 193:265.
12. Mayer, A. M. 1961. Nature and location of phenolase in germinating lettuce. Physiol. Plantarum, 14:322.
13. Montgomery, M. W. and V. C. Sqarbieri.
52
1975. Isozymes of banana polyphenoloxida5e. Phytochemistry, 14:1245.
14. Nelson, J.M. and C.R. Dawson. 1944. Tyrosinase. Adv. Enzymol., 4:99.
15. Palmer, J. K. 1963. Banana polyphenol oxidase. Preparation and properties. Plant Physiol., 38:503.
16. Patil, S. S. and M. Zucker. 1965. Potato phenolases. Purification and properties. J. Biol. Chem., 240:3938.
17. Rivas, N. J. and J. R. Whitaker. 1973. Purification and some properties of two polyphenol oxidases from Bartlett pears. Plant Physiol., 52 :501.
18. Robb, D. A., T. Swain and L. W. Mapson. 1966. Substrates and inhibitors of the activated tyrosinase of broad bean leaves (Vici a f aba L.). Phytochemistry, 5 :665.
19. Scandalios, J. G. 1974. Isozymes in development and differentiation. Ann. Rev. Plant Physiol., 25 :225.
20. Tate, J. N., B. S. Luh and G. K. York. 1964. Polyphenol oxidase in Bartlett pears. J. Food Sci., 29 :829.
21. Wong, T. C., B. S. Luh and J. R. Whitaker. 1971. Isolation and characterization of polyphenol oxidase isozymes of clingstone peaches. Plant Physiol., 48:19.

Refinements in Pickle Brine Recycling T. GLAROS and J. R. GEISMAN1
INTRODUCTION The volume of cucumbers for pickling in the
United States has increased over the last few years. The trend in per capita consumption has also increased, with each individual consuming slightly more than 8 lb of pickles per year.
Three different kinds of pickles are available to the consumer: fresh pack, salt <;tock, and refrigerated. Fresh pack and refrigerated pickles do not create a major pollution problem, but the spent curing brine from salt stock does. In the United States, more than 30 million gallons of spent brine are produced annually from pickle processing. The Water Pollution Control Act of 1972 sets limits on the amount of chlorides which can be discharged from a particular plant. This limits the release of salt into the environment and therefore means that there must be a rapid and efficient method for treating or recycling brines for re-use.
Several methods have been proposed for brine recycling. These involve pH adjustment with subsequent settling times, heat treatment through specially constructed heat exchangers, and the re-use of brine with very little conditioning. Each of these techniques has particular drawbacks. The pH adjustment requires a 48 hr settling period. Heat treatment or pasteurization not only requires an expensive piece of equipment but relies on fuel which may be scarce. Re-use of brine with no conditioning is dangerous in that softening enzymes could be present which would build to a point where the entire pack could be lost.
This research was conducted to determine whether refinement of the technique developed at OARDC for brine recycling could be accomplished. There were two objectives to this study:
1. To determine the feasibility of polyelectrolyte addition and sand filtration as possible methods of recycling spent brine from the cucumber fermentation.
2. To compare the efficiency of polyelectrolyte addition, pH adjustment, and sand filtration as methods for recycling spent curing brines.
EXPERIMENTAL MATERIALS AND METHODS The research was conducted in two phases.
Phase I involved construction and use of sand filtration as a means of recycling spent curing brine. Phase
1Former Graduate Student and Professor, Dept. of Horticulture, The Ohro State Un1vers1ty and Ohro Agricultural Research and De· velopment Center.
53
II involved pH adjustment with and without the addition of organic flocculents (polyelectrolytes) . Spent curing brine was obtained from the H. W. Madison Co. division of the ]. M. Smucker Co.
Phase I-Sand Filtration Construction of the Sand Filter
The sand filter was constructed of readily obtainable materials using a 55-gallon barrel for holding the material. A wooden flume was placed inside
22~ II
24 II 35 II
---.------ - - - - .__...___~
FIG. 1.-Side view of sand filter.
FIG. 2.-Top view of sand filter.

the barrel which held an 18-inch deep bed of filter sand. A false bottom was placed inside to support the flume and filter sand. The space between the false bottom and the actual bottom acted as a reservoir for the filtrate.
A drain was connected to the bottom of the barrel so the filtrate could be removed. A hole was cut on the side of the barrel just above the false bottom. This acted as a drain for backwash material which collected between the barrel and the flume. Backwashing was accomplished by forcing water up through the filtrate, then through the reservoir and through the filter sand. Construction is illustrated in Figs. 1 and 2.
Filtration Procedure Three replications with duplicate samples for
analysis were performed. Approximately 18 gallons of spent brine were used for each replicate. Before filtration, the barrel of spent brine was stirred. The filter was cleaned between replicates by backwashing with fresh water for 10 minutes.
Flow Chart
55 Gallons of Spent Brine
l SBA 18 Gallons ~Sand Filter
;?7 Residue Filtrate RBA
SBA = Spent Brine Analysis RBA = Recycled Brine Analysis
Phase II: Polyelectrolyte Additiion With or Without pH Adjustment
Three different polyelectrolytes manufactured by Calgon Corp. were tested for their ability to produce a floe that would rapidly settle when added to spent brine. The treatments were replicated, with duplicate samples removed for analysis. The polyelectrolytes are known by the following trade names:
Anionic Polyelectrolyte WT 2900 Cationic Polyelectrolyte WT 2870 Nonionic Polyelectrolyte WT 2690
Nonionic Polyelectrolyte WT 2690
A stock solution of WT 2690 was prepared. A magnetic stirring bar and 500 ml of distilled water were added to a clean 600 ml beaker, which was placed on a magnetic stirrer. The magnetic stirrer was set at speed 4. Exactly 1.000 g of WT 2690
54
wa<; sprinkled into the agitated, distilled water and allowed to mix until completely dissolved. This solution was quantitatively transferred to a clean 1,000 ml volumetric flask and diluted to the mark. One ml of this stock solution, when added to 1 liter of spent brine, is equivalent to 1 ppm. The stock solution was stable for 2 weeks.
Twelve 1-litcr bottles with rubber stoppers were cleaned, and 1 liter of spent brine was added to each bottle. The following dilutions were prepared and replicated:
0 ppm-control 0.01 ppm-1 ml of stock solution to 100 ml
H20, 1 ml/liter 0.1 ppm-10 ml of stock solution to 100 ml
H 20, 1 ml/liter ppm-1 ml of stock solution/liter
10 ppm-10 ml of stock solution/liter 100 ppm-100 ml of stock solution/liter
After the addition of the polyelectrolyte, the samples were mixed and then observed for the polyclectrolyte's ability to form a floe that would rapidly settle in comparison to the control.
Twelve more bottles with rubber stoppers were cleaned and 1 liter of spent brine was added to each. Each 1 liter of spent brine was adjusted to pH 11, using 19 N sodium hydroxide and a Beckman Expandomatic SS - 2 pH meter. The same dilutions as above were prepared and replicated with polyelectrolyte additions after pH adjustment.
The samples were mixed and then observed as previously described.
Twelve more bottles were thoroughly cleaned and 1 liter of spent brine was added to each. The same dilutions were prepared and replicated. The polyelectrolyte was added and the samples were adjusted to pH 11 as previously described. Observaticns were made on the rate of floe formation.
Cationic Polyelectrolyte WT 2870 A stock solution of WT 2870 was prepared in
exactly the same manner as for the polyclectrolyte WT 2690. Dilutions of this stock were added to spent brine with and without pH adjustment as previously described. The rate and amount of floe information were recorded.
Anionic Polyelectrolyte WT 2900 A stock solution of WT 2900 was prepared. A
magnetic stirring bar and 500 ml of distilled water were added to a clean 600 ml beaker, which was placed on a magnetic stirrer. Exactly 0.2000 g of WT 2900 was sprinkled into the agitated water. After complete solution, the mixture was quantitatively transferred to a clean 1,000 ml volumetric flask and then diluted to the mark with distilled wa-

ter. One ml of the stock solution, when added to the 1,000 ml of spent brine, equals 0.2 ppm.
Fourteen 1-liter bottles with rubber stoppers were thoroughly cleaned, and I liter of spent pickle brine wac; added to each. Each dilution including the control (no polyelectrolyte) was replicated. The following series of dilutions were made:
0 ppm-control 2 ppm-10 ml of stock solution/liter 4 ppm-20 ml of stock solution/liter 6 ppm-30 ml of stock solution/liter
8 ppm-40 ml of stock solution/liter 10 ppm-50 ml of stock solution/liter 20 ppm-100 ml of stock solution/liter 40 ppm-200 ml of stock solution/liter After each dilution was prepared, it was ob
served for the polyelectrolyte's ability to produce a floe that would rapidly settle in comparison to the control.
Additional treatments were made with pH adjustment before and after polyelectrolyte addition a~ previously described. Observations were made on the rate of floe formation.
Analysis of Treated Brines
Only those polyelecrolyte solutions producing a floe that settled rapidly were tested for clarity and photographed to give a better indication as to the effectiveness of polyelectrolyte addition.
These treated brines were also analyzed using standard methods for:
1. Percent salt 2. Percent light transmittance ( Spectronic 20
at 587 nm) 3. pH 4. Total acid (percent lactic acid) 5. Total solids and ash.
RESULTS AND DISCUSSION Phase I: Sand Filtration
Raw pickle brine was filtered through 18 inches of filter sand in an effort to remove the suspended solids. The speed of filtration was dependent upon gravity. This filter did not utilize a pump. The sand particle size ranged from 0.25-0.55 mm.
Sand filtration alone was not an adequate method for recycling spent brine. Filtration was slow without a pump. Less than 1 liter of filtrate was collected per minute. Prior chemical pretreatment wa;;; necessary in order to produce a re-usable brine. Even though there were statistical differences in the analytical results before and after filtration, these differences were of little practical value.
55
I. Percent Light Transmittance at 587 nm ( S pectronic 20)
Percent light transmittance at 587 nm before filtration averaged 62.08%. After filtration, the light trammittance increac;ed to 64. 73 ;7c. This wa<; a significant increase at the 0.05 significance level.
2. Percent Salt
There was a small but significant reduction in the percent salt after filtration. The salt percentage before filtration averaged 14.66. After filtration, the salt content was reduced to 14.33%.
3. pH
The pH did not change significantly. The pH before filtration ranged from 3.51-3.55. After filtration, the pH ranged from 3.59-3.60.
4. Total Acid as Percent Lactic Acid
Total acid as percent lactic acid did not change significantly with filtration. Before filtration, total acid as lactic averaged 0.54%. After filtration, total acid as lactic averaged 0.51 % .
5. Total Solids
Sand filtration reduced total solids from 16.6 to 15.26%. This was a significant difference at the 0.05 significance level. The difference between the salt percentage and the total solids percentage after filtration is approximately 1 %. This difference could be attributed to organic matter such as dead bacteria, pieces of pickle, enzymes, and possibly yeast cells.
6. Perc1ent Ash
Ash expressed as a percentage of total solids ranged from 86.88 to 90.80% before sand filtration. Percent ash before filtration averaged 89.61 %- Each ash determination was performed in exactly the same manner. This variation cannot be accounted for. After filtration, ash ranged from 90.56 to 92.76% with an average value of 91.55%.
Phase II: pH Adjustment Followed by Polyelectrolyte Addition
The only polyelectrolyte capable of producing a large floe was Calgon WT 2900. The sequence of material addition was extremely important. The pH had to be adjmted to 11 before WT 2900 was added. Any other sequence with or without pH adjustment proved unsuccessful. A pH higher than 11 would inactivate the anionic polyelectrolyte. The polyelectrolyte was evaluated at different concentrations ranging from 2 to 40 ppm. Six ppm proved to be the ideal concentration. It produced a large floe which rose to the top of the container in the laboratory. Apparently during the mixing process, air was entrapped in the floe which caused it to rise instead of sink.

The anionic polyelectrolyte costs $2.50 per pound. The cost per 5,300 gallons of spent brine was less than 50 cents.
This procedure was tested at the H. W. Madison Company division of J.M. Smucker Company in Medina, Ohio. Approximately 5,300 gallons of spent brine were adjusted to pH 11. Six ppm of WT 2900 were added and mixed. Within 2 hours, a layer of sediment less than 1 foot in depth had accumulated at the bottom of the vat. The decantable supernatant was clear without any suspended solids. This proce~s was approximately 24 times faster than pH adjustment alone.
After pH adjustment and polyelectrolyte addition, the decantable liquid was tested for percent light transmittance at 587 nm using Spectronic 20. The reconditioned brine transmitted 100% of the 587 nm light passed through the sample.
SUMMARY AND CONCLUSION The sand filter constructed during Phase I of this
project was not able to remove the suspended solids present in the spent brine that were responsible for the low light transmittance. The rate of filtration was also slow. Approximately 1 liter of filtrate per minute was collected during the filtration process.
Adjustment of the pH to 11 followed by the addition of anionic WT 2900 polyelectrolyte was effective in producing a large floe that would rise to the top of the container. Air bubbles were entrapped within the material during the dissolving process, causing the floe to rise instead of sink. The clear liquid generated as a result of this process could be re-used.
The method for recycling spent brine should lie refined to pH adjustment followed by the addition of 6 ppm of the polyelectrolyte WT 2900. This is the fastest and most effective method to date. This met hod is 24 times faster than pH adjustment alone.
Use of Ultraviolet Light to Inhibit Staphylococcus aureus Growth on the Surface of Baked Pumpkin Pie
NICHOLAS N. KALLAS and WILBUR A. GOULD1
INTRODUCTION Ultraviolet irradiation is a powerful bactericidal
agent. But due to its poor penetrative powers, food use is limited to surface applications. Nevertheless, ultraviolet light has widespread, practical use in the food preservation industries. Several food applications include bread, cakes, aging of meats, bread slicing knives, storage and packaging cheese, air surrounding foods, and water for beverages ( 5, 6).
Section 128e.7 (c) (9) of the FDA's (1976) proposed GMP's for bakery foods, if approved, would have required all baked goods supporting microbial growth to be refrigerated to 40° F or below within 2 hours after baking and maintained at this temperature or below until final retail consumer purchase. Therefore, a potential alternative ultraviolet light preservation method which would allow the marketing of baked pumpkin pie without refrigeration but ~ith safety from staphylococcal food poisoning was mvestigated.
This study was based on the following hypothesis. If a baked pumpkin pie is free from viable staphylococci upon leaving the oven, any postbaking sta-
1Graduate Research Associate and Professor, Dept. of Horticul· ture, The Ohio State University and Ohio Agricultural Research and Development Center.
56
phylococcal contamination, provided the integrity of the pie's surface is maintained, would he surface oriented where treatment with ultraviolet light would effectively inhibit staphylococcal growth and/ or survival. To test this hypothesis, two experimental objectives were investigated: 1) to determine if Staph;1-
lococcus aureus is destroyed by the baking process, and 2) to determine the effect of ultraviolet irradiation on the growth and/ or survival of Staphylococcus aureus surface inoculated on baked pumpkin pie at various inoculum levels and stored at various temperatures.
MATERIALS AND METHODS Staphylococcal Strains. The S6 strain is a clas
sical food isolate which produces enterotoxins A and B. The 836 strain is a recent food (barbecue) isolate which produces enterotoxin A.
Pie Materials: The pumpkin pie filling and pie shells were obtained frozen from a local commercial bakery and stored at -23° C until used. Prior to use, the filling was thawed at 4° C for 24-36 hours and the shells at room temperature for 20 minutes. The pumpkin filling was heated to 20° C before baking.
UV Light Apparatus: A CE-36-4 unit from the American Ultraviolet Co., Chatham, N. J., which operates with four G36T6 ultraviolet lamps was used

throughout the study. This fixture has an approximate shortwave germicidal output at 2537 A of between 10,900 and 15,000 microwatts/cm2 at 212 inches ( 6.35 cm) from the radiation source.
lnoculum Preparation: The inoculum preparation method was that of Crisley et al. ( 3). All inoculums were adjusted so that 0.1 ml cell suspensions in 0.1 % peptone (Difeo) water would represent the desired inoculum size. Verification of inoculum sizes was made by plating the inoculum suspension on Plate Count Agar (Difeo).
The Baking Process on Staphylococcal Survival: Eight-inch diameter pies were inoculated with a 12-hour culture of 108 S. aureus S6 cells in six different localized positions (one pie-one position). The positions inoculated were on the surface of the filling both center and perimeter, in the filling both center and perimeter, and on the filling-crust interface both center and perimeter. Duplicate replications of each position were tested.
The pies were baked in a Dispatch reel oven at 190° C for 45 minutes with a fill temperature of 20° C. After baking, 50 grams of the inoculated section were blended with 450 ml of Butterfield's PO buffer and sampled using PCA spread plates and Trypticase Soy broth (TSB) (Difeo) (3 tube most probable number) and incubated at 37° C for 48 hours. Positive TSB tubes were streaked for isolation on PCA and Staphylococcus 110 (Difeo) media and incubated at 37° C for 48 hours.
All colonial growth was treated first by a gram stain and if gram positive cocci were found, a second and conclusive staphylococcal test would have been the determination of coagulase production. Since no gram positive cocci were isolated, coagulase tests were deemed unnecessary.
Pie Processing: Experimental conditions were designed to simulate an actual commercial operation. The 8-inch pies were baked at 190° C for 45 minutes and the 4-inch pies at 163 ° C for 90 minutes. The pies were open air cooled from oven temperatures of 98° C to 57° C on raised wire rack surfaces.
The pies were inoculated by pipette delivering 0.1 ml of 0.1 % peptone water containing the desired inoculum size. The pies were irradiated for the desired time treatment by being passed under the UV apparatus placed on a conveyor belt. The pies were then placed in standard pie cartons which contained side vents and a "breathing" cellophane window. The pies were stored as follows: 8-inch pies at 20-22° C for 9 days and 4-inch pies at 25° C for 90 days and at 30° C for 7 days.
Sampling of Irradiated and Control Pies: Pies were sampled every 24 hours starting on the day of baking on PCA and SllO agars. For the 4-inch pies,
57
the entire surface representing 20.0 grams was removed at a depth of approximately Ya-inch and blended with 180 ml of PO, buffer. Further dilutions were made with 90 ml PO, dilution blanks. For the 8-inch pies, the same technique was used except only the inoculated pie surface section was removed.
Explanation of Figures: Figures 1-4 represent PCA counts only since these counts were consistently higher than Sl 10 counts. Previous experimentation by the authors ( 7) with uninoculated pumpkin pies both irradiated and nonirradiated showed little if any microbial growth on PCA as a result of air-borne contamination or otherwise under these same experimental conditions. The values shown in the figures represent the average PCA counts obtained from the two pies sampled for each specific treatment.
RESULTS AND DISCUSSION The Baking Process on Staphylococcal Survival
Since no gram positive cocci were isolated from any of the six pie positions after baking, S. aureus was determined to be destroyed by the baking process. This is in agreement with Cathcart et al. ( 2) and Angelotti et al. ( 1), who found staphylococci to be destroyed in custard pies when given a commercial baking process.
However, just because staphylococci are killed by the baking process, this does not mean that staphylococci will be absent indefinitely from the pie product. In automated commercial operations, the baked pie<; upon leaving the oven are open air cooled on moving conveyor belts. Consequently, since air is an environment which contacts the top surface of the pie during this cooling operation, it is evident that these air-exposed products may become contaminated with airborne staphylococci, the main source of which is the food worker ( 8) .
It also is important to note that if staphylococcal contamination, growth, and enterotoxin production occur before the baking process, the enterotoxin which is heat stable will not be completely inactivated by the baking heat treatment and foods under such conditions might cause food poisoning, although no live staphylococci can be demonstrated. Consequently, for UV light to be effective in controlling staphylococcal food poisoning, the history (raw ingredients, handling, sanitary conditions, etc.) of the product prior to baking is of vital importance in determining whether the product carries toxin.
Shelf Life Studies With the 8-inch pies inoculated with strain S6
and irradiated at 2 inches from the pie's surface and incubated at 20-22° C, as the irradiation time increased, the lag period increased, with the 16-sccond irradiated pies displaying a lag period of at least 9

~ )i:'. 9.0
'i 8.0
: 7.0 (!) 60 " . iE 5.0
;:!: 4.0 VI .... 3.0
0 2.0 (!) 0 1.0 .... o.a-..... --.--.--..... ..-~..-..-...,--..---
0 23456789
TIME (DAYS)
FIG. 1.-Log of average staphylococci per gram (PCA) vs. time, 8-inch pies, 20-22° C incubation; 4, 8, and 16-second irradiation at 2 inches, strain 56.
,..._ c( u !:. 6.0
~ c(
~ 5.0
" ::c Cl. c( 4.0 .... VI
.... 0 3.0
(!) 0
.. ···· FOo·o. Po;~.oliii~G ";QN°E .. ...- . ...-. ~ ::: ... ·.· .·: :·::~~ .... : ...... -: :· ... ~. :". .. ·.·. :: :".. ~~ .-:: ...... ~. ~ ·:: ...
.............................. ...................................... ...... ...... ..., "----·
ULTRAVIOLET EXPOSURE
- OSEC ..... 16 SEC
•-• 32 SEC
..... 2.0 .... ------..----..-----0 2345678 9
TIME (DAYS)
FIG. 2.-Log of average staphylococci per gram (PCA) vs. time, 4-inch pies, 25° C incubation; 0, 16, and 32-second irradiation at 2 V2 inches, 1.0 x 10⁶ inoculum strain 836.
~ v Cl. ~
~ c( ~ (!)
" ::c 0.. c( .... Vl
.... 0
(!) 0 ....
9.0
8.0
7.0
6.0
5.0
4.0
3.0
2.0
1.0 0 2345678
TIME (DAYS)
ULTRAVIOLET EXPOSURE
- 0 SEC
•••n 16 SEC
.. -- 32 SEC
FIG. 3.-Log of average staphylococci per gram (PCA) vs. time, 4-inch pies, 30° C incubation; 0, 16, and 32-second irradiation at 2 % inches, 1.0 x 10⁶ inoculum strain 836.
58
days. Both the 4 and the 8-second irradiated pies supported sufficient staphylococcal growth to be considered suspect food poisoning agents, whereas the 16-second irradiated pies did not support definite staphylococcal growth to he comidered a suspect food poisoning vehicle (Fig. 1 ) .
For the 4-inch pies inoculated with 1.0 x 1 O'; strain 836 cells and irradiated at 2 Y2 inches from the pie's surface and stored at 25 ° C, all three treatments, control, 16, and 3 2-second irradiated pies failed to support staphylococcal growth and displayed lag periods of at least 9 days (Fig. 2).
For the 4-inch pies inoculated with 1.2 x 10⁴
strain 836 cells and irradiated at 2 Y2 inches and incubated at 30° C (Fig. 3), the control and 16-second irradiated pies supported sufficient staphylococcal growth to be considered suspect food poisoning agents. The 32-second irradiated pies displayed a 5 to 6-day lag period and only supported slight staphylococcal growth after 6 days but remained considerably below 500,000 staphylococci per gram (generally recognized as the number of staphylococci required to cause food poisoning ( 5, 6)) during the entire 7-day 30° C storage period (Fig. 3).
Under the same conditions of irradiation and incubation but with a higher 1.1 x 10r. strain 836 inoculum size (Fig. 4), the 32-second irradiated pies displayed a lag period of 7 days and at no time during the 7-day storage did the 32-second irradiated pies support definite staphylococcal multiplication, as counts decreased with time of storage.
In summary, Staphylococcus aureus is destroyed in pumpkin pie when given a commercial baking process. The pies were not sterilized by exposure to ultraviolet irradiation, although for a food preservation
< u Cl.
7.0
.._, 6.0
~ c( ~ <!> 5.0
" ::c Cl.
;:!: 4.0 Vl
.... 0 3.0 (!) 0 ....
2.0..---.-........ ~..--.--.... --o 2345678
TIME (DAYS)
ULTRAVIOLET EXPOSURE
- 0 SEC
..... 16 SEC
-.-•32 SEC
FIG. 4.-Log of average staphylococci per gram (PCA) vs. time, 4-inc'h pies, 30° C incubation; 0, 16, and 32-second irradiation at 21;2 inches, 1.1 x 10'' inoculum strain 836.

method to be effective it does not have to destroy or remove all microorganisms. Rather, causing a delay in the initiation of growth (lag time) is an important part of food preservation. In this study, this is exactly what preservation by ultraviolet light offers to the baking industry, as lag periods of 5 to 6 days were observed with 3 2-second irradiated pies inoculated with 104 and 10° staphylococcal 836 cells, respectively.
This research did show that the use of ultraviolet irradiation in the preservation of baked pumpkin pie with regard to staphylococcal food poisoning has great potential and merits serious consideration before anv mandatory refrigeration regulation is promulgated. .
ACKNOWLEDGMENTS The authors wish to thank Blue Bird Baking Co.,
Dayton, Ohio, for their financial and material support during this research investigation, and Dr. E. E. Batchelor, FDA Supervisory Microbiologist, Cincinnati, Ohio, for suppling the staphylococcal strains.
REFERENCES 1. Angelotti, R., M. J. Foter, and H.K. Lewis. 1961.
Time-temperature effects on Salmonellae and
Staphylococci in foods. III. Thermal death time studies. Appl. Microbiol., 9:308.
2. Cathcart, W. H., A. Merz, and R. E. Ryberg. 1942. Staphylococci and Salmonella control in foods. IV. Effect of cooking bakery custards. Food Res., 7: 100.
3. Crisley, F. D., R. Angelotti, and M. J. Foter. 1964. Multiplication of Staph,ylococcus aureus in synthetic cream fillings and pies. U. S. Puh. Health Reports, 79:236.
4. Food and Drug Administration. 1976. Docket No. 76N-0027. Bakery goods; proposal to establish a good manufacturing practice regulation. Fed. Reg., 41 (30) :6456.
5. Frazier, W. C. 1967. Food microbiology. McGraw-Hill, Inc., New York, 2nd Edition.
6. Jay, J. M. 1970. Modern food microbiology. D. Van Nostrand Co., New York.
7. Kallas, N. N. and W. A. Gould. 1977. Unpuhlished data.
8. Williams, R. E. 0. 1963. Healthy carriage of Staphylococcus aureus: Its prevalence and importance. Bact. Reviews, 27 :56.
Development of a Nutritionally Improved Corn Masa THOMAS H. RIEMAN and WILBUR A. GOULD1
INTRODUCTION Recent consumer group comments have indicated
public concern about the lack of nutritional content of formulated processed foods and snack foods in particular ( 2, 8). Corn chips, which comprise a substantial portion of the snack industry's production, are subject to the same criticism as other snack foods.
To improve the nutritional content of corn chips, minced fish flesh was utilized in masa formulation as a suitable protein source ( 3) for a natural form of nutrification. The objectives of this study were: 1) to determine the applicability and acceptability of mechanically deboned minced silver bass (Aplodinotus grunniens) flesh as a natural fortification agent, and 2) to determine the effects of masa production procedures necessary for nutrification by addition of fish flesh.
MATERIALS AND METHODS Masa (corn dough) was prepared with two vari
eties of Zea mays in a ratio of 70% yellow dent corn and 30% white dent corn (Fig. 1). A lye or lime
1Graduate Research Associate and Professor, Dept. of Horticulture, The Ohio State University and Ohio Agricultural Research and Development Center.
59
process was used for removal of the corn pericarp. Lye processed corn was treated with a 20% lye solution at 190° F for 1 minute, followed immediately by washing in water.
A steam jacketed kettle was used for the cooking process, with an amount of water sufficient to cover the kernels, or approximately 90 gallons of water per 100 lb of corn. The corn, under agitation, was heated in such a manner that after initially reaching 160° F it would be heated to 210° F within 15 minutes. After reaching 210° F, the com was immediately cooled to 160° F and allowed to soak for a minimum of 8 hours. Following the soak period, the com was ready for masa production.
Lime processed corn was also cooked in a steam jacketed kettle with agitation. The ratio of corn to water was the same as used for lye processed corn. However, lime (Ca(OH) 2 ) was added at a rate of 12 to 16 oz per 100 lb of corn. Time and temperature conditions of cooking were identical to those used with lye processed corn. After cooking, the corn was soaked a minimum of 8 hours. For both lye and lime processed corn, the pericarp was removed from the kernels by a water spray in a reel washer.

Fortified corn chips were prepared by m1xmg corn and fish flesh in a 3: 1 ratio. The fish flesh wa~ prepared from Lake Erie silver bass (A plodinotus grunniens) that had been headed, gutted, split, and mechanically deboned with a Bibun SDX-16 flesh separator. The minced flesh was of a consistency similar to ground beef, which allowed for ease of mixing and subsequent homogeneous masa. To achieve a homogeneous masa, however, it was necessary to use a high speed mechanical size reduction machine. A Comitrol (Urschel Laboratories, Inc.), operated at 9,600 rpm was used to produce masas from the lye and lime processed corn and the corn/fish mixture. Stone ground (traditional method) masa was produced at the Dan Dee Co., Columbus, Ohio, and used as a control product.
Masas were extruded and fried (Fig. 1) on a commercial corn chip line by the Marion Popcorn Co., Marion, Ohio.
CORN 70% YELLOW, 30% WHITE
20% LYE l MINUTE @ 190°F
WASH
COOK !600F to 2JQOF WITHIN 15 MINUTES
WATER
COOL ....._ __ _... to 16QoF
LIME COOK 160°F to 2 JQOF
WITHIN 15 MINUTES
SOAK 8 HR MINIMUM
WASH MINCED FISH
CORN CORN/FISH 3:1
STONE GRIND COMITROL
EXTRUDE
DEEP-FAT FRY
FIG. 1.-Masa and corn chip production flow chart.
60
Masas were analyzed for moi~ture before extrusion by the vacuum oven drying ( 7). Finished chips were analyzed for moisture using the infrared method ( 6). Oil content wa~ determined using the BaileyW alker method ( 6). Protein content was determined by the micro Kjeldahl method ( 4). Ash was determined according to the AO.\C procedure ( 4). Caloric content was determined according to .\STM method D3286-73, using a Parr Instruments Plain Static Oxygen Bomb Colorimeter No. 1341 with a No. 1108 bomb.
The index of nutritional quality (I. N. Q.) was calculated by the following formula:
l.N.Q.
percent nutrient requirement supplied by a quantity of food
percent energy requirement supplied by a quantity of food
This factor is the ratio of nutrients to calories. An ideal food would have an I.N.Q. of 1.
Color of corn chips was determined with an Agtron M30-A in the red mode (R) standardized on 00 and 90 disks ( 6).
Chips were evaluated for color, texture, and flavor on a scale of 0 (off) to 10 (excellent), using a sensory evaluation panel consisting of 10 graduate students, staff, and/ or faculty of the Department of Horticulture. Analysis of variance was used to determine significant differences between mean scores.
RESULTS AND DISCUSSION Results of compositional analyses revealed that
the addition of mechanically deboned fish flesh resulted in a 78.3% increase in protein content, 25.6'/{i reduction in oil absorption, and an 87 .5 7r increase in the protein index of nutritional quality ( I.N.Q.). Agtron R values indicated that the color of the fortified chips was somewhat lighter than conventional chips (Table 1) ; however, sensory evaluation showed that panelists found the light color equally acceptable as the darker conventional chips (not significantly different P < .01). Caloric content of the fortified chip was reduced only slightly by the addition of fish flesh (Table 1 ).
Sensory evaluation of the corn chip variations showed only flavor of the salted fortified chips was significantly different ( P < .05). No significant cliff erences ( P < .01 ) were found between mean scores of unsalted chips (Table 2). Short-term storage of the fortified chips appears feasible since panelists found the fortified chips to be equally acceptable as the conventional chips after 1 month of storage (Table 3).
These results present a possible avenue to the production of a snack food with substantially better nutritional quality through the use of underutilized spe-

TABLE 1.-Composition of Masa and Finished Corn Chips.
Moisture Protein
Type Mas a Chip Oil Protein Ash Agtron l.N.Q. Chip % % % % % R Calories Value
fortified 58 0.5 29 8.2 1.0 41.5 166 0.60 Stone Gnd. 55 0.5 39 .!..6 1.0 36.5 174 0.32 Comitrol 57 0.5 36 A.5 1.0 35.5 171 0 31 Lye Process 59 0.5 39 •L2 1.0 43.0 177 0.30
TABLE 2.-Acceptability of Fortified and Conventional, Salted and Unsalted Corn Chips.
Mean Sensory Scores
Salted Fortified Comitrol
Color 5.3 7.9 Flavor 4.8* 6.6 Texture 7.0 7.3
*Significant difference (p <.05).
Stone Gnd. Fortified
7.2 5.4 7.4 5.6 7.6 5.9
Unsalted Comitrol
8.9 6.3 8.2
Stone Gnd.
6.5 7.0 7.9
TABLE 3.-Acceptability of Salted Fortified and Conventional Salted Corn Chips When Fresh and After ShortTerm Storage.
Mean Sensory Scores
Fresh
Fortified Comitrol
Color 5.3 7.9
Flavor 4.8* 6.6
Texture 7.0 7.3
*Significant difference (p < .OJ).
cies of fish such as silver bass. The cutting waste from fish stick and portion production may also be a source of fish flesh for use in fortified corn chips, as this flesh has many of the properties of mechanically deboned fish.
REFERENCES 1. AACC. 1972. American association of cereal
chemists approved methods. Amer. Assoc. Cereal Chemists, St. Paul, Vol. 2, pp. 46-63.
2. Adams, R. 1976. Eating m Eden. Rodale Press Books Div., Emmaus, Pa., pp. 1-6, 75-81.
3. Ambrose, M. and V. Sidwell. 1975. Protein nutritional quality of foods. Marcel Dekker, Inc., New York, N. Y., Vol. 1, Part 2, pp. 197-211.
4. AOAC. 1970. Official Methods of Analysis,
1-Month Storage
Stone Gnd. Fortified Comitrol Stone Gnd.
7.2 7.4 5.2 6.4 6.5
7.6 7.0 7.5 7.6
61
11th Ed. Assoc. Official Analytical Chemists, Washington, D. C., p. 211.
5. ASTM. 1974. Annual book of ASTM standards. Amer. Soc. Testing Mater., Philadelphia, Pa.
6. Gould, W. A. 1976. Snack food quality control procedures. Potato Chip/Snack Food Assoc., Cleveland, Ohio, pp. 37-38, 43.
7. Gould, W. A. 1977. Food quality assurance. Avi Publishing Co., Westport, Conn., pp. 49-57.
8. Hall, R. H. 1974. Food for nought the decline in nutrition. Harper and Ross, Hagenstown, Mo.
9. Hansen, R. G., A. Sorenson, A. Wittwer, and B. Wyse. 1976. Nutritional quality index identifies consumer nutrient needs. Food Technol., 30( 1): 22-27.

Mechanical Debon'ing of Lake Erie Freshwater Drum
W. E. STONE and W. A. GOULD1
INTRODUCTION Many species of fish are presently underutilized
due to low yield by conventional filleting techniques or to a skeletal structure which does not allow boneless fillets. Losses in filleting and skinning freshwater drum can range from 75 to 85% of the round weight.
In an effort to recover a greater yield from such species, mechanical deboning machines or flesh separators have been used. Although the use of such machines is recent in the United States, Japan fish processors have used deboning equipment since 1950 ( 1). Depending upon the species of fish, yield of machine recoverable flesh can be expected to range from 28% to 66%, based on the weight of whole fish ( 4, 7). Mechanical deboning, however, produces definite changes in flesh color, bone content, and fat of the usable flesh (3, 5, 6, 8, 10).
The objective of this study was to determine some effects of mechanical deboning variations on freshwater drum (Aplodinotus grunniens) flesh.
MATERIALS AND METHODS Freshwater drum in round form landed in the
Western Basin of Lake Erie were purchased from commercial sources within 24 hours or less after landing. The drum were transported to the Food Technology Pilot Plant at OSU, boxed 60 lb/box in flake ice, and kept under 2° C refrigeration until processed.
Deboning Treatments: Drum were prepared for deboning by the following methods (Fig. 1). All preparatory operations were performed by hand. Drum were washed with cold water prior to heading and gutting and after kidney removal. A Bibun SDX-16 flesh separator with 3.0 mm cylinder perforations was used for deboning operations. All results are based on round weight lots of 54.5 kg ( 120 lb).
Fish Preparation Methods HG: Round fish headed, gutted, water jet re
moval of kidney. No orientation of the fish to the cylinder.
HGS: Round fish headed, gutted, water jet removal of kidney, split the entire length by cutting the ribs along one side of the spine. Fish oriented with flesh against the cylinder and skin side against the belt of the separator.
HGSA: Round fish prepared same as HGS treatment. Additionally, a solution of 87.6% distilled water, 11.0% sodium tripolyphosphate, 1.3%
1Technical Assistant and Professor, Dept. of Horticulture, The Ohio State University and Ohio Agricultural Research and Development Center.
62
ascorbic acid, and 0.9% citric acid (w/w) was applied to the split surface of the fish with a sprayer delivering 50 ml/minute. The sprayer was passed over the surface of the flesh twice from a distance of about 20 cm at a rate similar to that used in spray painting. Fish were oriented to the cylinder as in the HGS treatment.
HGSDT: Round fish headed, gutted, water jet removal of kidney, split as in HGS treatment, and tail removed to a point just behind the dorsal fin. Fish oriented to cylinder as in HGS treatment.
Pressure Variations: 1.5, 3.5, 6.0-numbers following treatment abbreviations correspond to relative pressures applied to the fish by the main pressure roller of the de boning machine (indicating arrow and scale device attached to the machine). Minimum pressure was 0.0 and maximum pressure was 6.0.
Mechanical deboning variations were evaluated by the following methods:
Color: Color of the raw deboned flesh was determined with a Hunter Color and Color Difference Meter D25D3A standardized with a Hunter white tile C2-4306 (L 95,00, a -0.60, b 0.40), and with an Agtron M-400A standardized on 00 and 90% relative reflectance disks in the red ( R) mode.
Fat Rancidity: As indicated by 2-thiobarbituric acid values (TBA), fat rancidity was determined by the method of Tarladgis et al. ( 9), modified by adding 2 drops of Tenox II (Eastman Chemical Co.) to inhibit oxidation during blending ( 11 ) . TBA values are expressed as mg malonaldehyde per 100 g fish flesh.
Bone and Scale Content: The method of Patashnik et al. ( 8) was used. Bone content reported as 3.2 mm or less, 3.2-6.4 mm, 6.4-12.8 mm, and greater. All scale and scale particles reported as the total number.
Moisture Con tent: Moisture content was determined by drying flesh samples on aluminum pans for 2 hours at 100° C in a convection oven, after which the samples were transferred to a vacuum oven for 5 hours at 70° C and ca. 100 mm pressure.
Fat Content: Fat content was determined by use of the Bailey-Walker apparatus with petroleum ether as the solvent. Dry 5.0 g samples were extracted in triplica.te for 3 hours. Solvent was evaporated by steam bath, followed by drying for 0.5 hour in a convection oven at 100° C. Results are expressed as percent fat on a wet basis.
Yield: Results are reported as percent of round weight and as percent of prepared weight. Yield re-

suits are based on round weight lots of approximately 54.5 kg ( 120 lb).
Sensory Evaluation: Samples for sensory evaluation were prepared by deep-fat frying and baking according to methods outlined by King ( 2), modified by preparing smaller portions, approximately 2.54 cm x 3.8 cm x 1.3 cm. Evaluation forms were hedonic/ scoring, a score of 1 being lowest and 9 being highest.
RESULTS AND DISCUSSION Rancidity (TBA): TBA values obtained from
minced flesh treatments generally increased by a factor of 2 over TBA values from the round fish used in the treatments (Table 1). Pressure applied during deboning or the degree of preparation prior to deboning had little effect on the immediate increase of TBA values, but points out that the deboning process itself had the probability of rancidity development due to the tremendous increase of flesh surface areas exposed to air.
Color: Pressure applied during deboning and the degree of preparation both show effects on the color of minced drum flesh. Examination of skin and bone waste showed that at greater pressures nearly all of the red muscle tissue directly beneath the skin was removed (Table 1). Greater pressure applied generally resulted in a more highly pigmented flesh (lower R values), with the exception of the HG treatments. It is believed that some gray coloration removed from the skin during deboning of HG treatments obscured any color differences present due to pressure variations. This suggests that drum should be oriented flesh side against the cylinder to avoid discoloration of the skin. Removal of the tail of drum (HGSDT treatments), which contains a high proportion of red muscle tissue, proved to have a definite lightening effect on the color of minced drum, especially at the lowest pressure setting (Table 1).
Bone and Scale C ont1ent: Bone and scale content was directly related to pressure applied to the fish during deboning. When fish were not oriented in any particular manner as in HG 1.5-6.0 treatments, the amount of scale material increased substantially, thus indicating that splitting and orientation of the flesh side against the cylinder is advantageous. Regardless of the treatment, the majority of the bone particles were 3.2 mm or less, the type that may give a "grit" feeling in the mouth (Table 1 ) . These results agree well with those from commercial minced cod and pollack blocks from several countries ( 8) .
Yield: Yield, as expected, increased as pressure applied to the fish was increased (Table 1), both as a percent of the round weight and percent of the weight of the fish as prepared for deboning. Though removal of the tail (HGSDT) reduced yield, the 28% re-
63
~ 'ii ... ·2 0
.c:: ... ~ ... 0
r.I :c "' ·c .g E! 0
.c:: u
e ·e GI
.c:: u "'O c 0
e i Cl.
e ~
II)
c 0
f :I
"' "' ! Cl.
&JI c ·2 0
.Q GI c "'O c 0 ... c GI
~ 0 ! .... t" 0 ... 0 .... o.c:: t; rt iC ... E 0 :I ... :!C ... .! i --i ~ • .c:: ... ; ~it a:i,, c( GI .... c
0 .Q GI c
.. 11 COI0--00-COl-.r...-O-O-to e -~~- C">- C°'IC
Ill
-~.a .f 0 .!
.. J!! § ...
:z:
c( • ID 0 ... z
~ c .. ! E " I~ ... ""
MlOM'<tCNM-0-01'-.M'<t'<t ...;-q:.,;...;...;.,;<Nc-iNc?..t..t
r-.to-00-1'-.-0-IO-O<Nr... r--.:c0t-..'.c:Oo=c00~~dO:O: " " " " " " co co co co " "
o--to-coor...r-.co<'<O-<'< S: '<I" " " .,., "° co '<I" -0 -0 I() .,., "
ci .e II) co
~ ~ ~ ~ ~ ~ ~ ~ ~ ~ C? ~ ci
~ ......
1l C'l c
ci ~ ~ ~ d ci : ~ ~ ~ ~ ~ E '<I" '<I""!" '<I" '<I" '<I""' '<I" '<I" '<I" '<I" '<I" ""
~ .. £
t'lMO-t'lOMt'lO-IOCOOIO ,5 .,;.o.,;...;.o..;r-:o:r-:r-:.,;...: '"Cl
"' "' "' '<I""' "' "' "' "' '<I" '<I" '<I" ~ ::> .c .. .;:::
it;~~~!:g~~~;:::e;~~ -g CNCNc-.!MMMIO'<t'<tt'lMM 5 c:i ci ci c:i c:i c:i c:i ci ci ci ci c:i -
E .g .. .. ::> g

covered flesh from HGSDT 1.5 treatment is better than the yield of skin-on drum fillets. The lighter flesh color resulting from tail removal is felt to offset the reduced yield.
Fat Analysis of Minced Flesh: Fat content of headed and gutted drum ranged from 4.8% to 6.1 %. Results of fat analysis of minced drum showed that much of the fat on the prepared fish is removed and incorporated into the flesh (Table 1). Greater pressure resulted in higher amounts of fat being removed. It was noted that a much smaller increase between pressure settings of 1.5 and 3.5 than between 3.5 and 6.0 occurred. This range of fat in minced drum and the large surface area exposed will positively warrant the use of an effective antioxidant to prevent rapid deterioration of the fat. Fat content of fillets has been
found to range from 0.5% to 2.3%, an obvious advantage of filleting although yield is somewhat reduced.
Sensory Evaluation of Minred Flesh Treatments: Samples of all minced fle~h treatment/pressure variations were presented to panelists for sensory evaluation in baked and deep-fat batter fried forms. Pressure applied to the fish during dehoning significantly affected the cooked flesh color. This was reflected by lower mean scores obtained for treatments of greater deboning pressure, regardless of the type of preparation fish received before deboning (Tables 2 and 3). The data support results of objective color determinations (Table 1) as to the relationship of deboning pressure to the color of the minced flesh.
Significant but minor, in that the scores were
TABLE 2.-Effects of Several Preparatory Treatments and Deboning Pressures on the Sensory Acceptance of Minced Freshwater Drum Cooked by Baking.
Treatment/ Mean Sensory Score
Pressure Color Odor Texture Flavor
HG 1.5 4.0 cdt 6.6 ab 7.0 a 5.3 abc HG 3.5 4.0 cd 6.8 ab 7.1 a 5.6 abc HG 6.0 4.8 d 7.2 ab 7.2 a 6.1 abc HGS 1.5 5.9 abc 8.0 a 6.6 a 6.9 ab HGS 3.5 4.3 bcde 7.1 ab 6.9 a 6.1 abc HGS 6.0 2.5 e 6.1 b 6.3 a 5.8 abc HGSA 1.5 5.6 abed 7.4 ab 6.8 a 4.4 be HGSA 3.5 5.0 bed 7.1 ab 6.4 a 4.2 c HGSA 6.0 4.0 cd 6.1 b 7.3 a 4.8 c HGSDT 1.5 6.2 ab 7.5 ab 7.5 a 7.8 a HGSDT 3.5 5.6 abed 7.3 ab 6.7 a 6.8 ab HGSDT 6.0 5.8 abc 6.9 ab 6.9 a 3.8 c Minced Fillets* 7.5 a 8.0 a 6.3 a 5.5 abc
*Skinless, boneless fillets minced in Hobart silent cutter. tColumn means with like letters not significantly different [P < 0.01).
TABLE 3.-Effects of Several Preparatory Treatments and Deboning Pressures on the Sensory Acceptance of Minced Freshwater Drum Cooked by Deep-Fat Frying.
Treatment/ Mean Sensory Score
Pressure Color Odor J,exture
HG 1.5 4.5 det 7.8 abc 6.8 ab HG 3.5 4.2 e 8.2 abc 7.0 ab HG 6.0 4.1 e 8.0 abc 7.1 ab HGS 1.5 6.6 ab 8.3 ab 7.5 a HGS 3.5 5.5 cde 7.4 be 6.7 ab HGS 6.0 4.1 e 7.1 c 6.4 ab HGSA 1.5 7.1 abc 7.9 abc 5.7 b HGSA 3.5 5.9 bed 7.8 abc 6.5 ab HGSA 6.0 4.5 de 7 .9 abc 7.1 ab HGSDT 1.5 7.4 ab 8.2 abc 7.0 ab HGSDT 3.5 7.4 ab 8.2 abc 7.4 a HGSDT 6.0 6.9 abc 8.0 abc 7.1 ab Minced Fillets* 8.0 a 8.7 a 7.8 a
*Skinless, boneless fillets minced in Hobart silent cutter. tColumn means with like letters not significantly different [P < .01 ).
64
Flavor
6.4 ab 7.6 ab 6.8 ab 7.4 ab 6.6 ab 6.1 b 7.2 ab 6.6 ab 6.2 ab 7.8 ab 7.9 a 6.5 ab 7.7 ab

relatively high, differences in odor were observed in minced flesh treatments, although the deep-fat fried samples generally scored higher for this attribute. Neitheir pressure nor treatment variation had substantial effect upon texture. Significant differences observed in deep-fat fried samples are believed to be the result of frying variation, in that baked samples did not show similar differences.
Flavor results were varied. Significant differences were observed in baked samples and deep-fat fried samples of minced drum, although differences were not as prominent between deep-fat fried samples. The poor flavor of baked samples of HGSDT 6.0 and HGSA. 1.5 may be attributable to an earthy flavor pre-
Transport
Refrigeration 2°c
Spray Wash Re-ice
Heading Gutting
Kidney Tissue Removal
Splitting
Spray Antioxidant
Tail Removal
1.5 3.5 6.0
Freeze -34°C
Store -23°C
FIG. 1.-Minced fish processing.
65
sent in some drum used in these two deboning variations. The effect of earthiness in drum on flavor emphasizes the need to remove these fish from any processing operation. The generally higher mean scores of deep-fat fried samples indicate that some masking of undesirable flavors is accomplished through the batter and deep-fat frying process.
In summary, the data suggest that moderate deboning pressures be used to avoid excessive pigmentation of the flesh obtained and prevent large increase of bone content. Orientation of fish to the separation cylinder and tail removal also appear to be beneficial in respect to obtaining lighter color flesh. Additionally, improvement in flavor was evident from scores of deep-fat fried samples, suggesting use of mechanically deboned fish in deep-fat fried products. Thus, the use of mechanically deboned Lake Erie freshwater drum flesh appears not only feasible but has been found to be suitable for products where a natural flakiness is not important.
ACKNOWLEDGMENTS The authors acknowledge the financial assistance
of the Ohio Department of Natural Resources and National Marine Fisheries Service.
REFERENCES 1. Carver, J. H. and F. J. King. 1971. Fish scrap
offers high quality protein. Food Engr., 43 (1):75-76.
2. King, F. J. 1976. Procedures for cooking seafood products. J. AOAC, 59 ( 1) : 225-226.
3. King, F. J. 1973. Improving the supply of minced blocks for the fish stick trade. A progress report. Mar. Fish. Rev., 35 ( 8) :26-32.
4. Kudo, G., M. Okada, and D. Miyauchi. 1973. Gel-forming capacity of washed and unwashed flesh of some Pacific Coast species of fish. Mar. Fish. Rev., 35 ( 12) : 10-15.
5. Miyauchi, D., G. Kudo, and M. Patashnik. 1973. Surimi-a semi processed wet fish protein. Mar. Fish. Rev., 35(12):7-9.
6. Miyauchi, D. and M. Steinberg. 1970. Machine separation of edible flesh from fish. Fish. Ind. Res., 6 ( 4) : 165-1 71.
7. Okada, M., D. Miyauchi, and G. Kudo. 1974. Kamaboko-the giant among Japanese processed fishery products. Mar. Fish. Rev., 35 ( 12): 1-6.
8. Patashnik, M., G. Kudo, and D. Miyauchi. 1974. Bone particle content of some minced fish muscle products. J. Food Sci., 39 ( 3) :588-591.
9. Tarladgis, B. G., A. M. Pearson, and L. R. Dugan, Jr. 1964. Chemistry of the 2-thiobarbi-

turic acid test for determination of oxidative rancidity in foods. II. Formation of the TBAmalonaldehyc complex without acid-heat treatment. J. Sci. Food Agr., 15 :602.
10. Teeny, F. M. and D. Miyauchi. 1972. Preparation and utilization of frozen blocks of
black rockfish muscle. J. Milk Food Technol., 35 ( 7) :414-417.
11. Yu, T. C. and R. 0. Sinnhuber. 1967. An improved 2-thiobarhituric acid (TBA) procedure for the measurement of autoxidation in fish oils. J. AOCS, 44 ( 4) : 256-258.
Lake Erie Freshwater Drum Fillet Processing, Storage, and Evaluation
W. E. STONE and W. A. GOULD1
INTRODUCTION There is presently an estimated 7 to 10 million
lb annual sustainable yield of freshwater drum (Aplodinotus grunniens) in Lake Erie ( 10). But commercial landings account for only 10% to 14% of this yield. Freshwater drum, like many other underutilized species, has not attained the popularity of other species as a food fish. However, as seafood prices continue to rise, the potential food use importance of these species will increase.
During 1976, frozen seafoods showed a 54% gain in dollar value over 1975. The biggest single contribution to this increase was frozen shrimp, increasing 82.8 % in dollar value ( 6). An average price of $4.65/lb for frozen shrimp during 1976 will exclude shrimp from many household budgets and force the consumer to choose alternatives. It was also indicated ( 6) that the highly exploited species are experiencing large dollar value gains.
Although problems of storage and texture variations have been reported ( 1), Lake Erie freshwater drum and other underutilized species may become increasingly important. Therefore, a specific objective of a broader project was to develop and evaluate processing methods which would allow extended storage of Lake Erie freshwater drum fillets without serious loss of quality.
MATERIALS AND METHODS Freshwater drum in round form landed in the
Western Basin of Lake Erie were purchased each month, April through October 1976, from commercial sources within 24 hours or less after landing. Drum, 60 lb/box in flake ice were transported to the Food Technology Pilot Plant at OSU and kept under 2° C refrigeration until processed.
. 'Technical Assistant and Professor, Dept. of Horticulture, The Ohio State University ond Ohio Agricultural Reseorch and Develop· ment Center.
66
Prior to filleting, drum were sprayed with cold water to remove slime and extraneous material. Filleting and skinning of drum were performed by hand prior to the following treatments:
Control (CON): No treatment to boneless, skinless fillets.
Blanch ( BLH): Fillets blanched in steam followed by a 30 sec cold water spray. Fillets less than 20.3 cm in length were blanched 20 sec, fillets longer than 20.3 cm were blanched 30 sec. Unsized fillets were blanched for 25 sec.
Dipped (DIP): Fillets were dipped for 1 min in a solution of 87 .6% distilled water ( 2° C), 11.0% sodium tripolyphosphate, 1.3% ascorbic acid, and 0.09% citric acid.
Glazed (GLZ): Fillets were frozen individually at -34° C and glazed by dipping the frozen fillets in a solution of 99.4% distilled water (2° C), 0.4% ascorbic acid, and 0.2% citric acid.
Fillets of April used for blanching and fillets of August used for all treatments were sized 20.3 cm or less ( SML), and greater than 20.3 cm in length (LGE).
Packaging of processed fillets with the exception of GLZ fillets was in 0.038 mm polyethylene bags with positive locking seals. GLZ fillets were packaged bulk in large plastic bags. All fillets were frozen at -34° C and stored at -18° C.
Fillet treatments were evaluated over a 10-month storage period at approximately monthly intervals by the following methods.
Fat Rancidity: The method of Tarladgis et al. ( 11), modified by adding 2 drops of Tenox II ( Ea5tman Chemical Co.) during blending of samples ( 14). TBA values are expressed as mg malonaldehyde/ 1000 g fish flesh.
Thaw Drip: Frozen samples of 60 to 100 g were placed in polyethylene bags measuring 11.0 x 22.0 cm. The bags were suspended in circulating water main-

tained at 18 to 21 ° C for 30 min. The bags were then drained of free liquid and reweighed for calculation of percent free thaw drip.
Color: Fle5h color was measured with a Hunter Color and Color Difference Meter D25D3A, standardized on a Hunter white tile C2-4306 ( L 95.00, a --0.60, b 0.40), after being ground through a plate having 3.2 mm holes.
Sensory Evaluation: Sensory evaluation panels were conducted with 7 to 10 members consisting of graduate students, staff, and faculty. Color, odor, texture, and flavor were judged on a hedonic/scoring scale of 1 (lowest score) to 9 (highest score) . Samples for sensory evaluation were prepared according to King ( 4).
RESULTS AND DISCUSSION Treating fillets with an antioxidant/ antidrip so
lution prior to freezing (DIP) reduced thaw drip by at least 50% regardless of the month in which the fillets
were processed (Fig. 1 ) . BLH fillets released the greatest amount of drip, while CON fillets released an amount intermediate of the other treatments. Thaw drip in GLZ fillets could not be determined due to the inability to separate or distingui5h actual thaw drip from muscle tis5ue from glaze melt. Size of fillets did not have a great effect on thaw drip release, although size has been suggested as one of the many factors influencing drip loss ( 8). Thaw drip decreased in fillets processed progressively later in the year, suggesting seasonal effects on thaw drip losses.
Ten months of storage had little effect upon fbh color a~ measured objectively or by sensory evaluation methods, regardless of the treatment the fish received. DIP and GLZ treatments provided protection to the myoglobin of red muscle tissue by retarding its oxidat;on to the metmyoglobin form (brown in color). Although BLH fillets displayed a whiter appearance when raw, panelists did not indicate any color prefer-
TABLE 1.-Effects of Harvest Time and Treatment on the Acceptability of Freshwater Drum Fillets as Shown by Overall Mean Scores.
Color Odor Texture Flavor
Month/Treal- Month/Treat- Month/Treat• Month/Treat·· ment/Size Overall Mean ment/Size Overall Mean ment/Size Overall Mean ment/Size Overall Mean
AUG/BLH/LGE 7.90 a* AUG/BLH/LGE 7.78 a SEP/DIP 7.39 a SEP/DIP 7.03 a
AUG/DIP/LGE 7.80 ab JUL/DIP 7.67 ab SEP/GLZ 7.16 ab AUG/BLH/LGE 6.97 ab
AUG/GLZ/LGE 7.68 abc SEP/BLH 7.57 abc AUG/DIP/SML 7.12 ab AUG/DIP/SML 6.80 abc
SEP/GLZ 7.66 abed SEP/DIP 7.56 abe AUG/GLZ/LGE 7.11 abe AUG/DIP/LGE 6.76 abed
SEP/DIP 7.60 abede JUN/DIP 7.56 abe AUG/CON/LGE 7.05 abed JUL/DIP 6.68 abed
SEP/BLH 7.53 abede AUG/DIP/LGE 7.53 abe AUG/CON/SML 7.01 abed OCT/DIP 6 67 abed
AUG/BLH/SML 7.53 abede JUL/CON 7.52 abe JUL/DIP 6.98 abed SEP/GLZ 6.64 abede
AUG/CON/LGE 7.51 abedef AUG/GLZ/SML 7.50 abc AUG/DIP/LGE 6.98 abed SEP/CON 6.59 abede
AUG/DIP/SML 7.44 abedef AUG/CON/SML 7.49 abe AUG/GLZ/SML 6.90 abed OCT/GLZ 6.47 abedef
JUL/DIP 7.34 abedef AUG/DIP/SML 7.44 abed SEP/CON 6.79 abed SEP/BLH 6.45 abedef
AUG/CON/SML 7.36 abedef SEP/CON 7.43 abed AUG/BLH/SML 6.78 abed AUG/CON/SML 6.42 abedefg
JUL/CON 7.29 abedefg SEP/GLZ 7.41 abed OCT/DIP 6.69 abed AUG/BLH/SML 6.40 abedefg
OCT/BLH 7.28 abedefg JUL/GLZ 7.36 abed JUL/GLZ 6 67 abed OCT/CON 6.33 obedefgh
JUN/GLZ 7.21 abedefg JUN/GLZ 7.36 abed JUL/CON 6.52 abede JUL/CON 6.31 abcdefgh
AUG/GLZ/SML 7.12 abedefghi AUG/BLH/SML 7.28 abed JUN/DIP 6.38 abedef AUG/GLZ/SML 6.21 bcdefghi
SEP/CON 7.11 abedefghi JUL/BLH 7.28 abed AUG/GLZ/LGE 6.34 abedefg JUN/GLZ 6.05 bedefghi
OCT/DIP 6.99 abcdefghii AUG/GLZ/LGE 7.27 abed OCT/GLZ 6 30 abedefg AUG/GLZ/LGE 6.03 bedefghi
APR/CON 6.98 abcdefghij APR/GLZ 7.25 abed J UL/BLH 6.28 abedefg AUG/CON/LGE 5.99 cdefghi
JUL/GLZ 6.84 bcdefghij OCT/DIP 7 .24 abed SEP/BLH 6.25 abedefgh JUL/8LH 5.98 edefghi
OCT/GLZ 6.82 bedefghij AUG/CON/LGE 7.20 abed JUN/GLZ 6.12 abedefghi JUL/GLZ 5.95 cdefghi
JUN/DIP 6.77 edefghij APR/DIP 7.18 abed OCT/CON 6.04 bedefghi JUN/DIP 5.85 cdefghi
OCT/CON 6.75 cdefghij JUN/BLH 7.17 abed JUN/BLH 6.03 bedefghi OCT/BLH 5.81 defghi
JUN/BLH 6.67 defgh1j JUN/CON 7.13 obede MAY/BLH 5.91 bedefghi MAY/CON 5.70 efghij
APR/DIP 6.66 defgh1j OCT/GLZ 7.10 abede MAY/CON 5.83 edefghi APR/GLZ 5.70 efghij
JUN/CON 6.63 efgh1j OCT/CON 7.04 bcde MAY/DIP 5.79 defghi MAY/BLH 5.60 fghij
APR/BLH/LGE 6.53 fghijk OCT/BLH 7.00 bede APR/CON 5.33 efghi APR/DIP 5.53 fghij
JUN/BLH 6.32 ghijk APR/CON 6.89 edef JUN/CON 5.23 efghi APR/CON 5.52 fghii
APR/GLZ 6.26 hijk APR/BLH 6.87 edef APR/BLH/LGE 5.20 efghi APR/BLH/SML 5.49 ghij
MAY/DIP 6.24 ijk MAY/CON 6.75 def MAY/GLZ 5.19 efghi JUN/BLH 5.44 hij
APR/BLH/SML 6.14 jk APR/BLH/LGE 6.75 def APR/BLH/SML 5.18 fghi APR/BLH/LGE 5.30 ij
MAY/CON 6.08 jk MAY/BLH 6.55 ef OCT/BLH 5.13 ghi JUN/CON 4.90 i MAY/BLH 5.72 kl MAY/GLZ 6.48 ef APR/DIP 5.05 hi MAY/DIP 4.07 k
MAY/GLZ 5.08 MAY/DIP 6.34 f APR/GLZ 5.01 MAY/GLZ 3.52 k
*Column means with like letters not sign1f1cantly different (p < .01 ).
67

co r-i
~ tJ ~~ ·1
'° .-1
,
I
...::t"
.-1
I
I
I
N .-I
0
I I
I
I 1-0
I
0
0
0
0
I 0
1---o 0
0
I 0
t--o 0
I I I I
0 co '° ...::t" .-I
dI~a ~VHL LNa8~ad
1-o .,;
OCT DIP l .... 0 SEP DIP ;::
E
t-o :> JUL DIP ...
"ti ...
JUN DIP <II c MAY DIP ~
.c "' QI
0 ... APR DIP -c
OCT BLH Q. ·;:
SEP BLH "ti
E-f ~ 0
~JUL BLH = ;:;::: c ~JUN BLH 0
~MAY BLH c QI
E-f E c:o ~APR BLH SML c "° E-f QI
6APR BLH LGE ... -
~ "ti c
OCT CON ti -... SEP CON QI
> ... 0
AUG CON SML .c -0 AUG CON LGE .c
JUL CON 'E 0 E
JUN CON -0
"' MAY CON -u QI
APR CON --LU
I. . N 0 ci
ii:
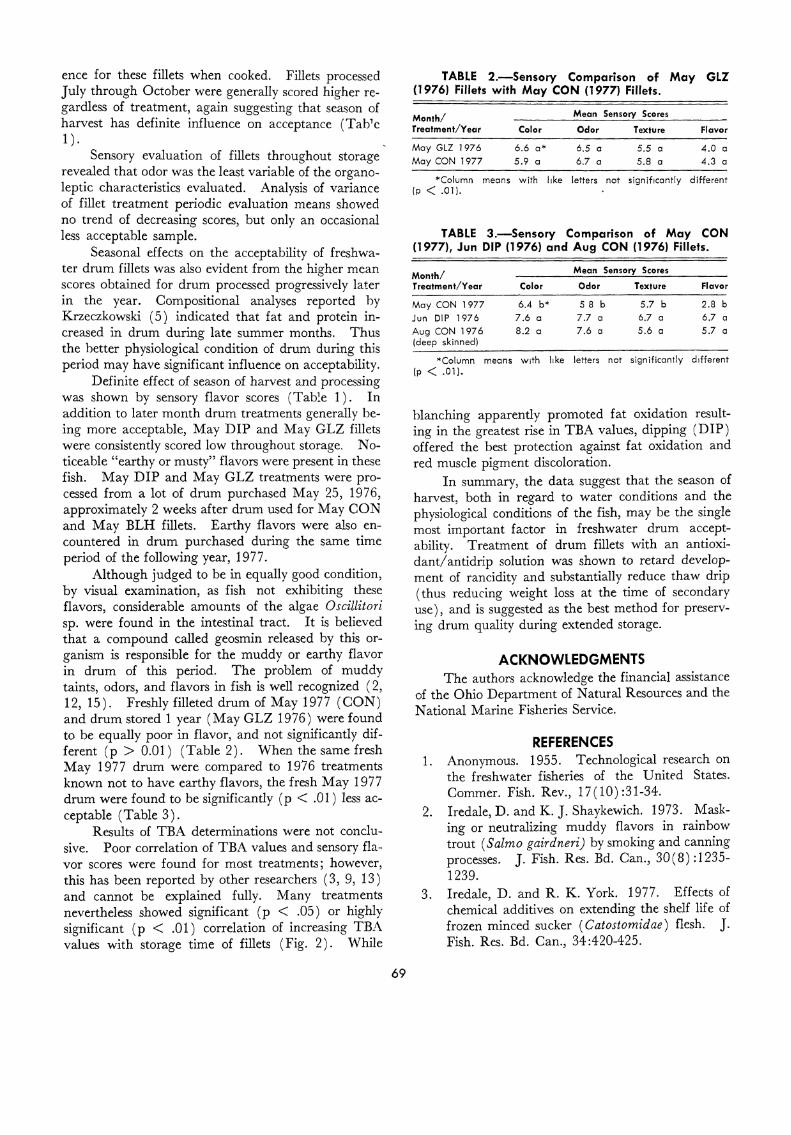
ence for these fillets when cooked. Fillets processed July through October were generally scored higher regardless of treatment, again suggesting that season of harvest has definite influence on acceptance (Tab1c 1 ) .
Sensory evaluation of fillets throughout storage revealed that odor was the least variable of the organoleptic characteristics evaluated. Analysis of variance of fillet treatment periodic evaluation means showed no trend of decreasing scores, but only an occasional less acceptable sample.
Seasonal effects on the acceptability of freshwater drum fillets was also evident from the higher mean scores obtained for drum processed progressively later in the year. Compositional analyses reported by Krzeczkowski ( 5) indicated that fat and protein increased in drum during late summer months. Thus the better physiological condition of drum during this period may have significant influence on acceptability.
Definite effect of season of harvest and processing was shown by sensory flavor scores (Tab~e 1). In addition to later month drum treatments generally being more acceptable, May DIP and May GLZ fillets were consistently scored low throughout storage. Noticeable "earthy or musty" flavors were present in these fish. May DIP and May GLZ treatments were processed from a lot of drum purchased May 25, 1976, approximately 2 weeks after drum used for May CON and May BLH fillets. Earthy flavors were also encountered in drum purchased during the same time period of the following year, 1977.
Although judged to be in equally good condition, by visual examination, as fish not exhibiting these flavors, considerable amounts of the algae Oscillitori sp. were found in the intestinal tract. It is believed that a compound called geosmin released by this organism is responsible for the muddy or earthy flavor in drum of this period. The problem of muddy taints, odors, and flavors in fish is well recognized ( 2, 12, 15). Freshly filleted drum of May 1977 (CON) and drum stored 1 year (May GLZ 1976) were found to be equally poor in flavor, and not significantly different (p > 0.01) (Table 2). When the same fresh May 1977 drum were compared to 1976 treatments known not to have earthy flavors, the fresh May 1977 drum were found to be significantly (p < .01) less acceptable (Table 3) .
Results of TBA determinations were not conclusive. Poor correlation of TBA values and sensory flavor scores were found for most treatments; however, this has been reported by other researchers (3, 9, 13) and cannot be explained fully. Many treatments nevertheless showed significant (p < .05) or highly significant ( p < .01) correlation of increasing TBA values with storage time of fillets (Fig. 2). While
69
TABLE 2.-Sensory Comparison of May GLZ (l 976) Fillets with May CON (l 977) Fillets.
Month/ Mean Sensory Scores
Treatment/Year Color Odor Texture Flavor
May GLZ 1976 6.6 a* 6.5 a 5.5 a 4.0 a Moy CON 1977 5.9 a 6.7 a 5.8 a 4.3 a
*Column means with like letters not significantly different (p < .01).
TABLE 3.-Sensory Comparison of May CON (l 977), Jun DIP (1976) and Aug CON (1976) Fillets.
Month/ Mean Sensory Scores
Treatment/Year Color Odor Texture Flavor
May CON 1977 6.4 b* 5 8 b 5.7 b 2.8 b Jun DIP 1976 7.6 a 7.7 a 6.7 a 6.7 a Aug CON 1976 8.2 a 7.6 a 5.6 a 5.7 a (deep skinned)
*Column means with like letters not significantly different (p < .01).
blanching apparently promoted fat oxidation resulting in the greatest rise in TBA values, dipping (DIP) offered the best protection against fat oxidation and red muscle pigment discoloration.
In summary, the data suggest that the season of harvest, both in regard to water conditions and the physiological conditions of the fish, may be the single most important factor in freshwater drum acceptability. Treatment of drum fillets with an antioxidant/antidrip solution was shown to retard development of rancidity and substantially reduce thaw drip (thus reducing weight loss at the time of secondary use), and is suggested as the best method for preserving drum quality during extended storage.
ACKNOWLEDGMENTS The authors acknowledge the financial assistance
of the Ohio Department of Natural Resources and the National Marine Fisheries Service.
REFERENCES 1. Anonymous. 1955. Technological research on
the freshwater fisheries of the United States. Commer. Fish. Rev., 17(10):31-34.
2. Iredale, D. and K. J. Shaykewich. 1973. Masking or neutralizing muddy flavors in rainbow trout (Salmo gairdneri) by smoking and canning processes. J. Fish. Res. Bd. Can., 30 ( 8) : 1235-1239.
3. Iredale, D. and R. K. York. 1977. Effects of chemical additives on extending the shelf life of frozen minced sucker ( Catostomidae) flesh. J. Fish. Res. Bd. Can., 34:420-425.

2.5
2.0
1.5
0.5
o.o
1.5
1.0 . ~ ~ ~ 0.5
o.o
4' 6
MONTHS OF STO RAGE 8 10
6
FIG. 2.-Effects of t MONTHS OF STORAGE 8 s orage r ime on rancidity dev I e opment (TBA) . m selected fresh
2 4 10
70
12
12
MAY BLH
APR BLH LGE
OCT BLH
JUL BLH APR BLH SML
SEP BLH
AUG GLZ SML
SEP CON AUG CON LGE
SEP GLZ
AUG GLZ SML AUG DIP LGE
water drum fillet treatment s.

4. King, F. J. 1976. Procedures for cooking seafood products. J. AOAC, 59( 1) :225-226.
5. Krzeczkowski, R. 1970. Fea<>ibility of usmg Tennessee River fish for fishery products. Fish. Ind. Res., 6(3) :93-101.
6. Martin, S. 1977. Frozen seafoods rang up $4.38 billion in 1976, an unprecedented 54% gain. Quick Frozen Foods, 40(2) :40-43, 46.
7. Medsker, L. L., D. Jenkins, and J. F. Thomas. 1968. Odorous compounds in natural water. An earthy-smelling compound associated with blue-green algae and actinomycetes. Environ. Sci. Technol., 2:461-464.
8. Miyauchi, D. 1963. Drip formation in fish. 1. A review of factors affecting drip. J. Fish. Ind. Res., 2(2) :13-20.
9. Pohle, W. D., R. L. Gregory, and B. VanGreesen. 1964. Relationship of peroside value and thiobarbituric acid value to development of undesirable flavor characteristics in fats. J. AOCS, 41 :649-650.
10. Scholl, R. 1976. Personal communication.
71
11. Tarladgis, B. G., A. M. Pearson, and L. R. Dugan, Jr. 1964. Chemistry of the 2-thioharbituric acid test for determination of oxidative rancidity in food. II. Formation of the TBAmalonaldehyde complex without add-heat treatment. J. Sci. Food Agr., 15 :602.
12. Thaysen, A. C. 1936. The origin of an earthy or muddy taint in fish. I. The nature and isolation of the taint. Ann. Appl. Biol., 23 :99-104.
13. Turner, E. W., W. D. Paynter, E. J. Montie, M. W. Bessert, G. M. Struck, and F. C. Olson. 1954. Use of the 2-thiobarbituric acid reagent to measure rancidity in frozen pork. Food Technol., 8(7) :326-330.
14. Yu, T. C. and R. 0. Sinnhuber. 1967. An improved 2-thiobarbituric acid (TBA) procedure for the measurement of autoxidation in fish oils. J. AOCS, 44(4) :256-258.
15. Yurkowski, M. and J. L. Tabachek. 1973. Identification, analysis and removal of geosmin from muddy flavored trout. J. Fish. Res. Bd. Can., 31 ( 12) :1851-1858.

7~ State '74- ~ ~ /4-1t //~t 61<~ ad'!)~
GREEN SPRINGS CROPS RESEARCH UNIT
• NORTHWESTERN • BRANCH MUCK CROPS•
BRANCH
i ' : \
WOOSTER
~ , CENTER
HEADQUARTERS
MAHONING CO. FARMe
NORTH APPALACHIAN EXPERIMENTAL WATERSHED•
1 •POMERENE FOREST
WESTERN e BRANCH ,
COLUMBUS
• THE OHIO STATE UNIVERSITY
JACKSON• BRANCH
Ohio's major soil types and climatic conditions are represented at the Research Center's 12 locations.
Research is conducted by 15 departments on more than 7000 acres at Center headquarters in Wooster, seven branches, Green Springs Crops Research Unit, Pomerene Forest Laboratory, North Appalachian Experimental Watershed, and The Ohio State University. Center Headquarters, Wooster, Wayne
County: 1953 acres Eastern Ohio Resource Development Cen
ter, Caldwell, Noble County: 2053 acres
Green Springs Crops Research Unit, Green Springs, Sandusky County: 26 acres
- LABORATORY
I '
EASTERN OHIO RESOURCE DEVELOPMENT CENTER
•
Jackson Branch, Jackson, Jackson County: 502 acres
Mahoning County Farm, Canfield: 275 acres
Muck Crops Branch, Willard, Huron County: 15 acres
North Appalachian Experimental Watershed, Coshocton, Coshocton County: 1047 acres (Cooperative with Agricultural Research Service, U. S. Dept. of Agriculture)
Northwestern Branch, Hoytville, Wood County: 247 acres
Pomerene Forest Laboratory, Coshocton County: 227 acres
Southern Branch, Ripley, Brown County: 275 acres
Western Branch, South Charleston, Clark County: 428 acres