Food Patterns Equivalents Database 2007-08 - … Patterns Equivalents Database ... Determination of...
111
Food Patterns Equivalents Database 2009-10: Methodology and User Guide Shanthy A. Bowman, John C. Clemens, Rachel C. Thoerig, James E. Friday, Miyuki Shimizu, and Alanna J. Moshfegh August 2013 U.S. Department of Agriculture Agricultural Research Service Beltsville Human Nutrition Research Center Food Surveys Research Group 10300 Baltimore Avenue Beltsville, Maryland
-
Upload
nguyenlien -
Category
Documents
-
view
250 -
download
1
Transcript of Food Patterns Equivalents Database 2007-08 - … Patterns Equivalents Database ... Determination of...
Food Patterns Equivalents Database 2009-10: Methodology and User Guide
Shanthy A. Bowman, John C. Clemens, Rachel C. Thoerig, James E. Friday, Miyuki Shimizu, and Alanna J. Moshfegh
August 2013
U.S. Department of Agriculture Agricultural Research Service
Beltsville Human Nutrition Research Center Food Surveys Research Group
10300 Baltimore Avenue Beltsville, Maryland
2 Suggested citation: Bowman SA, Clemens JC, Thoerig RC, Friday JE, Shimizu M, and Moshfegh AJ. 2013. Food Patterns Equivalents Database 2009-10: Methodology and User Guide [Online]. Food Surveys Research Group, Beltsville Human Nutrition Research Center, Agricultural Research Service, U.S. Department of Agriculture, Beltsville, Maryland. Available at: http://www.ars.usda.gov/ba/bhnrc/fsrg
Acknowledgements
We gratefully acknowledge the following individuals (alphabetical list) for reviewing the FPED 2009-10 Methodology and User Guide, associated mean intake tables, and databases:
Patricia Britten, Nutritionist, Nutrition Guidance and Analysis Division, Center for Nutrition Policy and Promotion, United States Department of Agriculture, Alexandria, VA;
Kristin Koegel, Nutritionist, Center for Nutrition Policy and Promotion, Alexandria, VA;
Susan Krebs-Smith, Chief, Risk Factor Monitoring and Methods Branch, National Cancer Institute, Bethesda, MD;
Jill Reedy, Nutritionist, Risk Factor Monitoring and Methods Branch, National Cancer Institute, Bethesda, MD.
We express our deep appreciation to the following USDA and HHS organizations for the partial funding of the FPED 2009-10 project. USDA, Center for Nutrition Policy and Promotion Centers for Disease Control and Prevention Food and Drug Administration NIH, Office of the Director NIH, National Cancer Institute NIH, National Institute of Child Health and Human Development NIH, National Heart, Lung, and Blood Institute NIH, Division of Nutrition Research Coordination

3 Disclaimers
The use of trade, firm, or corporation names in this database and documentation is for the information and convenience of the reader. Such use does not constitute an official endorsement or approval by the United States Department of Agriculture or the Agricultural Research Service of any product or service to the exclusion of others that may be suitable.
The U.S. Department of Agriculture (USDA) prohibits discrimination in all its programs and activities on the basis of race, color, national origin, age, disability, and where applicable, sex, marital status, familial status, parental status, religion, sexual orientation, genetic information, political beliefs, reprisal, or because all or a part of an individual’s income is derived from any public assistance program. (Not all prohibited bases apply to all programs.) Persons with disabilities who require alternative means for communication of program information (Braille, large print, audiotape, etc.) should contact USDA's TARGET Center at (202) 720-2600 (voice and TDD).
To file a complaint of discrimination, write USDA, Director, Office of Civil Rights, 1400 Independence Avenue, S.W., Washington, D.C. 20250-9410 or call (800) 795-3272 (voice) or (202) 720-6382 (TDD). USDA is an equal opportunity provider and employer.

4
Glossary of Abbreviations
Abbreviation Full Name
ARS Agricultural Research Service
BHNRC Beltsville Human Nutrition Research Center
CDC Centers for Disease Control and Prevention
CNPP Center for Nutrition Policy and Promotion
DGA Dietary Guidelines for Americans
Cup eq. Cup equivalents
FDA Food and Drug Administration
FP Food Patterns
FPE Food Patterns Equivalents
FPED Food Patterns Equivalents Database
FPID Food Patterns Equivalents Ingredients Database
FNDDS Food and Nutrient Database for Dietary Studies
FSRG Food Surveys Research Group
HHS United States Department of Health and Human Services
MPED MyPyramid Equivalents Database
NCHS National Center for Health Statistics
NCI National Cancer Institute
NHANES National Health and Nutrition Examination Survey
NIH National Institutes for Health
Oz. eq. Ounce equivalents
SAS® Statistical Analysis System
Tsp. eq. Teaspoon equivalents
USDA United States Department of Agriculture
WWEIA What We Eat in America
5
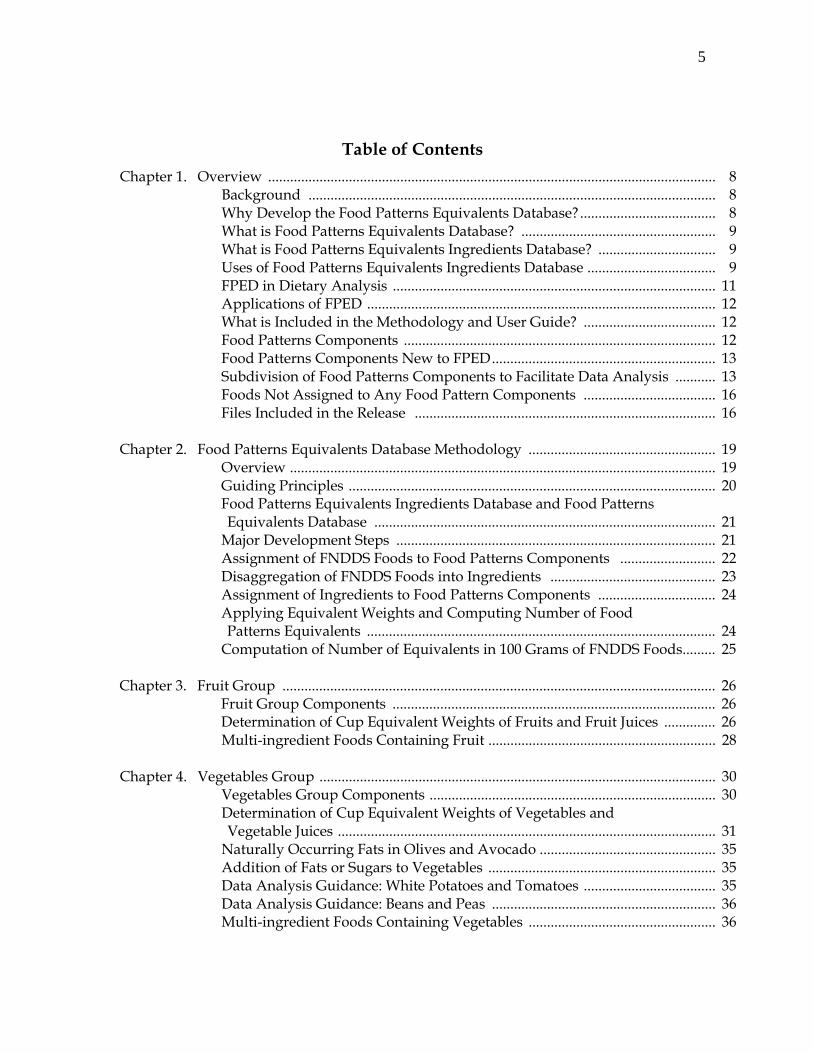
Table of Contents
Chapter 1. Overview .......................................................................................................................... 8 Background ............................................................................................................... 8 Why Develop the Food Patterns Equivalents Database? ..................................... 8 What is Food Patterns Equivalents Database? ..................................................... 9 What is Food Patterns Equivalents Ingredients Database? ................................ 9 Uses of Food Patterns Equivalents Ingredients Database ................................... 9 FPED in Dietary Analysis ........................................................................................ 11 Applications of FPED ............................................................................................... 12 What is Included in the Methodology and User Guide? .................................... 12 Food Patterns Components ..................................................................................... 12 Food Patterns Components New to FPED ............................................................. 13 Subdivision of Food Patterns Components to Facilitate Data Analysis ........... 13 Foods Not Assigned to Any Food Pattern Components .................................... 16 Files Included in the Release .................................................................................. 16 Chapter 2. Food Patterns Equivalents Database Methodology ................................................... 19 Overview .................................................................................................................... 19 Guiding Principles .................................................................................................... 20 Food Patterns Equivalents Ingredients Database and Food Patterns Equivalents Database ............................................................................................. 21 Major Development Steps ....................................................................................... 21 Assignment of FNDDS Foods to Food Patterns Components .......................... 22 Disaggregation of FNDDS Foods into Ingredients ............................................. 23 Assignment of Ingredients to Food Patterns Components ................................ 24 Applying Equivalent Weights and Computing Number of Food Patterns Equivalents ............................................................................................... 24 Computation of Number of Equivalents in 100 Grams of FNDDS Foods ......... 25 Chapter 3. Fruit Group ...................................................................................................................... 26 Fruit Group Components ........................................................................................ 26 Determination of Cup Equivalent Weights of Fruits and Fruit Juices .............. 26 Multi-ingredient Foods Containing Fruit .............................................................. 28 Chapter 4. Vegetables Group ............................................................................................................ 30 Vegetables Group Components .............................................................................. 30 Determination of Cup Equivalent Weights of Vegetables and Vegetable Juices ....................................................................................................... 31 Naturally Occurring Fats in Olives and Avocado ................................................ 35 Addition of Fats or Sugars to Vegetables .............................................................. 35 Data Analysis Guidance: White Potatoes and Tomatoes .................................... 35 Data Analysis Guidance: Beans and Peas ............................................................. 36 Multi-ingredient Foods Containing Vegetables ................................................... 36
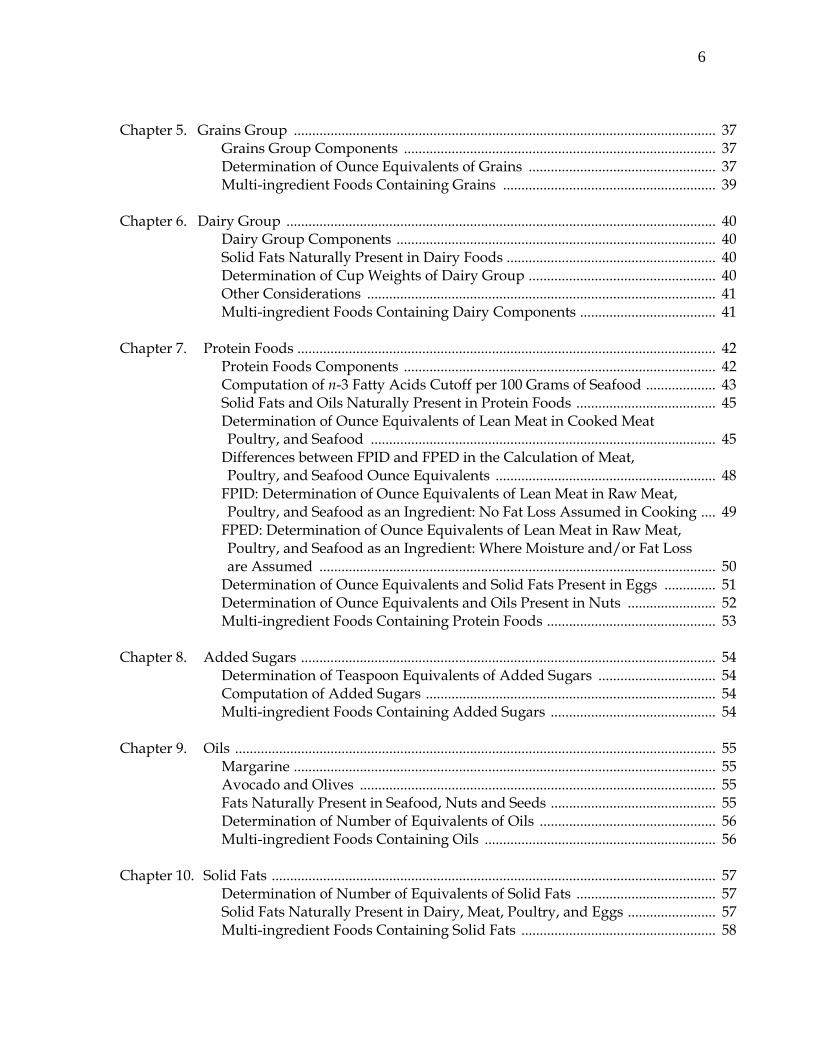
6 Chapter 5. Grains Group ................................................................................................................... 37 Grains Group Components ..................................................................................... 37 Determination of Ounce Equivalents of Grains ................................................... 37 Multi-ingredient Foods Containing Grains .......................................................... 39 Chapter 6. Dairy Group ..................................................................................................................... 40 Dairy Group Components ....................................................................................... 40 Solid Fats Naturally Present in Dairy Foods ......................................................... 40 Determination of Cup Weights of Dairy Group ................................................... 40 Other Considerations ............................................................................................... 41 Multi-ingredient Foods Containing Dairy Components ..................................... 41
Chapter 7. Protein Foods .................................................................................................................. 42 Protein Foods Components ..................................................................................... 42 Computation of n-3 Fatty Acids Cutoff per 100 Grams of Seafood ................... 43 Solid Fats and Oils Naturally Present in Protein Foods ...................................... 45 Determination of Ounce Equivalents of Lean Meat in Cooked Meat Poultry, and Seafood .............................................................................................. 45 Differences between FPID and FPED in the Calculation of Meat, Poultry, and Seafood Ounce Equivalents ............................................................ 48 FPID: Determination of Ounce Equivalents of Lean Meat in Raw Meat, Poultry, and Seafood as an Ingredient: No Fat Loss Assumed in Cooking .... 49 FPED: Determination of Ounce Equivalents of Lean Meat in Raw Meat, Poultry, and Seafood as an Ingredient: Where Moisture and/or Fat Loss are Assumed ............................................................................................................ 50 Determination of Ounce Equivalents and Solid Fats Present in Eggs .............. 51 Determination of Ounce Equivalents and Oils Present in Nuts ........................ 52 Multi-ingredient Foods Containing Protein Foods .............................................. 53 Chapter 8. Added Sugars ................................................................................................................. 54 Determination of Teaspoon Equivalents of Added Sugars ................................ 54 Computation of Added Sugars ............................................................................... 54 Multi-ingredient Foods Containing Added Sugars ............................................. 54 Chapter 9. Oils ................................................................................................................................... 55 Margarine ................................................................................................................... 55 Avocado and Olives ................................................................................................. 55 Fats Naturally Present in Seafood, Nuts and Seeds ............................................. 55 Determination of Number of Equivalents of Oils ................................................ 56 Multi-ingredient Foods Containing Oils ............................................................... 56 Chapter 10. Solid Fats ......................................................................................................................... 57 Determination of Number of Equivalents of Solid Fats ...................................... 57 Solid Fats Naturally Present in Dairy, Meat, Poultry, and Eggs ........................ 57 Multi-ingredient Foods Containing Solid Fats ..................................................... 58

7 Chapter 11. Alcoholic Drinks ............................................................................................................ 59 Determination of Number of Drinks ...................................................................... 59 Multi-ingredient Foods Containing Alcohol (Ethanol) ....................................... 60 References ..................................................................................................................................... 61 Appendix 1: List of Foods included in the Food Patterns Components, Units, and FPED/FPID Variable Names in Parenthesis ....................................................... 63 Appendix 2: Connecting MPED 2.0 and FPED Variables .......................................................... 71 Appendix 3: Food Patterns Equivalents Ingredients Database (FPID) Variables .................. 73 Appendix 4: Food Patterns Equivalents Database (FPED) Variables ...................................... 75 Appendix 5: Food Patterns Equivalents Intake Files per Food per Individual for Day 1 and Day 2: Number of Observations and Variables .......................................... 77 Appendix 6: Total Food Patterns Equivalents Intakes Files per Individual for Day 1 and Day 2: Number of Observations and Variables .......................................... 81 Appendix 7: SAS Program for Calculating Mean Intakes of Food Patterns Equivalents
for the Thirty-Seven Components .......................................................................... 85 Appendix 8: Fruit Cup Equivalent Weights ................................................................................ 94 Appendix 9: Vegetable Cup Equivalent Weights ....................................................................... 98 Appendix 10: Dairy Cup Equivalent Weights ............................................................................... 107 Appendix 11: Beans and Peas (Legumes) Cup Equivalent Weights .......................................... 110

8 Chapter 1
Overview Background
The Dietary Guidelines for Americans (DGA) have been updated in 2010 [1] and translated into messages and tips for making healthful food choices [2]. The DGA 2010 formed the basis for revisions to the U.S. Department of Agriculture (USDA) Food Patterns (FP). The Food Patterns provide calorie-based dietary guidance on how much Americans should eat from each of the FP components such as Fruit, Vegetables, Grains, Protein Foods, Dairy, and Oils to have a healthful diet, while simultaneously placing limits on the amounts of added sugars, solid fats, and alcoholic drinks that can be consumed.
The Federal Government, as part of its ongoing nutrition monitoring and surveillance activities conducts the What We Eat in America (WWEIA) survey, which is the dietary intake component of the National Health and Nutrition Examination Survey (NHANES) [3]. The WWEIA, NHANES is a continuous survey and is conducted by the U.S. Department of Agriculture (USDA) and the U.S. Department of Health and Human Services (HHS). The survey uses 24-hour dietary recall method to collect data on the types and amounts of foods and beverages Americans report that they consume. The Food and Nutrient Database for Dietary Studies 5 (FNDDS 5) [4] provides nutrient composition of the 7,000+ foods and beverages in WWEIA, NHANES [3]. In order to monitor whether Americans meet the recommendations of the DGA 2010, the foods in FNDDS must be first converted to the respective number of FP equivalents present in them.
Why Develop the Food Patterns Equivalents Database?
Single ingredient FNDDS foods such as orange juice, baked potato, cooked rice, baked fish, or skim milk can be directly assigned to Fruit, Vegetables, Grains, Protein Foods, and Dairy components, respectively. However, many of the FNDDS foods such as pizza, sandwich, fruit salad, chocolate milk shake, fried eggs, and casserole are multi-ingredient foods consisting of ingredients that are from more than one FP component. Hence, it is necessary to disaggregate multi-ingredient foods to ingredients that can be assigned to an FP component before computing the amount of FP equivalents present in the food. The Food Patterns Equivalents Database (FPED) serves this purpose by converting foods that are in the forms reported consumed to appropriate Food Patterns equivalents amounts, thereby providing means to assess the adherence of American diets to the DGA recommendations.

9 What is Food Patterns Equivalents Database?
Food Patterns Equivalents Database is the new name for the former MyPyramid Equivalents Database (MPED) [5] developed by USDA, Agricultural Research Service (ARS), Food Surveys Research Group (FSRG). The FPED converts FNDDS foods to the respective number of cup equivalents of Fruit, Vegetables, and Dairy; ounce equivalents of Grains and Protein Foods; number of Alcoholic Drinks; teaspoon equivalents of Added Sugars; and gram equivalents of Solid Fats and Oils. Foods in FNDDS 5 are disaggregated to ingredients that can be directly assigned to one of the FP components. Additionally, protein foods are further disaggregated to lean fraction and fat. Meat and poultry are disaggregated to lean meat and solid fat fractions; dairy foods to low fat fraction, similar to skim milk, and solid fat fraction; and seafood and nuts to lean and oil fractions. In addition, the FPED release includes a Food Patterns Equivalents Ingredients Database (FPID) that is similar to FPED for the unique ingredients of FNDDS foods. A few applications of FPID are described in this section.
What is Food Patterns Equivalents Ingredients Database?
The FNDDS SR-Links file includes data on the ingredients and the amounts present in each of the FNDDS foods (includes beverages). A majority of the FNDDS 5 foods are multi-ingredient and are composed of various combinations of about 2800+ Standard Reference (SR) foods that form the unique ingredients of FNDDS 5 foods. For the first time, a separate database named Food Patterns Equivalents Ingredients Database (FPID) has been developed for these unique ingredients. The FP equivalent amounts of FPID ingredients are then applied to foods in the FNDDS SR-links file to create FPED. Details on FPID and FPED development are described in the later sections. The methodology for the development of FPED and FPID are essentially the same. The FPED includes the amounts of the 37 FP components per 100 grams of each of the FNDDS foods, and FPID includes the amounts of the 37 FP components per 100 grams of each of the unique ingredients of FNDDS foods. Uses of Food Patterns Equivalents Ingredients Database The FPID has the potential for many research, economic, and policy applications. A few of the major applications of FPID are listed below.
• Because FPID is ingredient-based, it can be used to estimate the amount of FP components present in foods in general, where recipes are available. FPID serves as a tool to estimate the amounts of FP components consumed by participants of dietary studies. Additionally, because FPID is used to create FPED for foods reported in the national dietary surveys, the dietary

10
status of the study populations is comparable to that of the national population.
• FPID in combination with ARS Food Intakes Converted to Retail Commodities Databases (FICRCDs) [6] can be used to estimate the amounts of raw, frozen, or canned fruits and vegetables commodities to be purchased to meet the DGA recommendations. To estimate the amounts of raw fruits and vegetables to be purchased, it is necessary to convert fruits and vegetables from their consumed forms to purchased forms, which include peel, seeds and other refuse. FICRCDs include conversion factors that convert fruits and vegetable from consumed forms to purchased forms. FICRCDs also include conversion factors to convert cooked grains, legumes, meat, poultry, and fish to their respective uncooked or raw forms. Appendices 8-11 of this document [FPED 2009-10 Methodology and User Guide] include the weights of 1 cup equivalents for many fruits, vegetables, and dairy foods that are ingredients of FNDDS foods.
• The FPID can serve as a resource for estimating the cost of meeting DGA recommendations for fruits and vegetable and other food commodities. By pricing the commodities, the cost (price) of nutritious food choices can be estimated.
The following two examples illustrate the use of FPID cup equivalent weights and FICRCD conversion factors in combination to estimate: (1) the amount of raw broccoli and cantaloupe commodities to be purchased to obtain one cup equivalent of each; (2) the cost (price) of one cup equivalent of raw broccoli and cantaloupe; and (3) the number of cup equivalents of raw broccoli and cantaloupe present in 1 pound of respective commodities (1lb=454 grams). Raw Broccoli 1 cup equivalent of broccoli (from FPID) =80g
Conversion factor for raw broccoli (from FICRCD) =1.64 i.e., 164 grams of raw broccoli commodity purchased will yield 100 grams of raw, edible portion.
(1) 1 cup equivalent of broccoli, edible portion
=80x1.64=131g of raw broccoli commodity 131 grams raw broccoli commodity =131/454=0.29 lb Or, 0.29 lb of raw broccoli commodity will yield 1 cup equivalent of raw broccoli (edible portion)
(2) Price of 1 lb raw broccoli commodity =$1.70 Price of 0.29 lb raw broccoli commodity =$(1.70x0.29) =$0.49 Price of 1 cup equivalent of raw broccoli is $0.49

11
(3) 1 lb raw broccoli commodity =[(454/80)/1.64] cup eq.
=3.46 =3.5 cup eq. i.e., 1 pound of raw broccoli commodity will yield 3.5 cup eq. of raw broccoli (edible portion).
Cantaloupe
1 cup equivalent of cantaloupe (from FPID) =170g Conversion factor for cantaloupe (from FICRCD) =1.96g i.e., 196 grams of raw cantaloupe commodity purchased will yield 100 grams of raw, edible portion.
(1) 1 cup equivalent of cantaloupe, edible portion =1.96x170=333g of raw cantaloupe commodity 333 grams of raw cantaloupe commodity =333/454=0.73 lb Or, 0.73 lb of raw cantaloupe commodity will yield 1 cup equivalent of cantaloupe (edible portion)
(2) Price of 1 lb raw cantaloupe commodity =$1.00 Price of 0.73 lb raw cantaloupe commodity =$(1.00x0.73) =$0.73 Price of 1 cup equivalent of cantaloupe is $0.73
(3) 1 lb raw cantaloupe commodity =[(454/170)/1.96] cup eq. =1.36=1.4 cup eq.
i.e., 1 pound of raw cantaloupe commodity will yield 1.4 cup equivalent of cantaloupe (edible portion). Similar computations can be made for frozen and canned fruits and vegetables by applying appropriate conversion factors from FICRCD. Canned fruits and vegetables are assumed to contain 65% of gross weight as fruit and vegetables, respectively [6]. FPED in Dietary Analysis Many multi-ingredient foods such as pizza, soups, sandwiches, and salads are commonly consumed. The energy and nutrients obtained from these foods can be estimated without having to disaggregate these foods to their ingredients. Nutrient adequacy estimations can be done without requiring food disaggregation. However, if data analysis requires an assessment of diets with respect to the DGA recommendations, disaggregation of foods to appropriate FP components can be attained by applying FPED amounts.

12 Applications of FPED
The FPED has many important applications in Federal nutrition policies and in education programs. It is used to estimate mean and usual intakes of FP components by Americans and to evaluate whether Americans eat according to the DGA recommendations, by linking FPED with the appropriate WWEIA, NHANES dietary intake data. The FPED (as MPED) data files are also used as a source file for SuperTracker, a dietary assessment tool [7], Healthy Eating Index [8], and USDA Food Plans including the Thrifty Food Plan [9], to name a few. Federal agencies such as the USDA Economic Research Service, Center for Nutrition Policy and Promotion, Food and Nutrition Service, U.S. Department of Health and Human Services [10], National Cancer Institute [11], and the Centers for Disease Control and Prevention use the data to conduct epidemiological studies, surveillance, risk analysis, policy analysis and to develop dietary intervention programs and messages.
FPED can be used in dietary research, if the foods in the study can be directly linked to FNDDS food codes.
What is Included in the Methodology and User Guide?
It describes the methodology including, guiding principles and other decisions made in the development of FPID and FPED FP components, determination of FP equivalents for each component, and algorithms used in the computation of FP equivalents. It also includes descriptions of the data files and databases in FPED 2009-10 release.
Food Patterns Components
Table 1 includes the main FP components in FPED and their units of measurement.
Table 1. Units of Food Patterns Equivalents Database Components
Food Patterns Equivalents Database Main Components
Units of Measurement
Fruits Cup equivalents Vegetables Cup equivalents Grains Ounce equivalents Dairy Cup equivalents Protein Foods Ounce equivalents Added Sugars Teaspoon equivalents Oils Gram equivalents Solid Fats Gram equivalents Alcoholic Drinks Number of drinks

13 Food Patterns Components New to FPED FPED includes new components that are not in MPED
• Fruit juice has been separated into a separate Fruit Juice component. • The Red and Orange Vegetables component includes tomatoes and other
red and orange colored vegetables.
Additionally, names of some of the components common to FPED and MPED have changed so as to be consistent with DGA 2010. Meat, poultry, fish, eggs, nuts, seeds, soy products are included in the Protein Foods components. The Fish component in MPED is named Seafood in FPED. The Cured Meat component includes frankfurters, sausages, and luncheon meats that are made from beef, pork, or poultry and replaces M_Frank component of MPED. Subdivision of Food Patterns Components to Facilitate Data Analysis
In FPED, many of the Food Patterns main components are further subdivided so as to facilitate in-depth data analysis. The Red and Orange Vegetable component is subdivided into Tomatoes and Other Red and Orange Vegetables; the Starchy Vegetable component is subdivided into Potatoes (white potatoes) and Other Starchy Vegetables; the Meat, Poultry, and Seafood component is subdivided into Meat, Poultry, Organ Meat, Cured Meat, Seafood high in n-3 fatty acids, and Seafood low in n-3 fatty acids.
Because beans and peas (legumes) can be considered as vegetables as well as protein foods, the Beans and Peas component is computed both ways, thereby providing flexibility to users to place beans and peas in either of the two components, but not in both simultaneously. Frankfurters, sausages, and luncheon meat that are made from beef, pork, or poultry are placed in Cured Meat component because of the way they are processed. Organ meat is a separate component in FPED.
Table 2 lists the 37 FP components and includes a brief description of foods included in the components.
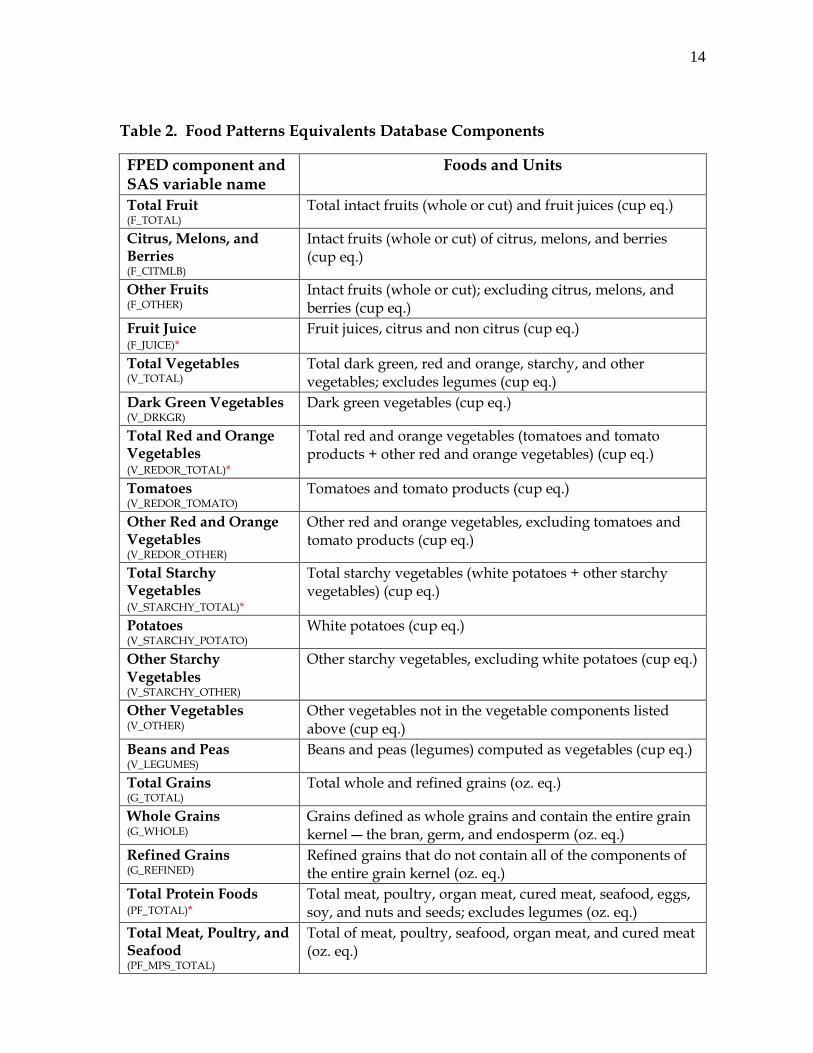
14 Table 2. Food Patterns Equivalents Database Components
FPED component and SAS variable name
Foods and Units
Total Fruit (F_TOTAL)
Total intact fruits (whole or cut) and fruit juices (cup eq.)
Citrus, Melons, and Berries (F_CITMLB)
Intact fruits (whole or cut) of citrus, melons, and berries (cup eq.)
Other Fruits (F_OTHER)
Intact fruits (whole or cut); excluding citrus, melons, and berries (cup eq.)
Fruit Juice (F_JUICE)*
Fruit juices, citrus and non citrus (cup eq.)
Total Vegetables (V_TOTAL)
Total dark green, red and orange, starchy, and other vegetables; excludes legumes (cup eq.)
Dark Green Vegetables (V_DRKGR)
Dark green vegetables (cup eq.)
Total Red and Orange Vegetables (V_REDOR_TOTAL)*
Total red and orange vegetables (tomatoes and tomato products + other red and orange vegetables) (cup eq.)
Tomatoes (V_REDOR_TOMATO)
Tomatoes and tomato products (cup eq.)
Other Red and Orange Vegetables (V_REDOR_OTHER)
Other red and orange vegetables, excluding tomatoes and tomato products (cup eq.)
Total Starchy Vegetables (V_STARCHY_TOTAL)*
Total starchy vegetables (white potatoes + other starchy vegetables) (cup eq.)
Potatoes (V_STARCHY_POTATO)
White potatoes (cup eq.)
Other Starchy Vegetables (V_STARCHY_OTHER)
Other starchy vegetables, excluding white potatoes (cup eq.)
Other Vegetables (V_OTHER)
Other vegetables not in the vegetable components listed above (cup eq.)
Beans and Peas (V_LEGUMES)
Beans and peas (legumes) computed as vegetables (cup eq.)
Total Grains (G_TOTAL)
Total whole and refined grains (oz. eq.)
Whole Grains (G_WHOLE)
Grains defined as whole grains and contain the entire grain kernel ― the bran, germ, and endosperm (oz. eq.)
Refined Grains (G_REFINED)
Refined grains that do not contain all of the components of the entire grain kernel (oz. eq.)
Total Protein Foods (PF_TOTAL)*
Total meat, poultry, organ meat, cured meat, seafood, eggs, soy, and nuts and seeds; excludes legumes (oz. eq.)
Total Meat, Poultry, and Seafood (PF_MPS_TOTAL)
Total of meat, poultry, seafood, organ meat, and cured meat (oz. eq.)
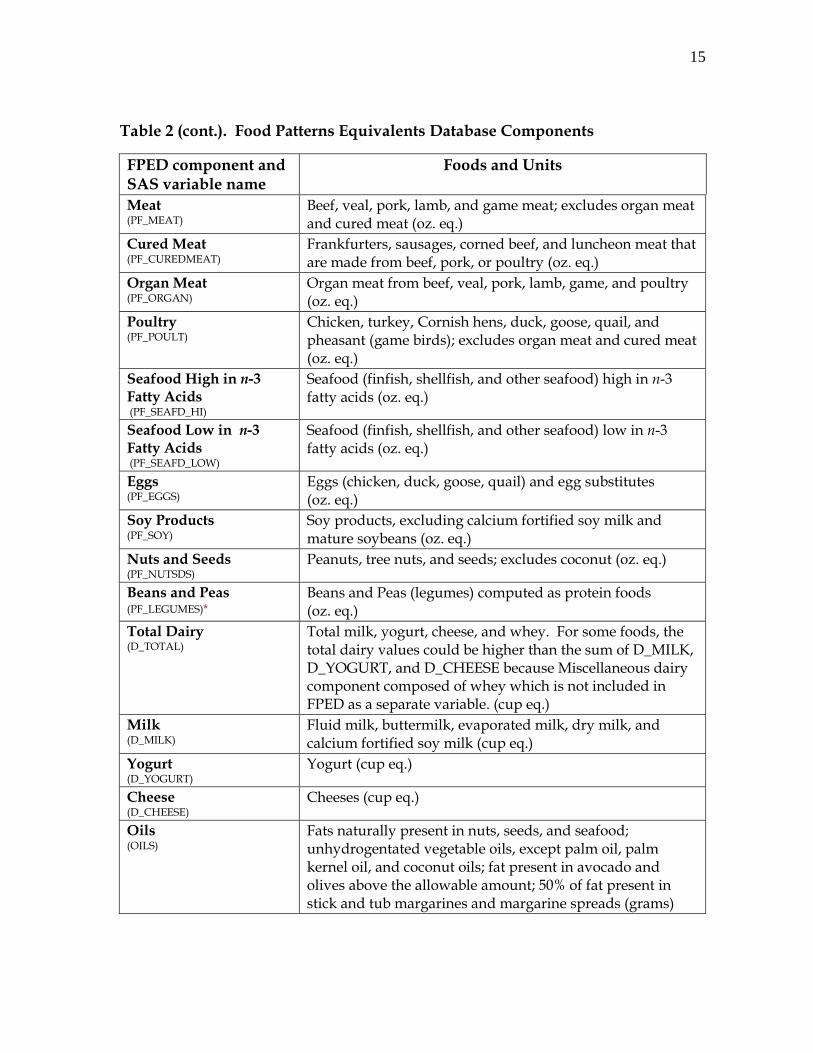
15 Table 2 (cont.). Food Patterns Equivalents Database Components
FPED component and SAS variable name
Foods and Units
Meat (PF_MEAT)
Beef, veal, pork, lamb, and game meat; excludes organ meat and cured meat (oz. eq.)
Cured Meat (PF_CUREDMEAT)
Frankfurters, sausages, corned beef, and luncheon meat that are made from beef, pork, or poultry (oz. eq.)
Organ Meat (PF_ORGAN)
Organ meat from beef, veal, pork, lamb, game, and poultry (oz. eq.)
Poultry (PF_POULT)
Chicken, turkey, Cornish hens, duck, goose, quail, and pheasant (game birds); excludes organ meat and cured meat (oz. eq.)
Seafood High in n-3 Fatty Acids (PF_SEAFD_HI)
Seafood (finfish, shellfish, and other seafood) high in n-3 fatty acids (oz. eq.)
Seafood Low in n-3 Fatty Acids (PF_SEAFD_LOW)
Seafood (finfish, shellfish, and other seafood) low in n-3 fatty acids (oz. eq.)
Eggs (PF_EGGS)
Eggs (chicken, duck, goose, quail) and egg substitutes (oz. eq.)
Soy Products (PF_SOY)
Soy products, excluding calcium fortified soy milk and mature soybeans (oz. eq.)
Nuts and Seeds (PF_NUTSDS)
Peanuts, tree nuts, and seeds; excludes coconut (oz. eq.)
Beans and Peas (PF_LEGUMES)*
Beans and Peas (legumes) computed as protein foods (oz. eq.)
Total Dairy (D_TOTAL)
Total milk, yogurt, cheese, and whey. For some foods, the total dairy values could be higher than the sum of D_MILK, D_YOGURT, and D_CHEESE because Miscellaneous dairy component composed of whey which is not included in FPED as a separate variable. (cup eq.)
Milk (D_MILK)
Fluid milk, buttermilk, evaporated milk, dry milk, and calcium fortified soy milk (cup eq.)
Yogurt (D_YOGURT)
Yogurt (cup eq.)
Cheese (D_CHEESE)
Cheeses (cup eq.)
Oils (OILS)
Fats naturally present in nuts, seeds, and seafood; unhydrogentated vegetable oils, except palm oil, palm kernel oil, and coconut oils; fat present in avocado and olives above the allowable amount; 50% of fat present in stick and tub margarines and margarine spreads (grams)

16 Table 2 (cont.). Food Patterns Equivalents Database Components
FPED component and SAS variable name
Foods and Units
Solid Fats (SOLID_FATS)
Fats naturally present in meat, poultry, eggs, and dairy (lard, tallow, and butter); hydrogenated or partially hydrogenated oils; shortening, palm, palm kernel and coconut oils; fats naturally present in coconut meat and cocoa butter; and 50% of fat present in stick and tub margarines and margarine spreads (grams)
Added Sugars (ADD_SUGARS)
Foods defined as added sugars (tsp. eq.)
Alcoholic Drinks (A_DRINKS)
Alcoholic beverages and alcohol (ethanol) added to foods after cooking (no. of drinks)
* New variable in FPED and not in MPED 2
Appendix 1 contains a detailed list of foods included in each of the 37 Food Patterns components in FPED. Appendix 2 lists the variables in MPED 2 and FPED, showing the connections between the variables in the two databases.
Foods Not Assigned to Any Food Patterns Components
A few of the FNDDS 5 foods are considered as non-FP components, because they contain a substantial proportion of ingredients that are not conventional FP components. These non-FP foods include infant formula and a few of the milk- or soy-based beverages that are meal supplements or protein supplements containing extensively processed ingredients such as hydrolyzed whey and soy products which are not FP foods. Other foods that are considered as non-FP components include broth, coconut water, cornstarch, black coffee without added sugars, human milk, leavening agents, lecithin, mustard, orange peel, salt, low-calorie or nonnutritive sweeteners, sugarless gums, soy sauce, tea without additions, vinegar, water, yeast extract, and spices such as celery seeds, cinnamon, cloves, cumin, curry powder, nutmeg, black and white pepper, poppy seeds, and powdered spices.
Files Included in the Release
The release includes
• Methodology and User Guide; • The amount of each of the 37 FP components present per 100 grams of each
of the FNDDS 5 foods (FPED) and their unique ingredients (FPID), in MS Access and SAS;

17
• The amount of each of the 37 FP components present in individual foods reported by each respondent on day 1 and day 2 of the survey, and respondents’ demographic information in SAS;
• Total amount of each of the 37 FP components reported by each respondent on day 1 and day 2 of the survey and respondents’ demographic information, in SAS;
• Four table sets containing estimates of mean intakes of the 37 FP components on day 1, by demographic groups; and
• SAS codes file to create mean intake estimates of FP components on day 1, by demographic groups.
The names of the files including the MS Access and SAS datasets that are released in FPED 2009-10 are listed in Table 3.
Table 3. List of files and datasets included in FPED 2009-10 release
Name of the file Information contained in the file fped_0910.pdf Food Patterns Equivalents Database 2009-10:
Methodology and User Guide with appendices on the foods included in each of the 37 FP component and cup weights for fruits, vegetables, and dairy.
fpid_0910.mdb Includes amounts of the 37 FP components present per 100 grams of the 2947 FNDDS 5 ingredients, in MS Access
fpid_0910.sas7bdat Includes amounts of the 37 FP components present per 100 grams of the 2947 FNDDS 5 ingredients, in SAS
fped_0910.mdb Includes amounts of the 37 FP components present per 100 grams of the 8190 FNDDS 5 foods, in MS Access
fped_0910.sas7bdat Includes amounts of the 37 FP components present per 100 grams of the 8190 FNDDS 5 foods, in SAS
fped_dr1iff_0910.sas7bdat Includes amount of each of the 37 FP components present in each of the foods reported by the respondents on day 1 and demographic variables. Total number of observations in the file= 150991. See Appendix 5 for the variables list.
fped_dr2iff_0910.sas7bdat Includes amount of each of the 37 FP components present in each of the foods reported by the respondents on day 2 and demographic variables. Total number of observations in the file= 129141. See Appendix 5 for the variables list.
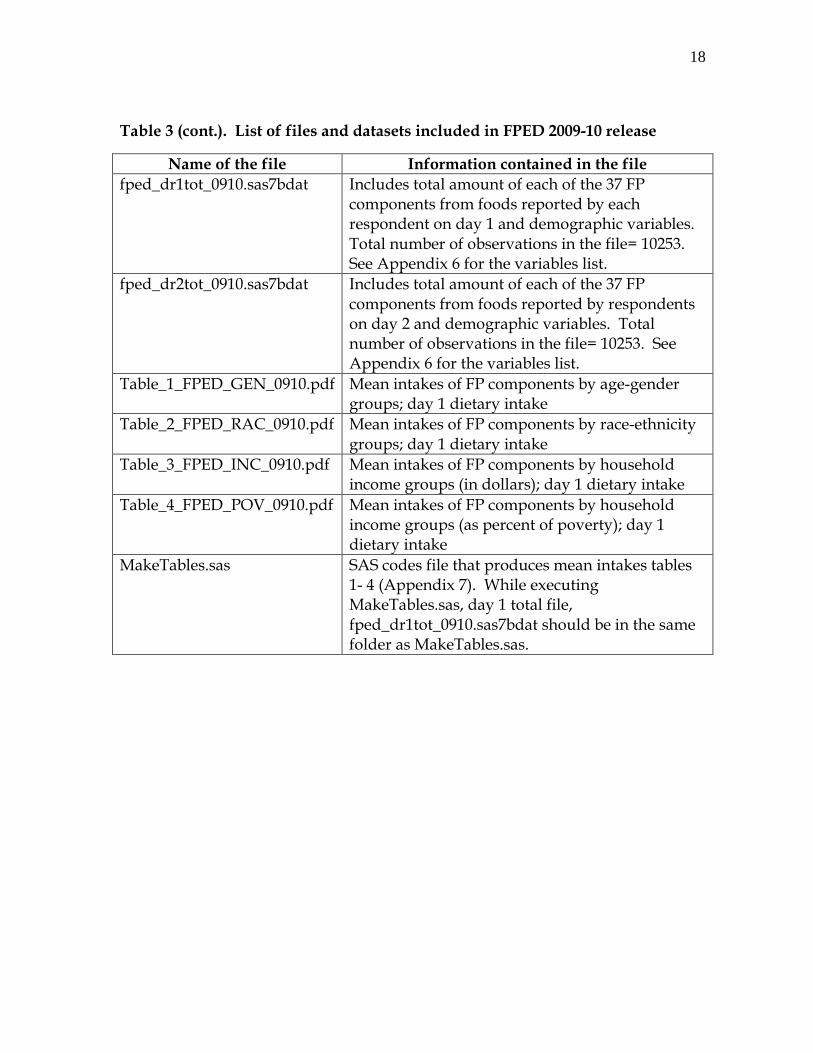
18 Table 3 (cont.). List of files and datasets included in FPED 2009-10 release
Name of the file Information contained in the file fped_dr1tot_0910.sas7bdat Includes total amount of each of the 37 FP
components from foods reported by each respondent on day 1 and demographic variables. Total number of observations in the file= 10253. See Appendix 6 for the variables list.
fped_dr2tot_0910.sas7bdat Includes total amount of each of the 37 FP components from foods reported by respondents on day 2 and demographic variables. Total number of observations in the file= 10253. See Appendix 6 for the variables list.
Table_1_FPED_GEN_0910.pdf Mean intakes of FP components by age-gender groups; day 1 dietary intake
Table_2_FPED_RAC_0910.pdf Mean intakes of FP components by race-ethnicity groups; day 1 dietary intake
Table_3_FPED_INC_0910.pdf Mean intakes of FP components by household income groups (in dollars); day 1 dietary intake
Table_4_FPED_POV_0910.pdf Mean intakes of FP components by household income groups (as percent of poverty); day 1 dietary intake
MakeTables.sas SAS codes file that produces mean intakes tables 1- 4 (Appendix 7). While executing MakeTables.sas, day 1 total file, fped_dr1tot_0910.sas7bdat should be in the same folder as MakeTables.sas.

19 Chapter 2
Food Patterns Equivalents Database Methodology Overview
The methodology used to develop the MPED has been revised in order to:
• Simplify FPED development • Apply consistent decisions across similar foods
Major differences between FPED and MPED methodology are:
• Consolidation of the weights of 1 cup equivalent of fruits such that similar types of fruits will have the same cup weights, with a few exceptions.
• Fruit juices form a separate component and are not included along with intact or whole fruit.
• Consolidation of the weights of 1 cup equivalent of vegetables such that similar types of vegetables will have the same cup weights, with a few exceptions.
• Definition of ounce equivalents of grains: For grain products such as breads, pancakes, waffles, muffins, and grain-based snacks made of flour, 16 grams of flour is used as the basis for defining one ounce equivalent of grains. Cooked grains such as cooked rice, pasta, and hot breakfast cereals are converted to uncooked form, and one ounce equivalent of grains is defined as 28.35 grams. No change has been made from the MPED definition of one ounce equivalent of grains (28.35 g) for ready-to-eat cereals.
• Inclusion of calcium fortified soy milk in the Dairy Group, as defined in the DGA 2010.
• Computation of added sugars equivalents using the sugar content of foods and ingredients that are defined as added sugars.
• Computation of the number of alcoholic drinks directly from the alcohol (ethanol) content of the beverages. One drink is defined as the amount of alcoholic beverage containing 0.6 fluid ounces or 14 grams of alcohol.
• Yogurt present in frozen yogurt is assigned to the Yogurt component. In MPED, frozen yogurt was assigned to the Milk component.
• Fat free cream cheese is assigned to the Cheese component. In MPED, it was assigned to solid fat.
• The fat present in stick, tub, and spread type of margarines are divided into equal amounts of oils and solid fats. This is a major change from MPED, where stick margarines were assigned to solid fats and tub and spread types containing less than 80 percent fat were assigned to oils.
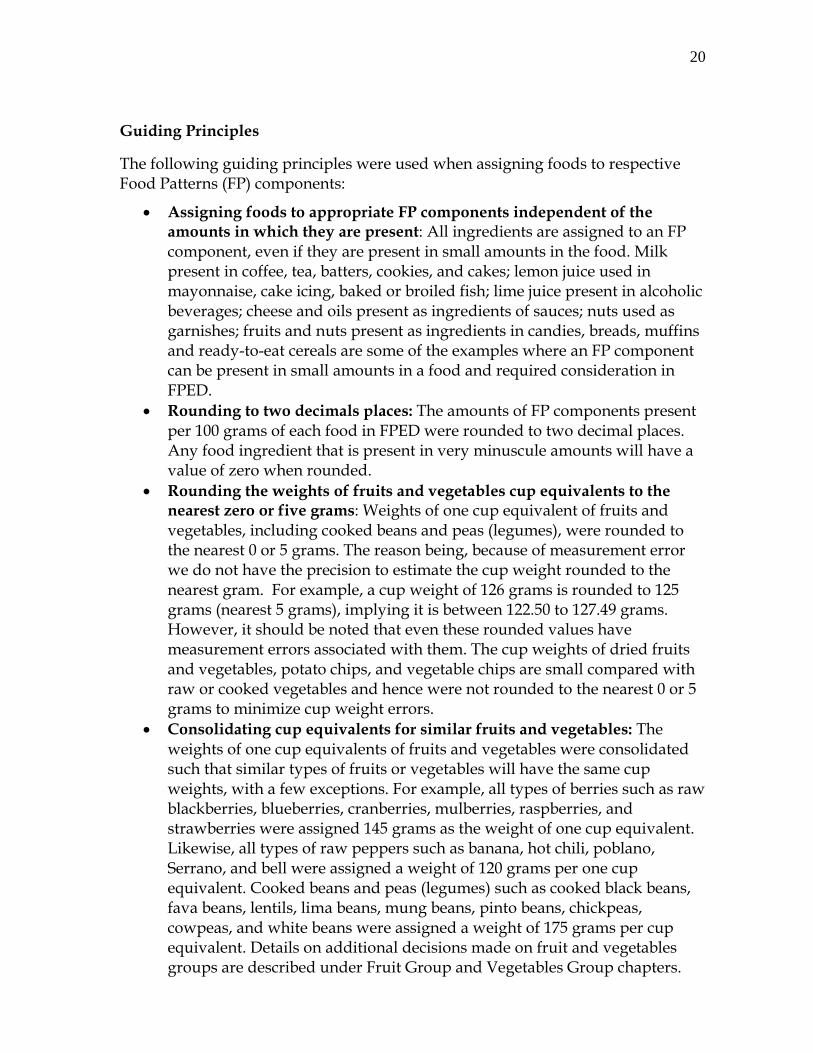
20 Guiding Principles
The following guiding principles were used when assigning foods to respective Food Patterns (FP) components:
• Assigning foods to appropriate FP components independent of the amounts in which they are present: All ingredients are assigned to an FP component, even if they are present in small amounts in the food. Milk present in coffee, tea, batters, cookies, and cakes; lemon juice used in mayonnaise, cake icing, baked or broiled fish; lime juice present in alcoholic beverages; cheese and oils present as ingredients of sauces; nuts used as garnishes; fruits and nuts present as ingredients in candies, breads, muffins and ready-to-eat cereals are some of the examples where an FP component can be present in small amounts in a food and required consideration in FPED.
• Rounding to two decimals places: The amounts of FP components present per 100 grams of each food in FPED were rounded to two decimal places. Any food ingredient that is present in very minuscule amounts will have a value of zero when rounded.
• Rounding the weights of fruits and vegetables cup equivalents to the nearest zero or five grams: Weights of one cup equivalent of fruits and vegetables, including cooked beans and peas (legumes), were rounded to the nearest 0 or 5 grams. The reason being, because of measurement error we do not have the precision to estimate the cup weight rounded to the nearest gram. For example, a cup weight of 126 grams is rounded to 125 grams (nearest 5 grams), implying it is between 122.50 to 127.49 grams. However, it should be noted that even these rounded values have measurement errors associated with them. The cup weights of dried fruits and vegetables, potato chips, and vegetable chips are small compared with raw or cooked vegetables and hence were not rounded to the nearest 0 or 5 grams to minimize cup weight errors.
• Consolidating cup equivalents for similar fruits and vegetables: The weights of one cup equivalents of fruits and vegetables were consolidated such that similar types of fruits or vegetables will have the same cup weights, with a few exceptions. For example, all types of berries such as raw blackberries, blueberries, cranberries, mulberries, raspberries, and strawberries were assigned 145 grams as the weight of one cup equivalent. Likewise, all types of raw peppers such as banana, hot chili, poblano, Serrano, and bell were assigned a weight of 120 grams per one cup equivalent. Cooked beans and peas (legumes) such as cooked black beans, fava beans, lentils, lima beans, mung beans, pinto beans, chickpeas, cowpeas, and white beans were assigned a weight of 175 grams per cup equivalent. Details on additional decisions made on fruit and vegetables groups are described under Fruit Group and Vegetables Group chapters.
21
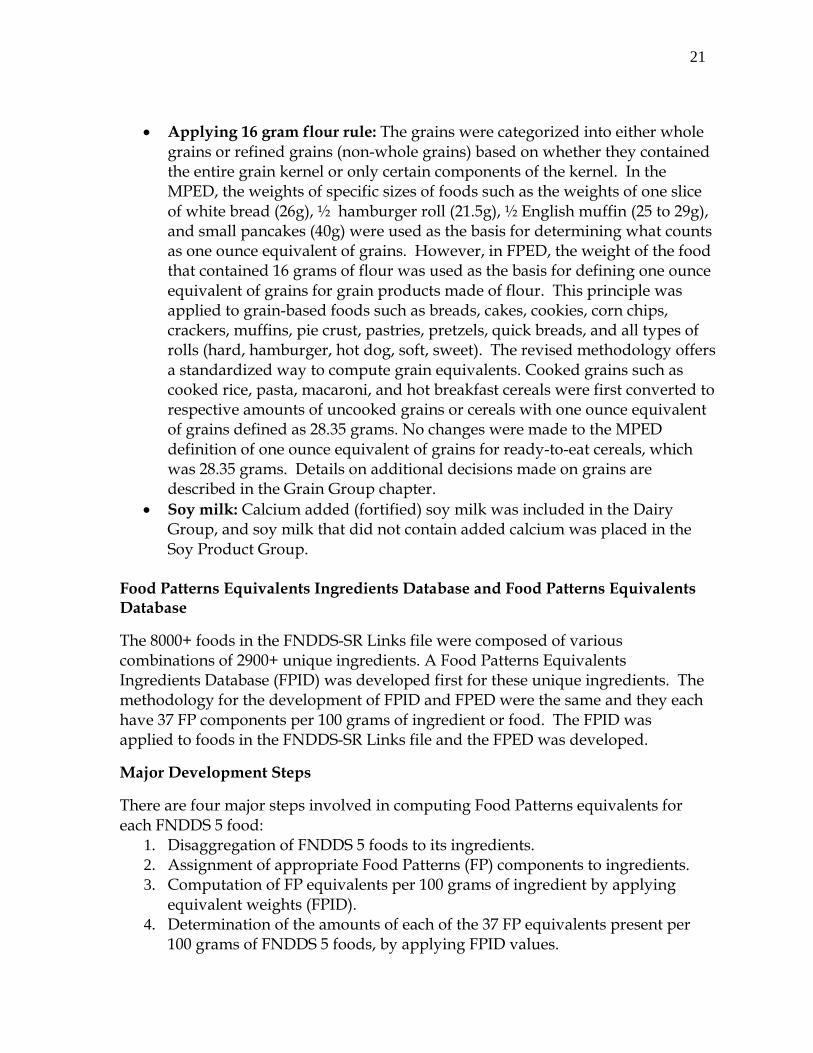
• Applying 16 gram flour rule: The grains were categorized into either whole grains or refined grains (non-whole grains) based on whether they contained the entire grain kernel or only certain components of the kernel. In the MPED, the weights of specific sizes of foods such as the weights of one slice of white bread (26g), ½ hamburger roll (21.5g), ½ English muffin (25 to 29g), and small pancakes (40g) were used as the basis for determining what counts as one ounce equivalent of grains. However, in FPED, the weight of the food that contained 16 grams of flour was used as the basis for defining one ounce equivalent of grains for grain products made of flour. This principle was applied to grain-based foods such as breads, cakes, cookies, corn chips, crackers, muffins, pie crust, pastries, pretzels, quick breads, and all types of rolls (hard, hamburger, hot dog, soft, sweet). The revised methodology offers a standardized way to compute grain equivalents. Cooked grains such as cooked rice, pasta, macaroni, and hot breakfast cereals were first converted to respective amounts of uncooked grains or cereals with one ounce equivalent of grains defined as 28.35 grams. No changes were made to the MPED definition of one ounce equivalent of grains for ready-to-eat cereals, which was 28.35 grams. Details on additional decisions made on grains are described in the Grain Group chapter.
• Soy milk: Calcium added (fortified) soy milk was included in the Dairy Group, and soy milk that did not contain added calcium was placed in the Soy Product Group.
Food Patterns Equivalents Ingredients Database and Food Patterns Equivalents Database
The 8000+ foods in the FNDDS-SR Links file were composed of various combinations of 2900+ unique ingredients. A Food Patterns Equivalents Ingredients Database (FPID) was developed first for these unique ingredients. The methodology for the development of FPID and FPED were the same and they each have 37 FP components per 100 grams of ingredient or food. The FPID was applied to foods in the FNDDS-SR Links file and the FPED was developed.
Major Development Steps
There are four major steps involved in computing Food Patterns equivalents for each FNDDS 5 food:
1. Disaggregation of FNDDS 5 foods to its ingredients. 2. Assignment of appropriate Food Patterns (FP) components to ingredients. 3. Computation of FP equivalents per 100 grams of ingredient by applying
equivalent weights (FPID). 4. Determination of the amounts of each of the 37 FP equivalents present per
100 grams of FNDDS 5 foods, by applying FPID values.
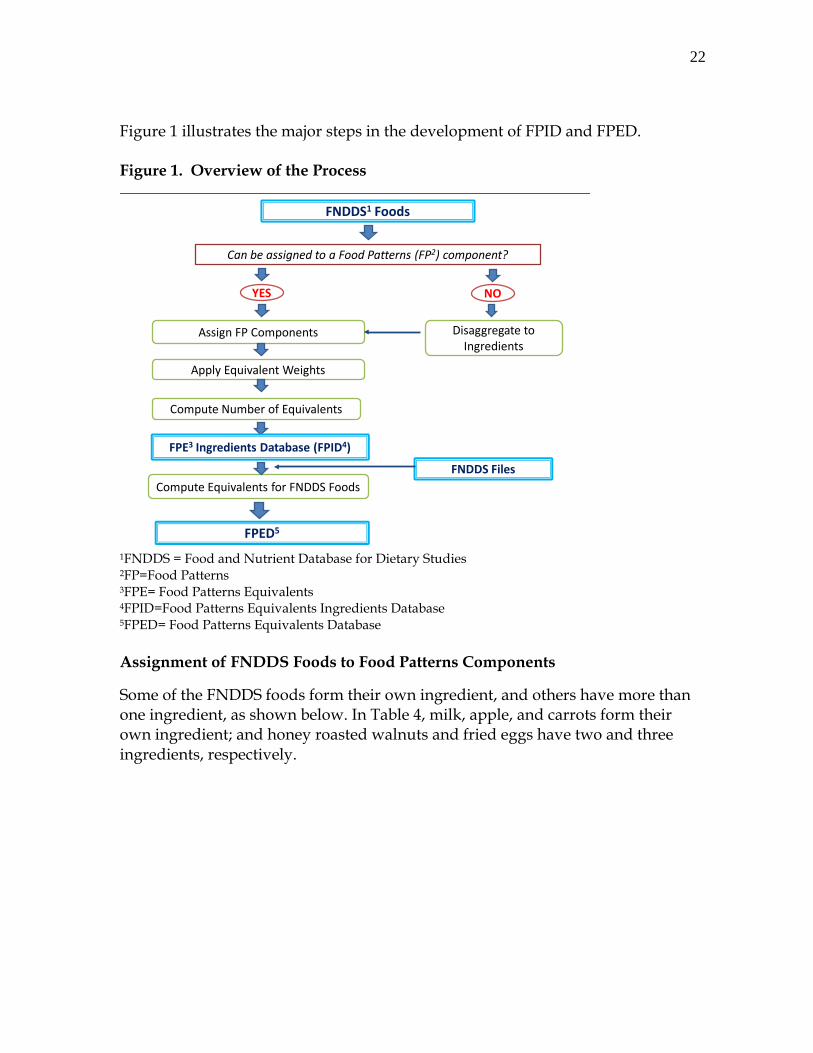
22 Figure 1 illustrates the major steps in the development of FPID and FPED. Figure 1. Overview of the Process
FNDDS1 Foods
Can be assigned to a Food Patterns (FP2) component?
Assign FP Components
Apply Equivalent Weights
Compute Number of Equivalents
YES NO
Disaggregate to Ingredients
FPED5
Compute Equivalents for FNDDS Foods
FPE3 Ingredients Database (FPID4)
FNDDS Files
1FNDDS = Food and Nutrient Database for Dietary Studies 2FP=Food Patterns 3FPE= Food Patterns Equivalents 4FPID=Food Patterns Equivalents Ingredients Database 5FPED= Food Patterns Equivalents Database Assignment of FNDDS Foods to Food Patterns Components
Some of the FNDDS foods form their own ingredient, and others have more than one ingredient, as shown below. In Table 4, milk, apple, and carrots form their own ingredient; and honey roasted walnuts and fried eggs have two and three ingredients, respectively.

23 Table 4. Examples of FNDDS foods and their ingredients
FNDDS food code
Description SR ingredient code
Ingredient description
11111000 Milk, cow’s, fluid, whole 01077 Milk, whole, 3.25% milk fat, with added vitamin D
63101000 Apple, raw 09003 Apples, raw 73101010 Carrots, raw 11124 Carrots, raw 42116100 Walnuts, honey roasted 12155 Walnuts
19296 Honey 31105000 Eggs, whole, fried 01123 Eggs, whole, raw, fresh
81102010 Margarine, stick 02047 Table salt
FNDDS foods that can be directly assigned to an FP component are assigned to the appropriate component. Fruits, vegetables, fluid milk, cheese, cooked rice and pasta, broiled meat and fish, butter, cooking oils, and plain peanuts and tree nuts are examples of foods that can be directly assigned to an FP component, without requiring disaggregation into ingredients. Using Table 4 examples, milk, apples, and carrots can be assigned directly to the appropriate FP components. If an FNDDS food can be directly assigned to an FP component, then the number of FP equivalents were computed using appropriate cup, ounce, or gram weights.
Disaggregation of FNDDS Foods into Ingredients
Foods that cannot be directly assigned to an FP component are disaggregated into its ingredients. Most of the FNDDS foods are multi-ingredient foods and cannot be directly assigned to an FP component, without prior disaggregation into their ingredients (e.g., pizza, sandwiches, soups, cakes, cookies, candies, ready-to-eat cereals, rice with vegetables and meat, frozen dinners). In Table 4 examples, honey roasted walnuts and fried eggs cannot be directly assigned to an FP component and need disaggregation into ingredients that can be assigned to an FP component. Table 5 provides a conceptual model for the level of food disaggregation used in FPID and FPED.

24 Table 5. A Conceptual Model for Food Disaggregation Survey food description
Recipe for the previous level Level 1 disaggregation
Level 2 disaggregation
Level 3 disaggregation
Tuna noodle casserole with cream or white sauce a
1. Light tuna fish, canned in oil, drained
i. Tuna fish b ii. Soybean oil b iii. Salt c
2. Egg noodles, cooked
i. Egg noodles, dry
i. Whole eggs, raw b ii. Wheat flour b
3. Fluid milk b 4. Regular stick
margarine, 80% fat b
5. White all purpose wheat flour b
Tequila Sunrise a 1. Tequila b 2. Orange juice b 3. Lime juice b 4. Grenadine i. High fructose
corn syrup b ii. Water c
Baked fish a 1. Fish b 2. Butter b 3. Lemon juice b
a Only the major ingredients are listed b Indicates the level at which assignments are made c Ingredient is defined as a non-FP component
Assignment of Ingredients to Food Patterns Components
After disaggregation, each ingredient is either assigned to an appropriate FP component listed in Table 2 or to the “non-FP component” category.
Applying Equivalent Weights and Computing Number of Food Patterns Equivalents
The FP equivalents are computed per 100 grams of ingredients or foods that have an FP component assignment. Table 6 gives examples of FP equivalents computations per 100 grams of ingredient or foods.

25 Table 6. Application of Equivalent Weights and Computation of Number of
Equivalents Present per 100 Grams of Ingredient or Food
Food Weight of one cup equivalent (g)
Number of equivalents per 100 grams of food
Fluid milk 245 100/245=0.41 Carrots, raw 125 100/125=0.80 Berries, raw 145 100/145=0.69 100% fruit juices 250 100/250=0.40
Computation of Number of Equivalents in 100 Grams of FNDDS Foods
The amounts of FP equivalents present in each of the ingredients of an FNDDS food are totaled to get the 37 FP component profile per 100 grams of food. FNDDS foods that have only non-FP components will have zero values for all of the FP components in FPED. There are no missing values in FPID and FPED.
The following table provides an overview of computing number of equivalents for 100 grams of sweetened yogurt with strawberries.
Table 7. Number of Equivalents Computation: Sweetened Yogurt with Strawberries
Ingredients1 Amount present per 100 grams of food (g)
Weight of one cup equivalent (g)
Food Patterns component assignment
Number of equivalents per 100 grams of food
Yogurt, non-fat
82 245 Yogurt 0.34 cup
Strawberries, frozen
6 150 Citrus, Melons, and Berries
0.04 cup
Sugar 12 4.2 Added Sugar 2.86 tsp 1Only the major FP ingredients are included.
In FPED, 100 grams of sweetened yogurt will have 0.34 cup Yogurt and Total Dairy; 0.04 cup Citrus, Melons, and Berries, and Total Fruit; and 2.86 teaspoons of Added Sugars; and the rest of the FP components will have zero values.

26 Chapter 3
Fruit Group This chapter discusses the Fruit Group components and the determination of the amount of Food Patterns equivalents for its components, with examples.
Fruit Group Components
The Fruit Group consists of three components: Citrus, Melons, and Berries; Other Fruits; and Fruit Juice. The first two components include fruits that are consumed as intact fruit or as fruit pieces, and exclude fruit juices. The Fruit Juice component includes both citrus and non-citrus fruit juices.
The Citrus, Melons, and Berries component includes blackberries, blueberries, cranberries, currents, dewberries, huckleberries, kiwifruit, loganberries, mulberries, raspberries, and strawberries; melons such as cantaloupe, casaba, honeydew, and watermelon; and citrus fruit such as calamondin, grapefruit, kumquats, lemons, limes, mandarin oranges, oranges, tangerines, and tangelos. The Other Fruit component includes apples, apricots, bananas, cherries, dates, figs, grapes, guava, litchis, mangoes, nectarines, papaya, passion fruit, peaches, pears, pineapple, plums, pomegranates, prunes, raisins, rhubarb, and tamarind. The Fruit Juice component includes juice of citrus, melons, berries and other fruits.
Appendix 1 lists foods in the Fruit Group.
Determination of Cup Equivalent Weights of Fruits and Fruit Juices
One cup of raw, canned, or frozen fruit, or one cup of 100% fruit juice is defined as one cup equivalent of fruit. The weights of 1 cup equivalent of fruits are consolidated such that similar types of fruits will have the same cup weights, with a few exceptions. The cup weights are rounded to the nearest 0 or 5 grams. The cup weights are based on the most common cup weight for the fruits within the group, as provided in FNDDS 5.
Berries: One cup weights of raw (or fresh) berries such as blackberries, blueberries, dewberries, huckleberries, loganberries, mulberries, and strawberries are between 140 and 145 grams, with most of them weighing 145 grams. Therefore, raw/fresh berries are assigned 145 grams per cup. Frozen berries have a higher cup weight, probably due to compacting of fruit during blanching prior to freezing. One cup of frozen, unsweetened berries is given a weight of 150 grams; and frozen, sweetened berries are given 165 grams cup weight because of added sugars.

27 Melons: Casaba, cantaloupe, and honeydew melons weigh about 170 grams per cup, and therefore 170 grams is chosen as one cup weight for all types of melons. An exception is watermelon with a cup weight of 150 grams.
Citrus fruit: One cup weight of all raw commercial varieties of oranges is 180 grams, Florida oranges 185 grams, and tangerines and mandarins 195 grams. A cup weight of 185 grams is chosen for these fruits. Lemon, lime, and grapefruits have a higher cup weight, and are assigned the cup weight of lemon, which is 210 grams.
Other fruits: For most of the fruits categorized as other fruits, weights were adjusted close to the cup weights used in FNDDS 5 and rounded to the nearest 0 or 5 grams such as apples 110 grams, banana 150 grams, papaya 140 grams, peaches 154 grams rounded to 155 grams, and nectarines 143 grams rounded to 145 grams.
Fruit juices, nectars and fruit juice drinks: Single strength fruit juices and fruit juice drinks are assigned a cup weight of 250 grams; frozen juice concentrates 70 grams; and fruit nectars 250 grams. Fruit nectars and fruit juice drinks contain added sugars in addition to fruit juice or pulp. Only a few fruit nectars have label information as to the amount of fruit contained in them which ranged from 25 to 45 percent. Due to a lack of detail information as to the percentage of fruit pulp or juice present in fruit nectars, it was decided that all types of fruit nectars contained 40 percent of fruit juice or pulp. Fruit juice drinks were assumed to contain 15 percent fruit juice. Consequently, 100 grams of nectars and fruit juice drinks contain 0.16 and 0.06 cup equivalents of fruit juice, respectively. In addition, the added sugars present in nectars and fruit juice drinks are computed, after subtracting sugars naturally present in the fruit juice components.
Examples:
1. Mango nectar
One cup weight of mango pulp =250 grams Number of cup equivalents per 100 grams =100/250=0.4 cup Number of cup equivalents in FPED (40% fruit juice assumed) =0.4 x 0.4 cup =0.16 cup 2. Fruit juice drink, low calorie One cup weight of fruit juice drink =250 grams Number of cup equivalents per 100 grams =100/250=0.4 cup Number of cup equivalents in FPED (15% fruit assumed) =0.4 x 0.15 cup =0.06 cup

28
Frozen fruit juice concentrates: The determination of one cup weight for frozen fruit concentrate is described below.
Example: Frozen orange juice concentrate
One cup weight of orange juice frozen concentrate =284 grams` Frozen orange juice concentrate is made to single-strength by adding 3 parts water to 1 part juice concentrate. Dilution factor to bring frozen concentrate to single strength juice =4 Weight of frozen orange juice concentrate to produce 1 cup single strength juice =284/4 = 71 Rounded weight =70 grams Canned fruit: The weights of one cup equivalent of canned fruits are as follow: in water pack or juice pack 245 grams, in light syrup 250 grams, and in heavy syrup 255 grams. Fruit canned in 100% fruit juice, water, light or heavy syrups were assumed to contain 65 percent fruit and 35 percent liquid medium. Fruits canned in fruit juice contain 65 percent fruit and 35 percent juice. The juice in juice packs is assigned to fruit juices and the fruit to the respective fruit component. In addition, the added sugars in the syrup are computed, after subtracting the naturally present sugars in fruits.
Example: Canned pineapple in light syrup
One cup weight of canned pineapples in light syrup =250 grams Number of cup equivalents per 100 grams =100/250=0.4 cup Number of cup equivalents in FPED (65% fruit assumed) =0.4 x 0.65 cup =0.26 cup Dried Fruit: The weight of ½ cup of dried fruit is defined as one cup equivalent. Multi-ingredient Foods Containing Fruit Fruit present in multi-ingredient foods such as fruit salads, cakes, ice cream, and other desserts; fruit juices present in cocktails, fruit nectars, and fruit juice drinks are assigned to the appropriate Fruit component. Ingredients other than fruit or fruit juice are assigned to the respective FP components. Table 8 summarizes one cup equivalent weights of selected Fruit Group foods. Appendix 8 includes an extensive list of one cup equivalent weights for fruits and fruit juices.

29 Table 8. Fruit Group: Summary of Selected Cup Equivalent Weights
Fruit type Weight of one cup
equivalent (g)
Additional information
All types of berries, raw 145 All types of berries, frozen, unsweetened 150 All types of berries, frozen, sweetened 165 Citrus fruit, oranges 185 All melons types (except, watermelon), raw
170 Watermelon 150 grams/cup
All other fruits, raw varied Mostly FNDDS 5 weights, rounded to nearest 0 or 5 grams
Fruit juice (100%) 250 Fruit juice concentrate, frozen 70 Canned fruit in juice pack 245 65% fruit assumed,
35% juice Canned fruit in water pack 245 65% fruit assumed Canned fruit in light syrup 250 65% fruit assumed;
added sugars computed
Canned fruit in heavy pack 255 65% fruit assumed; added sugars computed
Canned fruit water or juice pack, drained 190 Canned fruit syrup pack, drained 200 Applesauce 245 Fruit nectar 250 40% fruit juice
assumed; added sugars computed
Fruit juice drinks 250 15% fruit juice assumed, added sugars computed
Dried fruit 45-90 FNDDS 5 weights, rounded
Dried fruit, cooked or stewed 250
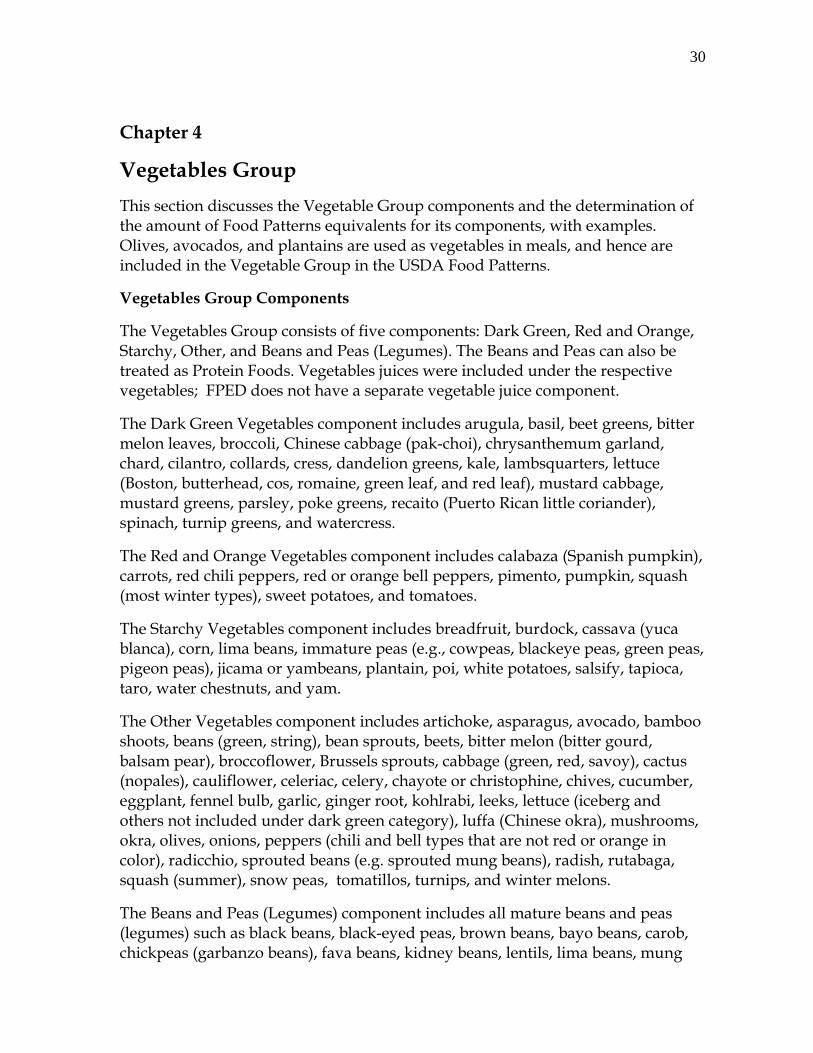
30 Chapter 4
Vegetables Group This section discusses the Vegetable Group components and the determination of the amount of Food Patterns equivalents for its components, with examples. Olives, avocados, and plantains are used as vegetables in meals, and hence are included in the Vegetable Group in the USDA Food Patterns.
Vegetables Group Components
The Vegetables Group consists of five components: Dark Green, Red and Orange, Starchy, Other, and Beans and Peas (Legumes). The Beans and Peas can also be treated as Protein Foods. Vegetables juices were included under the respective vegetables; FPED does not have a separate vegetable juice component.
The Dark Green Vegetables component includes arugula, basil, beet greens, bitter melon leaves, broccoli, Chinese cabbage (pak-choi), chrysanthemum garland, chard, cilantro, collards, cress, dandelion greens, kale, lambsquarters, lettuce (Boston, butterhead, cos, romaine, green leaf, and red leaf), mustard cabbage, mustard greens, parsley, poke greens, recaito (Puerto Rican little coriander), spinach, turnip greens, and watercress.
The Red and Orange Vegetables component includes calabaza (Spanish pumpkin), carrots, red chili peppers, red or orange bell peppers, pimento, pumpkin, squash (most winter types), sweet potatoes, and tomatoes.
The Starchy Vegetables component includes breadfruit, burdock, cassava (yuca blanca), corn, lima beans, immature peas (e.g., cowpeas, blackeye peas, green peas, pigeon peas), jicama or yambeans, plantain, poi, white potatoes, salsify, tapioca, taro, water chestnuts, and yam.
The Other Vegetables component includes artichoke, asparagus, avocado, bamboo shoots, beans (green, string), bean sprouts, beets, bitter melon (bitter gourd, balsam pear), broccoflower, Brussels sprouts, cabbage (green, red, savoy), cactus (nopales), cauliflower, celeriac, celery, chayote or christophine, chives, cucumber, eggplant, fennel bulb, garlic, ginger root, kohlrabi, leeks, lettuce (iceberg and others not included under dark green category), luffa (Chinese okra), mushrooms, okra, olives, onions, peppers (chili and bell types that are not red or orange in color), radicchio, sprouted beans (e.g. sprouted mung beans), radish, rutabaga, squash (summer), snow peas, tomatillos, turnips, and winter melons.
The Beans and Peas (Legumes) component includes all mature beans and peas (legumes) such as black beans, black-eyed peas, brown beans, bayo beans, carob, chickpeas (garbanzo beans), fava beans, kidney beans, lentils, lima beans, mung

31 beans, navy beans, pink beans, pinto beans, split peas, white beans, and soybeans. Soy flour, soy isolate, and soy concentrate are not included in Beans and Peas, but are assigned to Protein Foods (variable name: M_Soy).
Appendix 1 lists foods in the Vegetables Group.
Determination of Cup Equivalent Weights of Vegetables and Vegetable Juices
One cup of raw, canned, frozen, or cooked vegetable, 2 cups of raw, leafy vegetables, one cup of cooked beans and peas (legumes), or one cup of 100% vegetable juice are defined as one cup equivalent of vegetables. The cup weights chosen are close to the FNDDS 5 weights, with a few exceptions. The weights of 1 cup equivalent of vegetables are rounded to the nearest 0 or 5 grams. Variations in the cup weights exist among some of the vegetables in the dark green, red and orange, starchy, or other vegetables categories; and the cup weights are consolidated as much as possible.
• Sliced, diced, or chopped raw vegetables are given the same cup weight because FNDDS food code descriptions do not specify the types of cuts. Most often, the cup weights were the average weights of different cuts. For example, raw carrots are assigned 125 grams cup weight, which is an average of one cup of sliced (122g) and chopped (128g) carrots; bell peppers are assigned 120 grams cup weight, which is an average of one cup sliced (92g) and chopped (149g); and one cup of broccoli was assigned 80 grams, which is an average of broccoli flowerets (71g) and chopped broccoli (88g).
• In general, raw vegetables have lower cup weights than their cooked counterparts. Examples include carrots, raw 125 grams, cooked 145 grams; cucumber, raw 120 grams, cooked 180g; eggplant, raw 80g, cooked 95g; bell peppers, raw 120g, cooked 135 grams; and mushrooms, raw 70 grams, cooked 155 grams. This highlights the fact that a person eating cooked vegetables will have to eat greater amounts to get the same number of cup equivalents as a person eating raw or uncooked vegetables.
• Most often, the same cup weights are used regardless of whether a cooked vegetable is prepared from raw (fresh), frozen, or canned form of vegetables, with a few exceptions. Vegetables for which the same cup weights are assigned regardless of the form include artichoke, asparagus, beets, Brussels sprouts, cabbage, carrots, corn, onions, peas, peppers, pumpkin, summer squash, sweet potatoes, and turnips. Where FNDDS 5 cup weights of canned or frozen vegetables are quite different from the respective vegetables cooked from fresh or NS as to form, two sets of cup weight are used, as described below.
o Dark green, leafy vegetables such as collards, greens, kale, mustard greens, spinach, and turnip greens have the same cup weights when

32
prepared from fresh (raw) and different set of cup weights if prepared from frozen or canned forms.
o Other vegetables such as okra and string beans and starchy vegetables such as immature lima beans prepared from fresh or NS as to forms are assigned the same cup weights and that prepared from frozen or canned have a different set of cup weights.
An explanation for the observed higher weights of canned and frozen vegetables in FNDDS 5 could be due to the compacting of leafy vegetables and some of the other non-leafy vegetables during blanching.
• The FNDDS 5 weights for one cup of cooked beans and peas (legumes) range from 170 to 191, with an exception of mung beans which weigh 200 grams per cup. Most of the cup weights for beans are between 172-177 grams. A cup weight of beans not specified as to type of beans is 175 grams. For this reason, cooked beans and peas (legumes) are assigned 175 grams cup weight. The average value of the conversion factors that are used in the USDA’s Food Intakes Converted to Retail Commodities Database, 2003-08 [6], to convert cooked legumes to uncooked legumes is 0.33. And so, one cup of uncooked legumes is assigned as 60 grams weight (175x0.33= 58, then rounded to 60).
• The assigned weights of one cup of potatoes and potato products are: boiled potatoes and canned potatoes, drained, 155 grams; baked or roasted potatoes, 120 grams; and potato chips, 57 grams (2 oz).
• The weight of ½ cup of dried vegetables is defined as one cup equivalent of vegetables.
• One cup of raw tomatoes is assigned 170 grams; tomato paste and puree, 120 grams; tomato sauce and tomato juice, 245 grams; and dried tomatoes, 25 grams.
Table 9 summarizes one cup equivalent of vegetables discussed above and a few additional vegetables. Appendix 9 includes an extensive list of one cup equivalent weights for vegetables.

33 Table 9. Vegetables Group: Summary of Selected Cup Equivalent Weights
Vegetables Weight of one cup
equivalent (g) Artichoke, raw 150 Artichoke, cooked from raw, frozen, or canned 175 Asparagus, raw 135 Asparagus, cooked from raw, frozen, or canned 180 Avocados, raw 145 Bean sprouts, raw 105 Bean sprouts, cooked from raw, or canned 125 Beets, raw 135 Beets, cooked from raw, frozen, or canned 170 Bitter melon, cooked 125 Broccoflower, raw 110 Broccoflower, cooked 125 Broccoli, raw 80 Broccoli, cooked from raw, frozen, or NS1 as to form 155 Brussels sprouts, raw 90 Brussels sprouts, cooked from raw, frozen, or NS1 as to form 155 Cabbage, (green, red, or Savoy), raw 90 Cabbage, (green, red, or Savoy), cooked 150 Cabbage, Chinese (pak-choi), raw 140 Cabbage, Chinese (pe-tsai), raw 150 Carrots, raw 125 Carrots, cooked from raw, frozen, or canned 145 Cauliflower, raw 110 Cauliflower, cooked from raw, frozen, or NS1 as to form 125 Cauliflower, cooked from canned 180 Celery, raw 120 Celery, cooked 150 Collards, raw 70 Collards, cooked from fresh or NS1 as to form 130 Collards, cooked from frozen or canned 165 Corn, raw 150 Corn, cooked from raw, frozen, or canned 165 Cucumber, raw 120 Cucumber, cooked 180 Eggplant, raw 80 Eggplant, cooked 95 1NS= Not Specified
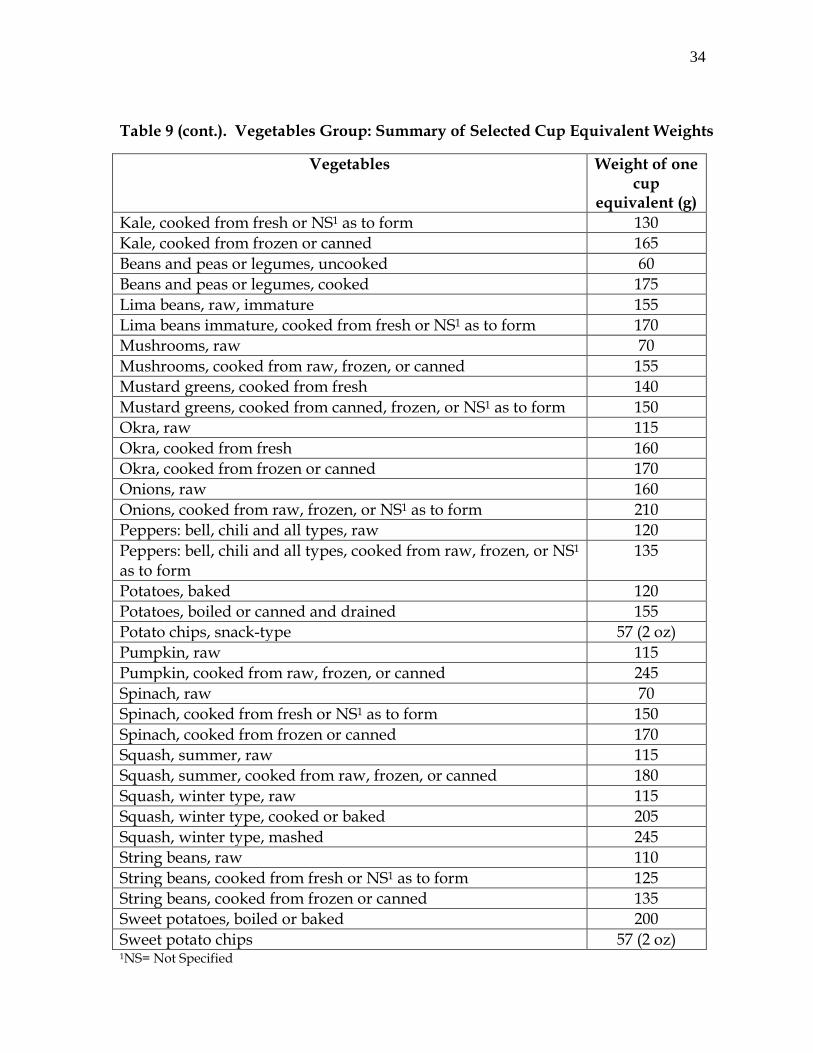
34 Table 9 (cont.). Vegetables Group: Summary of Selected Cup Equivalent Weights
Vegetables Weight of one cup
equivalent (g) Kale, cooked from fresh or NS1 as to form 130 Kale, cooked from frozen or canned 165 Beans and peas or legumes, uncooked 60 Beans and peas or legumes, cooked 175 Lima beans, raw, immature 155 Lima beans immature, cooked from fresh or NS1 as to form 170 Mushrooms, raw 70 Mushrooms, cooked from raw, frozen, or canned 155 Mustard greens, cooked from fresh 140 Mustard greens, cooked from canned, frozen, or NS1 as to form 150 Okra, raw 115 Okra, cooked from fresh 160 Okra, cooked from frozen or canned 170 Onions, raw 160 Onions, cooked from raw, frozen, or NS1 as to form 210 Peppers: bell, chili and all types, raw 120 Peppers: bell, chili and all types, cooked from raw, frozen, or NS1 as to form
135
Potatoes, baked 120 Potatoes, boiled or canned and drained 155 Potato chips, snack-type 57 (2 oz) Pumpkin, raw 115 Pumpkin, cooked from raw, frozen, or canned 245 Spinach, raw 70 Spinach, cooked from fresh or NS1 as to form 150 Spinach, cooked from frozen or canned 170 Squash, summer, raw 115 Squash, summer, cooked from raw, frozen, or canned 180 Squash, winter type, raw 115 Squash, winter type, cooked or baked 205 Squash, winter type, mashed 245 String beans, raw 110 String beans, cooked from fresh or NS1 as to form 125 String beans, cooked from frozen or canned 135 Sweet potatoes, boiled or baked 200 Sweet potato chips 57 (2 oz) 1NS= Not Specified
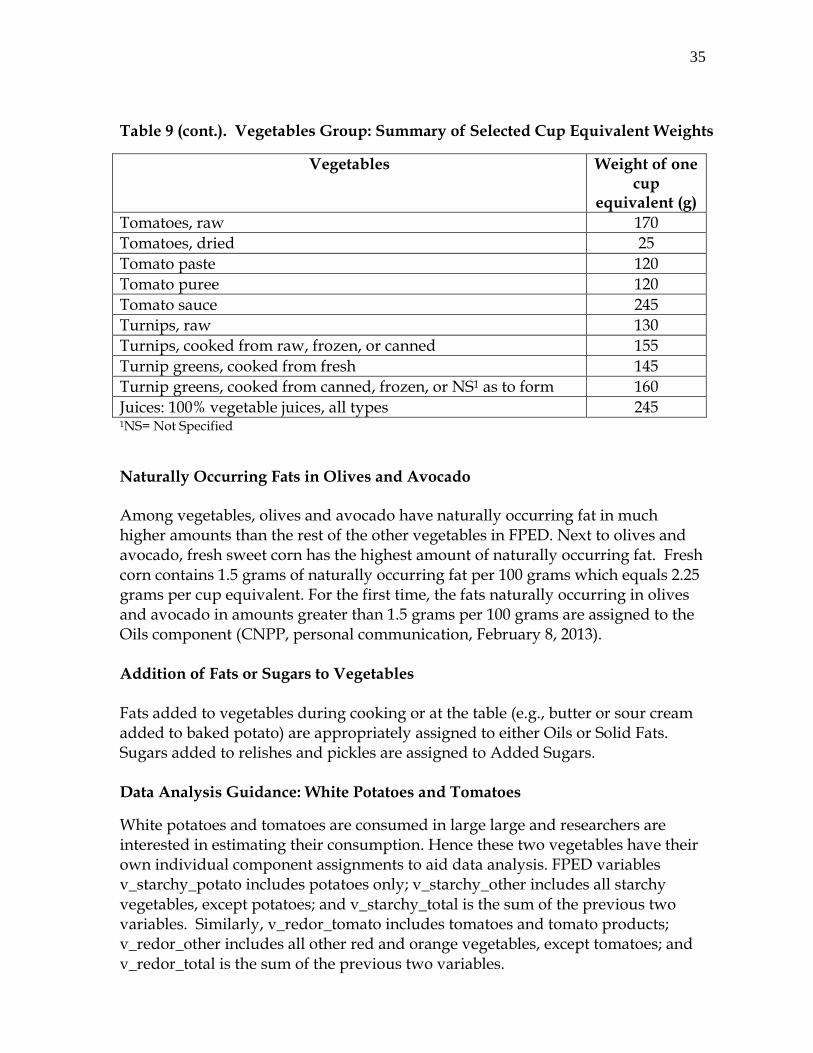
35 Table 9 (cont.). Vegetables Group: Summary of Selected Cup Equivalent Weights
Vegetables Weight of one cup
equivalent (g) Tomatoes, raw 170 Tomatoes, dried 25 Tomato paste 120 Tomato puree 120 Tomato sauce 245 Turnips, raw 130 Turnips, cooked from raw, frozen, or canned 155 Turnip greens, cooked from fresh 145 Turnip greens, cooked from canned, frozen, or NS1 as to form 160 Juices: 100% vegetable juices, all types 245 1NS= Not Specified
Naturally Occurring Fats in Olives and Avocado Among vegetables, olives and avocado have naturally occurring fat in much higher amounts than the rest of the other vegetables in FPED. Next to olives and avocado, fresh sweet corn has the highest amount of naturally occurring fat. Fresh corn contains 1.5 grams of naturally occurring fat per 100 grams which equals 2.25 grams per cup equivalent. For the first time, the fats naturally occurring in olives and avocado in amounts greater than 1.5 grams per 100 grams are assigned to the Oils component (CNPP, personal communication, February 8, 2013). Addition of Fats or Sugars to Vegetables Fats added to vegetables during cooking or at the table (e.g., butter or sour cream added to baked potato) are appropriately assigned to either Oils or Solid Fats. Sugars added to relishes and pickles are assigned to Added Sugars. Data Analysis Guidance: White Potatoes and Tomatoes
White potatoes and tomatoes are consumed in large large and researchers are interested in estimating their consumption. Hence these two vegetables have their own individual component assignments to aid data analysis. FPED variables v_starchy_potato includes potatoes only; v_starchy_other includes all starchy vegetables, except potatoes; and v_starchy_total is the sum of the previous two variables. Similarly, v_redor_tomato includes tomatoes and tomato products; v_redor_other includes all other red and orange vegetables, except tomatoes; and v_redor_total is the sum of the previous two variables.

36 Data Analysis Guidance: Beans and Peas
The Beans and Peas (legumes) can be considered either in the Vegetables or Protein Foods, but not in both components simultaneously. For convenience, FPED has both component forms: Vegetables (v_legumes) and Proteins Foods (pf_legumes). When considered as Vegetables, beans and peas are computed in cup equivalents. When considered as Protein Foods, they are computed in ounce equivalents. One cup equivalent of beans and peas equals four ounce equivalents of protein foods.
Example:
1 cup equivalent of lentils computed as Vegetables = 4 ounce equivalents of lentils as Protein Foods.
Multi-ingredient Foods Containing Vegetables
Vegetables present in multi-ingredient foods such as soups, salads, pizza, sandwiches, and vegetable dishes are assigned to the appropriate Vegetable component.

37 Chapter 5
Grains Group This section discusses the Grains Group components and the determination of the amount of Food Patterns equivalents for its components, with examples.
Grains Group Components
The Grains Group consists of two components: Whole Grains and Refined Grains (non-whole grains). Whole Grains include amaranth, barley (not pearled), brown rice, buckwheat, bulgur, millets, oats, popcorn, quinoa, dark rye, triticale, whole-grain cornmeal, whole-grain wheat flour, whole-grain cracked wheat, wild rice, and grain-based products made with 100% whole grains or their flours. Refined Grains (non-whole grains) include grains that are degermed or polished and their flours or meal, cornmeal, masa, corn grits, bran of all cereals, cream of rice, cream of wheat, cracked wheat, malted barley or malted flours, pearled barley, rye (light or medium), wheat gluten, and white rice.
Appendix 1 lists foods in the Grains Group.
Determination of Ounce Equivalents of Grains
The method of computing grains equivalents is one of the major changes that took place in the development of FPED. The Choosemyplate.gov Website lists consumer-friendly examples of what counts as one ounce grain equivalent [2]. These examples are based on common portion sizes such as one slice of bread, one-half cup of cooked rice, and one cup of ready-to-eat cereal, instead of the actual amount of grains present in these foods. Using common portion sizes to compute grain equivalents poses a challenge because standard rules cannot be applied across all foods, whereas using the actual amounts of grains present in a food to determine grain equivalents offers a systematic approach to creating FPED.
Two different definitions of what counts as one ounce grain equivalent are used in FPED:
• For grain products such as breads, bagels, biscuits, muffins, cakes, cookies, pancakes, and waffles made with flour, each 16 grams of flour present in a food was used as the basis for defining one ounce grain equivalent, the rationale being that one standard slice of bread has been defined as equal to one ounce grain equivalent will contain 16 grams of flour.
• For intact grains or grain products such as cream of wheat, barley, bulgur, millets, oats, pasta, rice, rye, quinoa, and ready-to-eat cereals, 28.35 grams of grains was defined as equal to one ounce grain equivalent.

38 To evaluate this approach, bagels, biscuits, breads, muffins, grain snacks, baked grain products, pancakes, pasta, rice, and ready-to-eat cereals in FNDDS 4.1 for WWEIA, NHANES 2007-08 were selected. The grain equivalents were computed by two methods: (1) using the definitions based on the common portion sizes of the foods, and (2) using FPED definitions described above and the actual amounts of the grains present in foods [12]. The differences in the amounts of grain equivalents computed by the two methods were not appreciable; and the national mean intakes of grain equivalents estimated were the same. Using the amounts of grains present in grain-based foods offers a standardized method for the computation of grain equivalents.
Table 10 summarizes foods grouped based on the definition of one ounce of grain equivalents.
Table 10. Amounts of Grains in One Ounce Equivalent
Grain amounts in one ounce equivalents Foods
16 grams flour Bagels Biscuits Breads and rolls Cakes Cookies Crackers Danishes Doughnuts
Grain based snacks (e.g., pretzels, tortilla chips, corn chips)
Gravies and sauces Muffins and quick
breads Pancakes and waffles Pies Tortillas
28.35 grams grain Barley Buckwheat Bulgur Couscous Hot cereals (e.g.,
cream of wheat/rice, farina, grits, oatmeal)
Millets Pasta Popcorn Quinoa Ready-to-eat cereals Rice

39 Multi-ingredient Foods Containing Grains
Grains present in multi-ingredient foods such as breads, rice and vegetable dishes, macaroni and cheese, and noodle soups are assigned to Whole or Refined Grains components, as appropriate.

40 Chapter 6 Dairy Group This section discusses the Dairy Group components and the determination of the amount of Food Patterns equivalents for its components, with examples.
Dairy Group Components
The Dairy Group consists of four components: Milk, Yogurt, Cheese, and Miscellaneous Dairy, which is predominantly whey. The Milk component includes all types of fluid milk, buttermilk, dry milk, and evaporated milk, with different levels of fat. Soy milk with added calcium is included in the Milk component. Soy milk without calcium fortification is assigned to Soy Products. The Yogurt component includes plain yogurt, flavored yogurt, fruit yogurt, and frozen yogurt, containing different levels of fat. The Cheese component includes all types of cheeses such as natural cheese, soft cheese, processed cheese, and cheese food. Examples of cheeses include brie, camembert, cheddar, cottage cheese, Colby, Edam, feta, Fontana, Gouda, gruyere, Limburger, Mexican cheeses (queso anego, queso asadero, queso chihauhau), Monterey, mozzarella, muenster, parmesan, provolone, ricotta, and Swiss. The Miscellaneous Dairy component includes whey. Because its national mean intake is minuscule, the Miscellaneous Dairy component is not a standalone FPED variable, and it is included under the Total Dairy component. The Dairy Group does not include dairy fat such as butter, cream, and cream cheese, which are assigned to Solid Fats component. Appendix 1 lists foods in the Dairy Group.
Solid Fats Naturally Present in Dairy foods
Milk fat is classified as solid fat. The fats naturally present in milk, yogurt, and cheese in excess of 1.5 grams per cup equivalent, which is same as the amount of fat present in fat-free milk, is assigned to the Solid Fats component.
Determination of Cup Weights of Dairy Group
One cup equivalents of selected foods in the Dairy Group are listed in Table 11.

41 Table 11. Dairy Group: Summary of Selected Cup Equivalent Weights
Dairy Weight of 1 cup equivalent
Fluid milk, all fat types, plain or flavored 245g Buttermilk 245g Dry milk, reconstituted 245g Soy milk, calcium fortified 245g Evaporated milk 125g Dry milk 25g Yogurt, all fat types, plain or flavored, without fruit 245g Yogurt, frozen, sweetened with low-calorie sweetener 245g Cheese, natural 1 to 2 oz Cheese, natural, soft 4.5 oz Cheese, processed 1.5 to 2 oz
Other Considerations
Flavored milk: Flavored milks are assigned as 100 percent milk. In addition, added sugars are computed, if they are present.
Yogurt with fruit or nuts: Fruit yogurts are assumed to contain 6 percent fruit, and 3 percent nuts, if nuts are present. In addition, added sugars are computed, if they are present.
Cheeses: In general, cup equivalents for various cheeses are set using several categories, based on the type of cheese and approximate calcium content in comparison to the calcium in one cup of milk. For cream cheeses, only the fat-free form of cream cheese is assigned to the Cheese component (CNPP, personal communication, December 17, 2012). Regular and low fat cream cheeses are not assigned to the Cheese component due to their low calcium content; only the fat present in these two cheeses are assigned to the Solid Fats component, as in the case for all types of cheese. Also, one cup equivalent of cottage cheese is defined as the amount containing 302 milligrams of calcium, the amount present in a cup of milk.
Multi-ingredient Foods Containing Dairy Components
The milk present in multi-ingredient foods such as half and half, and ice cream are assigned to the Milk component; yogurt present in frozen yogurt is assigned to the Yogurt component; and cheese present in sandwiches, salads, and pizza are assigned to the Cheese component.
42 Chapter 7
Protein Foods This section discusses the Protein Foods components and the determination of the amount of Food Patterns equivalents for its components, with examples.
Protein Foods Components
The Protein Foods Group consists of Meat, Poultry, Seafood, Eggs, Nuts and Seeds, Soy Products (other than calcium added soy milk and mature soybean), and Beans and Peas (or Legumes). The Meat and Poultry components were further subdivided into: Meat (pf_meat); Poultry (pf_poultry); Organ Meat (pf_organ); and Cured Meat (pf_curedmeat) to facilitate detailed data analysis. The Seafood component is divided into: Seafood that are high in n-3 fatty acids (pf_seafd_hi) and Seafood that are low in n-3 fatty acids (pf_seafd_lo).
The Meat component includes beef, goat, lamb, pork (includes fresh or uncured ham), game meat (e.g. bear, bison, moose, opossum, rabbit, raccoon, squirrel, venison), and veal. The Poultry component includes chicken, Cornish hens, dove, duck, game birds (e.g. ostrich, pheasant, quail), goose, and turkey. The Cured Meat component includes cured or smoked meat products such as frankfurters, sausages, and luncheons meats, cured meat made from beef, chicken, ham, pork, and turkey. The Organ Meat component includes brain, chitterlings, giblets, gizzard, heart, kidney, liver, stomach, sweetbreads, thymus, tongue, and tripe.
The following FDA definitions [13] are used for classification of cured meat. The three basic categories of cured meat and poultry, as defined by FDA are listed in Table 12.

43 Table 12. FDA Cured Meat and Poultry Categories FDA cured meat and poultry categories Foods included within the category
Uncomminuted smoked products Include bacon, beef jerky, hams, pork
shoulders, turkey breasts, turkey drumsticks.
Sausages (including cured sausages) Include both finely ground and coarsely ground products.
• Finely ground sausages include bologna, frankfurters, luncheon meats and loaves, sandwich spreads, and viennas.
• Coarsely ground sausages include chorizos, kielbasa, pepperoni, salami, and summer sausages.
Cured sausages may be categorized as (1) raw, cured; (2) cooked, smoked; (3) cooked, unsmoked; and (4) dry, semidry, or fermented.
Uncomminuted, unsmoked processed products
Include corned beef, pastrami, pig’s feet, and corned tongues. This category of products may be sold either as raw ready-to-cook or ready-to-eat.
Computation of n-3 fatty Acids Cutoff per 100 Grams of Seafood
The only n-3 fatty acids of interest are the long chain fatty acids, EPA and DHA. The Seafood component is further subdivided into: (1) high in n-3 fatty acids and (2) low in n-3 fatty acids. Cooked seafood containing 500 mg or more of n-3 fatty acids (EPA and DHA) per 3 ounces was assigned as seafood high in n-3 fatty acids [14]. This translates to 588 milligrams per 100 grams of cooked fish as shown below.
3 ounces = 3x28.35 grams =85.05 gram
85 grams of cooked high n-3 seafood should contain at least 500 mg of n-3
100 grams of cooked high n-3 seafood should contain at least (500/85) x100 =588 mg n-3 fatty acids

44 To estimate the cutoff amount of n-3 fatty acids in raw fish, a cooking yield of 77 percent is applied [15]. The amount of 452 milligrams of n-3 fatty acids per 100 grams of raw seafood is used to categorize seafood one of the two n-3 groups. The computation is described below. Computation of raw seafood n-3 cutoff amount:
130g raw fish will yield 100 g cooked fish (77% yield) Cutoff n-3 fatty acid amount = 588 mg per 100g cooked or 130g raw Cutoff n-3 fatty acid amount = (588/130)x100 = 452 mg Examples of seafood that are high in n-3 fatty acids include anchovy, herring, mackerel, salmon, sardine, shark, trout, and bluefin and albacore tuna. Seafood low in n-3 fatty acids include catfish, clams, cod, crabs, crayfish, croaker, eel, flounder, haddock, lobster, mussels, octopus, oyster, perch, pollock, scallop, shrimp, snapper, tilapia, tuna (other than bluefin and albacore) and turtle. Canned tuna fish was divided between the two seafood components: 25% high in n-3 and 75% low in n-3 [14]. Appendix 1 lists seafood in the two n-3 components. The Eggs component includes chicken eggs and other birds’ eggs and their components such as egg yolk, egg white, liquid egg, dried eggs, and egg substitutes containing egg whites. The Soy Products component includes all soy products except calcium added (fortified) soy milk and immature soybean cooked as vegetables. The Soy Products component includes soy flour, soy protein isolate, soy concentrate, tofu, soy milk that is not calcium fortified. The Beans and Peas (Legumes) component includes all mature beans and peas (legumes) such as black beans, black-eyed peas, brown beans, bayo beans, carob, chickpeas (garbanzo beans), fava beans, kidney beans, lentils, lima beans, mung beans, navy beans, pink beans, pinto beans, soy beans, and white beans. Appendix 1 lists foods in the Protein Foods Group. The definitions of one ounce equivalent of protein foods are in Table 13.

45 Table 13. Definitions of One Ounce Equivalent of Protein Foods
Protein Foods components
Definition of one ounce equivalent
Lean meat/poultry 28.35 grams of cooked, lean portion of meat/poultry containing no more than 2.63 grams of solid fats naturally present, per ounce equivalent
Lean seafood 28.35 grams of cooked, lean portion of seafood containing no more than 2.63 grams of fats naturally present as oils, per ounce equivalent
Eggs 50 grams, raw or cooked Nuts and seeds ½ ounce or (28.35/2) grams Nut butters 16 grams (1 tablespoon) Legumes 4 x the number of cup equivalents of legumes as
vegetables (that is, ¼ cup of cooked legumes as vegetables equals 1 ounce equivalent of legumes as protein foods. 1 cup equivalent of cooked legumes= 175 grams in FPED)
Soy flour, isolate or concentrate
½ ounce or (28.35/2) grams
Soy, tofu ¼ cup or (250/4) grams Soy nuts 28.35 grams
Solid Fats and Oils Naturally Present in Protein Foods
The fats naturally present in seafood, nuts, seeds, and legumes are defined as oils and fats present in meat, poultry, and eggs are defined as solid fats. The USDA Food Patterns allows 2.63 grams of fat or oils per ounce of lean meat and other protein foods. Any solid fats or oils that are naturally present above the allowable amounts are included under the Solid Fats or Oils components of the respective protein foods.
The method for calculating ounce equivalents for meat, poultry, and seafood disaggregates solid fats or oils while the method for eggs and nuts does not. The following section describes computation of these components.
Determination of Ounce Equivalents of Lean Meat in Cooked Meat, Poultry, and Seafood
By definition, one ounce of cooked lean meat, poultry, or seafood can have no more than 2.63 grams of allowable fat per 28.35 grams of lean meat. Or, 100 grams of cooked lean meat, poultry, or seafood will contain 100/28.35 or 3.53 ounces of lean meat with a maximum of (3.53 x 2.63) grams or 9.28 grams of allowable fat.
Non-fat portion = (100-9.28) grams = 90.72 grams

46 Or, 90.72 grams of non-fat meat, poultry, or seafood can contain up to 9.28 grams of allowable fat or oils. Or, Food Patterns allowable solid fat per oz eq. =2.63 grams Non-fat meat portion per 28.35 grams (1 ounce) lean meat =28.35-2.63 =25.72 grams
The following is derived from the above information:
(1) Any cooked meat, poultry, of seafood that has 9.28 percent or less total fat will not have either solid fats or oils above the allowable limits.
(2) Any cooked meat, poultry, or seafood that has 9.28 percent or less total fat will have 3.53 ounce equivalent of lean protein per 100 grams.
Examples: The computation of Protein Food equivalents and Solid Fats or Oils components can be done in several ways. Two methods are described below and the user may choose the one that is convenient to them, because both computational methods give the same result. The examples in this chapter use method 2. Cooked sausage (example 1) and broiled beef steak (example 2) are examples from MPED 2 Documentation and User Guide, pp 36-37 [5]. These foods are included to show that either of the two methods will provide the same result as MPED 2. 1. Cooked sausage - Method 1
Cooked sausage contains 31.16 percent total fat. Because this amount is greater than 9.28, the cooked sausage will contain solid fats above the allowable limit.
Non-fat meat portion present in 100g sausage =100-31.16 =68.84 grams Allowable solid fat for 68.84g non-fat meat portion =(9.28/90.72) x 68.84 =7.04 grams Solid fat above the allowable limit = % total fat- allowable fat
=31.16-7.04 =24.12 grams
Number of ounce equivalents of meat = (100 – % total fat above the limit)/28.35 =(100-24.12)/28.35 =75.88/28.35 =2.677 = 2.68
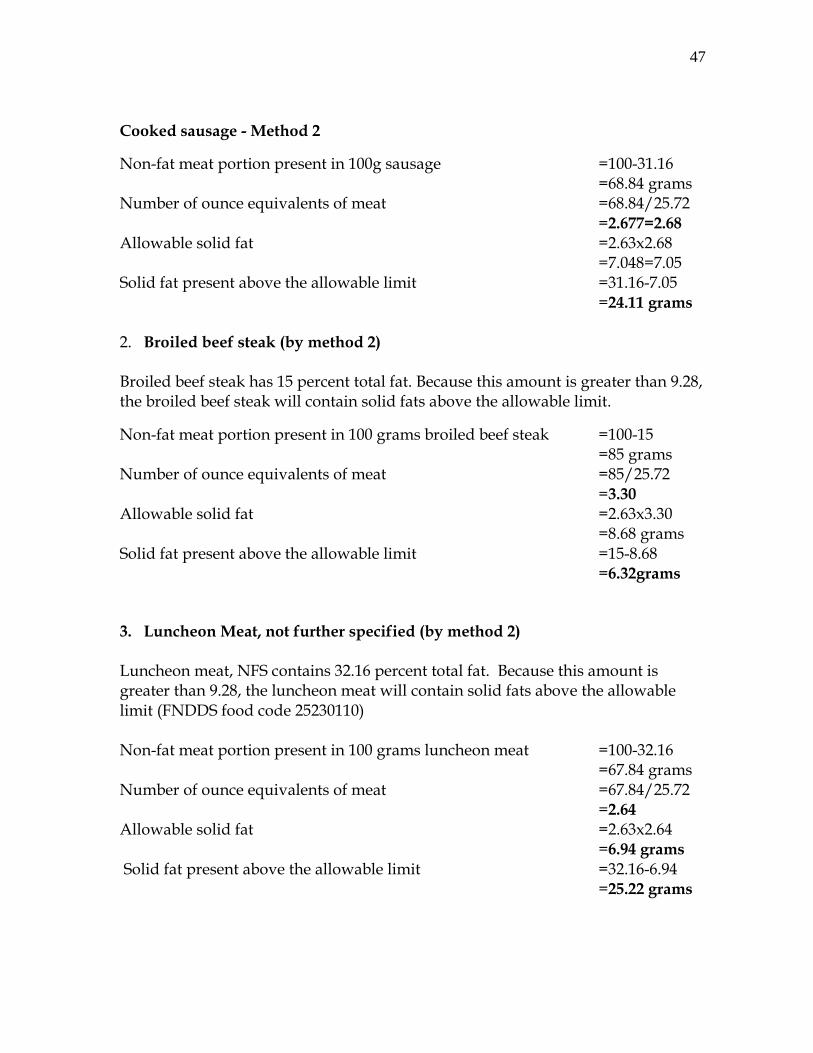
47 Cooked sausage - Method 2
Non-fat meat portion present in 100g sausage =100-31.16 =68.84 grams
Number of ounce equivalents of meat =68.84/25.72 =2.677=2.68
Allowable solid fat =2.63x2.68 =7.048=7.05 Solid fat present above the allowable limit =31.16-7.05 =24.11 grams
2. Broiled beef steak (by method 2)
Broiled beef steak has 15 percent total fat. Because this amount is greater than 9.28, the broiled beef steak will contain solid fats above the allowable limit.
Non-fat meat portion present in 100 grams broiled beef steak =100-15 =85 grams Number of ounce equivalents of meat =85/25.72
=3.30 Allowable solid fat =2.63x3.30
=8.68 grams Solid fat present above the allowable limit =15-8.68
=6.32grams
3. Luncheon Meat, not further specified (by method 2)
Luncheon meat, NFS contains 32.16 percent total fat. Because this amount is greater than 9.28, the luncheon meat will contain solid fats above the allowable limit (FNDDS food code 25230110) Non-fat meat portion present in 100 grams luncheon meat =100-32.16 =67.84 grams Number of ounce equivalents of meat =67.84/25.72 =2.64 Allowable solid fat =2.63x2.64 =6.94 grams Solid fat present above the allowable limit =32.16-6.94 =25.22 grams

48 4. Baked salmon without added fat (by method 2) If no other ingredient is present in the baked salmon, the computation is as follows. (FNDDS food code 26137110, the amount of added salt is disregarded in the computation) Baked salmon without added fat has 4.3 percent total fat Because 4.3 percent fat is lower than the allowable oil level of 9.28 grams, the baked salmon will not contain any oils above the allowable limit. Number of ounce equivalents of seafood =100/28.35 =3.53 5. Herring, baked without added fat (by method 2) Baked herring contains 11.14 percent total fat. Because this amount is greater than 9.28 grams, the baked herring will contain oils above the allowable limit. Non-fat, lean portion present in 100 grams =100-11.14
=88.86 grams Number of ounce equivalents of seafood =88.86/25.72
=3.45 Allowable oils =2.63x3.45
=9.07 grams Oils present above the allowable limit =11.14-9.07
=2.07 grams
In FNDDS, some of the baked or broiled fish have added lemon juice. These food codes will have fruit juice equivalents and a slightly lower amount of protein foods ounce equivalents than that are in the above examples. Differences between FPID and FPED in the Calculation of Meat, Poultry, and Seafood Ounce Equivalents
In FPID, raw meat and poultry are assumed to have 75 percent cooking yield and the raw seafood is assumed to have 77 percent cooking yield. Cooked meat, poultry, and seafood ingredients are assumed to have 100 percent cooking yield (no moisture or fat loss during cooking). However, in FNDDS, some of the meat, poultry, and seafood, whether raw or cooked, may have varying levels of cooking yields and some may additionally have lost fat during cooking. Because of the differences in cooking yields, the FPID FP equivalents are not used for the computation of meat, poultry, and seafood in FPED. In FPED, meat, poultry, and

49 seafood equivalents are computed using FNDDS fat loss and/or moisture loss information. Cooking yield was computed using fat and/or moisture loss data.
The following example show the computations used in FPID and FPED.
FPID: Determination of Ounce Equivalents of Lean Meat in Raw Meat, Poultry, and Seafood as an Ingredient: No Fat Loss Is Assumed in Cooking
In the computation, no fat loss during cooking was assumed, if no fat loss was indicated in the recipe.
Examples:
1. Raw pork Raw pork contains 14.8 percent total fat. In the computation 75 percent cooking yield and no fat loss during cooking is used. (SR code/FPID code 10003)
After cooking, 100 grams of raw pork will yield 75 grams of cooked pork containing 14.8 grams of total fat.
Non-fat, lean portion present in 75 grams =75-14.8 =60.20 grams
Number of ounce equivalents of meat =60.20/25.72 =2.34
Allowable solid fats =2.63x2.34 =6.15 grams
Solid fats present above the allowable limit =14.8-6.15 =8.65 grams
2. Raw mackerel
Raw mackerel contains 13.9 percent total fat. In the computation, 77 percent cooking yield and no fat loss during cooking was used (SR code/FPID code 15046) Non-fat, lean portion present in 77 grams of mackerel =77-13.9
=63.1 grams Number of ounce equivalents of seafood =63.1/25.72
=2.45 Allowable oils =2.63x2.45
=6.44 grams Oils present above the allowable limit =13.9-6.44
=7.46 grams

50 FPED: Determination of Ounce Equivalents of Lean Meat in Raw Meat, Poultry, and Seafood as an Ingredient: Where Moisture and/or Fat Loss Are Assumed
FNDDS fat loss and/or moisture loss information as shown in the examples below. The cooking yield less than 100 percent is a result of moisture loss, fat loss, or both.
% cooking yield= 100 –%moisture lost - % fat lost
The moisture lost from the meat and poultry ingredients are computed as follows:
• Calculate moisture present in each ingredient • Add the moisture from each ingredient to get the total moisture of the food • Calculate the proportion of moisture from each ingredient to the total
moisture of the food • Allocate moisture loss to each ingredient in the proportion computed in the
above step
The fat loss is allocated to the specific type of fat in the fat type variable in the FNDDS. Generally, the fat is lost from the meat or poultry ingredient.
Example:
Chicken breast fried, skin not eaten
FNDDS food code 24124100
The purpose of this example is to demonstrate the calculation of ounce equivalents of lean poultry and solid fats from the chicken. Based on the fat type information, fat is lost from the poultry only and not from the vegetable shortening present as an ingredient. All of the fat from vegetable shortening will count toward solid fat.
Moisture loss in cooking=31% Fat loss in cooking=4.2% Cooking yield= 64.8%
Ingredients needed to make 100 grams of fried chicken (no skin eaten) (amount rounded to one decimal place):
Chicken breast, raw =151.7g
Vegetable shortening =1.5 g
Salt =1.1g
Total ingredient weight =154.3 g
Moisture loss during cooking =154.3x(31/100)=47.8g
Fat loss is during cooking =154.3x(4.2/100)= 6.5 g
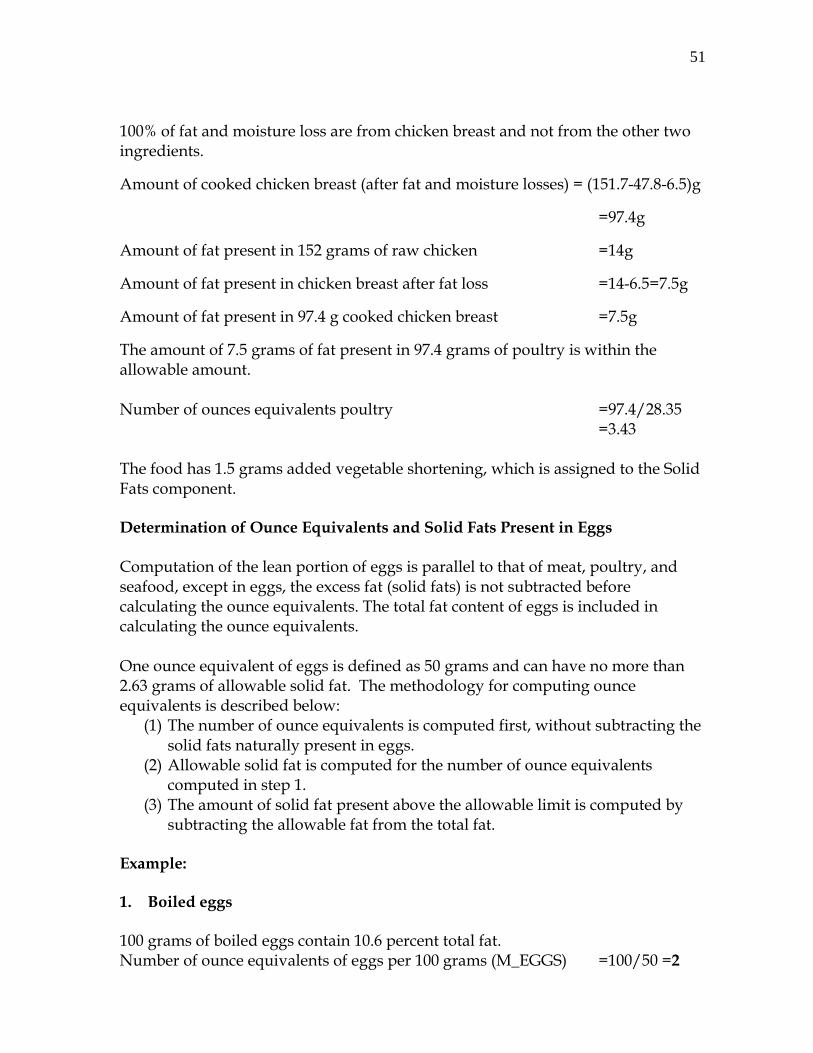
51 100% of fat and moisture loss are from chicken breast and not from the other two ingredients.
Amount of cooked chicken breast (after fat and moisture losses) = (151.7-47.8-6.5)g
=97.4g
Amount of fat present in 152 grams of raw chicken =14g
Amount of fat present in chicken breast after fat loss =14-6.5=7.5g
Amount of fat present in 97.4 g cooked chicken breast =7.5g
The amount of 7.5 grams of fat present in 97.4 grams of poultry is within the allowable amount. Number of ounces equivalents poultry =97.4/28.35 =3.43 The food has 1.5 grams added vegetable shortening, which is assigned to the Solid Fats component. Determination of Ounce Equivalents and Solid Fats Present in Eggs Computation of the lean portion of eggs is parallel to that of meat, poultry, and seafood, except in eggs, the excess fat (solid fats) is not subtracted before calculating the ounce equivalents. The total fat content of eggs is included in calculating the ounce equivalents. One ounce equivalent of eggs is defined as 50 grams and can have no more than 2.63 grams of allowable solid fat. The methodology for computing ounce equivalents is described below:
(1) The number of ounce equivalents is computed first, without subtracting the solid fats naturally present in eggs.
(2) Allowable solid fat is computed for the number of ounce equivalents computed in step 1.
(3) The amount of solid fat present above the allowable limit is computed by subtracting the allowable fat from the total fat.
Example: 1. Boiled eggs 100 grams of boiled eggs contain 10.6 percent total fat. Number of ounce equivalents of eggs per 100 grams (M_EGGS) =100/50 =2

52 Allowable fat per 2 ounces of eggs =2.63 x2 =5.26 grams Solid fat present above the allowable limit =10.6-5.26 =5.34 grams Solid fat present per oz eq. of eggs =5.34/2 =2.67 grams Determination of Ounce Equivalents and Oils Present in Nuts
Computation of lean portion of nuts is parallel to that of meat, poultry, and seafood, except in nuts, the excess fat (oils) is not subtracted before calculating the ounce equivalents. All fat present in nuts are included in calculating the ounce equivalents. The oil present above the allowable limit is calculated using the number of ounce equivalents. One ounce equivalent of nuts is defined as ½ ounce or 14.175 grams. The fats naturally present in nuts are defined as oils. The methodology for computing ounce equivalents is described below:
(1) The number of ounce equivalents is computed first, without subtracting the oils naturally present in nuts.
(2) Allowable oil is computed for the number of ounce equivalents computed in the above step.
(3) The amount of oils above the allowable limit is computed by subtracting the allowable fat from the total fat.
The oil present above the allowable limit is calculated using the number of ounce equivalents. As a result, the amount of oil present in one ounce equivalent of nuts will vary, as shown in the following examples. Examples: 1. Dry roasted almonds Dry roasted almonds contain 52.8 percent total fat. Number of ounce equivalents of nuts per 100 grams =100/14.175 =7.05 Allowable oils in 7.05 ounce equivalents =2.63 x7.05 =18.5 grams Oils present above the allowable limit =52.8-18.5 =34.3 grams

53 100 grams of roasted almonds contain 7.05 ounce equivalents and each ounce equivalent of roasted almonds will contain 7.49 grams (52.8/7.05) of fat, of which 4.86 grams (7.49-2.63) is also assigned to Oils component. 2. Macadamia nuts Macadamia nuts contain 76.1 percent total fat. Number of ounce equivalents of nuts per 100 grams =100/14.175 =7.05 Allowable oils in 7.05 ounce equivalents =2.63 x7.05 =18.5 grams Oils present above the allowable limit =76.1-18.5 =57.6 grams Each ounce equivalent of macadamia nuts will contain 10.8 grams of fat (76.1/7.05), of which 8.17 grams (10.8-2.63) is also assigned to Oils component. Table 14 includes examples of the amount of oils present in one ounce equivalent of selected nuts. Table 14. Amount of Oils Present in One Ounce Equivalent of Selected Nuts Name Fat content per
100 grams of nuts (g)
No. of ounce equivalents per 100 grams nuts
Amount of oils present per ounce equivalent of nuts (g) [A/7.05]
A B D Almonds 55.1 7.05 7.8 Mixed nuts 51.4 7.05 7.3 Peanuts 49.6 7.05 7.0 Pecans 71.9 7.05 10.2 Pistachio 45.9 7.05 6.5 Walnuts 65.2 7.05 9.2 Multi-ingredient Foods Containing Protein Foods
Proteins foods present in multi-ingredient foods such as sandwiches and subs; rice and meat or chicken dishes; soups; pizza; hotdogs; and frozen dinners are assigned to the appropriate Protein Foods components.

54 Chapter 8 Added Sugars Added sugars are defined as sugars that are added to foods as an ingredient during preparation, processing, or at the table. Added sugars do not include naturally occurring sugars such as lactose present in milk and fructose present in fruits. Examples of added sugars include brown sugar, cane sugar, confectioners’ sugar, granulated sugar, dextrose, white sugar, corn syrup and corn syrup solids, molasses, honey, and all types of syrups such as maple syrup, table syrups, and pancake syrup. Appendix 1 lists added sugars included in FPED.
Determination of Teaspoon Equivalents of Added Sugars
One teaspoon equivalent of added sugars is computed using the sugar content of foods defined as added sugars. One teaspoon equivalent of added sugars is defined as 4.2 grams of sugars, the amount present in one teaspoon of granulated sugar.
Computation of Added Sugars
The sugar contents (in grams) of foods that are defined as added sugar are divided by 4.2 to obtain the number of teaspoon equivalents of added sugars.
Examples:
1. Granulated sugar The sugar content of 100 grams of granulated sugar =98.8 grams Number of teaspoon equivalents present in 100g granulated sugar =98.8/4.2 =23.5
2. Maple syrup The sugar content of 100 grams of maple syrup =60.4 grams Number of teaspoon equivalents present in 100g maple syrup =60.4/4.2 =14.4
3. Presweetened herbal tea The sugar content of 100 grams of presweetened herbal tea =5 grams Number of teaspoon equivalents present in 100g of herbal tea =5/4.2 =1.2 Multi-ingredient Foods Containing Added Sugars
Ingredients that are added sugars present in multi-ingredient foods such as cakes, cookies, milk shakes, and ice cream are assigned to the Added Sugars component.

55 Chapter 9
Oils
Oils include unhydrogenated vegetable oils, except palm oil, palm kernel oil, and coconut oil, and fats naturally present in nuts, seeds, avocado, olives, and seafood. Unhydrogenated vegetable oils present in all types of margarines (stick, tub, spread, etc.) are assigned to oils. Appendix 1 lists oils included in FPED. Margarine In MPED, tub margarines and margarine-like spreads were assigned to the Oils component and stick margarines were assigned to the Solid Fats component. We examined the food labels of these margarines. Almost all of the margarines, whether stick, tub, or spread have unhydrogenated vegetable oils as the first ingredient; partially hydrogenated oils and/or palm oil as the next ingredient(s); and water. As per the guiding principles used in developing FPED, the unhydrogenated vegetable oils present in margarines are assigned to Oils component; and the partially hydrogenated oils, palm oil, and palm kernel oils present in margarines are assigned to Solid Fats. We were unable to obtain data on the proportion of unhydrogenated vegetable oils and oils that are defined as solid fats in margarines. For this reason, the fat present in margarine was divided equally between Oils and Solid Fats. That is, margarine with a fat content of 80 grams per 100 grams is assigned 40 grams each to Oils and Solid Fats. Avocado and Olives For the first time, the fats naturally present in olives and avocados above 2.25 grams per cup equivalent are assigned to the Oils component. This amount translates to 1.5 grams per 100 grams of allowable fat. In MPED, all of the fats naturally present in avocado and olives were considered as allowable fat and not assigned to the Oils component.
Fats Naturally Present in Seafood, Nuts and Seeds The gram equivalents of oils present in seafood and nuts and seeds are computed after subtracting 2.63 grams of allowable fat per ounce equivalents of protein foods, from the total fat. Details on the computation of oils present in seafood and nuts and seeds are explained in the Protein Foods Section (Chapter 7).

56 Determination of Number of Equivalents of Oils
One gram of oil is defined as one equivalent. The following examples describe the computation of oil equivalents in 100 grams of food.
Examples: 1. Vegetable oils
Vegetable oils such as almond, canola, corn, peanut, sunflower, and soybean containing 100 grams of fat per 100 grams Gram equivalents of oils in 100 grams of vegetable oil =100
2. Margarine, tub Tub margarine containing 60 grams of fat per 100 gram Gram equivalents of Oils in 100 grams of tub margarine =60/2=30 Gram equivalents of Solid Fats in 100 grams of tub margarine =60/2=30
Multi-ingredient Foods Containing Oils
Oils present in multi-ingredient foods such fried vegetables, fried rice, fish dishes, ready-to-eat cereals that contain nuts, mayonnaise, and salad dressings are assigned to the Oils component.

57 Chapter 10
Solid Fats Solid fats include fats naturally present in dairy products such as milk, cheese, butter, cream, cream cheese, and sour cream; fats naturally present in meat, poultry, and eggs; lard; hydrogenated or partially hydrogenated fats and shortenings; cocoa butter; coconut oil; and palm oil. The fats present in stick and tub margarines and margarine spreads was divided equally between Oils and Solid Fats. Appendix 1 lists solid fats included in FPED.
Determination of Number of Equivalents of Solid Fats
One gram of fat is defined as one equivalent. The following examples describe the computation of solid fats equivalents in 100 grams of food.
Examples: 1. Coconut oil or palm oil
Vegetable oils such as coconut and palm oil containing 100 grams of fat per 100 grams Gram equivalents of solid fats per 100 grams of coconut or palm oil =100
2. Coconut meat, raw Raw coconut meat containing 33.5 grams of fat per 100 grams Gram equivalents of solid fats per 100 grams of raw, coconut meat =33.5
3. Butter Butter containing 81.1 grams of fat per 100 grams Gram equivalents of solid fats per 100 grams of butter =81.1
4. Stick margarine Stick margarine containing 80 grams of fat per 100 grams Gram equivalents of Oils in 100 grams of tub margarine =80/2
=40 Gram equivalents of Solid Fats in 100 grams of tub margarine =80/2
=40
Solid Fats Naturally Present in Dairy, Meat, Poultry, and Eggs The gram equivalents of solid fats present in meat, poultry, and eggs are computed after subtracting 2.63 grams of allowable fat per ounce equivalents of these protein foods, from the total fat. The amount of allowable fat in the Dairy component is 1.5 grams per cup equivalent. Details on the computation of solid

58 fats present in meat, poultry, and eggs are explained in the Dairy and Protein Foods sections.
Multi-ingredient Foods Containing Solid Fats
Solid fats present in multi-ingredient foods such as cakes, cookies, pies, pizza, meat dishes, and ice cream are assigned to the Solid Fats component.

59 Chapter 11
Alcoholic Drinks Alcoholic Drinks include all types of beers; all types of wines; distilled spirits such as brandy, gin, rum, vodka, and whiskey; and cordials and liqueurs. Appendix 1 lists alcoholic drinks included in FPED.
Determination of Number of Drinks
In general, 12 fluid ounces of beer, 5 fluid ounces of wine, or 1.5 fluid ounces of 80-proof distilled spirit is considered as one drink and contains about 14 grams of ethanol. Based on this, in FPED, one drink was defined as the amount of alcoholic beverage containing 0.6 fluid ounce or 14 grams of ethanol. FNDDS foods that had alcoholic beverages used in cooking are considered not having any residual ethanol and therefore, do not contain alcoholic drinks equivalents. If alcoholic beverages are added to a food after cooking, credit is given for alcoholic drinks equivalents (e.g., no-bake rum ball cookie, zabaglione). The following examples describe the computation of the number of alcoholic drinks in 100 grams of beverages.
Examples: 1. Dessert Wine
Dessert wine containing 15.3 grams of ethanol per 100 grams Number of alcoholic drinks per 100 grams =15.3/14=1.09
2. Martini Martini containing 32.2 grams of ethanol per 100 grams Number of alcoholic drinks per 100 grams =32.2/14=2.3
3. Whiskey Whiskey containing 36 grams of ethanol per 100 grams Number of alcoholic drinks per 100 grams =36/14=2.57
4. Crème de menthe Crème de menthe containing 29.8 grams of ethanol per 100 grams Number of alcoholic drinks per 100 grams =29.8/14=2.13
5. No-bake rum ball cookie No-bake rum ball cookie containing 3.6 grams of ethanol per 100 grams Number of alcoholic drinks per 100 grams =3.5/14=0.25
60 6. Zabaglione
Zabaglione containing 7.7 grams of ethanol per 100 grams Number of alcoholic drinks per 100 grams =7.7/14=0.55
Multi-ingredient Foods Containing Alcohol (Ethanol)
Alcohol (ethanol) present in beverages such as cocktails and alcoholic beverages that are added to multi-ingredient foods after cooking are assigned to the Alcoholic Drinks component.
61
References
1. U.S. Department of Agriculture and U.S. Department of Health and Human Services. 2010. The Dietary Guidelines for Americans, 2010. Published by the U.S. Department of Health and Human Services and U.S. Department of Agriculture, Washington, D.C. January 2011. Available at: http://www.health.gov/dietaryguidelines/dga2010/DietaryGuidelines2010.pdf Accessed June 20, 2013.
2. U.S. Department of Agriculture, Center for Nutrition Policy and Promotion. Alexandria,
Virginia. Choose MyPlate Web Site. Available at: http://www.choosemyplate.gov Accessed June 20, 2013.
3. U.S. Department of Agriculture, Agricultural Research Service, Beltsville Human
Nutrition Research Center, Food Surveys Research Group, Beltsville, Maryland, and U.S. Department of Health and Human Services, Centers for Disease Control and Prevention, National Center for Health Statistics (Hyattsville, Maryland). What We Eat in America, NHANES 2009-2010. Dietary Interview (Individual Foods File) (Data, Documentation, Codebooks, SAS Code). Available at: http://www.cdc.gov/nchs/nhanes/nhanes2009-2010/nhanes09_10.htm Accessed June 20, 2013.
4. U.S. Department of Agriculture, Agricultural Research Service, Beltsville Human
Nutrition Research Center, Food Surveys Research Group. Beltsville, Maryland. Food and Nutrient Database for Dietary Studies 5. Available at: http://www.ars.usda.gov/ba/bhnrc/fsrg Accessed June 20, 2013.
5. Bowman SA, Friday JE, Moshfegh A. (2008). MyPyramid Equivalents
Database, 2.0 for USDA Survey Foods, 2003-2004 [Online] Food Surveys Research Group. Beltsville Human Nutrition Research Center, Agricultural Research Service, U.S. Department of Agriculture, Beltsville, Maryland. Available at: http://www.ars.usda.gov/ba/bhnrc/fsrg Accessed June 20, 2013.
6. Bowman SA, Martin CL, Carlson JL, Clemens JC, Lin B-H, and Moshfegh AJ. 2013. Food Intakes Converted to Retail Commodities Databases: 2003-08: Methodology and User Guide. U.S. Department of Agriculture, Agricultural Research Service, Beltsville, MD, and U.S. Department of Agriculture, Economic Research Service, Washington, D.CAvailable at: http://www.ars.usda.gov/ba/bhnrc/fsrg Accessed July30, 2013.
7. U.S. Department of Agriculture, Center for Nutrition Policy and Promotion. Alexandria, Virginia. SuperTracker Web Site. Available at: http://www.choosemyplate.gov/supertracker-tools/supertracker.html Accessed June 20, 2013.

62
8. Guenther, P.M., Reedy, J., Krebs-Smith, S.M., Reeve, B.B., & Basiotis, P.P. (2007).
Development and Evaluation of the Healthy Eating Index-2005: Technical Report. Center for Nutrition Policy and Promotion, U.S. Department of Agriculture. Available at: http://www.cnpp.usda.gov/HealthyEatingIndex.htm Accessed June 20, 2013.
9. Carlson, A., Lino, M., Juan, W-Y., Hanson, K., & Basiotis, P.P. (2007). Thrifty Food Plan,
2006. (CNPP-19). U.S. Department of Agriculture, Center for Nutrition Policy and Promotion. Available at: http://www.cnpp.usda.gov/Publications/FoodPlans/MiscPubs/TFP2006Report.pdf Accessed June 20, 2013.
10. U.S. Department of Health and Human Services. Washington, D.C. Healthy People 2020 Web Site. Available at: http://www.healthypeople.gov/2020/default.aspx Accessed June 20, 2013.
11. U.S. National Institutes of Health, National Cancer Institute. Bethesda, Maryland.
National Cancer Institute’s Risk Factor Monitoring and Methods Web Site. Available at: http://riskfactor.cancer.gov/diet Accessed June 20, 2013.
12. Bowman S, Friday J, Clemens J, Moshfegh A. 2011. Estimation of Grain Equivalents in
Foods: A Critical Review of Methodology. 36th National Nutrient Databank Conference, April 8, 2011, Bethesda, MD.
13. Food and Drug Administration. FDA Food Code: Annex 6- Food Processing Criteria.
Smoking and Curing: Definitions. Available at: http://www.fda.gov/Food/GuidanceRegulation/RetailFoodProtection/FoodCode/ucm188201.htm Accessed June 20, 2013.
14. Marcoe K, Juan W, Yamini S, Carlson A, Britten P. 2006. Development of Food Group Composites and Nutrient Profiles for the MyPyramid Food Guidance System. Journal of Nutrition Education and Behavior. 38:S93-S107.
15. Reference Amounts Customarily Consumed per Eating Occasion: General Food Supply
(Table 2), 21 C.F.R. § 101.12 (2012).

Appendix 1: List of Foods Included in the Food Patterns Components, Units, and FPED/FPID Variable Names in Parenthesis
Fruit Components (cup eq.)
Foods
Total Fruit (F_TOTAL)
Includes the sum of all foods in the Fruit components listed below:
Citrus, Melons, and Berries (F_CITMLB)
Blackberries Blueberries Boysenberries Calamondin Cantaloupe Casaba Cranberries Dewberries Grapefruit Honeydew Huckleberries Juneberries Kiwi fruit
Kumquats Lemons Limes Loganberries Mandarins Mulberries Oranges Raspberries Strawberries Tangelos Tangerines Watermelon Youngberries
Other Fruits (F_OTHER)
Apples Apricots Bananas Cherries Currants Dates Figs Grapes Guava Lychees Mangoes Nectarines Papayas
Passion fruits Peaches Pears Persimmons Pineapple Plums (Ciruelas) Pomegranates Prunes Raisins Rhubarb Soursop (Guanabana) Starfruit (Carambola) Tamarind
Fruit Juice (F_JUICE)
Citrus and non-citrus fruit juices
63

Vegetables Components (cont.) (cup eq.)
Foods
Other Red and Orange Vegetables (V_REDOR _OTHER)
Calabaza (Spanish pumpkin)
Carrots Carrot juice Red colored bell,
and nonbell peppers
Pimiento Pumpkin Squash (most winter
varieties) Sweet potatoes
Total Starchy Vegetables (V_STARCHY _TOTAL)
Includes the sum of all foods in the Potatoes and Other Starchy Vegetables components listed below:
Potatoes (V_STARCHY _POTATO)
White potatoes White potato flour
White potato flakes
Other Starchy Vegetables (V_STARCHY _OTHER)
Breadfruit Burdock Cassava (Yuca
blanca) Corn, sweet
(raw) Dasheen Green bananas Hominy Jicama (Yam
beans) Lima beans,
immature Lotus root
Parsnips Immature peas (e.g.,
immature cowpeas, blackeye peas, green peas, pigeon peas)
Plantains Salsify Tannier Tapioca Taro Water chestnuts Yams
Vegetables Components (cup eq.)
Foods
Total Vegetables (V_TOTAL)
Includes the sum of all foods in the Vegetables components listed below except beans and peas (legumes):
Dark Green Vegetables (V_DRKGR)
Arugula Basil Beet greens Bitter melon leaves Broccoli Chinese Cabbage
(pak-choi) Chrysanthemum
garland Chard Chicory leaves Cilantro
(Coriander) Collards Cress Dandelion greens Endive Escarole Greens
Horseradish leaves Kale Lambsquarters Leaves of grapes,
pumpkin, squash, sweet potato, swamp cabbage, taro, and thistle
Lettuce (Boston, butterhead, green or red leaf, Cos or Romaine)
Mustard cabbage Mustard greens Parsley Poke greens Spinach Turnip greens Watercress
Total Red and Orange Vegetables (V_REDOR _TOTAL)
Includes the sum of all foods in the Tomatoes and Other Red and Orange Vegetables components listed below:
Tomatoes (V_REDOR _TOMATO)
Tomatoes (canned, cooked, raw, stewed)
Tomatoes, dried Tomato juice
Tomato paste Tomato puree Tomato sauce
64

Vegetables Components (cont.) (cup eq.)
Foods
Other Vegetables (V_OTHER)
Alfalfa sprouts Artichoke Asparagus Avocado Bamboo shoots Beans (green,
yellow, snap, string)
Bean sprouts Beets Bitter melon
(bitter gourd, balsam pear)
Broccoflower Brussels sprouts Cabbage Cactus (Nopales) Capers Cauliflower Celeriac Celery Chayote (Christophine) Chinese cabbage
(Pei-tsai) Chinese okra
(Luffa) Chives Cucumber Eggplant Fennel bulb Flowers, edible Garlic Ginger root Horseradish pods
Jute Kohlrabi Leeks Lettuce (varieties not
in dark green category)
Mushrooms Okra Olives Onions Palm hearts Peas, podded Peppers, bell and
nonbell peppers (not red or orange in color)
Pokeberry shoots Radicchio Radish Rutabaga Scallions Seaweed Snow peas Sprouted beans (e.g.
mung, soybean) Squash (green,
sequin, spaghetti, yellow, zucchini, most summer varieties)
Tomatillos Tomatoes, green Turnips Winter melon (Wax
gourd)
Vegetables Components (cont.) (cup eq.)
Foods
Beans and Peas (Legumes) (V_LEGUMES)
Includes all mature beans and peas (legumes) such as:
Black beans Blackeye peas Brown beans Bayo beans Calico beans Carob Chickpeas
(Garbanzo beans)
Cowpeas Fava beans
Kidney beans Lentils Mature lima beans Mung beans Navy beans Pink beans Pinto beans Red Mexican beans Soybeans (raw) Split peas White beans
65

Grains Components (oz. eq.)
Foods
Total Grains (G_TOTAL)
Includes the sum of all foods in the Grains components listed below:
Whole Grains (G_WHOLE)
Amaranth Barley, whole Barley flour
(whole barley) Barley meal Brown rice Brown rice flour Buckwheat groats Bulgur Corn, whole grain Corn meal or flour
(whole grain)
Millett Oats Oat flour Oatmeal Popcorn Quinoa Rye, whole grain Rye flour (dark) Triticale Wheat Whole wheat flour Wild rice
Refined Grains (G_REFINED)
Barley, pearled Barley, pearled,
flour Barley malt flour Bran (all grains) Corn flour or
meal, degermed Corn grits Cream of wheat Couscous Farina
Masa Oat flour, debranned Rice (milled, not
whole grain ) Rice, milled, flour Rye flour (light and
medium) Semolina Wheat flour (milled,
not whole grain) Wheat germ
66

Protein Foods Components (oz. eq.)
Foods
Total Protein Foods (PF_ TOTAL)
Includes the sum of all foods in the Protein Foods components listed below except Beans and Peas:
Total Meat, Poultry, and Seafood (PF_MPS_TOTAL)
Includes the sum of all foods in the Meat, Cured Meat, Organ Meat, Poultry, Seafood High in n-3, and Seafood Low in n-3 components listed below:
Meat (PF_MEAT)
Armadillo Bacon (not cured) Bear Beaver Beef Bison Caribou Game meat
(other) Goat Ground hog Ham (not cured)
Lamb Moose Opossum Oxtail Pork Rabbit Raccoon Squirrel Veal Venison Wild pig
Protein Foods Components (cont.) (oz. eq.)
Foods
Cured Meat (PF_CUREDMEAT)
Bacon Beef sausage Beef luncheon
meat Blood sausage Bockwurst Bologna Bratwurst Braunschweiger Capicola Cervelat Chicken sticks Chicken luncheon
meat Chicken or turkey
loaf Chorizo Cold cut deli meat Corned beef Chipped beef Dutch brand loaf Frankfurters Ham (cured,
smoked, deli, deviled, loaf, luncheon meat, minced)
Head cheese Honey loaf
Hotdogs Italian sausage Jerky (all meats) Kielbasa Knockwurst Liverwurst Meat spreads Meat sticks Mettwurst Mortadella Pastrami Pepperoni Pepper loaf Polish sausage Pork luncheon meat Pork sausage Potted meats Salami Sandwich loaf Souse Thuringer Turkey luncheon
meat Turkey sausage Turkey, smoked Turkey sticks Veal loaf Vienna sausage
Organ Meat (PF_ORGAN)
Brain Chitterlings Giblets Gizzard Heart Kidney
Liver Stomach Sweetbreads Thymus Tongue Tripe
67

Protein Foods Components (cont.) (oz. eq.)
Foods
Eggs (PF_EGGS)
Eggs, whole (chicken, duck, goose, quail, and other birds)
Egg white Egg yolk Egg substitute Egg, dried
Soy Products (PF_SOY)
Miso Natto Soybean Soybean curd or
tofu Soybean flour Soybean meal
Soybean protein isolate and concentrate
Soy milk (not calcium fortified)
Soy nuts
Nuts and Seeds (PF_NUTSDS)
Almonds Almond butter Almond paste Brazil nuts Cashew Cashew butter Chestnuts Flax seeds Hazelnuts Macadamia nuts Peanuts Peanut butter
Peanut flour Pecans Pine nuts Pistachios Pumpkin seeds Squash seeds Sesame butter
(tahini) Sesame seeds Sesame paste Sunflower seeds Walnuts
Beans and Peas (Legumes) (PF_LEGUMES)
See under Vegetables, Beans and Peas component for the list of foods
Protein Foods Components (cont.) (oz. eq.)
Foods
Poultry (PF_POULT)
Chicken Cornish game hen Dove Duck Goose
Ostrich Pheasant Quail Turkey
Seafood High in n-3 Fatty Acids (PF_SEAFD_HI)
Anchovy Barracuda Caviar (roe) Cisco Herring Mackerel Pompano Ray Salmon Sardine
Sea bass Shad Shark Squid Swordfish Trout Tuna (albacore and
bluefin) Whitefish
Seafood Low in n-3 Fatty Acids (PF_SEAFD_LOW)
Abalone Carp Catfish Clams Cod Crab Crayfish Croaker Eel Flounder Frog legs Haddock Halibut Lobster Mullet Mussels Ocean perch Octopus
Oyster Perch Pike Pollock Porgy Scallop Scup Shrimp Snail Snapper Sole Sturgeon Tilapia Tuna (except
albacore and bluefin)
Turtle Whiting
68

Dairy Components (cont.) (cup eq.)
Foods
Cheese (D_CHEESE)
Includes natural and processed cheeses of all fat-types such as:
American cheese Blue cheese Brick cheese Brie cheese Camembert
cheese Cheddar cheese Colby cheese Colby Jack cheese Cottage cheese Cream cheese, fat
free Edam cheese Feta cheese Fontina cheese Goat cheese Gouda cheese Gruyere cheese Limburger cheese
Mexican blend Monterey cheese Mozzarella cheese Muenster cheese Parmesan cheese Pasteurized cheese Port de salut cheese Provolone cheese Ricotta cheese Romano cheese Roquefort Swiss cheese Queso anejo Queso asadero Queso Chiluahua Queso del pais,
blanco Queso fresco
Dairy Components (cup eq.)
Foods
Total Dairy (D_TOTAL)
Includes the sum of all foods in the Dairy components listed below, plus the following:
Whey
Milk (D_MILK)
Includes fluid milk and calcium added soy milk of all fat-types such as:
Buttermilk Evaporated milk Filled milk Milk, dry Milk, evaporated
Milk, fluid Goat milk, fluid Soy milk, calcium
added
Yogurt (D_YOGURT)
Includes yogurt of all fat-types and yogurt present in flavored and frozen yogurt
69

Oils Component (grams)
Foods
Oils (OILS)
Includes fats naturally present in seafood, nuts, and seeds and the following:
Almond oil Canola oil Corn oil Cottonseed oil Fish oil Flaxseed oil Olive oil Peanut oil Rapeseed oil
Safflower oil Sesame oil Spreads Soybean oil Sunflower oil Vegetable oil Walnut oil Wheat germ oil
Added Sugars Component (tsp. eq.)
Foods
Added Sugars (ADD_SUGARS)
Brown Sugar Cane syrup Corn Syrups Corn syrup solids Dextrose Fructose Fruit syrups
Honey Maple syrup Molasses Pancake syrups Raw sugar Sorghum syrups White sugar
Solid Fats Component (grams)
Foods
Solid Fats (SOLID_FATS)
Includes fats naturally present in milk products, meat, poultry, eggs and the following:
Butter Cocoa butter Cocoa fat Coconut cream Coconut oil Cream Cream substitute Cream Cheese,
regular and low-fat
Ghee Hydrogenated oils Lard Palm oil Tallow Shortening (animal
and vegetable) Sour cream
Alcoholic Drinks Component (no. of drinks)
Foods
Alcoholic Drinks (A_DRINKS)
Includes: Beer Wine Distilled spirits Alcohol (ethanol) present in cocktails and other alcoholic beverages Alcohol (ethanol) added to foods after cooking
70

71
Appendix 2: Connecting MPED 2.0 and FPED Variables
MPED 2.0 Variables FPED Variables Foods in FPED Variables (units) F_TOTAL F_TOTAL Total intact fruits (whole or cut) and fruit juices (cup eq.) F_CITMLB1 F_CITMLB Intact fruits (whole or cut) of citrus, melons, and berries (cup eq.) F_OTHER1 F_OTHER Intact fruits (whole or cut); excluding citrus, melons, and berries (cup eq.) -- F_JUICE2 Fruit juices, citrus and non citrus (cup eq.) V_TOTAL V_TOTAL Total dark green, red and orange, starchy, and other vegetables; excludes legumes
(cup eq.) V_DRKGR V_DRKGR Dark green vegetables (cup eq.) -- V_REDOR_TOTAL2 Total red and orange vegetables (tomatoes and tomato products + other red and
orange vegetables) (cup eq.) V_TOMATO V_REDOR_TOMATO Tomatoes and tomato products (cup eq.) V_ORANGE V_REDOR_OTHER Other red and orange vegetables, excluding tomatoes and tomato products (cup eq.) -- V_STARCHY_TOTAL2 Total starchy vegetables (white potatoes + other starchy vegetables) (cup eq.) V_POTATO V_STARCHY_POTATO White potatoes (cup eq.) V_STARCY V_STARCHY_OTHER Other starchy vegetables, excluding white potatoes (cup eq.) V_OTHER V_OTHER Other vegetables not in the vegetable components listed above (cup eq.) LEGUMES V_LEGUMES Beans and peas (legumes) computed as vegetables (cup eq.) G_TOTAL G_TOTAL Total whole and refined grains (oz. eq.) G_WHL G_WHOLE Grains defined as whole grains and contain the entire grain kernel ― the bran, germ,
and endosperm (oz. eq.) G_NWHL G_REFINED Refined grains that do not contain all of the components of the entire grain kernel
(oz. eq.) -- PF_TOTAL2 Total meat, poultry, organ meat, cured meat, seafood, eggs, soy, and nuts and seeds;
excludes legumes (oz. eq.) M_MPF PF_MPS_TOTAL Total of meat, poultry, seafood, organ meat, and cured meat (oz. eq.) M_MEAT3 PF_MEAT Beef, veal, pork, lamb, and game meat; excludes organ meat and cured meat (oz. eq.) M_FRANK3 PF_CUREDMEAT Frankfurters, sausages, corned beef, and luncheon meat that are made from beef, pork,
or poultry (oz. eq.) M_ORGAN PF_ORGAN Organ meat from beef, veal, pork, lamb, game, and poultry (oz. eq.) M_POULT PF_POULT Chicken, turkey, Cornish hens, duck, goose, quail, and pheasant (game birds);
excludes organ meat and cured meat (oz. eq.)

72
MPED 2.0 Variables FPED Variables Foods in FPED Variables (units) M_FISH_HI PF_SEAFD_HI Seafood (finfish, shellfish, and other seafood) high in n-3 fatty acids (oz. eq.) M_FISH_LO PF_SEAFD_LOW Seafood (finfish, shellfish, and other seafood) low in n-3 fatty acids (oz. eq.) M_EGG PF_EGGS Eggs (chicken, duck, goose, quail) and egg substitutes (oz. eq.) M_SOY4 PF_SOY Soy products, excluding calcium fortified soy milk and immature soybeans (oz. eq.) M_NUTSD PF_NUTSDS Peanuts, tree nuts, and seeds; excludes coconut (oz. eq.) -- PF_LEGUMES2 Beans and Peas (legumes) computed as protein foods (oz. eq.) D_TOTAL D_TOTAL Total milk, yogurt, cheese, and whey. For some foods, the total dairy values could be
higher than the sum of D_MILK, D_YOGURT, and D_CHEESE because Miscellaneous dairy component composed of whey which is not included in FPED as a separate variable. (cup eq.)
D_MILK4 D_MILK Fluid milk, buttermilk, evaporated milk, dry milk, and calcium fortified soy milk (cup eq.)
D_YOGURT D_YOGURT Yogurt (cup eq.) D_CHEESE D_CHEESE Cheeses (cup eq.) DISCFAT_OIL OILS Fats naturally present in nuts, seeds, and seafood; unhydrogentated vegetable oils,
except palm oil, palm kernel oil, and coconut oils; fat present in avocado and olives above the allowable amount; 50% of fat present in stick and tub margarines and margarine spreads (grams)
DISCFAT_SOL SOLID_FATS Fats naturally present in meat, poultry, eggs, and dairy (lard, tallow, and butter); hydrogenated or partially hydrogenated oils; shortening, palm, palm kernel and coconut oils; fat naturally present in coconut meat and cocoa butter; and 50% of fat present in stick and tub margarines and margarine spreads (grams)
ADD_SUG ADD_SUGARS Foods defined as added sugars (tsp. eq.) A_BEV A_DRINKS Alcoholic beverages and alcohol (ethanol) added to foods after cooking (no. of drinks)
1 Fruit juices were included in the individual fruit subgroups in MPED 2.0
2 New variables, not in MPED 2.0 3 Cured or smoked ham and turkey were included in the M_MEAT subgroup in MPED 2.0 4 Soy milk was included in the M_SOY subgroup in MPED 2.0

73
Appendix 3: Food Patterns Equivalents Ingredients Database (FPID) Variables
FPID Variables Description (units) CODE Food code DESCRIPTION Food description F_TOTAL Total intact fruits (whole or cut) and fruit juices (cup eq.) F_CITMLB Intact fruits (whole or cut) of citrus, melons, and berries (cup eq.) F_OTHER Intact fruits (whole or cut); excluding citrus, melons, and berries (cup eq.) F_JUICE Fruit juices, citrus and non citrus (cup eq.) V_TOTAL Total dark green, red and orange, starchy, and other vegetables; excludes legumes (cup eq.) V_DRKGR Dark green vegetables (cup eq.) V_REDOR_TOTAL Total red and orange vegetables (tomatoes and tomato products + other red and orange vegetables)
(cup eq.) V_REDOR_TOMATO Tomatoes and tomato products (cup eq.) V_REDOR_OTHER Other red and orange vegetables, excluding tomatoes and tomato products (cup eq.) V_STARCHY_TOTAL Total starchy vegetables (white potatoes + other starchy vegetables) (cup eq.) V_STARCHY_POTATO White potatoes (cup eq.) V_STARCHY_OTHER Other starchy vegetables, excluding white potatoes (cup eq.) V_OTHER Other vegetables not in the vegetable components listed above (cup eq.) V_LEGUMES Beans and peas (legumes) computed as vegetables (cup eq.) G_TOTAL Total whole and refined grains (oz. eq.) G_WHOLE Grains defined as whole grains and contain the entire grain kernel ― the bran, germ, and endosperm
(oz. eq.) G_REFINED Refined grains that do not contain all of the components of the entire grain kernel (oz. eq.) PF_TOTAL Total meat, poultry, organ meat, cured meat, seafood, eggs, soy, and nuts and seeds; excludes
legumes (oz. eq.) PF_MPS_TOTAL Total of meat, poultry, seafood, organ meat, and cured meat (oz. eq.) PF_MEAT Beef, veal, pork, lamb, and game meat; excludes organ meat and cured meat (oz. eq.) PF_CUREDMEAT Frankfurters, sausages, corned beef, and luncheon meat that are made from beef, pork, or poultry
(oz. eq.) PF_ORGAN Organ meat from beef, veal, pork, lamb, game, and poultry (oz. eq.) PF_POULT Chicken, turkey, Cornish hens, duck, goose, quail, and pheasant (game birds); excludes organ meat
and cured meat (oz. eq.)

74
FPID Variables Description (units) PF_SEAFD_HI Seafood (finfish, shellfish, and other seafood) high in n-3 fatty acids (oz. eq.) PF_SEAFD_LOW Seafood (finfish, shellfish, and other seafood) low in n-3 fatty acids (oz. eq.) PF_EGGS Eggs (chicken, duck, goose, quail) and egg substitutes (oz. eq.) PF_SOY Soy products, excluding calcium fortified soy milk and immature soybeans (oz. eq.) PF_NUTSDS Peanuts, tree nuts, and seeds; excludes coconut (oz. eq.) PF_LEGUMES Beans and Peas (legumes) computed as protein foods (oz. eq.) D_TOTAL Total milk, yogurt, cheese, and whey. For some foods, the total dairy values could be higher than the
sum of D_MILK, D_YOGURT, and D_CHEESE because Miscellaneous dairy component composed of whey which is not included in FPED as a separate variable. (cup eq.)
D_MILK Fluid milk, buttermilk, evaporated milk, dry milk, and calcium fortified soy milk (cup eq.) D_YOGURT Yogurt (cup eq.) D_CHEESE Cheeses (cup eq.) OILS Fats naturally present in nuts, seeds, and seafood; unhydrogentated vegetable oils, except palm oil,
palm kernel oil, and coconut oils; fat present in avocado and olives above the allowable amount; 50% of fat present in stick and tub margarines and margarine spreads (grams)
SOLID_FATS Fats naturally present in meat, poultry, eggs, and dairy (lard, tallow, and butter); hydrogenated or partially hydrogenated oils; shortening, palm, palm kernel and coconut oils; fat naturally present in coconut meat and cocoa butter; and 50% of fat present in stick and tub margarines and margarine spreads (grams)
ADD_SUGARS Foods defined as added sugars (tsp. eq.) A_DRINKS Alcoholic beverages and alcohol (ethanol) added to foods after cooking (no. of drinks)

75
Appendix 4: Food Patterns Equivalents Database (FPED) Variables
FPED Variables Description (units) FOODCODE Food code MODCODE Modification code DESCRIPTION Food description F_TOTAL Total intact fruits (whole or cut) and fruit juices (cup eq.) F_CITMLB Intact fruits (whole or cut) of citrus, melons, and berries (cup eq.) F_OTHER Intact fruits (whole or cut); excluding citrus, melons, and berries (cup eq.) F_JUICE Fruit juices, citrus and non citrus (cup eq.) V_TOTAL Total dark green, red and orange, starchy, and other vegetables; excludes legumes (cup eq.) V_DRKGR Dark green vegetables (cup eq.) V_REDOR_TOTAL Total red and orange vegetables (tomatoes and tomato products + other red and orange vegetables)
(cup eq.) V_REDOR_TOMATO Tomatoes and tomato products (cup eq.) V_REDOR_OTHER Other red and orange vegetables, excluding tomatoes and tomato products (cup eq.) V_STARCHY_TOTAL Total starchy vegetables (white potatoes + other starchy vegetables) (cup eq.) V_STARCHY_POTATO White potatoes (cup eq.) V_STARCHY_OTHER Other starchy vegetables, excluding white potatoes (cup eq.) V_OTHER Other vegetables not in the vegetable components listed above (cup eq.) V_LEGUMES Beans and peas (legumes) computed as vegetables (cup eq.) G_TOTAL Total whole and refined grains (oz. eq.) G_WHOLE Grains defined as whole grains and contain the entire grain kernel ― the bran, germ, and endosperm
(oz. eq.) G_REFINED Refined grains that do not contain all of the components of the entire grain kernel (oz. eq.) PF_TOTAL Total meat, poultry, organ meat, cured meat, seafood, eggs, soy, and nuts and seeds; excludes
legumes (oz. eq.) PF_MPS_TOTAL Total of meat, poultry, seafood, organ meat, and cured meat (oz. eq.) PF_MEAT Beef, veal, pork, lamb, and game meat; excludes organ meat and cured meat (oz. eq.) PF_CUREDMEAT Frankfurters, sausages, corned beef, and luncheon meat that are made from beef, pork, or poultry
(oz. eq.) PF_ORGAN Organ meat from beef, veal, pork, lamb, game, and poultry (oz. eq.)

76
FPED Variables Description (units) PF_POULT Chicken, turkey, Cornish hens, duck, goose, quail, and pheasant (game birds); excludes organ meat
and cured meat (oz. eq.) PF_SEAFD_HI Seafood (finfish, shellfish, and other seafood) high in n-3 fatty acids (oz. eq.) PF_SEAFD_LOW Seafood (finfish, shellfish, and other seafood) low in n-3 fatty acids (oz. eq.) PF_EGGS Eggs (chicken, duck, goose, quail) and egg substitutes (oz. eq.) PF_SOY Soy products, excluding calcium fortified soy milk and immature soybeans (oz. eq.) PF_NUTSDS Peanuts, tree nuts, and seeds; excludes coconut (oz. eq.) PF_LEGUMES Beans and Peas (legumes) computed as protein foods (oz. eq.) D_TOTAL Total milk, yogurt, cheese, and whey. For some foods, the total dairy values could be higher than the
sum of D_MILK, D_YOGURT, and D_CHEESE because Miscellaneous dairy component composed of whey which is not included in FPED as a separate variable. (cup eq.)
D_MILK Fluid milk, buttermilk, evaporated milk, dry milk, and calcium fortified soy milk (cup eq.) D_YOGURT Yogurt (cup eq.) D_CHEESE Cheeses (cup eq.) OILS Fats naturally present in nuts, seeds, and seafood; unhydrogentated vegetable oils, except palm oil,
palm kernel oil, and coconut oils; fat present in avocado and olives above the allowable amount; 50% of fat present in stick and tub margarines and margarine spreads (grams)
SOLID_FATS Fats naturally present in meat, poultry, eggs, and dairy (lard, tallow, and butter); hydrogenated or partially hydrogenated oils; shortening, palm, palm kernel and coconut oils; fat naturally present in coconut meat and cocoa butter; and 50% of fat present in stick and tub margarines and margarine spreads (grams)
ADD_SUGARS Foods defined as added sugars (tsp. eq.) A_DRINKS Alcoholic beverages and alcohol (ethanol) added to foods after cooking (no. of drinks)

77
Appendix 5: Food Patterns Equivalents Intakes Files per Food per Individual for Day 1 and Day 2: Number of Observations and Variables
Day 1 fped_dr1iff_0910.sas7bdat
Day 2 fped_dr2iff_0910.sas7bdat
Description (units)
150991 129141 Number of observations SEQN SEQN Respondent sequence number RIAGENDR RIAGENDR Gender RIDAGEYR RIDAGEYR Age at screening adjudicated - Recode RIDRETH1 RIDRETH1 Race/Ethnicity – Recode INDFMIN2 INDFMIN2 Annual family income INDFMPIR INDFMPIR Ratio of family income to poverty SDMVPSU SDMVPSU Masked variance pseudo-PSU SDMVSTRA SDMVSTRA Masked variance pseudo-stratum WTDRD1 WTDRD1 Dietary day one sample weight WTDR2D WTDR2D Dietary two-day sample weight DR1DRSTZ DR2DRSTZ Dietary recall status DRABF DRABF Breast-fed infant (either day) DRDINT DRDINT Number of days of intake DR1TNUMF DR2TNUMF Number of foods reported DR1ILINE DR2ILINE Food/Individual component number DR1IFDCD DR2IFDCD USDA food code DR1MC DR2MC Modification code DR1IGRMS DR2IGRMS Grams DESCRIPTION DESCRIPTION Food description DR1I_F_TOTAL DR2I_F_TOTAL Total intact fruits (whole or cut) and fruit juices (cup eq.) DR1I_F_CITMLB DR2I_F_CITMLB Intact fruits (whole or cut) of citrus, melons, and berries (cup eq.)

78
Day 1 fped_dr1iff_0910.sas7bdat
Day 2 fped_dr2iff_0910.sas7bdat
Description (units)
DR1I_F_OTHER DR2I_F_OTHER Intact fruits (whole or cut); excluding citrus, melons, and berries (cup eq.)
DR1I_F_JUICE DR2I_F_JUICE Fruit juices, citrus and non citrus (cup eq.) DR1I_V_TOTAL DR2I_V_TOTAL Total dark green, red and orange, starchy, and other vegetables;
excludes legumes (cup eq.) DR1I_V_DRKGR DR2I_V_DRKGR Dark green vegetables (cup eq.) DR1I_V_REDOR_TOTAL DR2I_V_REDOR_TOTAL Total red and orange vegetables (tomatoes and tomato products + other
red and orange vegetables) (cup eq.) DR1I_V_REDOR_TOMATO DR2I_V_REDOR_TOMATO Tomatoes and tomato products (cup eq.) DR1I_V_REDOR_OTHER DR2I_V_REDOR_OTHER Other red and orange vegetables, excluding tomatoes and tomato
products (cup eq.) DR1I_V_STARCHY_TOTAL DR2I_V_STARCHY_TOTAL Total starchy vegetables (white potatoes + other starchy vegetables)
(cup eq.) DR1I_V_STARCHY_POTATO DR2I_V_STARCHY_POTATO White potatoes (cup eq.) DR1I_V_STARCHY_OTHER DR2I_V_STARCHY_OTHER Other starchy vegetables, excluding white potatoes (cup eq.) DR1I_V_OTHER DR2I_V_OTHER Other vegetables not in the vegetable components listed above (cup eq.) DR1I_V_LEGUMES DR2I_V_LEGUMES Beans and peas (legumes) computed as vegetables (cup eq.) DR1I_G_TOTAL DR2I_G_TOTAL Total whole and refined grains (oz. eq.) DR1I_G_WHOLE DR2I_G_WHOLE Grains defined as whole grains and contain the entire grain kernel ― the
bran, germ, and endosperm (oz. eq.) DR1I_G_REFINED DR2I_G_REFINED Refined grains that do not contain all of the components of the entire
grain kernel (oz. eq.) DR1I_PF_TOTAL DR2I_PF_TOTAL Total meat, poultry, organ meat, cured meat, seafood, eggs, soy, and
nuts and seeds; excludes legumes (oz. eq.) DR1I_PF_MPS_TOTAL DR2I_PF_MPS_TOTAL Total of meat, poultry, seafood, organ meat, and cured meat (oz. eq.) DR1I_PF_MEAT DR2I_PF_MEAT Beef, veal, pork, lamb, and game meat; excludes organ meat and cured
meat (oz. eq.)

79
Day 1 fped_dr1iff_0910.sas7bdat
Day 2 fped_dr2iff_0910.sas7bdat
Description (units)
DR1I_PF_CUREDMEAT DR2I_PF_ CUREDMEAT Frankfurters, sausages, corned beef, and luncheon meat that are made from beef, pork, or poultry (oz. eq.)
DR1I_PF_ORGAN DR2I_PF_ORGAN Organ meat from beef, veal, pork, lamb, game, and poultry (oz. eq.) DR1I_PF_POULT DR2I_PF_POULT Chicken, turkey, Cornish hens, duck, goose, quail, and pheasant (game
birds); excludes organ meat and cured meat (oz. eq.) DR1I_PF_SEAFD_HI DR2I_PF_SEAFD_HI Seafood (finfish, shellfish, and other seafood) high in n-3 fatty acids
(oz. eq.) DR1I_PF_SEAFD_LOW DR2I_PF_SEAFD_LOW Seafood (finfish, shellfish, and other seafood) low in n-3 fatty acids
(oz. eq.) DR1I_PF_EGGS DR2I_PF_EGGS Eggs (chicken, duck, goose, quail) and egg substitutes (oz. eq.) DR1I_PF_SOY DR2I_PF_SOY Soy products, excluding calcium fortified soy milk and immature
soybeans (oz. eq.) DR1I_PF_NUTSDS DR2I_PF_NUTSDS Peanuts, tree nuts, and seeds; excludes coconut (oz. eq.) DR1I_PF_LEGUMES DR2I_PF_LEGUMES Beans and Peas (legumes) computed as protein foods (oz. eq.) DR1I_D_TOTAL DR2I_D_TOTAL Total milk, yogurt, cheese, and whey. For some foods, the total dairy
values could be higher than the sum of D_MILK, D_YOGURT, and D_CHEESE because Miscellaneous dairy component composed of whey which is not included in FPED as a separate variable. (cup eq.)
DR1I_D_MILK DR2I_D_MILK Fluid milk, buttermilk, evaporated milk, dry milk, and calcium fortified soy milk (cup eq.)
DR1I_D_YOGURT DR2I_D_YOGURT Yogurt (cup eq.) DR1I_D_CHEESE DR2I_D_CHEESE Cheeses (cup eq.) DR1I_OILS DR2I_OILS Fats naturally present in nuts, seeds, and seafood; unhydrogentated
vegetable oils, except palm oil, palm kernel oil, and coconut oils; fat present in avocado and olives above the allowable amount; 50% of fat present in stick and tub margarines and margarine spreads (grams)
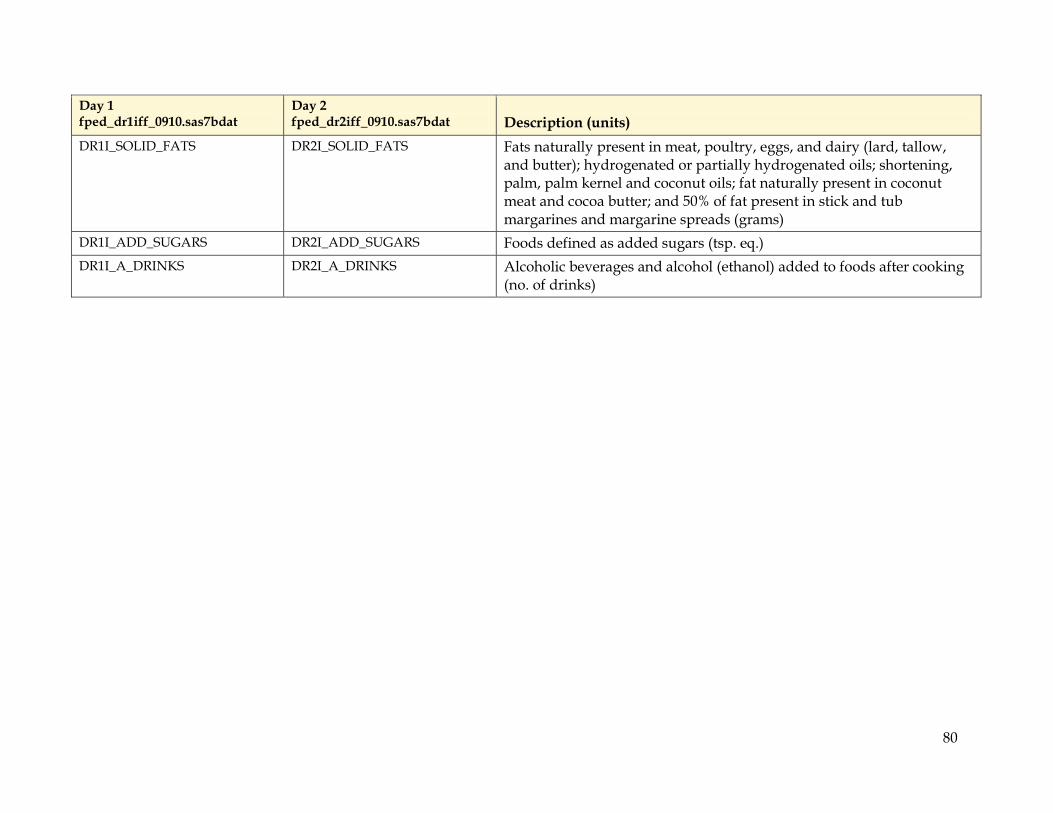
80
Day 1 fped_dr1iff_0910.sas7bdat
Day 2 fped_dr2iff_0910.sas7bdat
Description (units)
DR1I_SOLID_FATS DR2I_SOLID_FATS Fats naturally present in meat, poultry, eggs, and dairy (lard, tallow, and butter); hydrogenated or partially hydrogenated oils; shortening, palm, palm kernel and coconut oils; fat naturally present in coconut meat and cocoa butter; and 50% of fat present in stick and tub margarines and margarine spreads (grams)
DR1I_ADD_SUGARS DR2I_ADD_SUGARS Foods defined as added sugars (tsp. eq.) DR1I_A_DRINKS DR2I_A_DRINKS Alcoholic beverages and alcohol (ethanol) added to foods after cooking
(no. of drinks)

81
Appendix 6: Total Food Patterns Equivalents Intakes Files per Individual for Day 1 and Day 2: Number of Observations and Variables
Day 1 fped_dr1tot_0910.sas7bdat
Day 2 fped_dr2tot_0910.sas7bdat
Description (units)
10253 10253 Number of observations SEQN SEQN Respondent sequence number RIAGENDR RIAGENDR Gender RIDAGEYR RIDAGEYR Age at screening adjudicated - Recode RIDRETH1 RIDRETH1 Race/Ethnicity – Recode INDFMIN2 INDFMIN2 Annual family income INDFMPIR INDFMPIR Ratio of family income to poverty SDMVPSU SDMVPSU Masked variance pseudo-PSU SDMVSTRA SDMVSTRA Masked variance pseudo-stratum WTDRD1 WTDRD1 Dietary day one sample weight WTDR2D WTDR2D Dietary two-day sample weight DR1DRSTZ DR2DRSTZ Dietary recall status DRABF DRABF Breast-fed infant (either day) DRDINT DRDINT Number of days of intake DR1TNUMF DR2TNUMF Number of foods reported DR1T_F_TOTAL DR2T_F_TOTAL Total intact fruits (whole or cut) and fruit juices (cup eq.) DR1T_F_CITMLB DR2T_F_CITMLB Intact fruits (whole or cut) of citrus, melons, and berries (cup eq.) DR1T_F_OTHER DR2T_F_OTHER Intact fruits (whole or cut); excluding citrus, melons, and berries
(cup eq.) DR1T_F_JUICE DR2T_F_JUICE Fruit juices, citrus and non citrus (cup eq.) DR1T_V_TOTAL DR2T_V_TOTAL Total dark green, red and orange, starchy, and other vegetables;
excludes legumes (cup eq.)

82
Day 1 fped_dr1tot_0910.sas7bdat
Day 2 fped_dr2tot_0910.sas7bdat
Description (units)
DR1T_V_DRKGR DR2T_V_DRKGR Dark green vegetables (cup eq.) DR1T_V_REDOR_TOTAL DR2T_V_REDOR_TOTAL Total red and orange vegetables (tomatoes and tomato products +
other red and orange vegetables) (cup eq.) DR1T_V_REDOR_TOMATO DR2T_V_REDOR_TOMATO Tomatoes and tomato products (cup eq.) DR1T_V_REDOR_OTHER DR2T_V_REDOR_OTHER Other red and orange vegetables, excluding tomatoes and tomato
products (cup eq.) DR1T_V_STARCHY_TOTAL DR2T_V_STARCHY_TOTAL Total starchy vegetables (white potatoes + other starchy vegetables)
(cup eq.) DR1T_V_STARCHY_POTATO DR2T_V_STARCHY_POTATO White potatoes (cup eq.) DR1T_V_STARCHY_OTHER DR2T_V_STARCHY_OTHER Other starchy vegetables, excluding white potatoes (cup eq.) DR1T_V_OTHER DR2T_V_OTHER Other vegetables not in the vegetable components listed above
(cup eq.) DR1T_V_LEGUMES DR2T_V_LEGUMES Beans and peas (legumes) computed as vegetables (cup eq.) DR1T_G_TOTAL DR2T_G_TOTAL Total whole and refined grains (oz. eq.) DR1T_G_WHOLE DR2T_G_WHOLE Grains defined as whole grains and contain the entire grain kernel ―
the bran, germ, and endosperm (oz. eq.) DR1T_G_REFINED DR2T_G_REFINED Refined grains that do not contain all of the components of the entire
grain kernel (oz. eq.) DR1T_PF_TOTAL DR2T_PF_TOTAL Total meat, poultry, organ meat, cured meat, seafood, eggs, soy, and
nuts and seeds; excludes legumes (oz. eq.) DR1T_PF_MPS_TOTAL DR2T_PF_MPS_TOTAL Total of meat, poultry, seafood, organ meat, and cured meat (oz. eq.) DR1T_PF_MEAT DR2T_PF_MEAT Beef, veal, pork, lamb, and game meat; excludes organ meat and
cured meat (oz. eq.) DR1T_PF_ CUREDMEAT DR2T_PF_ CUREDMEAT Frankfurters, sausages, corned beef, and luncheon meat that are made
from beef, pork, or poultry (oz. eq.) DR1T_PF_ORGAN DR2T_PF_ORGAN Organ meat from beef, veal, pork, lamb, game, and poultry (oz. eq.)

83
Day 1 fped_dr1tot_0910.sas7bdat
Day 2 fped_dr2tot_0910.sas7bdat
Description (units)
DR1T_PF_POULT DR2T_PF_POULT Chicken, turkey, Cornish hens, duck, goose, quail, and pheasant (game birds); excludes organ meat and cured meat (oz. eq.)
DR1T_PF_SEAFD_HI DR2T_PF_SEAFD_HI Seafood (finfish, shellfish, and other seafood) high in n-3 fatty acids (oz. eq.)
DR1T_PF_SEAFD_LOW DR2T_PF_SEAFD_LOW Seafood (finfish, shellfish, and other seafood) low in n-3 fatty acids (oz. eq.)
DR1T_PF_EGGS DR2T_PF_EGGS Eggs (chicken, duck, goose, quail) and egg substitutes (oz. eq.) DR1T_PF_SOY DR2T_PF_SOY Soy products, excluding calcium fortified soy milk and immature
soybeans (oz. eq.) DR1T_PF_NUTSDS DR2T_PF_NUTSDS Peanuts, tree nuts, and seeds; excludes coconut (oz. eq.) DR1T_PF_LEGUMES DR2T_PF_LEGUMES Beans and Peas (legumes) computed as protein foods (oz. eq.) DR1T_D_TOTAL DR2T_D_TOTAL Total milk, yogurt, cheese, and whey. For some foods, the total dairy
values could be higher than the sum of D_MILK, D_YOGURT, and D_CHEESE because Miscellaneous dairy component composed of whey which is not included in FPED as a separate variable. (cup eq.)
DR1T_D_MILK DR2T_D_MILK Fluid milk, buttermilk, evaporated milk, dry milk, and calcium fortified soy milk (cup eq.)
DR1T_D_YOGURT DR2T_D_YOGURT Yogurt (cup eq.) DR1T_D_CHEESE DR2T_D_CHEESE Cheeses (cup eq.) DR1T_OILS DR2T_OILS Fats naturally present in nuts, seeds, and seafood; unhydrogentated
vegetable oils, except palm oil, palm kernel oil, and coconut oils; fat present in avocado and olives above the allowable amount; 50% of fat present in stick and tub margarines and margarine spreads (grams)
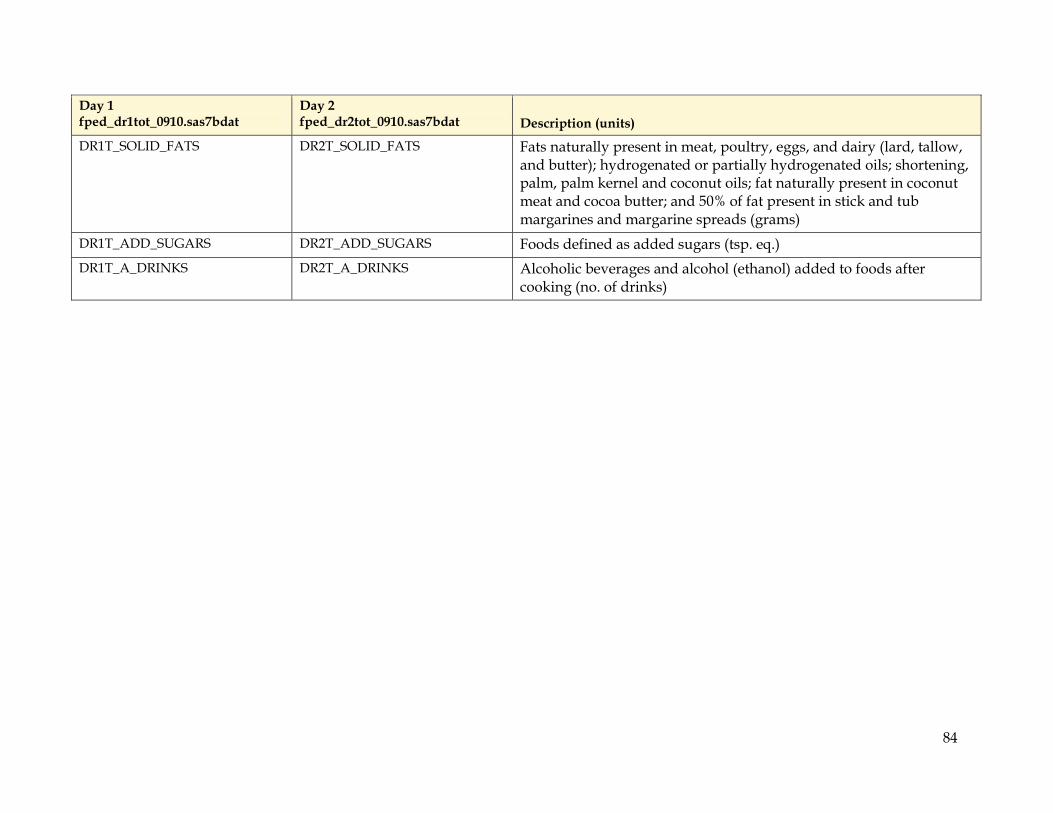
84
Day 1 fped_dr1tot_0910.sas7bdat
Day 2 fped_dr2tot_0910.sas7bdat
Description (units)
DR1T_SOLID_FATS DR2T_SOLID_FATS Fats naturally present in meat, poultry, eggs, and dairy (lard, tallow, and butter); hydrogenated or partially hydrogenated oils; shortening, palm, palm kernel and coconut oils; fat naturally present in coconut meat and cocoa butter; and 50% of fat present in stick and tub margarines and margarine spreads (grams)
DR1T_ADD_SUGARS DR2T_ADD_SUGARS Foods defined as added sugars (tsp. eq.) DR1T_A_DRINKS DR2T_A_DRINKS Alcoholic beverages and alcohol (ethanol) added to foods after
cooking (no. of drinks)

85
Appendix 7: SAS Program for Calculating Mean Intakes of Food Patterns Equivalents for the Thirty-Seven Components
/***********************************************************************************; SAS Program: MakeTables.sas Purpose: Sample SAS program to estimate mean intakes of USDA 2009-2010 Food Patterns Equivalents and create tables Data In: ...\Output\FPED_DR1TOT_0910.sas7bdat Output: ...\Output\Table1.pdf by Gender and Age ...\Output\Table2.pdf by Race/Ethnicity and Age ...\Output\Table3.pdf by Family Income (in Dollars) and Age ...\Output\Table4.pdf by Family Income (% Poverty) and Age ************************************************************************************/ ********************************************************************; * ; * MakeTables.sas ; * ; * This SAS® program estimates mean intakes, consumed per ; * individual in the United States of USDA 2009-2010 Food ; * Patterns Equivalents and creates the following tables ; * in the same directory as this program: ; * ; * Table1.pdf by Gender and Age ; * Table2.pdf by Race/Ethnicity and Age ; * Table3.pdf by Family Income (in Dollars) and Age ; * Table4.pdf by Family Income (% Poverty) and Age ; * ; * The required input data set, FPED_DR1TOT_0910.sas7bdat, ; * is assumed to exist in the same directory as this program. ; * If not, be sure to modify the libname statement appropriately. ; * ; ********************************************************************; options nocenter nodate number orientation=landscape ls=155 ps=48 missing = ' '; * Create macro var, iPath, with directory of this program.; %let iPath=%sysfunc(tranwrd(%sysget(SAS_EXECFILEPATH),\%sysget(SAS_EXECFILENAME),)); * Libname of folder where FPED_DR1TOT_0910 resides.; libname Input "&iPath."; ********************************************************************; * ; * Make data1 with stub variables for the groups. ; * Day 1, 2 year and over, exclude breast-fed, reliable intakes. ; * ; ********************************************************************; data data1;
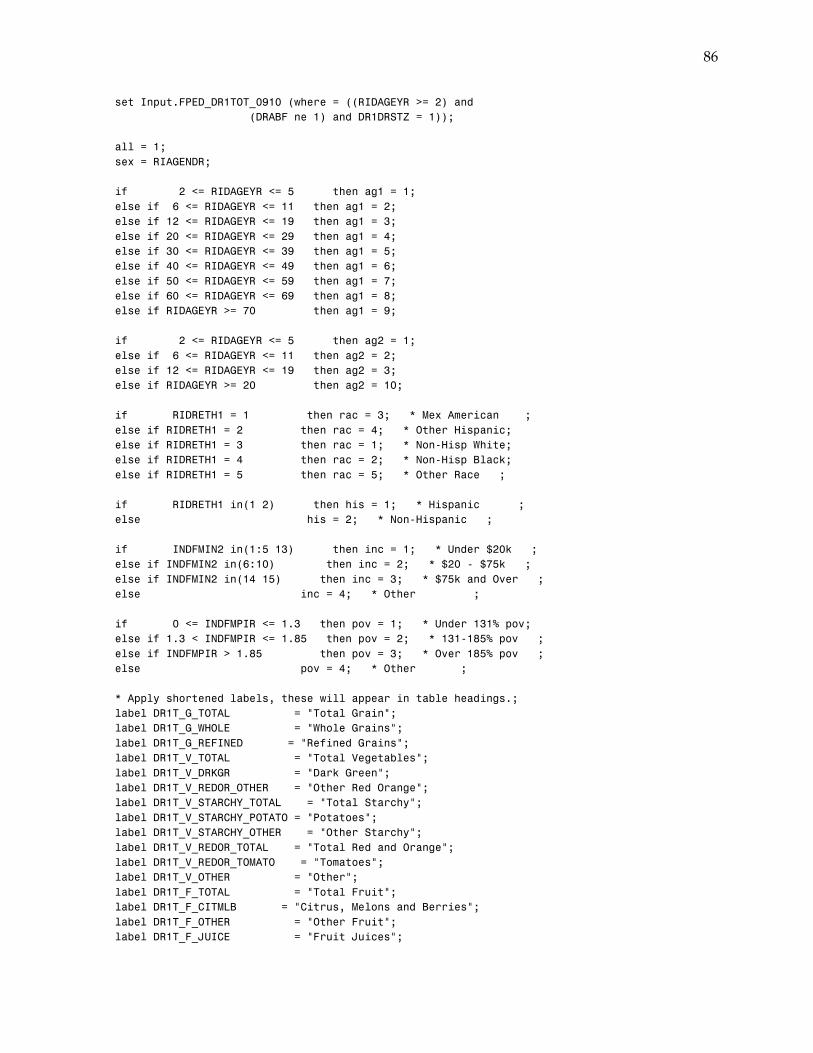
86
set Input.FPED_DR1TOT_0910 (where = ((RIDAGEYR >= 2) and (DRABF ne 1) and DR1DRSTZ = 1)); all = 1; sex = RIAGENDR; if 2 <= RIDAGEYR <= 5 then ag1 = 1; else if 6 <= RIDAGEYR <= 11 then ag1 = 2; else if 12 <= RIDAGEYR <= 19 then ag1 = 3; else if 20 <= RIDAGEYR <= 29 then ag1 = 4; else if 30 <= RIDAGEYR <= 39 then ag1 = 5; else if 40 <= RIDAGEYR <= 49 then ag1 = 6; else if 50 <= RIDAGEYR <= 59 then ag1 = 7; else if 60 <= RIDAGEYR <= 69 then ag1 = 8; else if RIDAGEYR >= 70 then ag1 = 9; if 2 <= RIDAGEYR <= 5 then ag2 = 1; else if 6 <= RIDAGEYR <= 11 then ag2 = 2; else if 12 <= RIDAGEYR <= 19 then ag2 = 3; else if RIDAGEYR >= 20 then ag2 = 10; if RIDRETH1 = 1 then rac = 3; * Mex American ; else if RIDRETH1 = 2 then rac = 4; * Other Hispanic; else if RIDRETH1 = 3 then rac = 1; * Non-Hisp White; else if RIDRETH1 = 4 then rac = 2; * Non-Hisp Black; else if RIDRETH1 = 5 then rac = 5; * Other Race ; if RIDRETH1 in(1 2) then his = 1; * Hispanic ; else his = 2; * Non-Hispanic ; if INDFMIN2 in(1:5 13) then inc = 1; * Under $20k ; else if INDFMIN2 in(6:10) then inc = 2; * $20 - $75k ; else if INDFMIN2 in(14 15) then inc = 3; * $75k and Over ; else inc = 4; * Other ; if 0 <= INDFMPIR <= 1.3 then pov = 1; * Under 131% pov; else if 1.3 < INDFMPIR <= 1.85 then pov = 2; * 131-185% pov ; else if INDFMPIR > 1.85 then pov = 3; * Over 185% pov ; else pov = 4; * Other ; * Apply shortened labels, these will appear in table headings.; label DR1T_G_TOTAL = "Total Grain"; label DR1T_G_WHOLE = "Whole Grains"; label DR1T_G_REFINED = "Refined Grains"; label DR1T_V_TOTAL = "Total Vegetables"; label DR1T_V_DRKGR = "Dark Green"; label DR1T_V_REDOR_OTHER = "Other Red Orange"; label DR1T_V_STARCHY_TOTAL = "Total Starchy"; label DR1T_V_STARCHY_POTATO = "Potatoes"; label DR1T_V_STARCHY_OTHER = "Other Starchy"; label DR1T_V_REDOR_TOTAL = "Total Red and Orange"; label DR1T_V_REDOR_TOMATO = "Tomatoes"; label DR1T_V_OTHER = "Other"; label DR1T_F_TOTAL = "Total Fruit"; label DR1T_F_CITMLB = "Citrus, Melons and Berries"; label DR1T_F_OTHER = "Other Fruit"; label DR1T_F_JUICE = "Fruit Juices";

87
label DR1T_D_TOTAL = "Total Dairy"; label DR1T_D_MILK = "Fluid Milk"; label DR1T_D_YOGURT = "Yogurt"; label DR1T_D_CHEESE = "Cheese"; label DR1T_PF_TOTAL = "Total Protein"; label DR1T_PF_MPS_TOTAL = "Total Meat, Poultry, and Seafood"; label DR1T_PF_MEAT = "Meat"; label DR1T_PF_ORGAN = "Organ"; label DR1T_PF_CUREDMEAT = "Cured Meats"; label DR1T_PF_POULT = "Poultry"; label DR1T_PF_SEAFD_HI = "Seafood High n-3"; label DR1T_PF_SEAFD_LOW = "Seafood Low n-3"; label DR1T_PF_EGGS = "Eggs"; label DR1T_PF_SOY = "Soybean Products"; label DR1T_PF_NUTSDS = "Nuts and Seeds"; label DR1T_V_LEGUMES = "Legumes as Vegetable"; label DR1T_PF_LEGUMES = "Legumes as Protein"; label DR1T_OILS = "Oils"; label DR1T_SOLID_FATS = "Solid Fats"; label DR1T_ADD_SUGARS = "Added Sugar"; label DR1T_A_DRINKS = "Alcoholic Drinks"; run; ********************************************************************; * ; * Create formats for the group variables. ; * ; ********************************************************************; proc format; value agef 1 = " 2 - 5.............." 2 = " 6 - 11.............." 3 = "12 - 19.............." 4 = "20 - 29.............." 5 = "30 - 39.............." 6 = "40 - 49.............." 7 = "50 - 59.............." 8 = "60 - 69.............." 9 = " 70 and over......" 10 = " 20 and over..." 11 = " 2 and over..."; value sexf 1 = "Males:" 2 = "Females:" 3 = "Males and females:"; value racf 1 = "Non-Hispanic White:" 2 = "Non-Hispanic Black:" 3 = "Mexican American:" 4 = "All Hispanic:"; value incf 1 = "$0 - $24,999:" 2 = "$25,000 - $74,999:"

88
3 = "$75,000 and higher:" 4 = "All Individuals:"; value povf 1 = "Under 131% poverty:" 2 = "131-185% poverty:" 3 = "Over 185% poverty:" 4 = "All Individuals:"; run; ********************************************************************; * ; * Generate weighted means and SE. ; * ; ********************************************************************; ods listing close; ods noresults; proc sort data=data1; by SDMVSTRA SDMVPSU; * By Gender and Age.; proc surveymeans nobs mean stderr data = data1; stratum SDMVSTRA; cluster SDMVPSU; weight WTDRD1; domain all sex*ag1 sex*ag2; var DR1T_F_CITMLB--DR1T_A_DRINKS; ods output domain = data2_sex; * By Race/Ethnicity and Age.; proc surveymeans nobs mean stderr data = data1; stratum SDMVSTRA; cluster SDMVPSU; weight WTDRD1; domain rac his ag2*rac ag2*his; var DR1T_F_CITMLB--DR1T_A_DRINKS; ods output domain = data2_rac; * By Family Income (in Dollars) and Age.; proc surveymeans nobs mean stderr data = data1; stratum SDMVSTRA; cluster SDMVPSU; weight WTDRD1; domain all inc all*ag2 inc*ag2;; var DR1T_F_CITMLB--DR1T_A_DRINKS; ods output domain = data2_inc; * By Family Income (% Poverty) and Age.; proc surveymeans nobs mean stderr data = data1; stratum SDMVSTRA; cluster SDMVPSU; weight WTDRD1; domain all pov all*ag2 pov*ag2;; var DR1T_F_CITMLB--DR1T_A_DRINKS; ods output domain = data2_pov; run; ods listing; ********************************************************************;

89
* ; * Combine data sets, assign statistical flag, round, and add ; * table, age, and group variables. ; * ; ********************************************************************; data data3; set data2_sex (in=insex) data2_rac (in=inrac) data2_inc (in=ininc) data2_pov (in=inpov); * Assign statistical flag based on cv, sample size, and vif.; vif = 2.16; * Variance inflation factor for 2 year and older.; if (mean > 0) then cv = stderr / mean * 100; if (cv >= 30) or (n < (30 * vif)) then statflag = '*'; * Round values. ; cstat = put(mean, 8.2); cse = put(stderr, 8.3); * Indicate if value greated than zero too small to print. ; if (round(mean, 0.01) eq 0) and (mean > 0) then cstat = "#"; if (round(stderr, 0.001) eq 0) and (stderr > 0) then cse = "#"; * Don't show statflag if too small to print. ; if cstat = "#" then statflag = ""; cse = compress("("||cse||")"); * Don't show cse if cstat too small to print. ; if cstat = "#" then cse = ""; * Replace zero with #. ; if compress(cstat) = "0" then do; cstat = "#"; cse = ""; statflag = ""; end; * Make table, age, and group variables. ; if insex=1 then do; table = "sex"; if ag1 in(1:9) then age = ag1; if ag2 in(10) then age = ag2; if all in(1) then do; sex = 3; * All individuals ; age = 11; * 2 and over ; end; group = put(sex, sexf.); end; if inrac=1 then do; table = "rac"; if rac in(4 5) then rac = .; if his in(1) then rac = 4; * All Hispanic ; if ag2 in(.) then age = 11; * 2 and over ; if ag2 in(1:10) then age = ag2; group = put(rac, racf.);

90
end; if ininc=1 then do; table = "inc"; if inc in(4) then inc = .; if all in(1) then inc = 4; * All individuals ; if ag2 in(.) then age = 11; * 2 and over ; if ag2 in(1:10) then age = ag2; group = put(inc, incf.); end; if inpov=1 then do; table = "pov"; if pov in(4 5) then pov = .; if all in(1) then pov = 4; * All individuals ; if ag2 in(.) then age = 11; * 2 and over ; if ag2 in(1:10) then age = ag2; group = put(pov, povf.); end; agegroup = put(age, agef.); if group ^="" and age in(1:11) then output; keep varname varlabel cstat cse statflag n mean stderr cv; keep sex rac inc pov table age group agegroup; run; ********************************************************************; * ; * Create data set, vars, with varnames and varorder. ; * Permits printing vars in the correct order. ; * ; ********************************************************************; proc transpose data=data1(keep=DR1T_F_CITMLB--DR1T_A_DRINKS obs=0) out=vars (keep=_name_ rename=(_name_=varname)); data vars; set vars; varorder=_n_; proc sort data=data3; by varname; proc sort data=vars; by varname; data data3; merge data3 vars; by varname; proc sort data=data3; by table sex rac inc pov age varorder; run; ********************************************************************; * ; * Create and run macro program to make tables. ; * ; ********************************************************************; %macro makeTables();
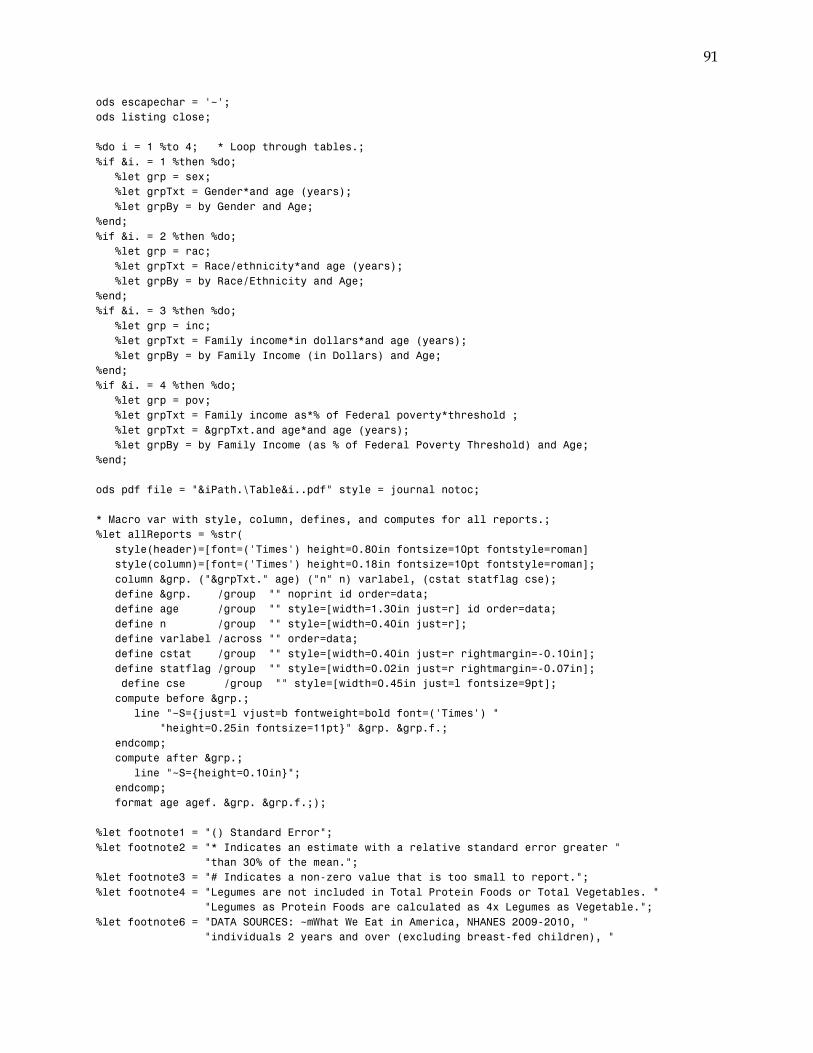
91
ods escapechar = '~'; ods listing close; %do i = 1 %to 4; * Loop through tables.; %if &i. = 1 %then %do; %let grp = sex; %let grpTxt = Gender*and age (years); %let grpBy = by Gender and Age; %end; %if &i. = 2 %then %do; %let grp = rac; %let grpTxt = Race/ethnicity*and age (years); %let grpBy = by Race/Ethnicity and Age; %end; %if &i. = 3 %then %do; %let grp = inc; %let grpTxt = Family income*in dollars*and age (years); %let grpBy = by Family Income (in Dollars) and Age; %end; %if &i. = 4 %then %do; %let grp = pov; %let grpTxt = Family income as*% of Federal poverty*threshold ; %let grpTxt = &grpTxt.and age*and age (years); %let grpBy = by Family Income (as % of Federal Poverty Threshold) and Age; %end; ods pdf file = "&iPath.\Table&i..pdf" style = journal notoc; * Macro var with style, column, defines, and computes for all reports.; %let allReports = %str( style(header)=[font=('Times') height=0.80in fontsize=10pt fontstyle=roman] style(column)=[font=('Times') height=0.18in fontsize=10pt fontstyle=roman]; column &grp. ("&grpTxt." age) ("n" n) varlabel, (cstat statflag cse); define &grp. /group "" noprint id order=data; define age /group "" style=[width=1.30in just=r] id order=data; define n /group "" style=[width=0.40in just=r]; define varlabel /across "" order=data; define cstat /group "" style=[width=0.40in just=r rightmargin=-0.10in]; define statflag /group "" style=[width=0.02in just=r rightmargin=-0.07in]; define cse /group "" style=[width=0.45in just=l fontsize=9pt]; compute before &grp.; line "~S={just=l vjust=b fontweight=bold font=('Times') " "height=0.25in fontsize=11pt}" &grp. &grp.f.; endcomp; compute after &grp.; line "~S={height=0.10in}"; endcomp; format age agef. &grp. &grp.f.;); %let footnote1 = "() Standard Error"; %let footnote2 = "* Indicates an estimate with a relative standard error greater " "than 30% of the mean."; %let footnote3 = "# Indicates a non-zero value that is too small to report."; %let footnote4 = "Legumes are not included in Total Protein Foods or Total Vegetables. " "Legumes as Protein Foods are calculated as 4x Legumes as Vegetable."; %let footnote6 = "DATA SOURCES: ~mWhat We Eat in America, NHANES 2009-2010, " "individuals 2 years and over (excluding breast-fed children), "

92
"day 1 dietary intake data, weighted.~-2n" "Food Patterns Equivalent Database (FPED) 2009-2010."; %let titleEnd = Consumed per Individual,~-2nEstimated from Dietary Intake; %let titleEnd = &titleEnd. Data, &grpBy., in the United States, 2009-2010); title; footnote; footnote1 &footnote1.; footnote2 &footnote2.; footnote3 &footnote3.; footnote4 ; footnote6 &footnote6.; title1 "Dairy: ~mMean Cup Equivalents, &titleEnd."; proc report nowindows missing split ="*" data=data3 &allReports.; where table = "&grp." and varname in( "DR1T_D_TOTAL" "DR1T_D_MILK" "DR1T_D_CHEESE" "DR1T_D_YOGURT"); run; title1 "Fruit: ~mMean Cup Equivalents, &titleEnd."; proc report nowindows missing split ="*" data=data3 &allReports.; where table = "&grp." and varname in( "DR1T_F_TOTAL" "DR1T_F_CITMLB" "DR1T_F_OTHER" "DR1T_F_JUICE"); run; title1 "Grains: ~mMean Ounce Equivalents &titleEnd."; proc report nowindows missing split ="*" data=data3 &allReports.; where table = "&grp." and varname in( "DR1T_G_TOTAL" "DR1T_G_WHOLE" "DR1T_G_REFINED"); run; title1 "Protein Foods: ~mMean Ounce Equivalents, &titleEnd."; proc report nowindows missing split ="*" data=data3 &allReports.; where table = "&grp." and varname in( "DR1T_PF_TOTAL" "DR1T_PF_MPS_TOTAL" "DR1T_PF_MEAT" "DR1T_PF_POULT" "DR1T_PF_CUREDMEAT" "DR1T_PF_SEAFD_LOW" "DR1T_PF_SEAFD_HI" "DR1T_PF_ORGAN"); run; title1 "Protein Foods: ~mMean Ounce Equivalents, &titleEnd."; proc report nowindows missing split ="*" data=data3 &allReports.; where table = "&grp." and varname in( "DR1T_PF_EGGS" "DR1T_PF_NUTSDS" "DR1T_PF_SOY"); run; title1 "Legumes: ~mMean Cup Equivalents (as vegetable) and Ounce " "Equivalents (as protein), &titleEnd."; footnote4 &footnote4.; footnote6 &footnote6.; proc report nowindows missing split ="*" data=data3 &allReports.; where table = "&grp." and varname in( "DR1T_PF_LEGUMES" "DR1T_V_LEGUMES");

93
run; title1 "Vegetables: ~mMean Cup Equivalents &titleEnd."; footnote4 ; footnote6 &footnote6.; proc report nowindows missing split ="*" data=data3 &allReports.; where table = "&grp." and varname in( "DR1T_V_TOTAL" "DR1T_V_DRKGR" "DR1T_V_REDOR_OTHER" "DR1T_V_STARCHY_TOTAL" "DR1T_V_STARCHY_POTATO" "DR1T_V_STARCHY_OTHER" "DR1T_V_REDOR_TOTAL" "DR1T_V_REDOR_TOMATO" "DR1T_V_OTHER"); run; title1 "Oils and Other Components: ~mMean Grams of Oils and Solid Fats; " "Teaspoon Equivalents of Added Sugars;~-2nand Number of Alcoholic " "Drinks, &titleEnd."; proc report nowindows missing split ="*" data=data3 &allReports.; where table = "&grp." and varname in( "DR1T_OILS" "DR1T_SOLID_FATS" "DR1T_ADD_SUGARS" "DR1T_A_DRINKS"); run; ods _all_ close; %end; * End of table loop.; ods listing; %mend makeTables; %makeTables();

94
Appendix 8: Fruit Cup Equivalent Weights
Food DescriptionWeight of One
Cup Equivalent (g)
250100% Fruit juice
250100% Fruit juice blend
70100% Fruit juice concentrate
110Apples, baked
45Apples, dried
110Apples, raw
245Applesauce
65Apricots, dried
165Apricots, raw
50Banana flakes, dehydrated
150Bananas, boiled
150Bananas, raw
150Blackberries, frozen
145Blackberries, raw
150Blueberries, frozen
145Blueberries, raw
150Boysenberries, frozen
145Boysenberries, raw
185Calamondin, raw
170Cantaloupe, melon, frozen
170Cantaloupe, melon, raw
140Carambolas (starfruit), raw
170Cassaba melon, raw
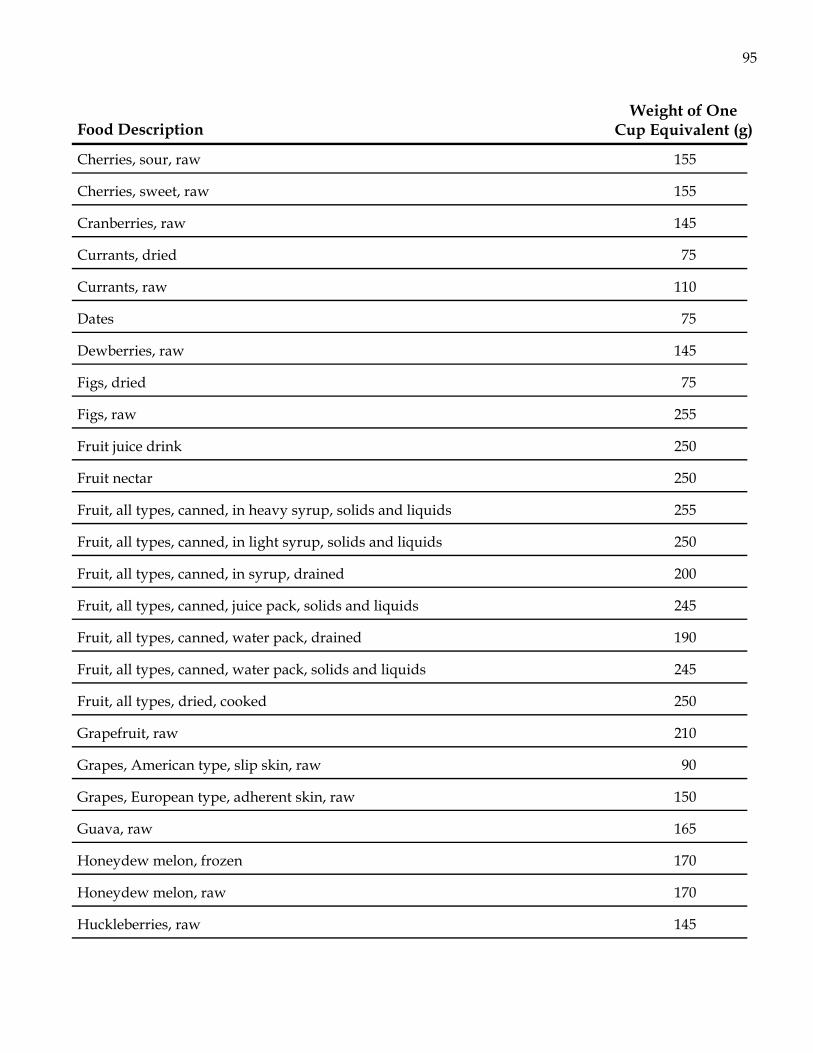
Food DescriptionWeight of One
Cup Equivalent (g)
95
155Cherries, sour, raw
155Cherries, sweet, raw
145Cranberries, raw
75Currants, dried
110Currants, raw
75Dates
145Dewberries, raw
75Figs, dried
255Figs, raw
250Fruit juice drink
250Fruit nectar
255Fruit, all types, canned, in heavy syrup, solids and liquids
250Fruit, all types, canned, in light syrup, solids and liquids
200Fruit, all types, canned, in syrup, drained
245Fruit, all types, canned, juice pack, solids and liquids
190Fruit, all types, canned, water pack, drained
245Fruit, all types, canned, water pack, solids and liquids
250Fruit, all types, dried, cooked
210Grapefruit, raw
90Grapes, American type, slip skin, raw
150Grapes, European type, adherent skin, raw
165Guava, raw
170Honeydew melon, frozen
170Honeydew melon, raw
145Huckleberries, raw

Food DescriptionWeight of One
Cup Equivalent (g)
96
145Juneberries, raw
175Kiwifruit, raw
185Kumquats, raw
210Lemons, raw
210Limes, raw
45Litchis, dried
190Litchis, raw
150Loganberries, frozen
145Loganberries, raw
165Mangoes, raw
145Mulberries, raw
145Nectarines, raw
185Oranges, raw
70Papayas, dried
140Papayas, raw
235Passion fruit, raw
80Peaches, dried
150Peaches, frozen
155Peaches, raw
90Pears, dried
165Pears, raw
165Persimmon, raw
70Pineapple, dried
165Pineapple, raw
165Plums, raw

Food DescriptionWeight of One
Cup Equivalent (g)
97
60Plums, rock salt, dried
155Pomegranate, raw
85Prunes, dried
75Raisins
150Raspberries, frozen
145Raspberries, raw
120Rhubarb, raw
150Strawberries, frozen
145Strawberries, raw
120Tamarind, raw
185Tangelos, raw
185Tangerines, raw
150Watermelon, raw
145Youngberries, raw
2. Fruit nectars are presumed to contain 40% fruit juice.
Fruits canned in syrup or water are presumed to be 65% fruit. Fruits canned in juice are presumed to be 65% fruit and 35% juice.
1. Fruit juice drinks are presumed to contain 15% fruit juice.
Endnotes:
3.

Appendix 9: Vegetable Cup Equivalent Weights
98
Food DescriptionWeight of One
Cup Equivalent (g)
245100% Vegetable juice, all types
35Alfalfa sprouts or sprouted seeds, raw
175Artichokes, cooked, from raw, frozen, or canned (drained)
150Artichokes, raw
40Arugula, raw
180Asparagus, cooked, from raw, frozen, or canned (drained)
135Asparagus, raw
145Avocados, raw
150Bamboo shoots, cooked
150Bamboo shoots, raw
40Basil, fresh
125Bean sprouts, cooked, from raw or canned (drained)
105Bean sprouts, raw
145Beet greens, cooked
75Beet greens, raw
170Beets, cooked, from raw, frozen, or canned (drained)
135Beets, raw
125Bitter melon leaves, cooked
125Bitter melon, cooked
250Breadfruit, cooked
220Breadfruit, raw
125Broccoflower, cooked
110Broccoflower, raw

Food DescriptionWeight of One
Cup Equivalent (g)
99
155Broccoli, cooked, from raw or frozen
80Broccoli, raw
155Brussels sprouts, cooked, from raw or frozen
90Brussels sprouts, raw
125Burdock root, cooked
120Burdock root, raw
150Cabbage, (green, red, or Savoy) cooked
90Cabbage, (green, red, or Savoy) raw
170Cabbage, Chinese, cooked
155Cabbage, mustard, cooked
130Cabbage, mustard, raw
140Cabbage, Pak-choi, raw
150Cabbage, Pe-tsai, raw
150Cabbage, pickled, Japanese style
150Cactus (Nopales), cooked
150Cactus (Nopales), raw
165Calabaza (Spanish pumpkin), cooked
135Capers, cooked
245Carrot juice
145Carrots, cooked, from raw, frozen, or canned (drained)
35Carrots, dried
125Carrots, raw or frozen
130Cassava (yuca blanca), cooked
130Cassava (yuca blanca), raw
180Cauliflower, cooked, from canned (drained)
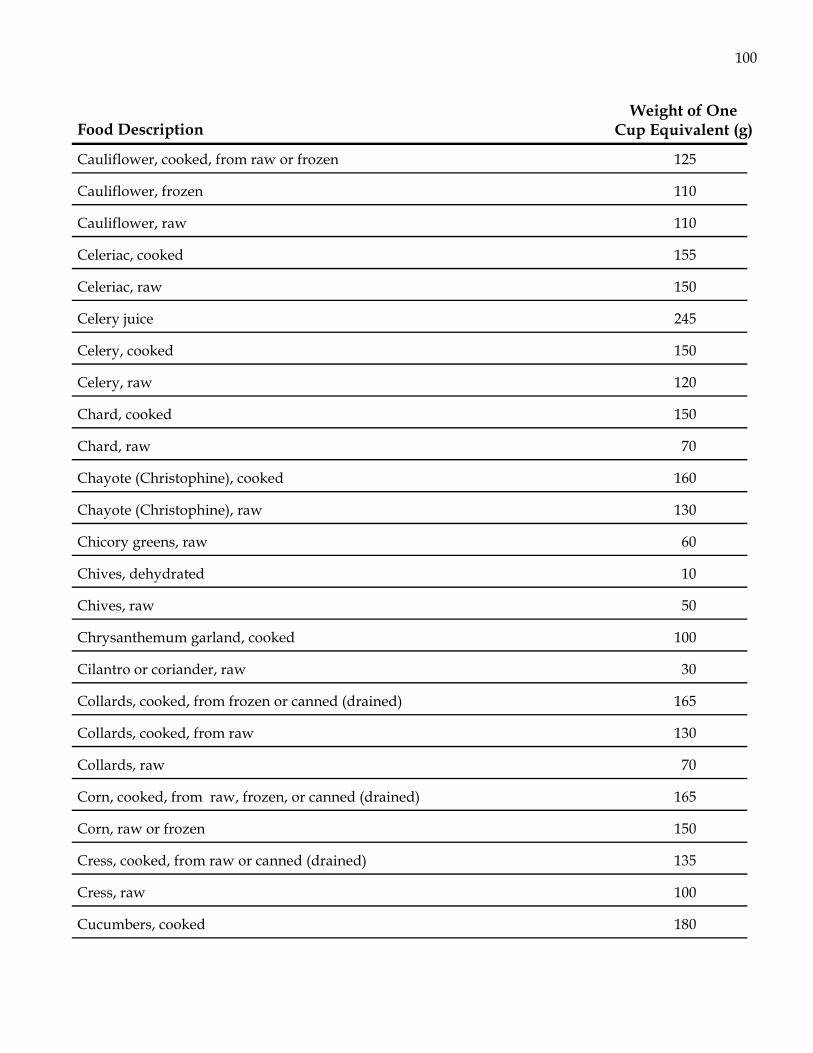
Food DescriptionWeight of One
Cup Equivalent (g)
100
125Cauliflower, cooked, from raw or frozen
110Cauliflower, frozen
110Cauliflower, raw
155Celeriac, cooked
150Celeriac, raw
245Celery juice
150Celery, cooked
120Celery, raw
150Chard, cooked
70Chard, raw
160Chayote (Christophine), cooked
130Chayote (Christophine), raw
60Chicory greens, raw
10Chives, dehydrated
50Chives, raw
100Chrysanthemum garland, cooked
30Cilantro or coriander, raw
165Collards, cooked, from frozen or canned (drained)
130Collards, cooked, from raw
70Collards, raw
165Corn, cooked, from raw, frozen, or canned (drained)
150Corn, raw or frozen
135Cress, cooked, from raw or canned (drained)
100Cress, raw
180Cucumbers, cooked

Food DescriptionWeight of One
Cup Equivalent (g)
101
155Cucumbers, pickled
120Cucumbers, raw
110Dandelion greens, cooked
110Dandelion greens, raw
140Dasheen, cooked
95Eggplant, cooked
135Eggplant, pickled
80Eggplant, raw
100Endive, raw
130Escarole, cooked
100Escarole, raw
85Fennel bulb, cooked
85Fennel bulb, raw
135Garlic, cooked
135Garlic, raw
95Ginger root, raw
30Grape leaves, raw
160Greens, cooked, from frozen or canned (drained)
145Greens, cooked, from raw
165Hominy, canned or cooked
40Horseradish tree, leafy tips, cooked
100Horseradish, pods, raw
130Jicama, raw
145Jute, potherb, cooked
165Kale, cooked, from frozen or canned (drained)
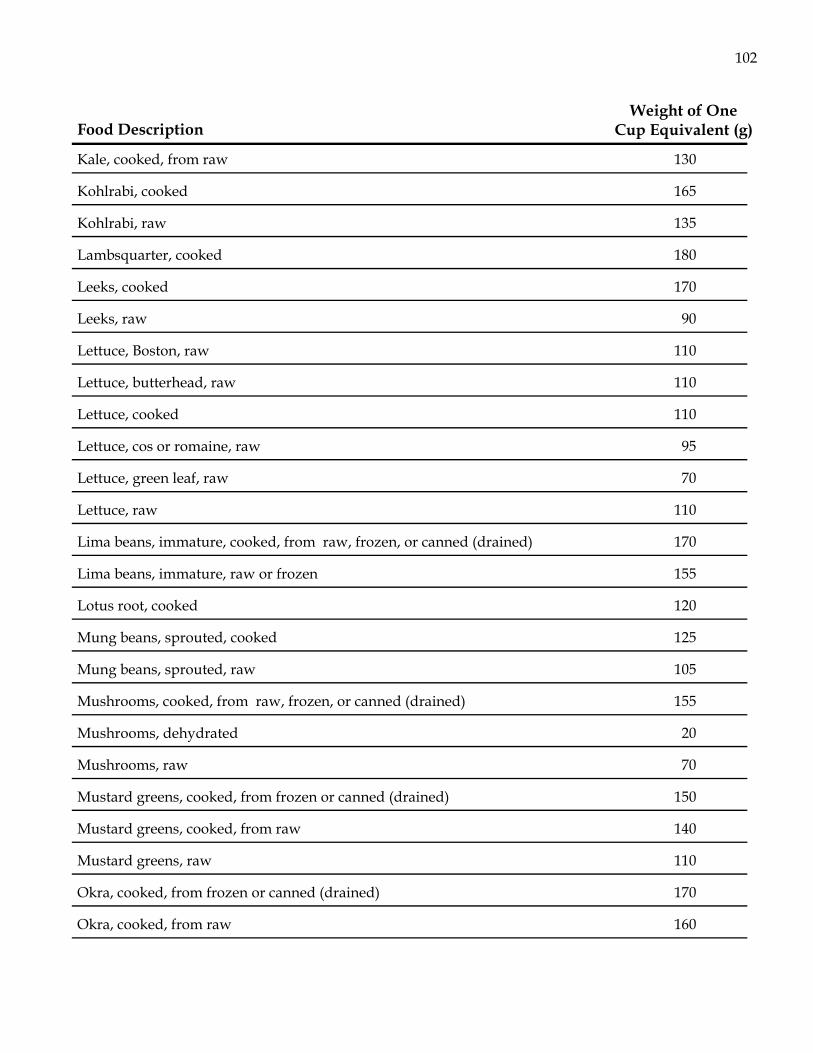
Food DescriptionWeight of One
Cup Equivalent (g)
102
130Kale, cooked, from raw
165Kohlrabi, cooked
135Kohlrabi, raw
180Lambsquarter, cooked
170Leeks, cooked
90Leeks, raw
110Lettuce, Boston, raw
110Lettuce, butterhead, raw
110Lettuce, cooked
95Lettuce, cos or romaine, raw
70Lettuce, green leaf, raw
110Lettuce, raw
170Lima beans, immature, cooked, from raw, frozen, or canned (drained)
155Lima beans, immature, raw or frozen
120Lotus root, cooked
125Mung beans, sprouted, cooked
105Mung beans, sprouted, raw
155Mushrooms, cooked, from raw, frozen, or canned (drained)
20Mushrooms, dehydrated
70Mushrooms, raw
150Mustard greens, cooked, from frozen or canned (drained)
140Mustard greens, cooked, from raw
110Mustard greens, raw
170Okra, cooked, from frozen or canned (drained)
160Okra, cooked, from raw
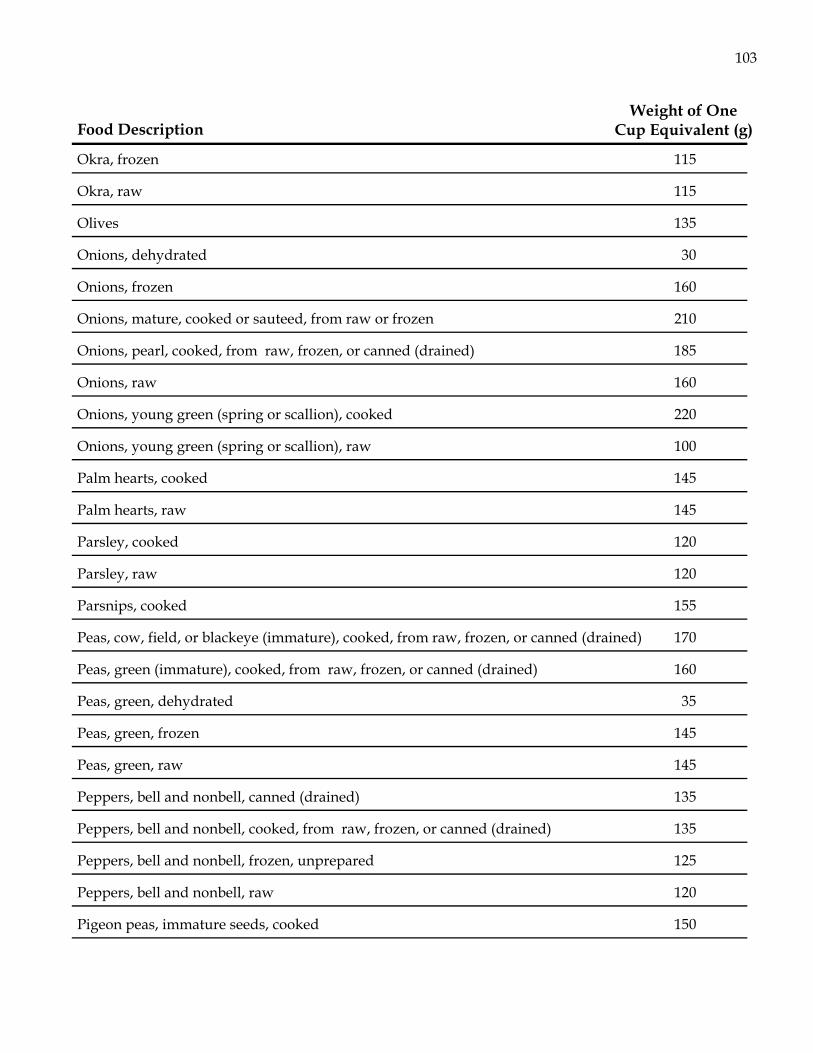
Food DescriptionWeight of One
Cup Equivalent (g)
103
115Okra, frozen
115Okra, raw
135Olives
30Onions, dehydrated
160Onions, frozen
210Onions, mature, cooked or sauteed, from raw or frozen
185Onions, pearl, cooked, from raw, frozen, or canned (drained)
160Onions, raw
220Onions, young green (spring or scallion), cooked
100Onions, young green (spring or scallion), raw
145Palm hearts, cooked
145Palm hearts, raw
120Parsley, cooked
120Parsley, raw
155Parsnips, cooked
170Peas, cow, field, or blackeye (immature), cooked, from raw, frozen, or canned (drained)
160Peas, green (immature), cooked, from raw, frozen, or canned (drained)
35Peas, green, dehydrated
145Peas, green, frozen
145Peas, green, raw
135Peppers, bell and nonbell, canned (drained)
135Peppers, bell and nonbell, cooked, from raw, frozen, or canned (drained)
125Peppers, bell and nonbell, frozen, unprepared
120Peppers, bell and nonbell, raw
150Pigeon peas, immature seeds, cooked

Food DescriptionWeight of One
Cup Equivalent (g)
104
145Pigeon peas, immature seeds, raw
190Pimiento
57Plantain chips
150Plantain or green bananas, cooked
150Plantain or green bananas, raw
155Poke greens, cooked
165Pokeberry shoots, cooked
57Potato chips
155Potatoes, boiled
30Potatoes, dry, powder
150Potatoes, raw
120Potatoes, roasted or baked
65Pumpkin leaves, cooked
245Pumpkin, cooked, from raw, frozen, or canned (drained)
115Pumpkin, raw
80Radicchio, raw
145Radish, cooked
125Radish, raw
170Rutabaga, cooked
140Rutabaga, raw
135Salsify, cooked
140Sauerkraut
80Seaweed, raw
160Snow peas, cooked, from raw or frozen
100Snow peas, raw

Food DescriptionWeight of One
Cup Equivalent (g)
105
170Spinach, cooked, from frozen or canned (drained)
150Spinach, cooked, from raw
155Spinach, frozen, chopped or leaf
70Spinach, raw
55Sprouts, not further specified
155Squash, spaghetti, cooked
180Squash, summer, cooked, from raw, frozen, or canned (drained)
115Squash, summer, raw
205Squash, winter type, baked or cooked
245Squash, winter type, mashed
115Squash, winter type, raw
135String (snap) beans, cooked, from frozen or canned (drained)
125String (snap) beans, cooked, from raw
110String (snap) beans, raw
57Sweet potato chips
65Sweet potato leaves, cooked
200Sweet Potatoes, canned (drained)
200Sweet Potatoes, cooked, baked or boiled
130Sweet Potatoes, raw
190Tannier, cooked
75Tapioca, pearl, dry
57Taro chips
145Taro leaves, cooked
60Taro leaves, raw
130Taro, cooked

Food DescriptionWeight of One
Cup Equivalent (g)
106
105Taro, raw
145Thistle leaves, cooked
130Tomatillos, raw
245Tomato and vegetable juice or cocktail
245Tomato juice
120Tomato paste
120Tomato puree
245Tomato sauce
245Tomatoes, canned, packed in tomato juice
240Tomatoes, cooked
25Tomatoes, dried
170Tomatoes, raw
160Turnip greens, cooked, from frozen or canned (drained)
145Turnip greens, cooked, from raw
155Turnips, cooked, from raw, frozen, or canned (drained)
130Turnips, raw
160Water chestnuts, cooked
125Water chestnuts, raw
135Watercress, cooked,
70Watercress, raw
175Winter melon (wax gourd), cooked
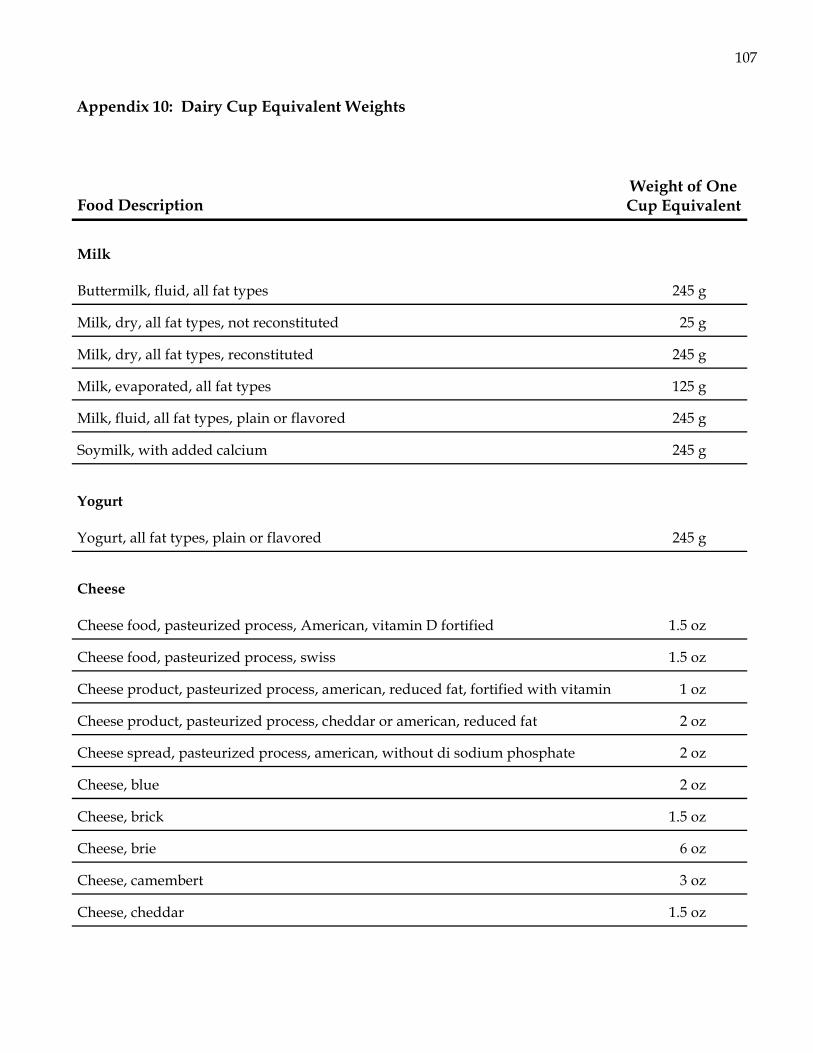
Appendix 10: Dairy Cup Equivalent Weights
107
Food DescriptionWeight of OneCup Equivalent
Milk
245 gButtermilk, fluid, all fat types
25 gMilk, dry, all fat types, not reconstituted
245 gMilk, dry, all fat types, reconstituted
125 gMilk, evaporated, all fat types
245 gMilk, fluid, all fat types, plain or flavored
245 gSoymilk, with added calcium
Yogurt
245 gYogurt, all fat types, plain or flavored
Cheese
1.5 ozCheese food, pasteurized process, American, vitamin D fortified
1.5 ozCheese food, pasteurized process, swiss
1 ozCheese product, pasteurized process, american, reduced fat, fortified with vitamin
2 ozCheese product, pasteurized process, cheddar or american, reduced fat
2 ozCheese spread, pasteurized process, american, without di sodium phosphate
2 ozCheese, blue
1.5 ozCheese, brick
6 ozCheese, brie
3 ozCheese, camembert
1.5 ozCheese, cheddar

Food DescriptionWeight of OneCup Equivalent
108
1.5 ozCheese, colby
variableCheese, cottage
3 ozCheese, cream, fat free
1.5 ozCheese, edam
2 ozCheese, feta
2 ozCheese, fontina
1 ozCheese, goat, hard type
3.5 ozCheese, goat, semisoft type
7.5 ozCheese, goat, soft type
1.5 ozCheese, gouda
1 ozCheese, gruyere
2 ozCheese, limburger
3 ozCheese, low fat, cheddar or colby
1.5 ozCheese, low-sodium, cheddar or colby
1 ozCheese, Mexican, blend, reduced fat
1.5 ozCheese, mexican, queso anejo
1.5 ozCheese, mexican, queso asadero
1.5 ozCheese, mexican, queso chihuahua
1.5 ozCheese, monterey
1.5 ozCheese, monterey, low fat
1.5 ozCheese, mozzarella, low sodium
1 ozCheese, mozzarella, nonfat
1.5 ozCheese, mozzarella, part skim milk
1.5 ozCheese, mozzarella, part skim milk, low moisture
2 ozCheese, mozzarella, whole milk
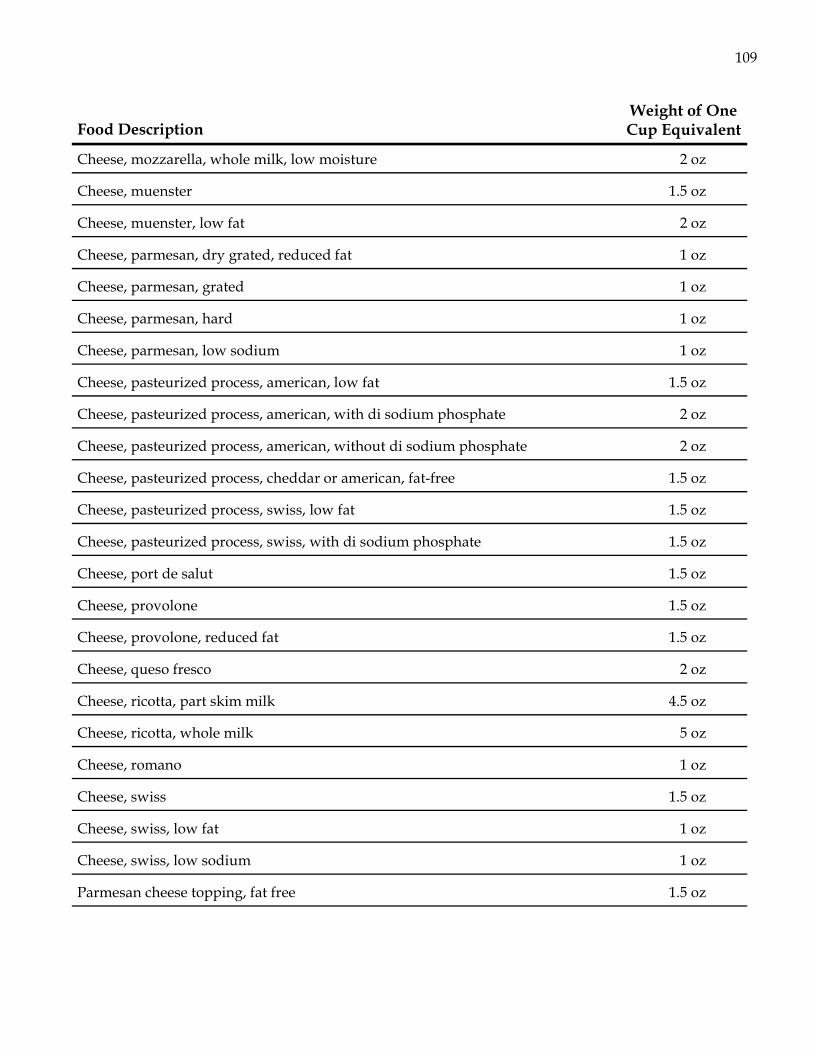
Food DescriptionWeight of OneCup Equivalent
109
2 ozCheese, mozzarella, whole milk, low moisture
1.5 ozCheese, muenster
2 ozCheese, muenster, low fat
1 ozCheese, parmesan, dry grated, reduced fat
1 ozCheese, parmesan, grated
1 ozCheese, parmesan, hard
1 ozCheese, parmesan, low sodium
1.5 ozCheese, pasteurized process, american, low fat
2 ozCheese, pasteurized process, american, with di sodium phosphate
2 ozCheese, pasteurized process, american, without di sodium phosphate
1.5 ozCheese, pasteurized process, cheddar or american, fat-free
1.5 ozCheese, pasteurized process, swiss, low fat
1.5 ozCheese, pasteurized process, swiss, with di sodium phosphate
1.5 ozCheese, port de salut
1.5 ozCheese, provolone
1.5 ozCheese, provolone, reduced fat
2 ozCheese, queso fresco
4.5 ozCheese, ricotta, part skim milk
5 ozCheese, ricotta, whole milk
1 ozCheese, romano
1.5 ozCheese, swiss
1 ozCheese, swiss, low fat
1 ozCheese, swiss, low sodium
1.5 ozParmesan cheese topping, fat free

Appendix 11: Beans and Peas (Legumes) Cup Equivalent Weights
110
Food DescriptionWeight of One
Cup Equivalent (g)
Bayo beans, cooked 175
Bayo beans, uncooked 60
Beans, not further specified, cooked 175
Beans, not further specified, uncooked 60
Black beans, cooked 175
Black beans, uncooked 60
Brown beans, cooked 175
Brown beans, uncooked 60
Calico beans, cooked 175
Calico beans, uncooked 60
Carob flour or powder 60
Chickpeas (garbanzo beans, Bengal gram), canned, drained 175
Chickpeas (garbanzo beans, Bengal gram), cooked 175
Chickpeas (garbanzo beans, bengal gram), uncooked 60
Cowpeas, common (blackeyed, crowder, and southern peas), cooked 175
Cowpeas, common (blackeyed, crowder, and southern peas), uncooked 60
Fava beans (broad beans), cooked 175
Fava beans (broad beans), uncooked 60
Kidney beans, canned, drained 175
Kidney beans, cooked 175
Kidney beans, uncooked 60
Lentils, cooked 175
Lentils, uncooked 60

Food DescriptionWeight of One
Cup Equivalent (g)
111
Lima beans (mature), cooked 175
Lima beans (mature), uncooked 60
Mung beans, cooked 175
Mung beans, uncooked 60
Navy beans, canned, drained 175
Navy beans, cooked 175
Navy beans, uncooked 60
Pink beans, cooked 175
Pink beans, uncooked 60
Pinto beans, cooked 175
Pinto beans, uncooked 60
Split peas, cooked 175
Split peas, uncooked 60
White beans, cooked 175
White beans, uncooked 60
The weight of one cup equivalent for all other uncooked beans and peas is 60g, and all other cooked beans and peas is 175g.
Endnote: