Food losses in cassava and maize value chains in Nigeria · PDF fileFood losses in cassava and...
80
Published by Food losses in cassava and maize value chains in Nigeria Analysis and recommendations for reduction strategies
Transcript of Food losses in cassava and maize value chains in Nigeria · PDF fileFood losses in cassava and...

Published by
Food losses in cassava and maize value chains in Nigeria Analysis and recommendations for reduction strategies

2
Table of Contents
0 ExEcutuvE summary 5 1 IntroductIon 10 1.1 Aim of the study 10 1.2 Concept of food losses 10 1.3 Concept of food value chain 11
2 mEthodology 14
3 cassava 17 3.1 Cassava in Nigeria 17 3.2 Cassava value chains 19 3.2.1 Cassava production 22 3.2.2 Cassava processing 22 3.2.3 Cassava marketing 28 3.3 Quantitative and qualitative analysis of losses in the cassava value chain 28 3.3.1 Incidence of losses in the cassava value chain 28 3.3.2 Quantification of losses in the cassava value chain 31 3.3.3 Monetary quantification of losses in the cassava value chain 33 4 maIzE 37 4.1 Maize in Nigeria 37 4.2 Value chains of maize grain and green maize 39 4.2.1 Maize production 41 4.2.2 Processing of maize into feed 42 4.2.3 Maize marketing 43 4.3 Quantitative and qualitative analysis of losses in the maize value chain 43 4.3.1 Incidence of losses in maize value chain 43 4.3.2 Quantification of losses in maize value chain 45 4.3.3 Monetary quantification of losses in the maize value chain 47 4.3.4 Maize storage facilities in the study areas 51 5 By-Products along thE maIzE and cassava valuE chaIns 52 6 oPtIons For rEducIng Food lossEs 53 6.1 Technology 53 6.2 Organisation of farmers along the value chain 53 6.3 Infrastructure 54 6.4 Human capacity development 55 6.5 Credit policy 55 6.6 Handling and processing policy 55 6.7 Costs and benefits of intervention options 55 6.8 Actors and Partners with potential roles in the control of post-harvest losses 56 annexe 58
Table of CoNTeNTS

3Table of CoNTeNTS
list of tablesTable 1: Generic food supply chain and examples of food wastage (Parfitt et al. 2010) 12Table 2: Traditional measures and their metric conversions 14Table 3: Number of respondents in each sample 15Table 4: Description of key variables in cassava production per average cassava farm 22Table 5: Estimates of losses in the cassava value chain – farmers’ assessment 32Table 6: Estimates of losses in the cassava value chain – gari processors’ assessment 32Table 7: Estimates of losses in the Cassava value chain – starch processors’ assessment 33Table 8: Estimates of losses in the cassava value chain – gari marketers’ assessment 33Table 9: Monetary assessment of losses of fresh cassava tubers at the farm gate 34Table 10: Monetary assessment of losses of fresh cassava tubers during gari processing phase 34Table 11: Monetary assessment of losses during gari processing 35Table 12: Monetary assessment of losses of gari during marketing 35Table 13: Monetary assessment of losses of cassava starch during processing and storage 36Table 14: Summary of cassava PHL monetary assessment 36Table 15: Description of key variables in maize production 41Table 16: Estimates of losses in the maize value chain – farmers’ assessment 45Table 17: Estimates of losses in the maize value chain – marketers’ assessment 46Table 18: Estimates of losses in the maize value chain – feed millers’ assessment 46Table 19: Duration of storage of maize grain and products (feed) 47Table 20: Quantification of losses of maize cobs (green and dry) at the farm gate 47Table 21: Quantification of losses of maize grain at the farm gate 48Table 22: Quantification of losses of maize grain during marketing (storage and transportation) 48Table 23: Quantification of losses of maize grain during feed milling 49Table 24: Quantification of losses of feed during marketing 49Table 25: Summary of quantification of maize losses 50Table 26: Actors and partners’ potential roles in post-harvest losses 56Table 27: Cost of gari processing equipment and tools 58Table 28: Description of key variables in gari processing 58Table 29: Farmers experiencing cassava losses 58Table 30: Starch processors experiencing losses 59Table 31: Gari processors experiencing losses 59Table 32: Gari marketers experiencing losses 59Table 33: Maize farmers experiencing losses 60Table 34: Maize marketers experiencing losses 60Table 35: Feed millers experiencing losses 60

4 Table of CoNTeNTS
list of Figures
Figure 1: Synopsis of losses in the cassava value chain 6Figure 2: Synopsis of losses in the maize value chain 8Figure 3: Wastage of food products along the supply chain 11Figure 4: Generic elements of a basic linear value chain 13Figure 5: Cassava growing regions in Nigeria 17Figure 6: Output of cassava in Nigeria (1990 – 2010) 18Figure 7: Gari destination markets in Nigeria 19Figure 8: Cassava value chain map 21Figure 9: Stages of gari processing 23Figure 10: Cassava peeler 23Figure 11: Cassava peeler 23Figure 12: Cassava hand peeler 24Figure 13: Gari frying 24Figure 14: Cassava grater and lister engine 24Figure 15: Cassava grater 25Figure 16: Stages of starch processing 26Figure 17: Mass flow from fresh cassava tubers to gari and starch 27Figure 18: Losses experienced by cassava farmers 29Figure 19: Losses experienced by cassava starch processors 30Figure 20: Losses experienced by Gari processors 30Figure 21: Losses experienced by gari marketers 31Figure 22: Distribution of cassava loss values in Mio EUR 36Figure 23: Maize production in Nigeria in 2005 37Figure 24: Output of maize in Nigeria (1990 – 2010) 38Figure 25: Maize value chain map 40Figure 26: Stages of maize feed processing 42Figure 27: Losses experienced by maize farmers 43Figure 28: Losses experienced by maize marketers 44Figure 29: Losses experienced by feed millers 45Figure 30: Distribution of maize loss values in Mio EUR 50Figure 31: Pick-up van being used for cassava transportation 61Figure 32: Land Rover being used for cassava transportation 61Figure 33: Peeled fresh cassava tubers 62Figure 34: Screw cassava press 62Figure 35: Hydraulic cassava press 62

5 exeCuTive Summary aNd CoNCluSioN
0 Executive Summary and Conclusion
each year, a significant proportion of food produced for human consumption is lost or wasted. annual losses have been estimated at about 1.3 billion tonnes by the fao (2011)1. in light of rising food prices, growing pressure on natural resources and severe famine in parts of eastern and western africa in recent years, avoidable loss and waste of food cannot be tolerated. The world’s natural resources, such as soil, water, fossil energy and nutrients, are limited, and must be used in a more efficient and responsible manner.
The term food wastage, as used by the fao, encompasses both food loss and food waste. Wastage occurs along the entire food/value chain and varies in extent depending on the product and region. The concept of food wastage is defined differently in different parts of the world. in developed countries, food waste arises at the consumer stage and concerns food which is processed and ready to eat. in developing countries, food losses occur at the post-harvest stages; during marketing and processing (Godfray et al., 20102).
This study focuses on food losses at the harvesting, pro-cessing and marketing stages. its main aim is to improve data availability concerning food losses in important food value chains in the showcase country of Nigeria, contribute to methodological discourse on the assess-ment of food losses, and identify options for German development Cooperation to engage in food loss reduc-tion programmes.
Cassava and maize, which are important staple foods for many africans both in rural areas and in the rapidly growing cities, were selected as the focus of the study.3 both crops are cultivated across different agro-ecological zones in Nigeria, mostly by smallholder farmers. both are processed into different foodstuffs at household and industrial level. They also serve as feed for animals. There are also industrial utilisations for cassava and maize which are not related to the production of food or feed.
The scope of the study was to describe at least one typical value chain for cassava and maize (from harvest to retailer) along with its system boundaries, provide
quantitative and qualitative analysis of food losses, iden-tify hot spots for losses, determine causes of food losses and positive or negative incentives, identify important actors and partners in the private and public sectors and the research and donor communities, and examine the role of these actors in reducing food losses along value chains. finally, it aimed to provide recommendations for reducing food losses at the operational and policy level and for future engagement of the German federal minis-try for economic Cooperation and development (bmZ).
The survey comprised 400 cassava and maize farmers, 54 marketers and 63 processors. results show that losses in cassava and maize value chains are significant, but also that their distribution within the value chains is irregu-lar. data have been obtained by assessment, not by meas-urement, and are therefore dependent on the perception of the interviewees. in order to ensure the data collected was representative, 400 respondents took part in the study and specially trained field interviewers were used.
field data have been supplemented with official national statistics, mostly data of the fao (food and agriculture organisation of the uN), to provide a better overview of national losses in the two value chains studied. The quality of the nationwide data is therefore dictated by the quality of the underlying official statistics. due to the complexity of interactions in the value chains, the chains have been slightly simplified in order to demonstrate the main re-source flows. Short cuts in the value chains have not been considered, which may have led to a tendency to overes-timate loss data. Percentage loss data in the value chains are presented for every cluster in the chain (farmers, processors, marketers) and cannot be added up, because they base on different quantities. They show nevertheless significant hot spots and challenges in post- harvest losses.
The results of this study show crude loss data without considering the economics of losses. in reality, it is not feasible to achieve zero losses, as protection measures to secure 100 percent of the harvest will inevitably be disproportionately costly. losses have to be accepted to a certain extent, depending on market prices and existing infrastructure. actual losses for farmers, processors and
1 food and agriculture organization of the united Nations, rome, italy, 2011: Global food losses and food waste extent: causes and prevention 2 Godfray, H. C. et al. 2010: food Security: The Challenge of feeding 9 billion People; Science; 12 february 2010; 327 3 Nigeria annual production figure; faoSTaT, 2012 http://faostat.fao.org/site/567/desktopdefault.aspx?Pageid=567#ancor

marketers are therefore smaller than estimated in this study.
The study on losses is followed by a second study which estimates, on the basis of these data, the impact of food losses on natural resources such as soil, water, biodiver-sity and climate (ecological footprint).4
Cassava is a tuber crop that is grown and consumed across all the agro-ecological zones in Nigeria. With an annual production of over 40 million metric tons (mt), Nigeria is widely acknowledged as the largest producer of cassava in the world. The major growers are the southern and middle belt states of the federation.
Cassava is processed into gari for human consumption and into starch for the food and beverage industries. furthermore, it is used in the pulp and paper as well as the furniture and plywood industries. it is also an im-portant raw material in the textile and pharmaceutical industries in Nigeria. inability to meet local demand for starch from local sources has led to Nigeria importing significant quantities of corn starch each year.
losses in the cassava value chain relate to measurable quantitative and qualitative losses in the course of trans-forming cassava into various products. it is difficult to assess the loss of quality in gari due to the absence of measurable criteria that are easy for consumers to use. in the case of starch used for industrial purposes, quality criteria include moisture content and other impurities.
Cassava farmers indicate that the most significant losses occur during harvest (4.95%), due to inappropriate har-vesting technologies (machetes) and poor soil conditions (dry and stony). according to the respondents, the main challenges for gari processors are tubers that are too small (5.8%) and too woody (4.1%), as these cannot be peeled correctly and have to be thrown away. This prob-lem appears to be less significant when gari is processed for home consumption at the farm level. This could be attributed to the fact that farmers are more reluctant to discard their harvest or that they use better adapted peel-ing technology than gari processors. improved cassava peeling technology would be a key element in reducing these losses.
6 exeCuTive Summary aNd CoNCluSioN
4 Pe international/ GiZ 2013: life Cycle assessment of maize and Cassava: Post-Harvest losses in Nigeria
Figure 1: synopsis of losses in the cassava value chain
Losses along the cassava value chain
Farm 8.51%
Harvest 4.95%
Spoilage during storage 1.63%
Too small 1.93%
Starch Factory 11.8 %
Processing 5.5%
Storage 6.3%
Gari Processor
Loss of fresh tuber 12.1%
Transport 2.2%
Too woody 4.1% Too small
5.8%
Loss of Gari 2.71%
Processing 1.6 %
Storage/ Spoilage
1.1%
Gari Market 9.5 %
Transport 2.5%
Storage 7.0 %
Moisture 4.5%
Rodents 2.5%

The main reasons for losses of gari at the marketing level are moisture (4.5%) and rodents (2.5%) during storage, whereas transportation accounts for around 2.5% of losses.
losses during starch production are significant, amount-ing to nearly 12%. The most significant losses occur during processing of tubers (5.5%) and during storage of starch (6.3%).
extrapolation of the losses from the assessment to the whole of Nigeria indicates that they are significant in both, gari and starch value chains. loss of fresh cas-sava tubers at the farm gate and during gari processing amounts to more than 6.3 million mt, corresponding to annual mean losses of 37 kg per capita5. This does not include losses of gari during and after processing, which amount to around 800,000 mt a year and losses in cassava starch production of around 106,000 mt per year. The total sum of monetary losses of cassava at the farm gate and during processing, storage, transport and marketing amounts to 144 billion Naira, which corresponds to eur 686 million.
Maize is cultivated in the forest, derived savannah and southern Guinea savannah zones of Nigeria as a sole or mixed crop. it is harvested either as green maize or maize grain. The major end-users of maize are feed and flour mills. The feed mills supply the poultry and aquaculture industry while the products of the flour mills are meant for direct human consumption. The value chain exam-ined in detail in this study is feed production. although
the fao currently only defines food products which were originally meant for human consumption and are then used for other purposes (e.g. feed, biofuel) as “food waste”, this study also considers losses along the value chain of maize for feed production. maize is a very important feed in Nigeria and its affect food security indirectly because it competes with the production and use of maize for hu-man consumption.
in the case of maize destined for human consumption, farmers harvest the crop when it is fully ripe. Green maize is harvested before the grain has ripened. maize to be sold as grain is allowed to dry on the plant and is then further sun-dried to reduce the moisture content and shelled by hand. Shelled grain is bagged and stored until the time of sale. Trade in maize grain is dominated by grain merchants. retailers buy the product from the wholesale markets and sell it to consumers in small quantities.
The farmers identified four main causes of losses. The most significant losses occur before harvesting and are attributed to pests and disease. as these are not strictly post-harvest losses, they have not been further con-sidered in the study, but the issue should be addressed in any integrated approach to increasing agricultural productivity. losses during harvesting were estimated at 4.03% of the total harvest, while shelling, storage of dry maize cobs and dry maize grain and transport of fresh maize to the market entailed losses of between 1.53% and 2.27%. altogether, losses at farm level were around 13.7%.
7exeCuTive Summary aNd CoNCluSioN
5 Population of Nigeria approximately 167 million in october 2011, German federal foreign office

8 exeCuTive Summary aNd CoNCluSioN
a mean per capita loss of 11.6 kg. feed milling and feed marketing account for around 233,600 mt of feed losses. The total sum of monetary losses in maize value chains amounts to around 120 billion Naira, which corresponds to approximately eur 576 million.
options for food loss reductionTechnology: inappropriate technology appears to be the dominant cause of food losses. in the case of cassava, areas requiring attention are harvesting, peeling and storage of fresh cassava tubers and efficiency in grating and milling. in the case of maize, areas requiring atten-tion are bagging, transportation and storage (especially hygiene). appropriate technologies could be developed through collaborative research projects conducted by public and private actors, focussing, for example, on the development of a cassava peeling machine. appropriate packaging and transportation arrangements would have to be made for the transportation of semi-finished prod-ucts to the starch factory.
The most significant losses in the maize value chain occur at the marketing stage (26.6%), mostly due to storage problems (spillage, rodents, weevils (Sitophilus zeamais) and moisture) and to a lesser extent during transportation (3.7%).
feed millers cited storage of grain (5.8%) and storage of feed (4%) as the most important areas in which losses occur. Transportation accounts for 3% of losses. Total losses at the feed miller level amount to 12.8%.
The mean period of storage of maize grain before mill-ing is 8.8 weeks and the period before spoilage begins to manifest is around 4.0 weeks. The length of time that products can be stored before spoilage starts to set in is 3.0 months.
losses of green and dry maize cobs at the farm gate amount to 194,276 mt per year, while 257,885 mt of maize grain are also lost annually. The biggest losses occur during the marketing stage, which accounts for 1,943,271 mt of maize grain per year. This corresponds to
Figure 2: synopsis of losses in the maize value chain
Losses along the maize value chain
Farm 9.83%
Harvest 4.03%
Shelling 1.53%
Storage dry maize grain 2.0%
Storage dry maize cob
2.27%
Transport of fresh maize to market 1.95 %
Transport to market 3.7 %
Storage market 22.9 %
Spillage 5.0%
Rodents 6.0%
Weevils 8.5%
Moisture 2.5% Transport to feed miller
2.0 %
Feed miller (storage) 5.8 %
Spoilage 2.0% Rodents 2.8% Weevils 1.0%
Transport of feed 3.0 %
Storage of feed 4.0%
Spillage 2.0% Weevils 2.0%

9exeCuTive Summary aNd CoNCluSioN
industrial or food-grade starch. The transportation of fresh tubers to pre-processing centres that are only a short distance away would reduce the potential for loss and minimise the cost of transporting water and fibre (wastes) along with the cassava.
Market: Poor market infrastructure and marketing sys-tems contribute to significant losses, especially in maize value chains. in recent times there have been attempts in some states to improve market infrastructure. Within markets, sections are often created for specific agricul-tural products. it should therefore be easy to address the market operators for each type of agricultural product in a targeted manner.
Standards for handling and processing of agricultural raw materials (maize grain and cassava tubers) should be established and appropriate informational materials developed to teach actors along the value chain about appropriate handling, packaging, transportation and pro-cessing techniques that will minimise losses in the value chains while ensuring cost effectiveness.
Human capacity development: appropriate advocacy and training can be provided to operators in the wholesale and retail sections of the gari market to improve the handling (especially bagging) and storage of the product with a view to maintaining quality and reducing physical losses.
a thorough cost-benefit analysis is the basis of economi-cally sustainable investment. low prices for commodities frequently restrict investment in improving post-harvest management. in many cases, accepting losses is cheaper than investing in protection. Technology transfer and training can only be successful if there is genuine eco-nomic benefit for the farmers. Whether this benefit is generated through higher market prices or, for an in-termediate period, through state support and subsidies depends on the situation. innovations often need initial support in order to become accepted and widespread, but they should be always based on sound economic analysis.
The steady increase in food prices over recent years would seem to offer the right impetus for investment in post-harvest management.
Organisation of farmers and the value chain: due to the decline of farmers’ organisations and cooperatives, farm-ers no longer have the capacity to influence the produc-tion, processing, transportation and marketing of agri-cultural commodities. farmers can pool their resources and create economic incentives to improve transporta-tion and storage facilities, thus helping to reduce food losses and enhance their own incomes. as groups and cooperatives, they will be able to receive credit from agricultural financial institutions or advance payments from buyers of their produce. it would be advisable for the department of Cooperatives at the state and federal levels to collaborate with the State offices of the Nigerian ministry of agriculture and rural development to promote farmers’ organisations.
Processors, public sector actors and donors should collaborate in promoting and strengthening farmers’ organisations and cooperative societies and linking them with processors to create efficient commodity supply chains that could reduce losses in the production, processing, transportation and marketing of maize grain and cassava tubers.
Processors of cassava tubers should work with agri-cultural development Programmes in specific states to develop out-grower schemes, which could be used to provide farmers with inputs and technical guidance for efficient cassava production, while the processors undertake the harvesting, collection and transportation of fresh tubers at maturity.
Infrastructure: Poor transportation and storage facili-ties and lack of other infrastructure contribute to losses in value chains. areas to focus on are infrastructure for transportation, storage and marketing that is appropri-ate to the tropical environment and the road network. it appears there are currently no economic incentives for private sector operators to deploy appropriate vehicles for the transportation of farm-fresh products in Nigeria. The establishment of small-scale pre-processing centres located among clusters of cassava farmers and/or farming communities, and thus close to the farm gate, would allow cassava to be transformed into semi-finished, dewatered starch products which could then be transported to starch factories for processing into

10 iNTroduCTioN
1 Introduction
1.1 aim of the study
The aim of this study is to improve the availability of data on food losses in important food value chains in the showcase country of Nigeria, more precisely the north-ern state of Kaduna and the southern state of ondo. The study aims to contribute to methodological discourse on the assessment of food losses and to identify options for German development Cooperation to engage in food loss reduction programmes.
1.2 concept of food losses
each year, a significant proportion of food produced for human consumption is lost or wasted. annual losses have been estimated at about 1.3 billion tonnes. in light of rising food prices, growing pressure on natural re-sources and severe famine in parts of eastern and west-ern africa in recent years, avoidable loss and wastage of food cannot be tolerated. The world’s natural resources, such as soil, water, energy and nutrients, are limited, and must be used in a more efficient and responsible manner.
The term food wastage, as used by the fao, encompasses both food loss and food waste. Wastage occurs along the entire food/value chain and varies in extent depending on the product and region (fao 2011)6. in developed countries, food waste arises at the consumer stage and concerns food which is processed and ready to eat. in developing countries, food losses occur at the post- harvest stages (Godfray et al., 20107).
This study focuses on food losses at the pre-harvest, harvest, post-harvest and processing stages, which are most relevant in developing countries. Pre-harvest losses are not further considered in this study, because preventing them would require specific crop protection measures. Post-harvest losses take place at the time of harvest and during various post-harvest operations from the farm gate to the first level of the market. They can be of physical nature (weight and quality) and/or economic nature (loss of value due to bad storage facilities or infor-mation systems). losses in food value chains are highly variable, ranging from 5% to 30%.
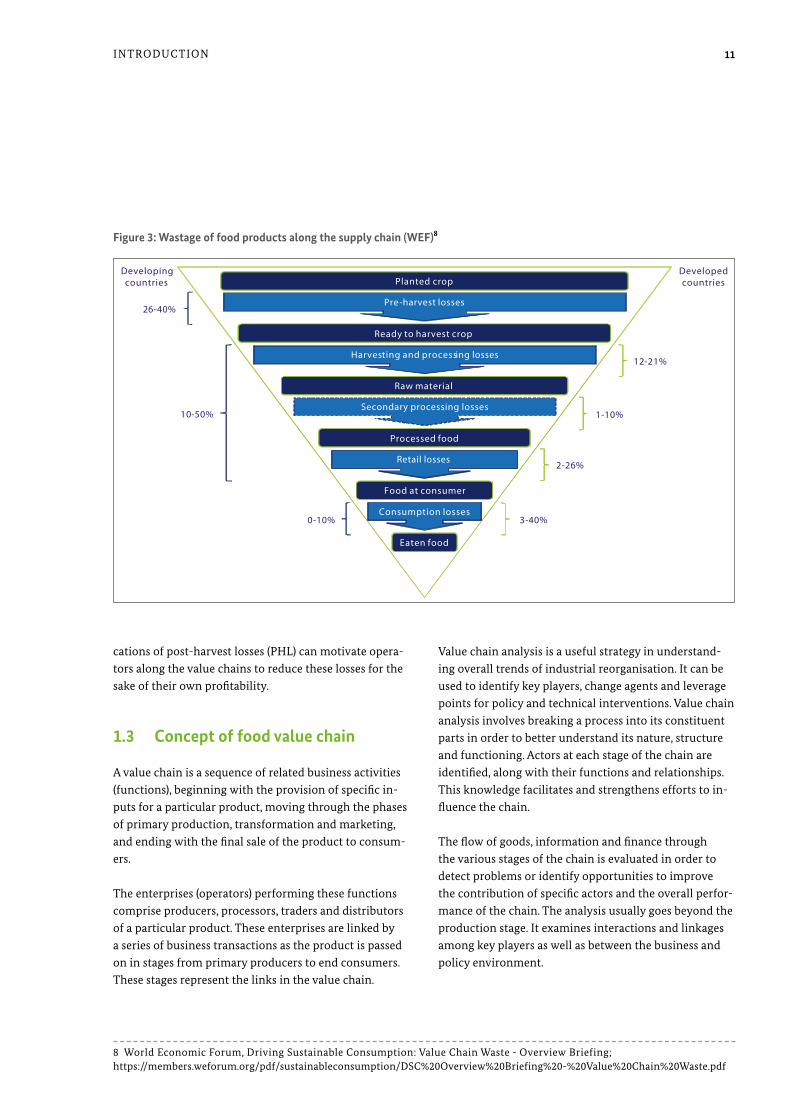
as figure 3 shows, the distribution of losses across the value chain in developed economies differs from that in developing economies. in the latter, more losses occur towards the production stage, while in the developed economies more occur towards the consumption stage.
a review of existing literature on the subject showed that accurately monitoring food losses continues to represent a considerable challenge. There are a number of reasons for this, the most important being major differences in crops, the multiplicity of routes a typical crop can fol-low from farm to end-user and the time it takes a crop to reach the end-user. The situation for cereals differs significantly from that for roots and tubers. There are also variations among the cereals, with the handling and processing routes for maize, for instance, deviating sig-nificantly from those that other cereals pass along. Simi-larly, the handling of maize harvested when green is very different from that of maize harvested as grain.
The term ‘food loss’ can refer to a loss of quantity and/or quality. loss of quantity is measured in terms of weight and volume while loss of quality requires subjective evaluation, in most cases in the absence of appropriate standards and tools. loss of weight due to a reduction in moisture content cannot be described as loss since the nutritional quality of the food remains intact. The term ‘damage’ refers to loss which affects quality more than quantity, though this loss may still result in economic loss. a frequent form of damage is broken grain. in addi-tion to these, losses can occur as a result of spillage from bags, consumption by pests, deterioration and road ac-cidents during long distance transportation.
The main reason why previous projects aiming to avoid food losses have not succeeded is that they have given insufficient consideration to the complexity of causes. Solutions have therefore been too narrow in focus. The underlying causes of food losses (drivers) have to be fully investigated in order to understand why farmers and other economic operators act the way they do. The public and private sectors should share the investment costs and risks involved in carrying out targeted interventions. it should also be borne in mind that the economic impli-
6 food and agriculture organization of the united Nations, rome, 2011: Global food losses and food waste extent: causes and prevention 7 Godfray, H. C. et al. 2010: food Security: The Challenge of feeding 9 billion People; Science, 12 february 2010, 327
11iNTroduCTioN
value chain analysis is a useful strategy in understand-ing overall trends of industrial reorganisation. it can be used to identify key players, change agents and leverage points for policy and technical interventions. value chain analysis involves breaking a process into its constituent parts in order to better understand its nature, structure and functioning. actors at each stage of the chain are identified, along with their functions and relationships. This knowledge facilitates and strengthens efforts to in-fluence the chain.
The flow of goods, information and finance through the various stages of the chain is evaluated in order to detect problems or identify opportunities to improve the contribution of specific actors and the overall perfor-mance of the chain. The analysis usually goes beyond the production stage. it examines interactions and linkages among key players as well as between the business and policy environment.
cations of post-harvest losses (PHl) can motivate opera-tors along the value chains to reduce these losses for the sake of their own profitability.
1.3 concept of food value chain
a value chain is a sequence of related business activities (functions), beginning with the provision of specific in-puts for a particular product, moving through the phases of primary production, transformation and marketing, and ending with the final sale of the product to consum-ers.
The enterprises (operators) performing these functions comprise producers, processors, traders and distributors of a particular product. These enterprises are linked by a series of business transactions as the product is passed on in stages from primary producers to end consumers. These stages represent the links in the value chain.
Developingcountries
DevelopedcountriesPlanted crop
Ready to harvest crop
Raw material
Processed food
Food at consumer
Eaten food
Pre-harvest losses
Harvesting and processing losses
Secondary processing losses
Retail losses
Consumption losses0-10%
10-50%
26-40%
3-40%
2-26%
1-10%
12-21%
Figure 3: Wastage of food products along the supply chain (WEF)8
8 World economic forum, driving Sustainable Consumption: value Chain Waste - overview briefing; https://members.weforum.org/pdf/sustainableconsumption/dSC%20overview%20briefing%20-%20value%20Chain%20Waste.pdf

12 iNTroduCTioN
stage Examples of food waste/loss characteristics
Harvesting – handling at harvest
Edible crops left in field, ploughed into soil, eaten by birds, rodents, timing of harvest not optimal: loss in quality
Crop damaged during harvesting/poor harvesting technique
Outgrades at farm to improve quality of produce
Threshing Loss through poor technique
Drying – transportation and distribution10 Poor transport infrastructure, loss owing to spillage/bruising
Storage Pests, disease, spillage, contamination, natural drying out of food
Primary processing – cleaning, classification, dehulling, pounding, grinding, packaging, soaking, winnowing, drying, sieving, milling
Process losses
Contamination in process causing loss of quality
Secondary processing – mixing, cooking, frying, moulding, cutting, extrusion
Process losses
Contamination in process causing loss of quality
Product evaluation – quality control: standard recipes Product discarded/outgrades in supply chain
Packaging – weighing, labelling, sealing
Inappropriate packaging damages produce
Grain spillage from sack
Losses caused by rodents
Marketing – publicity, sale, distribution
Damage during transport: spoilage
Poor handling in wet market
Losses caused by lack of cooling/cold storage
Post-consumer recipes elaboration: traditional dishes, new dishes product evaluation, consumer education, discards
Plate scrapings
Poor storage/stock management in homes: discarded before serving
Poor food preparation technique: edible food discarded with inedible
Food discarded in packaging: confusion over 'best before' and 'use by' dates
End of life – disposal of food waste/loss at different stages of supply chain
Food waste discarded may be separately treated, fed to livestock/poultry, mixed with other wastes or land-filled
table 1: generic food supply chain and examples of food wastage9
9 Parfitt, J.,barthel, m., and macnaughton, S. (2010). food waste within food supply chains: quantification and potential for change to 2050. Phil. Trans. r. Soc. b 2010 365, 3065-3081. references doi: 10.1098/rstb.2010.0126 10 drying usually takes place on the farm and/or farmstead. The grain must also be transported to a storage facility and loss can occur in this process.

13iNTroduCTioN
Figure 4: generic elements of a basic linear value chain11
Basic functions (chain links)
Provision of specific inputs Production Transformation Trade Final sale
Provide- equipment-inputs
-Grow-Harvest-Dry
-Classify-Process-Pack
-Transport-Distribute-Sell
Specific consumer market
Categories of chain operators and their relations
Specific input provider
Primary producers
Logistics centres, Industry Traders Final sale point
/ Retailer
11 GTZ (2007), value links manual: The methodology of value Chain Promotion, first edition

14
This study has been based essentially on information from primary and secondary sources. most of the in-formation on cross-sector value chain institutions and policy issues was obtained from secondary sources while the information on enterprise-specific value chain issues and the percentage of food losses at different levels came from primary sources. a specially designed questionnaire was developed to collect field data from actors along cassava and maize value chains (questionnaires can be found in annexe iv). These actors comprise cassava farm-ers, starch processors, marketers of cassava tubers, gari processors, maize farmers, marketers of maize grain and feed millers. The data collected were reviewed and the information required to address the specific aspects of the study was extracted and utilised.
for each actor surveyed, variables on costs, returns, post- harvest losses (PHl), storage, transportation, production, etc. were solicited from respondents. To adequately esti-mate the net benefits of the ventures focused on in the study, certain assumptions were made regarding aspects such as soil quality and agronomic practices. Smallholder cassava yield ranges between 8 and 12 metric tons (mt) per hectare (ha). However, on experimental stations, the yield could exceed 20 mt per ha.
Wherever information was available, previously docu-mented input-output data were used. This was neces-sitated by the fact that different measures were being used for business transactions across the sampled states, meaning prices and quantities were difficult to standard-ise. various measures are currently in use, such as heaps, portions and baskets of cassava tubers; kongos (mudus) and basins of gari; baskets, wheelbarrows and pick-up vans of cassava, etc. This made it difficult to compute an appropriate and representative cost and returns frame-work based strictly on the field data. efforts were there-fore made to obtain standard measures and prices from other sources. for example, rather than working with 200 heaps of cassava at a farm gate price of ₦ 5,000, we used the prevailing cassava tuber purchase price of ₦ 9,000 per mt set by maTNa foods Company, a starch factory in ondo State. To convert prices for gari from Naira per kongo to Naira per kg, we ascertained the weights of dif-ferent kongos of gari and found out that a kongo of gari weighs 1.1 kg on average. We also found that a kongo of dry maize grain weighs 1.25 kg on average. This informa-tion, coupled with the price data collected from the field, was used to calculate and confirm the price of gari and maize per mt. a further finding was that a pick-up van of cassava tubers was equivalent to 400 heaps, which trans-lates to 4.08 mt.
meTHodoloGy
2 Methodology
Product local measure unit respective value in Kilograms (rounded)
Cassava tubers 1 Pick-up van (≈ 400 heaps) 4080
Maize grain 1 Kongo 1.25
Gari 1 Kongo 1.1
table 2: traditional measures and their metric conversions
a comprehensive review of existing literature was carried out. Subject areas covered included production, processing, handling, storage and marketing of cassava and maize, value chain analysis, post-harvest losses and food waste.
The value chain maps for cassava and maize were devel-oped based on the literature review. The system bounda-ries are delineated, in line with Gustavsson et al. (2011)12, as field (agricultural production), farm storage facilities (post-harvest handling and storage), farm industry (pro-cessing and packaging), wholesale and retail markets (dis-tribution) and household food services (consumption).
12 Gustavsson, J., Cederberg, C., Sonesson, u., otterdijk, r. and meybeck, a. (2011): Global food losses and Wastes, Swedish institute for food and biotechnology (SiK), Gothenburg, Sweden and fao, rome, italy

15
therefore could not complete the questionnaire without assistance. a multistage sampling technique was adopted to select the farmers that would constitute the sample. in the first stage two states which are major producers of cassava and maize were selected. These were ondo in the south and Kaduna in the north. in each of the two states, two local government areas which are high producers of cassava and maize were selected. The study was thus carried out in four local government areas. lists of cas-sava and maize farmers were obtained from the respec-tive agricultural development Programme (adP) and 50 cassava farmers and 50 maize farmers were randomly selected for each local government area, making a total of 200 cassava and 200 maize farmers. as shown in Table 3 below, other specific actors along the value chain were also interviewed.
Specific potential respondents within the value chain were targeted for data collection in accordance with these boundaries.
data were collected from published sources, through key informants and focus group interviews and where neces-sary through the use of questionnaires and/or surveys. data collection covered major participants along the value chain, the major sources and causes of losses and waste, and information on loss quantities. other infor-mation collected included costs and returns for various players in the value chain. To collect data from the farm-ers, specific questionnaires were developed (annexe iv). The questionnaire was used as an interview guide by trained enumerators to elicit information from the farm-ers, since many of the farmers were not able to read and
meTHodoloGy
state ondo Kaduna total
local government area Ifedore Akure North Lere Gema
maize farmers 50 50 50 50 200
cassava farmers 50 50 50 50 200
gari processors 10 10 5 5 30
maize grain marketers 2 2 10 10 24
Fresh cassava tuber marketers 10 10 5 5 30
Feed millers 6 2 8
cassava starch processors 15 10 25
total 517
table 3: number of respondents in each sample
The data that were collected from cassava and maize farmers to determine the environmental footprint of food losses include:
1. Type and quantity of fertiliser used per unit area
2. Cropping system: mono-cropping/mixed cropping (crop combinations, percentage of mixture with other crop)
3. Type and quantity of pesticides and fertilisers (if any) used per unit area
4. extent of mechanisation - type of farm machinery used and for which operations
5. Crop rotation – crop succession on the same plot
6. Type of transport and distances usually covered to reach the store/warehouse, market, retailer, etc.
There appears to be no generally accepted methodology for determining post-production losses in root/tuber crops. a publication by the National academy of Sciences (uSa) from the year 1978 on post-harvest losses13 makes the following differentiation between assessment, measurement and estimation of losses:
Assessment is a rough quantitative approximation of food loss or the characterisation of the relative points of loss in a particular food supply system. This approach implies a measure of subjectivity resulting from a lack of suffi-cient information.
16 meTHodoloGy
Measurement on the other hand is a more precise quan-titative observation with less subjectivity. With meas-urements there is a high expectation of reproducibility without observer bias.
in light of the above, and considering the expected deliv-erable of this study in respect of quantitative and quali-tative analysis of food losses, the work was undertaken as an ‘assessment of food losses’, using structured ques-tionnaires to elicit information from farmers, marketers and processors (especially in the case of cassava). for industrial users and other actors along the value chain, consultation with experts and key informant interviews were conducted.
13 National academy of Sciences: Post-harvest food losses in developing Countries. Washington d.C. 1978, 202p.
17CaSSava
3 Cassava
3.1 cassava in nigeria
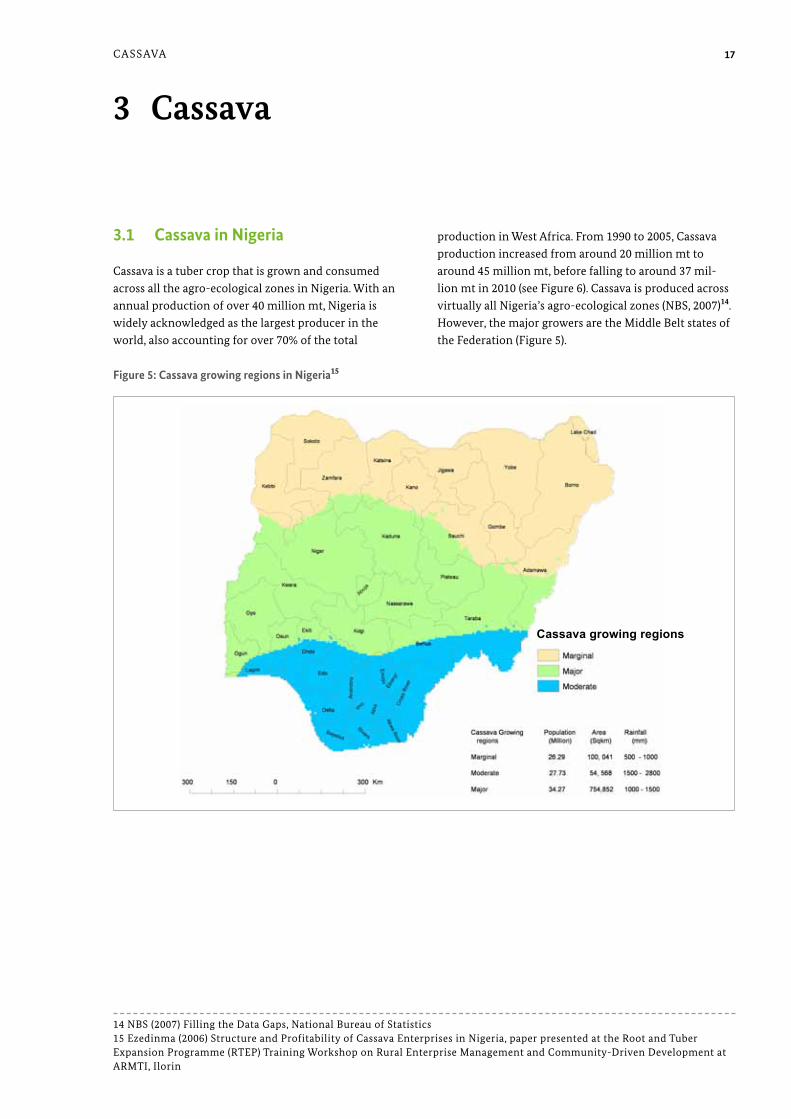
Cassava is a tuber crop that is grown and consumed across all the agro-ecological zones in Nigeria. With an annual production of over 40 million mt, Nigeria is widely acknowledged as the largest producer in the world, also accounting for over 70% of the total
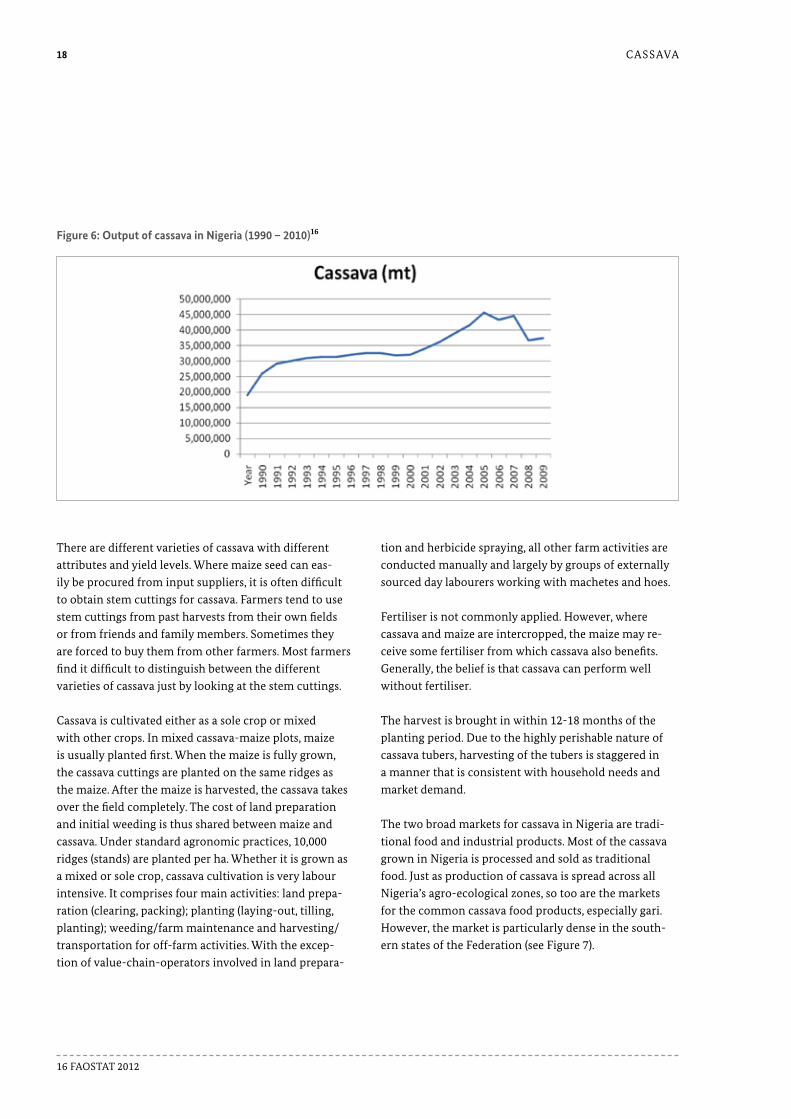
production in West africa. from 1990 to 2005, Cassava production increased from around 20 million mt to around 45 million mt, before falling to around 37 mil-lion mt in 2010 (see figure 6). Cassava is produced across virtually all Nigeria’s agro-ecological zones (NbS, 2007)14. However, the major growers are the middle belt states of the federation (figure 5).
Figure 5: cassava growing regions in nigeria15
Cassava growing regions
14 NbS (2007) filling the data Gaps, National bureau of Statistics 15 ezedinma (2006) Structure and Profitability of Cassava enterprises in Nigeria, paper presented at the root and Tuber expansion Programme (rTeP) Training Workshop on rural enterprise management and Community-driven development at armTi, ilorin
18 CaSSava
There are different varieties of cassava with different attributes and yield levels. Where maize seed can eas-ily be procured from input suppliers, it is often difficult to obtain stem cuttings for cassava. farmers tend to use stem cuttings from past harvests from their own fields or from friends and family members. Sometimes they are forced to buy them from other farmers. most farmers find it difficult to distinguish between the different varieties of cassava just by looking at the stem cuttings.
Cassava is cultivated either as a sole crop or mixed with other crops. in mixed cassava-maize plots, maize is usually planted first. When the maize is fully grown, the cassava cuttings are planted on the same ridges as the maize. after the maize is harvested, the cassava takes over the field completely. The cost of land preparation and initial weeding is thus shared between maize and cassava. under standard agronomic practices, 10,000 ridges (stands) are planted per ha. Whether it is grown as a mixed or sole crop, cassava cultivation is very labour intensive. it comprises four main activities: land prepa-ration (clearing, packing); planting (laying-out, tilling, planting); weeding/farm maintenance and harvesting/transportation for off-farm activities. With the excep-tion of value-chain-operators involved in land prepara-
tion and herbicide spraying, all other farm activities are conducted manually and largely by groups of externally sourced day labourers working with machetes and hoes.
fertiliser is not commonly applied. However, where cassava and maize are intercropped, the maize may re-ceive some fertiliser from which cassava also benefits. Generally, the belief is that cassava can perform well without fertiliser.
The harvest is brought in within 12-18 months of the planting period. due to the highly perishable nature of cassava tubers, harvesting of the tubers is staggered in a manner that is consistent with household needs and market demand.
The two broad markets for cassava in Nigeria are tradi-tional food and industrial products. most of the cassava grown in Nigeria is processed and sold as traditional food. Just as production of cassava is spread across all Nigeria’s agro-ecological zones, so too are the markets for the common cassava food products, especially gari. However, the market is particularly dense in the south-ern states of the federation (see figure 7).
Figure 6: output of cassava in nigeria (1990 – 2010)16
16 faoSTaT 2012

19CaSSava
Figure 7: gari destination markets in nigeria17
Rural market for Gari
The industrial product market for cassava includes the starch, food-grade ethanol and cassava flour markets. of the three markets, the starch market is the most pro-nounced. it comprises the native starch and the modified starch markets (Knipscheer, 2003)18. most of the indus-trial players in this market are also concentrated in the southern states of Nigeria.
3.2 cassava value chains
The cassava value chains examined in this study were selected based on a review of existing literature, consul-tation with experts, and previous field work done in the context of this study.
The critical input suppliers for cassava cultivation are farmers, international research institutions (such as iiTa or CiaT), agricultural development Programs (adPs),
and the roots and Tubers expansion Programme (rTeP). They all provide stem cuttings: the most significant input after labour. Cassava cultivation is dominated by smallholder farmers and household members who are engaged in both upstream (production) and downstream (homestead processing and marketing) activities. differ-ent levels of processing can be observed. These include homestead processing by farmers’ wives, commercial processing by women who buy tubers for processing and selling in product form, and toll processing in which spe-cialised professionals provide peeling, milling (grating), pressing and frying services. There are also some indus-trial processors who buy cassava on a large scale for pro-cessing into starch and other derivatives for use in other industries as well as gari,fufu and lafun for the domestic market. between these actors there are middlemen and women who perform various marketing functions.
19
17 ezedinma, C., ojiako, i. a., okechukwu, r. u., lemchi, J., r., umar, a. m., Sanni, l., akoroda, m., ogbe, f., okoro, e., Tarawai, e., and dixon, a. (2007). The cassava food commodity market and trade network in Nigeria. iiTa, ibadan, iSbN 978-131-200-5. 296 pp. 18 Knipscheer (2003) opportunities in the industrial Cassava market in Nigeria, Winrock/iiTa

20 CaSSava
for the purpose of providing a detailed description of the traditional and industrial sectors, the following value chains will be considered:
i. fresh cassava tubers passing through the marketing and processing stages and reaching households as gari;
ii. fresh cassava tubers passing through the marketing and processing stages and reaching industry as starch.
These end products (gari and starch) are the most traded of all the cassava products in Nigeria.
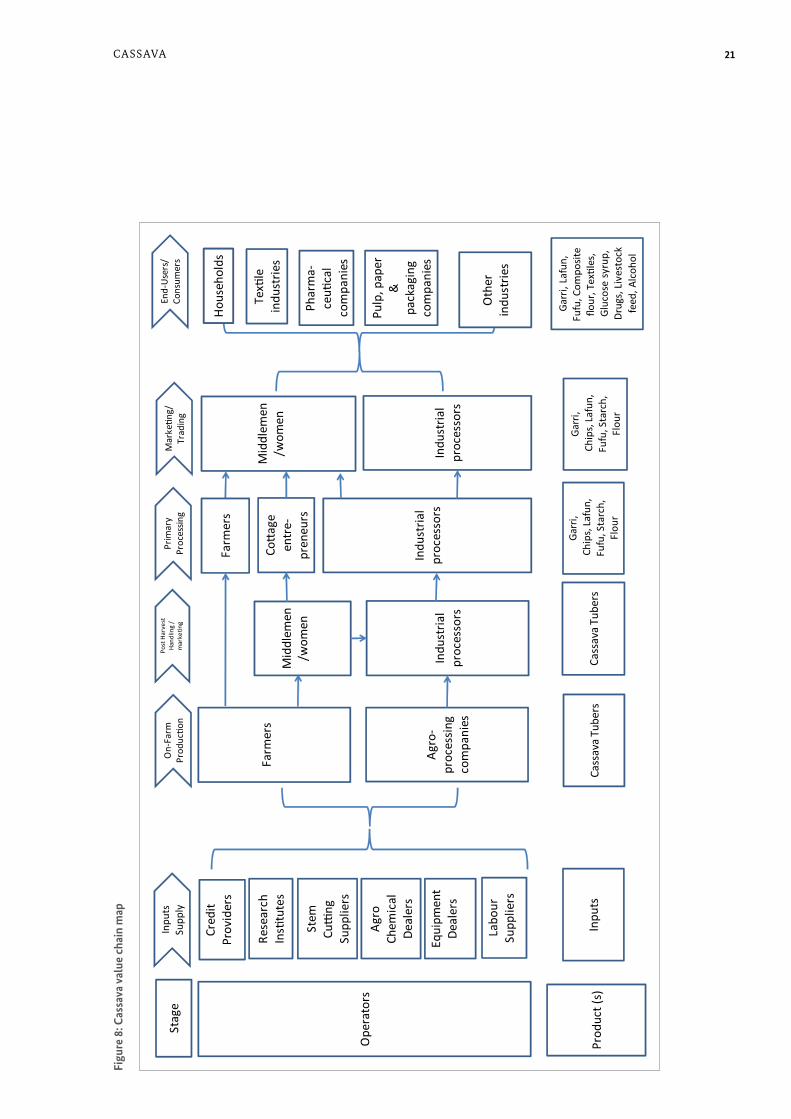
The value chain map for cassava is presented in figure 8, and is supplemented by a functional analysis of key vari-ables (Table 4). The map indicates the operators and the products at each stage of the value chain. it also shows links between the operators across the stages. as shown in the map, the end products of cassava transformation in Nigeria are gari, lafun, fufu19, composite flour, textiles, starch, glucose syrup, medicines, livestock feed and alco-hol. These products emanate from both traditional and industrial sectors in the cassava value chain.
19 Gari is a creamy white, partially gelatinised, roasted, free flowing granular flour with a slightly fermented and sour flavour. fufu is a fermented wet paste widely consumed in eastern and south-western Nigeria. lafun is a whitish cassava powder which is mixed with hot water to form a paste and is widely consumed in south-western Nigeria.
21CaSSava
Figu
re 8
: cas
sava
val
ue c
hain
map
Stag
eIn
puts
Su
pply
On-
Farm
Pr
oduc
�on
Post
Har
vest
Ha
ndlin
g /
mar
ke�n
g
Prim
ary
Proc
essin
gM
arke
�ng/
Tr
adin
g
End-
User
s/
Cons
umer
s
Ope
rato
rs
Prod
uct (
s)In
puts
Mid
dlem
en/w
omen
Cass
ava
Tube
rsCa
ssav
a Tu
bers
Indu
stria
l pr
oces
sors
Farm
ers
Agro
-pr
oces
sing
co
mpa
nies
Cred
it Pr
ovid
ers
Rese
arch
In
s�tu
tes
Stem
Cu
�ng
Su
pplie
rs
Agro
Ch
emic
al
Deal
ers
Equi
pmen
t De
aler
s
Labo
ur
Supp
liers
Farm
ers
Indu
stria
l pr
oces
sors
Co�a
ge
entr
e-pr
eneu
rs
Mid
dlem
en/w
omen
Indu
stria
l pr
oces
sors
Garr
i, Ch
ips,
Lafu
n,
Fufu
, Sta
rch,
Fl
our
Hou
seho
lds
Tex�
le
indu
strie
s
Phar
ma-
ceu�
cal
com
pani
es
Pulp
, pap
er
&
pack
agin
g co
mpa
nies
Oth
er
indu
strie
s
Garr
i, Ch
ips,
Lafu
n,
Fufu
, Sta
rch,
Fl
our
Garr
i, La
fun,
Fu
fu, C
ompo
site
flour
, Tex
�les
, Gl
ucos
e sy
rup,
Dr
ugs,
Live
stoc
k fe
ed, A
lcoh
ol
22 CaSSava
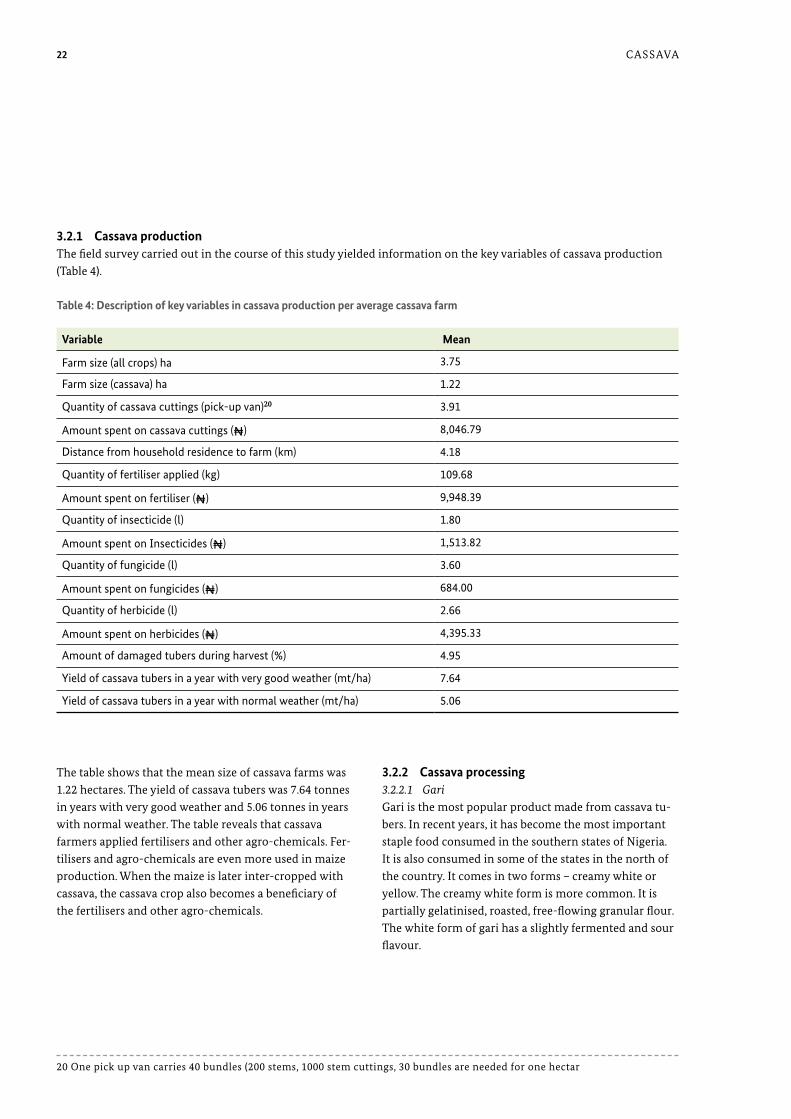
3.2.1 cassava productionThe field survey carried out in the course of this study yielded information on the key variables of cassava production (Table 4).
The table shows that the mean size of cassava farms was 1.22 hectares. The yield of cassava tubers was 7.64 tonnes in years with very good weather and 5.06 tonnes in years with normal weather. The table reveals that cassava farmers applied fertilisers and other agro-chemicals. fer-tilisers and agro-chemicals are even more used in maize production. When the maize is later inter-cropped with cassava, the cassava crop also becomes a beneficiary of the fertilisers and other agro-chemicals.
variable mean
Farm size (all crops) ha 3.75
Farm size (cassava) ha 1.22
Quantity of cassava cuttings (pick-up van)20 3.91
Amount spent on cassava cuttings (₦) 8,046.79
Distance from household residence to farm (km) 4.18
Quantity of fertiliser applied (kg) 109.68
Amount spent on fertiliser (₦) 9,948.39
Quantity of insecticide (l) 1.80
Amount spent on Insecticides (₦) 1,513.82
Quantity of fungicide (l) 3.60
Amount spent on fungicides (₦) 684.00
Quantity of herbicide (l) 2.66
Amount spent on herbicides (₦) 4,395.33
Amount of damaged tubers during harvest (%) 4.95
Yield of cassava tubers in a year with very good weather (mt/ha) 7.64
Yield of cassava tubers in a year with normal weather (mt/ha) 5.06
table 4: description of key variables in cassava production per average cassava farm
3.2.2 cassava processing 3.2.2.1 GariGari is the most popular product made from cassava tu-bers. in recent years, it has become the most important staple food consumed in the southern states of Nigeria. it is also consumed in some of the states in the north of the country. it comes in two forms – creamy white or yellow. The creamy white form is more common. it is partially gelatinised, roasted, free-flowing granular flour. The white form of gari has a slightly fermented and sour flavour.
20 one pick up van carries 40 bundles (200 stems, 1000 stem cuttings, 30 bundles are needed for one hectar

23CaSSava
Peeling continues to represent a challenge as it has not yet been successfully mechanised. The equipment and
tools that are used in gari processing are shown in the following pictures (figures 10 – 15).
21 + 22 ezedinma (2006), Structure and Profitability of Cassava enterprises in Nigeria, Paper Presented at the root and Tuber expansion Programme (rTeP) Training Workshop on rural enterprise management and Community-driven development at armTi, ilorin
Figure 9: stages of gari processing
1. Peeling the tubers
2. Washing the peeled tubers
3. Grating into mash
4. Fermentation and dewatering
(pressing) 5. Sieving
6. Frying the sieved particles
and cooling
7. Packaging for sale
Figure 10: cassava peeler (Futa aKurE)21 Figure 11: cassava peeler (IIta & arcEdEm)22

24 CaSSava
Two main types of equipment are available at the centres for use under a hire arrangement. There is a motorised mechanical grater (mill) and a screw press for dewatering the cassava mash. These are two critical stages that can slow down the processing of cassava into gari. a diesel lister engine serves as the source of power for the motor-ised mechanical grater. The lister engine for grating is the costliest item of equipment used.
The price per kg of gari at the processing centre was ₦ 78 while the corresponding market price was ₦ 118.30 (2012).
Gari processing is undertaken using traditional (house-hold processors) and mechanical or commercial meth-ods. The traditional equipment includes manual hand graters, stones/logs for dewatering, manual sieves and local gari fryers.
There are specialised processing groups comprising mainly women (normally 5-6) that carry out all the processing activities. usually three of the women are dedicated to frying. The groups are paid according to the number of cassava loads processed, the quantity pro-duced, the wage for a day’s labour or payments in-kind (gari) and are often found at the commercial processing centres.
Figure 12: cassava hand peeler23
23 ezedinma (2006), Structure and Profitability of Cassava enterprises in Nigeria, Paper Presented at the root and Tuber expansion Programme (rTeP) Training Workshop on rural enterprise management and Community-driven development at armTi, ilorin 24 Kindly provided by dr. adegboyega eyitayo oguntade
Figure 13: gari frying24
Figure 14: cassava grater and lister engine24

25CaSSava
3.2.2.2 StarchStarch is the major constituent of cassava tubers. litera-ture indicates that cassava roots have a starch content of between 25-35% depending on their age. The starch has thickening and binding qualities which are used in the food and beverage industries and in the manufacture of convenience and baby foods. Starch is also an important raw material for textile and pharmaceutical products. furthermore, the modified starch dextrin, which has ad-hesive properties, is commonly used in the pulp and pa-per industries in the production of corrugated cardboard and cartons for packaging as well as in the furniture and plywood industries.
Starch is produced using traditional and industrial methods. Some elements of the traditional process are similar to those used in gari manufacturing. The activities involved in the production of starch are:
25 ezedinma (2006), Structure and Profitability of Cassava enterprises in Nigeria, Paper Presented at the root and Tuber expansion Programme (rTeP) Training Workshop on rural enterprise management and Community-driven development at armTi, ilorin
Figure 15: cassava grater25

26 CaSSava
maTNa has an integrated plant with a capacity of 4,500 mt of food grade starch per year. in 2012, maTNa bought cassava tubers at ₦ 9,000 per metric ton at the factory gate. its customers include multi-national food process-ing companies, such as Nestlé and unilever, who use the starch as binders in the manufacture of food seasoning products. Non-food manufacturing companies use starch in the production of dry cell batteries, mosquito repel-lent coils, and packaging glue.
figure 17 shows the flow of mass from fresh cassava tubers to gari and starch.
as is the case for gari processing, grating can be carried out manually using hand graters. alternatively, there are mechanical graters powered by lister engines (mills).
industrial manufacturers of starch in Nigeria include maTNa in ogbese, ondo State, Sunshine Cassava Processing factory in ondo, ondo State, Nigerian Starch mill in ihialla, anambra State and Peak Starch factory in abeokuta, ogun State.
Figure 16: stages of starch processing
1. Peeling the tubers
2. Washing the peeled tubers
3. Grating into mash
4. Mixing with water and
sieving
5. Sedimentation
of starch 6. Drying
7. Packaging for sale

27CaSSava
Figure 17: mass flow from fresh cassava tubers to gari and starch

28 CaSSava
Starch trade at commercial level is more significant than that at subsistence and retail level. This is due to the large demand for starch in industry which cannot be met locally. large-scale industries tend to buy directly from processors such as maTNa while at the same time utilis-ing the services of contract suppliers. The packing indus-tries that do not require food-grade starch rely more on contract suppliers. inability to meet demand for starch from local sources has led to Nigeria importing signifi-cant quantities of corn starch each year.
3.3 Quantitative and qualitative analysis of losses in the cassava value chain
When we talk about losses in the cassava value chain, we are referring to measurable quantitative and qualitative losses in the course of transforming cassava into vari-ous products. The two products under consideration in this study are gari and starch. Quantitative loss implies a reduction in the physical substance of the product, re-flected in weight loss. loss of product quality (qualitative loss) is also important, but is more difficult to measure and/or quantify. This is because, in the case of gari, there is a lack of quality criteria that are easily measurable and used by consumers. in the case of starch used for indus-trial purposes, quality criteria are applied which include moisture content and other impurities. Their measure-ment requires the use of specialised equipment and is beyond the scope of this study. The focus of the study is therefore on quantitative losses along the value chain.
3.3.1 Incidence of losses in the cassava value chainan investigation into the incidence of post-harvest losses among cassava farmers yielded the information presented in figure 18.
3.2.3 cassava marketingThere is some trade in fresh tubers but it is not as wide-spread as trade in gari and starch. farmers usually sell their cassava as stands on the farm. Harvesting is the responsibility of the buyer and to that extent it is also the buyer who bears the risk of the yield. frequently, these customers are female entrepreneurs who then engage labourers to harvest and pack the cassava. They then hire vehicles to transport the goods to processing centres. There are some farmers who sell their cassava to indus-trial processors like maTNa. in this instance, they bear the cost of harvesting, packing and transportation to the factory gate.
in the case of the most traded cassava product, gari, different operators are involved in production. These include:
• household farmers/gari processors who retail at subsistence level;
• wives of cassava farmers who sell gari as wholesalers on specific market days;
• gari merchants who buy cassava on the farm and sell gari on a wholesale basis;
• commercial millers who also sell to traders and institutional buyers on a wholesale basis;
• market traders (often women) selling gari.
These operators market varying volumes of products at the processing centres and the markets. Competition is keen and it is rarely possible for any category of operator to control the market.

29CaSSava
analysis of the data collected on the incidence of losses among cassava starch processors yielded the information presented in figure 19.
When we compare the number of farmers who consid-ered the various issues a problem, it becomes clear that the most significant post-harvest losses among cassava farmers are tubers being damaged during harvesting (91%), tubers being too woody to peel with knife (72.9%) and tubers being too small to peel with a knife (61.1%).
Figure 18: losses experienced by cassava farmers
91,0%
54,2% 61,1%
24,3%
72,9%
31,9%
21,4%
12,5%
50,0%
0%
10%
20%
30%
40%
50%
60%
70%
80%
90%
100%

30 CaSSava
claimed that they experience loss of revenue as a result of the damage to the tubers.
figure 20 presents information on the incidence of losses in the value chain, as indicated by the responses received from gari processors.
When we look at the percentage of gari processors that responded ‘yes’ to the incidence of the specific problems, we can see that the most important sources of post-harvest losses among starch processors are tubers being damaged during transportation (70.6%), tubers being lost during processing (66.7%) and tubers being damaged during peeling (41.2%). about 73.3% of the respondents
Figure 19: losses experienced by cassava starch processors
70.6%
41.2%
66.7% 73.3%
5.9% 13.3%
0%
10%
20%
30%
40%
50%
60%
70%
80%
Tubersdamageduring
transport
Tubersdamageduringpeeling
Loss oftubers during
processing
Loss ofrevenue
because ofdamage
Loss of tubersdue to other
problems
Loss due tospoilage
Figure 20: losses experienced by gari processors
94,1%
95,0%
92,9%
90,9% 91,7%
88%
89%
90%
91%
92%
93%
94%
95%
96%
Discard smalltubers
Discard woodytubers
Loss of tubersduring
transportation
Loss of finishedproduct duringtransportation
Loss of finishedproduct during
storage

31CaSSava
The gari marketers’ response on the incidence of losses is presented in figure 21. The numbers indicate that they consider loss of gari during transportation (40.0%) to be the major source of losses. This is probably due to poor handling and transportation facilities in Nigeria.
ing, estimated at 4.95% of the total harvest, followed by losses occurring during storage of the finished product (1.94%) and losses occurring due to small size of the cas-sava tubers (1.93%).
The numbers indicate that the problem of woody (95.0%) and small (94.1%) tubers were the most significant sourc-es of losses being experienced by gari processors. These are followed by tubers being lost during transportation (92.9%) and losses occurring during storage of the fin-ished product (91.7%).
3.3.2 Quantification of losses in the cassava value chain Table 5 presents the cassava farmers’ assessment of loss percentages from harvesting onwards. The table shows that the most significant losses occurred during harvest-
Figure 21: losses experienced by gari marketers
40,0% 40,0%
66,7%
0%
10%
20%
30%
40%
50%
60%
70%
80%
Loss of Gari duringtransportation
Loss of Revenue Loss of Gari during storage

32 CaSSava
losses also occur due to the small size of tubers. When cassava tubers are too small, they are difficult to peel. The very small ones are left on the farms after harvesting or discarded during peeling. When cassava is left on the field for too long, it can become woody. The woody parts of the tubers are discarded during peeling or process-ing. farmers tend to keep cassava standing in the field as a form of storage, especially when prices are too low. Sometimes farmers will wait until the next rainy season to avoid the difficulty of harvesting when the soil is dry.
it is common that farmers process some of their cassava into gari for household consumption. Some of them ex-perience losses during the transportation of tubers to the processing centres and during the transportation of gari back to their houses. Some losses are also recorded by farmers during storage of gari at home.
The gari processors’ assessment of losses during their operations is presented in Table 6.
losses during harvest are usually the result of the soil structure, the season or the harvester’s skill level and equipment. Cassava is usually harvested by digging the roots from the soil or simply pulling the plant out of the ground by the stem, thereby uprooting the tubers. This process frequently results in roots being broken. These damaged roots either remain under the soil or are left on the farm by the harvester. digging out tubers with ma-chetes can also damage the tubers if not done skilfully. furthermore, tubers are more difficult to harvest if the soil contains stones. digging of tubers is also more dif-ficult during the dry season since the soil will invariably be dry and hard. under these conditions, cassava tubers break easily and some of them are lost in the soil. it is for these reasons that losses during harvesting recorded the highest percentage in the survey.
Food losses (gari processors) mean (%)
Loss during transportation of cassava tubers 2.2
Loss of finished product 1.6
Discard of small tubers 5.8
Discard of woody tubers 4.1
Loss during storage due to spoilage 1.11
table 6: Estimates of losses in the cassava value chain – gari processors’ assessment
Food loss (farmers) mean (%)
Loss during harvest 4.95
Loss due to small size tubers 1.93
Loss due to woody tubers 1.72
Loss during transportation to processing centres 1.25
Loss of finished product during transportation from processing centres 1.17
Loss of fresh tuber during storage 1.63
Loss of finished product during storage 1.94
table 5: Estimates of losses in the cassava value chain – farmers’ assessment

33CaSSava
or woody tubers are smaller at the farmers’ level than at the processors’ level. The reason for this is unclear. it could be that farmers are more reluctant to discard their harvest or that they apply different techniques or quality standards.
The starch processors’ assessment of losses in their operations showed that 5.5 % loss occurred during processing of cassava and 6.3 % loss occurred during storage of starch as is shown in Table 7.
as the table shows, losses resulting from the discard of small cassava tubers were estimated at 5.8% of the cassa-va being processed. This was followed by losses resulting from the discard of woody tubers, which were estimated at 4.1%. losses during transportation of cassava tubers were said to amount to 2.2% of the cassava processed. losses during the processing of the finished product were 1.6%, while losses during storage of the finished product were 1.11%. it was estimated that spoilage begins to occur at 4.4 weeks. losses due to the discard of small
losses during transportation of cassava tubers, losses due to woody content (which can be only determined at the processing stage) and losses of the finished product do not play a role in the calculation of post-harvest losses at the farm gate. Thus, Table 9 does not contain informa-tion on these losses. The table presents information on loss due to damage of tubers during harvesting, loss due to tubers being too small and loss of fresh tubers during storage (tubers that are not processed or sold shortly af-ter harvesting).
The gari marketers’ assessment of losses in their operations is presented in Table 8.
moisture was indicated as the most significant cause of gari loss during storage, accounting for losses of about 4.5%. losses during transportation and losses during storage due to rodent pests were each estimated at 2.5%.
3.3.3 monetary quantification of losses in the cassava value chainbeyond the harvesting of cassava tubers, some farmers also carry out processing activities, generating outputs of gari for their household’s consumption. However,
Food losses(gari marketers) mean (%)
Loss of gari during transportation 2.5
Loss of gari during storage due to moisture 4.5
Loss of gari during storage due to rodent pests 2.5
Food losses (starch processors) mean (%)
Loss during processing of cassava 5.5
Loss of starch during storage 6.3
table 8: Estimates of losses in the cassava value chain – gari marketers’ assessment
table 7: Estimates of losses in the cassava value chain – starch processors’ assessment

34 CaSSava
Table 10 indicates that gari processors are experiencing losses of fresh cassava tubers and the finished product (gari).
Total losses accounted for 8.51% of the total harvest of about 37.5 million mt of cassava tubers. The quantity of fresh cassava tubers lost at the farm gate was 3,191,599 mt, which has a total value of be ₦ 31.9 billion (₦ 10,000 per mt).
Food loss (farmers’ questionnaire)
mean (%)
annual prod. (mt)
Qty lost (mt)
Price per mt (₦)
value of food loss (₦)
Loss during harvest (damaged tubers)
4.95
37,504,100
1,856,453 10,000 18,564,529,500
Loss due to small tuber size 1.93 723,829 7,238,291,300
Loss due to woody tubers N/A*
Loss during transportation to processing centre
N/A*
Loss of finished product during transportation from processing centre
N/A*
Loss of fresh tubers during storage 1.63 611,317 6,113,168,300
Loss of finished product during storage
N/A*
total 8.51 3,191,599 31,915,989,100
table 9: monetary assessment of losses of fresh cassava tubers at the farm gate
* These rows are not applicable (N/A) either because the loss does not occur at the farm gate or because the product that is lost is not fresh tubers but gari.
Food loss (gari processors)
mean (%)
annual prod. (mt)
Qty lost (mt)
Price per mt (₦)
value of food loss (₦)
Loss during transportation of cassava tubers
2.2
26,252,870
577,563
10,000
5,775,631,400
Loss of finished product N/A*
Discard of small tubers 5.8 1,522,666 15,226,664,600
Discard of woody tubers 4.1 1,076,368 10,763,676,700
Loss during storage due to spoilage N/A*
total 12,1 3.176.597 31.765.972.700
table 10: monetary assessment of losses of fresh cassava tubers during gari processing phase
* These rows are not applicable (N/a) either because the loss does not occur at the farm gate or because the product that is lost is not fresh tubers but gari.
The total loss of fresh cassava tubers during processing amounted to around 12.1%. The total quantity of cassava processed into gari was estimated at 26.25 million mt per year, which corresponds to 70% of annual cassava
production. The total quantity of fresh cassava tubers lost annually during transportation was 3,176,597 mt. at ₦ 10, 000 per mt, this translates into ₦ 31.7 billion.
35CaSSava
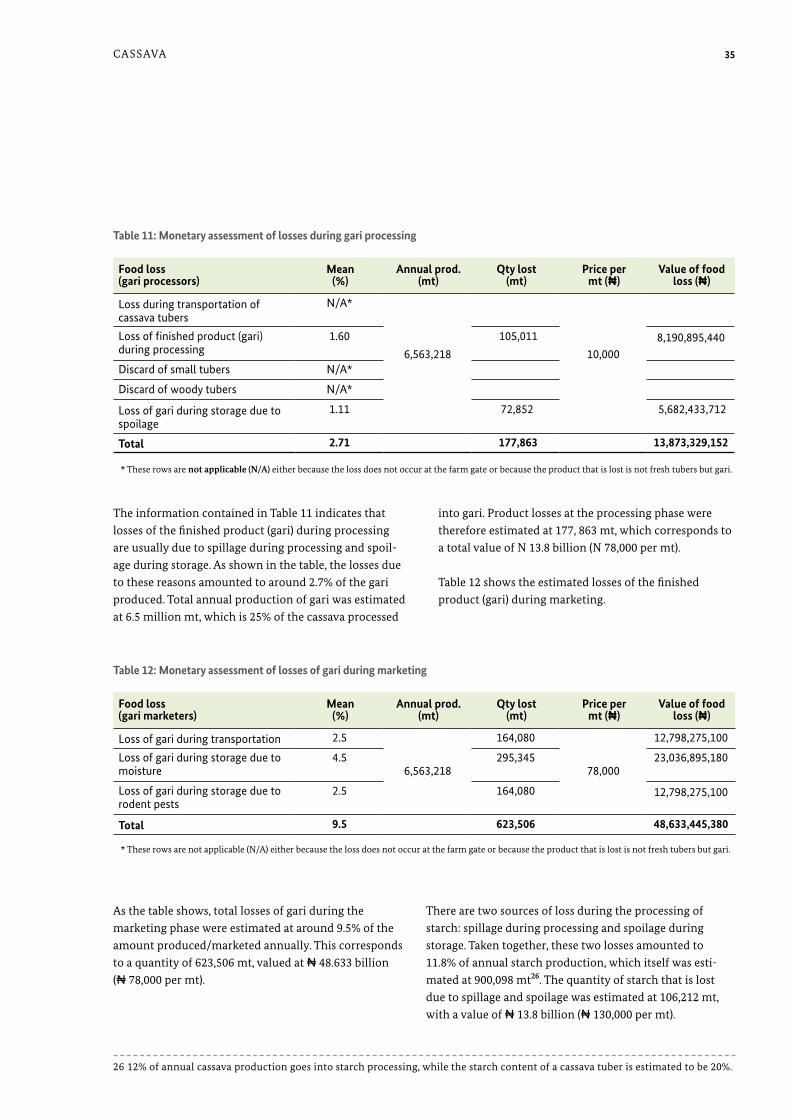
into gari. Product losses at the processing phase were therefore estimated at 177, 863 mt, which corresponds to a total value of N 13.8 billion (N 78,000 per mt).
Table 12 shows the estimated losses of the finished product (gari) during marketing.
The information contained in Table 11 indicates that losses of the finished product (gari) during processing are usually due to spillage during processing and spoil-age during storage. as shown in the table, the losses due to these reasons amounted to around 2.7% of the gari produced. Total annual production of gari was estimated at 6.5 million mt, which is 25% of the cassava processed
Food loss (gari marketers)
mean (%)
annual prod. (mt)
Qty lost (mt)
Price per mt (₦)
value of food loss (₦)
Loss of gari during transportation 2.5
6,563,218
164,080
78,000
12,798,275,100
Loss of gari during storage due to moisture
4.5 295,345 23,036,895,180
Loss of gari during storage due to rodent pests
2.5 164,080 12,798,275,100
total 9.5 623,506 48,633,445,380
table 12: monetary assessment of losses of gari during marketing
* These rows are not applicable (N/a) either because the loss does not occur at the farm gate or because the product that is lost is not fresh tubers but gari.
Food loss (gari processors)
mean (%)
annual prod. (mt)
Qty lost (mt)
Price per mt (₦)
value of food loss (₦)
Loss during transportation of cassava tubers
N/A*
6,563,218
10,000
Loss of finished product (gari) during processing
1.60 105,011 8,190,895,440
Discard of small tubers N/A*
Discard of woody tubers N/A*
Loss of gari during storage due to spoilage
1.11 72,852 5,682,433,712
total 2.71 177,863 13,873,329,152
table 11: monetary assessment of losses during gari processing
* These rows are not applicable (N/A) either because the loss does not occur at the farm gate or because the product that is lost is not fresh tubers but gari.
as the table shows, total losses of gari during the marketing phase were estimated at around 9.5% of the amount produced/marketed annually. This corresponds to a quantity of 623,506 mt, valued at ₦ 48.633 billion (₦ 78,000 per mt).
There are two sources of loss during the processing of starch: spillage during processing and spoilage during storage. Taken together, these two losses amounted to 11.8% of annual starch production, which itself was esti-mated at 900,098 mt26. The quantity of starch that is lost due to spillage and spoilage was estimated at 106,212 mt, with a value of ₦ 13.8 billion (₦ 130,000 per mt).
26 12% of annual cassava production goes into starch processing, while the starch content of a cassava tuber is estimated to be 20%.

36 CaSSava
of gari and starch is indicated Table 14. it amounts to around ₦ 140 billion annually.
The total monetary value of losses along the cassava value chain from harvesting of cassava to marketing
mean (%)
annual prod. (mt)
Qty lost (mt)
Price per mt (₦)
value of food loss (₦)
Loss of starch during Processing 5.5900,098
49,505 130,000
6,435,703,560
Loss of starch during storage 6.3 56,706 7,371,805,896
total 11.8 106,212 13,807,509,456
table 13: monetary assessment of losses of cassava starch during processing and storage
Figure 22: distribution of cassava loss values in mio Eur (exchange rate of 4 February 2013)
146.900 146.200
63.800 63.500
223.800
0
50.000
100.000
150.000
200.000
250.000
Loss of freshcassava at farm
gate
Loss of freshcassava inprocessing
Loss of gari inprocessing
Loss of starch inprocessing and
storage
Loss of gari inmarketing
Quantification of losses in the cassava value chain value of losses (₦)
value of losses (mio Eur)
Loss of fresh cassava tubers at the farm gate 31,915,989,100 146,900
Loss of fresh cassava tubers at the processing phase 31,765,972,700 146,200
Loss of gari at the processing phase 13,873,329,152 63,800
Loss of cassava starch during processing and storage 13,807,509,456 63,500
Loss of gari at the marketing phase 48,633,445,380 223,800
total 139,996,245,788 644,200
table 14: summary of cassava Phl monetary assessment

37maiZe
4 Maize
4.1 maize in nigeria
maize is cultivated in the forest, derived savannah and southern Guinea savannah zones of Nigeria. maize grows best on fertile, well-drained sandy loam or loamy soil. it can be planted on flat soil or on ridges or heaps. it is cultivated either as a sole or mixed crop. most farmers practice mixed cropping, e.g. cassava/maize or cassava/
maize/melon. maize can also be cultivated with yam, guinea corn, rice, cowpeas, groundnuts and soybeans, depending on the production zone. maize cultivation in Nigeria is spread across all states and hence all the agro-ecological zones in the country (NbS, 2007)27. figure 23 indicates that the major producers are found in the middle belt and parts of the Southwest.
27 NbS (2007) filling the data Gaps, National bureau of Statistics 28 uSaid marKeTS, 2010
maize produced in Nigeria is harvested either as green maize or maize grain. The green maize is consumed in season by Nigerians as a snack and as a substitute for reg-
ular food. figure 24 presents information on the output of maize in Nigeria. it is clear that a relatively small pro-portion of the maize output is harvested as green maize.
Figure 23: maize production in nigeria in 200528
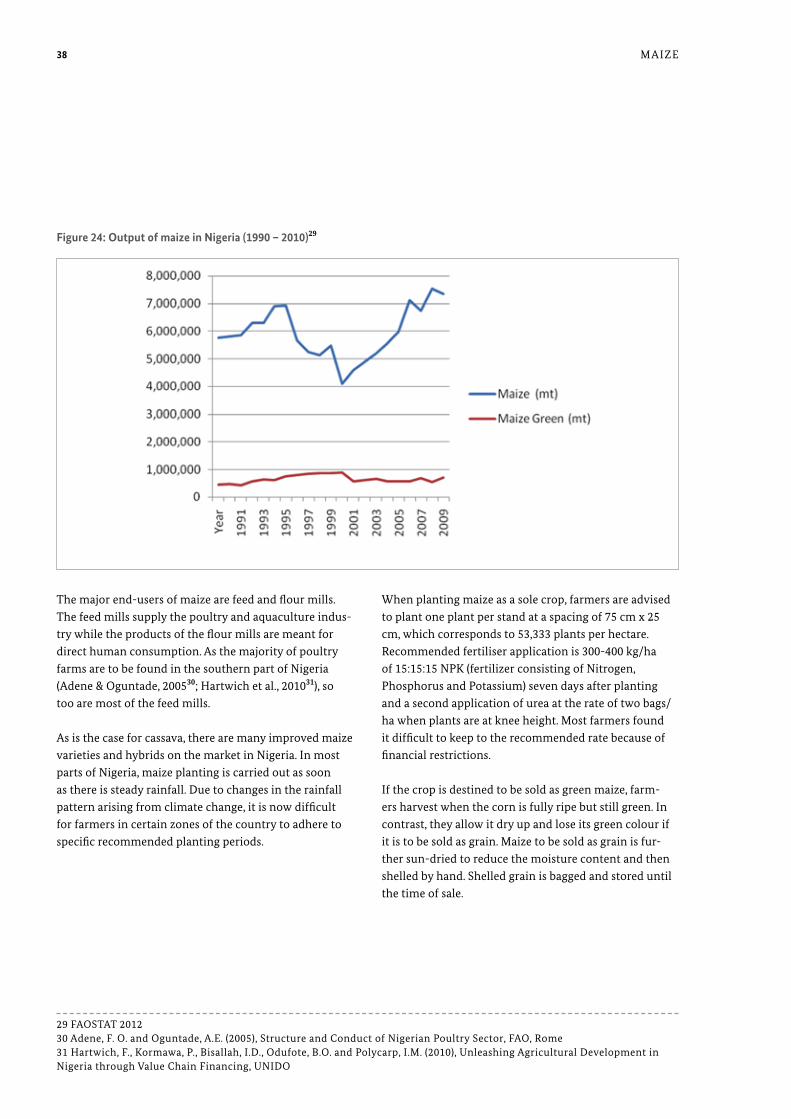
38 maiZe
The major end-users of maize are feed and flour mills. The feed mills supply the poultry and aquaculture indus-try while the products of the flour mills are meant for direct human consumption. as the majority of poultry farms are to be found in the southern part of Nigeria (adene & oguntade, 200530; Hartwich et al., 201031), so too are most of the feed mills.
as is the case for cassava, there are many improved maize varieties and hybrids on the market in Nigeria. in most parts of Nigeria, maize planting is carried out as soon as there is steady rainfall. due to changes in the rainfall pattern arising from climate change, it is now difficult for farmers in certain zones of the country to adhere to specific recommended planting periods.
When planting maize as a sole crop, farmers are advised to plant one plant per stand at a spacing of 75 cm x 25 cm, which corresponds to 53,333 plants per hectare. recommended fertiliser application is 300-400 kg/ha of 15:15:15 NPK (fertilizer consisting of Nitrogen, Phosphorus and Potassium) seven days after planting and a second application of urea at the rate of two bags/ha when plants are at knee height. most farmers found it difficult to keep to the recommended rate because of financial restrictions.
if the crop is destined to be sold as green maize, farm-ers harvest when the corn is fully ripe but still green. in contrast, they allow it dry up and lose its green colour if it is to be sold as grain. maize to be sold as grain is fur-ther sun-dried to reduce the moisture content and then shelled by hand. Shelled grain is bagged and stored until the time of sale.
29 faoSTaT 2012 30 adene, f. o. and oguntade, a.e. (2005), Structure and Conduct of Nigerian Poultry Sector, fao, rome 31 Hartwich, f., Kormawa, P., bisallah, i.d., odufote, b.o. and Polycarp, i.m. (2010), unleashing agricultural development in Nigeria through value Chain financing, uNido
Figure 24: output of maize in nigeria (1990 – 2010)29
39maiZe
i. fresh maize passing through the marketing and processing stages and reaching households as grain;
ii. fresh maize passing through the marketing and processing stages and reaching feed millers as grain.
Trade in maize grain is more significant than trade in fresh maize, with most of the grain being used in the livestock feed industry.
4.2 value chains of maize grain and green maize
The value chain map for maize is presented in figure 25. The map indicates the stages of the value chain and the operators and products at each level. it also illustrates links between the operators across the stages. as shown in the map, the end products of maize transformation in Nigeria are green maize, breakfast cereals32 and feed. These products emanate from both traditional and in-dustrial sectors in the maize value chain. for the purpose of providing a detailed description of the traditional and industrial sectors, the following value chains will be con-sidered:
32 breakfast cereals comprise cornflakes for mostly urban population and pap – a slurry liquid substance

40 maiZe
Figu
re 2
5: m
aize
val
ue c
hain
map
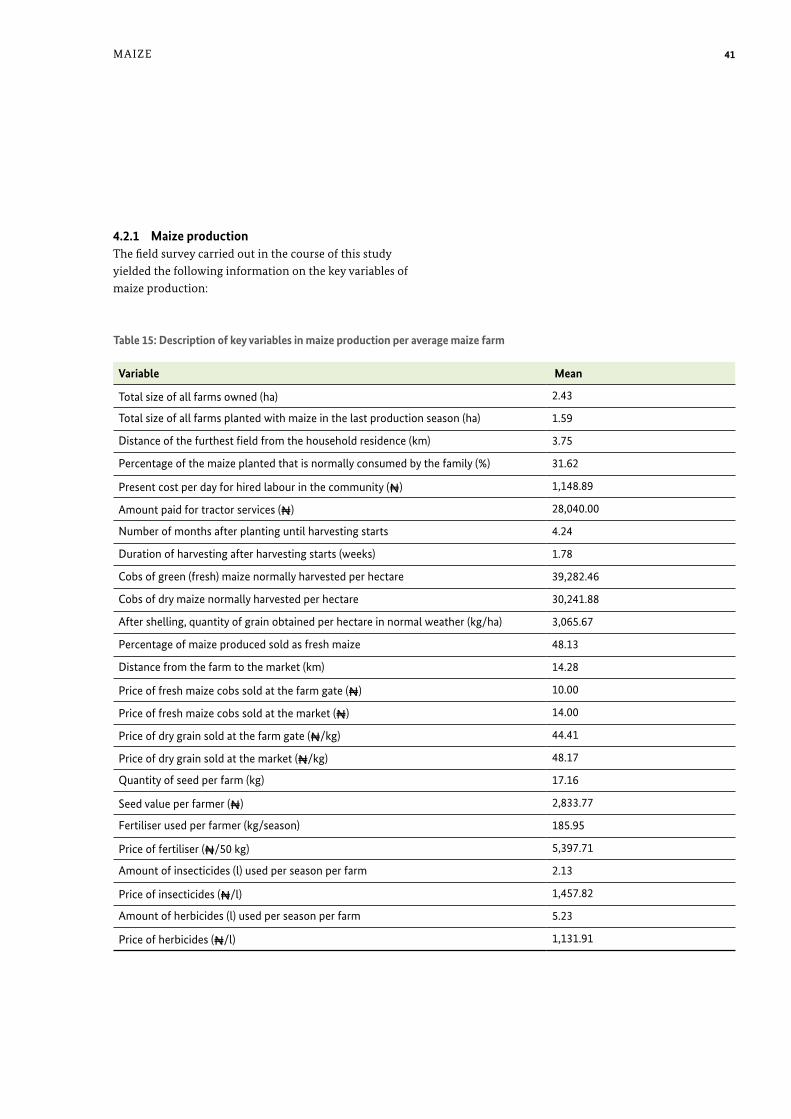
41
variable mean
Total size of all farms owned (ha) 2.43
Total size of all farms planted with maize in the last production season (ha) 1.59
Distance of the furthest field from the household residence (km) 3.75
Percentage of the maize planted that is normally consumed by the family (%) 31.62
Present cost per day for hired labour in the community (₦) 1,148.89
Amount paid for tractor services (₦) 28,040.00
Number of months after planting until harvesting starts 4.24
Duration of harvesting after harvesting starts (weeks) 1.78
Cobs of green (fresh) maize normally harvested per hectare 39,282.46
Cobs of dry maize normally harvested per hectare 30,241.88
After shelling, quantity of grain obtained per hectare in normal weather (kg/ha) 3,065.67
Percentage of maize produced sold as fresh maize 48.13
Distance from the farm to the market (km) 14.28
Price of fresh maize cobs sold at the farm gate (₦) 10.00
Price of fresh maize cobs sold at the market (₦) 14.00
Price of dry grain sold at the farm gate (₦/kg) 44.41
Price of dry grain sold at the market (₦/kg) 48.17
Quantity of seed per farm (kg) 17.16
Seed value per farmer (₦) 2,833.77
Fertiliser used per farmer (kg/season) 185.95
Price of fertiliser (₦/50 kg) 5,397.71
Amount of insecticides (l) used per season per farm 2.13
Price of insecticides (₦/l) 1,457.82
Amount of herbicides (l) used per season per farm 5.23
Price of herbicides (₦/l) 1,131.91
table 15: description of key variables in maize production per average maize farm
maiZe
4.2.1 maize production The field survey carried out in the course of this study yielded the following information on the key variables of maize production:

42 maiZe
The table shows that the mean size of maize farms was 1.59 hectares while the maize yield per hectare was 39,282 cobs for green (fresh) maize and 30,241 cobs for dry maize. after shelling, the quantity of grain obtained per hectare was estimated at 3,065.67 kg per ha. 48.13% of the maize produced is sold as green maize.
4.2.2 Processing of maize into feedmaize is processed into feed as part of commercial livestock feed milling operations in Nigeria. The major actors in this sector are feed millers, grain merchants/buyer agents, importers of concentrates, additives and supplements, poultry shops and poultry and aquaculture farms. Three types of feed millers can be identified: cus-tom, toll and integrated farms. The custom millers mill and market their feeds under registered trade names. The dominant trade names in the market include amo bym, Guinea feed, Top feed, and vital feed, among others.
The toll millers are found in locations with significant concentrations of small to medium scale poultry and aq-uaculture farms. The mill operators produce feed to the specification of customers (poultry and catfish farmers) and charge a fee (toll) per quantity milled. They also sell feed ingredients (including maize grain) to customers. The third category of feed millers is integrated poultry and aquaculture farms, which own feed mills and pro-duce feed for their own use. Some of these farms sell part of their feed output to other farms.
The feed millers acquire their grain from grain mer-chants/buying agents who in turn buy their grain mostly from farmers. These merchants have established net-works for aggregating grain from smallholder farmers.
feed millers also require other ingredients for their ra-tions, including fish meal, lysine methionine and soy meal. They acquire these ingredients from importers and their intermediaries. The marketing of feeds and other poultry and aquaculture inputs is generally undertaken by the feed retailers.
Figure 26: stages of maize feed processing
1. Formulating the ration (determining the ingredient mix)
2. Measuring the quantities of the
various ingredients required
3. Milling the bulk ingredients to the
required sizes
4. Mixing the ingredients to ensure even distribution of
components
5. Pelletising (optional)/extruding to
floating feed for catfish
6. Bagging

43maiZe
country, they supply the wholesale markets in the urban centres as well as feed millers around the country. retail-ers buy grain from the wholesale markets and sell it in small units (kongos/mudus)33 to consumers.
4.3 Quantitative and qualitative analysis of losses in the maize value chain
The study looked at two products in the maize value chain: green maize and feed. loss measurement focused on quantitative losses along the value chain, as criteria for qualitative measurement are difficult to establish and communicate to operators.
4.3.1 Incidence of losses in maize value chain The incidence of post-harvest losses among maize farmers was determined using a set of specific questions. The information obtained, which is presented in figure 27, shows that only four causes of loss were identified by the farmers. The most significant of these is pests and disease attacking maize in the field.
4.2.3 maize marketing maize is traded both as green maize and grain. Trade in green maize is carried out mostly as rural/urban and peri-urban/urban trade. Green maize is seldom moved over very long distances because it is expected to reach consumers fresh. Green maize that is kept for longer than 24 hours before consumption loses its sweetness as some of its sugar content is converted into starch.
Green maize is harvested and sold as cobs. Women trad-ers usually buy green maize at the farm gate or at rural markets, in varying quantities. Those who purchase small amounts usually sell the green maize directly to consum-ers in boiled or roasted form. Those who buy large quan-tities transport the maize to urban centres and sell it in smaller portions to retailers. These urban retailers also sell the green maize in boiled or roasted form to consumers.
Trade in maize grain is dominated by grain merchants. These merchants have established networks for aggregat-ing grain from smallholder farmers and have mastered the logistics of maize transportation across the country. buying their grain mostly from the northern part of the
33 Kongos and mudus are standard volume measures of grain, flour, etc. that are recognised by the Government. one kongo of maize grain weighs about 1.4 kg.
Figure 27: losses experienced by maize farmers
32,9%
26,7% 30,0%
20,7%
0%
5%
10%
15%
20%
25%
30%
35%
Pest and diseaseattacks on maize
field
Maize cobs usuallydamage during
harvesting
Loss of revenue dueto damagedgrain/cobs
Discard afterharvesting becauseof other problems

44 maiZe
The most important sources of loss among maize mar-keters are losses of maize grain due to challenges in marketing and transportation of maize grain (72.22 %), losses in storage during the processes of aggregation and marketing due to spillage (68.18 %) and losses of maize grain during storage due to spoilage (46.67 %) as is shown in figure 28.
analysis of the data collected on the incidence of losses among maize marketers yielded the information presented in figure 28.
Figure 28: losses experienced by maize marketers
18,75%
37,50%
72,22%
68,18%
46,67%
0%
10%
20%
30%
40%
50%
60%
70%
80%
Loss of revenue due totransportation losses
Discard after buying fromfarmers due to poor quality
Loss due to challenges inmarketing and transportation
Loss in storage/process ofaggregation/marketing due to
spillage
Loss during storage due tospoilage
figure 29 presents the information provided by the feed millers on the incidence of losses in their operations. it indicates that the most significant problems occurred during transportation of maize from the market to the feed mill (83.3%), during storage of maize grain before milling (83.3%), during storage of the finished product (spillage: 83.3%) and during storage of maize grain (spoil-age: 80.0%).
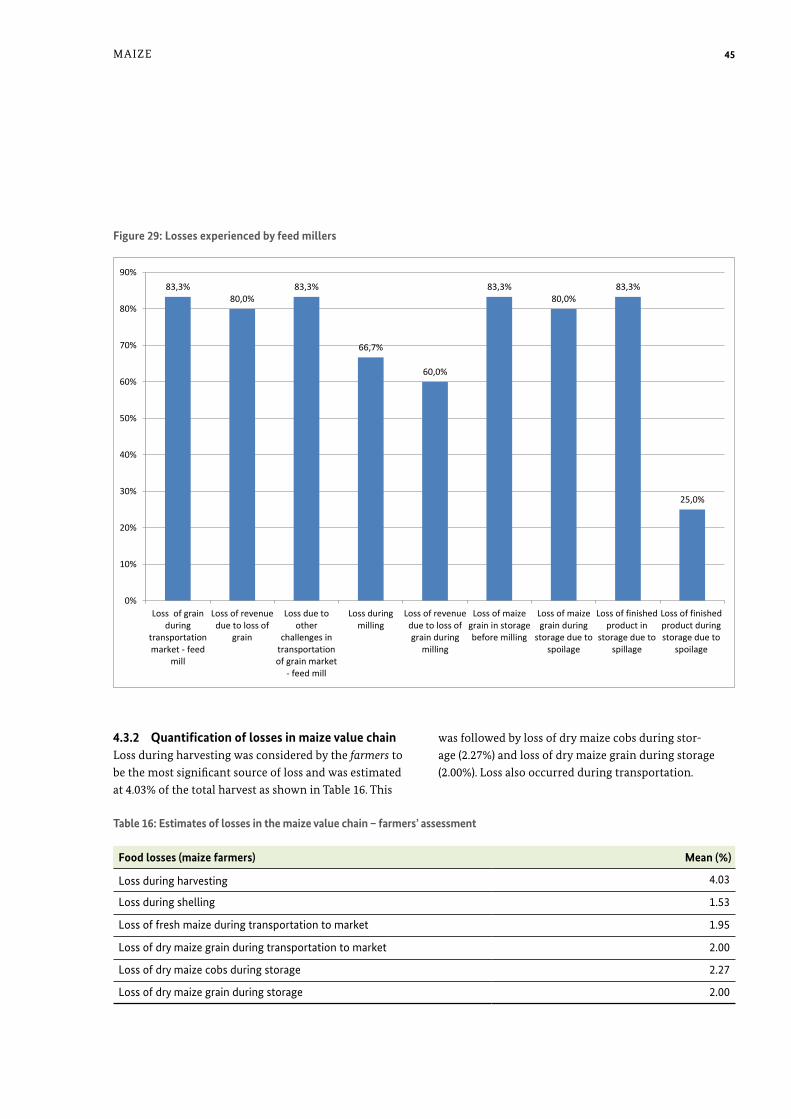
45maiZe
Figure 29: losses experienced by feed millers
83,3% 80,0%
83,3%
66,7%
60,0%
83,3% 80,0%
83,3%
25,0%
0%
10%
20%
30%
40%
50%
60%
70%
80%
90%
Loss of grainduring
transportationmarket - feed
mill
Loss of revenuedue to loss of
grain
Loss due toother
challenges intransportationof grain market
- feed mill
Loss duringmilling
Loss of revenuedue to loss ofgrain during
milling
Loss of maizegrain in storagebefore milling
Loss of maizegrain during
storage due tospoilage
Loss of finishedproduct in
storage due tospillage
Loss of finishedproduct duringstorage due to
spoilage
was followed by loss of dry maize cobs during stor-age (2.27%) and loss of dry maize grain during storage (2.00%). loss also occurred during transportation.
4.3.2 Quantification of losses in maize value chainloss during harvesting was considered by the farmers to be the most significant source of loss and was estimated at 4.03% of the total harvest as shown in Table 16. This
Food losses (maize farmers) mean (%)
Loss during harvesting 4.03
Loss during shelling 1.53
Loss of fresh maize during transportation to market 1.95
Loss of dry maize grain during transportation to market 2.00
Loss of dry maize cobs during storage 2.27
Loss of dry maize grain during storage 2.00
table 16: Estimates of losses in the maize value chain – farmers’ assessment

46 maiZe
Problems mean (%)
Amount of maize grain lost during transportation 2.0
Amount of product (feed) lost during transportation 3.0
Amount of the maize grain spoiled in storage 2.0
Spoilage of maize grain in storage due to rodents 2.8
Spoilage of maize grain in storage due to Weevils 1.0
Amount of product (feed) lost during storage due to spillage 2.0
Amount of product (feed) lost during storage due to weevils 2.0
table 18: Estimates of losses in the maize value chain – feed millers’ assessment
Table 17 presents the maize marketers’ assessment of losses in their operations. loss of maize grain during storage due to weevils was estimated at 8.5% while loss of maize grain during storage due to rodents was 6.0%. loss of maize grain during storage due to spillage was 5.9%
while loss during transportation amounted to 3.7%. loss due to moisture was estimated at 2.5%. fungus infesta-tion does not appear to be considered a source of loss. This is probably because it tends to affect quality rather than quantity.
Problems mean (%)
Loss during transportation 3.7
Loss of maize grain during storage due to spillage 5.9
Loss of maize grain during storage due to rodents 6.0
Loss of maize grain during storage due to weevils 8.5
Loss of maize grain during storage due to fungus -
Loss of maize grain during storage due to excess moisture 2.5
table 17: Estimates of losses in the maize value chain – marketers’ assessment
Table 18 presents the feed millers’ assessment of losses in their operations. The two most significant sources of losses are loss of the product (feed) during transporta-tion (3.0%) and spoilage of maize grain in storage due to rodent attacks (2.8%). Commercial feed millers have to distribute their products over a wide geographical area. This requires transportation over long distances. The bags of feed may sometimes break during transporta-tion, leading to spillage of feed. Customers are unwilling to purchase feed in broken bags because they do not want to run the risk of further spillage of feed within their own store before sale or use. rodents are major pests wherever they have easy access to food and are
consequently often found in stores in which grain and livestock feed are kept. Their presence is encouraged by the spillage of grain and feed and they can cause spillage themselves as they often cut open the bags to gain access to their contents. The ready availability of a rich diet of feed supports their rapid proliferation in these environments.
feed millers also experienced loss of maize grain dur-ing transportation (2.0%), spoilage of maize grain in storage (2.0%) and loss of the product (feed) during storage due to spillage (2%).
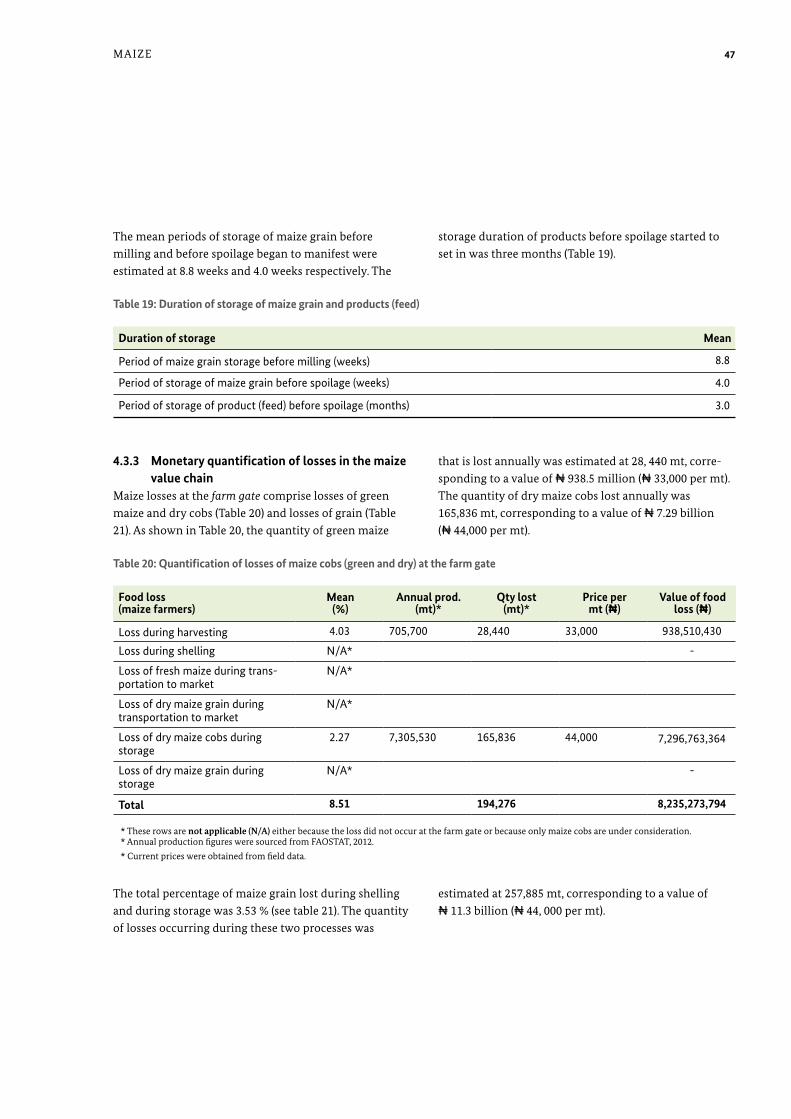
47maiZe
storage duration of products before spoilage started to set in was three months (Table 19).
The mean periods of storage of maize grain before milling and before spoilage began to manifest were estimated at 8.8 weeks and 4.0 weeks respectively. The
duration of storage mean
Period of maize grain storage before milling (weeks) 8.8
Period of storage of maize grain before spoilage (weeks) 4.0
Period of storage of product (feed) before spoilage (months) 3.0
table 19: duration of storage of maize grain and products (feed)
4.3.3 monetary quantification of losses in the maize value chainmaize losses at the farm gate comprise losses of green maize and dry cobs (Table 20) and losses of grain (Table 21). as shown in Table 20, the quantity of green maize
that is lost annually was estimated at 28, 440 mt, corre-sponding to a value of ₦ 938.5 million (₦ 33,000 per mt). The quantity of dry maize cobs lost annually was 165,836 mt, corresponding to a value of ₦ 7.29 billion (₦ 44,000 per mt).
The total percentage of maize grain lost during shelling and during storage was 3.53 % (see table 21). The quantity of losses occurring during these two processes was
estimated at 257,885 mt, corresponding to a value of ₦ 11.3 billion (₦ 44, 000 per mt).
Food loss (maize farmers)
mean (%)
annual prod. (mt)*
Qty lost (mt)*
Price per mt (₦)
value of food loss (₦)
Loss during harvesting 4.03 705,700 28,440 33,000 938,510,430
Loss during shelling N/A* -
Loss of fresh maize during trans-portation to market
N/A*
Loss of dry maize grain during transportation to market
N/A*
Loss of dry maize cobs during storage
2.27 7,305,530 165,836 44,000 7,296,763,364
Loss of dry maize grain during storage
N/A* -
total 8.51 194,276 8,235,273,794
table 20: Quantification of losses of maize cobs (green and dry) at the farm gate
* These rows are not applicable (N/A) either because the loss did not occur at the farm gate or because only maize cobs are under consideration. * annual production figures were sourced from faoSTaT, 2012.
* Current prices were obtained from field data.

48 maiZe
was estimated at 1.2 million mt, while the total quantity of maize lost at this stage was 93,600 mt, corresponding to a value of ₦ 4.1 billion.
losses of grain and feed at the feed milling stage of the maize value chain are presented in Table 23. it shows the quantity and value of maize grain lost annually. The total quantity of maize going into feed production each year
Food loss (maize farmers)
mean (%)
annual prod. (mt)*
Qty lost (mt)
Price per mt (₦)
value of food loss (₦)
Loss during transportation 3.7
7,305,530
270,305
44,000
11,893,402,840
Loss of maize grain during storage due to spillage
5.9 431,026 18,965,155,880
Loss of maize grain during storage due to rodents
6 438,332 19,286,599,200
Loss of maize grain during storage due to weevils
8.5 620,970 27,322,682,200
Loss of maize grain during storage due to fungus
-
Loss of maize grain during storage due to excess moisture
2.5 182,638 8,036,083,000
total 26.6 1,943,271 85,503,923,120
table 22: Quantification of losses of maize grain during marketing (storage and transportation)
The total quantity of maize grain lost was 1,943,271 mt. The value of this loss was 85.5 billion.
losses of maize grain during transportation and storage at the marketing phase are presented in Table 22.
Food loss (maize farmers)
mean (%)
annual prod. (mt)*
Qty lost (mt)
Price per mt (₦)*
value of food loss (₦)
Loss during harvesting N/A
7,305,530
44,000
Loss during shelling 1.53 111,775 4,918,082,796
Loss of fresh maize during transportation to market
N/A*
Loss of dry maize grain during transportation to market
N/A*
Loss of dry maize cobs during storage
N/A*
Loss of dry maize grain during storage
2.00 146,111 6,428,866,400
total 3.53 257,885 11,346,949,196
table 21: Quantification of losses of maize grain at the farm gate
* These rows are not applicable because only maize grain is under consideration.
* annual production figures were sourced from faoSTaT, 2012.
* Current prices were obtained from field data.

49maiZe
Table 24 shows the quantity and value of feed lost during the marketing of feed. about 140,000 mt of feed was lost due to spillage during transportation, pest attacks and
spoilage during storage. This was valued at ₦ 11.2 billion (₦ 80,000 per mt).
loss of maize grain during processing
mean (%)
maize milled (2010) (mt)34
maize lost (mt)
Price per mt (₦)
value of food loss (₦)
Amount of maize grain lost during transportation
2
1,200,000
24,000
44,000
1,056,000,000
Amount of product (feed) lost during transportation
N/A*
Amount of maize grain spoiled in storage
2 24,000 1,056,000,000
Spoilage of maize grain in storage due to rodents
2.8 33,600 1,478,400,000
Spoilage of maize grain in storage due to weevils
1 12,000 528,000,000
Amount of product (feed) lost during storage due to spillage
N/A* -
Amount of product (feed) lost during storage due to weevils
N/A* -
total 5.8 93,600 4,118,400,000
table 23: Quantification of losses of maize grain during feed milling
* These rows are not applicable because only maize grain is under consideration.
34 uSda foreign agricultural Service, Global agricultural information Network, ‘Nigeria Grain and feed annual’, GaiN report Number Ni11015, 4/15/2011 35 estimated based on the quantity of maize that was used for feed production. See footnote 36.
Food loss (livestock feed) mean (%)
annual prod. (mt)35
Qty lost (mt)
Price per mt (₦)
value of food loss (₦)
Amount of maize grain lost during transportation
N/A*
2,000,000
80,000
Amount of product (feed) lost du-ring transportation
3 60,000 4,800,000,000
Amount of the maize grain spoiled in storage
N/A*
Spoilage of maize grain in storage due to rodents
N/A*
Spoilage of maize grain in storage due to weevils
N/A*
Amount of product (feed) lost during storage due to spillage
2 40,000 3,200,000,000
Amount of product (feed) lost during storage due to weevils
2 40,000 3,200,000,000
total 7 140,000 11,200,000,000
table 24: Quantification of losses of feed during marketing
* These rows are not applicable because only livestock feed is under consideration.
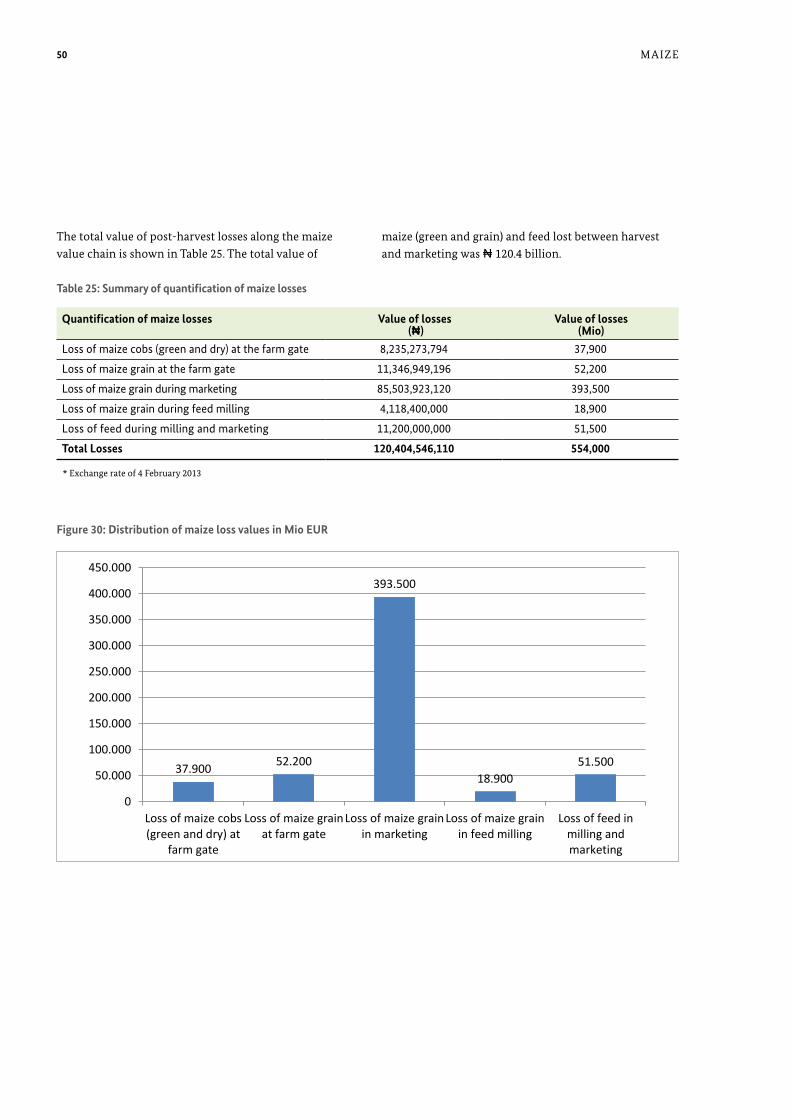
50 maiZe
Figure 30: distribution of maize loss values in mio Eur
37.900 52.200
393.500
18.900 51.500
0
50.000
100.000
150.000
200.000
250.000
300.000
350.000
400.000
450.000
Loss of maize cobs(green and dry) at
farm gate
Loss of maize grainat farm gate
Loss of maize grainin marketing
Loss of maize grainin feed milling
Loss of feed inmilling andmarketing
maize (green and grain) and feed lost between harvest and marketing was ₦ 120.4 billion.
The total value of post-harvest losses along the maize value chain is shown in Table 25. The total value of
Quantification of maize losses value of losses (₦)
value of losses (mio)
Loss of maize cobs (green and dry) at the farm gate 8,235,273,794 37,900
Loss of maize grain at the farm gate 11,346,949,196 52,200
Loss of maize grain during marketing 85,503,923,120 393,500
Loss of maize grain during feed milling 4,118,400,000 18,900
Loss of feed during milling and marketing 11,200,000,000 51,500
total losses 120,404,546,110 554,000
* exchange rate of 4 february 2013
table 25: summary of quantification of maize losses
51maiZe
When synthetic fertiliser bags are used, the maize grain is packed in bags after shelling and the bags are tied to prevent insect attacks and spillage. most large-scale farmers use this method because the bags can hold large quantities of grain and can be conveniently stacked in the store.
rhumbu are traditional silos made of mud mixed with grass. The rhumbu is elevated from the ground with the aid of stones to guard against attacks by rodents, and covered with a thatched roof to protect it against rain. rhumbu are usually built very close to residential areas to guard against theft.
raised platforms on the farm are used to store dry maize cobs in large quantities. Platforms are constructed by tying bamboo sticks together. Stored on raised plat-forms the cobs are exposed to insect attacks, rainfall and humidity, which can cause deterioration and hence food loss.
Some small-scale farmers store and preserve their dry maize cobs by hanging them over the fireplace. This method uses smoke to keep the cobs dry and repel insects. However, the cobs can reabsorb moisture if the fireplace is devoid of fire for a considerable time. maize kept in this way is prone to rodent attack. The use of ceiling storage facilities is common among smallholder farmers and is used for small quantities of cobs.
4.3.4 maize storage facilities in the study areasinsect pests are one of the major causes of decline in quantity, quality and germination potential of maize seeds in storage. adequate and effective storage of maize grain is therefore necessary to protect against loss during storage and limit economic damage. according to uSda GaiN (united States department of agriculture – Global agricultural information Network), about 30 percent of Nigeria’s grain output is lost due to spoilage, contamina-tion, attack by insects and rodents, and physiological deterioration in storage (Post-Harvest losses)36.
in most areas of Nigeria, small quantities of maize are preserved by sun-drying. maize cobs are spread out in the sun and, when necessary, protected from the rain. after this process, the farmer or the maize marketer decides whether to store the maize as grain or as cobs. When cobs are dry enough, they can easily be shelled manually or using a shelling device.
in Nigeria, there are various means of storing maize. These include synthetic fertiliser bags, raised platforms on the farm, cribs, clay pots, rhumbu, oba, bare floor, bottles, baskets, drums, hanging cobs over the fireplace or from the ceiling, etc. in the north the most widespread means are synthetic fertiliser bags, rhumbu and storage on the bare floor, while synthetic fertiliser bags, raised platforms on the farm, baskets, and hanging over the fireplace and from the ceiling are more common in the south.
36 uSda foreign agricultural Service, Global agricultural information Network, ‘Nigeria Grain and feed annual’, GaiN report Number Ni11015, 4/15/2011
Quantification of maize losses value of losses (₦)
value of losses (mio)
Loss of maize cobs (green and dry) at the farm gate 8,235,273,794 37,900
Loss of maize grain at the farm gate 11,346,949,196 52,200
Loss of maize grain during marketing 85,503,923,120 393,500
Loss of maize grain during feed milling 4,118,400,000 18,900
Loss of feed during milling and marketing 11,200,000,000 51,500
total losses 120,404,546,110 554,000
* exchange rate of 4 february 2013

52 by-ProduCTS aloNG THe maiZe aNd CaSSava value CHaiNS
in the case of maize, two potential by-products can be identified. These are the husks and the empty cobs (cobs with the grain removed). To date these two by-products are not known to have any valuable use and must therefore be treated as waste products.
a by-product is a useful or commercially valuable product produced incidentally in the production of other outputs. Waste products are unwanted products occur-ring in a value chain that are considered useless and of no commercial value. Theoretically, a waste product can become a useful by-product if a use can be found for it, or if, through the development of new technologies, it can be used as an input in other production processes.
The gari production process illustrated in figure 17 (flow of mass from fresh cassava tubers to gari and/or starch) generates a number of by-products. These are the fresh peel, which accounts for around 25% of the fresh cassava tuber, the fibre obtained after sieving the dewatered cassava mash, which amounts to around 2.3% of the fresh tuber, and the coarse granules which are obtained after sieving the fried gari, which amount to around 0.1% of the fresh tuber.
by-products of the starch production process include fresh cassava peel as with gari, along with the fibre aris-ing from the sieving of cassava starch slurry from cassava mash. The by-products that currently have commercial value, albeit little, are the fresh cassava peel, the fibre and the coarse granules from the gari production pro-cess. The fibre from the starch production process has little or no value, because extraction of the starch dur-ing the sieving process removes virtually all the energy content of the fibre. from the point of view of quantity, the coarse granules that can be obtained from sieving fried cassava mash (gari) are negligible. The by-product produced in the greatest quantities is the fresh cassava peel, which can account for up to 25% of the fresh tuber. This by-product is usually sun-dried and fed to livestock. Some of the processing centres claimed that it was some-times bought by pig farmers. The fibre that results from the sieving of dewatered cassava mash is usually milled into flour and consumed by human beings. it is prepared like ground rice and eaten with soup.
5 By-products along the maize and cassava value chain

53
6 Options for reducing food losses recommendations for the private sector, national authorities and donors
oPTioNS for reduCiNG food loSSeS
6.1 technology
The use of inappropriate technology for harvesting cassava is a major reason for losses of fresh tubers, especially during dry periods. Similarly, lack of suitable cassava peeling technology not only makes the work more difficult but also leads to part of the tuber itself being lost along with the outer peel. Insufficient knowl-edge regarding the right time to harvest the different varieties of cassava tuber results in woody tubers that are discarded at the time of processing, which is a further cause of losses. The efficiency of grating/milling can also affect the amount of loss occurring in the process of transforming cassava into gari or starch.
many losses in the maize and cassava starch value chains occur as a result of inappropriate bagging and packag-ing, poor transportation systems and inappropriate storage technology. Weevils and rodents constitute a major source of loss of maize grain in storage.
Appropriate technologies could be developed through collaborative research projects conducted by public and private actors. The process of peeling by hand could be eliminated in the production of starch, with the tubers simply being washed and milled. This would require an affordable technology that could be deployed on a small scale to remove the particles of brown cassava peel from the slurry after milling and mixing with water. Similarly the development of an efficient and affordable cassava peeling machine could help to eliminate unnecessary work as well as addressing the problem of waste resulting from over-peeling.
6.2 organisation of farmers and the value chain
Poverty and subsistence production limit the technologi-cal and marketing options available to the farmers. better organisation of farmers and the whole value chain could help to overcome these obstacles to progress.
due to the decline of farmers’ organisations and coop-eratives, farmers no longer have the capacity to influence the production, processing, transportation and market-ing of agricultural commodities. farmers can pool their resources and create economic incentives to improve transportation and storage facilities, thus helping to reduce food losses and enhance their own incomes. as groups and cooperatives, they will be able to receive credit from agricultural financial institutions or advance payments from buyers of their produce.
farmers currently tend to keep cassava on the farm for longer than optimal periods in order to retain its value and ensure the food security of their household. They harvest/sell just enough cassava stands to meet the food and/or cash needs of the household. This can result in the fibre content of the tubers increasing significantly before they are harvested.
it would be advisable for the department of Coopera-tives at the state and federal levels to collaborate with the State offices of the Nigerian ministry of agriculture and rural development to promote farmers’ organisations. When organised into functioning cooperatives, the farm-ers are able to pool their resources and are more likely to invest in efficient packaging/bagging, storage, trans-portation and marketing with a view to minimising food losses and increasing their incomes.
Given the farm sizes, small groups of cassava farmers may find it difficult to sustain a small-scale cassava (gari) processing centre given the quantities of cassava that are required. This is why toll processing centres (usually owned by entrepreneurs) which provide services to several farmers and processors have proved successful in the case of gari production.
in the case of starch production, small-scale pre- processing centres could be established among clusters of cassava farmers and/or farming communities. ap-propriate small-scale processing technology should be made available close to the farm gate for pre-processing fresh cassava into semi-finished starch which could then be transported to starch factories for processing into in-
54 oPTioNS for reduCiNG food loSSeS
(rolle, 200638; Stuart, 200939). This is a particular problem in Nigeria where appropriate vehicles may not be avail-able in time to transport farm-fresh products (see an-nexe). The poor road network also contributes to delays in getting farm-fresh products to the end-users.
in Nigeria, the provision of vehicles for transportation is firmly in the hands of the private sector, while the con-struction and maintenance of the road network is gener-ally accepted to be the responsibility of the government. The government is not involved to any significant extent in the provision of storage facilities. it appears that there are currently no economic incentives for private-sector operators to deploy appropriate vehicles for the trans-portation farm-fresh products in Nigeria. for this reason, green maize is no longer farm fresh when it arrives at the table of the final consumers in the urban centres. The poor condition of (rural) roads and the use of inappropri-ate vehicles lead to damage, spillage and deterioration of quality, and hence to food losses.
The establishment of small-scale pre-processing centres among clusters of cassava farmers and/or farming communities close to the farm gate would allow the transformation of cassava into semi-finished starch products which could then be transported to starch factories for processing into industrial or food-grade starch. This would reduce the delay in processing fresh tubers and correspondingly reduce deterioration and damage/losses in the course of transporting fresh tubers over long distances. it would also eliminate the cost of transporting water and fibre (wastes) to the starch factories.
in recent times there have been attempts in some states to improve market infrastructure. Within markets, sections are often created for specific agricultural prod-ucts. it should therefore be easy to address the market operators for each type of agricultural product in a targeted manner. This should be particularly easy in the case of gari.
dustrial or food-grade starch. The semi-finished product could be milled and dewatered cassava or wet starch. The transportation of fresh tubers to pre-processing centres that are only a short distance away would reduce the potential for loss and minimise the cost of transporting water and fibre (wastes) along with the cassava37. Appropriate packaging and transportation arrange-ments would have to be made for the transportation of semi-finished products to the starch factories.
Processors, public sector actors and donors should collaborate in promoting and strengthening farmers’ organisations and cooperative societies and linking them with processors to create efficient commodity supply chains that could reduce losses in the production, processing, transportation and marketing of maize grain and cassava tubers. These supply chains would create economic incentives for appropriate transportation and storage facilities that could reduce food losses and enhance farmers’ incomes.
Processors of cassava tubers should work with agri-cultural development Programmes in specific states to develop out-grower schemes, which could be used to provide farmers with inputs and technical guidance for efficient cassava production, while the processors undertake the harvesting, collection and transportation of fresh tubers at maturity. The out-growers should be paid at maturity and should receive the market value of the standing crops less the cost of inputs supplied to them. This would accord with the current practice of many farmers who prefer to sell their cassava tubers as standing crops and to leave the harvesting, collection and transportation to buyers.
6.3 Infrastructure
Poor transportation and storage facilities and lack of other infrastructure contribute to post-harvest losses. fresh cassava tubers and fresh maize cobs straight from the farm can spoil in hot climates due to the lack of in-frastructure for transportation, storage and marketing
37 The starch content of cassava is 20%. 38 rolle. 2006. improving postharvest management and marketing in the asia-Pacific region: issues and challenges. from: Postharvest management of fruit and vegetables in the asia-Pacific region, aPo, iSbN:92-833-7051-1 39 Stuart, T. 2009. Waste – uncovering the global food scandal. Penguin books: london, iSbN: 978-0-141-03634-2

55oPTioNS for reduCiNG food loSSeS
6.5 credit policy
it would be advisable for government and donor agen-cies to create an on-lending programme to promote ag-gregation and appropriate bagging and storage of maize grain by farmer cooperatives. This could help to ensure that relevant bagging and storage standards are followed with a view to reducing losses caused by breakages of bags, spillage and weevil and rodent attacks. inventory credit can also enable farmers to delay the sale of some of their outputs from the time of harvest, when prices are low, to the off-season, when they can achieve higher prices.
6.6 handling and processing policy
Standards should be established and appropriate in-formational materials developed to teach actors along the value chain about appropriate handling, packag-ing, transportation and processing techniques that will minimise losses in the value chains while ensuring cost effectiveness.
6.7 costs and benefits of intervention options
To evaluate the feasibility of technological and institu-tional innovations, a proper cost-benefit analysis should be carried out. low prices for commodities frequently restrict investment in improving post-harvest manage-ment. in many cases, accepting losses is cheaper than investing in protection. Technology transfer and train-ing can only be successful if there is genuine economic benefit for the farmers. Whether this benefit is generated through higher market prices or, for an intermediate pe-riod, through state support and subsidies depends on the situation. innovations often need initial support in order to become accepted and widespread, but they should be always based on sound economic analysis.
for industrial users of cassava tubers such as the starch factories, purchasing cassava as standing crop is not an attractive option. The preference is for suppliers to deliv-er cassava tubers at the factory gate where the supply can be weighed and the amount due confirmed. However, the cost of transportation is often significant and frequently makes the business transaction unprofitable for the farmers/suppliers. Greater distances from the source of supply to the starch factory mean higher transportation costs and a less profitable transaction for the farmer/sup-plier. it should be noted that these considerations were responsible for the lack of success and eventual demise of large-scale industrial processors of gari in Nigeria. The same considerations are affecting the industrial starch processors and making it difficult for them to get suffi-cient supplies of fresh cassava to feed their plants. on the other hand, small-scale gari processors and toll-operated gari processing centres have been largely successful because they are located close to the centre of cassava supply and transportation of tubers over long distances is minimised. The quantity of cassava tubers required to meet the installed capacity of the toll-operated gari pro-cessors can easily be supplied by farms in the vicinity.
6.4 human capacity development
a comprehensive education and training policy is neces-sary to improve the capacity of stakeholders in produc-tion, post-harvest handling and storage, processing and marketing. as in many countries women play an impor-tant role, especially in the first part of the value chain, gender aspects are therefore crucial for the success of training and extension. options are field days, demon-stration plots, on-farm trials, storage buildings, process-ing plants, eventually planting, harvesting, storing and processing in groups with mutual exchange, household and kitchen visits with cooking and baking cassava and maize dishes. appropriate advocacy measures and train-ing can be provided to operators in the wholesale and retail sections of the market to improve the handling (especially bagging) and storage of the product with a view to maintaining quality and reducing physical losses.
The various institutions in research and training (i.e. iiTa) have a lot of technical information that should be made available to those who need it.
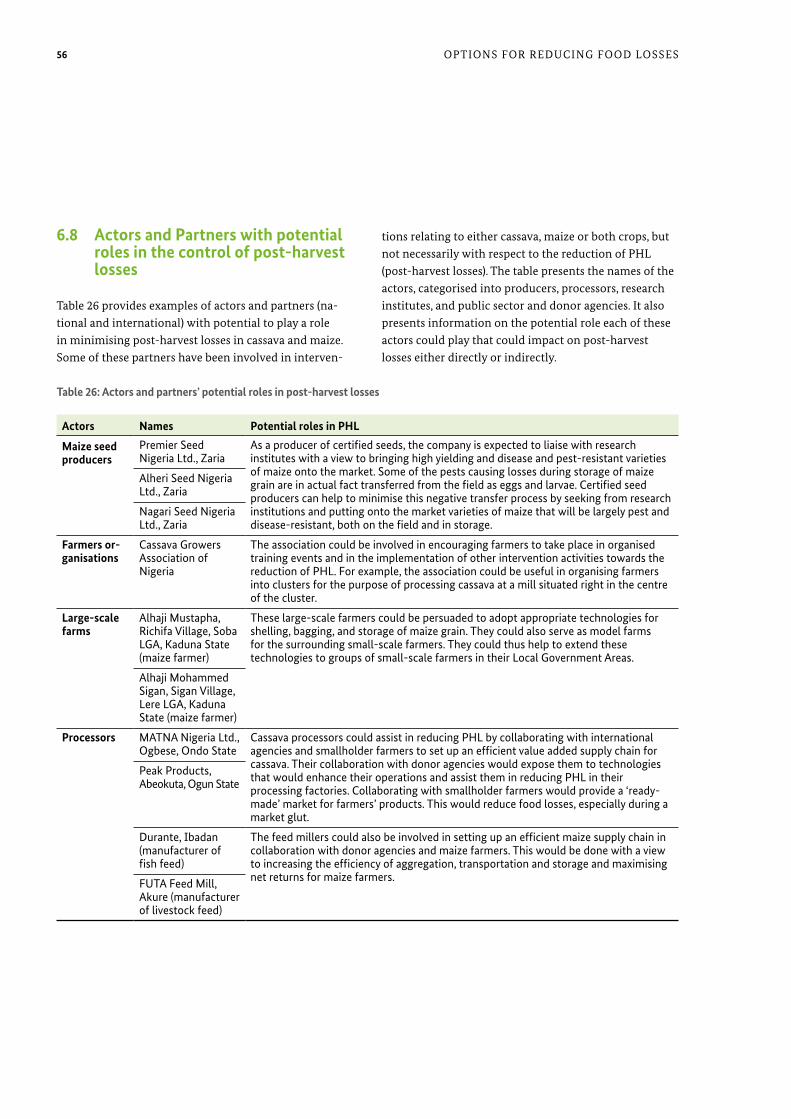
56 oPTioNS for reduCiNG food loSSeS
tions relating to either cassava, maize or both crops, but not necessarily with respect to the reduction of PHl (post-harvest losses). The table presents the names of the actors, categorised into producers, processors, research institutes, and public sector and donor agencies. it also presents information on the potential role each of these actors could play that could impact on post-harvest losses either directly or indirectly.
6.8 actors and Partners with potential roles in the control of post-harvest losses
Table 26 provides examples of actors and partners (na-tional and international) with potential to play a role in minimising post-harvest losses in cassava and maize. Some of these partners have been involved in interven-
actors names Potential roles in Phl
maize seed producers
Premier Seed Nigeria Ltd., Zaria
As a producer of certified seeds, the company is expected to liaise with research institutes with a view to bringing high yielding and disease and pest-resistant varieties of maize onto the market. Some of the pests causing losses during storage of maize grain are in actual fact transferred from the field as eggs and larvae. Certified seed producers can help to minimise this negative transfer process by seeking from research institutions and putting onto the market varieties of maize that will be largely pest and disease-resistant, both on the field and in storage.
Alheri Seed Nigeria Ltd., Zaria
Nagari Seed Nigeria Ltd., Zaria
Farmers or-ganisations
Cassava Growers Association of Nigeria
The association could be involved in encouraging farmers to take place in organised training events and in the implementation of other intervention activities towards the reduction of PHL. For example, the association could be useful in organising farmers into clusters for the purpose of processing cassava at a mill situated right in the centre of the cluster.
large-scale farms
Alhaji Mustapha, Richifa Village, Soba LGA, Kaduna State (maize farmer)
These large-scale farmers could be persuaded to adopt appropriate technologies for shelling, bagging, and storage of maize grain. They could also serve as model farms for the surrounding small-scale farmers. They could thus help to extend these technologies to groups of small-scale farmers in their Local Government Areas.
Alhaji Mohammed Sigan, Sigan Village, Lere LGA, Kaduna State (maize farmer)
Processors MATNA Nigeria Ltd., Ogbese, Ondo State
Cassava processors could assist in reducing PHL by collaborating with international agencies and smallholder farmers to set up an efficient value added supply chain for cassava. Their collaboration with donor agencies would expose them to technologies that would enhance their operations and assist them in reducing PHL in their processing factories. Collaborating with smallholder farmers would provide a ‘ready-made’ market for farmers’ products. This would reduce food losses, especially during a market glut.
Peak Products, Abeokuta, Ogun State
Durante, Ibadan (manufacturer of fish feed)
The feed millers could also be involved in setting up an efficient maize supply chain in collaboration with donor agencies and maize farmers. This would be done with a view to increasing the efficiency of aggregation, transportation and storage and maximising net returns for maize farmers.FUTA Feed Mill,
Akure (manufacturer of livestock feed)
table 26: actors and partners’ potential roles in post-harvest losses

57oPTioNS for reduCiNG food loSSeS
actors names Potential roles in Phl
research Institutes
International Institute of Tropical Agriculture (IITA)
The national and international research institutes in Nigeria are responsible for carrying out field experiments and developing disease and pest-resistant, high-yielding and early-maturing varieties of planting materials. These improved maize and cassava varieties have the potential to reduce food losses on the farm and in storage.National Cereals
Research Institute (NCRI)
National Root Crops Research Institute (NRCRI)
donors World Bank Donor agencies can promote interventions that aim to improve the efficiency of operations along the cassava and maize value chains, among other things with a view to reducing post-harvest losses. For example, USAID MARKETS collaborated with MATNA in developing an efficient cassava supply chain comprising the company and about 400 cassava farmers. IITA collaborated with Peak in developing and testing flash dryers for cassava processing.
USAID MARKETS
International Ferti-liser Development Centre (IFDC)
Public sector Federal Ministry of Agriculture
In partnership with donor agencies, the public sector agencies could implement inter-ventions to reduce post-harvest losses, such as providing training to farmers, marketers and processors on how to conduct their businesses in such a way that PHL can be minimised. They could also provide loans and grants to pay for small-scale processing equipment that would increase efficiency and reduce losses during the processing of maize and cassava.

58 aNNexe
Annexe
I. socIo EconomIc data
II. data From thE FIEld survEy
a. cassava
Equipment and tools mean cost per unit
Knife 265
Bowl 600
Lister 67,500
Screw press 31,250
Sieve 1,500
Pot 2,500
Bag 60
Grater 35,000
table 27: cost of gari processing equipment and tools
Problem Frequencies Percentage
Yes No Total Yes No
Tubers usually damaged during harvesting 132 13 145 91 9
Loss of revenue due to damage 71 60 131 54.2 45.8
Discard of tubers because they are too small to peel with knife
80 51 131 61.1 38.9
Loss of tubers during storage due to spoilage 9 28 37 24.3 75.7
Discard of tubers because they are too woody to peel with knife
94 35 129 72.9 27.1
Discard of tubers after harvesting due to other problems
45 96 141 31.9 68.1
Loss of tubers while transporting them to the processing centre
27 99 126 21.4 78.6
Loss of finished product while transporting from the processing centre
16 112 128 12.5 87.5
Loss of finished product during storage due to spoilage
56 56 112 50 50
table 29: Farmers experiencing cassava losses
Amount charged/paid for processing one tonne of tubers into gari (₦)
3,645
Quantity of gari per unit of tubers (kg/mt) 250
Distance from processing centre to the market (km) 8.1
Cost of transporting gari per unit (₦/pick-up) 1384
Quantity of gari produced per annum (bags) 250.84
Price of gari at the processing centre (₦/kg) 78.06
Price of gari in the market (₦/kg) 118.30
table 28: description of key variables in gari processing

59aNNexe
Problem Frequencies Percentage
Yes No Total Yes No
Discard of small tubers 16 1 17 94.1 5.9
Discard of woody tubers 19 1 20 95.0 5.0
Loss of tubers during transportation 13 1 14 92.9 7.1
Loss of finished product during transportation 10 1 11 90.9 9.1
Loss of finished product during storage 11 1 12 91.7 8.3
table 31: gari processors experiencing losses
Problem Frequencies Percentage
Yes No Total Yes No
Tubers usually damaged during transport 12 5 17 70.6 29.4
Tubers damaged during peeling 7 10 17 41.2 58.8
Loss of tubers during processing 10 5 15 66.7 33.3
Loss of revenue due to damage 11 4 15 73.3 26.7
Loss of tubers due to other problems 1 16 17 5.9 94.1
Loss due to spoilage 2 13 15 13.3 86.7
table 30: starch processors experiencing losses
table 28: description of key variables in gari processing
Problem Frequencies Percentage
Yes No Total Yes No
Loss of gari during transportation 6 9 15 40 60
Loss of revenue 6 9 15 40 60
Loss of gari during storage 10 5 15 66.7 33.3
table 32: gari marketers experiencing losses
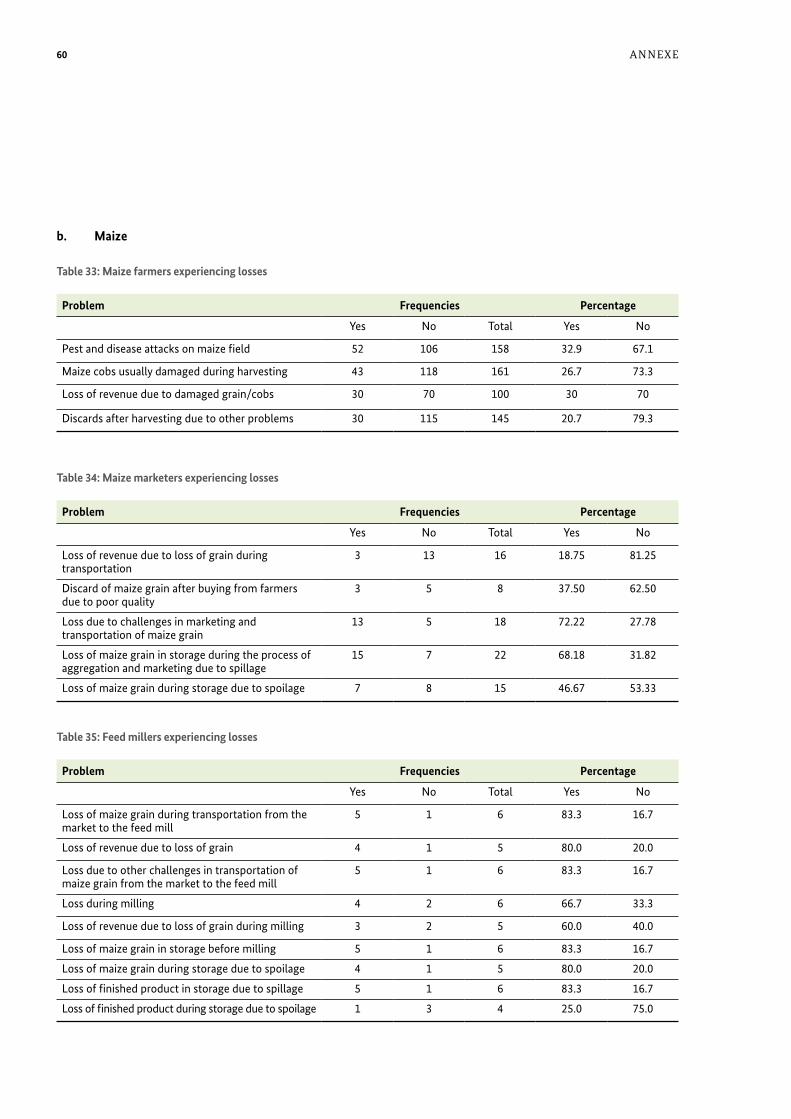
60 aNNexe
b. maize
Problem Frequencies Percentage
Yes No Total Yes No
Pest and disease attacks on maize field 52 106 158 32.9 67.1
Maize cobs usually damaged during harvesting 43 118 161 26.7 73.3
Loss of revenue due to damaged grain/cobs 30 70 100 30 70
Discards after harvesting due to other problems 30 115 145 20.7 79.3
table 33: maize farmers experiencing losses
Problem Frequencies Percentage
Yes No Total Yes No
Loss of revenue due to loss of grain during transportation
3 13 16 18.75 81.25
Discard of maize grain after buying from farmers due to poor quality
3 5 8 37.50 62.50
Loss due to challenges in marketing and transportation of maize grain
13 5 18 72.22 27.78
Loss of maize grain in storage during the process of aggregation and marketing due to spillage
15 7 22 68.18 31.82
Loss of maize grain during storage due to spoilage 7 8 15 46.67 53.33
table 34: maize marketers experiencing losses
Problem Frequencies Percentage
Yes No Total Yes No
Loss of maize grain during transportation from the market to the feed mill
5 1 6 83.3 16.7
Loss of revenue due to loss of grain 4 1 5 80.0 20.0
Loss due to other challenges in transportation of maize grain from the market to the feed mill
5 1 6 83.3 16.7
Loss during milling 4 2 6 66.7 33.3
Loss of revenue due to loss of grain during milling 3 2 5 60.0 40.0
Loss of maize grain in storage before milling 5 1 6 83.3 16.7
Loss of maize grain during storage due to spoilage 4 1 5 80.0 20.0
Loss of finished product in storage due to spillage 5 1 6 83.3 16.7
Loss of finished product during storage due to spoilage 1 3 4 25.0 75.0
table 35: Feed millers experiencing losses

61aNNexe
III. Photo documEntatIon
a. means of transport
Figure 31: Pick-up van being used for cassava transportation37
Figure 32: land rover being used for cassava transportation37
37 Kindly provided by dr. adegboyega eyitayo oguntade

62 aNNexe
Figure 33: Peeled fresh cassava tubers38
b. tubers during processing
Figure 34: screw cassava press39 Figure 35: hydraulic cassava press39
c. Processing machines
38 Kindly provided by dr. adegboyega eyitayo oguntade 39 ezedinma (2006) Structure and Profitability of Cassava enterprises in Nigeria, Paper Presented at the root & Tuber expansion Programme (rTeP) Training Workshop on rural enterprise management and Community-driven at armTi, ilorin

63QueSTioNNaireS
Questionnaires St
and:
Er
stel
lt vo
n:
Seite
1
IV Q
UES
TIO
NN
AIRE
S
1)Su
rvey
of l
osse
s in
Cass
ava
valu
e ch
ain
Farm
er’s
Que
stio
nnai
re
This
surv
ey is
bei
ng c
ondu
cted
with
a v
iew
to
elic
iting
info
rmat
ion
on lo
sses
tha
t m
ay b
e oc
curr
ing
betw
een
cass
ava
farm
ers’
field
and
the
ulti
mat
e co
nsum
er o
f ca
ssav
a pr
oduc
ts.
This
part
icul
ar
ques
tionn
aire
is d
esig
ned
to c
olle
ct in
form
atio
n on
loss
es in
the
quan
tity
and
qual
ity o
f fre
sh c
assa
va
tube
rs a
nd b
y-pr
oduc
ts o
n fa
rmer
s’ fie
lds a
nd h
omes
tead
, etc
Al
l inf
orm
atio
n w
ill r
emai
n an
onym
ous
and
conf
iden
tial a
nd w
ill o
nly
be u
sed
for
the
purp
oses
of
iden
tifyi
ng th
e so
urce
s an
d am
ount
s of
loss
es in
cas
sava
pro
duct
ion,
pro
cess
ing,
tran
spor
tatio
n an
d m
arke
ting.
A.
IDEN
TIFI
CATI
ON
Nam
e of
Enu
mer
ator
Date
of I
nter
view
Stat
e
Loca
l Gov
ernm
ent A
rea
Vi
llage
Nam
e of
resp
onde
nt
B.
DE
MO
GRAP
HIC
DATA
1.
Trib
e:__
____
____
____
2.
Ho
me
Tow
n (P
lace
of O
rigin
) :
To
wn_
____
____
____
_LGA
____
____
____
__St
ate_
____
____
____
_ 3.
Pl
ace
of B
irth:
Tow
n___
____
____
___L
GA__
____
____
____
Stat
e___
____
____
___
5.
Sex:
(i) M
ale
(ii) F
emal
e 6.
Re
ligio
n:
(i) C
hrist
iani
ty
(ii
) Isla
m
(iii)
Trad
ition
al
(iv)
Oth
ers
7.
Age:
___
____
____
___
8.
Mar
ital S
tatu
s:
(i) S
ingl
e (ii
) Mar
ried
(iii)
Wid
ow/e
r 9.
Ho
use
hold
size
: ___
____
____
___
10.
Num
ber o
f Wiv
es:--
------
------
------
--- (E
xact
, num
ber,
plea
se)
11.
Num
ber o
f Chi
ldre
n:
Sex
Tota
l N
umbe
r of
Child
ren
Child
ren
Still
Li
ving
with
Yo
u (A
ll)
Child
ren
Still
Liv
ing
with
You
Num
ber
Activ
e in
ag
ricul
ture
0
– 5
Yrs.
6
– 15
Yrs
. 16
+ Yr
s
Mal
e
Fe
mal
e
To
tal
12.
Depe
ndan
t Rel
ativ
es:
Sex
Rela
tive
Livi
ng w
ith Y
ou
N
umbe
r Act
ive
in
agric
ultu
re
Stan
d:
Erst
ellt
von:
Se
ite 2
0 –
5 Yr
s.
6 –
15 Y
rs.
16+
Yrs
Mal
e
Fe
mal
e
To
tal
14.
Educ
atio
n (H
ighe
st le
vel o
nly)
Farm
er:
(i)
Prim
ary
(ii)
Seco
ndar
y
(iii)
Te
chni
cal C
olle
ge
(iv
) Te
rtia
ry (v
) Vo
catio
nal
(vi)
Ad
ult E
duca
tion
(v
ii) N
one
Spou
se:
(i)
Prim
ary
(ii)
Seco
ndar
y
(iii)
Te
chni
cal C
olle
ge
(iv
) Te
rtia
ry (v
) Vo
catio
nal
(vi)
Ad
ult E
duca
tion
(v
ii) N
one
C.
PRE-
PRO
DUCT
ION
1.
To
tal s
ize o
f all
farm
s ow
ned:
……
……
Heap
s/…
……
.Ha
2.
To
tal s
ize o
f all
farm
s pla
nted
with
cas
sava
last
pro
duct
ion
seas
on :…
……
…He
aps/
……
….H
a
3
Dist
ance
of t
he fa
rthe
st fi
eld
from
the
Hous
e ho
ld re
siden
ce---
------
------
-- 4
Plea
se, l
ist th
e cr
ops y
ou p
lant
ed la
st p
rodu
ctio
n se
ason
in th
e or
der o
f im
port
ance
……
……
……
……
……
……
……
……
……
……
……
……
……
……
……
……
……
……
……
……
……
……
……
……
…
…
……
……
……
……
……
……
……
……
……
……
……
……
……
……
……
……
……
……
……
……
……
……
……
….
5 W
hat p
erce
ntag
e of
the
cass
ava
plan
ted
is no
rmal
ly c
onsu
med
by
your
fam
ily?
……
……
…..%
6.
Ar
e yo
u pa
rtic
ipat
ing
in a
ny F
G/St
ate/
NGO
pro
ject
that
is p
rom
otin
g ca
ssav
a pr
oduc
tion?
Ye
s……
/No…
…
7.
If ye
s, pl
ease
stat
e th
e na
me
of th
e pr
ojec
t……
……
……
……
……
……
……
……
……
……
……
……
……
…..
8.
Are
gove
rnm
ent e
xten
sion
agen
ts c
omin
g to
pro
vide
info
rmat
ion
to y
ou o
n ho
w to
gro
w a
nd
proc
ess c
assa
va?
Yes
……
/No…
…
9.
If ye
s, pl
ease
stat
e ho
w o
ften
:
Twic
e in
a m
onth
……
Onc
e in
a m
onth
……
O
nce
in tw
o m
onth
s……
O
nce
in th
ree
mon
ths…
…
10.
Are
you
a m
embe
r of a
coop
erat
ive
soci
ety?
Yes
……
/No…
……
11
. If
yes,
plea
se st
ate
the
type
. (i)
Prod
ucer
……
……
(ii)T
hrift
&Cr
edit…
……
(ii
i) M
arke
ting…
……
(iv
) Oth
ers,
plea
se st
ate
……
……
……
……
. D.
PR
ODU
CTIO
N
Land
tenu
re
1.
Plea
se c
ompl
ete
the
follo
win
g ta
ble
Type
of F
ield
Nu
mbe
r Si
ze
Inhe
rited
Pu
rcha
sed
Rent
ed
Pled
ged
Oth
ers
2.
Did
you
use
irrig
atio
n fo
r cas
sava
pro
duct
last
pro
duct
ion
seas
ons?
Yes
……
….N
o……
3.
If
yes,
wha
t is t
he to
tal s
ize o
f all
cass
ava
farm
s irr
igat
ed la
st p
rodu
ctio
n
seas
on: …
……
…He
aps/
……
….H
a 4.
Pl
ease
, pro
vide
an
estim
ate
of th
e irr
igat
ion
cost
. N…
……
……
……
……
…

64 QueSTioNNaireS
Stan
d:
Erst
ellt
von:
Se
ite 3
Cr
oppi
ng S
yste
m
5.
Did
you
plan
t cas
sava
sole
or m
ixed
with
oth
er c
rops
? S
ole…
……
. Mix
ed…
……
…
6.
If m
ixed
, sta
te th
e cr
ops y
ou m
ixed
with
cass
ava…
……
……
……
……
……
……
……
……
……
..
……
……
……
……
……
……
……
……
……
……
……
……
……
……
……
……
……
……
……
……
……
……
……
……
7.
In
whi
ch w
eek
and
mon
th o
f the
yea
r do
you
norm
ally
pre
pare
the
land
for p
lant
ing
cass
ava?
Wee
k 1
2
3 4
Mon
th …
……
……
……
……
……
8.
Pl
ease
, pro
vide
the
follo
win
g in
form
atio
n on
cas
sava
stem
cut
ting
used
for p
lant
ing
your
fie
ld(s
) las
t pro
duct
ion
seas
on.
So
urce
s Va
riety
Q
uant
ity
Valu
e (N
) AD
P
MAN
R
Mar
ket
Pa
st h
arve
st
O
ther
s
9.
Plea
se, p
rovi
de th
e fo
llow
ing
info
rmat
ion
on th
e fe
rtili
zer u
sual
ly a
pplie
d to
the
cass
ava
field
s pl
ante
d (d
urin
g th
e la
st p
rodu
ctio
n se
ason
).
Sour
ces
Fer
tilize
r typ
e (N
PK/ U
rea/
sp
ecify
oth
ers )
Q
uant
ity
(50k
g ba
gs)
Price
/50k
g ba
g
ADP
M
ANR
Mar
ket
De
aler
/Age
nt
O
ther
s
10.
Whe
re d
o yo
u st
ore
fert
ilize
r?...
......
......
......
......
......
......
......
......
......
......
.. 11
Pl
ease
, pro
vide
the
follo
win
g in
form
atio
n on
inse
ctic
ide/
fung
icide
/her
bici
de a
pplie
d to
the
cass
ava
field
s pla
nted
last
yea
r. I)
Sour
ces
Inse
ctic
ide
Qua
ntity
(ple
as,
spec
ify u
nit)
Pr
ice/
unit
last
yea
r
ADP
M
ANR
M
arke
t
Deal
er/A
gent
Oth
ers
II)
Sour
ces
Fung
icid
e
Qua
ntity
(ple
as,
spec
ify u
nit)
Pr
ice/
unit
last
yea
r
ADP
M
ANR
M
arke
t
Deal
er/A
gent
Oth
ers
Stan
d:
Erst
ellt
von:
Se
ite 4
III
) So
urce
s He
rbici
de
Qua
ntity
(ple
as,
spec
ify u
nit)
Pr
ice/
unit
last
yea
r
ADP
M
ANR
M
arke
t
Deal
er/A
gent
Oth
ers
12
. W
here
do
you
stor
e ch
emic
als?
......
......
......
......
......
......
......
......
......
......
......
......
......
......
......
.. 13
. Di
d yo
u us
e cr
edit
for t
he c
assa
va y
ou p
lant
ed d
urin
g th
e la
st p
rodu
ctio
n se
ason
? Ye
s……
….N
o……
13
. If
your
ans
wer
is y
es, p
leas
e in
dica
te th
e so
urce
s
……
……
……
……
……
……
……
……
……
……
……
……
……
……
……
……
……
……
……
……
……
……
……
……
……
……
……
…
14.
If yo
ur a
nsw
er is
no,
Why
? N
ot n
eede
d …
…..
Not
ava
ilabl
e …
…
Too
expe
nsiv
e……
…
15.
Did
you
use
hire
d la
bour
for t
he ca
ssav
a fie
lds p
lant
ed d
urin
g th
e la
st p
rodu
ctio
n se
ason
? Ye
s……
….N
o……
16
. If
your
ans
wer
is n
o, W
hy?
Not
nee
ded
……
.. N
ot a
vaila
ble
……
To
o ex
pens
ive…
……
17
. If
your
ans
wer
is y
es, h
ow m
uch
did
you
pay
per d
ay fo
r hire
d la
bour
? N…
……
……
…
18.
Wha
t is t
he p
rese
nt c
ost p
er d
ay fo
r hire
d la
bour
in y
our c
omm
unity
? N…
……
……
…
19.
Plea
se in
dica
te w
hich
of t
he fo
llow
ing
type
s of f
amily
labo
ur a
re b
eing
use
d.
Type
s Ye
s/N
o He
ad o
f hou
seho
ld o
nly
W
ife/w
ives
Child
ren
De
pend
ant r
elat
ives
All T
ypes
20.
Plea
se, p
rovi
de in
form
atio
n on
labo
ur u
tilize
d fo
r the
culti
vatio
n of
the
cass
ava
field
s pla
nted
la
st p
rodu
ctio
n se
ason
Fa
rm O
pera
tion
M
onth
Don
e La
bour
type
N
o. o
f man
days
Co
st/m
anda
y (N
) Bu
sh c
lear
ing
Plou
ghin
g
He
ap m
akin
g
Pl
antin
g
W
eedi
ng
Harv
estin
g
O
ther
s, pl
ease
sp
ecify
(i)
Adul
t mal
e (ii
) Ad
ult f
emal
e (ii
i) M
ale
child
ren
(iv)
Fem
ale
child
ren
21.
Did
you
use
mec
hani
zed
equi
pmen
t (tr
acto
r) to
pre
pare
the
land
use
d fo
r cul
tivat
ing
the
cass
ava
plan
ted
durin
g th
e la
st p
rodu
ctio
n se
ason
? Ye
s……
….N
o……
22
. If
yes,
how
muc
h di
d yo
u pa
y fo
r the
serv
ices
? N
……
……
……
……
…..
23.
Did
any
pest
s (in
sect
s, bi
rds,
rode
nts,
etc)
and
dise
ases
att
ack
the
cass
ava
field
s you
pla
nted
la
st p
rodu
ctio
n se
ason
? Ye
s……
….N
o……
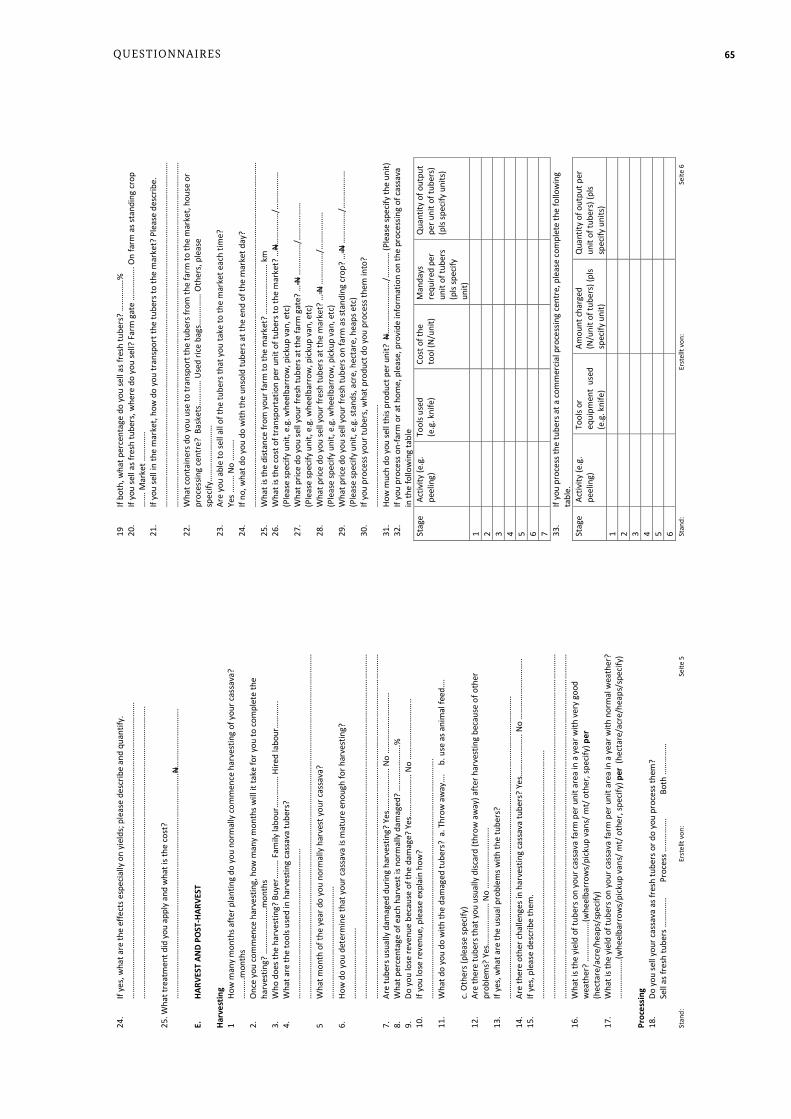
65QueSTioNNaireS
Stan
d:
Erst
ellt
von:
Se
ite 5
24
. If
yes,
wha
t are
the
effe
cts e
spec
ially
on
yiel
ds; p
leas
e de
scrib
e an
d qu
antif
y.
…
……
……
……
……
……
……
……
……
……
……
……
……
……
……
……
……
……
……
……
……
……
……
……
.
……
……
……
……
……
……
……
……
……
……
……
……
……
……
……
……
……
……
……
……
……
……
……
.. 25
. Wha
t tre
atm
ent d
id y
ou a
pply
and
wha
t is t
he c
ost?
……
……
……
……
……
……
……
……
……
……
……
……
……
……
……
……
……
……
N……
……
……
……
….
E.
HARV
EST
AND
POST
-HAR
VEST
Ha
rves
ting
1 Ho
w m
any
mon
ths a
fter
pla
ntin
g do
you
nor
mal
ly c
omm
ence
har
vest
ing
of y
our c
assa
va?
……
….m
onth
s 2.
O
nce
you
com
men
ce h
arve
stin
g, h
ow m
any
mon
ths w
ill it
take
for y
ou to
com
plet
e th
e ha
rves
ting?
……
……
……
….m
onth
s 3.
W
ho d
oes t
he h
arve
stin
g? B
uyer
……
… F
amily
labo
ur…
……
……
Hire
d la
bour
……
……
. 4.
W
hat a
re th
e to
ols u
sed
in h
arve
stin
g ca
ssav
a tu
bers
? …
……
……
……
……
……
……
……
……
……
……
……
…
…
……
……
……
……
……
……
……
……
……
……
……
……
……
……
……
……
……
……
……
……
……
……
……
……
……
……
……
5
Wha
t mon
th o
f the
yea
r do
you
norm
ally
har
vest
you
r cas
sava
? …
……
……
……
……
……
……
……
……
…
6.
How
do
you
dete
rmin
e th
at y
our c
assa
va is
mat
ure
enou
gh fo
r har
vest
ing?
…
……
……
……
……
……
. …
……
……
……
……
……
……
……
……
……
……
……
……
……
……
……
……
……
……
……
……
……
……
……
……
……
……
……
…
……
……
……
……
……
……
……
……
……
……
……
……
……
……
……
……
……
……
……
……
……
……
……
……
……
……
……
7.
Ar
e tu
bers
usu
ally
dam
aged
dur
ing
harv
estin
g? Y
es…
……
……
…..
No …
……
……
……
……
.. 8.
W
hat p
erce
ntag
e of
eac
h ha
rves
t is n
orm
ally
dam
aged
? …
……
……
……
.%
9.
Do y
ou lo
se re
venu
e be
caus
e of
the
dam
age?
Yes
……
……
……
.. N
o …
……
……
……
……
.. 10
. If
you
lose
reve
nue,
ple
ase
expl
ain
how
? …
……
……
……
……
……
……
……
……
……
……
……
……
……
……
……
……
……
……
….
11.
Wha
t do
you
do w
ith th
e da
mag
ed tu
bers
? a
. Thr
ow a
way
….
b. u
se a
s ani
mal
feed
….
c.
Oth
ers (
plea
se sp
ecify
)
12.
Are
ther
e tu
bers
that
you
usu
ally
disc
ard
(thr
ow a
way
) aft
er h
arve
stin
g be
caus
e of
oth
er
prob
lem
s? Y
es…
……
……
…..
No
……
……
……
……
…..
13.
If ye
s, w
hat a
re th
e us
ual p
robl
ems w
ith th
e tu
bers
? …
……
……
……
……
……
……
……
……
……
……
……
……
……
……
……
……
……
……
……
……
……
……
……
….
14.
Are
ther
e ot
her c
halle
nges
in h
arve
stin
g ca
ssav
a tu
bers
? Ye
s……
……
……
.. N
o …
……
……
……
……
.. 15
. If
yes,
plea
se d
escr
ibe
them
. …
……
……
……
……
……
……
……
……
……
……
……
……
……
……
……
……
……
……
……
..
……
……
……
……
……
……
……
……
……
……
……
……
……
……
……
……
……
……
……
……
……
……
……
……
……
……
……
…
……
……
……
……
……
……
……
……
……
……
……
……
……
……
……
……
……
……
……
……
……
……
……
……
……
……
……
…
16.
Wha
t is t
he y
ield
of t
uber
s on
your
cas
sava
farm
per
uni
t are
a in
a y
ear w
ith v
ery
good
w
eath
er?
……
……
……
.(whe
elba
rrow
s/pi
ckup
van
s/ m
t/ o
ther
, spe
cify
) per
(h
ecta
re/a
cre/
heap
s/sp
ecify
) 17
. W
hat i
s the
yie
ld o
f tub
ers o
n yo
ur c
assa
va fa
rm p
er u
nit a
rea
in a
yea
r with
nor
mal
wea
ther
? …
……
……
….(w
heel
barr
ows/
pick
up v
ans/
mt/
oth
er, s
peci
fy) p
er (
hect
are/
acre
/hea
ps/s
peci
fy)
Proc
essi
ng
18.
Do y
ou se
ll yo
ur c
assa
va a
s fre
sh tu
bers
or d
o yo
u pr
oces
s the
m?
Se
ll as
fres
h tu
bers
……
……
..
Proc
ess …
……
……
. Bo
th …
……
……
Stan
d:
Erst
ellt
von:
Se
ite 6
19
If
both
, wha
t per
cent
age
do y
ou se
ll as
fres
h tu
bers
? …
……
……
%
20.
If yo
u se
ll as
fres
h tu
bers
, whe
re d
o yo
u se
ll? F
arm
gat
e …
……
……
. On
farm
as s
tand
ing
crop
…
…. M
arke
t ……
……
.. 21
. If
you
sell
in th
e m
arke
t, ho
w d
o yo
u tr
ansp
ort t
he tu
bers
to th
e m
arke
t? P
leas
e de
scrib
e.
……
……
……
……
……
……
……
……
……
……
……
……
……
……
……
……
……
……
……
……
……
……
……
……
……
……
……
……
……
……
……
……
……
……
……
……
……
……
……
……
……
……
……
……
……
……
……
……
……
……
……
……
……
……
……
22
. W
hat c
onta
iner
s do
you
use
to tr
ansp
ort t
he tu
bers
from
the
farm
to th
e m
arke
t, ho
use
or
proc
essin
g ce
ntre
? B
aske
ts…
……
… U
sed
rice
bags
……
……
… O
ther
s, pl
ease
sp
ecify
……
……
……
……
…
23.
Are
you
able
to se
ll al
l of t
he tu
bers
that
you
take
to th
e m
arke
t eac
h tim
e?
Yes …
..… N
o …
……
. 24
. If
no, w
hat d
o yo
u do
with
the
unso
ld tu
bers
at t
he e
nd o
f the
mar
ket d
ay?
……
……
……
……
……
……
……
……
……
……
……
……
……
……
……
……
……
……
……
……
……
……
……
……
……
……
……
…
25.
Wha
t is t
he d
istan
ce fr
om y
our f
arm
to th
e m
arke
t? …
……
……
……
… k
m
26.
Wha
t is t
he c
ost o
f tra
nspo
rtat
ion
per u
nit o
f tub
ers t
o th
e m
arke
t? …
N……
……
…/…
……
……
…
(Ple
ase
spec
ify u
nit,
e.g.
whe
elba
rrow
, pic
kup
van,
etc
) 27
. W
hat p
rice
do y
ou se
ll yo
ur fr
esh
tube
rs a
t the
farm
gat
e? …
N …
……
……
/……
……
……
(P
leas
e sp
ecify
uni
t, e.
g. w
heel
barr
ow, p
icku
p va
n, e
tc)
28.
Wha
t pric
e do
you
sell
your
fres
h tu
bers
at t
he m
arke
t? …
N …
……
……
/……
……
……
(P
leas
e sp
ecify
uni
t, e.
g. w
heel
barr
ow, p
ickup
van
, etc
) 29
. W
hat p
rice
do y
ou se
ll yo
ur fr
esh
tube
rs o
n fa
rm a
s sta
ndin
g cr
op?
… N
……
……
…/…
……
……
…
(Ple
ase
spec
ify u
nit,
e.g.
stan
ds, a
cre,
hec
tare
, hea
ps e
tc)
30.
If yo
u pr
oces
s you
r tub
ers,
wha
t pro
duct
do
you
proc
ess t
hem
into
? …
……
……
……
……
……
……
……
….
31.
How
muc
h do
you
sell
this
prod
uct p
er u
nit?
N…
……
……
……
…./…
……
… (P
leas
e sp
ecify
the
unit)
32
. If
you
proc
ess o
n-fa
rm o
r at h
ome,
ple
ase,
pro
vide
info
rmat
ion
on th
e pr
oces
sing
of c
assa
va
in th
e fo
llow
ing
tabl
e St
age
Activ
ity (e
.g.
peel
ing)
To
ols u
sed
(e
.g. k
nife
) Co
st o
f the
to
ol (N
/uni
t)
Man
days
re
quire
d pe
r un
it of
tube
rs
(pls
spec
ify
unit)
Qua
ntity
of o
utpu
t pe
r uni
t of t
uber
s)
(pls
spec
ify u
nits
)
1
2
3
4
5
6
7
33.
If yo
u pr
oces
s the
tube
rs a
t a c
omm
ercia
l pro
cess
ing
cent
re, p
leas
e co
mpl
ete
the
follo
win
g ta
ble.
St
age
Activ
ity (e
.g.
peel
ing)
To
ols o
r eq
uipm
ent
used
(e
.g. k
nife
)
Amou
nt ch
arge
d (N
/uni
t of t
uber
s) (p
ls sp
ecify
uni
t)
Qua
ntity
of o
utpu
t per
un
it of
tube
rs) (
pls
spec
ify u
nits
) 1
2
3
4
5
6

66 QueSTioNNaireS
Stan
d:
Erst
ellt
von:
Se
ite 7
7
34.
Do y
ou h
ave
to d
iscar
d so
me
tube
rs b
ecau
se th
ey a
re to
o sm
all t
o pe
el w
ith k
nife
? Y
es…
… N
o …
…
35.
If ye
s, w
hat p
erce
ntag
e of
the
harv
este
d tu
ber b
elon
gs to
this
cate
gory
? …
…..%
36
. Do
you
hav
e to
disc
ard
som
e tu
bers
bec
ause
they
are
too
woo
dy to
pee
l with
kni
fe?
Yes
……
No…
. 37
. If
yes,
wha
t per
cent
age
of th
e ha
rves
ted
tube
r bel
ongs
to th
is ca
tego
ry?
……
..%
38.
Wha
t do
you
do w
ith th
e ca
ssav
a pe
els a
nd th
e di
scar
ded
cass
ava?
…
..……
……
……
……
……
……
……
……
……
……
……
……
……
……
……
……
……
……
……
……
……
……
……
……
……
……
…
39.
Do y
ou u
sual
ly lo
se fr
esh
tube
rs w
hile
tran
spor
ting
them
to th
e pr
oces
sing
cent
re?
Ye
s……
……
No
……
……
40.
If ye
s, pl
ease
indi
cate
the
quan
tity
that
is u
sual
ly lo
st a
s a p
erce
ntag
e of
the
quan
tity
tran
spor
ted.
……
……
……
..%
41.
Do y
ou u
sual
ly lo
se so
me
finish
ed p
rodu
cts w
hile
tran
spor
ting
it fr
om th
e pr
oces
sing
cent
re?
Yes…
... N
o …
….
42.
If ye
s, pl
ease
indi
cate
the
quan
tity
as th
at is
usu
ally
lost
as a
per
cent
age
of th
e qu
antit
y tr
ansp
orte
d. …
……
……
…..%
St
orag
e 43
. Do
you
stor
e fr
esh
cass
ava
afte
r har
vest
ing?
Yes
……
…N
o …
…
44.
If ye
s, ho
w?
……
……
……
……
……
……
……
……
……
……
……
……
……
……
……
……
……
……
……
…..
45.
If ye
s, do
you
lose
tube
rs d
urin
g st
orag
e du
e to
spoi
lage
? Ye
s……
…N
o …
……
46
. If
yes,
afte
r how
man
y da
ys o
f sto
rage
do
norm
ally
not
ice sp
oila
ge?
……
……
……
……
……
….
47.
If ye
s, w
hat p
erce
ntag
e of
the
tube
rs?
……
……
…%
48
. Do
you
stor
e th
e fin
ished
pro
duct
aft
er p
roce
ssin
g? Y
es…
……
No …
……
49
. If
yes,
how
? …
……
……
……
……
……
……
……
……
……
……
……
……
……
……
……
……
……
……
……
.. 50
. If
yes,
do y
ou lo
se fi
nish
ed p
rodu
ct d
urin
g st
orag
e du
e to
spoi
lage
? Ye
s……
No
……
51
. If
yes,
afte
r how
man
y da
ys/w
eeks
/mon
ths o
f sto
rage
do
norm
ally
not
ice sp
oila
ge?
……
……
……
……
……
…. d
ays/
wee
ks/m
onth
s 52
. If
yes,
wha
t per
cent
age
of th
e pr
oduc
t? …
……
……
%
53.
Wha
t per
cent
age
of th
e fin
ished
pro
duct
is re
serv
ed fo
r hom
e co
nsum
ptio
n? …
……
……
%
F.
IMPA
CT O
N T
HE E
NVI
RON
MEN
T 54
. Th
e fo
llow
ing
tabl
e is
desig
ned
to c
olle
ct in
form
atio
n on
the
impa
ct o
f cas
sava
mar
ketin
g on
th
e en
viro
nmen
t. Pl
ease
com
plet
e th
e ta
ble
as m
uch
as it
rela
tes t
o yo
ur o
pera
tions
.
Desc
riptio
n of
Dat
a
Crop
Ent
erpr
ise
Com
bina
tion
Cass
ava
Mon
ocro
p Ca
ssav
a M
ixed
Cass
ava
Crop
2
Crop
3
Crop
4
Fiel
d Si
ze
Area
U
nit
Date
of s
owin
g / p
lant
ing
(Mon
th/Y
ear)
Plan
t spa
cing
Crop
s Pla
nted
Bef
ore
Fi
eld
Clea
red
by b
urni
ng (Y
es/N
o)
Crop
s Mix
ed W
ith
N
ot A
pplic
able
Pe
rcen
tage
of e
ach
Crop
in th
e M
ixed
Stan
d:
Erst
ellt
von:
Se
ite 8
Desc
riptio
n of
Dat
a
Crop
Ent
erpr
ise
Com
bina
tion
Cass
ava
Mon
ocro
p Ca
ssav
a M
ixed
Cass
ava
Crop
2
Crop
3
Crop
4
Date
of h
arve
st (m
onth
/yea
r)
Am
ount
of m
ain
prod
uct h
arve
sted
and
take
n of
f the
fiel
d (fr
esh
wei
ght)
.whe
elba
rrow
s/pi
ckup
van
s/ m
t/
othe
r, sp
ecify
) per
(he
ctar
e/ac
re/s
peci
fy)
Am
ount
of b
y- p
rodu
ct (e
.g. s
tem
cut
ting)
ha
rves
ted
and
take
n of
f the
fiel
d (fr
esh
wei
ght)
.whe
elba
rrow
s/pi
ckup
van
s/ m
t/
othe
r, sp
ecify
) per
(he
ctar
e/ac
re/s
peci
fy)
Min
eral
Fer
tilize
r Ap
plie
d (Q
uant
ity
in k
g)
NPK
Ure
a
Oth
er, s
peci
fy
Org
anic
Man
ure
Appl
ied
Qua
ntity
(Bag
s)
Co
st (N
aira
)
Type
(Pou
ltry/
Catt
le)
Pest
icid
e Ap
plie
d
Nam
e
Q
uant
ity
Uni
t
N
ame
Qua
ntity
U
nit
Nam
e
Q
uant
ity
Uni
t
Mac
hine
ry U
sed
Nam
e
Ca
paci
ty
Type
(Pet
rol/D
iese
l)
Ho
urs o
f Wor
k on
Far
m
Type
of w
ork
Nam
e
Ca
paci
ty
Type
(Pet
rol/D
iese
l)
Ho
urs o
f Wor
k on
Far
m
Type
of w
ork
Nam
e
Ca
paci
ty
Type
(Pet
rol/D
iese
l)
Ho
urs o
f Wor
k on
Far
m
Type
of w
ork
Tran
spor
tatio
n (F
arm
to
Hom
este
ad
Dist
ance
(km
)
Ty
pe o
f Veh
icle
(e.g
. Pi
ck-u
p va
n)

67QueSTioNNaireS
Stan
d:
Erst
ellt
von:
Se
ite 9
Desc
riptio
n of
Dat
a
Crop
Ent
erpr
ise
Com
bina
tion
Cass
ava
Mon
ocro
p Ca
ssav
a M
ixed
Cass
ava
Crop
2
Crop
3
Crop
4
Num
ber o
f trip
s car
ryin
g in
puts
to fa
rm p
er y
ear
Num
ber o
f trip
s car
ryin
g ou
tput
s fro
m fa
rm p
er
year
Tran
spor
tatio
n (H
omes
tead
to
Rura
l Mar
ket)
Dist
ance
(km
)
Ty
pe o
f Veh
icle
(e.g
. Pi
ck-u
p va
n)
Num
ber o
f trip
s car
ryin
g in
puts
to fa
rm p
er y
ear
Num
ber o
f trip
s car
ryin
g ou
tput
s fro
m fa
rm p
er
year
Star
ch P
roce
ssor
s’ Q
uest
ionn
aire
Th
is su
rvey
is b
eing
con
duct
ed w
ith a
vie
w t
o el
iciti
ng in
form
atio
n on
loss
es t
hat
may
be
occu
rrin
g be
twee
n ca
ssav
a fa
rmer
s’ fie
ld a
nd t
he u
ltim
ate
cons
umer
of
cass
ava
prod
ucts
. Th
is pa
rtic
ular
qu
estio
nnai
re is
des
igne
d to
col
lect
info
rmat
ion
on lo
sses
in th
e qu
antit
y an
d qu
ality
of f
resh
cas
sava
tu
bers
and
by-
prod
ucts
dur
ing
the
proc
ess o
f tra
nsfo
rmat
ion
into
star
ch
All i
nfor
mat
ion
will
rem
ain
anon
ymou
s an
d co
nfid
entia
l and
will
onl
y be
use
d fo
r th
e pu
rpos
es o
f id
entif
ying
the
sour
ces
and
amou
nts
of lo
sses
in c
assa
va p
rodu
ctio
n, p
roce
ssin
g, tr
ansp
orta
tion
and
mar
ketin
g.
A.
IDEN
TIFI
CATI
ON
Na
me
of E
num
erat
or
Da
te o
f Int
ervi
ew
St
ate
Lo
cal G
over
nmen
t Are
a
Villa
ge
Na
me
of p
roce
ssor
B.
PRO
CESS
ING
Cass
ava
star
ch p
roce
ssin
g
1.Ho
w d
o yo
u ge
t you
r fre
sh c
assa
va tu
bers
?
i. Fr
om o
wn
farm
ii. T
hrou
gh S
uppl
iers
iii F
rom
farm
gat
es
2.W
hat q
uant
ity o
f cas
sava
tube
rs d
o yo
u bu
y an
nual
ly?
……
……
……
.(whe
elba
rrow
s/pi
ckup
va
ns/ m
t/ o
ther
, spe
cify)
3.
Wha
t is t
he a
vera
ge p
rice
of c
assa
va tu
bers
from
farm
gat
e? N
....
......
......
......
...pe
r (w
heel
barr
ows/
pick
up v
ans/
mt/
oth
er, s
pecif
y)
Stan
d:
Erst
ellt
von:
Se
ite 1
0 4.
Wha
t is t
he a
vera
ge p
rice
of ca
ssav
a tu
bers
from
supp
liers
? N
....
......
......
......
...pe
r (w
heel
barr
ows/
pick
up v
ans/
mt/
oth
er, s
peci
fy)
5.Pl
ease
com
plet
e th
e ta
ble
belo
w:
Data
Des
crip
tion
Da
ta
Fres
h ca
ssav
a tu
bers
(Qua
ntity
per
tonn
e of
star
ch) (
tone
s)
Q
uant
ity o
f wat
er p
er to
nne
of st
arch
(litr
es)
O
ther
ingr
edie
nts (
cost
per
ton
of st
arch
) N
To
tal o
utpu
t of s
tarc
h pe
r ann
um (t
onne
)
Selli
ng p
rice
per t
onne
(N)
M
onth
ly w
ages
(N)
Re
nt o
n bu
ildin
gs (N
)
6.
Are
tube
rs u
sual
ly d
amag
ed d
urin
g tr
ansp
orta
tion
and
proc
essin
g? Y
es..…
No
…..
7.
Are
tube
rs u
sual
ly d
amag
ed d
urin
g pe
elin
g? Y
es..…
No
…..
8.
Do y
ou u
sual
ly h
ave
any
loss
dur
ing
proc
essin
g? Y
es..…
No
…..
9.
Wha
t per
cent
age
of to
tal c
assa
va is
nor
mal
ly d
amag
ed?
……
……
……
….%
10
.Do
you
lose
reve
nue
beca
use
of th
e da
mag
e? Y
es…
…
No
……
11
.If
you
lose
reve
nue,
ple
ase
expl
ain
how
? .…
……
……
……
……
……
……
……
……
……
……
……
……
……
……
…
……
……
……
……
……
……
……
……
……
……
……
……
……
……
……
……
……
……
……
……
……
……
……
……
……
……
……
12
.W
hat d
o yo
u do
with
the
dam
aged
tube
rs?
a. T
hrow
aw
ay…
. b.
use
as a
nim
al fe
ed…
.
c. S
ell
d.
Oth
ers (
plea
se sp
ecify
) 13
.Ho
w m
uch
do y
ou re
alize
from
the
dam
aged
tube
rs/lo
st p
rodu
cts?
N…
……
……
……
……
……
14
.Ar
e th
ere
tube
rs th
at y
ou u
sual
ly d
iscar
d (t
hrow
aw
ay) a
fter
buy
ing/
harv
estin
g be
caus
e of
ot
her p
robl
ems?
Yes
……
No
……
…
15.
If ye
s, w
hat a
re th
e us
ual p
robl
ems w
ith th
e tu
bers
? …
……
……
……
……
……
……
……
……
……
……
……
……
……
……
……
……
……
……
……
……
……
……
……
……
……
……
.. 16
.Do
you
stor
e th
e fin
ished
pro
duct
aft
er p
roce
ssin
g? Y
es…
……
……
…..
No
……
……
……
……
…..
17.
If ye
s, ho
w?
……
……
……
……
……
……
……
……
……
……
……
……
……
……
……
……
……
……
……
…..
18.
If ye
s, do
you
lose
fini
shed
pro
duct
dur
ing
stor
age
due
to sp
oila
ge Y
es…
... N
o …
……
19
.If
yes,
afte
r how
man
y da
ys/w
eeks
/mon
ths o
f sto
rage
do
norm
ally
not
ice sp
oila
ge?
……
……
……
……
……
…. d
ays/
wee
ks/m
onth
s 20
.If
yes,
wha
t per
cent
age
of th
e pr
oduc
t? …
……
……
%
21.
Wha
t is y
our a
nnua
l sta
rch
prod
uctio
n? …
……
……
……
……
……
……
….(p
leas
e sp
ecify
the
unit)
22
.Do
you
hav
e ot
her b
ye p
rodu
cts?
Yes
……
. No…
….
23.
If ye
s, ho
w m
uch
do y
ou re
alize
from
thes
e by
e pr
oduc
ts a
nnua
lly?
N …
……
……
……
……
. 24
.W
hat i
s the
pric
e pe
r uni
t of t
he fi
nish
ed p
rodu
ct?
N …
……
……
……
……
. per
……
……
……
……
…..
(ple
ase
spec
ify th
e un
it)
C.
IMPA
CT O
N T
HE E
NVI
RON
MEN
T Th
e fo
llow
ing
tabl
e is
desig
ned
to c
olle
ct in
form
atio
n on
the
impa
ct o
f st
arch
pro
cess
ing
on t
he
envi
ronm
ent.
Plea
se co
mpl
ete
the
tabl
e as
muc
h as
it re
late
s to
your
ope
ratio
ns.
Desc
riptio
n of
Dat
a Da
ta
Mac
hine
ry U
sed
for
Proc
essin
g
1 N
ame
Ca
paci
ty
Co
st(N
) U
se li
fe (y
ears
) Ty
pe (P
etro
l/Die
sel/E
lect
ricity
)
Hour
s of W
ork
per d
ay

68 QueSTioNNaireS
Stan
d:
Erst
ellt
von:
Se
ite 1
1 De
scrip
tion
of D
ata
Data
N
umbe
r of D
ays o
f Wor
k pe
r Yea
r Ty
pe o
f wor
k
2 N
ame
Ca
paci
ty
Co
st(N
) U
se li
fe (y
ears
) Ty
pe (P
etro
l/Die
sel/E
lect
ricity
)
Hour
s of W
ork
per D
ay
N
umbe
r of D
ays o
f Wor
k pe
r Yea
r Ty
pe o
f wor
k
3 N
ame
Ca
paci
ty
Co
st(N
) U
se li
fe (y
ears
)
Type
(Pet
rol/D
iese
l/Ele
ctric
ity)
Ho
urs o
f Wor
k pe
r Day
Num
ber o
f Day
s of W
ork
per Y
ear
Type
of w
ork
Tran
spor
tatio
n (C
assa
va
farm
s to
Pr
oces
sing
Cent
re)
Di
stan
ce (k
m)
Type
of V
ehic
le (e
.g. P
ick-
up v
an)
Num
ber o
f trip
s ca
rryi
ng fr
esh
cass
ava
tube
rs
from
farm
to
proc
essin
g ce
nter
per
yea
r
Tran
spor
tatio
n (P
roce
ssin
g Ce
ntre
to
Di
strib
utio
n ou
tlets
/Mar
ket)
Di
stan
ce (k
m)
Type
of V
ehic
le (e
.g. P
ick-
up v
an)
Num
ber
of t
rips
carr
ying
sta
rch
from
fac
tory
to
dist
ribut
ion
outle
ts/m
arke
t per
yea
r
Feed
Pro
cess
ors’
Que
stio
nnai
re
This
surv
ey is
bei
ng c
ondu
cted
with
a v
iew
to
elic
iting
info
rmat
ion
on lo
sses
tha
t m
ay b
e oc
curr
ing
betw
een
mai
ze f
arm
ers’
field
and
the
ulti
mat
e co
nsum
er o
f m
aize
pro
duct
s. Th
is pa
rtic
ular
qu
estio
nnai
re is
des
igne
d to
col
lect
info
rmat
ion
on lo
sses
in th
e qu
antit
y an
d qu
ality
of m
aize
gra
ins
and
by-p
rodu
cts d
urin
g th
e pr
oces
s of t
rans
form
atio
n in
to li
vest
ock
feed
s Al
l inf
orm
atio
n w
ill r
emai
n an
onym
ous
and
conf
iden
tial a
nd w
ill o
nly
be u
sed
for
the
purp
oses
of
iden
tifyi
ng t
he s
ourc
es a
nd a
mou
nts
of lo
sses
in m
aize
pro
duct
ion,
pro
cess
ing,
tra
nspo
rtat
ion
and
mar
ketin
g.
A.
IDEN
TIFI
CATI
ON
Na
me
of E
num
erat
or
Da
te o
f Int
ervi
ew
St
ate
Lo
cal G
over
nmen
t Are
a
Villa
ge
Na
me
of re
spon
dent
Stan
d:
Erst
ellt
von:
Se
ite 1
2 Fe
ed p
roce
ssin
g
1.W
hat q
uant
ity o
f mai
ze g
rain
do
you
buy
annu
ally
? …
……
……
….(m
t/ 5
0 kg
-bag
s /ot
her,
spec
ify)
2.Ho
w m
uch
do y
ou p
ay p
er u
nit o
f mai
ze g
rain
pur
chas
ed fr
om th
e m
arke
t? N
...
......
......
......
....p
er (m
t/ 5
0 kg
-bag
s /ot
her,
spec
ify)
3.Ho
w m
uch
do y
ou p
ay p
er u
nit o
f mai
ze g
rain
supp
lied
to y
ou a
t the
feed
mill
? N
...
......
......
......
....p
er (m
t/ 5
0 kg
-bag
s /ot
her,
spec
ify)
4.Do
you
lose
mai
ze g
rain
s dur
ing
tran
spor
tatio
n fr
om th
e m
arke
t to
your
feed
mill
? Ye
s….
No
……
. 5.
If ye
s, w
hat p
erce
ntag
e of
tota
l mai
ze g
rain
bou
ght i
s nor
mal
ly sp
oilt
/ los
t dur
ing
tran
spor
tatio
n? …
……
……
……
.%
6.Pl
ease
stat
e th
e ca
uses
of l
osse
s of g
rain
s dur
ing
tran
spor
tatio
n …
……
……
……
……
……
……
……
……
……
……
……
……
……
……
.……
……
……
……
……
……
……
……
…
7.Do
you
lose
reve
nue
beca
use
of th
e lo
ss?
Yes…
…
No
……
8.
If yo
u lo
se re
venu
e, p
leas
e ex
plai
n ho
w?
.……
……
……
……
……
……
……
……
……
……
……
……
……
……
……
…
……
……
……
……
……
……
……
……
……
……
……
……
……
……
……
……
……
……
……
……
……
……
……
……
……
……
…
9.W
hat d
o yo
u do
with
the
spoi
lt m
aize
gra
ins?
......
......
......
......
......
......
......
......
......
......
......
......
10
.Ar
e th
ere
othe
r cha
lleng
es in
tran
spor
tatio
n of
mai
ze g
rain
s fro
m th
e m
arke
t to
your
feed
m
ill?
Yes…
… N
o …
….
11.
If ye
s, pl
ease
des
crib
e th
em. …
……
……
……
……
……
……
……
……
……
……
……
……
……
……
……
……
……
……
. …
……
……
……
……
……
……
……
……
……
……
……
……
……
……
……
……
……
……
……
……
……
……
……
……
……
……
12
.Pl
ease
com
plet
e th
e fo
llow
ing
tabl
e fo
r the
diff
eren
t typ
es o
f fee
d pr
oduc
ed.
In
puts
Fe
ed ty
pes
Broi
ler S
tart
er
Chic
k M
arsh
Gr
ower
La
yer
Fini
sher
M
aize
gra
ins
(Qua
ntity
pe
r ton
ne o
f fee
d)
Oth
er in
gred
ient
s (c
ost
per t
on o
f fee
d) N
Tota
l ou
tput
pe
r an
num
(ton
ne)
Selli
ng p
rice
per
tonn
e (N
)
Mon
thly
wag
es (N
)
Rent
on
build
ings
(N)
13.
Do y
ou u
sual
ly h
ave
any
loss
dur
ing
mill
ing?
Yes
..…
No …
..
14.
Wha
t per
cent
age
of to
tal p
rodu
ct is
nor
mal
ly lo
st?
……
……
……
….%
15
.Do
you
lose
reve
nue
beca
use
of th
e lo
ss?
Yes…
…
No
……
16
.If
you
lose
reve
nue,
ple
ase
expl
ain
how
? .…
……
……
……
……
……
……
……
……
……
……
……
……
……
……
…
……
……
……
……
……
……
……
……
……
……
……
……
……
……
……
……
……
……
……
……
……
……
……
……
……
……
……
17
.Do
you
stor
e m
aize
gra
ins b
efor
e m
illin
g? Y
es…
……
……
…..
No …
……
……
……
……
. 18
.If
yes,
how
? …
……
……
……
……
……
……
……
……
……
……
……
……
……
……
……
……
……
……
……
.. 19
.If
yes,
do y
ou lo
se m
aize
gra
ins d
urin
g st
orag
e du
e to
spoi
lage
? Ye
s……
……
……
.. No
…
……
……
……
……
.. 20
.If
yes,
how
long
on
the
aver
age
do y
ou st
ore
a ba
tch
of m
aize
gra
ins?
……
……
……
……
…
wee
ks/m
onth
s 21
.If
yes,
afte
r how
man
y w
eeks
/mon
ths o
f sto
rage
do
you
norm
ally
not
ice sp
oila
ge?
……
……
……
……
……
….
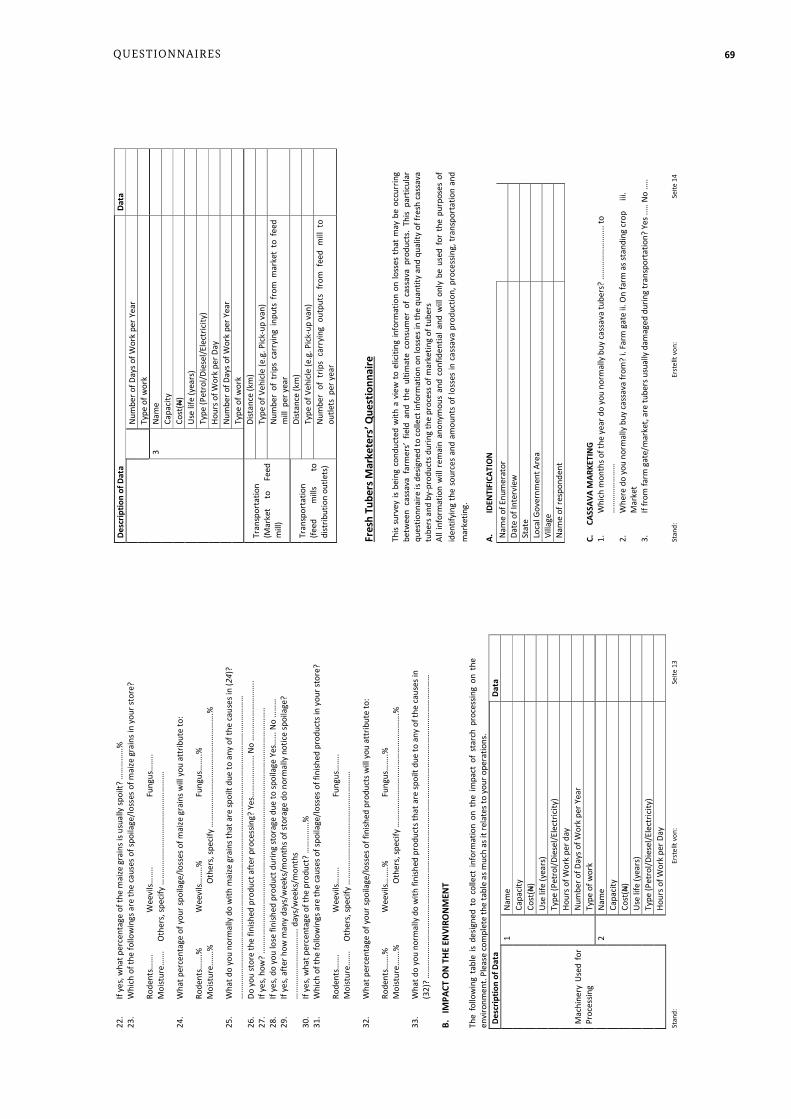
69QueSTioNNaireS
Stan
d:
Erst
ellt
von:
Se
ite 1
3 22
.If
yes,
wha
t per
cent
age
of th
e m
aize
gra
ins i
s usu
ally
spoi
lt? …
……
……
%
23.
Whi
ch o
f the
follo
win
gs a
re th
e ca
uses
of s
poila
ge/lo
sses
of m
aize
gra
ins i
n yo
ur st
ore?
Ro
dent
s……
.
Wee
vils…
…..
Fung
us…
…..
M
oist
ure…
….
Oth
ers,
spec
ify …
……
……
……
……
……
……
……
……
….
24.
Wha
t per
cent
age
of y
our s
poila
ge/lo
sses
of m
aize
gra
ins w
ill y
ou a
ttrib
ute
to:
Rode
nts…
….%
Wee
vils…
…..%
Fu
ngus
……
..%
Moi
stur
e……
.%
O
ther
s, sp
ecify
……
……
……
……
……
……
……
……
……
.%
25.
Wha
t do
you
norm
ally
do
with
mai
ze g
rain
s tha
t are
spoi
lt du
e to
any
of t
he c
ause
s in
(24)
? …
……
……
……
……
……
……
……
……
……
……
……
……
……
……
……
……
……
……
……
……
……
……
……
……
26
.Do
you
stor
e th
e fin
ished
pro
duct
aft
er p
roce
ssin
g? Y
es…
……
……
…..
No
……
……
……
……
…..
27.
If ye
s, ho
w?
……
……
……
……
……
……
……
……
……
……
……
……
……
……
……
……
……
……
……
…..
28.
If ye
s, do
you
lose
fini
shed
pro
duct
dur
ing
stor
age
due
to sp
oila
ge Y
es…
... N
o …
……
29
.If
yes,
afte
r how
man
y da
ys/w
eeks
/mon
ths o
f sto
rage
do
norm
ally
not
ice
spoi
lage
? …
……
……
……
……
……
. day
s/w
eeks
/mon
ths
30.
If ye
s, w
hat p
erce
ntag
e of
the
prod
uct?
……
……
…%
31
.W
hich
of t
he fo
llow
ings
are
the
caus
es o
f spo
ilage
/loss
es o
f fin
ished
pro
duct
s in
your
stor
e?
Rode
nts…
….
W
eevi
ls……
..
Fu
ngus
……
..
M
oist
ure…
….
Oth
ers,
spec
ify …
……
……
……
……
……
……
……
……
….
32.
Wha
t per
cent
age
of y
our s
poila
ge/lo
sses
of f
inish
ed p
rodu
cts w
ill y
ou a
ttrib
ute
to:
Rode
nts…
….%
Wee
vils…
…..%
Fu
ngus
……
..%
Moi
stur
e……
.%
O
ther
s, sp
ecify
……
……
……
……
……
……
……
……
……
.%
33.
Wha
t do
you
norm
ally
do
with
fini
shed
pro
duct
s tha
t are
spoi
lt du
e to
any
of t
he c
ause
s in
(32)
? …
……
……
……
……
……
……
……
……
……
……
……
……
……
……
……
……
……
……
……
……
……
……
……
……
B.IM
PACT
ON
THE
EN
VIRO
NM
ENT
Th
e fo
llow
ing
tabl
e is
desig
ned
to c
olle
ct in
form
atio
n on
the
impa
ct o
f st
arch
pro
cess
ing
on t
he
envi
ronm
ent.
Plea
se co
mpl
ete
the
tabl
e as
muc
h as
it re
late
s to
your
ope
ratio
ns.
Desc
riptio
n of
Dat
a Da
ta
Mac
hine
ry U
sed
for
Proc
essin
g
1 N
ame
Ca
paci
ty
Co
st(N
)
Use
life
(yea
rs)
Ty
pe (P
etro
l/Die
sel/E
lect
ricity
)
Hour
s of W
ork
per d
ay
N
umbe
r of D
ays o
f Wor
k pe
r Yea
r
Type
of w
ork
2
Nam
e
Capa
city
Cost
(N)
U
se li
fe (y
ears
) Ty
pe (P
etro
l/Die
sel/E
lect
ricity
)
Hour
s of W
ork
per D
ay
Stan
d:
Erst
ellt
von:
Se
ite 1
4 De
scrip
tion
of D
ata
Data
N
umbe
r of D
ays o
f Wor
k pe
r Yea
r Ty
pe o
f wor
k
3 N
ame
Ca
paci
ty
Co
st(N
) U
se li
fe (y
ears
) Ty
pe (P
etro
l/Die
sel/E
lect
ricity
)
Hour
s of W
ork
per D
ay
N
umbe
r of D
ays o
f Wor
k pe
r Yea
r Ty
pe o
f wor
k
Tran
spor
tatio
n (M
arke
t to
Fe
ed
mill
)
Di
stan
ce (k
m)
Type
of V
ehic
le (e
.g. P
ick-
up v
an)
Num
ber
of t
rips
carr
ying
inp
uts
from
mar
ket
to f
eed
mill
per
yea
r
Tran
spor
tatio
n (fe
ed
mill
s to
di
strib
utio
n ou
tlets
)
Di
stan
ce (k
m)
Type
of V
ehic
le (e
.g. P
ick-
up v
an)
Num
ber
of t
rips
carr
ying
out
puts
fro
m f
eed
mill
to
outle
ts p
er y
ear
Fr
esh
Tube
rs M
arke
ters
’ Que
stio
nnai
re
This
surv
ey is
bei
ng c
ondu
cted
with
a v
iew
to
elic
iting
info
rmat
ion
on lo
sses
tha
t m
ay b
e oc
curr
ing
betw
een
cass
ava
farm
ers’
field
and
the
ulti
mat
e co
nsum
er o
f ca
ssav
a pr
oduc
ts.
This
part
icul
ar
ques
tionn
aire
is d
esig
ned
to c
olle
ct in
form
atio
n on
loss
es in
the
quan
tity
and
qual
ity o
f fre
sh c
assa
va
tube
rs a
nd b
y-pr
oduc
ts d
urin
g th
e pr
oces
s of m
arke
ting
of tu
bers
Al
l inf
orm
atio
n w
ill r
emai
n an
onym
ous
and
conf
iden
tial a
nd w
ill o
nly
be u
sed
for
the
purp
oses
of
iden
tifyi
ng th
e so
urce
s an
d am
ount
s of
loss
es in
cas
sava
pro
duct
ion,
pro
cess
ing,
tran
spor
tatio
n an
d m
arke
ting.
A.
ID
ENTI
FICA
TIO
N
Nam
e of
Enu
mer
ator
Date
of I
nter
view
Stat
e
Loca
l Gov
ernm
ent A
rea
Vi
llage
Nam
e of
resp
onde
nt
C.
CAS
SAVA
MAR
KETI
NG
1.W
hich
mon
ths o
f the
yea
r do
you
norm
ally
buy
cas
sava
tube
rs?
……
……
……
……
.. to
…
……
……
……
…
2.W
here
do
you
norm
ally
buy
cas
sava
from
? i.
Farm
gat
e ii.
On
farm
as s
tand
ing
crop
i
ii.
Mar
ket
3.If
from
farm
gat
e/m
arke
t, ar
e tu
bers
usu
ally
dam
aged
dur
ing
tran
spor
tatio
n? Y
es ..
… N
o …
..

70 QueSTioNNaireS
Stan
d:
Erst
ellt
von:
Se
ite 1
5 4.
If fr
om o
n fa
rm a
s sta
ndin
g cr
op, a
re tu
bers
usu
ally
dam
aged
dur
ing
harv
estin
g? Y
es ..
… N
o …
.. 5.
Wha
t per
cent
age
of to
tal c
assa
va b
ough
t/ha
rves
ted
is n
orm
ally
dam
aged
? …
……
……
……
.%
6.Do
you
lose
reve
nue
beca
use
of th
e da
mag
e? Y
es…
…
No
……
7.
If yo
u lo
se re
venu
e, p
leas
e ex
plai
n ho
w?
.……
……
……
……
……
……
……
……
……
……
……
……
……
……
……
…
……
……
……
……
……
……
……
……
……
……
……
……
……
……
……
……
……
……
……
……
……
……
……
……
……
……
….
8.W
hat d
o yo
u do
with
the
dam
aged
tube
rs?
a. T
hrow
aw
ay…
. b.
use
as a
nim
al fe
ed…
.
c. O
ther
s (pl
ease
spec
ify)
.……
……
……
……
……
……
……
……
……
……
……
……
……
…
9.Ar
e th
ere
tube
rs th
at y
ou u
sual
ly d
iscar
d (th
row
aw
ay) a
fter
buy
ing/
harv
estin
g be
caus
e of
ot
her p
robl
ems?
Yes
……
N
o …
……
10
.If
yes,
wha
t are
the
usua
l pro
blem
s with
the
tube
rs?
……
……
……
……
……
……
……
……
……
……
……
…
……
……
……
……
……
……
……
……
……
……
……
……
……
……
……
……
……
……
……
……
……
……
……
……
……
……
……
11
.Ar
e th
ere
othe
r cha
lleng
es in
har
vest
ing,
mar
ketin
g an
d tr
ansp
orta
tion
cass
ava
tube
rs?
Yes…
… N
o …
….
12.
If ye
s, pl
ease
des
crib
e th
em. …
……
……
……
……
……
……
……
……
……
……
……
……
……
……
……
……
……
……
. …
……
……
……
……
……
……
……
……
……
……
……
……
……
……
……
……
……
……
……
……
……
……
……
……
……
……
…
13.
Wha
t qua
ntity
of c
assa
va tu
bers
do
you
buy
annu
ally
? …
……
……
….(w
heel
barr
ows/
pick
up
vans
/ mt/
oth
er, s
pecif
y)
14.
Wha
t is t
he a
vera
ge p
rice
of c
assa
va tu
bers
from
farm
gat
e? N
....
......
......
......
...pe
r (w
heel
barr
ows/
pick
up v
ans/
mt/
oth
er, s
pecif
y)
15.
Wha
t is t
he a
vera
ge p
rice
of c
assa
va tu
bers
from
loca
l mar
kets
? N
....
......
......
......
...pe
r (w
heel
barr
ows/
pick
up v
ans/
mt/
oth
er, s
pecif
y)
16.
Wha
t is t
he a
vera
ge p
rice
of c
assa
va tu
bers
from
on
farm
stan
ding
crop
? N
...
......
......
......
....p
er (h
eaps
/whe
elba
rrow
s/pi
ckup
van
s/ m
t/ o
ther
, spe
cify)
17
.W
hat i
s the
dist
ance
bet
wee
n th
e fa
rm g
ate/
loca
l mar
ket a
nd th
e ga
rri p
roce
ssin
g pl
ant/
star
ch p
roce
ssin
g fa
ctor
y w
here
you
supp
ly c
assa
va?
……
.. km
18
.W
hat i
s the
cos
t of t
rans
port
atio
n pe
r uni
t of t
uber
s to
the
garr
i pro
cess
ing
plan
t/st
arch
pr
oces
sing
fact
ory?
…N
……
……
…/…
……
……
… (P
leas
e sp
ecify
uni
t, e.
g. w
heel
barr
ow, p
icku
p va
n, e
tc)
19.
Wha
t pric
e do
you
sell
your
fres
h tu
bers
at t
he g
arri
proc
essin
g pl
ant/
star
ch p
roce
ssin
g fa
ctor
y? …
N …
……
……
/……
……
……
(Ple
ase
spec
ify u
nit,
e.g.
whe
elba
rrow
, pic
kup
van,
etc
)
D.IM
PACT
ON
THE
EN
VIRO
NM
ENT
The
follo
win
g ta
ble
is de
signe
d to
col
lect
info
rmat
ion
on t
he im
pact
of
cass
ava
mar
ketin
g on
the
en
viro
nmen
t. Pl
ease
com
plet
e th
e ta
ble
as m
uch
as it
rela
tes t
o yo
ur o
pera
tions
. De
scrip
tion
of D
ata
Data
Fiel
d Si
ze
Area
Uni
t
Date
of h
arve
st (m
onth
/yea
r)
Am
ount
of m
ain
prod
uct h
arve
sted
and
take
n of
f th
e fie
ld
(fres
h w
eigh
t).w
heel
barr
ows/
pick
up
vans
/ m
t/
othe
r, sp
ecify
) per
(he
ctar
e/ac
re/s
peci
fy)
Am
ount
of
by-
prod
uct
(e.g
. st
em c
uttin
g)
harv
este
d an
d ta
ken
off
the
field
(fr
esh
wei
ght)
.whe
elba
rrow
s/pi
ckup
va
ns/
mt/
ot
her,
spec
ify) p
er (
hect
are/
acre
/spe
cify
) Tr
ansp
orta
tion
Dist
ance
(km
)
Stan
d:
Erst
ellt
von:
Se
ite 1
6 De
scrip
tion
of D
ata
Data
(F
arm
to
Ho
mes
tead
Ty
pe
of
Vehi
cle
(e.g
. Pi
ck-u
p va
n)
N
umbe
r of t
rips
carr
ying
in
puts
to fa
rm p
er y
ear
N
umbe
r of t
rips
carr
ying
ou
tput
s fr
om f
arm
pe
r ye
ar
Tran
spor
tatio
n (H
omes
tead
to
Ru
ral
Mar
ket/
Fact
ory
Gate
/Pro
cess
ing
Cent
re)
Dist
ance
(km
)
Type
of
Ve
hicle
(e
.g.
Pick
-up
van)
Num
ber o
f trip
s ca
rryi
ng
inpu
ts to
farm
per
yea
r
Num
ber o
f trip
s ca
rryi
ng
outp
uts
from
far
m
per
year

71QueSTioNNaireS
Stan
d:
Erst
ellt
von:
Se
ite 1
7
2)Su
rvey
of l
osse
s in
Mai
ze v
alue
cha
in
Farm
er’s
Que
stio
nnai
re
This
surv
ey is
bei
ng c
ondu
cted
with
a v
iew
to
elic
iting
info
rmat
ion
on lo
sses
tha
t m
ay b
e oc
curr
ing
betw
een
mai
ze f
arm
ers’
field
and
the
ulti
mat
e co
nsum
er o
f m
aize
pro
duct
s. Th
is pa
rtic
ular
qu
estio
nnai
re is
des
igne
d to
col
lect
info
rmat
ion
on lo
sses
in th
e qu
antit
y an
d qu
ality
of f
resh
mai
ze,
mai
ze (d
ry) g
rain
and
by-
prod
ucts
on
farm
ers’
field
s and
hom
este
ad, e
tc
All i
nfor
mat
ion
will
rem
ain
anon
ymou
s an
d co
nfid
entia
l and
will
onl
y be
use
d fo
r th
e pu
rpos
es o
f id
entif
ying
the
sou
rces
and
am
ount
s of
loss
es in
mai
ze p
rodu
ctio
n, p
roce
ssin
g, t
rans
port
atio
n an
d m
arke
ting.
A.
ID
ENTI
FICA
TIO
N
Nam
e of
Enu
mer
ator
Date
of I
nter
view
Stat
e
Loca
l Gov
ernm
ent A
rea
Vi
llage
Nam
e of
resp
onde
nt
B.
DE
MO
GRAP
HIC
DATA
1.
Tr
ibe:
____
____
____
__ (o
ptio
nal)
2.
Hom
e To
wn
(Pla
ce o
f Orig
in):
Tow
n___
____
____
___L
GA__
____
____
____
Stat
e___
____
____
3.
Pl
ace
of B
irth:
Tow
n___
____
____
___L
GA__
____
____
____
Stat
e___
____
____
___
5.
Sex:
(i) M
ale
(ii) F
emal
e 6.
Re
ligio
n: (o
ptio
nal)
(i) C
hrist
iani
ty
(ii) I
slam
(ii
i) Tr
aditi
onal
(i
v) O
ther
s 7.
Ag
e: _
____
____
____
_ 8.
M
arita
l Sta
tus:
(i)
Sin
gle
(ii) M
arrie
d (ii
i) W
idow
/er
9.
Hous
e ho
ld si
ze: _
____
____
____
_ 10
. N
umbe
r of W
ives
: ___
____
____
__(E
xact
, num
ber,
plea
se)
11.
Num
ber o
f Chi
ldre
n:
Sex
Tota
l N
umbe
r of
Child
ren
Child
ren
Still
Liv
ing
with
You
(A
ll)
Child
ren
Still
Liv
ing
with
You
Num
ber
Activ
e in
ag
ricul
ture
0
– 5
Yrs.
6
– 15
Yr
s.
16+
Yrs
Mal
e
Fe
mal
e
To
tal
12.
Depe
ndan
t Rel
ativ
es:
Sex
Rela
tive
Livi
ng w
ith Y
ou
N
umbe
r Act
ive
in a
gric
ultu
re
0 –
5 Yr
s.
6 –
15 Y
rs.
16+
Yrs
Stan
d:
Erst
ellt
von:
Se
ite 1
8 M
ale
Fem
ale
Tota
l
14
. Ed
ucat
ion
(Hig
hest
leve
l onl
y)
Fa
rmer
:
(i)
Prim
ary
(ii)
Seco
ndar
y
(iii)
Te
chni
cal C
olle
ge
(iv
) Te
rtia
ry (v
) Vo
catio
nal
(vi)
Ad
ult E
duca
tion
(v
ii) N
one
Spou
se:
(i)
Prim
ary
(ii)
Seco
ndar
y
(iii)
Te
chni
cal C
olle
ge
(iv
) Te
rtia
ry (v
) Vo
catio
nal
(vi)
Ad
ult E
duca
tion
(v
ii) N
one
C.
PR
E-PR
ODU
CTIO
N
1.
Tota
l size
of a
ll fa
rms o
wne
d: …
……
…He
aps/
……
….H
a
2.
Tota
l size
of a
ll fa
rms p
lant
ed w
ith m
aize
last
pro
duct
ion
seas
on :…
……
…He
aps/
……
….H
a
3
Dist
ance
of t
he fa
rthe
st fi
eld
from
the
Hous
e ho
ld re
siden
ce _
____
____
____
4
Plea
se, l
ist th
e cr
ops y
ou p
lant
ed la
st p
rodu
ctio
n se
ason
in th
e or
der o
f
impo
rtan
ce…
……
……
……
……
……
……
……
……
……
……
……
……
……
……
……
……
……
……
……
……
……
……
……
……
……
……
……
……
……
……
…
5 W
hat p
erce
ntag
e of
the
mai
ze p
lant
ed is
nor
mal
ly c
onsu
med
by
your
fam
ily?
……
……
…..%
6.
Ar
e yo
u pa
rtic
ipat
ing
in a
ny F
G/St
ate/
NGO
pro
ject
that
is p
rom
otin
g m
aize
pro
duct
ion?
Ye
s……
/No…
…
7.
If ye
s, pl
ease
stat
e th
e na
me
of th
e pr
ojec
t……
……
……
……
……
……
……
……
……
……
……
……
……
…..
8.
Are
gove
rnm
ent e
xten
sion
agen
ts co
min
g to
pro
vide
info
rmat
ion
to y
ou o
n ho
w to
gro
w a
nd
proc
ess m
aize
? Y
es…
…/N
o……
9.
If
yes,
plea
se st
ate
how
oft
en?
Tw
ice
in a
mon
th…
…
O
nce
in a
mon
th…
…
O
nce
in tw
o m
onth
s……
Onc
e in
thre
e m
onth
s……
10
. Ar
e yo
u a
mem
ber o
f a co
oper
ativ
e so
ciet
y? Y
es…
…/N
o……
…
11.
If ye
s, pl
ease
stat
e th
e ty
pe. (
i) Pr
oduc
er…
……
… (i
i)Thr
ift &
Cred
it……
…
(iii)
Mar
ketin
g……
…
(iv) O
ther
s, pl
ease
stat
e …
……
……
……
….
D.
PRO
DUCT
ION
La
nd te
nure
1.
Pl
ease
com
plet
e th
e fo
llow
ing
tabl
e Ty
pe o
f Fie
ld
Num
ber
Size
In
herit
ed
Purc
hase
d
Re
nted
Pl
edge
d
O
ther
s
2.
Di
d yo
u us
e irr
igat
ion
for m
aize
pro
duct
last
pro
duct
ion
seas
ons?
Yes
……
….N
o……
3.
If
yes,
wha
t is t
he to
tal s
ize o
f all
mai
ze fa
rms i
rrig
ated
last
pro
duct
ion
seas
on:
……
……
Heap
s/…
……
.Ha
4.
Plea
se, p
rovi
de a
n es
timat
e of
the
irrig
atio
n co
st.
N……
……
……
……
……

72 QueSTioNNaireS
Stan
d:
Erst
ellt
von:
Se
ite 1
9 Cr
oppi
ng S
yste
m
5.
Did
you
plan
t mai
ze so
le o
r mix
ed w
ith o
ther
cro
ps?
Sol
e……
…. M
ixed
……
……
6.
If
mix
ed, s
tate
the
crop
s you
mix
ed w
ith
mai
ze…
……
……
……
……
……
……
……
……
……
……
……
……
……
…
7.
In w
hich
wee
k an
d m
onth
of t
he y
ear d
o yo
u no
rmal
ly p
repa
re th
e la
nd fo
r pla
ntin
g m
aize
?
Wee
k 1
2
3 4
Mon
th …
……
……
……
……
……
8.
Pl
ease
, pro
vide
the
follo
win
g in
form
atio
n on
mai
ze se
eds u
sed
for p
lant
ing
your
fiel
d(s)
last
pr
oduc
tion
seas
on.
So
urce
s Va
riety
Ty
pe (w
hite
/Yel
low
) Q
uant
ity (k
g)
Valu
e (N
) AD
P
M
ANR
Mar
ket
Past
har
vest
O
ther
s
9.
Pl
ease
, pro
vide
the
follo
win
g in
form
atio
n on
the
fert
ilize
r app
lied
to th
e m
aize
fiel
ds p
lant
ed
durin
g th
e la
st p
rodu
ctio
n se
ason
. So
urce
s F
ertil
izer t
ype
(NPK
/ U
rea/
spec
ify o
ther
s )
Qua
ntity
(5
0kg
bags
) Pr
ice/5
0kg
bag
ADP
M
ANR
Mar
ket
De
aler
/Age
nt
O
ther
s
10.
Whe
re d
o yo
u st
ore
fert
ilize
r? ..
......
......
......
......
......
......
......
......
......
......
...
11
Plea
se, p
rovi
de th
e fo
llow
ing
info
rmat
ion
on in
sect
icid
e/fu
ngic
ide/
herb
icid
e ap
plie
d to
the
mai
ze fi
elds
pla
nted
last
yea
r. I)
Sour
ces
Inse
ctic
ide
Qua
ntity
(ple
as,
spec
ify u
nit)
Pr
ice/
unit
last
yea
r
ADP
M
ANR
M
arke
t
Deal
er/A
gent
Oth
ers
II)
So
urce
s Fu
ngic
ide
Q
uant
ity (p
leas
, sp
ecify
uni
t)
Pric
e/un
it la
st y
ear
ADP
M
ANR
M
arke
t
Deal
er/A
gent
Oth
ers
Stan
d:
Erst
ellt
von:
Se
ite 2
0 III
) So
urce
s He
rbic
ide
Q
uant
ity (p
leas
, sp
ecify
uni
t)
Pric
e/un
it la
st y
ear
ADP
M
ANR
M
arke
t
Deal
er/A
gent
Oth
ers
12
. W
here
do
you
stor
e ch
emic
als?
......
......
......
......
......
......
......
......
......
......
......
......
......
......
......
.. 13
. Di
d yo
u us
e cr
edit
for t
he m
aize
you
pla
nted
dur
ing
the
last
pro
duct
ion
seas
on?
Yes…
……
.No…
…
13.
If yo
ur a
nsw
er is
yes
, ple
ase
indi
cate
the
sour
ces.
……
……
……
……
……
……
……
……
……
……
……
……
……
14
. If
your
ans
wer
is n
o, W
hy?
Not
nee
ded
……
.. No
t ava
ilabl
e……
To
o ex
pens
ive…
…
15.
Did
you
use
hire
d la
bour
for t
he m
aize
fiel
ds p
lant
ed d
urin
g th
e la
st p
rodu
ctio
n se
ason
? Ye
s……
….N
o……
16
. If
your
ans
wer
is n
o, W
hy?
Not
nee
ded
……
.. No
t ava
ilabl
e……
To
o ex
pens
ive…
…
17.
If yo
ur a
nsw
er is
yes
, how
muc
h di
d yo
u pa
y pe
r day
for h
ired
labo
ur?
N……
……
……
……
…
18.
Wha
t is t
he p
rese
nt c
ost p
er d
ay fo
r hire
d la
bour
in y
our c
omm
unity
? N…
……
……
……
……
19
. Pl
ease
indi
cate
whi
ch o
f the
follo
win
g ty
pes o
f fam
ily la
bour
are
bei
ng u
sed.
Ty
pes
Yes/
No
Head
of h
ouse
hold
onl
y
Wife
/wiv
es
Ch
ildre
n
Depe
ndan
t rel
ativ
es
Al
l Typ
es
20
Pl
ease
, pro
vide
info
rmat
ion
on la
bour
util
ized
for t
he cu
ltiva
tion
of th
e m
aize
fiel
ds p
lant
ed
last
pro
duct
ion
seas
on
Farm
Ope
ratio
n
Mon
th D
one
Labo
ur ty
pe
No.
of m
anda
ys
Cost
/man
day
(N)
Bush
cle
arin
g
Pl
ough
ing
Heap
mak
ing
Plan
ting
Wee
ding
Ha
rves
ting
Oth
ers,
plea
se
spec
ify
(i)
Ad
ult m
ale
(ii)
Adul
t fem
ale
(iii)
Mal
e ch
ildre
n
(iv)
Fe
mal
e ch
ildre
n 21
Di
d yo
u us
e m
echa
nize
d eq
uipm
ent (
trac
tor)
to p
repa
re th
e la
nd u
sed
for c
ultiv
atin
g th
e m
aize
pla
nted
dur
ing
the
last
pro
duct
ion
seas
on?
Yes…
……
.No…
…
22.
If ye
s, ho
w m
uch
did
you
pay
for t
he se
rvic
es?
N …
……
……
……
……
.. 23
. Di
d an
y pe
sts (
inse
cts,
bird
s, ro
dent
s, et
c) a
nd d
iseas
es a
ttac
k th
e m
aize
fiel
ds y
ou p
lant
ed
last
pro
duct
ion
seas
on?
Yes…
……
.No…
…
24.
If ye
s, w
hat a
re th
e ef
fect
s esp
ecia
lly o
n yi
elds
; ple
ase
desc
ribe
and
quan
tify.
……
……
……
……
……
……
……
……
……
……
……
……
……
……
……
……
……
……
……
……
……
……
……
……
……
……
……
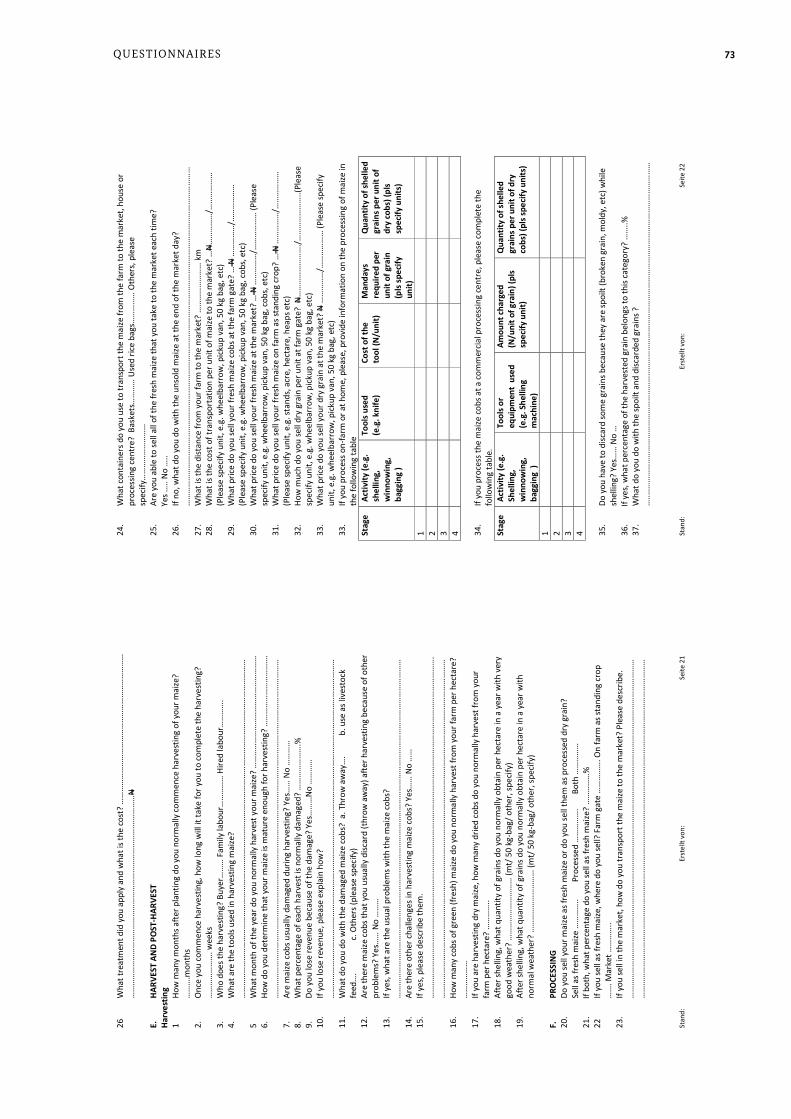
73QueSTioNNaireS
Stan
d:
Erst
ellt
von:
Se
ite 2
1 26
W
hat t
reat
men
t did
you
app
ly a
nd w
hat i
s the
cos
t? …
……
……
……
……
……
……
……
……
……
……
……
…
…
……
……
……
……
……
……
……
……
……
……
……
……
……
.……
……
…N
E.
HARV
EST
AND
POST
-HAR
VEST
Ha
rves
ting
1 Ho
w m
any
mon
ths a
fter p
lant
ing
do y
ou n
orm
ally
com
men
ce h
arve
stin
g of
you
r mai
ze?
……
….m
onth
s 2.
O
nce
you
com
men
ce h
arve
stin
g, h
ow lo
ng w
ill it
take
for y
ou to
com
plet
e th
e ha
rves
ting?
…
……
……
……
. wee
ks
3.
Who
doe
s the
har
vest
ing?
Buy
er…
……
Fam
ily la
bour
……
……
… H
ired
labo
ur…
……
….
4.
Wha
t are
the
tool
s use
d in
har
vest
ing
mai
ze?
……
……
……
……
……
……
……
……
……
……
……
……
……
……
……
……
……
……
……
……
……
……
……
……
……
……
……
5
Wha
t mon
th o
f the
yea
r do
you
norm
ally
har
vest
you
r mai
ze?
……
……
……
……
……
……
……
……
……
6.
Ho
w d
o yo
u de
term
ine
that
you
r mai
ze is
mat
ure
enou
gh fo
r har
vest
ing?
……
……
……
……
……
….
……
……
……
……
……
……
……
……
……
……
……
……
……
……
……
……
……
……
……
……
……
……
……
……
……
……
……
7.
Ar
e m
aize
cob
s usu
ally
dam
aged
dur
ing
harv
estin
g? Y
es…
… N
o …
……
…
8.
Wha
t per
cent
age
of e
ach
harv
est i
s nor
mal
ly d
amag
ed?
……
……
……
….%
9.
Do
you
lose
reve
nue
beca
use
of th
e da
mag
e? Y
es…
……
No
……
……
10
. If
you
lose
reve
nue,
ple
ase
expl
ain
how
? …
……
……
……
……
……
……
……
……
……
……
……
……
……
……
……
……
……
……
……
……
……
……
……
……
……
……
…
11.
Wha
t do
you
do w
ith th
e da
mag
ed m
aize
cob
s? a
. Thr
ow a
way
….
b. u
se a
s liv
esto
ck
feed
….
c.
Oth
ers (
plea
se sp
ecify
)
12.
Are
ther
e m
aize
cob
s tha
t you
usu
ally
disc
ard
(thr
ow a
way
) afte
r har
vest
ing
beca
use
of o
ther
pr
oble
ms?
Yes
……
No
……
…
13.
If ye
s, w
hat a
re th
e us
ual p
robl
ems w
ith th
e m
aize
cob
s?
……
……
……
……
……
……
……
……
……
……
……
……
……
……
……
……
……
……
……
……
……
……
……
……
……
……
……
14
. Ar
e th
ere
othe
r cha
lleng
es in
har
vest
ing
mai
ze c
obs?
Yes
……
No
……
15
. If
yes,
plea
se d
escr
ibe
them
. …
……
……
……
……
……
……
……
……
……
……
……
……
……
……
……
……
……
……
……
……
……
……
……
……
……
……
….
……
……
……
……
……
……
……
……
……
……
……
……
……
……
……
……
……
……
……
……
……
……
……
……
……
……
……
16
. Ho
w m
any
cobs
of g
reen
(fre
sh) m
aize
do
you
norm
ally
har
vest
from
you
r far
m p
er h
ecta
re?
……
……
……
17
. If
you
are
harv
estin
g dr
y m
aize
, how
man
y dr
ied
cobs
do
you
norm
ally
har
vest
from
you
r fa
rm p
er h
ecta
re?
……
……
.. 18
. Af
ter s
helli
ng, w
hat q
uant
ity o
f gra
ins d
o yo
u no
rmal
ly o
btai
n pe
r hec
tare
in a
yea
r with
ver
y go
od w
eath
er?
……
……
……
……
……
(mt/
50
kg-b
ag/ o
ther
, spe
cify
) 19
. Af
ter s
helli
ng, w
hat q
uant
ity o
f gra
ins d
o yo
u no
rmal
ly o
btai
n pe
r hec
tare
in a
yea
r with
no
rmal
wea
ther
? …
……
……
……
……
… (m
t/ 5
0 kg
-bag
/ oth
er, s
peci
fy)
F.
PRO
CESS
ING
20.
Do y
ou se
ll yo
ur m
aize
as f
resh
mai
ze o
r do
you
sell
them
as p
roce
ssed
dry
gra
in?
Se
ll as
fres
h m
aize
……
……
..
Proc
esse
d …
……
……
. Bo
th …
……
……
21
. If
both
, wha
t per
cent
age
do y
ou se
ll as
fres
h m
aize
? …
……
……
%
22
If yo
u se
ll as
fres
h m
aize
, whe
re d
o yo
u se
ll? F
arm
gat
e …
……
……
. On
farm
as s
tand
ing
crop
…
…. M
arke
t ……
……
.. 23
. If
you
sell
in th
e m
arke
t, ho
w d
o yo
u tr
ansp
ort t
he m
aize
to th
e m
arke
t? P
leas
e de
scrib
e.
……
……
……
……
……
……
……
……
……
……
……
……
……
……
……
……
……
……
……
……
……
……
……
……
……
……
……
……
……
……
……
……
……
……
……
……
……
……
……
……
……
……
……
……
……
……
……
……
……
……
……
……
……
……
Stan
d:
Erst
ellt
von:
Se
ite 2
2 24
. W
hat c
onta
iner
s do
you
use
to tr
ansp
ort t
he m
aize
from
the
farm
to th
e m
arke
t, ho
use
or
proc
essin
g ce
ntre
? B
aske
ts…
……
… U
sed
rice
bags
……
……
… O
ther
s, pl
ease
sp
ecify
……
……
……
……
…
25.
Are
you
able
to se
ll al
l of t
he fr
esh
mai
ze th
at y
ou ta
ke to
the
mar
ket e
ach
time?
Ye
s …..
No
…..
26.
If no
, wha
t do
you
do w
ith th
e un
sold
mai
ze a
t the
end
of t
he m
arke
t day
? …
……
……
……
……
……
……
……
……
……
……
……
……
……
……
……
……
……
……
……
……
……
……
……
……
……
……
…
27.
Wha
t is t
he d
istan
ce fr
om y
our f
arm
to th
e m
arke
t? …
……
……
……
… k
m
28.
Wha
t is t
he co
st o
f tra
nspo
rtat
ion
per u
nit o
f mai
ze to
the
mar
ket?
…N…
……
……
/……
……
……
(P
leas
e sp
ecify
uni
t, e.
g. w
heel
barr
ow, p
icku
p va
n, 5
0 kg
bag
, etc
) 29
. W
hat p
rice
do y
ou se
ll yo
ur fr
esh
mai
ze c
obs a
t the
farm
gat
e? …
N …
……
……
/……
……
……
(P
leas
e sp
ecify
uni
t, e.
g. w
heel
barr
ow, p
icku
p va
n, 5
0 kg
bag
, cob
s, et
c)
30.
Wha
t pric
e do
you
sell
your
fres
h m
aize
at t
he m
arke
t? …
N …
……
……
/……
……
……
(Ple
ase
spec
ify u
nit,
e.g.
whe
elba
rrow
, pic
kup
van,
50
kg b
ag, c
obs,
etc)
31
. W
hat p
rice
do y
ou se
ll yo
ur fr
esh
mai
ze o
n fa
rm a
s sta
ndin
g cr
op?
… N
……
……
…/…
……
……
…
(Ple
ase
spec
ify u
nit,
e.g.
stan
ds, a
cre,
hec
tare
, hea
ps e
tc)
32.
How
muc
h do
you
sell
dry
grai
n pe
r uni
t at f
arm
gat
e? N
……
……
……
……
./……
……
……
…..(
Plea
se
spec
ify u
nit,
e.g.
whe
elba
rrow
, pic
kup
van,
50
kg b
ag, e
tc)
33.
Wha
t pric
e do
you
sell
your
dry
gra
in a
t the
mar
ket?
N …
……
……
/……
……
……
(Ple
ase
spec
ify
unit,
e.g
. whe
elba
rrow
, pic
kup
van,
50
kg b
ag, e
tc)
33.
If yo
u pr
oces
s on-
farm
or a
t hom
e, p
leas
e, p
rovi
de in
form
atio
n on
the
proc
essin
g of
mai
ze in
th
e fo
llow
ing
tabl
e St
age
Activ
ity (e
.g.
shel
ling,
w
inno
win
g,
bagg
ing
)
Tool
s use
d
(e.g
. kni
fe)
Cost
of t
he
tool
(N/u
nit)
M
anda
ys
requ
ired
per
unit
of g
rain
(p
ls sp
ecify
un
it)
Qua
ntity
of s
helle
d gr
ains
per
uni
t of
dry
cobs
) (pl
s sp
ecify
uni
ts)
1
2
3
4
34.
If yo
u pr
oces
s the
mai
ze co
bs a
t a c
omm
ercia
l pro
cess
ing
cent
re, p
leas
e co
mpl
ete
the
follo
win
g ta
ble.
St
age
Activ
ity (e
.g.
Shel
ling,
w
inno
win
g,
bagg
ing
)
Tool
s or
equi
pmen
t us
ed
(e.g
. She
lling
m
achi
ne)
Amou
nt c
harg
ed
(N/u
nit o
f gra
in) (
pls
spec
ify u
nit)
Qua
ntity
of s
helle
d gr
ains
per
uni
t of d
ry
cobs
) (pl
s spe
cify
uni
ts)
1
2
3
4
35.
Do y
ou h
ave
to d
iscar
d so
me
grai
ns b
ecau
se th
ey a
re sp
oilt
(bro
ken
grai
n, m
oldy
, etc
) whi
le
shel
ling?
Yes
……
No
…
36.
If ye
s, w
hat p
erce
ntag
e of
the
harv
este
d gr
ain
belo
ngs t
o th
is ca
tego
ry?
……
..%
37.
Wha
t do
you
do w
ith th
e sp
oilt
and
disc
arde
d gr
ains
?
…..…
……
……
……
……
……
……
……
……
……
……
……
……
……
……
……
……
……
……
……
……
……
……
……
……
……
……

74 QueSTioNNaireS
Stan
d:
Erst
ellt
von:
Se
ite 2
3 G.
TR
ANSP
ORT
ATIO
N
38.
Do y
ou u
sual
ly lo
se fr
esh
mai
ze w
hile
tran
spor
ting
them
to th
e m
arke
t? Y
es…
… N
o …
…
39.
If ye
s, pl
ease
indi
cate
the
quan
tity
that
is u
sual
ly lo
st a
s a p
erce
ntag
e of
the
quan
tity
tran
spor
ted.
……
……
……
..%
40.
Do y
ou u
sual
ly lo
se m
aize
(dry
) gra
ins w
hile
tran
spor
ting
them
to th
e m
arke
t?
Yes…
……
……
…..
No …
……
……
……
…
41
. If
yes,
plea
se in
dica
te th
e qu
antit
y th
at is
usu
ally
lost
as a
per
cent
age
of th
e qu
antit
y tr
ansp
orte
d. …
……
……
…..%
H.
ST
ORA
GE
42.
Do y
ou st
ore
mai
ze (d
ry) c
obs a
fter
har
vest
ing?
Yes
……
……
……
.. N
o …
……
……
……
……
.. 43
. If
yes,
how
? …
……
……
……
……
……
……
……
……
……
……
……
……
……
……
……
……
……
……
……
.. 44
. If
yes,
do y
ou lo
se m
aize
(dry
) cob
s dur
ing
stor
age
due
to sp
oila
ge?
Yes…
……
. No
……
…
45.
If ye
s, af
ter h
ow m
any
days
of s
tora
ge d
o yo
u no
rmal
ly n
otice
spoi
lage
? …
……
……
……
……
……
. 46
. If
yes,
wha
t per
cent
age
of th
e m
aize
cob
s? …
……
……
%
47.
Do y
ou st
ore
the
shel
led
gra
ins?
Yes
……
……
……
.. N
o …
……
……
……
……
.. 48
. If
yes,
how
? …
……
……
……
……
……
……
……
……
……
……
……
……
……
……
……
……
……
……
……
.. 49
. If
yes,
do y
ou lo
se m
aize
gra
ins d
urin
g st
orag
e du
e to
spoi
lage
? Y
es…
… N
o …
….
50.
If ye
s, af
ter h
ow m
any
days
/wee
ks/m
onth
s of s
tora
ge d
o no
rmal
ly n
otic
e sp
oila
ge?
……
……
……
……
……
…. d
ays/
wee
ks/m
onth
s 51
. If
yes,
wha
t per
cent
age
of m
aize
gra
ins i
s usu
ally
spoi
lt? …
……
……
%
52.
Whi
ch o
f the
follo
win
gs a
re th
e ca
uses
of s
poila
ge/lo
sses
of m
aize
gra
ins i
n yo
ur st
ore?
Ro
dent
s……
.
Wee
vils…
…..
Fung
us…
…..
Moi
stur
e……
. O
ther
s, sp
ecify
……
……
……
……
……
……
……
……
……
. 53
. W
hat p
erce
ntag
e of
you
r spo
ilage
/loss
es o
f mai
ze g
rain
s will
you
att
ribut
e to
: Ro
dent
s……
.%
W
eevi
ls……
..%
Fung
us…
…..%
M
oist
ure…
….%
Oth
ers,
spec
ify …
……
……
……
……
……
……
……
……
….%
54
. W
hat d
o yo
u no
rmal
ly d
o w
ith m
aize
gra
ins t
hat a
re sp
oilt
due
to a
ny o
f the
cau
ses i
n (53)
? …
……
……
……
……
……
……
……
……
……
……
……
……
……
……
……
……
……
……
……
……
……
……
……
……
55
. W
hat p
erce
ntag
e of
the
finish
ed p
rodu
ct is
rese
rved
for h
ome
cons
umpt
ion?
……
……
…%
I
IMPA
CT O
N T
HE E
NVI
RON
MEN
T 56
. Th
e fo
llow
ing
tabl
e is
desig
ned
to c
olle
ct in
form
atio
n on
the
impa
ct o
f mai
ze p
rodu
ctio
n on
th
e en
viro
nmen
t. Pl
ease
com
plet
e th
e ta
ble
as m
uch
as it
rela
tes t
o yo
ur o
pera
tions
.
Desc
riptio
n of
Dat
a
Crop
Ent
erpr
ise C
ombi
natio
n M
aize
M
onoc
rop
Mai
ze M
ixed
Mai
ze
Crop
2
Crop
3
Crop
4
Fiel
d Si
ze
Area
U
nit
Date
of s
owin
g / p
lant
ing
(Mon
th/Y
ear)
Plan
t spa
cing
Crop
s Pla
nted
Bef
ore
Fi
eld
Clea
red
by b
urni
ng (Y
es/N
o)
Crop
s Mix
ed W
ith
Not
App
licab
le
Perc
enta
ge o
f eac
h Cr
op in
the
Mix
ed
Da
te o
f har
vest
(mon
th/y
ear)
Amou
nt o
f gre
en (f
resh
) mai
ze h
arve
sted
and
Stan
d:
Erst
ellt
von:
Se
ite 2
4
Desc
riptio
n of
Dat
a
Crop
Ent
erpr
ise C
ombi
natio
n M
aize
M
onoc
rop
Mai
ze M
ixed
Mai
ze
Crop
2
Crop
3
Crop
4
take
n of
f the
fiel
d (fr
esh
wei
ght)
.whe
elba
rrow
s/pi
ckup
van
s/ m
t/ c
obs,
othe
r, sp
ecify
) per
(he
ctar
e/ac
re/s
peci
fy)
Amou
nt o
f dry
mai
ze h
arve
sted
and
take
n of
f th
e fie
ld (f
resh
wei
ght).
whe
elba
rrow
s/pi
ckup
va
ns/ m
t/ c
obs,
othe
r, sp
ecify
) per
(h
ecta
re/a
cre/
spec
ify)
M
iner
al F
ertil
izer
Appl
ied
(Qua
ntity
in
kg)
NPK
Ure
a
Oth
er, s
peci
fy
Org
anic
Man
ure
Appl
ied
Qua
ntity
(Bag
s)
Co
st (N
aira
)
Type
(Pou
ltry/
Catt
le)
Pest
icid
e Ap
plie
d
Nam
e
Q
uant
ity
Uni
t
N
ame
Qua
ntity
U
nit
Nam
e
Q
uant
ity
Uni
t
Pl
ease
stat
e th
e m
etho
d of
pre
serv
atio
n in
st
orag
e of
mai
ze g
rain
s
Not
App
licab
le
Agro
chem
ical
use
d fo
r pre
serv
atio
n of
M
aize
gra
in
Nam
e N
ot A
pplic
able
Q
uant
ity p
er a
nnum
N
ot A
pplic
able
Co
st p
er u
nit
N
ot A
pplic
able
Mac
hine
ry U
sed
Nam
e
Ca
paci
ty
Type
(Pet
rol/D
iese
l)
Ho
urs o
f Wor
k on
Far
m
Type
of w
ork
Nam
e
Ca
paci
ty
Type
(Pet
rol/D
iese
l)
Ho
urs o
f Wor
k on
Far
m
Type
of w
ork
Nam
e
Ca
paci
ty
Type
(Pet
rol/D
iese
l)
Ho
urs o
f Wor
k on
Far
m
Type
of w
ork
Tran
spor
tatio
n Di
stan
ce (k
m)
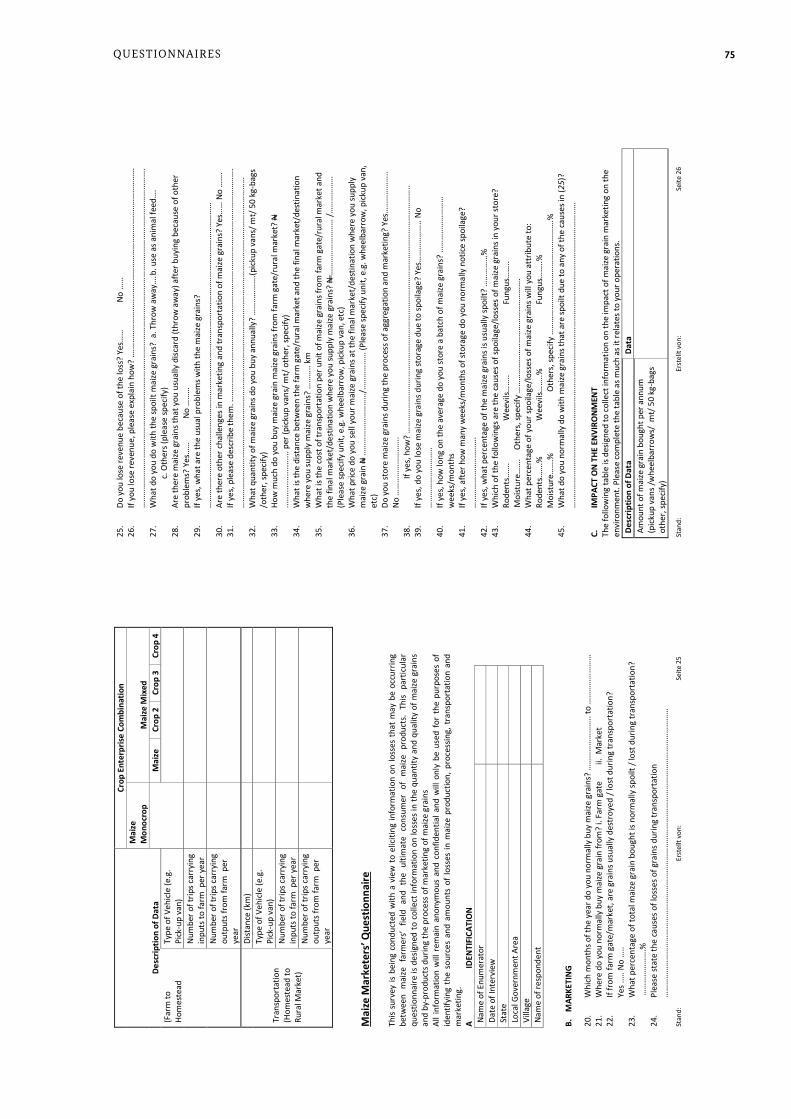
75QueSTioNNaireS
Stan
d:
Erst
ellt
von:
Se
ite 2
5
Desc
riptio
n of
Dat
a
Crop
Ent
erpr
ise C
ombi
natio
n M
aize
M
onoc
rop
Mai
ze M
ixed
Mai
ze
Crop
2
Crop
3
Crop
4
(Far
m to
Ho
mes
tead
Ty
pe o
f Veh
icle
(e.g
. Pi
ck-u
p va
n)
Num
ber o
f trip
s car
ryin
g in
puts
to fa
rm p
er y
ear
Num
ber o
f trip
s car
ryin
g ou
tput
s fro
m fa
rm p
er
year
Tran
spor
tatio
n (H
omes
tead
to
Rura
l Mar
ket)
Dist
ance
(km
)
Ty
pe o
f Veh
icle
(e.g
. Pi
ck-u
p va
n)
Num
ber o
f trip
s car
ryin
g in
puts
to fa
rm p
er y
ear
Num
ber o
f trip
s car
ryin
g ou
tput
s fro
m fa
rm p
er
year
M
aize
Mar
kete
rs’ Q
uest
ionn
aire
Th
is su
rvey
is b
eing
con
duct
ed w
ith a
vie
w t
o el
iciti
ng in
form
atio
n on
loss
es t
hat
may
be
occu
rrin
g be
twee
n m
aize
far
mer
s’ fie
ld a
nd t
he u
ltim
ate
cons
umer
of
mai
ze p
rodu
cts.
This
part
icul
ar
ques
tionn
aire
is d
esig
ned
to c
olle
ct in
form
atio
n on
loss
es in
the
quan
tity
and
qual
ity o
f mai
ze g
rain
s an
d by
-pro
duct
s dur
ing
the
proc
ess o
f mar
ketin
g of
mai
ze g
rain
s Al
l inf
orm
atio
n w
ill r
emai
n an
onym
ous
and
conf
iden
tial a
nd w
ill o
nly
be u
sed
for
the
purp
oses
of
iden
tifyi
ng t
he s
ourc
es a
nd a
mou
nts
of lo
sses
in m
aize
pro
duct
ion,
pro
cess
ing,
tra
nspo
rtat
ion
and
mar
ketin
g.
A
IDEN
TIFI
CATI
ON
Na
me
of E
num
erat
or
Da
te o
f Int
ervi
ew
St
ate
Lo
cal G
over
nmen
t Are
a
Villa
ge
Na
me
of re
spon
dent
B.M
ARKE
TIN
G
20.
Whi
ch m
onth
s of t
he y
ear d
o yo
u no
rmal
ly b
uy m
aize
gra
ins?
……
……
……
……
.. to
……
……
……
……
21
.W
here
do
you
norm
ally
buy
mai
ze g
rain
from
? i.
Farm
gat
e ii.
Mar
ket
22.
If fr
om fa
rm g
ate/
mar
ket,
are
grai
ns u
sual
ly d
estr
oyed
/ lo
st d
urin
g tr
ansp
orta
tion?
Yes .
.… N
o …
..
23.
Wha
t per
cent
age
of to
tal m
aize
gra
in b
ough
t is n
orm
ally
spoi
lt / l
ost d
urin
g tr
ansp
orta
tion?
……
……
……
….%
24
.Pl
ease
stat
e th
e ca
uses
of l
osse
s of g
rain
s dur
ing
tran
spor
tatio
n …
……
……
……
……
……
……
……
……
……
……
……
……
……
……
.……
……
……
……
……
……
……
……
…
Stan
d:
Erst
ellt
von:
Se
ite 2
6 25
.Do
you
lose
reve
nue
beca
use
of th
e lo
ss?
Yes…
…
No
……
26
.If
you
lose
reve
nue,
ple
ase
expl
ain
how
? .…
……
……
……
……
……
……
……
……
……
……
……
……
……
……
…
……
……
……
……
……
……
……
……
……
……
……
……
……
……
……
……
……
……
……
……
……
……
……
……
……
……
……
. 27
.W
hat d
o yo
u do
with
the
spoi
lt m
aize
gra
ins?
a. T
hrow
aw
ay…
. b. u
se a
s ani
mal
feed
….
c.
Oth
ers (
plea
se sp
ecify
)
28.
Are
ther
e m
aize
gra
ins t
hat y
ou u
sual
ly d
iscar
d (th
row
aw
ay) a
fter
buy
ing
beca
use
of o
ther
pr
oble
ms?
Yes
……
N
o …
……
29
.If
yes,
wha
t are
the
usua
l pro
blem
s with
the
mai
ze g
rain
s?
……
……
……
……
……
……
……
……
……
……
……
……
……
……
……
……
……
……
……
……
……
……
……
……
…
30.
Are
ther
e ot
her c
halle
nges
in m
arke
ting
and
tran
spor
tatio
n of
mai
ze g
rain
s? Y
es…
… N
o …
….
31.
If ye
s, pl
ease
des
crib
e th
em. …
……
……
……
……
……
……
……
……
……
……
……
……
……
……
……
……
……
……
. …
……
……
……
……
……
……
……
……
……
……
……
……
……
……
……
……
……
……
……
……
……
……
……
……
……
……
32
.W
hat q
uant
ity o
f mai
ze g
rain
s do
you
buy
annu
ally
? …
……
……
….(p
icku
p va
ns/ m
t/ 5
0 kg
-bag
s /o
ther
, spe
cify
) 33
.Ho
w m
uch
do y
ou b
uy m
aize
gra
in m
aize
gra
ins f
rom
farm
gat
e/ru
ral m
arke
t? N
...
......
......
......
.... p
er (p
icku
p va
ns/ m
t/ o
ther
, spe
cify
) 34
.W
hat i
s the
dist
ance
bet
wee
n th
e fa
rm g
ate/
rura
l mar
ket a
nd th
e fin
al m
arke
t/de
stin
atio
n w
here
you
supp
ly m
aize
gra
ins?
……
…..
km
35.
Wha
t is t
he c
ost o
f tra
nspo
rtat
ion
per u
nit o
f mai
ze g
rain
s fro
m fa
rm g
ate/
rura
l mar
ket a
nd
the
final
mar
ket/
dest
inat
ion
whe
re y
ou su
pply
mai
ze g
rain
s? N
……
……
……
……
… /…
……
……
…
(Ple
ase
spec
ify u
nit,
e.g.
whe
elba
rrow
, pick
up v
an, e
tc)
36.
Wha
t pric
e do
you
sell
your
mai
ze g
rain
s at t
he fi
nal m
arke
t/de
stin
atio
n w
here
you
supp
ly
mai
ze g
rain
N …
……
……
……
……
…/…
……
……
… (P
leas
e sp
ecify
uni
t, e.
g. w
heel
barr
ow, p
icku
p va
n,
etc)
37
.Do
you
stor
e m
aize
gra
ins d
urin
g th
e pr
oces
s of a
ggre
gatio
n an
d m
arke
ting?
Yes
……
……
……
.. N
o …
……
……
……
……
. 38
.
If ye
s, ho
w?
……
……
……
……
……
……
……
……
……
……
……
……
……
……
……
……
……
……
……
…..
39.
If ye
s, do
you
lose
mai
ze g
rain
s dur
ing
stor
age
due
to sp
oila
ge?
Yes…
……
……
…..
No
……
……
……
……
…..
40.
If ye
s, ho
w lo
ng o
n th
e av
erag
e do
you
stor
e a
batc
h of
mai
ze g
rain
s? …
……
……
……
……
w
eeks
/mon
ths
41.
If ye
s, af
ter h
ow m
any
wee
ks/m
onth
s of s
tora
ge d
o yo
u no
rmal
ly n
otice
spoi
lage
? …
……
……
……
……
……
. 42
.If
yes,
wha
t per
cent
age
of th
e m
aize
gra
ins i
s usu
ally
spoi
lt? …
……
……
%
43.
Whi
ch o
f the
follo
win
gs a
re th
e ca
uses
of s
poila
ge/lo
sses
of m
aize
gra
ins i
n yo
ur st
ore?
Rode
nts…
….
W
eevi
ls……
..
Fu
ngus
……
..
M
oist
ure…
….
Oth
ers,
spec
ify …
……
……
……
……
……
……
……
……
….
44.
Wha
t per
cent
age
of y
our s
poila
ge/lo
sses
of m
aize
gra
ins w
ill y
ou a
ttrib
ute
to:
Rode
nts…
….%
Wee
vils…
…..%
Fu
ngus
……
..%
Moi
stur
e……
.%
O
ther
s, sp
ecify
……
……
……
……
……
……
……
……
……
.%
45.
Wha
t do
you
norm
ally
do
with
mai
ze g
rain
s tha
t are
spoi
lt du
e to
any
of t
he c
ause
s in
(25)
? …
……
……
……
……
……
……
……
……
……
……
……
……
……
……
……
……
……
……
……
……
……
……
……
……
C.
IM
PACT
ON
THE
EN
VIRO
NM
ENT
The
follo
win
g ta
ble
is de
signe
d to
col
lect
info
rmat
ion
on th
e im
pact
of m
aize
gra
in m
arke
ting
on th
e en
viro
nmen
t. Pl
ease
com
plet
e th
e ta
ble
as m
uch
as it
rela
tes t
o yo
ur o
pera
tions
. De
scrip
tion
of D
ata
Data
Am
ount
of m
aize
gra
in b
ough
t per
ann
um
(pic
kup
vans
/whe
elba
rrow
s/ m
t/ 5
0 kg
-bag
s ot
her,
spec
ify)
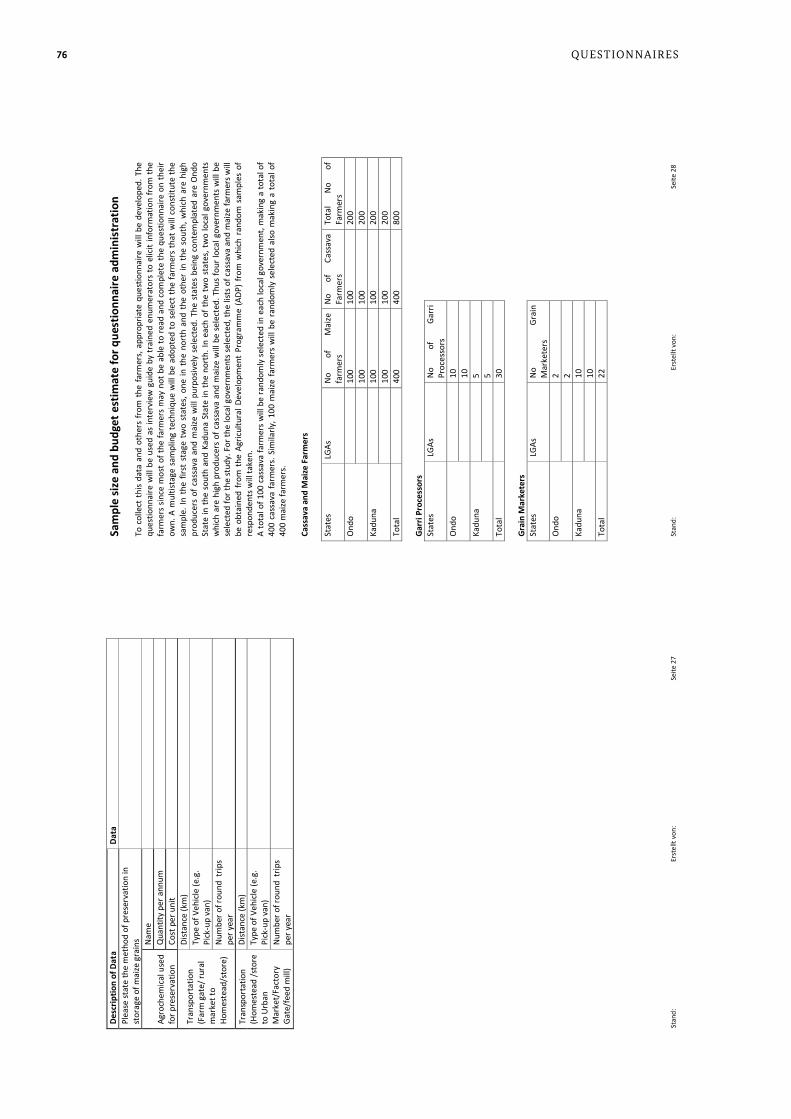
76 QueSTioNNaireS
Stan
d:
Erst
ellt
von:
Se
ite 2
7 De
scrip
tion
of D
ata
Data
Pl
ease
stat
e th
e m
etho
d of
pre
serv
atio
n in
st
orag
e of
mai
ze g
rain
s
Agro
chem
ical
use
d fo
r pre
serv
atio
n
Nam
e Q
uant
ity p
er a
nnum
Cost
per
uni
t
Tran
spor
tatio
n (F
arm
gat
e/ ru
ral
mar
ket t
o Ho
mes
tead
/sto
re)
Dist
ance
(km
)
Type
of V
ehic
le (e
.g.
Pick
-up
van)
Num
ber o
f rou
nd t
rips
per y
ear
Tr
ansp
orta
tion
(Hom
este
ad /s
tore
to
Urb
an
Mar
ket/
Fact
ory
Gate
/fee
d m
ill)
Dist
ance
(km
)
Type
of V
ehic
le (e
.g.
Pick
-up
van)
Num
ber o
f rou
nd t
rips
per y
ear
Stan
d:
Erst
ellt
von:
Se
ite 2
8 Sa
mpl
e si
ze a
nd b
udge
t est
imat
e fo
r que
stio
nnai
re a
dmin
istr
atio
n To
col
lect
thi
s da
ta a
nd o
ther
s fr
om t
he fa
rmer
s, ap
prop
riate
que
stio
nnai
re w
ill b
e de
velo
ped.
The
qu
estio
nnai
re w
ill b
e us
ed a
s in
terv
iew
gui
de b
y tr
aine
d en
umer
ator
s to
elic
it in
form
atio
n fr
om th
e fa
rmer
s sin
ce m
ost o
f the
farm
ers
may
not
be
able
to re
ad a
nd c
ompl
ete
the
ques
tionn
aire
on
thei
r ow
n. A
mul
tista
ge s
ampl
ing
tech
niqu
e w
ill b
e ad
opte
d to
sel
ect t
he fa
rmer
s th
at w
ill c
onst
itute
the
sam
ple.
In t
he f
irst
stag
e tw
o st
ates
, one
in t
he n
orth
and
the
oth
er in
the
sou
th, w
hich
are
hig
h pr
oduc
ers
of c
assa
va a
nd m
aize
will
pur
posiv
ely
sele
cted
. The
sta
tes
bein
g co
ntem
plat
ed a
re O
ndo
Stat
e in
the
sou
th a
nd K
adun
a St
ate
in th
e no
rth.
In e
ach
of th
e tw
o st
ates
, tw
o lo
cal g
over
nmen
ts
whi
ch a
re h
igh
prod
ucer
s of
cas
sava
and
mai
ze w
ill b
e se
lect
ed. T
hus
four
loca
l gov
ernm
ents
will
be
sele
cted
for t
he st
udy.
For
the
loca
l gov
ernm
ents
sele
cted
, the
list
s of c
assa
va a
nd m
aize
farm
ers w
ill
be o
btai
ned
from
the
Agr
icultu
ral D
evel
opm
ent
Prog
r am
me
(ADP
) fr
om w
hich
ran
dom
sam
ples
of
resp
onde
nts w
ill ta
ken.
A
tota
l of 1
00 c
assa
va fa
rmer
s w
ill b
e ra
ndom
ly s
elec
ted
in e
ach
loca
l gov
ernm
ent,
mak
ing
a to
tal o
f 40
0 ca
ssav
a fa
rmer
s. Si
mila
rly, 1
00 m
aize
farm
ers
will
be
rand
omly
sel
ecte
d al
so m
akin
g a
tota
l of
400
mai
ze fa
rmer
s. Ca
ssav
a an
d M
aize
Far
mer
s
Stat
es
LGAs
N
o of
M
aize
fa
rmer
s N
o of
Ca
ssav
a Fa
rmer
s To
tal
No
of
Farm
ers
Ond
o
100
100
200
10
0 10
0 20
0 Ka
duna
100
100
200
10
0 10
0 20
0 To
tal
40
0 40
0 80
0 Ga
rri P
roce
ssor
s St
ates
LG
As
No
of
Garr
i Pr
oces
sors
O
ndo
10
10
Kadu
na
5
5
Tota
l
30
Grai
n M
arke
ters
St
ates
LG
As
No
Grai
n M
arke
ters
O
ndo
2
2
Kadu
na
10
10
Tota
l
22
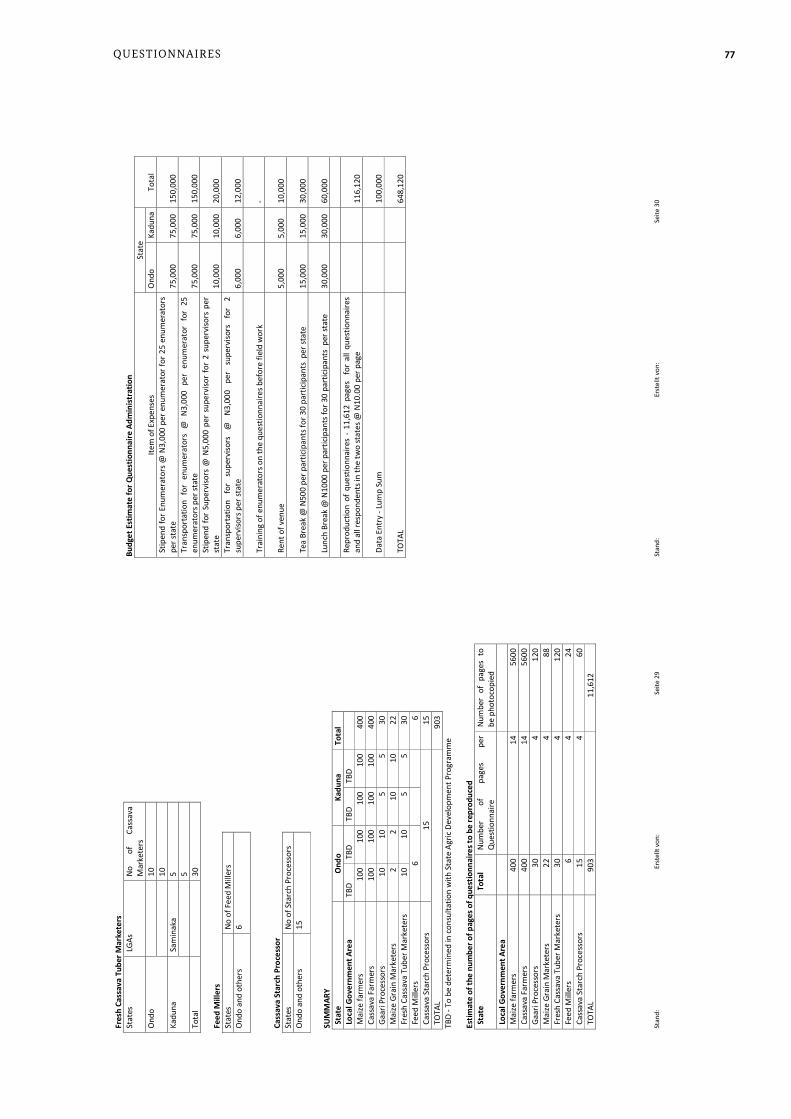
77QueSTioNNaireS
Stan
d:
Erst
ellt
von:
Se
ite 2
9 Fr
esh
Cass
ava
Tube
r Mar
kete
rs
Stat
es
LGAs
N
o of
Ca
ssav
a M
arke
ters
O
ndo
10
10
Kadu
na
Sam
inak
a 5
5
Tota
l
30
Feed
Mill
ers
Stat
es
No o
f Fee
d M
iller
s O
ndo
and
othe
rs
6
Cass
ava
Star
ch P
roce
ssor
St
ates
No
of S
tarc
h Pr
oces
sors
O
ndo
and
othe
rs
15
SUM
MAR
Y St
ate
Ond
o Ka
duna
To
tal
Loca
l Gov
ernm
ent A
rea
TBD
TBD
TBD
TBD
M
aize
farm
ers
100
100
100
100
400
Cass
ava
Farm
ers
100
100
100
100
400
Gaar
i Pro
cess
ors
10
10
5 5
30
Mai
ze G
rain
Mar
kete
rs
2 2
10
10
22
Fres
h Ca
ssav
a Tu
ber M
arke
ters
10
10
5
5 30
Fe
ed M
iller
s 6
6 Ca
ssav
a St
arch
Pro
cess
ors
15
15
TOTA
L 90
3 TB
D - T
o be
det
erm
ined
in c
onsu
ltatio
n w
ith S
tate
Agr
ic D
evel
opm
ent P
rogr
amm
e Es
timat
e of
the
num
ber o
f pag
es o
f que
stio
nnai
res t
o be
repr
oduc
ed
Stat
e To
tal
Num
ber
of
page
s pe
r Q
uest
ionn
aire
Nu
mbe
r of
pag
es t
o be
pho
toco
pied
Lo
cal G
over
nmen
t Are
a
Mai
ze fa
rmer
s 40
0 14
56
00
Cass
ava
Farm
ers
400
14
5600
Ga
ari P
roce
ssor
s 30
4
120
Mai
ze G
rain
Mar
kete
rs
22
4 88
Fr
esh
Cass
ava
Tube
r Mar
kete
rs
30
4 12
0 Fe
ed M
iller
s 6
4 24
Ca
ssav
a St
arch
Pro
cess
ors
15
4 60
TO
TAL
903
11,6
12
Stan
d:
Erst
ellt
von:
Se
ite 3
0 Bu
dget
Est
imat
e fo
r Que
stio
nnai
re A
dmin
istra
tion
Item
of E
xpen
ses
Stat
e To
tal
Ond
o Ka
duna
St
ipen
d fo
r Enu
mer
ator
s @ N
3,00
0 pe
r enu
mer
ator
for 2
5 en
umer
ator
s pe
r sta
te
75,0
00
75,0
00
150,
000
Tr
ansp
orta
tion
for
enum
erat
ors
@ N
3,00
0 pe
r en
umer
ator
for
25
enum
erat
ors p
er st
ate
75,0
00
75,0
00
150,
000
St
ipen
d fo
r Su
perv
isors
@ N
5,00
0 pe
r su
perv
isor
for
2 su
perv
isors
per
st
ate
10,0
00
10,0
00
20
,000
Tr
ansp
orta
tion
for
supe
rviso
rs
@
N3,0
00
per
supe
rvis
ors
for
2 su
perv
isors
per
stat
e
6,
000
6,
000
12,0
00
Trai
ning
of e
num
erat
ors o
n th
e qu
estio
nnai
res b
efor
e fie
ld w
ork
-
Rent
of v
enue
5,
000
5,
000
10,0
00
Tea
Brea
k @
N50
0 pe
r par
ticip
ants
for 3
0 pa
rtic
ipan
ts p
er st
ate
15,0
00
15,0
00
30
,000
Lunc
h Br
eak
@ N
1000
per
par
ticip
ants
for 3
0 pa
rtic
ipan
ts p
er st
ate
30,0
00
30,0
00
60
,000
Re
prod
uctio
n of
que
stio
nnai
res
- 11
,612
pag
es
for
all q
uest
ionn
aire
s an
d al
l res
pond
ents
in th
e tw
o st
ates
@ N
10.0
0 pe
r pag
e
11
6,12
0
Data
Ent
ry -
Lum
p Su
m
100,
000
TOTA
L
64
8,12
0

78 NoTeS
Notes

79

Published byDeutsche Gesellschaft für Internationale Zusammenarbeit (GIZ) GmbH
Registered officesBonn and Eschborn,Germany Sector project Sustainable Agriculture Dag-Hammarskjöld-Weg 1-5 65760 EschbornGermany Tel. +49 (0) 6196 79 - 0Fax +49 (0) 6196 79 - 1115 [email protected]/nachhaltige-landwirtschaft
AuthorDr. Adegboyega Eyitayo Oguntade, Department of Agricultural & Resource Economics, Federal University of Technology, Akure, Nigeria. Design and layoutJeanette Geppert, Frankfurt
Printed byTop Kopie GmbH, Frankfurt Printed on FSC-certified paper
Photo creditsFront page © Alida Vanni, istockphoto Other photos © Dr. Adegboyega Eyitayo Oguntade
As atJune 2013
GIZ is responsible for the content of this publication.
On behalf ofGerman Federal Ministry for Economic Cooperation and Development (BMZ);Division Rural Development, Agriculture and Food Security
Addresses of the BMZ officesBMZ Bonn BMZ BerlinDahlmannstraße 4 Stresemannstraße 94 53113 Bonn 10963 BerlinGermany GermanyTel. +49 (0) 228 99 535 - 0 Tel. +49 (0) 30 18 535 - 0 Fax +49 (0) 228 99 535 - 3500 Fax +49 (0) 30 18 535 - 2501