Food Innovation Trend & Beverage Market: Size and Growth by Segment, Global, 2014-2015 Speciality...
56
1 Food Innovation Trend –In collaboration with Intesa Sanpaolo Innovation Center– August 2016
Transcript of Food Innovation Trend & Beverage Market: Size and Growth by Segment, Global, 2014-2015 Speciality...

1
Food Innovation Trend–In collaboration with Intesa Sanpaolo Innovation Center–
August 2016

2
Context and Headlines (1/4)
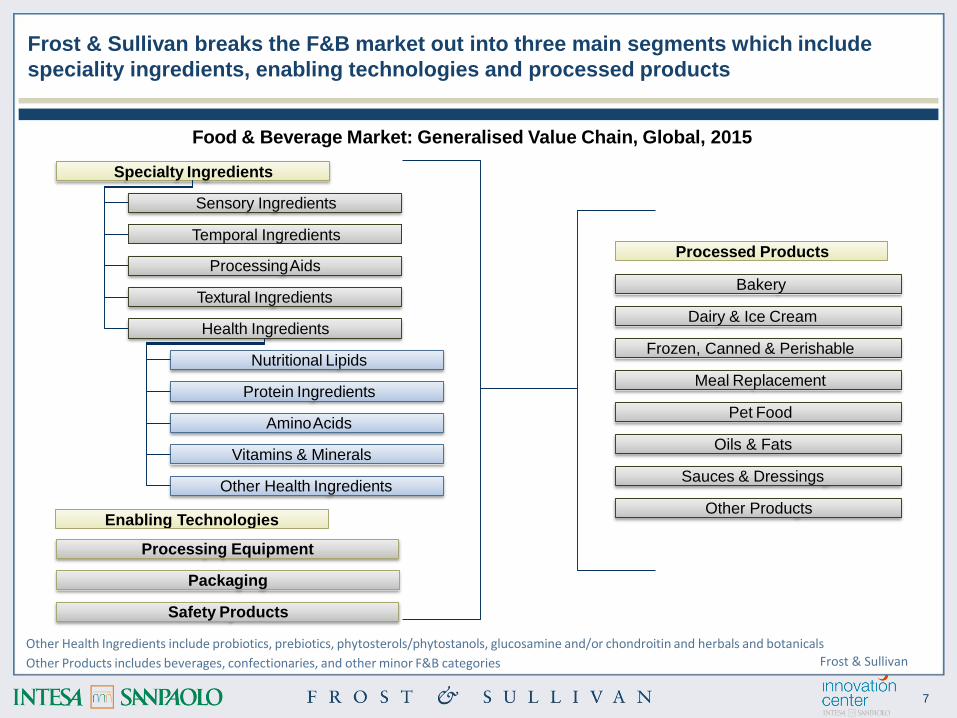
• Frost & Sullivan breaks the Food & Beverage market out into three main segments which include
speciality ingredients, enabling technologies and processed products. In terms of their potential, health
ingredients and safety products are the two most attractive elements of the value chain with growth
rates of 8.5% and 7.5% (2014-2020) respectively
1. Health Ingredients: a) Proteins
• The protein ingredients for human nutrition market can be segmented according the feedstock from
which the proteins stem, with plant proteins representing 24% and animal 76% of the total in unit terms
in 2014. Globally, the market was valued at $28.37 billion in 2014 and will expand to reach $42.99
billion by 2020, a 7.2% CAGR
• End-users’ focus on health and fitness is driving demand for functional foods, meat analogues, sports
nutrition and subsequently proteins
• Overall, the supply side is highly fragmented with backwards vertical integration one of the key
characteristics that distinguishes top participants from smaller and emerging players in the space.
Nonetheless, there are leaders in specific product categories – Fronterra notably has a strong
presence in animal proteins and Cargill is similarly positioned on the plant side owing to its global
reach and access to raw materials
• Protein ingredients find their main application in foods & beverages but sports nutrition is a pillar of
growth and medical nutrition is emerging
• From a feedstock point of view, egg, soy, and dairy will continue to dominate the market, but novel
ingredient sources like algae and pea have been shaking up the space in recent years Frost & Sullivan

3
Context and Headlines (2/4)
o Whole Algae Protein in the US is an example of an young company which is developing innovative
algae-based “Alga Via” protein solutions
o Globally, 8.98 million MT of peas are produced annually but, once they have been cleaned, dried,
de-hulled, milled, fractionated and purified, this translates into 20.70 thousand MT of pea protein
ingredients. The rising demand for pea protein in existing and new food applications (e.g. medical
foods) will sustain utilization rates of around 90%
o The pea protein value chain is similar to that of other plant-based proteins with the main
stakeholders specialised in storage and processing. There is significant vertical integration between
pea processors, elevators and traders/brokers
o Frost & Sullivan finds that 67% of pea protein is retained from a milled pea in the final concentrate
form, amounting to a 29% price mark-up
1. Health Ingredients: b) Omega-3
• The Omega-3 ingredients market can be segmented according the source from which the fatty acids
stem, with microalgae oils representing 35%. Globally, the omega-3 market was valued at $1.83 billion
in 2014 and will expand to reach $2.88 billion by 2025, a 4.2% CAGR
• An increase in the number of reported health benefits backed by scientific findings is driving the
adoption of omega-3 but concerns about the sustainability and quality of the ingredients as well as
price volatility remain an issue
• Regulations governing omega-3 ingredients intended for human consumption are stringent and vary
across countriesFrost & Sullivan

4
Context and Headlines (3/4)
• The global omega-3 ingredients market is moderately competitive, but has areas of concentration
depending on the end-market application. Overall, the top 3 tier I companies, DSM, BASF and Wuxi
Xunda, account for 52% of the global market and consolidation is expected to continue
• From an application perspective, dietary supplements lead in terms of volume and revenue, but the
pet food industry is expected to grow at a CAGR of 5.3% due to the rapid and continued growth in pet
ownership across the globe
• On the technology side, US firm Ocean Omega has developed a micro-emulsion solution which
makes omega-3 available to fortify functional beverages. Sweden-based Simiris is working to farm
algae with a view to providing a safe and environmentally friendly alternative to the omega-3 oils
extracts which typically stem from wild fatty fish
2. Safety Products
• Globally, the food safety market was valued at $20.50 billion in 2015 and will expand to reach $29.73
billion by 2025, with double digit growth expected in the software, test kits & consumables and
systems & equipment categories
• The market is expanding rapidly due to a combination of macro and micro factors on the demand
and supply side with regulation is creating challenges but also opportunities to transform the way in
which food safety is managed from a technology perspective
• Digital transformation in the sector is rooted in sustainable industry trends with particular progress
being made on leveraging electronic traceability, cloud-based and automation & robotics solutions
Frost & Sullivan

5
Context and Headlines (4/4)
3. Medical Foods
• Medical foods fall between pharmaceuticals and nutraceuticals and can be segmented into
prescription and non-prescription products. Globally, the medical foods market was valued at $9.36
billion in 2013 and will expand to reach $13.34 billion by 2018, a 7.3% CAGR
• Despite the robust growth and presence of strong underlying drivers, up-take of medical foods
faces supply and demand side challenges. Medical foods are notably tightly regulated, by the Food
and Drug Administration in the US and a European Commission Directive in the EU
• From a competitive point of view, the market is highly concentrated with Abbot, Nestle and Danone
leading the way in APAC and globally
• Diabetes, oncology and metabolic health are the most significant application areas, while immune and
cardiovascular promise high growth
Frost & Sullivan

6
Introduction
7
Frost & Sullivan breaks the F&B market out into three main segments which include
speciality ingredients, enabling technologies and processed products
Health Ingredients
Specialty Ingredients
ProcessingAids
Textural Ingredients
Other Health Ingredients
AminoAcids
Nutritional Lipids
Vitamins & Minerals
Protein Ingredients
Processing Equipment
Packaging
Safety Products
Meal Replacement
Pet Food
Oils & Fats
Sauces & Dressings
Bakery
Dairy & Ice Cream
Frozen, Canned & Perishable
Other Products
Other Health Ingredients include probiotics, prebiotics, phytosterols/phytostanols, glucosamine and/or chondroitin and herbals and botanicals
Other Products includes beverages, confectionaries, and other minor F&B categories
Food & Beverage Market: Generalised Value Chain, Global, 2015
Temporal Ingredients
Sensory Ingredients
Enabling Technologies
Processed Products
Frost & Sullivan

8
In terms of their growth potential, health ingredients and safety products are the two
most attractive elements of the value chain
9.0%
8.0%
7.0%
6.0%
5.0%
4.0%
3.0%
2.0%
1.0%
0.0%0.0 50.0 100.0 350.0
An
nu
al
Gro
wth
(20
14
–2015)
Safety
Products
Specialty
Ingredients
Packaging
150.0 200.0 250.0 300.0
All figures are rounded. Base year = 2014
Health
Ingredients
Food & Beverage Market: Size and Growth by Segment, Global, 2014-2015
Speciality Ingredients includes Health Ingredients
Processing
Equipment
Market Size, 2015 ($ Billion)
Frost & Sullivan
9
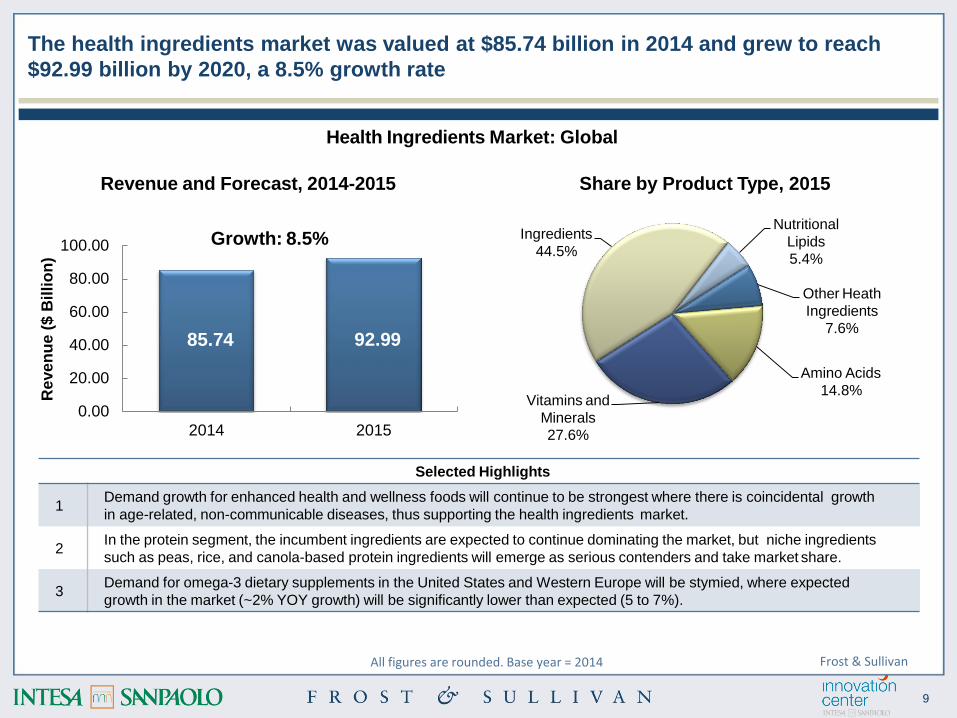
The health ingredients market was valued at $85.74 billion in 2014 and grew to reach
$92.99 billion by 2020, a 8.5% growth rate
Selected Highlights
1Demand growth for enhanced health and wellness foods will continue to be strongest where there is coincidental growth
in age-related, non-communicable diseases, thus supporting the health ingredients market.
2In the protein segment, the incumbent ingredients are expected to continue dominating the market, but niche ingredients
such as peas, rice, and canola-based protein ingredients will emerge as serious contenders and take market share.
3Demand for omega-3 dietary supplements in the United States and Western Europe will be stymied, where expected
growth in the market (~2% YOY growth) will be significantly lower than expected (5 to 7%).
Revenue and Forecast, 2014-2015
Growth: 8.5%
85.74 92.99
0.00
20.00
40.00
60.00
80.00
100.00
2014 2015
Re
ve
nu
e($
Bil
lio
n)
Nutritional
Lipids
5.4%
Other Heath
Ingredients
7.6%
Amino Acids
14.8%Vitamins and
Minerals
27.6%
Ingredients
44.5%
All figures are rounded. Base year = 2014
Health Ingredients Market: Global
Share by Product Type, 2015
Frost & Sullivan

10
The safety products market was valued at $15.53 billion in 2014 and grew to reach $16.69
billion by 2020, a 7.5% growth rate
Selected Highlights
1 Increasing demand for verifiable and assured food safety is growing worldwide.
2Disinfection equipment and food safety testing products are expected to see the greatest growth in demand through 2015
and 2016, relative to the other segments in this market.
3 On average, there are about 30 recalls per week in the United States in 2015.
Revenue and Forecast, 2014-2015
All figures are rounded. Base year = 2014
Safety Products Market: Global
Share by Product Type, 2015
15.53 16.6910.00
15.00
20.00
5.00
0.002014 2015
Re
ve
nu
e($
Bil
lio
n)
Growth: 7.5%PPE35%
Disenfect’ &
SanitiserChemicals
24%
Disenfect’ Equipment
10%
Safety Software
8%
Others23%
Frost & Sullivan
11
1. Health ingredients

12
Proteins
13
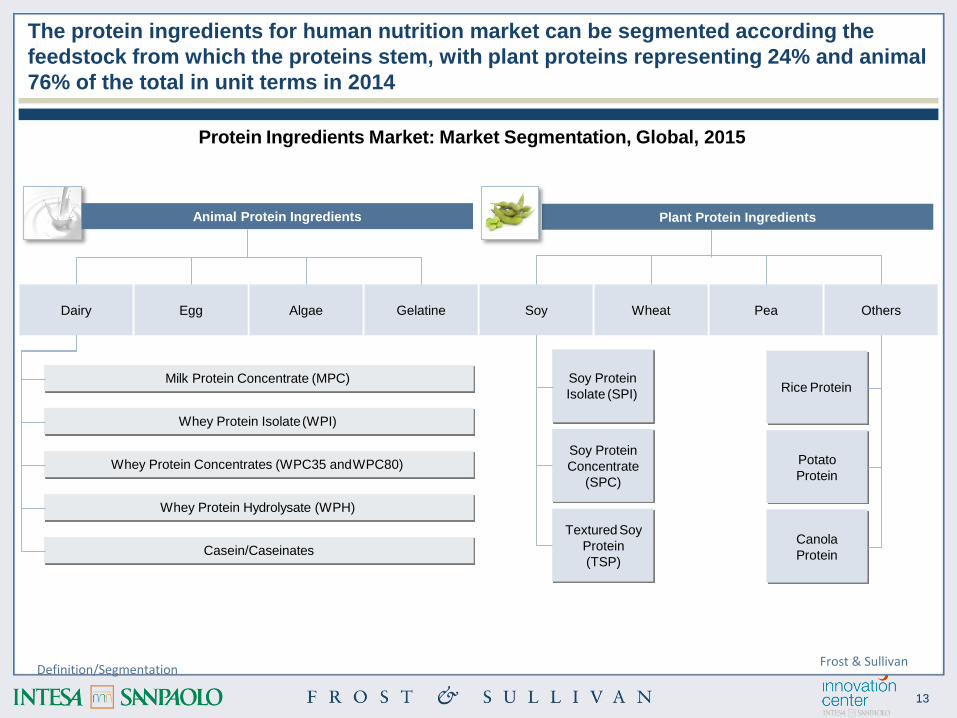
The protein ingredients for human nutrition market can be segmented according the
feedstock from which the proteins stem, with plant proteins representing 24% and animal
76% of the total in unit terms in 2014
Definition/Segmentation
Protein Ingredients Market: Market Segmentation, Global, 2015
Plant Protein Ingredients
Rice Protein
Potato
Protein
Canola
Protein
Soy Protein
Isolate (SPI)
Soy Protein
Concentrate
(SPC)
Textured Soy
Protein
(TSP)
Milk Protein Concentrate (MPC)
Whey Protein Isolate(WPI)
Whey Protein Concentrates (WPC35 andWPC80)
Whey Protein Hydrolysate (WPH)
Casein/Caseinates
Dairy Egg Algae Gelatine Soy Wheat Pea Others
Animal Protein Ingredients
Frost & Sullivan

14
Globally, the protein ingredients market was valued at $28.37 billion in 2014 and will
expand to reach $42.99 billion by 2020, a 7.2% CAGR
Market Analysis & ForecastAll figures are rounded. Base year = 2014
Protein Ingredients Market: Revenue Forecast, Global, 2014-2020
0.00
45.00
40.00
35.00
30.00
25.00
20.00
15.00
10.00
5.00
50.00
Plant Protein
2014
6.82
2015
7.25
2016
7.72
2017
8.21
2018
8.77
2019
9.38
2020
10.04
CAGR
(2014–2020)
6.7%
Animal Protein 21.55 22.96 24.52 26.27 28.24 30.45 32.95 7.3%
Reve
nu
e($
Bil
lio
n)
Frost & Sullivan

15
Drivers Short Mid Long
Rising End-user Focus on Health and Fitness Drive Protein Fortification of Foods H H H
Growing Demand for Functional Foods and Protein Supplements H H H
Increasing Shift Toward Vegetarianism Drives Market Growth for Meat Analogues M H H
Flourishing Sports Nutrition Market Drives Growth in the Proteins Market M M M
End-users’ focus on health and fitness is driving demand for functional foods, meat
analogues, sports nutrition and subsequently proteins
Market Trends
Protein Ingredients Market: Key Market Drivers and Restraints, North America, 2015–2020
Restraints Short Mid Long
Growth of Freedom Food Restrains the Wheat Gluten Market H H H
Concerns Over Animal and Bird Diseases Restrain Growth of Animal Proteins M M M
Flavour Challenges With High Protein Content Restrain Volume Usage of Proteins M M M
Anti-GMO Activism Restrain Growth of Plant Proteins L L L
Frost & Sullivan

16
Overall, the protein ingredients market is highly fragmented with backwards vertical
integration one of the key characteristics that distinguishes top participants from smaller
and emerging players in the space
Key Players & Forecast
Protein Ingredients Market: Competitive Structure, Global, 2015
Number of Companies in the Market >100
Competitive Factors
Product innovations, supply chain efficiency, application
diversity, multi-product presence, supply security, monitoring
consumer trends
Key End-user Groups Dairy, baked goods, processed food (dry goods), beverages
Major Market Participants
(selected)
ADM, Arla Foods, Cargill, DuPont/Solae, Fonterra, Friesland
Campina, Glanbia Nutritionals, Hilmar Ingredients, Kerry
Ingredients, Roquette, Solbar Ingredients
Market Share of Top 3 Competitors >30% in revenue terms
Emerging Market Participants
(selected)
Arnhem Group, Ballas Egg Products, California Natural
Products, Delta Protein, Erie Foods International, Marron
Foods, MGP Ingredients, World Food Processing
Frost & Sullivan

17
Nonetheless, there are leaders in specific productcategories; Fronterra notably has a
strong presence in animal proteins and Cargill is similarly positioned on the plant side
owing to their global reach and access to raw materials
Key Players & Forecast
Protein Ingredients Market: Competitive Structure, Global, 2015
Animal
Dairy
Whey Protein
Bongards' Creameries, Davisco, Fonterra, Glanbia, Hilmar Cheese,
Leprino Foods Company, Protient
Milk Protein ConcentrateDavisco, Erie Foods, Fonterra, Glanbia, Idaho Food Products, Kerry
Group
Casein and Caseinates Arla Foods, DMV International, Fonterra, Glanbia, Kerry Group
Egg ProteinBallas Egg Products, Henningsen Foods, Michael Foods, Moark, Rose
Acre Farms, Sonstegard Foods
Algae Proteins Aurora Algae, Solazyme (Algavia)
Gelatin Gelita, Kraft Foods, PB Leiner, Rousselo, Nitta
Plant
Soy Protein Archer Daniels, Cargill, Dupont (Solae)
Wheat GlutenArcher Daniels, Cargill, Manildra Group, MGP Ingredients, Roquette,
Syral, White Energy
Pea ProteinAxiom Foods, Burcon Nutrascience, Farbest Brands, Nutri-Pea,
Roquette Frères,
Others Rice and Canola Protein Axiom Foods, Burcon Nutrascience, BioExx
Frost & Sullivan
18
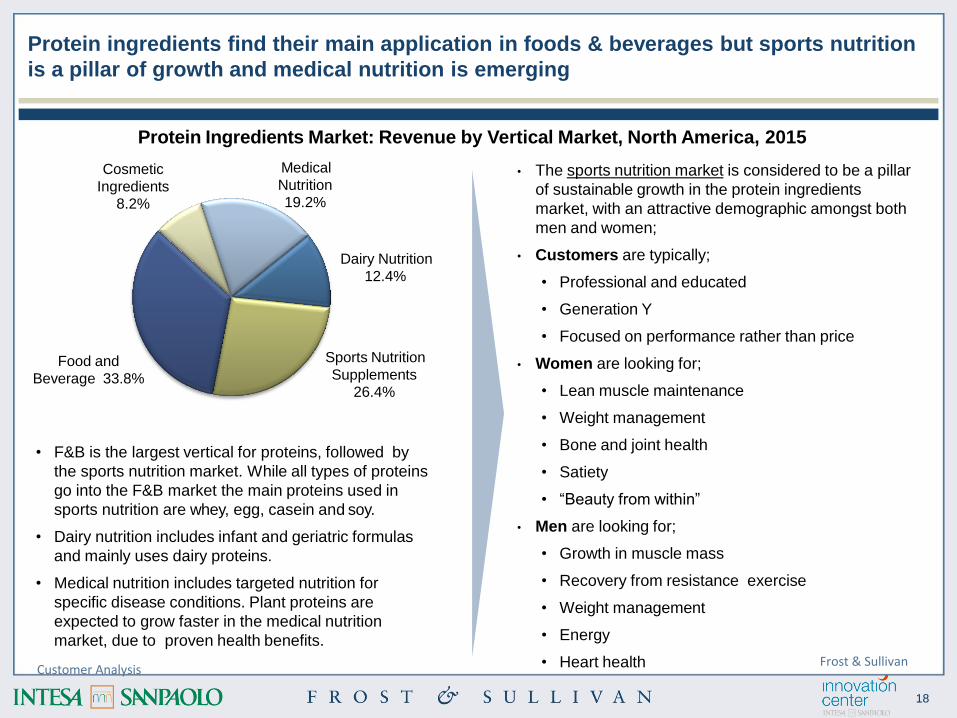
Protein ingredients find their main application in foods & beverages but sports nutrition
is a pillar of growth and medical nutrition is emerging
• The sports nutrition market is considered to be a pillar
of sustainable growth in the protein ingredients
market, with an attractive demographic amongst both
men and women;
• Customers are typically;
• Professional and educated
• Generation Y
• Focused on performance rather than price
• Women are looking for;
• Lean muscle maintenance
• Weight management
• Bone and joint health
• Satiety
• “Beauty from within”
• Men are looking for;
• Growth in muscle mass
• Recovery from resistance exercise
• Weight management
• Energy
• Heart health
Medical
Nutrition
19.2%
Cosmetic
Ingredients
8.2%
• F&B is the largest vertical for proteins, followed by
the sports nutrition market. While all types of proteins
go into the F&B market the main proteins used in
sports nutrition are whey, egg, casein and soy.
• Dairy nutrition includes infant and geriatric formulas
and mainly uses dairy proteins.
• Medical nutrition includes targeted nutrition for
specific disease conditions. Plant proteins are
expected to grow faster in the medical nutrition
market, due to proven health benefits.
Dairy Nutrition
12.4%
Sports Nutrition
Supplements
26.4%
Food and
Beverage 33.8%
Protein Ingredients Market: Revenue by Vertical Market, North America, 2015
Customer AnalysisFrost & Sullivan

19
From a feedstock point of view, egg, soy, and dairy will continue to dominate the
market, but novel ingredient sources like algae and pea have been shaking up the space
in recent years with growth in excess of 24% and 13%
Technology
30%
25%
20%
15%
10%
5%
0%0
2,000
4,000
6,000
8,000
Revenue CAGR
Reven
ue
($M
illio
n)
CA
GR
,2014–2020
(%)
0
5
10
15
20
10,000 25
Protein Ingredients Market: Revenue Forecast for Selected Proteins, Global, 2014-2020
All figures are rounded. Base year = 2014 Frost & Sullivan

20
Whole Algae Protein in the US is an example of an young company which is developing
innovative algae-based “Alga Via” protein solutions
Problem Statement
Innovation Attributes
Technology Profile
The production of animal protein is unsustainable at its current
rate due to a global population rise and the livestock farming
industry’s negative effects on the environment and public health.
The rising demand for alternative protein strongly influences
market shift from animal sources.
Consumers demand for vegan, non-allergenic, and non-
genetically modified (non-GM) sources of protein, which animal-
based protein could not fulfill.
Market Applications
Future Outlook
Algae cell wall helps limit protein interaction with other
ingredients, allowing easier formulation
Consists of 65% protein and is gluten-free
Contains high amino acids, lipids, fiber and micronutrients such
as lutein and zeaxanthin
Able to reduce fat and calorie content in formulations
Maintain favorable and delicious, nutty taste
Enhanced taste and texture, easily digestible
Indifferent tasting variant (developed through drying process
modification)
No beverage stabilizer is needed, allow fortifications
Steady in various temperatures and pH conditions
No formation of grittiness or extra viscosity on end products
Cater to a wide range of food preparations due to the oil, fiber
content, and micronized particles - a multifunctional food
ingredient
Highly adaptive to industrial applications
Target markets are the beverage industry, sports nutrition, and
sauce, snack, bread, and cereal products
Looking toward products that could enhance or replace
emulsifiers, fats, oils, polysaccharides, and oligosaccharides
Development of light-colored protein powder to improve end-
product physical appearance
In the production process, a native strain of the microalgae is thawed
and then inoculated in a flask filled with broth that is rich in simple
sugars and nutrients. The microalgae will then convert the simple
sugars into protein-rich whole food ingredients via fermentation. The
controlled variables are temperature, pH, agitation, and aeration. To
end the process, the fermentation broth is harvested, concentrated,
washed, dried, and milled into a fine powder. The use of a non-GM
sugar source for fermentation is done at the client’s request, but
only natural supplies such as corn, sugar beet, and sugarcane
dextrose are used for the process.
Whole Algae Protein, Frost & SullivanAlgae protein

21
8.98 Million
MT
Harvested Yellow Peas Production
North America produces 42% of the world’s yellow peas (3.67
million MT) and Canada accounts for 89% of North America’s
production.
94
Thousand
MT
1.62 Million
MT
Total Yellow Pea Protein Ingredients
24% of milled pea flour is attributed to pea protein. 46% of that
flour is a starch by-product. For starch processing, the same split
applies aftermilling.
Yellow Pea Product Processing
709 thousand MT is processed for flour, 394 thousand MT for
starch, and 512 thousand MT forprotein.
20.7
Thousand
MT
Dry Fractionated (DF) Yellow Pea Protein Ingredients
67% pea protein is retained from milling after fractionationand
purification. Solvents and/or additives are added, resulting in a final
product that ranges from 80% to 90% peaprotein.
Globally, 8.98 million MT of peas are produced annually but, once they have been
cleaned, dried, de-hulled, milled, fractionated and purified, this translates into 20.70
thousand MT of pea protein ingredients
Whole Yellow Pea and Pea Protein Ingredients Market: Percent of Harvested Peas Used inthe
Production of Value-added Pea Products, Global, 2014
Pea proteinFrost & Sullivan
22
0
20
40
60
80
0
5
10
15
20
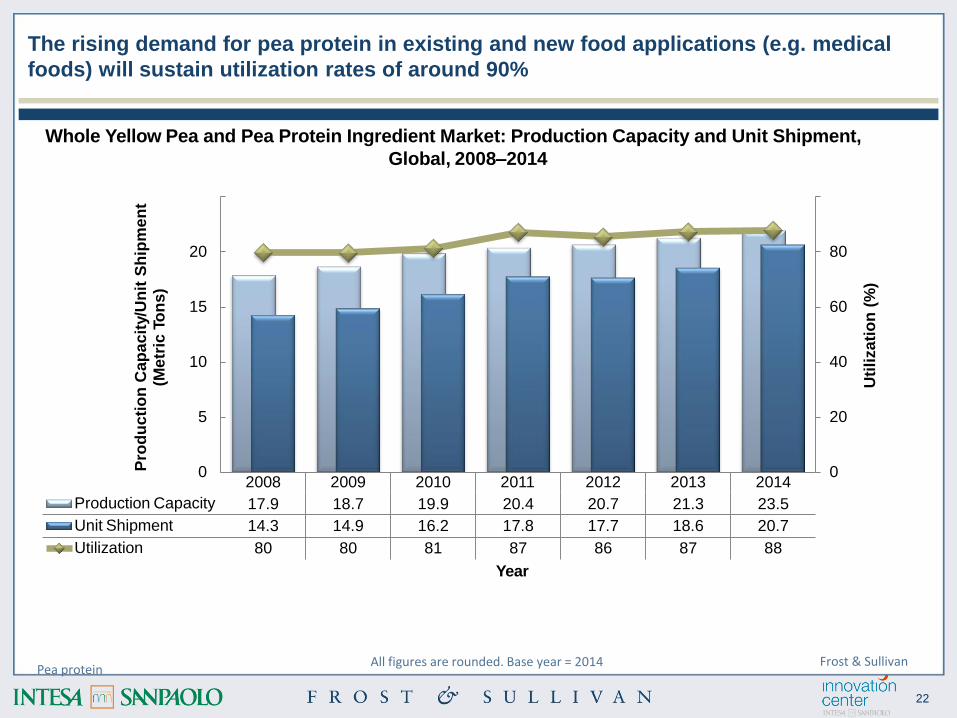
Production Capacity
2008
17.9
2009
18.7
2010
19.9
2011
20.4
2012
20.7
2013
21.3
2014
23.5
Unit Shipment 14.3 14.9 16.2 17.8 17.7 18.6 20.7
Utilization 80 80 81 87 86 87 88
Uti
liza
tio
n (
%)
Pro
du
cti
on
Cap
ac
ity/U
nit
Sh
ipm
en
t(M
etr
ic T
on
s)
The rising demand for pea protein in existing and new food applications (e.g. medical
foods) will sustain utilization rates of around 90%
Year
Whole Yellow Pea and Pea Protein Ingredient Market: Production Capacity and Unit Shipment,
Global, 2008–2014
All figures are rounded. Base year = 2014Pea protein
Frost & Sullivan

23
End-user
IndustriesElevator
Whole
Yellow Pea
Crop Grower
Processor
Whole Yellow Pea and Pea Protein Ingredients Market: Industry Supply Chain, Global,2014
Pea and Food
Ingredient
Processor and
ManufacturerWholesale and
Retail
Distributors
The pea protein value chain is similar to that of other plant-based proteins with the main
stakeholders specialised in storage and processing
The market comprises a wide range of participants. It can be roughly grouped intothe
following classifications:
• Companies that specialize in storage: These purchase harvested peas directly from the grower or trader
and store the same in a holding facility.
• Companies that specialize in pea processing: These purchase harvested peas directly from a grower, a
pulse elevator, or a trader. The peas undergo various levels of processing, which is subject to the
company’s end markets.
• Companies that specialize in pea protein processing: These undertake pea milling and additional
processing activities, such as fractionating flour into protein, starch, fiber, andfat.
Pea proteinFrost & Sullivan

24
There is a significant level of vertical integration between pea processors, elevators
and traders/brokers whereas the pea ingredient processors, which develop the protein,
consist of a separate group of companies
• Pea processors purchase harvested peas directly from a grower and/or pulse elevator and/or
trader/broker. The peas undergo various levels of processing depending on the end market
• Examples include Besopke Group LLC, Columbia Grain International, Coop Ag Producers, Inc.,
Northwest Pea & Bean Co, George F. Brocke & Sons, Inc., Spokane Seed, Co, Legume Matrix,
Alliance Grain Traders, 3D Corporate Solutions, Legumex Walker, Inc. and Tumac Commodities
• Pea elevators purchase harvested peas directly from a grower and/or trader/broker and store them in a
holding facility. In some cases, these organizations are also processors and traders/brokers
• Examples include Bespoke Group LLC, Columbia Grain International, Cooperative Agricultural
Producers, Inc., Northwest Pea & Bean Company, George F. Brooke & Sons, Inc., Spokane Seed
Company, 3D Corporate Solutions, and Tumac Commodities
• Pea traders/brokers buy and sell harvested and/or processed peas and other pulses
• Example include Besopke Group LLC, Columbia Grain International, Legume Matrix, Alliance Grain
Traders, JM Grain, 3D Corporate Solutions, Bridgewell Resources LLC, California Exim, Inc.,
Commercial Lynks, Inc., Globeways, Inc., Legumex Walker, Inc., Maviga and Nexus Trading, Inc
• Pea ingredient processors undertake pea milling and additional processing activities, such as
fractionating flour into protein, starch, fiber, and fat. In some cases, this processor is a multi-purpose food
and feed ingredient processor and manufacturer
• Example include Meelunie America, Inc., Harvest Innovations, Zumbro River Brand, Inc., Roquette,
Nutri-Pea Limited, Axiom Foods, Inc., Burcon Nutrascience, Cosucra, and Alliance Grain Traders, and
a large number of Chinese and Asian-based pea protein ingredient processors.Pea protein
Frost & Sullivan

25
• Harvest
Harvested Peas
• Sorting
20% VAM
Clean and Dry Peas
•De-husking
•39% VAM
De-hulled Peas
•Milling
32% VAM
Milled Peas
• Fractionation• Concentration• Isolation
75% VAM
Pea Proteins
1.00 ton 0.77 ton
<0.12 ton
Pea Product by Relative Weight
Frost & Sullivan finds that 67% of pea protein is retained from a milled pea in the final
concentrate form, amounting to a 29% price mark-up
Whole Yellow Pea and Pea Protein Ingredients Market: Production Value Chain, Global,2014
Key: VAM=Value-added Markup
0.77 ton0.9 ton
Pea proteinFrost & Sullivan

26
Omega-3

27
Omega-3 Ingredients Market: Percent
Revenue by Ingredient Type, Global, 2014
30% Natural Fish/18:12 Oils
16.3%
50 to 55% Fish Oil Concentrates
4.0%60 to 70% Fish Oil
Concentrates 11.0%
75%+ Fish Oil Concentrates
13.0%
Krill Oils 7.1%
Microalgae Oils 34.8% Specialty Fish Oils
13.8%
The Omega-3 ingredients market can be segmented according the source from which the
fatty acids stem, with microalgae oils representing 35%
• Omega-3 Polyunsaturated Fatty Acids (PUFA)
continue to be one of the most researched and
scientifically proven functional ingredients in the
marketplace. Hundreds of scientific papers have
been published about Omega-3’s benefits to both
human and animal nutrition, which greatly
enhances the credibility of omega-3 as a vital
functional ingredient.
• The main sources of Omega-3 PUFAs are cold-
water marine fish and microalgae algae, which are
both rich in eicosapentaenoic acid (EPA),
docosahexaenoic acid (DHA), or both;
o 30% EPA+DHA Natural Fish/18:12 Oils
o 50 to 55% EPA+DHA Fish Oil Concentrates
o 60 to 70% EPA+DHA Fish Oil Concentrates
o 75%+ EPA+DHA Fish Oil Concentrates
o Krill oils
o Microalgae oils
o Specialty fish oils
All figures are rounded. Base year = 2014Definition/Segmentation
Frost & Sullivan

28
0
50
100
150
200
2503,500
3,000
2,500
2,000
1,500
1,000
500
Revenue CAGR (2014–2025) = 4.2%; Units CAGR (2014–2025) = 4.1%
0 2012 2013 2014 2015 2016 2017 2018 2019 2020 2021 2022 2023 2024 2025
Revenue 1,766.1 1,809.5 1,830.8 1,958.8 2,089.9 2,221.2 2,343.6 2,451.7 2,546.5 2,632.9 2,711.0 2,778.5 2,834.1 2,878.2
Units 117 126 136 144 152 161 169 177 184 190 197 203 208 212
Un
its
('0
00
Metr
icT
on
s)
Rev
en
ue
($M
illio
n)
Year
Globally, the omega-3 market was valued at $1.83 billion in 2014 and will expand to reach
$2.88 billion by 2025, a 4.2% CAGR
Omega-3 Ingredients Market: Revenue Forecast, Global, 2014-2020
Market Analysis & ForecastAll figures are rounded. Base year = 2014 Frost & Sullivan
29
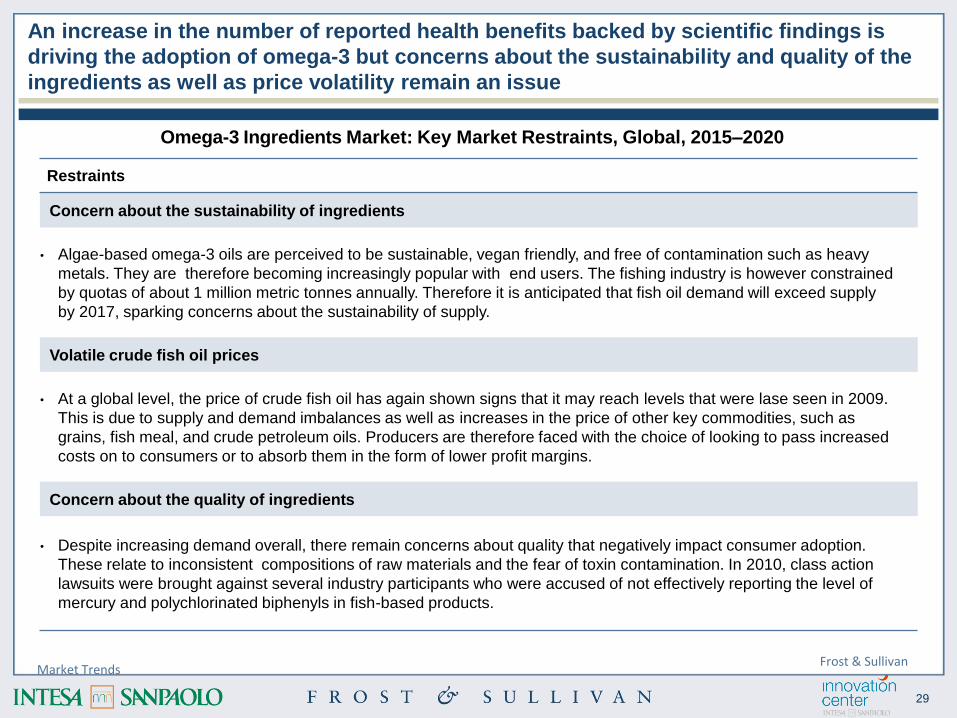
Restraints
Concern about the sustainability of ingredients
• Algae-based omega-3 oils are perceived to be sustainable, vegan friendly, and free of contamination such as heavy
metals. They are therefore becoming increasingly popular with end users. The fishing industry is however constrained
by quotas of about 1 million metric tonnes annually. Therefore it is anticipated that fish oil demand will exceed supply
by 2017, sparking concerns about the sustainability of supply.
Volatile crude fish oil prices
• At a global level, the price of crude fish oil has again shown signs that it may reach levels that were lase seen in 2009.
This is due to supply and demand imbalances as well as increases in the price of other key commodities, such as
grains, fish meal, and crude petroleum oils. Producers are therefore faced with the choice of looking to pass increased
costs on to consumers or to absorb them in the form of lower profit margins.
Concern about the quality of ingredients
• Despite increasing demand overall, there remain concerns about quality that negatively impact consumer adoption.
These relate to inconsistent compositions of raw materials and the fear of toxin contamination. In 2010, class action
lawsuits were brought against several industry participants who were accused of not effectively reporting the level of
mercury and polychlorinated biphenyls in fish-based products.
An increase in the number of reported health benefits backed by scientific findings is
driving the adoption of omega-3 but concerns about the sustainability and quality of the
ingredients as well as price volatility remain an issue
Market Trends
Omega-3 Ingredients Market: Key Market Restraints, Global, 2015–2020
Frost & Sullivan
30
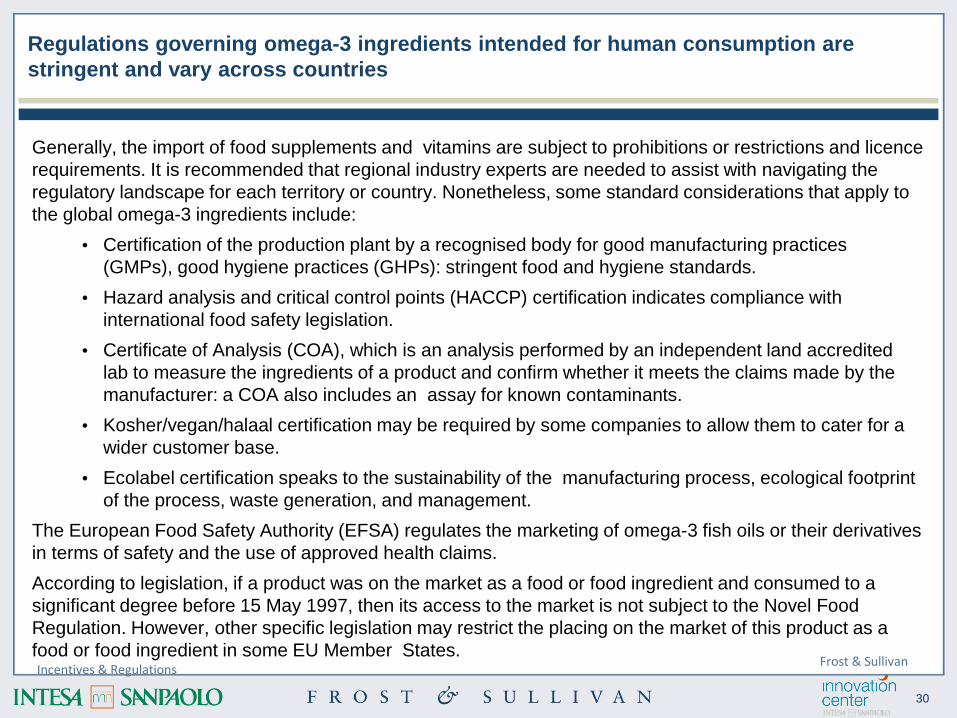
Regulations governing omega-3 ingredients intended for human consumption are
stringent and vary across countries
Generally, the import of food supplements and vitamins are subject to prohibitions or restrictions and licence
requirements. It is recommended that regional industry experts are needed to assist with navigating the
regulatory landscape for each territory or country. Nonetheless, some standard considerations that apply to
the global omega-3 ingredients include:
• Certification of the production plant by a recognised body for good manufacturing practices
(GMPs), good hygiene practices (GHPs): stringent food and hygiene standards.
• Hazard analysis and critical control points (HACCP) certification indicates compliance with
international food safety legislation.
• Certificate of Analysis (COA), which is an analysis performed by an independent land accredited
lab to measure the ingredients of a product and confirm whether it meets the claims made by the
manufacturer: a COA also includes an assay for known contaminants.
• Kosher/vegan/halaal certification may be required by some companies to allow them to cater for a
wider customer base.
• Ecolabel certification speaks to the sustainability of the manufacturing process, ecological footprint
of the process, waste generation, and management.
The European Food Safety Authority (EFSA) regulates the marketing of omega-3 fish oils or their derivatives
in terms of safety and the use of approved health claims.
According to legislation, if a product was on the market as a food or food ingredient and consumed to a
significant degree before 15 May 1997, then its access to the market is not subject to the Novel Food
Regulation. However, other specific legislation may restrict the placing on the market of this product as a
food or food ingredient in some EU Member States.Incentives & Regulations
Frost & Sullivan

31
The global omega-3 ingredients market is moderately competitive, but has areas of real
concentration depending on the end-market application
The omega-3 PUFA ingredients market is multi-layered. It starts with the raw material supplier. The actual
competition begins at the next level: the oil extractor or the PUFA ingredient supplier. At this stage, the PUFA
oil may be further refined depending on the specific needs of the manufacturer. PUFA ingredients are then
traded through distributors or regional offices to supplement or F&B manufacturers. Finally they reach the end
consumer via a number of PUFA-enriched products.
The market is continually facing competition from other nutritional ingredients. However, the wide range of
health benefits offered by PUFA ingredients is unmatched.
The challenge is to sustain popularity and consumer interest in omega-3 fatty acids.
A sustainable competitive advantage stems from having –
• a strong scientific focus in this industry
• third party certifiers (TPC) confirm that production processes and products conform to consumer
expectations and protects consumers from ambiguous product information. Standardization through
TPCs creates an barrier to entry for nonconforming competitors
The global omega-3 ingredients market (oil refiners) is moderately competitive, but has areas of extreme
market concentration depending on the end-market application. There are over 40 manufacturers (refiners)
active in this market. Frost & Sullivan expects the level of competition to increase thereby decreasing the
price of omega-3 products.
In November 2014, BASF sold its Brattvag plant in Norway to food industry supplier Marine Ingredients. The
sale confirms the anticipated industry shift from low concentration omega-3s to high concentrated
pharmaceutical grade products. Competitors in the high concentrates segment of the omega-3 market are
characterized by strong R&D capabilities, product differentiation, and regulatory know-how.Key Players & Forecast
Frost & Sullivan

32
Tier III and Other Companies
(5)24%
DSM (2)
23%
BASF(1)
20%
Products (China)
9%
GC Rieber Oils (Norway)
4%
Chemport (Korea)
3%
Clover
Corporation (4)
2%
FMC Corporation (3)
6%
Croda International (UK)
2%
Guangdong Runke Biological
Eng. Co. (China)2%
Hubei Fuxing Biotechnology
Co.,Ltd2%
Omega Protein Corporation
2%
Orkla Health (Norway)
1%Tier II Companies
18%
Wuxi Xunda Marine Biological
Notes:1) Includes Pronova BioPharma, Equateq, Callanish, and Cognis2) Includes Martek and Ocean Nutrition Canada3) Former Epax4) Former Nu-Mega5) Others include Axellus, Denomega, Lonza Group, Neptune Biotech, Omega Protein, Alltech, Rishon International Group, Seambiotic Ltd, Hubei YouzhiyouBiotechnology Co., Ltd, Shantou Runke Biological EngineeringCompany, and Wuhan Bioco Sci & Tech Dev Co.Ltd.
Overall, the top 3 tier I companies, DSM, BASF and Wuxi Xunda, account for 52% of the
global market and consolidation is expected to continue
Omega-3 Ingredients Market: Competitive Structure, Global, 2014
Key Players & ForecastFrost & Sullivan

33
Pet Food2.6%
Dietary Supplements
46.8%
Food & Beverage 10.9%
Infant Formula 26.9%
Pharmaceuticals 11.7%
Other End Markets 1.2%
End Application
2014
Revenue
($ Million)
Revenue
CAGR
(2014-2025)
2014 Units
(Metric Tons
000s)Units CAGR
(2014-2025)
Pet Food 46.7 5.3% 23.1 1.5%
Dietary
Supplements856.3 4.8% 82.4 4.6%
Food & Beverage 199.3 5.2% 18.5 5.4%
Infant Formula 493.0 1.8% 8.2 3.0%
Pharmaceuticals 22.1 5.6% 1.0 5.7%
Other End Markets 213.5 5.2% 2.3 4.3%
Total 1,830.8 4.2% 135.6 4.1%
From an application perspective, dietary supplements lead in terms of volume and
revenue, but the pet food industry is expected to grow at a CAGR of 5.3% due to rapid
and continued growth in pet ownership across the globe
Omega-3 Ingredients Market: Revenue by End Application, Global, 2014
All figures are rounded. Base year = 2014
Customer AnalysisOther end markets include personal care and other minor non-human nutrition applications
Frost & Sullivan

34
On the technology side, US firm Ocean Omega has developed a micro-emulsion solution
which makes omega-3 available to fortify functional beverages
1
2
Omega-3 has poor oxidative stability and variable
bioavailability, which limits its use in beverages.
Problem
StatementTech
Profile
Oceans Omega LLC has invented water‐soluble omega‐3 EPA
(eicosapentaenoic acid) and DHA (docosahexaenoic acid) ingredients
for the fortification of beverage products.
Oceans Omega LLC is located at Paramus, New Jersey, USA. It is a
wholly owned subsidiary of Mycell Technologies LLC.
The omega-3 micro-emulsion technology produces a stable emulsion
that decelerates the breakdown of nutritional content of omega-3 oil,
allowing for easy incorporation of omega-3 in beverages. The water-
soluble omega-3 emulsion has been commercialized as OTEC™
250CL-K and OTEC™ 300LDHA-S35.
Innovation
Attributes
pasteurization, cold-fill and
carbonation
Future
Plans
Omega Brands Corporation has purchased the omega-3 micro-
emulsion technology from Mycell Technologies LLC. It has entered into
a supply agreement with Oceans Omega LLC for distributing specialty
beverages fortified with Oceans Omega’s water-soluble omega-3
across North America and selected international markets.the finished product.
There is a need to address the low consumption of
omega-3 in the people’s daily diets, especially for
children and the elderly population.
Finished products are self-
stable underunrefrigerated
conditions
Incorporation of emulsion
through common beverage
manufacturing processes
such as hot-fill pasteurization,
cold-fill and carbonation
Emulsions are water- soluble
and highly translucent, thus
can fortify clear beverages
The omega-3 emulsion tastes
natural, is odorless, and has
no impact on the texture and
appearance on the finished
product.
Key Players & ForecastOceans Omega, Frost & Sullivan

35
Sweden-based Simiris is working to farm algae with a view to providing a safe and
environmentally friendly alternative to the omega-3 oils extracts which typically stem
from wild fatty fish
1
2
There are high levels of environmental toxins and
heavy metals in wild fatty fish.
Problem
StatementTech
Profile
The technology involves natural and prime processes starting with
farming, harvesting, and production. Algae are grown in photo-
bioreactors. The technology that is routinely used is both energy and
performance efficient in order to maintain the algae’s freshness. As a
result, algae nutrients can be reserved and protected.
The algae farm is located in Hammenhög, Sweden with 2,000 square
meters of greenhouses and laboratories
• Genetically modified organism (GMO)-free creation
• Free from solvent-based extractions
• Vegetarian omega-3 fatty acids
• Use of home-grown algae starter cultures
• No allergens
• Algae cultivation under supervised conditions
Innovation
Attributes
pasteurization, cold-fill and
carbonation
Future
Plans
• The improvement of the organoleptic property (taste) of omega-3 oil
• Microencapsulation of oil into powder
• Emulsification of algal oil for liquid application
• Estimated omega-3 EPA and DHA market growth to USD$2.7 billion
between 2014 and 2020 (at consumer level)the finished product.
The market is moving towards high-value,
sustainable, bioavailable and vegetarian omega-3s,
especially from highly concentrated algal oil.
Algae omega-3 oils DHA and
EPA extracts are
indistinguishable from high-fat
fish - In the food chain, algae
is a source of omega-3 for fish
Fish oil alternative - 100%
plant-based omega-3 fatty
acids
Algae are farmed in closed
system, greenhouses - Free
from environmental toxins,
controlled safety, and purity
Ecologically sustainable
omega-3 oil - Reduce
overfishing activities, maintain
natural ecology balance
Key Players & ForecastSimiris, Frost & Sullivan

36
2. Safety Products
37
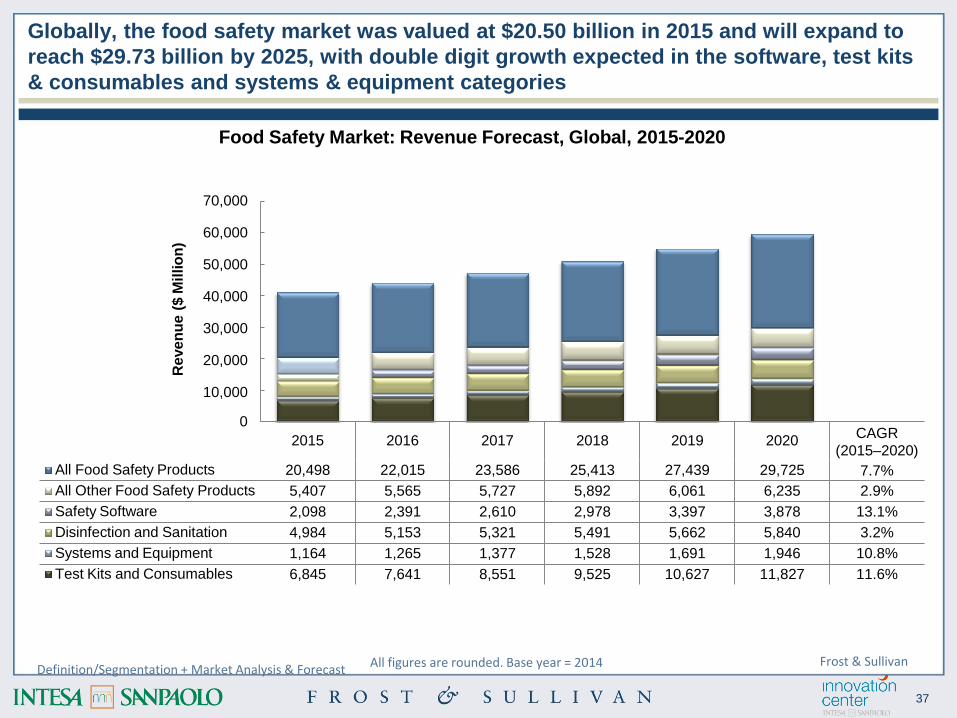
Globally, the food safety market was valued at $20.50 billion in 2015 and will expand to
reach $29.73 billion by 2025, with double digit growth expected in the software, test kits
& consumables and systems & equipment categories
Reven
ue
($M
illio
n)
0
All Food Safety Products
2015
20,498
2016
22,015
2017
23,586
2018
25,413
2019
27,439
2020
29,725
CAGR
(2015–2020)
7.7%
All Other Food Safety Products 5,407 5,565 5,727 5,892 6,061 6,235 2.9%
Safety Software 2,098 2,391 2,610 2,978 3,397 3,878 13.1%
Disinfection and Sanitation 4,984 5,153 5,321 5,491 5,662 5,840 3.2%
Systems and Equipment 1,164 1,265 1,377 1,528 1,691 1,946 10.8%
Test Kits and Consumables 6,845 7,641 8,551 9,525 10,627 11,827 11.6%
70,000
60,000
50,000
40,000
30,000
20,000
10,000
Food Safety Market: Revenue Forecast, Global, 2015-2020
All figures are rounded. Base year = 2014Definition/Segmentation + Market Analysis & Forecast
Frost & Sullivan

38
The market is expanding rapidly due to a combination of macro and micro factors on
both the demand and supply side
3Increasing volumes of data related to food safety (e.g., foodborne outbreaks, molecular
epidemiology) are being generated by government, industrial, and academic organizations, which
necessitates innovative enabling technologies to provide instantaneous and actionable insight.
4Research and development of rapid detection methods used for isolation, early detection, profiling,
and listing of pathogens and their metabolites in food safety diagnostics is stimulating the need
for higher efficiency of digital data management.
5Efficient software makes much-needed interoperability possible in the food & beverage industry,
and will increase the efficiencies of proactive monitoring for expired, spoiled, or tainted foods;
traceability; tracking; alerts; recalls; and corrective actions throughout the value chain.
The burden of food safety breaches is significant; consequently, the need for food security
solutions is only expected to increase. Demand will increase for enabling technologies that
address this challenge in the most cost-effective way possible.
1
2
Globalization and the demand for novel and exotic food have increased food safety concerns,
especially in a world with major differences in regulations and national enforcement. Demand is
growing for technologies that can track product and production information and share it across
regions and throughout the value chain.
Market TrendsFrost & Sullivan

39
Implementation
Challenges That
Should Be Addressed
Digitally
• Industry, government, and other external stakeholders have recognized the deficiency in the
US food safety system and have supported the passage of the FMSA, but implementation
challenges remain.
• While large companies are becoming digitalized, the FDA continues to require data to be
sent as scanned documents in PDF and fax formats.
• In general, the US food safety system has been relatively ineffective in ensuring the general
safety of the US food supply chain.
Food Safety
Management Systems
That Need Big Data
• The industry relies on food safety management systems—defined as the application of
processes and systems in a food business to prevent food-borne illness and to protect
consumer health. System objectives are to improve food safety, ensure consumer
protection, boost consumer confidence, improve efficiency throughout the supply chain,
benchmark parameters for food safety management, and provide an action plan to counter
problems.
• Food safety management systems active in the global food market include the Dutch
HACCP, International Organization for Standardization (ISO 22000), British Retail
Consortium (BRC), International Featured Standards (IFS), and Safe Quality Food Initiative
(SQF). Independent national and international standards also exist.
GFSI Calls For
Efficient Data
Management
• The Global Food Safety Initiative (GFSI) is a food safety trade standard organization founded
by large retailers including Carrefour, Tesco PLC, Metro AG, Migros, Royal Ahold, Walmart,
and Delhaize.
• GFSI’s vision is to have a standard that, once certified, is accepted everywhere.• Launched in 2000, the GFSI does not undertake any accreditation or certification activities.
Certification is based on BRC, IFS, and SQF food safety schemes.
Regulation is creating challenges but also opportunities to transform the way in which
food safety is managed from a technology perspective
Incentives & RegulationsFrost & Sullivan

40
Digital transformation in the sector is rooted in sustainable industry trends with
particular progress being made on leveraging electronic traceability, cloud-based and
automation & robotics solutions
Global Food
Trade/Imported
Foods
Demand for
Novel/Exotic
Foods
Need for Less-
Processed Foods
Harmonized
Food Safety
Information
Voluminous Data
on Outbreaks &
Epidemiology
Multiple Big Data
Banks
Diverse Big Data
at End Market &
Consumer Levels
Big Data
Analytics
Immunoassays
Biosensors
DNA-Based
Assays
Rapid
Detection
Methods
Expansion of
Software
Features
Interface with
Tracking &
Traceability
Cloud-Based
Technologies
Advanced Food
Safety Software
as a Service
Interventional
Technologies
Electronic
Traceability
Automation &
Robotics
Emerging
Technological
Innovations
Food Safety Market : Top 5 Trends, Global, 2015-2020
Enabling InfrastructureFrost & Sullivan
41
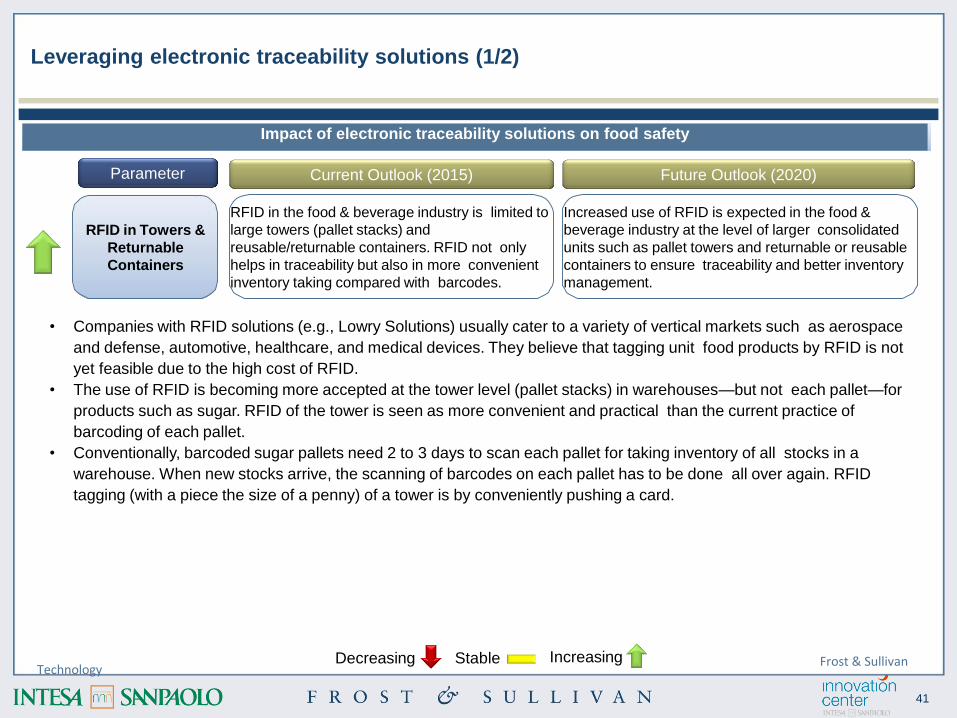
Leveraging electronic traceability solutions (1/2)
RFID in Towers &
Returnable
Containers
Parameter
RFID in the food & beverage industry is limited to
large towers (pallet stacks) and
reusable/returnable containers. RFID not only
helps in traceability but also in more convenient
inventory taking compared with barcodes.
Current Outlook (2015) Future Outlook (2020)
Increased use of RFID is expected in the food &
beverage industry at the level of larger consolidated
units such as pallet towers and returnable or reusable
containers to ensure traceability and better inventory
management.
Impact of electronic traceability solutions on food safety
IncreasingDecreasing StableTechnology
• Companies with RFID solutions (e.g., Lowry Solutions) usually cater to a variety of vertical markets such as aerospace
and defense, automotive, healthcare, and medical devices. They believe that tagging unit food products by RFID is not
yet feasible due to the high cost of RFID.
• The use of RFID is becoming more accepted at the tower level (pallet stacks) in warehouses—but not each pallet—for
products such as sugar. RFID of the tower is seen as more convenient and practical than the current practice of
barcoding of each pallet.
• Conventionally, barcoded sugar pallets need 2 to 3 days to scan each pallet for taking inventory of all stocks in a
warehouse. When new stocks arrive, the scanning of barcodes on each pallet has to be done all over again. RFID
tagging (with a piece the size of a penny) of a tower is by conveniently pushing a card.
Frost & Sullivan

42
Leveraging electronic traceability solutions (2/2)
Barcodes in
Packaged Foods
Parameter
Barcoding technologies interface with food
safety software, mainly at the packaged food
product manufacturing, logistics, and
retailing levels
Current Outlook (2015) Future Outlook (2020)
Barcode applications will increase in tune with
market expansion of food & beverage
manufacturing, warehousing, transportation, and
retailing (groceries and supermarkets) activities.
Impact of electronic traceability solutions on food safety
Technology
RFID in Food-
Allied Industries
RFID is becoming important in tracking of fishing
boats (tuna and shrimp) by the US government. It
is also likely to become more significant in the
traceability of food safety- related diagnostic kits
due to their high value and critical contents.
RFID is expected to become diverse in fishing boat
applications. Diagnostic kit suppliers for the food &
beverage industry will rely more on RFID for their
tracking and inventory management of expensive
materials that are also at risk of health and safety
breaches.
• Recent US regulations will require RFID or electronic tracking of fishing boats - private and corporate - that are used in
tuna and shrimp fishing. Information to be included are the ocean area in which the fish are caught, date, time, and
fishing boat details. Information must be reported to the government electronically (via document imaging) and
uploaded on a protected government Web site.
• According to companies with traceability software with barcode labeling compliance, barcode applications only start at
the level of downstream companies that manufacture packaged food products (e.g., Hershey’s, Kraft, Nestlé) that sell to
wholesalers such as Kroger, Walmart, or Costco that have larger staff, networks, and software for ERP, traceability, and
warehouse and inventory management.
IncreasingDecreasing Stable Frost & Sullivan
43
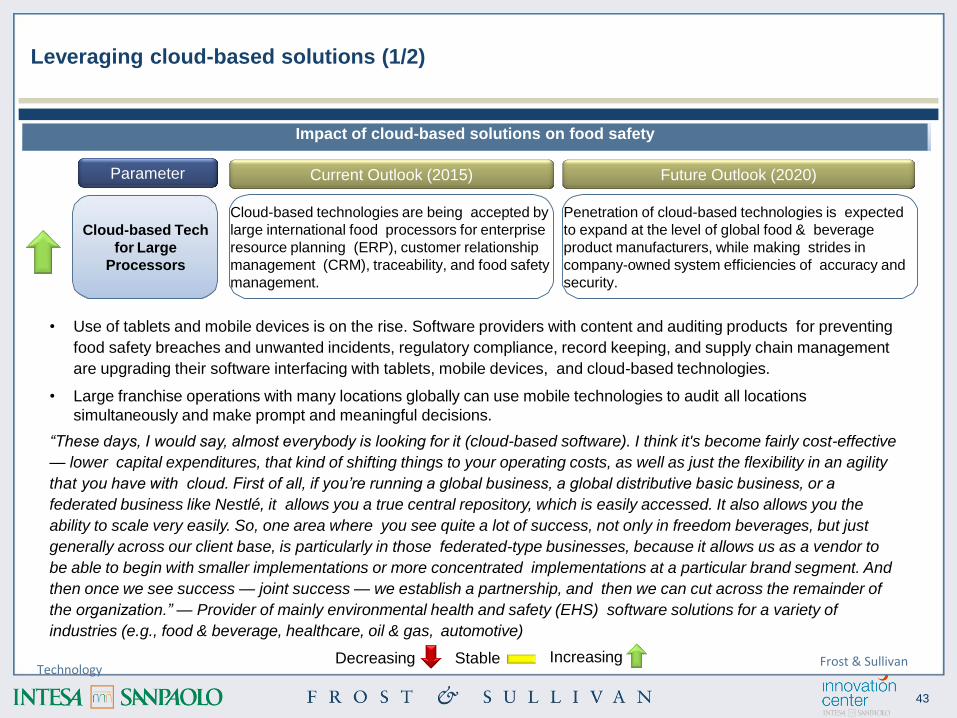
Leveraging cloud-based solutions (1/2)
Cloud-based Tech
for Large
Processors
Parameter
Cloud-based technologies are being accepted by
large international food processors for enterprise
resource planning (ERP), customer relationship
management (CRM), traceability, and food safety
management.
Current Outlook (2015) Future Outlook (2020)
Penetration of cloud-based technologies is expected
to expand at the level of global food & beverage
product manufacturers, while making strides in
company-owned system efficiencies of accuracy and
security.
Impact of cloud-based solutions on food safety
Technology
• Use of tablets and mobile devices is on the rise. Software providers with content and auditing products for preventing
food safety breaches and unwanted incidents, regulatory compliance, record keeping, and supply chain management
are upgrading their software interfacing with tablets, mobile devices, and cloud-based technologies.
• Large franchise operations with many locations globally can use mobile technologies to audit all locations
simultaneously and make prompt and meaningful decisions.
“These days, I would say, almost everybody is looking for it (cloud-based software). I think it's become fairly cost-effective
— lower capital expenditures, that kind of shifting things to your operating costs, as well as just the flexibility in an agility
that you have with cloud. First of all, if you’re running a global business, a global distributive basic business, or a
federated business like Nestlé, it allows you a true central repository, which is easily accessed. It also allows you the
ability to scale very easily. So, one area where you see quite a lot of success, not only in freedom beverages, but just
generally across our client base, is particularly in those federated-type businesses, because it allows us as a vendor to
be able to begin with smaller implementations or more concentrated implementations at a particular brand segment. And
then once we see success — joint success — we establish a partnership, and then we can cut across the remainder of
the organization.” — Provider of mainly environmental health and safety (EHS) software solutions for a variety of
industries (e.g., food & beverage, healthcare, oil & gas, automotive)
IncreasingDecreasing Stable Frost & Sullivan

44
Leveraging cloud-based solutions (2/2)
Cloud-based Tech
for Software
Providers
Parameter
Food software providers have mostly customized
their products to be compatible with cloud
platforms, with clients (especially large clients
with confidence in the security of their company-
owned servers) requesting this feature.
Current Outlook (2015) Future Outlook (2020)
Moving on from providing customized cloud-based
software for large clients with their own secure
servers, more food safety providers globally will
develop software that will be compatible with public
domains (e.g., Microsoft catering to the needs of small
to medium clients).
Impact of cloud-based solutions on food safety
Technology
• Updates in the form of dashboard graphs and summaries can be received in just 10 to 20 seconds from scores of
locations simultaneously (compared with conventional systems that can deliver information in a few hours, for one
location at a time).
• From a typical EHS software provider (e.g., Intelex) perspective, cloud-based systems have become pervasive. EHS
software is provided on a cloud-based platform since it has become cost-effective and efficient. Clients, especially large
companies with many locations, are demanding cloud-based EHS systems, and the provider is able to consider the
cloud in its software innovation.
• From the perspective of a food safety software specialist, cloud-based systems are here to stay and will grow in
application. Food safety software providers offer cloud systems in applications for seasonal businesses, large firms in
the United States, and large growers with fields that are scattered and sometimes remote. For example, farm-related
software systems run on iPads can be deployed in North America to fruit and vegetable fields. With cloud, the corporate
office is able to connect to workers with iPads, capture a lot of information from the fields during harvest and growing
cycles, and update it quickly.
IncreasingDecreasing Stable Frost & Sullivan
45
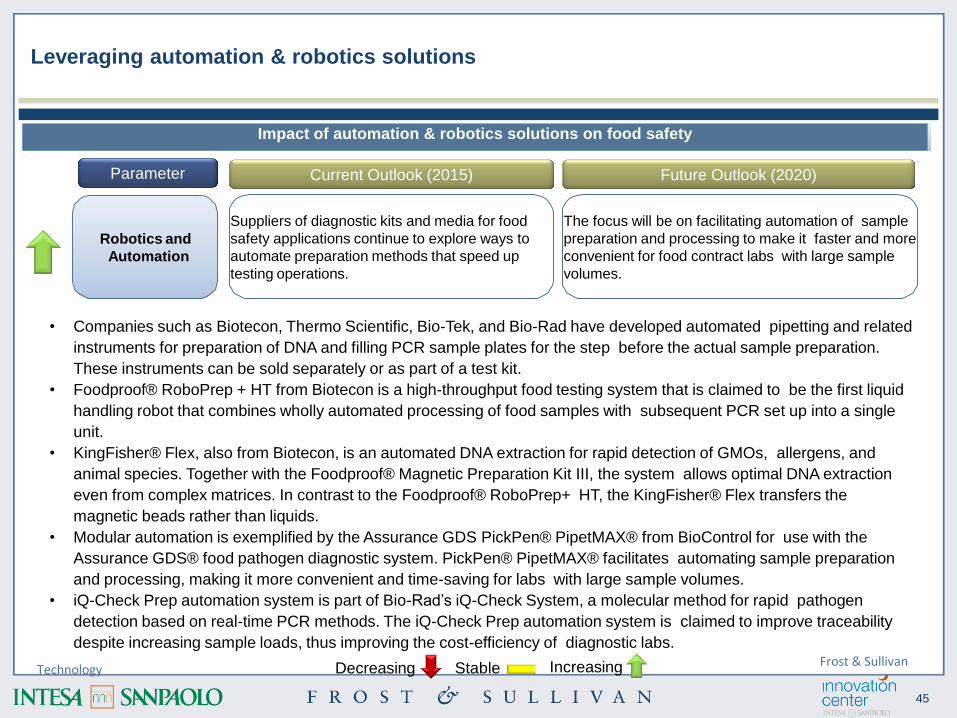
Leveraging automation & robotics solutions
Robotics and
Automation
Parameter
Suppliers of diagnostic kits and media for food
safety applications continue to explore ways to
automate preparation methods that speed up
testing operations.
Current Outlook (2015) Future Outlook (2020)
The focus will be on facilitating automation of sample
preparation and processing to make it faster and more
convenient for food contract labs with large sample
volumes.
Impact of automation & robotics solutions on food safety
Technology
• Companies such as Biotecon, Thermo Scientific, Bio-Tek, and Bio-Rad have developed automated pipetting and related
instruments for preparation of DNA and filling PCR sample plates for the step before the actual sample preparation.
These instruments can be sold separately or as part of a test kit.
• Foodproof® RoboPrep + HT from Biotecon is a high-throughput food testing system that is claimed to be the first liquid
handling robot that combines wholly automated processing of food samples with subsequent PCR set up into a single
unit.
• KingFisher® Flex, also from Biotecon, is an automated DNA extraction for rapid detection of GMOs, allergens, and
animal species. Together with the Foodproof® Magnetic Preparation Kit III, the system allows optimal DNA extraction
even from complex matrices. In contrast to the Foodproof® RoboPrep+ HT, the KingFisher® Flex transfers the
magnetic beads rather than liquids.
• Modular automation is exemplified by the Assurance GDS PickPen® PipetMAX® from BioControl for use with the
Assurance GDS® food pathogen diagnostic system. PickPen® PipetMAX® facilitates automating sample preparation
and processing, making it more convenient and time-saving for labs with large sample volumes.
• iQ-Check Prep automation system is part of Bio-Rad’s iQ-Check System, a molecular method for rapid pathogen
detection based on real-time PCR methods. The iQ-Check Prep automation system is claimed to improve traceability
despite increasing sample loads, thus improving the cost-efficiency of diagnostic labs.
IncreasingDecreasing StableFrost & Sullivan
46
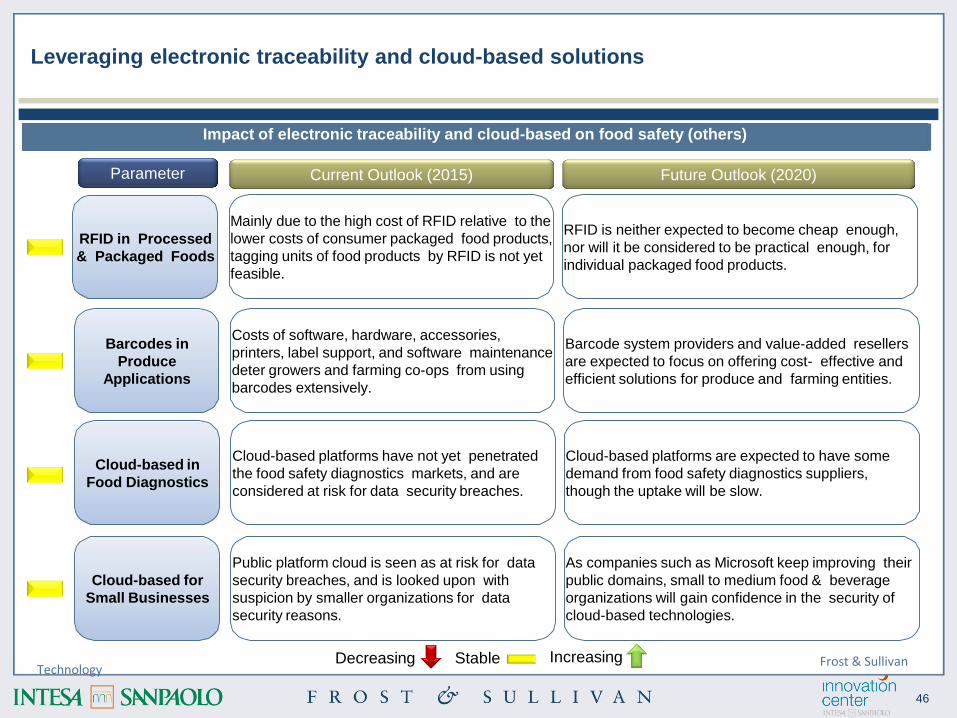
Leveraging electronic traceability and cloud-based solutions
RFID in Processed
& Packaged Foods
Cloud-based in
Food Diagnostics
Barcodes in
Produce
Applications
Parameter
Mainly due to the high cost of RFID relative to the
lower costs of consumer packaged food products,
tagging units of food products by RFID is not yet
feasible.
Cloud-based platforms have not yet penetrated
the food safety diagnostics markets, and are
considered at risk for data security breaches.
Costs of software, hardware, accessories,
printers, label support, and software maintenance
deter growers and farming co-ops from using
barcodes extensively.
Current Outlook (2015) Future Outlook (2020)
RFID is neither expected to become cheap enough,
nor will it be considered to be practical enough, for
individual packaged food products.
Cloud-based platforms are expected to have some
demand from food safety diagnostics suppliers,
though the uptake will be slow.
Barcode system providers and value-added resellers
are expected to focus on offering cost- effective and
efficient solutions for produce and farming entities.
Impact of electronic traceability and cloud-based on food safety (others)
Cloud-based for
Small Businesses
Public platform cloud is seen as at risk for data
security breaches, and is looked upon with
suspicion by smaller organizations for data
security reasons.
As companies such as Microsoft keep improving their
public domains, small to medium food & beverage
organizations will gain confidence in the security of
cloud-based technologies.
TechnologyIncreasingDecreasing Stable Frost & Sullivan

47
3. Medical Foods

48
Medical foods fall between pharmaceuticals and nutraceuticals and can be segmented
into prescription and non-prescription products
Definition/Segmentation
Medical Foods Market: Market Segmentation, Global, 2015
Pharmaceuticals
(Disease-specific)
Medical Foods
Nutraceuticals
(Address nutritional
requirements)
Prescription
Medical Foods
Non- prescription
Medical Foods
• Medical foods are essentially a product group wedged between pharmaceuticals and nutraceuticals.
• The only requirement for medical foods stipulated by the FDA is that the active ingredient be generally
recognized as safe (GRAS) and that the product be administered under medical supervision.
• This has paved the way for 2 sectors of medical foods;
• Prescription medical foods, more drug-like in nature, are administered in a capsule or tablet form and
are made available only in pharmacies and hospitals.
• Non-prescription medical foods, closer to nutraceuticals, are complete or partially complete nutrition
products available as concentrates or ready-to-consume formulations.
Frost & Sullivan

49
Globally, the medical foods market was valued at $9.36 billion in 2013 and will expand to
reach $13.34 billion by 2018, a 7.3% CAGR
Market Analysis & ForecastAll figures are rounded. Base year = 2013
Medical Foods Market: Revenue Forecast, Global, 2014-2018
5.0
6.0
7.0
8.0
9.0
10.0
0.00
2.00
4.00
6.00
8.00
10.00
12.00
14.00
16.00
Revenue
2013
9.36
2014
9.95
2015
10.61
2016
11.39
2017
12.30
2018
13.34
Growth Rate - 6.3 6.7 7.3 8.0 8.4
Gro
wth
Ra
te (
%)
Re
ve
nu
e($
Billi
on
)
Frost & Sullivan
50
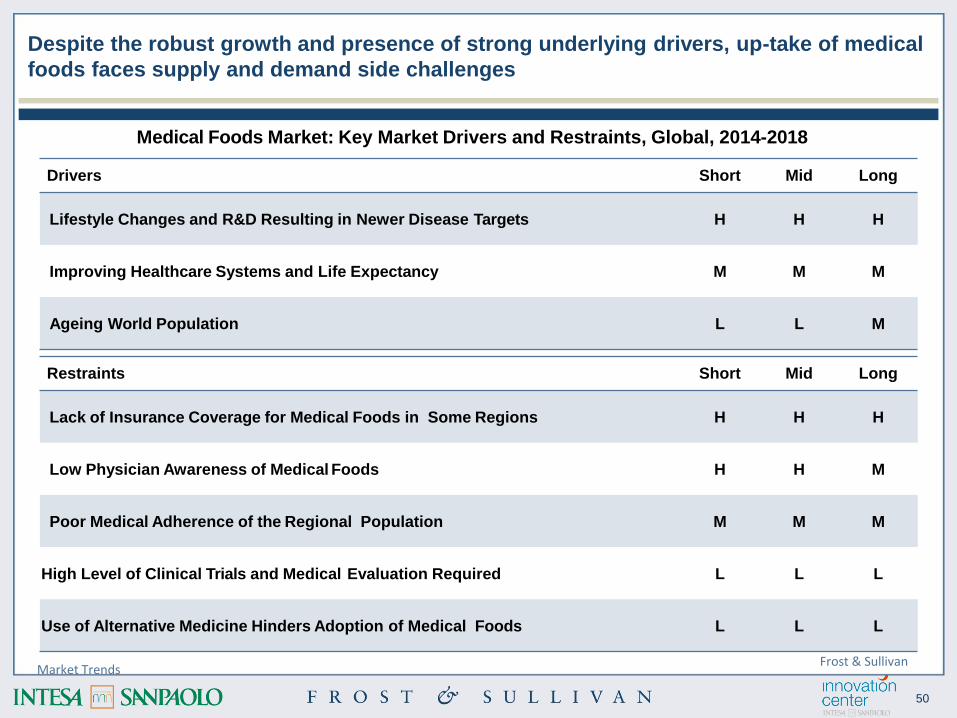
Drivers Short Mid Long
Lifestyle Changes and R&D Resulting in Newer Disease Targets H H H
Improving Healthcare Systems and Life Expectancy M M M
Ageing World Population L L M
Despite the robust growth and presence of strong underlying drivers, up-take of medical
foods faces supply and demand side challenges
Market Trends
Medical Foods Market: Key Market Drivers and Restraints, Global, 2014-2018
Restraints Short Mid Long
Lack of Insurance Coverage for Medical Foods in Some Regions H H H
Low Physician Awareness of Medical Foods H H M
Poor Medical Adherence of the Regional Population M M M
High Level of Clinical Trials and Medical Evaluation Required L L L
Use of Alternative Medicine Hinders Adoption of Medical Foods L L L
Frost & Sullivan

51
Medical foods are quite tightly regulated, by the Food and Drug Administration in the US
and a European Commission Directive in the EU
Incentives & Regulations
No pre-market approval is needed for marketing medical foods. However, in the US, the FDA keeps a check
on all existing and new products in the market and sends out warnings to any spurious or wrongly defined
products. Under regulation 21 CFR 101.9(j)(8), the US FDA has established the criteria to clarify the statutory
definition of medical foods as outlined below.
• It is a specially formulated and processed product (as opposed to a naturally occurring foodstuff used in
its natural state) for the partial or exclusive feeding of a patient by means of oral intake or enteral feeding
by tube.
• It is intended for the dietary management of a patient who, because of therapeutic or chronic medical
needs, has limited or impaired capacity to ingest, digest, absorb, or metabolize ordinary foodstuffs or
certain nutrients, or who has other special medically determined nutrient requirements, the dietary
management of which cannot be achieved by the modification of the normal diet alone.
• It provides nutritional support specifically modified for the management of the unique nutrient needs that
result from the specific disease or condition, as determined by medical evaluation.
• It is intended to be used under medical supervision; and
• It is intended only for a patient receiving active and ongoing medical supervision, wherein the patient
requires medical care on a recurring basis for, among other things, instructions on the use of the medical
food.
In Europe, the European Commission Directive 1999/21/EC of 25 March 1999 on dietary foods for special
medical purposes (as amended by Directive 2006/141/EC) outlines specifications for medical foods.
Regulations for medical foods are still under development in other parts of the world.Frost & Sullivan

52
Diabetes
Health
Oncology
Health
Metabolic
Health
Digestive
Health
Immune
Health
Musculoskeletal
Health
Critical Care/
Trauma
Diabetes
Health
Oncology
Health
Metabolic
Health
Digestive
Health
Immune
Health
Musculoskeletal
Health
Critical Care/
Trauma
From a competitive point of view, the market is highly concentrated with Abbot, Nestle
and Danone leading the way in APAC and globally
Key Players & Forecast
Abbot (45-55% share in APAC)
Leading Brands Ensure®, Glucerna®, Vital®, Juven®
Nestle (18-22% share in APAC)
Leading Brands: DIABETISHIELD®, PEPTAMEN®, RENALCAL®
Danone (15-18% share in APAC)
Leading Brands: FortiFit®, Souvenaid®, Nutrison®
Others include Fresenius-Kabi, Mead Johnson, Kalbe, Nutrifood and Vinamilk
Medical Foods Market: Competitive Structure, Global, 2013
Diabetes
Health
Oncology
Health
Metabolic
Health
Digestive
Health
Immune
Health
Musculoskeletal
Health
Critical Care/
Trauma
Frost & Sullivan

53
Diabetes, oncology and metabolic health are the most significant application areas, while
immune and cardiovascular promise high growth
Medical Foods Market: Principal Applications, Global, 2013
Customer Analysis
Foods targeted for type 1 and type 2 diabetes mellitusDiabetes
Foods targeted at different types of cancerOncology
Foods for metabolic disorders such as in-born errors of metabolism, hypoglycemia, milk
protein intolerance, and chronic liver diseaseMetabolic
Foods targeted for malabsorption in gastrointestinal and renal diseases such as inflammatory
bowel disease, short bowel syndrome, leaky gut syndrome, dysphagia, renal disease, and
renal failure.
Digestive
Foods for bone, muscle and joint health and musculoskeletal disorders such as osteoporosis,
sarcopenia, and fibromyalgiaMusculo-
skeletal
Frost & Sullivan

54
Appendices

55
Principal abbreviations
BRC British Retail Consortium
CAGR Compound Average Growth Rate
COA Certificate of Analysis
CRM Customer Relationship Management
DHA Docosahexaenoic Acid
EFSA European Food Safety Authority
EPA Eicosapentaenoic Acid
ERP Enterprise Resource Planning
EU European Union
F&B Food & Beverage
FDA Food and Drug Administration
FMSA Food Safety Modernization Act
GFSI Global Food Safety Initiative
GHP Good Hygiene Practice
GMP Good Manufacturing Practice
HACCP Hazard Analysis and Critical Control Points
IFS International Featured Standards
ISO International Organization for Standardization
MPC Milk Protein Concentrate
PUFA Polyunsaturated Fatty Acids
RFID Radio-Frequency Identification
SPC Soy Protein Concentrate
SPI Soy Protein Isolate
SQF Safe Quality Food Initiative
TPC Third Party Certifiers
TSP Textured Soy Protein
WPC Whey Protein Concentrate
WPH Whey Protein Hydrolysate
WPI Whey Protein Isolate
YoY Year On Year

56
Frost & Sullivan
www.frost.com
August 2016
In exclusive for Intesa Sanpaolo
All rights reserved.
The partial or full reproduction, use, distribution, publication, transmission, amendment or sale of
all or part of these document by any means and for any reason whatsoever is forbidden.
For any request, please contact [email protected]