Food habits, dietary intake and nutritional status during ... · PDF fileKEK = CED Kurang...
92
UMEÅ UNIVERSITY MEDICAL DISSERTATIONS New Series No. 885 ISSN 0346-6612 ISBN 91-7305-590-5 From Epidemiology and Public Health Sciences, Department of Public Health and Clinical Medicine, Umeå University, S-901 87 Umeå, Sweden and Community Health and Nutrition Research Laboratories, Gadjah Mada University, Jogjakarta, Indonesia and Nutrition Academy, Ministry of Health, Jogjakarta, Indonesia Food habits, dietary intake and nutritional status during economic crisis among pregnant women in Central Java, Indonesia Th. Ninuk Sri Hartini Umeå 2004
Transcript of Food habits, dietary intake and nutritional status during ... · PDF fileKEK = CED Kurang...
UMEÅ UNIVERSITY MEDICAL DISSERTATIONS
New Series No. 885 ISSN 0346-6612 ISBN 91-7305-590-5
From Epidemiology and Public Health Sciences, Department of Public Health and Clinical Medicine, Umeå University, S-901 87 Umeå, Sweden
and Community Health and Nutrition Research Laboratories, Gadjah Mada University, Jogjakarta, Indonesia
and Nutrition Academy, Ministry of Health, Jogjakarta, Indonesia
Food habits, dietary intake and nutritional status during economic
crisis among pregnant women in Central Java, Indonesia
Th. Ninuk Sri Hartini
Umeå 2004

II
Copyright: Th. Ninuk Sri Hartini Photograph: Th. Ninuk Sri Hartini and Birgitta Åström
Printed in Sweden by Print & Media, Umeå University 2004:402008
Epidemiology and Public Health Sciences, Dept of Public Health and Clinical Medicine Umeå University, SE-901 87 Umeå, Sweden

III
ABSTRACT
Objectives: The overall objective of this thesis was to study the effect of the economic crisis on food habits, dietary intake and nutritional status among pregnant women in Purworejo District, Central Java, Indonesia.
Subjects and Methods: Since 1994, the Community Health and Nutrition Research Laboratories (CHN-RL), Gadjah Mada University, Jogjakarta, Indonesia have operated a surveillance system in Purworejo District, Central Java, Indonesia. Between 1996 and 1998, a monthly monitoring of new pregnancies took place within the surveillance system. This project included a detailed evaluation of dietary intake during pregnancy. Each trimester six repeated 24-hour recalls were conducted on 450 pregnant women. Weight and mid-upper arm circumference (MUAC) were measured monthly, height and serum ferritin concentration was measured once. Here, the dietary intake and nutritional status of the women during the second trimester are evaluated in relation to the emergence of the economic crisis, that started in 1997. Women were classified into four socio-economic groups. A computer program (Inafood) was developed to calculate nutrient intake. To support the quantitative results, a qualitative study was carried out between January and June 1999. Focus group discussions were held with four groups of women, in-depth interviews with 16 women, three traditional birth attendants and four midwives, and observations were carried out with four women. Here, food habits and coping strategies in relation to the economic crisis were explored.
Results: Before the crisis, more than 80% of the pregnant women had inadequate energy and 40% had inadequate protein and vitamin A intake. All women had inadequate calcium and iron intake. The food intake consisted of rice, nuts and pulses and vegetables, meaning that it was mainly plant-based food. Rice behaved as a strongly inferior good in economic terms, meaning that its consumption increased in spite of its price increase. Rice remained an important supplier of energy, protein and carbohydrates also during the crisis. Especially, rural, poor women with access to rice fields increased their rice intake and decreased their intake of non-rice staple foods. Reasons for the continued rice intake included that the women had been accustomed to eating rice since they were born and that cooking methods for non-rice staple foods were difficult. The intake of animal food was low initially and decreased further during the economic crisis. Rich women decreased their intake of fat. The intake of nuts and pulses and vegetables increased for most groups. Nuts and pulses were an important supplier of calcium and iron, and vegetables were an important supplier of vitamin A. The rural, poor women with access to rice fields kept their food taboos also during the crisis. Rich women were able to maintain a good nutrient intake during the crisis, although fat intake decreased. Also, urban poor and rural, poor, landless women had an increased intake

IV
“during crisis” because relatives and neighbours provided some foods and perhaps also because of the government support programme.
Conclusion: Before the crisis, energy and nutrient intake of pregnant women were inadequate. The food pattern of the women was predominately plant-based. Rich women were able to maintain a good nutrient intake during the crisis, although fat intake decreased. Rural poor women with access to rice fields had a higher rice intake than other groups throughout the crisis. Urban poor and rural poor, landless women experienced a decreased intake of most nutrients in the transition period but an increased intake during the crisis, reflecting government intervention and support from relatives and neighbours. The latter, however, is not sustainable. Thus, vulnerable groups are at risk of developing nutritional deficiencies without food support programmes.
Key words: Food intake, nutrient intake, nutritional status, food pattern, pregnancy, food habits, coping strategies, economic crisis, Indonesia

V
ORIGINAL PAPERS
The thesis is based on the following papers:
I. Hartini TNS, Winkvist A, Lindholm L, Stenlund H, Surjono A, Hakimi M. Energy intake during economic crisis depends on initial wealth and access to rice fields: the case of pregnant Indonesian women. Health Policy. 2002. 61(1): 57-71.*
II. Hartini TNS, Winkvist A, Lindholm L, Stenlund H, Persson V, Nurdiati DS and Surjono A. Nutrient intake and iron status of urban and rural poor without access to rice fields are affected by the emerging economic crisis: the case of pregnant Indonesian women. European Journal of Clinical Nutrition. 2003. 57(5): 654-666.*
III. Hartini TNS, Winkvist A, Lindholm L, Stenlund H, Surjono A. Food pattern during economic crisis among pregnant women in Purworejo District, Central Java, Indonesia. Food and Nutrition
Bulletin. 2003. 24(3): 256-267.*
IV. Hartini TNS, Padmawati RS, Lindholm L, Surjono A, Winkvist A. The importance of eating rice: qualitative and quantitative study on Indonesian pregnant women’s food habits in relation to the economic crisis. Submitted.
V. Hartini TNS, Padmawati RS, Lindholm L, Surjono A, Winkvist A. The coping strategies of pregnant women during the economic crisis in Central Java, Indonesia. Manuscript.
* The original articles have been reprinted with permission from the publisher.

VI
ABBREVIATIONS
ACC/SCN Administrative Committee on Coordination/Sub- Committee on Nutrition
ASEAN Association of South East Asian Nations
Bappenas = NDPA Badan Perencanaan Nasional = National Development Planning Agency
BKKBN = NFPCB Badan Keluarga Berencana Nasional = National Family Planning Coordinating Board
BPS = CBS Biro Pusat Statistik = Central Bureau of Statistics
BULOG = NLA Badan Urusan Logistik = the National Logistic Agency
DPBD Development & Planning Board of District Level
EAR Estimated Average Requirement
FAO/WFP Food and Agriculture Organisation/ World Food Programme
GDP Gross Domestic Product
GNP Gross National Product
HFA Health for All
HKI Helen Keller International
ICN International Conference on Nutrition
IDD Iodine Deficiency Disorders
IFPRI International Food Policy Research Institute
IOM Institute of Medicine
IU International Unit
JPS = SSN Jaringan Pengaman Sosial = Social Safety Net
KEK = CED Kurang Energi Kronis = Chronic Energy Deficiency
kcal kilocalory
LIPI Lembaga Ilmu Pengetahuan Indonesia = National Institute of Sciences

VII
LPKGM = CHN-RL Lembaga Penelitian Kesehatan dan Gizi Masyarakat = Community Health and Nutrition Research Laboratories
LLA = MUAC Lingkar Lengan Atas = Mid-Upper Arm Circumference
MDS Maternal Depletion Study
MOH Ministry of Health
NGO Non Government Organisation
NPAFN National Plan of Action for Food and Nutrition
NRC National Research Council
PEM Protein Energy Malnutrition
Pelita = FYDP Pembangunan Lima Tahun = Five-Year Development Programme
RDA Recommended Dietary Allowances
RE Retinol Equivalent
Rp Rupiah (Indonesian currency)
Sida/SAREC The Swedish International Development Authority/the Swedish Agency for Research Co- operation in Developing Countries
STINT The Swedish Foundation for International Cooperation in Research and Higher Education
SUSENAS Survei Sosial Ekonomi Nasional = National Survey of Social Economy
UNICEF United Nation Children's Fund
VAD Vitamin A Deficiency
24 VASQ 24-hour Vitamin A Semi-Quantitative
VOC Vereniging Oost Indische Compagnie = Royal East Indian Company
WHO World Health Organization
Zibuvita Zinc ibu vitamin A = Zinc-mother-vitamin A study

VIII
GLOSSARY AND DEFINITIONS
Anaemia Abnormally low haemoglobin level due to pathological condition(s), defined as less than 11.0 g/dl.
Bias Deviation of results or inferences from the truth, or processes leading to such deviation. Any trend in the collection, analysis, interpretation, publication, or review of data that can lead to conclusions that are systematically different from the truth.
Bioavailibility The amount of the nutrient that reaches the blood.
Chronic energy deficiency A nutritional status corresponding to MUAC less than 23.5 cm (Indonesian definition) or body mass index less than 18.5. (International definition)
Confounder A variable that can cause or prevent the outcome of interest, is not an intermediate variable, and is associated with the factor under investigation.
Cross-sectional study A study that examines the relationship between diseases (or other health-related characteristics) and other variables of interests as they exist in a defined population at one particular time. The presence or absence of disease and the presence or absence of the other variables (or, if they are quantitative, their level) are determined in each member of the study population or in a representative sample at one particular time.
Iron deficiency Abnormal iron biochemistry with or without the presence of anaemia, defined as less than 12.0 g/l.
Power The ability of a study to demonstrate an association if one exists. The power of a study is determined by several factors, including the frequency of the condition under study, the

IX
magnitude of the effect, the study design, and sample size.
Selection bias Bias arising from the manner in which the study subjects were chosen from the entire population that theoretically could be studied.
Validity (Internal) The index and comparison groups are selected and compared in such a manner that the observed differences between them on the dependent variables under study may, apart of sampling error, be attributed only to the hypothesized effect under investigation.
Validity (External) A study is externally valid or generalisable if it can produce unbiased inferences regarding a target population.
Most definitions are obtained from: Last JM (ed). A Dictionary of
Epidemiology. Fourth Edition. New York: Oxford University Press, 2001.
X
CONTENTS
ABSTRACT............................................................................................................................ IIIORIGINAL PAPERS .............................................................................................................. VABBREVIATIONS................................................................................................................VIGLOSSERY AND DEFINITIONS.................................................................................... VIIICONTENTS............................................................................................................................. XINTRODUCTION .................................................................................................................... 11. Health and nutrition in Indonesia ......................................................................................... 1
General description of Indonesia........................................................................................ 1Food and nutritional problems............................................................................................ 2Nutrition policy and programmes in Indonesia.................................................................. 4
2. Economic development in Indonesia and the current crisis................................................ 5Economic development ........................................................................................................ 5Economic crisis .................................................................................................................... 6Government intervention ..................................................................................................... 8
3. Nutrient needs of pregnant women ...................................................................................... 8OBJECTIVES OF THE THESIS ..........................................................................................12CONCEPTUAL MODEL ......................................................................................................13METHODS .............................................................................................................................171. Study site .............................................................................................................................172. Subjects................................................................................................................................18
Quantitative study .............................................................................................................. 18Qualitative study ................................................................................................................20
3. Data collection ....................................................................................................................22Dietary intake data ............................................................................................................22Qualitative data collection ................................................................................................25Anthropometric measurements and blood samples..........................................................26Socio-economic and other background data ....................................................................26
4. Time periods in the crisis....................................................................................................275. Data quality control.............................................................................................................296. Analyses ..............................................................................................................................30
Quantitative data analyses ................................................................................................30Qualitative data analyses ..................................................................................................31
RESULTS................................................................................................................................321. Household expenditures before the crisis ..........................................................................322. Selection of women ............................................................................................................343. Effect of the crisis on food habits and food intake (Paper I, III, IV and V).....................374. Effect of the crisis on nutrient intake (Paper I and Paper II) ............................................455. Effect of the crisis on nutritional status (Paper I and Paper II).........................................48MAIN FINDINGS..................................................................................................................51DISCUSSION.........................................................................................................................531. Power and validity ..............................................................................................................53 Quantitative study ..............................................................................................................53
Qualitative study ................................................................................................................552. Dietary intake survey..........................................................................................................553. Adequacy of nutrient intake ...............................................................................................564. Food habits and food intake ...............................................................................................575. Nutrient intake.....................................................................................................................616. Nutritional status .................................................................................................................62

XI
7. Vulnerable groups...............................................................................................................63 8. Lessons learned about the dietary intake of pregnant women during the crisis...............64CONCLUSION.......................................................................................................................67 ACKNOWLEDGEMENTS...................................................................................................68 REFERENCES .......................................................................................................................71

INTRODUCTION
1
SS INTRODUCTION
1. Health and nutrition in Indonesia
General description of Indonesia
The Republic of Indonesia is the largest archipelago in the world with an aggregate land area of 1,900,000 square kilometres. It is located in Southern Asia and is situated between the Indian Ocean and the Pacific Ocean. This strategic position has always influenced the cultural, social, political and economic life of the country. There are a total of 13,667 islands. The five main islands are Sumatra, Java, Kalimantan, Sulawesi and Irian Jaya (Papua) (National Information and Communication Agency, 2001).
The population of Indonesia is about 206 million and more than 300 different ethnic groups exist. Most Indonesians are Muslims (92%), although six percent are Protestants or Catholics, two percent are Hindus and less than one percent are Buddhists. Because of the various ethnic groups and cultures, Indonesian diets consist of food from all parts of the archipelago. Agriculture remains the most important sector of the country’s economy. Indonesia has a dry season from May to October and a rainy season from November to April and the climate is tropical. The flora is very rich, and this natural resource has contributed to better living conditions for many Indonesians. About 6,000 species of plants are known to be used directly or indirectly by the people (Dept of Information, 1996). The local traditional foods are often very tasty and highly nutritious (MOH, 1995a).

INTRODUCTION
2
About 60% of the population live on Java Island. During the New Order1, general short-term and long-term developments were centralised in Java. The resulting economic growth in Java yielded a decrease in mortality, an improvement in nutritional status, and better living conditions than in other parts of the country.
Food and nutritional problems
Food is important for humans as part of social life and especially because it contains nutrients needed by humans. Unfortunately, people are not always able to access food, for various political, economic and geographic reasons. Food eaten in amounts that are too small, or too large, or that is unbalanced, results in malnutrition or diseases (WHO, 1990).
Several Indonesian reports suggest that the usual dietary intake of certain nutrients is inadequate for meeting the needs of the pregnant women and children in the country. In a study conducted in Bogor, Indramayu and Purwakarta, and Gunungkidul Districts, mean maternal energy (1,500 kcal/day) and protein intake (40 g/day) during pregnancy were low in all areas (Soekirman et al., 1992). This should be compared with several studies reported by researchers around the world indicating that mean daily energy intakes among pregnant women range from approximately 1,500 to 2,800 kcal/day (IOM, 1990). Similarly, the average dietary intake of pregnant women in Madura, Indonesia, was estimated at 1,500 kcal and 40 g of protein per day in another study (Kardjati et al., 1994). For these women, the energy deficit (77% of Recommended Dietary Allowances = RDA) was greater than the protein deficit (84% of RDA). Protein contributed 10-11% of the total energy intake. Typical of the diet of low-income households was its extremely low fat content, contributing less than 10% of the energy intake.
Still, in 1995, energy intake per capita was generally high, and only 14% of the population had a daily per capita energy intake below the Government’s recommended daily allowance (2,100
1 The New Order refers to the new regime under the second president, Soeharto. He ruled Indonesia between 1966 to 1998.
INTRODUCTION
3
kcal). Thus, overall, food availability was no longer a critical constraint in the early 1990s (GOI & UNICEF, 1995). In 2002, energy intake was 1986 kcal/cap/day and protein intake was 54.42 g/cap/day. Compared to daily allowance, the protein intake was sufficient (Ministry of Agriculture, 2004).
It is difficult to present a complete picture of the nutritional status of pregnant women in Indonesia, as most information originates from scattered surveys in various parts of the country (Soekirman et al., 1992). The nationally representative National Survey of Social Economy (Survei Sosial Ekonomi Nasional = SUSENAS) data from 2000 on the nutritional status of reproductive-aged women showed that 21.5% had chronic energy deficiency as indicated by a mid-upper arm circumference (MUAC) < 23.5 cm (MOH, 2001).
In poor societies, the prevalence of anaemia is three to four times higher than in rich societies. Globally as many as fifty-six percent of pregnant women are affected by anaemia (ACC/SCN & IFPRI, 2000). A positive sign in Indonesia has been that a national survey showed that a significant change had taken place in the prevalence of iron deficiency anaemia in pregnant women, from 63.5% in 1991 to 50.9% in 1995 (MOH, 1997). Further, a study in West Java in 1992 reported that 43.5% of women had low serum ferritin levels, no women were vitamin A deficient, but 10% had marginal vitamin A status (Suharno et al., 1993).
About 740 million people world-wide are affected by goitre, and over 38% of the population living in 130 countries are estimated to be at risk of Iodine Deficiency Disorders (IDD). In 1999, 12% of the regional population in countries in South East Asia was affected by goitre (ACC/SCN & IFPRI, 2000). The Indonesian prevalence of IDD decreased from 37.5% in 1980-1982 to 23.2% in 1988-1990. Still, iodine deficiency disorders are one of the biggest nutritional problems in Indonesia. In 1998, a national survey on IDD showed that 653 sub districts were categorised as serious and moderate endemic areas, 1169 sub districts as mild endemic areas, and 2186 sub districts as non endemic areas (MOH & WHO, 2000). Finally, by 1992,
INTRODUCTION
4
Indonesia had successfully reduced the prevalence of Xerophthalmia in children to 0.33%.
Nutrition policy and programmes in Indonesia
Food and nutrition problems are often difficult to solve because of the multitude of factors in their aetiology and maintenance. Undernutrition is a result of inadequate food intake and disease. A child who consumes a good diet but who frequently suffers from diarrhoea or fever most likely becomes undernourished. Thus, disease is the immediate causes of undernutrition (UNICEF, 1998). Poor diet and disease, in turn, are caused by food insecurity, as well as inadequate maternal and child health care. The distant causes are social structures and institutions, political systems and ideology, economic distribution, and potential resources (UNICEF, 1998).
The associations between health and national development are complex. The interaction is a two-way phenomenon, with health being both influenced by and influencing economic development. Unfortunately, improved health has for too long been considered solely a result of economic growth, a part of the product of growth, rather than one of its causes (Sorkin, 1977).
Food and nutrition policies in the poor societies have focused primarily on food production, the control of communicable diseases and education (WHO, 1990). Nutrition policies in Indonesia have developed stage by stage. In the long term, the most appropriate strategies to reduce nutrient deficiencies among pregnant women and children include improvement in dietary intake and fortification of foods with nutrients (Kodyat et al., 1996a). The latter is necessary despite an abundant supply of nutritious foods, because micronutrient deficiency, especially anaemia, remains common. Periodic iron tablet supplementation for pregnant women is the recommended short-term solution for the prevention of iron deficiency (MOH and WHO, 2000). However, according to the International Conference on Nutrition's (ICN) World Declaration on Nutrition and the plan of action for nutrition, signed by the ministers of 159 countries, the first priority should be given to food-based strategies. This is because experience has shown that the most effective and
INTRODUCTION
5
least costly approaches to reducing micronutrient deficiency problems are to increase the availability and consumption of micronutrient-rich foods (Buyckx, 1993).
To continue the progress made in improving health status, and monitoring dietary intake and growth, the Indonesian Government drew up a National Plan of Action for Food and Nutrition (NPAFN) for the years 2001-2005. The NPAFN constitutes the main guidelines for food and nutrition programmes for coordinated plans for policy makers at all levels. Specific objectives of the food and nutrition programme for the years 2001- 2005 are: a) to increase the quantity and quality of food availability through increasing production, productivity, the variety of food, and innovations in processed food; b) to increase diversity of food consumption while establishing food security at the household level; c) to improve the delivery of nutrition services in order to achieve good nutritional status by reducing the prevalence of undernutrition and overnutrition; and d) to improve the self-sufficiency of the family in attaining a healthy life by improving nutritional status (MOH & WHO, 2000).
2. Economic development in Indonesia and the current crisis
Economic development
In 1512, the Dutch landed on the Banten shore in Java. At first, the Dutch came as traders for the Royal East Indies Company (Vereniging Oost Indische Compagnie = VOC). When the VOC went bankrupt, the Dutch government took over the business in Indonesia. Until 1942, the Dutch occupied Indonesia. During World War II, the Japanese instead occupied the country. In 1945, Soekarno and Hatta proclaimed Indonesia an independent state, and Soekarno became the first president. In the early 1960s, the economic and political situation worsened in Indonesia, and there were conflicts between communists and non-communists. In 1967, Suharto became the second Indonesian president, and he consolidated his power under a new regime called the New Order. Suharto differentiated between what was necessary for economic reconstruction and for political reconstruction. He set up a developmental trilogy
INTRODUCTION
6
comprising political stability, economic growth and equality (CBS et al., 1998).
The gross national product (GNP) per capita is often used as a summary index of the relative economic well-being of people in different nations. When Indonesia started its first Five-Year Development Plan (FYDP I) in 1969, it was one of the poorest countries in the world. At that time, Indonesia's per capita income was only US$ 50, or about half that of India, Bangladesh and Nigeria (Soekirman et al., 1992). During the following three decades, Indonesia's economy underwent substantial improvement. The GNP per capita grew by 4.5% in the 1980s, and by 1990 the per capita income had reached US$ 570. The incidence of rural poverty declined from over 40% in 1976 to about 14% in 1997 (MOH, 1997).
Agriculture is the largest sector in the Indonesian economy. The increase in food crop production, particularly rice (oryza sativa)influenced the growth of the gross domestic product (GDP) and had a dominant role in the Indonesian economy (Kasryno, 2000). Rice was the most preferred cereal (Latief et al., 2000), and during 1995-1998 rice/cereal contributed 62-66% of the total energy intake (MOH & WHO, 2000). Unfortunately, lately the production has decreased whereas the demand has increased. Today, Indonesia is the largest importer of rice, the second largest importer of sugar, and it imports milk, meats and prepared products (Krisnamurti, 2003).
Economic crisis
Overall, for a period of three decades, Indonesian economic development brought higher standards of living and better diets. However, improved income is not in itself sufficient for an improvement in nutrition, because it may be that more calories are not bought with increased income. The reasons for this are that important non-food factors such as environmental hygiene and health may not be purchasable with increased income, and because much depends on how food and non-food resources are actually used in households (Gillespie, 1997).
Starting in August 1997, Indonesia unfortunately experienced a radical and rapid deterioration in its economic situation as part

INTRODUCTION
7
of the financial crisis that severely affected many Asian countries (The Jakarta Post, 1998). The prices of food and other basic necessities rose sharply amidst rapidly increasing unemployment, thus seriously eroding the purchasing power of large segments of the population. The fact that prices increased fuelled inflation, which reached 39% in March 1998, the highest level in 23 years (Shiner, 1998). The value of the Indonesian rupiah in July 1998 was a mere one-sixth of its pre-crisis value in July 1997, while inflation had soared to 46.5 percent during the first half of 1998. The situation worsened further as fears of unemployment rose (Kompas, 1998). Between 1997 and 1998, the Indonesian per capita GNP declined by 41% i.e. from US$ 1089 to 640 (World Bank, 2000).
The country’s sixth Five-Year Development Plan, FYDP VI 1994-1999, had targeted a further reduction in absolute poverty to six percent of the population (GOI & UNICEF, 1995). Despite this, more than eight million people lost their jobs following the summer of 1997 (Shiner, 1998). In short, the poverty situation started to become worse again after the summer of 1997. The Central Bureau of Statistics (BPS) reported in July 1998 that the number of Indonesians living below the poverty level had soared to 79.4 million, or about 40 percent of the population (Jawa Pos, 1998).
World-wide, many countries face economic crisis, but poor societies are today experiencing particularly unfavourable economic conditions. Absolute poverty has increased in many countries. At the same time, the basic resources needed for the well-being of future generations are being depleted at an alarming rate. In Indonesia, the Ministry of Culture and Education announced that the number of children between 12 and 15 years of age attending junior high school had dramatically declined from 70% to 58% (Kompas, 1998). While everyone will be affected by the depletion of resources, women and children are most at risk due to their subordinate position in most societies (Zapata and Godue, 1997).
Economic crisis causes food crisis, which also means that pregnant women in these countries have to consume food in less quantity and quality. It is important to note that the impact of
INTRODUCTION
8
economic crisis on food and nutrition is complex. Poverty is certainly the root cause of malnutrition (Tanski, 1994). Even so, households with the lowest incomes often develop a food consumption strategy that allows them to soften the effects of economic adjustment by maximising the nutritional potential of the foods available with the lowest relative prices (Summerfield, 1994). Still, changing food habits involves not only an acceptance of new foods but also a decrease or an increase in the quantity and variety of foods people are already familiar with. Therefore, it is difficult for people to change their food habits (Hartog et al., 1996). Further, availability of one’s own produced food will strongly influence the degree of adaptation of food habits during a crisis.
Government intervention
In response to the crisis, the Indonesian Government implemented a broad programme referred to as the social safety net programme (SSN) (NDPA, 2000). This programme had several components: a) A “low price rice” programme that aimed at ensuring food security. The government offered 20 kg rice per month at the discount price of Rp 1,000/kg to eligible poor households, b) Labour intensive programme. This programme provided employment opportunities (SMERU, 1999), c) Subsidised credit programme. Families could borrow money to start up small business (SMERU, 2000), d) Education programme, and e) Social safety net programme was implemented in the health sector. This programme provided supplementary feeding to children 4-24 months of age and to anaemic mothers, revitalized village health posts, and revitalized the nutrition surveillance system (Soekirman, 1999).
3. Nutrient needs of pregnant women
Human eating behaviour depends on both biological and cultural factors. Both perceptions and food taboos often influence food intake during pregnancy. Perceptions and food taboos are often influenced by traditions passed on from generation to generation.
A well-nourished woman, gaining 12.5 kg and giving birth to an infant weighing 3.5 kg, is estimated to require 80 000 kcal in

INTRODUCTION
9
addition to her non pregnancy energy balance (Hytten and Leitch, 1971). The 80 000 kcal are expected to cover the increased basal metabolic rate (36 000 kcal) and the synthesis of new tissue including foetal tissue, maternal fat deposits and increased blood volume (in total 44 000 kcal). Hence, the mother requires extra energy and extra intake of nutrients.
For some women, a reduction in physical activity covers part of this extra cost of pregnancy, but for many women this is not the case. Consequently, an increased intake of 300 kcal/day during the second and third trimesters is recommended for pregnant American women (NRC, 1989) and 285 kcal/day for pregnant Indonesian women (Table 1). In addition, protein intake is also critical, and overall, 0.9 kg of protein is deposited during pregnancy (Hytten, 1980). The need is low at the beginning and increases as pregnancy progresses. The recommended extra intake in the US is therefore 1.3 g/d, 6.1 g/d and 10.7 g/d for each trimester, respectively (NRC, 1989) and in Indonesia 10g/day (Table 1). Dietary protein surpluses do not accumulate. However, women in well-to-do societies on usual diets frequently consume more protein than is actually required. Under these circumstances, the extra needs of pregnancy are actually met with no significant changes in dietary intake (Akre, 1987).

INTRODUCTION
10
Table 1. Recommended Dietary Allowances of Indonesian women
Body weight (kg) Age
(year) FAO Indonesia
Energy (kcal)
Protein
(g)
Vit. A
(RE)
Calcium
(mg)
Iron
(mg)
Women 16-18 54 50 2000 55 600 700 31
19-29 55 54 2000 44 500 600 29
30-49 55 54 2100 44 500 600 29
Pregnant + 285 + 10 + 300 + 200 + 20
Source: Muhilal et al., 1998.
The primary physiological role of vitamin A involves vision and maintenance of the general health of the eyes, the immune system, growth, reproduction and epithelial tissue maintenance. During pregnancy, a daily supplement should not exceed 10 000 IU (3000 RE) (Braesco and Pascal, 2000). The Indonesian Government recommends that pregnant women consume 2300 IU or the equivalent of 700 RE (Muhilal et al., 1998). Further, calcium is the major factor in the formation of bone mineral and plays an important role as intracellular messenger in many systems and cells (Bronner and Pansu, 1999). During pregnancy the official recommendation is 900 to 1000 mg calcium per day (Muhilal et al., 1998). Finally, iron is needed during pregnancy for the growing foetus and placenta and to increase the maternal red cell mass. The iron need is equally distributed over the duration of pregnancy, but the iron requirements of the foetus are most important during the second and third trimesters. The American recommendation is an extra 30 mg of ferrous iron per day during pregnancy starting at about week 12 of gestation (IOM, 1990) and the Indonesian recommendation is an extra 30 mg/day.
Based on dietary survey, it is possible to detect any group with a low intake of one or more nutrients. In the past, Recommended Dietary Allowances (RDAs) were the only values used to assess the adequacy of nutrient intake of individuals and groups. The RDAs are supposed to cover the needs of most individuals in the population. Hence, they correspond to the estimated average requirement of the population, plus two standard deviations so that the average requirement of 97.5% of the population would be covered. The only exception is for energy, where the RDA

INTRODUCTION
11
corresponds to the estimated average requirement only, because of concerns about over-intake leading to obesity. Comparisons of individual intakes in a population with RDA may unfairly judge too many to have inadequate intake, because of the addition of two standards deviations to the median average requirement. Therefore, today intake of individuals often are compared simply with the Estimated Average Requirements (EAR) instead (National Academy of Sciences, 1997; Institute of Medicine, 1990).
The Indonesian economic crisis persisted for more than six years. As described above, the government responded to the crisis in different ways. However, the extent to which the population’s health was affected, and whether certain groups were particularly vulnerable, were unknown.

OBJECTIVES OF THE THESIS
12
OBJECTIVES OF THE THESIS
The general objective of this thesis was to study the effect of the economic crisis on food habits, dietary intake and nutritional status among pregnant women in Purworejo District, Central Java, Indonesia.
Specific objectives were:
1. To evaluate the adequacy of dietary intake before the crisis in comparison with Indonesian Estimated Average Requirements (EAR).
2. To explore food habits in relation to the economic crisis.
3. To explore the coping strategies during the economic crisis.
4. To describe the consequences of the economic crisis with respect to food intake.
5. To describe the consequences of the economic crisis with respect to nutrient intake and nutritional status.

CONCEPTUAL MODEL
13
CONCEPTUAL MODEL
In order to properly understand and investigate the effect of the crisis, a simple conceptual model was developed (Figure 1). We assume that the economic crisis directly affects food prices and incomes of the households. In Indonesia, prices increased, sometimes sharply, and real incomes dropped due to rising unemployment and increasing prices.
Figure 1. Conceptual framework for studying the effects of the economic crisis on food habits, dietary intake, and nutritional status.
Economic crisis
Food pricesand incomes
Nutritional statusNutrientintake
Food habits
PerceptionFood taboo
Government
Copingstrategies
Rich
Urban poor
Rural, poor, access to rice field
Rural, poor, landless
Other factors
Social safety net Supplementation

CONCEPTUAL MODEL
14
In the next step, food habits are likely to change due to increased prices and decreased income. If food intake changes, it may also influence nutrient intake, since different foods have different nutrient content.
For so called normal goods the demand, and thereby intake, will decrease when prices increase. However, rice in Indonesia is perhaps not a normal good in this sense, but is probably what is called a Giffen good in economic terms. A Giffen good is a strongly inferior good for which the quantity demanded increases as prices rise. Also, it should represent a large part of the household food expenditure. For example, a study done in Bangladesh reported that the people were so poor that most of their income was spent on rice. If the price of rice falls, Bangladeshi consumers may reduce their demand for rice and purchase meat or some other more nutritious food instead (Hardwick et al., 1999). Thus, this theory predicts that when the price of rice increases, rice consumption increases and households instead reduce their demand for more expensive food such as meat, chicken, etc. Hence, it seems reasonable to expect changes in the entire pattern of food intake.
However, it would be naive to expect a uniform response to price increases among people, as the income level or wealth of the household must naturally also be an important determinant of adjustments to price changes. A wealthy pregnant woman obviously has greater possibilities of handling the crisis by redistributing her income, e.g. decreasing her savings for a period of time, thereby avoiding nutritional consequences.
Thus, we can expect different responses to the crisis in different socio-economic groups. In order to classify households and identify those that were most vulnerable, we used the entitlement theory developed by Sen (1997). Sen’s theory suggests that starvation is not a consequence of physical shortage of food. Instead, the entitlement approach concentrates on the ability of people to command food through legal means that are available in the particular society. Ownership of food is one of the most

CONCEPTUAL MODEL
15
primitive property rights, and in each society there are rules governing this right. The entitlement approach concentrates on each person's entitlements to commodity bundles including food, and views starvation as resulting from failure to be entitled to a bundle with enough food.
We would expect the most severe nutritional consequences among women who are paid with money and who must get command over food through market exchange. In particular, we would expect vulnerable groups to be landless agricultural labourers and workers in industry and service. Further, the theory predicts more severe consequences from an increase in rice prices in urban areas than in rural areas. The reason for this is of course that a larger proportion of rural people have command over land through ownership or rental arrangement. Based on Sen’s theory, our hypotheses regarding the effects of the crisis on pregnant Indonesian women is shown in Table 2.
Table 2. Classification of households by means of income support in Indonesia, and expected consequences of a significant increase in rice prices.
Classification of households by means of income support
Rich Rural, poor, access to rice
field
Rural, poor, landless
Urban, poor
Command over land Not relevant Yes, by rental
/ownership
No No
Sell or buy rice Not relevant Sell Buy Buy
Increased rice price income Not relevant
Increased rice price welfare Not relevant
Increased rice price nutrition No change Less risk of malnutrition
High risk of malnutrition
High risk of malnutrition
Social and food intervention added nutrition No change No change Less risk of malnutrition
Less risk of malnutrition

CONCEPTUAL MODEL
16
Firstly, rich pregnant women obviously have greater possibilities of handling the crisis by redistributing their income. Rich women are thus treated as one sub group, irrespective of command over land. But a farmer classified as rich will of course increase their income possibilities if the rice price increases while a landless rich (for instance a teacher) will experience negative consequences such as decreased welfare. Secondly, urban poor and rural, poor, landless women are vulnerable groups, they work for wages, and they are at high risk of becoming malnourished. Thirdly, pregnant women in rural areas whose families own or cultivate rice fields have more direct access to basic food such as rice. They may increase their income and welfare when rice prices increase, since they are the sellers.
Finally, there are probably factors that modify the consequences of the crisis such as support from relatives and neighbours. Social support is beneficial to health (Stanfeld, 2000), as well as food intake. In Indonesia, a traditional pattern of social support helped the poor to get food during the crisis. This included aid from relatives and neighbours. Also, a national government can be expected to react in different ways. On the macro level, money and budget policies can be used as tools to influence prices and the labour market, the importing of food can be increased, basic foods can be subsidised, etc. In Indonesia, the Social Safety Net was implemented as described above.

METHODS
17
METHODS
1. Study site
The site used for the study was Purworejo District, Central Java, located 60 km west of Jogjakarta Province. According to the 1996 census, Purworejo District had a population of 757,000 persons (372,000 men and 385,000 women). The contour of the land in Purworejo varies from 2-325 m above sea level, so that some areas are considered hilly and others lowland. Eighty-seven percent of the people lived in rural areas, and 53% were farmers. The area used for rice fields totalled 30,600 hectares and the yearly production of rice was 283,400 tons.
Figure 2. Map of Purworejo District, Central Java Province, Indonesia.

METHODS
18
There is one government hospital, 22 primary health centres, and 48 subsidiary primary health centres. Also present in the District are one private mother and child hospital, one surgery unit, three birth centres, and several pharmacies (DPBD & CBS, 1999). Using data from the 1990 census, a crude death rate of 9.9 per 1,000 was estimated. The infant mortality rate has shown a declining pattern in the past five years, and the most recent estimates are 52 per 1,000 births (Wilopo, 2001). Infectious diseases still dominate the health condition of the population in Purworejo. The prevalence of children under five years of age with Protein Energy Malnutrition (PEM) was 5.43% in the late of 1990s (Purworejo District Health Office, 2000).
2. Subjects
Quantitative study
Since 1994, Community Health and Nutrition Research Laboratories (CHN-RL) Gadjah Mada University, Jogjakarta, has operated a surveillance system in Purworejo District. During 1994, a collaborative project between Epidemiology and Public Health Sciences, Department of Public Health and Clinical Medicine, Umeå University, Umeå, Sweden, and CHN-RL, was initiated concerning maternal and child health. The project included an Indonesian and a Swedish sub-study. The aim of the Indonesian project was to evaluate the effect of vitamin A and zinc supplementation during pregnancy on maternal and neonatal morbidity. The project was referred to as (Zibuvita) Zinc-mother-vitamin A (Zibuvita). The Zibuvita study was an individually randomised placebo-controlled, double blind trial. The target of the intervention and the unit of randomisation was the mother-infant dyad. The aim of the Swedish project was to evaluate the effect of reproduction on nutritional status (maternal depletion). It was referred to as the maternal depletion study (MDS), and was carried out within the Zibuvita study. Pregnant women were detected through the surveillance system of CHN-RL. Through this system, a list of women of reproductive age (14-49 years of age) and their marital status, date of marriage, number of children,

METHODS
19
and use of contraceptive methods was available (n = 13,094 in 1994).
Between 1996 and 1998 a monthly monitoring of new pregnancies among the women of reproductive age took place within the surveillance system. The detection of pregnancy was based on recording the date of the last menstrual period (LMP) and this was confirmed with a -HCG pregnancy kit in the field. For cultural reasons, women were excluded from intensive monitoring for pregnancy if they were not married and if they were pregnant beyond the first trimester. In total 2173 women whose duration of pregnancy was no more than 120 days, and who consented to participate, were randomised to the treatment groups of Zibuvita. Among these, in total, 846 women were invited to participate and assigned to intensive follow-up in the study of maternal depletion. The intensive group underwent anthropometric measurements, and symptoms of pregnancy morbidity were recorded monthly. Also, one blood sample and six repetitions of dietary intake data were collected every trimester (Figure 3).
970901 971130
Figure 3. Data collection periods.
1996 1997 1998
Time
Dec Mars JuneSept Sept Dec
- - - - - - - - - - - - -Before crisis- - - - - - - - - - - - - - - - Transition - - - - - - - - During crisis - - - -
(09-10)
trimester III
trimester III
trimester IIItrimester IItrimester I
trimester II
trimester IIItrimester IItrimester I
trimester IIItrimester IItrimester I
trimester IItrimester I
trimester IIItrimester IItrimester I
: Food consumption survey: Blood sample: Antropometry
- - - - - - - - - - - - - - - - - - - - -
Every trimester I, II and IIItrimester IItrimester I
trimester III
Mars

METHODS
20
In the non-intensive group, anthropometric measurements and symptoms of pregnancy morbidity were recorded monthly. The ethics committees of the Medical Faculties of Umeå University, Umeå, Sweden, and the Gadjah Mada University, Jogjakarta, Indonesia, approved the study.
The maternal depletion study included a detailed evaluation of dietary intake during pregnancy and lactation. In this thesis, information from the second trimester of pregnancy was analysed cross-sectionaly, in relation to date of data collection. Unfortunately, this module was not in place from the start of the cohort, some pregnancies were detected late in the first trimester (n = 232 missed subjects), and some were lost at the peak of the crisis because field workers had to be laid off (121), or for other reasons (43). In all, dietary data for 450 (53%) pregnant women were included in these analyses (Figure 4). The reason for selecting the second trimester was that data from this trimester were the most complete; 90% of the pregnant women who participated in the dietary study had all six recalls completed during this trimester. Some women were detected late during the first trimester and also, some women suffered from nausea and vomiting yielding inconsistent intake data. During the third trimester, some women had already delivered when the interviewer visited the women at home. Written informed consent was obtained from all women.
Qualitative study
A qualitative study was carried out between January and June 1999. This study examined the cultural pattern of food habits and coping strategies in different socio-economic and educational groups. In total, 16 women, three traditional birth attendants (TBA) and four midwives took part in in-depth interviews, 24 women took part in four focus group discussions (FGD) and four women took part in non-participant observation.
The women who participated in the qualitative study were mostly recruited from the dietary survey of 450 women. A list these women and their socio-economic status was generated. Each of the four FGDs was homogenous with respect to socio-economic status

METHODS
21
and therefore six women living in nearby villages of the same socio-economic status was chosen for each FGD. Women not participating in FGD were available as candidates to be interviewed and for observations. Based on socio-economic status, education and place of residency (hilly and coastal), women were purposively selected. Because of few urban poor women in the dietary survey, we also recruited urban poor women among participants in the larger maternal and child health study. The researchers were nutritionist, anthropologist, health economist and medical doctor from Indonesia and Sweden.
Figure 4. Sampling of quantitative and qualitative study
Married women of reproductiveage for pregnancy monitoring
n = 13,094
Pregnant womenn = 5,736
Eligible for the trialn = 3,001
Too shy = 10Migration = 4Refusal = 11
<3 repetitions = 12Others = 6Analysis
n = 450
Not eligiblefor the trial n = 2,735
Randomised and assigned to treatmentsn = 2,173
Intensive follow-up groupn = 846
Dietary surveyn = 493
Not randomised
n = 828
Non intensive follow-up group
n = 1,327
Dietary surveynot in place
n = 353
Quantitative study
Qualitative study 4 focusgroup
discussions
16 indepthinterview
4 non-participant
observations

METHODS
22
3. Data collection
Dietary intake data
Six 24-hour recalls were used in each trimester to estimate the dietary intake of individual pregnant women. The six recalls were randomly distributed over the five different days in the Javanese calendar (five days within one week). Detailed descriptions of all foods, beverages, vitamins and minerals consumed between 00.00 am and 24.00 pm the previous day, as well as cooking methods, were recorded by 22 trained female interviewers at the homes of the women. The training was carried out in two parts. The first part was theory-based and lasted one week, and the second part consisted of practical exercises and lasted three weeks. The interviewers were trained by nutritionists and an anthropologist. The interviewers usually completed the pre-coded questionnaire in 1-2 hours. We tried to have the same interviewer interview the same women. Food taboo data was collected once during second trimester.
A dietary analysis programme (Inafood) was developed to handle the data. The dietary analysis programme follows a format similar to that outlined in figure 5. In general, the analysis system involves 1) relating the food reported eaten in the questionnaire to the database by means of food codes, 2) converting portion sizes to grams consumed, 3) converting the weights of food items based on portion weight and food recipes, 4) calculating nutrient intake based on the weight of the food items and food composition tables.

METHODS
23
Figure 5. The steps in the dietary analysis system.
The first stage in the process is to identify each food item or meal according to the assigned code number. Quantities of foods eaten were estimated using several household measurements, e.g. a plate, teaspoon, bowl, glass, and about 20 types of food models, e.g. banana, fish, meat, tomato, bread. To obtain quantitative
Databases Files Example
Questionnaire
Entry
ZR-FILE
- NoID, Food Codes- Dishes or single foods- Portion size
PORTION SIZE
Weight of portion size (g)
ZRP-FILES
- Food Codes- Grams- Dishes
SFZR-FILE
- Food Codes- Grams/ingredient
NUTRISI-FILE
Nutrient intake
- Energy- Protein-Vitamins etc
RECIPE (g of ingredients/100 g dishes)
FOOD COMPOSITION
TABLE
- Indonesia- IML
1 medium bowl spinach soup1 banana
1 medium bowl spinach soup = 230.7 g1 banana = 86.3 g
1 banana = 86.3 g1 medium bowl spinach soup =
spinach = 15.8 g etc
Energy = 110.90 kcal
New, single foods
New Dishes

METHODS
24
information on the food and nutrient intake, we conducted a portion size survey. For each food item and recipe, we specified a portion size, using commonly used household measurements and food whenever possible. The average weights of portion sizes and household measurements were weighed in grams in order to estimate the nutrient contents.
In our study, the majority of the food consumed by the women were mix of dishes. We therefore conducted a community-based assessment of the food recipes and measured the food at women's houses and at field laboratories (Figure 6). Standard recipes are rare in the community and some 3,105 recipes recorded from the women were included in these analyses.
Figure 6. Weighing food and evaluating a food recipe in the field laboratory.
Nutrients in each of the ingredients in a recipe were added from food composition tables and the average content per 100 grams was calculated. The raw ingredients for all foods prepared during the observation period were weighed with a beam balance, as was
METHODS
25
the cooked food item itself. Basic cooking methods were also recorded. The most important information was the relative amounts of the ingredients and how they were processed and/or prepared.
In order to perform the calculations of nutrients, the Indonesian nutrient composition database was used in most cases (92%) (Mahmud et al., 1990; Briawan & Hardiansyah, 1990; Mukrie et al., 1995). However, in a few cases this was supplemented with databases from other countries (Siong et al., 1988). Vitamin A values were predominantly taken from the food composition table in de Pee and Bloom (de Pee & Bloom, 1999). We used the standard conversion factor of 1 g retinol = 6 g beta-carotene (FAO, 1988). Eighty-five food items not listed in the Indonesian Food Composition Table were sent to the Research and Development Centre for Nutrition, Bogor, Indonesia, for biochemical analysis (Hartini et al., 1995).
Qualitative data collection
All in-depth interviews took place in the subjects’ homes and this provided an opportunity to observe the environment and eating habits. The interview guide included questions on the effect of the crisis on food habits in general, food taboo, and the value of rice. The questions were open-ended, pre-tested on seven pregnant women and one midwife, and thereafter discussed and finalised with field supervisors and an anthropologist.
Focus group discussions were held at the village hall. Each group was homogenous with respect to socio-economic subgroups. During the discussions, the main researchers and the research assistant (anthropologist) were moderator and note taker. All interviews and discussions were conducted in the local language (Javanese), tape recorded and noted.
Direct non-participant observation of four women were performed by two of the researchers (anthropologist and nutritionist) three times a day for three days: in the morning, noon and evening. Those observations focused on the housing and environment

METHODS
26
conditions, food preparing, food processing, food serving as well as food intake of the women. Each participant completed a written consent form. No women refused to participate except one TBA who refused to be interviewed because she felt too old.
Anthropometric measurements and blood samples
Nutritional status is assessed through anthropometric measurements. In this study, anthropometric measurements on the sample of 450 women included body weight measured monthly to within 0.1 kg with a calibrated electronic scale (Seca Model 835, CMS Ltd, London, United Kingdom) with as light clothes as possible. Body height was measured once using a stadiometer with an accuracy of 0.1 cm (CMS Ltd., London, United Kingdom), and mid-upper arm circumference (MUAC) was measured monthly to the nearest mm on the left arm using insertion-type UNICEF tapes. Chronic Energy Deficiency (CED) was defined as MUAC<23.5 cm (MOH, 1995b). Ten trained field workers took anthropometric measurements. The standardisation procedures for anthropometry were carried out every sixth month. Calibration of anthropometry instruments was carried out every three months.
Specially trained nurses collected the second trimester blood sample from the women (nonfasting) at their homes. Blood samples were centrifuged in a field laboratory and analysed at the Gadjah Mada University laboratory. Serum ferritin was assessed by the IMX ferritin assay (ABBOTT Laboratories, IL, USA). Low iron stores was defined as serum ferritin <12 g/l (Cook & Skikne, 1989).
Socio-economic and other background data
During 1997, trained CHN-RL field workers using pre-coded questionnaires collected information on demographic characteristics, socio-economic status, reproductive history, and expenditures. Data on food prices were collected from the Development & Planning Board of District Level (DPBD) and the Central Bureau of Statistic (CBS) (DPBD & CBS, 1997; DPBD & CBS, 1998; DPBD & CBS, 1999). Information about ownership of

METHODS
27
rice fields and other assets such as land, pond, livestock, jewellery, radio, vehicles etc, collected by field workers during the same year as the dietary intake data were collected, was obtained mainly from the head of the household.
According to the conceptual model, the population was divided into four socio-economic subgroups. In our study area, prices were high for motorbikes and cars. In West Java a motorbike may indicate relative wealth (Achadi et al., 1995). Thus, we assumed that the group in which it was possible to buy a motorbike or a car comprised “rich” women. ”Rich” was defined by ownership of a car or motorbike irrespective of whether the pregnant women lived in a rural or urban area and irrespective of access to rice fields. ”Urban poor” was defined as living in an urban area without fulfilling the criterion for ”rich”. ”Rural poor” was defined as living in a rural area without fulfilling the criterion for ”rich”. In the last step, ”rural poor” was divided according to access to rice fields.
Pregnant women with access to rice fields included those who either had a legal certificate or those who had received the rice field as a traditional gift from their parents. It also included those who had access to rice fields through rental arrangements or as a loan from the government or through parental ownership. This subgroup was labelled ”rural, poor, access to rice field”. Finally, the fourth subgroup was labelled ”rural, poor, landless”.
4. Time periods in the crisis
Most economic crisis develop gradually, and the division into time periods is not self-evident. A crucial component in this case was the price increases, and there are nine essential commodities classified by the government, i.e. rice, cooking oil, sugar, small salty fish, salt, kerosene, block soap, polyester cloth material and cotton cloth material. Unlike prices of rice, cooking oil and sugar, the prices of the other six essential commodities did not increase sharply during the economic crisis.

METHODS
28
Based on changes in the price of rice, cooking oil and sugar, and the value of Indonesian rupiah, we defined three periods of time.
Figure 7. The prices of foods and currency during 1997 and 1998.
The first period up to August 1997 was labelled “before crisis”, and the second period from September 1997 to November 1997 was labelled “transition”. The third period from December 1997 and onwards was labelled “during crisis” (Figure 7). By limiting the transition period to November 1997, our “during crisis” period coincide with the start of the social safety net. Thus we have three relatively homogenous time periods, “before crisis” characterised by prices, “transition” characterised by increasing prices and finally “during crisis” characterised by rapidly increasing and high
0
5000
10000
15000
US dollarsCooking oilSugarRice
Month/year
1997 1998
Jan March May July Sept Nov Jan March May July
Before Transition During
Rupia
h(R
p)
METHODS
29
prices in combination with governmental activities in order to relieve the consequences.
The study design is cross-sectional, in that data on 450 women were collected during their second trimester of pregnancy, and some groups of women in this sample are compared with other groups of women in the same sample. For simplicity, in the presentation of results from the comparisons of women measured before the crisis, in the transition period and during the crisis, expressions such as “a decrease was seen among urban poor women” is used. However, it should be remembered that the underlying data do not represent longitudinal changes within individual women, but cross-sectional trends among different sub-groups of women.
5. Data quality control
A system of quality control of the anthropometric measurements, dietary intake, blood samples and other information collected was implemented in the field. We designed the structured forms to be easy to complete, easy to be checked by a supervisor, and easy with respect to data entry. The forms had a logical layout, and used a sequence based on the information that needed to be recorded by interviewers. Editing of the data forms was conducted in the field within a few days of data collection. Supervisors periodically checked the questionnaire and data during the survey. A random sample of 5% of interviews was repeated later the same day for quality control.
To validate the Inafood program, total dietary intake was calculated manually from the nutrient composition tables for four dietary recalls by students at the Nutrition Academy, Jogjakarta, Indonesia. Complete agreement was obtained with respect to energy intake. The differences in protein, fat and carbohydrates (expressed as percentage of computed total) were in the ranges of 1-15%, 0-5% and 0-3%, respectively.
METHODS
30
6. Analyses
Quantitative data analyses
We used multiple linear regression models to examine potential confounding factors when assessing the association between socio-economic groups and food and nutrient intake in relation to the crisis. These potential confounding variables (education, age, parity, household member, and job) were all found to be non-significant in the models. Also, their inclusion did not change the association between socio-economic groups and dietary intake. Hence, they were not included in further analyses.
Differences in means between the three periods among the subgroups of women were analysed using Student’s t-test or ANOVA. Vitamin A intake and serum ferritin concentration as well as animal, vegetables and fruit intakes did not exhibit a normal distribution, but were skewed to the right. These are therefore presented as median values and the Kruskal-Wallis test and the Mann-Whitney U test were used. In total, only seven women consumed vitamin and mineral supplements. For these women, the supplements contributed 26% of their calcium intake and 21% of their iron intake. Because these intakes strongly affected the mean and standard deviations of the groups, nutrient intake of vitamin and mineral supplements were excluded from the main analysis where access to food was the focus. However, in the discussion of the adequacy of total intake, supplements were included, and this is mentioned in the text.
The Pearson product moment correlation analysis was used to identify the correlation between rice intake and intake of other food groups, e.g. the correlation of consumption of rice and consumption of vegetables. Multiple linear regression models were used to examine the factors associated with serum ferritin concentration. After controlling for vitamin A and zinc supplementations within the Zibuvita study, number of iron tablets consumed and gestational age, serum ferritin and iron intake were still negatively associated with time period. Differences were considered statistically significant when the p-value was less than

METHODS
31
0.05. Statistical analyses were conducted using the Statistical Package for Social Sciences (SPSS version 9.0).
Power was calculated in the beginning of the larger maternal and child health studies to assure that the aims of those studies (Zibuvita and MDS) could be achieved. However, the data were not collected for the purpose of evaluating the economic crisis. The study presented here simply took advantage of existing data. Hence, some cells in the conceptual model contain very individuals. These small cells were not collapsed together during the analyses because the conceptual model made us expect that different socio-economic groups would be affected in different ways. Also, we expected women to behave differently in the transition period, when no government intervention programmes and few coping mechanisms were in place, compared with during the crisis.
Qualitative data analyses
Audiotapes of the focus group discussions and interviews were transcribed by the field supervisors and translated from Javanese into Indonesian, and later into English. Qualitative content analysis (Burnard, 1991; Morgan, 1993) was used. The researchers read the transcripts and discussed the contents several times to become immersed in the data. We identified meanings, values, beliefs, experience and practises that had something in common and labelled these meaning units with a heading. The headings were grouped together into more refined categories. We cut and paste the categories manually and entered these into a matrix. The matrix thus consisted of categories of refined themes (row) and participants grouped according to background characteristics (column). In this way, we compared the data according to socio-economic groups, educational level, and time period of study, and discussed contradictory points.

RESULTS
32
RESULTS
1. Household expenditures before the crisis
Women were classified into four socio-economic groups based on car/motorcycle ownership, access to rice fields and urban/rural location, as described previously. Household expenditures among those measured before the crisis is another possible indicator for classifying the socio-economic position. Table 3 presents household expenditures “before crisis”, and shows that the “rich” subgroup had the highest total, food, and non-food household expenditures. The differences between the socio-economic groups are all significant (p< 0.05). The proportions of money spent for food by each subgroup were 69%, 67 and 66% (urban poor, rural, poor, access to rice fields and rural, poor, landless) and 60% (rich), respectively. This expenditure pattern supports the classification of rich versus poor used in this thesis.

RESULTS
33
Table 3. Median household expenditures of pregnant women before crisis according to socio-demographic characteristics (n = 235).
Socio-demographic characteristics Expenditure ($)a p % b
Food expenditure Area c
Urban 23 (17-33)d
0.53e
68 Rural 24 (18-31) 65
Socio-economic groupsf
Rich 29 (21-38) <0.01g
60 Urban, poor 24 (18-30) 69 Rural, poor, access to rice field 23 (18-30) 67 Rural,poor, landless 23 (17-34) 66 Non-food expenditure
Area Urban 13 (9-17) 0.83 32 Rural 13 (9-18) 35 Socio-economic groups
Rich 20 (14-30) <0.01 40 Urban, poor 12 (9-15) 31 Rural, poor, access to rice field 11 (9-16) 33 Rural, poor, landless 12 (9-16) 34 Total expenditure
Area Urban 37 (28-47) 0.61 Rural 37 (29-48) Socio-economic groups Rich 51 (35-64) <0.01 Urban, poor 37 (29-45) Rural, poor, access to rice field 36 (28-44) Rural, poor, landless 35 (28-50) a
In 1997, the exchange rate was 4,000 rupiah per US dollar. b
Percentage of total expenditure. c
The number of pregnant women in each area (urban, n=21; rural, n=214). d
Median (25th –75th percentile).e
Mann-Whitney U Test, differences in median expenditure among pregnant women who live in urban or rural areas.
fThe number of pregnant women in each socioeconomic group (rich, n=31; urban, poor, n=16; rural, poor, access to rice fields, n=118; rural, poor, landless, n=61).
gKruskal-Wallis Test, differences in median expenditure among socio-economic groups.

RESULTS
34
2. Selection of women
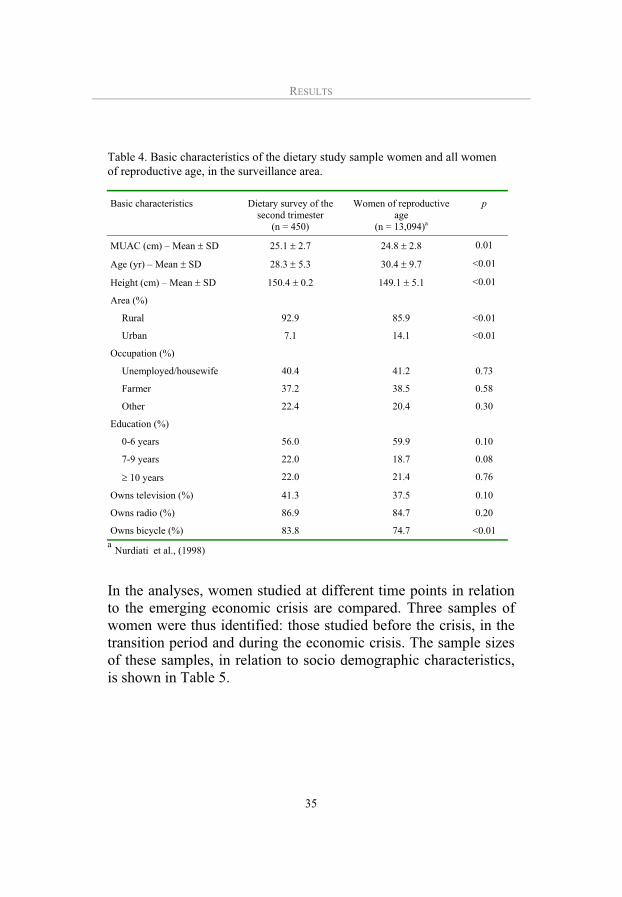
The dietary study during second trimester on 450 women was conducted between 1996 and 1998. At delivery mean gestational age was 37.9 + 4.6 weeks and infant birth weight was 3.2 + 0.5 kg. The sample of 450 women in the dietary study did not differ significantly from the 13,094 women of reproductive age in Purworejo District with respect to occupation, education and radio and television ownership (Table 4). However, a greater proportion of those included in the analysis lived in urban areas (14.1% versus 7.1%). The mean age and height of the total sample of women of reproductive age (n=13,094) in Purworejo were 30.4 +9.7 years and 149.1 + 5.1 cm, respectively, both of which differed significantly from the study sample (p<0.05). The differences were not large, but they were significant, probably because of the large size of one of the samples. Thus, in general the dietary study sample represents women of childbearing age in Purworejo District.
RESULTS
35
Table 4. Basic characteristics of the dietary study sample women and all women of reproductive age, in the surveillance area.
Basic characteristics Dietary survey of the second trimester
(n = 450)
Women of reproductive age
(n = 13,094)a
p
MUAC (cm) – Mean SD 25.1 2.7 24.8 2.8 0.01
Age (yr) – Mean SD 28.3 5.3 30.4 9.7 <0.01
Height (cm) – Mean SD 150.4 0.2 149.1 5.1 <0.01
Area (%)
Rural 92.9 85.9 <0.01
Urban 7.1 14.1 <0.01
Occupation (%)
Unemployed/housewife 40.4 41.2 0.73
Farmer 37.2 38.5 0.58
Other 22.4 20.4 0.30
Education (%)
0-6 years 56.0 59.9 0.10
7-9 years 22.0 18.7 0.08
10 years 22.0 21.4 0.76
Owns television (%) 41.3 37.5 0.10
Owns radio (%) 86.9 84.7 0.20
Owns bicycle (%) 83.8 74.7 <0.01
aNurdiati et al., (1998)
In the analyses, women studied at different time points in relation to the emerging economic crisis are compared. Three samples of women were thus identified: those studied before the crisis, in the transition period and during the economic crisis. The sample sizes of these samples, in relation to socio demographic characteristics, is shown in Table 5.

RESULTS
36
Table 5. Sample sizes for the three samples of women in relation to socio-demographic characteristics
Period Socio-demographic
characteristics Before crisis
Transition During crisis
Total
Area
Urban 21 7 4 32
Rural 214 97 107 418
Total 235 104 111 450
Socio-economic groups
Rich 31 19 27 77
Urban poor 16 5 3 24
Rural, poor, access to rice fields 118 67 63 248
Rural, poor, landless 61 11 17 89
Total 226 102 110 438a
aTwelve women rejected to be interviewed on ownership of rice fields.
In order to evaluate possible bias in the recruitment of women into the three samples, we used the variables “age” and “height”, which are not affected by the crisis (Table 6). There were no significant differences among the three time periods, “before”, “transition”, and “during crisis”, in terms of age and height in any of the socio-economic groups. Thus these data suggest that the women in the three time periods were sampled without a bias that could affect our study objectives.

RESULTS
37
Table 6. Mean age and height of pregnant women according to socio-demographic characteristics and time of data collection in relation to the economic crisis.
Period Socio-demographic
characteristics Before crisis n = 235
Transition n = 104
During crisis n = 111
p a
Age (yr) Area Urban Rural
Socio-economic groups
Rich Urban, poor Rural, poor, access to rice field Rural, poor, landless
29 + 6 28 + 5
29 + 5 28 + 6 28 + 5
28 + 5
31 + 6 29 + 6
30 + 5 31 + 7 28 + 6
28 + 4
24 + 529 + 5
28 + 6 22 + 2 29 + 5
28 + 5
0.20 0.58
0.66 0.13 0.51
0.95
Height (cm)Area Urban Rural
Socio-economic groups Rich Urban, poor Rural, poor, access to rice field Rural, poor, landless
149.5 + 4.6150.6 + 5.2
153.2 + 4.6 148.3 + 3.7 150.2 + 4.7
149.7 + 5.6
148.4 + 5.1149.8 + 4.2
151.0 + 3.6 148.2 + 6.2 149.8 + 4.2
147.5 + 4.8
148.4 + 3.8150.4 + 5.2
151.2 + 5.5 147.1 + 3.5 150.3 + 5.1
149.6 + 5.7
0.80 0.47
0.17 0.92 0.81
0.48
a Anova, differences in mean age and height for all subgroups between “before crisis”, “transition”, and “during crisis”.
3. Effect of the crisis on food habits and food intake (Paper I,
III, IV and V)
Among the pregnant women in the study, the overall daily intake of rice was approximately 250 grams per person before the crisis (Table 7). During the next two time periods, the intake of rice increased further to about 290 grams (p<0.05), even though the price of rice increased. Women gave several reasons for this food pattern, including 1) Compared to non-rice staple foods, rice has the highest nutrient value (educated women), 2) The women had been accustomed to eating rice since they were born (all women), 3) The taste of non-rice staple foods was not as good as that of rice
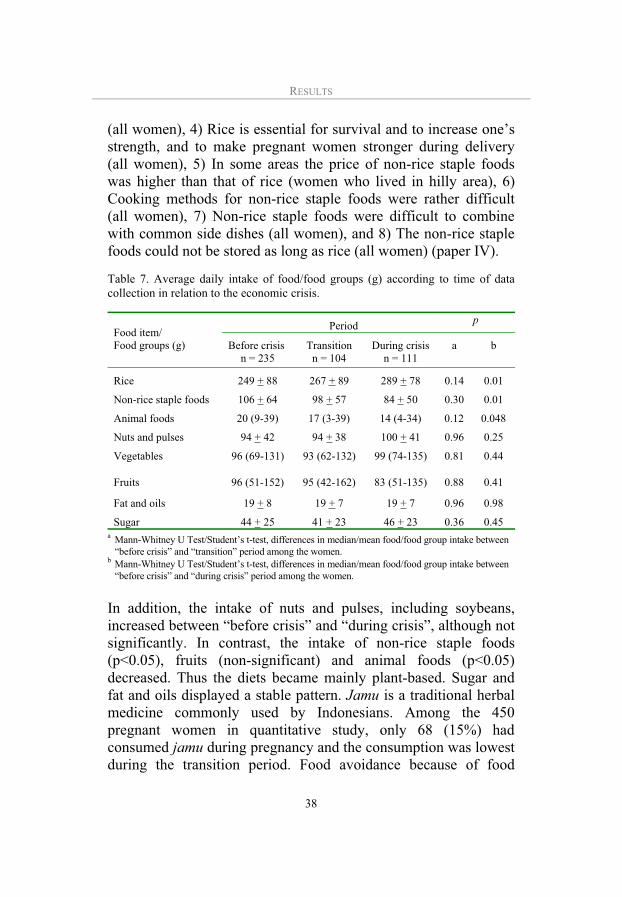
RESULTS
38
(all women), 4) Rice is essential for survival and to increase one’s strength, and to make pregnant women stronger during delivery (all women), 5) In some areas the price of non-rice staple foods was higher than that of rice (women who lived in hilly area), 6) Cooking methods for non-rice staple foods were rather difficult (all women), 7) Non-rice staple foods were difficult to combine with common side dishes (all women), and 8) The non-rice staple foods could not be stored as long as rice (all women) (paper IV).
Table 7. Average daily intake of food/food groups (g) according to time of data collection in relation to the economic crisis.
Period p
Food item/ Food groups (g) Before crisis
n = 235 Transition
n = 104 During crisis
n = 111 a b
Rice 249 + 88 267 + 89 289 + 78 0.14 0.01
Non-rice staple foods 106 + 64 98 + 57 84 + 50 0.30 0.01
Animal foods 20 (9-39) 17 (3-39) 14 (4-34) 0.12 0.048
Nuts and pulses 94 + 42 94 + 38 100 + 41 0.96 0.25
Vegetables 96 (69-131) 93 (62-132) 99 (74-135) 0.81 0.44
Fruits 96 (51-152) 95 (42-162) 83 (51-135) 0.88 0.41
Fat and oils 19 + 8 19 + 7 19 + 7 0.96 0.98
Sugar 44 + 25 41 + 23 46 + 23 0.36 0.45 a Mann-Whitney U Test/Student’s t-test, differences in median/mean food/food group intake between “before crisis” and “transition” period among the women.b Mann-Whitney U Test/Student’s t-test, differences in median/mean food/food group intake between “before crisis” and “during crisis” period among the women.
In addition, the intake of nuts and pulses, including soybeans, increased between “before crisis” and “during crisis”, although not significantly. In contrast, the intake of non-rice staple foods (p<0.05), fruits (non-significant) and animal foods (p<0.05) decreased. Thus the diets became mainly plant-based. Sugar and fat and oils displayed a stable pattern. Jamu is a traditional herbal medicine commonly used by Indonesians. Among the 450 pregnant women in quantitative study, only 68 (15%) had consumed jamu during pregnancy and the consumption was lowest during the transition period. Food avoidance because of food

RESULTS
39
taboos also existed. In total, 126 (28%) of the pregnant women avoided certain food items because of food taboos. Among the 351 occasions of avoided food items, in 103 (30%) cases the women did not know the reason for their avoidance. Our qualitative study revealed that sugar, fat and oil were regarded to make the foods tasty. Although all women interviewed believed that nutritious foods were essential to achieve maternal and foetal well-being, during the economic crisis, most women preferred to serve tasty foods rather than nutritious foods, for themselves and their families. All women interviewed reported that although they knew that pregnant women need extra food, the husband and children ate first at meal times (Paper IV).
The women worried not only about the increases in food prices, but also about increases in fees of education and health care survices. One women interviewed said (Paper V):
“Although I keep some chicken in our home garden, I and my family do not consume these. Instead I sell them, because my children need more funds for studying at the High School. During the crisis, not only the price of foods and other basic necessities have increased, but the education fees also have increased”.
With regard to the socio-economic groups, a significant increase in rice intake was observed for the rural, poor women with access to rice fields between “before crisis” and “during crisis” (p<0.05) (Paper I, Table 3). Concurrently, non-rice staple foods intake in this subgroup decreased, and the difference was significant (p<0.05). Rich women decreased their animal food intake. Rural poor landless increased their consumption of nuts and pulses (p<0.05) between “before crisis” and “during crisis” (Paper III, Table 2).
In the short-run of the economic crisis, rich women had sufficient money for buying foods although they decreased their savings. Women with access to rice fields felt secure about maintaining rice

RESULTS
40
consumption “during the crisis”. Some women with access to rice fields stored the rice production in the rice barn.
Relatives and neighbours commonly assisted the poor families with foods, especially with rice and vegetables. Further, more than 70% of the women cultivated different varieties of vegetables and fruits in their home gardens. Other food sources were sea shores, lands, rivers, ponds and grasslands (Figure 8). Food productions from these resources were primarily consumed by the women and their families. Compared to before crisis, the percentage of women who kept duck in the home garden increased during the crisis (p<0.05) (Paper V).
Figure 8. A woman freely picking the water spinach in a grassland.
The contributions of various foods to nutrient intake are illustrated in Table 8. Rice played a dominant role in the daily intake of nutrients. Before the crisis, rice provided 48% of the energy intake, 38% of the protein intake and 62% of the carbohydrate

RESULTS
41
intake. Most calcium intake (27%) and iron intake (38%) were derived from nuts and pulses. The food item in the nuts and pulses group that was of most importance to calcium and iron intake was fermented soybeans (tempe). The main source of fat was shown to be fat and oils (44%), and in particular cooking oil was important. The dominant contributor of vitamin A intake was vegetables (53%). Spinach (Amaranthus Hibridus) and cassava leaves were the largest source of vitamin A.
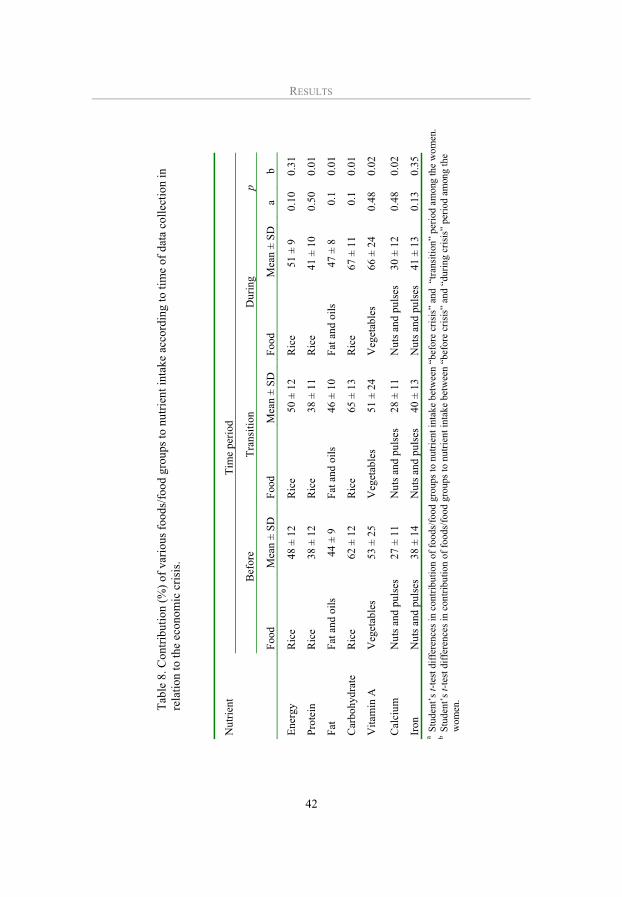
Tab
le 8
. Con
trib
utio
n (%
) of
var
ious
foo
ds/f
ood
grou
ps t
o nu
trie
nt i
ntak
e ac
cord
ing
to t
ime
of d
ata
coll
ecti
on i
n re
lati
on to
the
econ
omic
cri
sis.
T
ime
peri
od
Nut
rien
t
Bef
ore
Tra
nsit
ion
D
urin
g
p
Foo
d M
ean
± S
D
Foo
d M
ean
± S
D
F
ood
Mea
n ±
SD
a
b
Ene
rgy
Ric
e 48
± 1
2 R
ice
50 ±
12
R
ice
51 ±
9
0.10
0.31
Pro
tein
R
ice
38 ±
12
Ric
e 38
± 1
1
Ric
e 41
± 1
0 0.
500.
01
Fat
F
at a
nd o
ils
44 ±
9
Fat
and
oil
s 46
± 1
0
Fat
and
oil
s 47
± 8
0.
10.
01
Car
bohy
drat
e R
ice
62 ±
12
Ric
e 65
± 1
3
Ric
e 67
± 1
1 0.
10.
01
Vit
amin
A
Veg
etab
les
53 ±
25
Veg
etab
les
51 ±
24
V
eget
able
s 66
± 2
4 0.
480.
02
Cal
cium
N
uts
and
puls
es27
± 1
1 N
uts
and
puls
es28
± 1
1
Nut
s an
d pu
lses
30 ±
12
0.48
0.02
Iron
N
uts
and
puls
es38
± 1
4 N
uts
and
puls
es40
± 1
3
Nut
s an
d pu
lses
41 ±
13
0.13
0.35
a Stu
dent
’s t-
test
dif
fere
nces
in
cont
ribu
tion
of
food
s/fo
od g
roup
s to
nut
rien
t in
take
bet
wee
n “b
efor
e cr
isis
” an
d “
tran
siti
on”
peri
od a
mon
g th
e w
omen
. b S
tude
nt’s
t-te
st d
iffe
renc
es i
n co
ntri
buti
on o
f fo
ods/
food
gro
ups
to n
utri
ent
inta
ke b
etw
een
“bef
ore
cris
is”
and
“dur
ing
cris
is”
peri
od a
mon
g th
e
wom
en.
RESULTS
42

RESULTS
43
The correlations between consumption of rice and side dishes (animal foods, nuts and pulses, vegetables and fruits) in each time period are presented in Figures 9, 10 and 11. Before crisis, a positive significant correlation (p<0.05) between the intake of rice and pulses plus vegetables was found (Figure 9). This means that the more rice a woman consumed, the more pulses she also consumed. A different pattern was found regarding rice and animal foods. In this case the correlation was negative: the more rice the less animal foods. For rice and fruits the correlation was positive but weak.
Figure 9. Correlation between intake of rice and intake of animal foods, nuts and pulses, vegetables and fruits among pregnant Indonesian women before crisis.
Mainly the same pattern was found for the next two time periods as well (Figures 10 and 11). In conclusion, the food intake of the women was predominately plant-based food in all three periods. Concurrently, the women tended to decrease their already low consumption of animal foods.
veg – rice (r = 0.32)**
fruit – rice (r = 0.09)
pulses – rice (r = 0.25)**
animal – rice (r = -0.08)
** p <0.001
6005004003002001000
500
400
300
200
100
0
Rice consumption (g)
An
ima
l fo
od
, n
uts
an
d p
uls
es,
fru
itand
ve
ge
tab
les
(g)
x

RESULTS
44
6005004003002001000
500
400
300
200
100
0
Rice consumption (g)
An
ima
l fo
od
, n
uts
an
d p
uls
es,
fruit
and
ve
ge
tab
les
(g)
x
Figure 10. Correlation between intake of rice and intake of nuts and pulses, animal foods, fruits and vegetables among pregnant Indonesian women in transition period.
Figure 11. Correlation between intake of rice and intake of animal foods, nuts and pulses, vegetables and fruits among pregnant Indonesian women during crisis.
* p <0.01 ** p <0.001
veg – rice (r = 0.29)*
fruit – rice (r = 0.01)
pulses – rice (r = 0.38)**
animal – rice (r = -0.08)
6005004003002001000
500
400
300
200
100
0
Rice consumption (g)
An
ima
l fo
od
, n
uts
an
d p
uls
es,
fru
itand
ve
ge
tab
les
(g)
x
veg – rice (r = 0.33)**
fruit – rice (r = 0.06)
pulses – rice (r = 0.20)*
animal – rice (r = -0.05)
* p <0.01 ** p <0.001

RESULTS
45
4. Effect of the crisis on nutrient intake (Paper I and II)
Mean nutrient intakes in the period before the crisis are shown in Table 9. Energy, vitamin A, calcium or iron intakes were lower than the Indonesian EARs. Overall, more than 40% of the pregnant women had inadequate protein, vitamin A, or calcium intakes and all women had inadequate iron intakes. With regard to socio-economic groups, before the crisis there was a tendency towards a higher intake of carbohydrates, vitamin A, calcium and iron among urban women as compared to rural pregnant women; this was significant. Likewise, there was a significantly different intake “before crisis” for protein and fat for the different socio-economic groups, with higher values for rich women compared to other subgroups (p-valuees in interval 0.00-0.04) (Paper II, Table 2).
Table 9. Average energy and nutrient intake per day before the crisis and percentage of pregnant Indonesian women with a nutrient intake below Indonesian Estimated Average Requirements (EARs) (n=235).
Nutrient Nutrient intake EARs Percentage of EARs
Prevalence of inadequacy a(%)
Energy (kcal) 1875 + 534 2200-2400 78 82
Protein (g) 46 + 14 43-52 c 109 40
Fat (g) 44 + 17 40-42 d - -
Carbohydrate (g) 327+95 270-285 e - -
Vitamin A (IU) 1540 (717-1961) f 2100-2400 c 79 74
Calcium (mg) 360 + 140 640-720 c 56 96
Iron (mg) 14 + 5 39-41 c 36 100
a Proportion of pregnant women with nutrient intake below the EARs. b Mean + SD. c Indonesian EARs (Muhilal, 2002). d A general recommendation is that the fat content of the Indonesian diet should not exceed 20% of
the caloric intake (Muhilal et al, 1998). e A general recommendation is that the carbohydrate content of the Indonesian diet should be at
least 60% of the caloric intake (MOH, 1995). f Median (25th – 75th percentile).

RESULTS
46
Table 10 shows significantly higher mean intakes of calcium and iron when including the information on supplements (p<0.05). However, even when these intakes of vitamin and mineral supplements were included in the analyses, more than 95% of women still had inadequate calcium and iron intakes, respectively. This reflects the fact that only seven women out of 450 were consuming supplements.
Table 10. Differences in calcium and iron intake with and without supplements (n = 450).
Nutrient Nutrient intake
without supplement
Nutrient intake
with supplement
p
Calcium (mg) 360 ± 138 466 ± 304 <0.01
Iron (mg) 14 ± 5 17 ± 8 <0.01
Comparisons of nutrient intakes according to time-period are presented in Table 11. When comparing “before” and “transition”, there were no significant changes in energy, protein, carbohydrates, calcium or iron intake, but a significant increase in vitamin A intake. In the comparison between “before crisis” and “during crisis”, a significant increase in carbohydrate intake was observed (p<0.05).
Regarding the different socio-economic groups, there was a significant decrease in energy (Paper I, Table 2), protein, fat, carbohydrate and calcium intake among the urban poor between “before crisis” and “transition”. The rural, poor, landless tended to decrease their protein, fat, vitamin A, calcium and iron intake, although the differences were not significant. Hence, these two subgroups seemed to be the vulnerable groups during the transition period. Rich women experienced a significant decrease in fat “during crisis” compared to “before crisis” (p<0.05) (Paper II, Table 2).
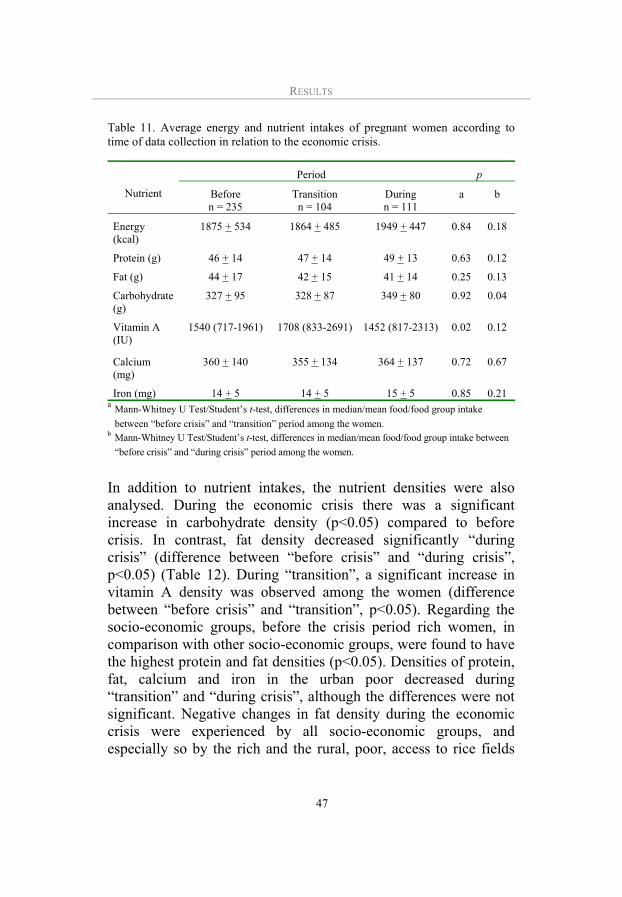
RESULTS
47
Table 11. Average energy and nutrient intakes of pregnant women according to time of data collection in relation to the economic crisis.
Period p
Nutrient Before n = 235
Transition n = 104
During n = 111
a b
Energy (kcal)
1875 + 534 1864 + 485 1949 + 447 0.84 0.18
Protein (g) 46 + 14 47 + 14 49 + 13 0.63 0.12
Fat (g) 44 + 17 42 + 15 41 + 14 0.25 0.13
Carbohydrate (g)
327 + 95 328 + 87 349 + 80 0.92 0.04
Vitamin A (IU)
1540 (717-1961) 1708 (833-2691) 1452 (817-2313) 0.02 0.12
Calcium (mg)
360 + 140 355 + 134 364 + 137 0.72 0.67
Iron (mg) 14 + 5 14 + 5 15 + 5 0.85 0.21 a
Mann-Whitney U Test/Student’s t-test, differences in median/mean food/food group intake
between “before crisis” and “transition” period among the women.b Mann-Whitney U Test/Student’s t-test, differences in median/mean food/food group intake between
“before crisis” and “during crisis” period among the women.
In addition to nutrient intakes, the nutrient densities were also analysed. During the economic crisis there was a significant increase in carbohydrate density (p<0.05) compared to before crisis. In contrast, fat density decreased significantly “during crisis” (difference between “before crisis” and “during crisis”, p<0.05) (Table 12). During “transition”, a significant increase in vitamin A density was observed among the women (difference between “before crisis” and “transition”, p<0.05). Regarding the socio-economic groups, before the crisis period rich women, in comparison with other socio-economic groups, were found to have the highest protein and fat densities (p<0.05). Densities of protein, fat, calcium and iron in the urban poor decreased during “transition” and “during crisis”, although the differences were not significant. Negative changes in fat density during the economic crisis were experienced by all socio-economic groups, and especially so by the rich and the rural, poor, access to rice fields
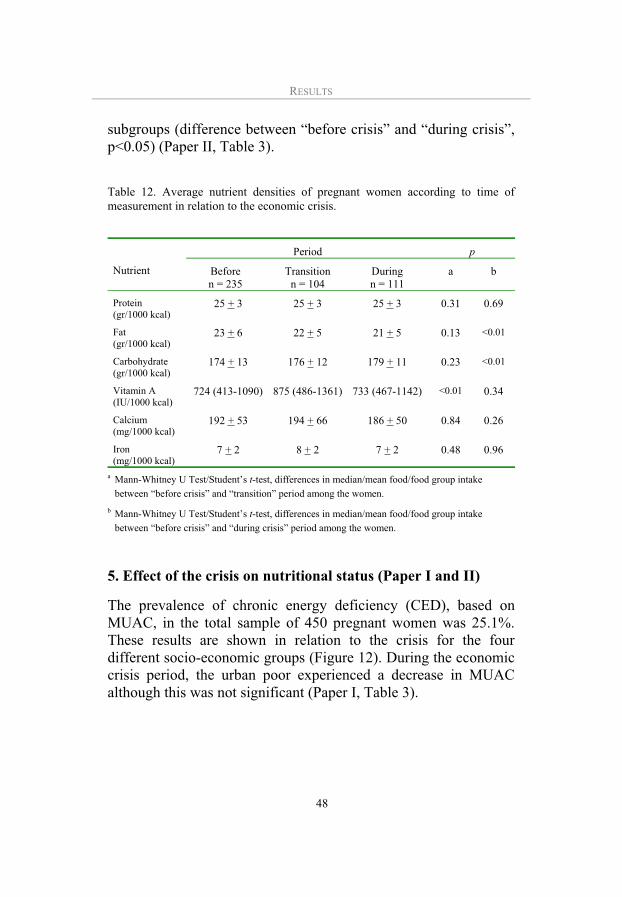
RESULTS
48
subgroups (difference between “before crisis” and “during crisis”, p<0.05) (Paper II, Table 3).
Table 12. Average nutrient densities of pregnant women according to time of measurement in relation to the economic crisis.
Period p
Nutrient Before n = 235
Transition n = 104
During n = 111
a b
Protein (gr/1000 kcal)
25 + 3 25 + 3 25 + 3 0.31 0.69
Fat(gr/1000 kcal)
23 + 6 22 + 5 21 + 5 0.13 <0.01
Carbohydrate (gr/1000 kcal)
174 + 13 176 + 12 179 + 11 0.23 <0.01
Vitamin A (IU/1000 kcal)
724 (413-1090) 875 (486-1361) 733 (467-1142) <0.01 0.34
Calcium (mg/1000 kcal)
192 + 53 194 + 66 186 + 50 0.84 0.26
Iron (mg/1000 kcal)
7 + 2 8 + 2 7 + 2 0.48 0.96
a Mann-Whitney U Test/Student’s t-test, differences in median/mean food/food group intake
between “before crisis” and “transition” period among the women.
b Mann-Whitney U Test/Student’s t-test, differences in median/mean food/food group intake
between “before crisis” and “during crisis” period among the women.
5. Effect of the crisis on nutritional status (Paper I and II)
The prevalence of chronic energy deficiency (CED), based on MUAC, in the total sample of 450 pregnant women was 25.1%. These results are shown in relation to the crisis for the four different socio-economic groups (Figure 12). During the economic crisis period, the urban poor experienced a decrease in MUAC although this was not significant (Paper I, Table 3).

RESULTS
49
Figure 12. Mid upper arm circumference (MUAC) of pregnant women according to socio-economic groups and time period of data collection.
The median serum ferritin concentration was 13.5 (8.1-21.4) g/lin the total sample. The total prevalence of low ferritin stores was 42%. With respect to socio-economic groups, between the “before crisis” and “transition” periods, there was a significant decrease in serum feritin concentration among the rural, poor, landless (Figure 13, p<0.05). Between the “before crisis” and “during crisis” periods, a significant decrease in serum ferritin concentration occurred among the urban poor (p<0.05). In contrast, a significant increase in serum ferritin concentration was experienced by the rich women between “before crisis” and “during crisis” (Paper II, Table 4).
Before crisis Transition During crisis
22
23
24
25
26
27
28
Rural, poor, landlessRural, poor, access to rice fieldUrban, poorRich
Period
MU
AC
(cm
)
Socio-economic groups

RESULTS
50
Figure 13. Serum ferritin concentration of pregnant women according to socio-economic group and time period of data collection.
Rural, poor, landlessRural, poor, access to rice fieldUrban, poorRich
Before crisis Transition During crisis
0
5
10
15
20
Se
rum
ferr
itin
(g/d
l)
Socio-economic groups
Period
Rural, poor, landlessRural, poor, access to rice fieldUrban, poorRich
Before crisis Transition During crisis
0
5
10
15
20
Se
rum
ferr
itin
(g/d
l)
Socio-economic groups
Period

MAIN FINDINGS
51
MAIN FINDINGS
Objective Results
To evaluate the adequacy of dietary intake before the crisis in comparison with the Indonesian Estimated Average Requirements (EARs)
1. Before crisis, more than 80% of the pregnant women had inadequate energy, and more than 40% had inadequate protein and vitamin A intake.
2. Almost all women had inadequate calcium and iron intake.
To explore the food habits in relation to the economic crisis
1. During the economic crisis, tasty foods were more importantthan nutritious foods
2. Twenty eight percent of women observed food taboos. Most avoided food items were beneficial or neutral. In 30% of taboo consumers, the women did not know the reason for the avoidance.
3. In general, 15% percent of women consumed jamu
(traditional medicine)
4. Rice was believed to have the highest value for survival, to give strength and to be easier to store and cook than non-rice staple foods
5. Husband and children had the highest priority to receive foods at meal times
To explore the coping strategies during the economic crisis
1. Rural, poor, landless and urban poor women borrowed rice and vegetables, and/or were given by relatives and neighbours.
2. Rich women did not change the kind of foods eaten, but they decreased the portion sizes of expensive foods such as meat, milk and fish.
3. Rural, poor with access to rice fields stored or borrowed rice in rice barn managed by the staff of village office.
4. Fish, eel, shrimp and shell fish picked from rivers, ponds and sea shores were regarded as common goods.
5. More women kept ducks in their home gardens during the economic crisis than before the crisis (p<0.05).
6. A family selling assets such as window or door is likely a very poor family.
7. Some rich women borrowed money to start a small business.
8. Most of women worried about the increase of school fees and health care costs.

MAIN FINDINGS
52
To describe the consequences of the economic crisis with respect to food intake.
1. The food patterns consisted of rice, nuts and pulses, and vegetables, meaning that food intake was mainly plant-based.
2. Rice remained an important supplier of energy, protein and carbohydrates during the economic crisis
3. Rice behaved as a Giffen good.
4. Nuts and pulses were an important supplier of calcium and iron.
5. Vegetables were an important supplier of vitamin A.
6. During crisis, the rural, poor with access to rice fields increased their intake of rice and decreased their intake of non-rice staple foods (p <0.05).
7. During crisis, rich women decreased their consumption of animal food (p<0.05).
To describe the consequences of the economic crisis with respect to nutrient intake and nutritional status.
1. Before crisis, the carbohydrate, vitamin A, calcium, and iron intake of urban, poor women were the highest (p<0.05).
2. The protein, fat, carbohydrate, and calcium intakes of urban poor decreased during the transition (p<0.05).
3. Rich women experienced a significant decrease in fat intake “during crisis” (p<0.05).
4. Negative changes in fat density during crisis were experienced by rich and the rural, poor, access to rice fields subgroups (p<0.05).
5. A significant increase in carbohydrate densities was seen for the rich and rural, poor, access to rice fields (p<0.05).
6. Urban poor experienced decreased MUAC (not significant) and decreased serum ferritin concentration during crisis (p<0.05).
7. Rich women experienced a significant increase in serum ferritin concentration during crisis (p<0.05).

DISCUSSION
53
DISCUSSION
In this thesis, the consequences of the economic crisis with respect to the food and nutrition of pregnant Indonesian women were studied. Food habits, food intake, nutrient intake and nutritional status were investigated by means of in-depth interviews, focus group discussions, observation, survey questions, anthropometric measures and blood samples. Based on the price levels of three basic commodities, the period under study was divided into three different parts: “before crisis”, “transition” and “during crisis”. The study was carried out in both urban and rural areas. Although the quantitative study design was cross-sectional, data were collected over several years, and thus this study can present a picture of the consequences of the economic crisis in terms of food intake, nutrient intake and nutritional status among pregnant women. In addition, the qualitative study addressed similar issues as the quantitative study. Taken together, the two studies provide a coherent picture of food and nutritional consequences of the crisis.
1. Power and validity
Quantitative study
Power is the probability of claiming a significant result when it is indeed true. Sample size and standard deviation influence the statistical power of a study (Altman, 1991). During the emerging crisis in Indonesia, the burden of the food deficit fell mainly on urban pregnant women, whose intake of certain nutrients decreased substantially. In our sample only 32 women (7%) lived in urban areas, which is somewhat lower than the figure for the entire district (14%). Thus our urban sample was small, and this of course influenced our ability to find significant differences

DISCUSSION
54
because of inadequate statistical power. The sample size could not be increased by combining different periods or different socio-economic groups, because of theoretical reasons as described in our conceptual model.
Selection bias may arise due to the selection procedure. All data used in the study came from a population-based study. As mentioned previously, for cultural reason only married pregnant women were included in this study. Still, another study conducted in West Java, Indonesia, found that most of the pregnant women studied (98.5%) were married (Achadi et al., 1995). Further, a national study of 27,000 households in 27 provinces reported that basically all births in Indonesia occur within marriage (CBS et al., 1998). Hence, likely only a small group of women were excluded in the sampling procedure. However, that small group of women likely differs markedly from the women included here in term of social networks, health and nutrition. Finally, no homeless women were included in the sample, as the surveillance system was based on ownership of home. However, even during the crisis homeless people was more of a phenomenon in large cities.
In this study, the three samples selected “before crisis”, “transition” and “during crisis” were used to evaluate the crisis effects. Hence, an assumption is that these three samples do not differ in a way that would make such comparison in valid. However, the three samples did not differ between each other with respect to age and height, thus indicating that all three samples came from the same target population.
Women were classified into four socio-economic groups, because it was assumed that socio-economic status would provide women with different means for responding to the crisis. The classification was based on assets in 1997, before the crisis, including car, motorcycle and rice fields. Outcome variables are different from these sets of variables. Outcome variables includes food habits and dietary intake, from any source, from 1997 and onwards.

DISCUSSION
55
Qualitative study
In the qualitative study, we used triangulation to improve the validity (or credibility) of the information. Triangulation can improve the credibility of how well we have captured the informant’s view during the economic crisis. We used triangulation in data methods collection, in that we collected observation data, interview data and focus group discussion data. We also used triangulation in subjects, in that these data were collected from women, traditional birth attendants and midwives. Finally, we used triangulation in researchers. In this study the researchers were anthropologist, nutritionists, health economist, and medical doctor from Indonesia and Sweden.
The main researchers were familiar with the study area, because they have been working in the area since 1990 in several studies (prolonged engagement). The sample sizes for the different qualitative modules were deemed sufficient for the purpose of this research, in that data collection ceased when no substantial new information was obtained (level of redundancy reached).
2. Dietary intake survey
The primary objectives of a dietary intake survey are to gain knowledge about the levels, patterns and habits of dietary intake of various population groups in the country (United Nations, 1984). For most epidemiologic investigations of dietary intake and disease, relative rankings of food and nutrient intakes are adequate for determination of correlation or relative risk (Buzzard, 1998).
However, for some objectives, individual intakes are needed. For each study objective, various types of surveys exist (Hartog & Staveren, 1983). We used the 24-hour recall method for several reasons. First, in Indonesia the 24-hour recall is the method of dietary assessment most commonly used to investigate the actual food items consumed. Second, detailed information about food quantities can be relatively easily obtained. Third, changes in intake over time can be assessed.

DISCUSSION
56
The weighing method is sometimes used for dietary assessment, but it is difficult, time-consuming to conduct, and expensive. Also, the dietary history method of dietary assessment is used to estimate an individual’s usual intake over some period of time (e.g. one year). Therefore, the dietary history method may not represent the typical diet over a short period and can not capture changes over a short period of time (Rush & Kristal, 1982). During pregnancy, the diet is expected to change over a short time period. In this situation, the 24-hour recall method may be most suitable.
However, the memory and communication ability of the subjects and the skills of the interviewer may affect the validity of the 24-hour recall method. To improve the accuracy of the dietary data collected, data collection in our study was administered only by well-trained interviewers using common sets of household measures and food models to estimate the portion sizes of food consumed. Six recalls were used to obtain the average nutrient intake, and this should be sufficient to measure the intake with reasonable precision (Launer et al., 1991). Further, we have shown that two or three repetitions are sufficient to measure most macro-nutrients (Persson et al., 2001).
The 24-hour recall method is known to underestimate dietary intake (Block, 1982), and our estimates are probably affected by this error as well. However, our ratio of energy intake to basal metabolic rate before crisis was 1.55 (Winkvist et al., 2001). This indicates that underestimation is a minor problem in our study. Also, even when taking the possibility of underestimation into account, the intake of our sample of women was low, especially for certain subgroups.
3. Adequacy of nutrient intake
In this study, we used the Indonesian EAR (Muhilal et al., 2002) for pregnant women to evaluate energy and nutrient intakes before the crisis. However, recommendations for carbohydrate intake were derived from the US (NRC, 1989). The entire nutrient intake
DISCUSSION
57
of more than 40% of the pregnant women was inadequate, meaning that more than 40% of them were at high risk of developing nutrient deficiency. Although foods are abundant in Indonesia, nutrient deficiency (CED, vitamin A deficiency, anaemia, IDD) remains a serious public health problem. The government should continue promoting nutritious natural food, increase food production, distribute nutrient supplements to vulnerable groups and continue food fortification.
4. Food habits and food intake
In general, our study indicates that the pregnant Indonesian women mainly had a similar food pattern in each time period. The food pattern consisted of rice, nuts and pulses, vegetables, sugar, fat and oils, and only small amounts of animal foods. This means that they consumed basically plant-based food. The findings reported by Tatala et al., (1998) are similar to our results. He and his colleagues found that people in Lindi District of Tanzania consumed a plant-based diet.
In Indonesia, rice is the preferred staple food and this is especially so in Java (Sumarno et al., 1997). All pregnant women in this study already consumed large amounts of rice before the crisis. During the time of the crisis, the consumption of rice increased, especially among the “rural, poor, access to rice field” subgroup (Hartini et al., 2002). This subgroup was not only a rice consumer, but it was also a rice producer. This dual position provide two options: the women could sell the rice they produced in the market or they could keep it for their own consumption. During the crisis the price of rice increased, primarily because of an expected decrease in domestic production due to changes in the rainfall pattern. In response, the government imported large amounts of rice, and the imported rice was supplied at subsidised prices, yet higher than the price was before the crisis. Hence two parallel markets existed, one for imported rice and one for locally produced rice. Since the price of local rice was higher, farmers faced problems selling local rice and most farmers likely kept most of it for use by their own household.
DISCUSSION
58
Even so, to some extent all subgroups increased their intake of rice “during the crisis”, and this reaction is not in conflict with economic theory. As mentioned earlier, rice probably can be considered as a Giffen good, meaning that the intake will increase when the prices increase. During the crisis, rice provided more than 50% of the daily energy intake, 30% of the daily protein intake and 65% of the daily carbohydrate intake. Also, the Food and Agriculture/World Food Programme (FAO/WFP) (FAO/WFP, 2000) reported that poor households in Indonesia continued to consume normal quantities of rice during the crisis.
The Indonesian Government has for the last decade been encouraging people to eat a wide variety of staple foods, i.e. cassava, corn, sweet potatoes, potatoes, etc. (MOH, 1995a). Until the 1980s, Indonesia was self-sufficient in rice (Kasryono, 2000). However, since then the country has had to import rice to provide an adequate supply and today Indonesia is the largest rice importer in the world. To avoid this dependence on other countries, the government is promoting diversification of staple food and other foods. In spite of this, the pregnant women in our study decreased their intake of non-rice staple foods and instead increased their intake of rice. It is not clear whether this was a rational choice by the households. This depends on the relative prices and the relative nutrient content of different foods. However, a switch from rice to non-rice staple foods is not easily undertaken, as human selection of food intake is influenced by multiple sensory, cultural and economic factors (Messer, 1989).
Our qualitative study illustrated these difficulties and reported that a change from rice to other non-rice staple foods is difficult because the rice was believed to have the highest value for survival, to give strength during pregnancy and delivery and to be easier to store and cook. The non-rice staple foods were also difficult to combine with commonly used side dishes.
A “low rice price policy”, or subsidised rice, has existed in Indonesia during the last three decades of agricultural development (Kasryono, 2000), and this also applies to cooking oil and sugar

DISCUSSION
59
(Wasito et al., 2000). The government sells subsidised rice in the market and all groups who want the rice can buy it. The price of rice sold to all Indonesians is higher than the price of rice sold to the poor. During the crisis, the Indonesian Government responded quickly to the effects of the economic crisis, and designed the Social Safety Net programme to lessen the impact of the crisis on the poorest people. One component of this programme involved the improvement of food security, and this intervention provided poor households with substantially subsidised rice (NDPA, 2000). It may have been as a result of this programme that an increase in energy intake as well as in rice consumption was detected “during crisis” among the urban poor and the rural, poor, landless women in our sample.
Unlike rice, nuts and pulses, vegetables and sugar, the intake of animal food decreased significantly during crisis for rich subgroups (Hartini et al., 2003b). In Indonesia (Hartini et al., 2003b), meat is generally an expensive source of protein, but it became even more so during “transition” and “during crisis”. Consequently, the intake of meat among all subgroups was low and become significantly lower “during crisis” in rich women. For rich women, also fat intake decreased “during crisis” (Hartini et al., 2003a). The price increase for animal foods most likely affected the fat intake. Although animal foods are recognised as nutritious and healthful, the pregnant Indonesian women were unable to purchase those foods. The same was found for pregnant Gambian women (Prentice et al., 1993). Further, the meat was eaten rarely among pregnant Iranian women, usually only on special occasions, and the intake of dairy products was also low (Rad et al., 1998). Finally, among pregnant women in South Malawi the contribution of meat, poultry and fish to energy intake was less than 5% (Hundle et al., 1998).
The intake of nuts and pulses increased during crisis among the Indonesian women, particularly in rural, poor landless women, and this food group, particularly fermented soybeans or tempe, was the predominant source of calcium and iron (Hartini et al., 2003b). Tempe is an original Indonesian food that is consumed especially

DISCUSSION
60
in Java (Rahardjo, 1997). It is a healthy food (Karyadi and Yip, 1997) that can, for example, shorten the duration of acute diarrhoea in children (Soenarto, 1997). Unfortunately, providing an adequate supply of soybeans is a problem in Indonesia, and the Indonesian Government must therefore import soybeans from abroad (Kasryono, 2000).
Overall, the consumption of vegetables increased in all subgroups during the crisis, despite a price increase. On the other hand, increases in the price of fruits had a negative effect on the intake of fruits, particularly among urban, poor. However, the prices for fruits were higher than prices for vegetables, which can explain the observed changes.
Fat and oils in meals provide energy and make foods more palatable. However, during the crisis the prices of sugar and fat and oils increased sharply. Overall, the intake of both cooking oil and sugar remained stable “during crisis” but many women explained that they purchased cheaper oil “during crisis”. Likewise, a study done by Wasito et al., (2001) in Jakarta and Kalimantan reported that “during crisis” the consumption of rice, vegetable oil and sugar remained relatively stable. The Indonesian food guidelines recommend that at most, 25% of total energy should come from fat (MOH, 1995a). Our results indicate that fat and oils contributed only 9% of the energy intake. Thus, consumption is still much lower than the recommended level. Therefore, the decrease in fat intake among rich women during the economic crisis was probably not beneficial.
Overall, food intake of the poor was affected by the price changes. During the crisis, the food pattern of the pregnant women appeared to become less varied, because they decreased their intake of non-rice staple foods, animal foods and fruits. Although extra food is needed by women during pregnancy, the food intake of the pregnant women in our study was insufficient for their needs. These changes in the pregnant women’s food intakes were similar to those of Indonesians in general (Kodyat et al., 1996b; Latief et al., 2000). However, the lives of women in the family differ from

DISCUSSION
61
those of men and children. Women are the last family members to eat, even when they are pregnant. Hence, their intake will likely not exceed that of other family members.
5. Nutrient intake
In general, the pregnant women in this study already had an energy intake below the Indonesian RDA of 2,200-2,400 kcal/day before the emerging crisis. Similarly, other studies conducted in Indonesia, in Madura, Bogor, Indramayu, Purwakarta and Gunungkidul Districts, found the mean maternal energy intake during pregnancy to be 1,500 cal/day (Kardjati et al., 1994; Soekirman et al., 1992). In our study, women from large households and urban poor women experienced a significant decrease in their energy intake during the emerging crisis. As predicted by our conceptual model, rural, poor, landless women also experienced a decrease, although this was non-significant. Surprisingly, the Indonesian Ministry of Health reported that the energy intake of the Indonesian population was not influenced by the crisis (Latief et al., 2000). Our study thus illustrates the importance of monitoring the food intake of vulnerable groups.
Protein intake “before crisis” among the pregnant Indonesian women in the present study was similar to that reported in pregnant Southern Malawian women (Huddle et al., 1998) and in a previous study of pregnant women in East Java, Indonesia (Kardjati et al., 1994). Rich women experienced a significant decrease in fat intake “during crisis”, compared to “before crisis” (p<0.05). The mean consumption of carbohydrates “before crisis” among the pregnant Indonesian women in the present study was higher than that for pregnant women in developing countries such as Mexico (Hunt et al., 1987), Malawi (Huddle et al., 1998) and Brazil (Vitolo et al., 1997).
Vitamin A intake is reported to vary in different developing countries. Pregnant Mexican women (Hunt et al., 1987) consumed more vitamin A than women in our sample. Compared to another study in other areas of Indonesia, vitamin A intake in our sample

DISCUSSION
62
was lower (Kardjati et al., 1994; Latief et al., 1997). Calcium intake in the present Indonesian study was lower than in pregnant women in other developing countries (Huddle et al., 1998; Prentice et al., 1993; Rad et al., 1998, Hunt et al., 1987; Vitolo, et al., 1997). Finally, iron intake was similar to that observed in the Malawian study (Gibson & Huddle, 1998), but lower than in the South Indian study (Sundararaj & Pereira, 1973).
As the crisis was emerging, the urban poor experienced a significantly decreased intake of energy, protein, fat and calcium and a close to significantly decreased intake of iron. In the same period the rural, poor, landless women predominantly experienced poorer protein and calcium density, perhaps indicating less milk intake. However, rice intake as well as nutrient densities increased among the rural, poor women with access to rice fields subgroup. The rich also maintained their superior dietary intake in the transition period.
During the crisis, the nutrient intake was higher in urban than in rural areas, although the difference was non-significant. Few tendencies toward decreased nutrient intake or nutrient density during the crisis were seen in our data, except that rich women experienced a significant decrease in fat intake, and both the rich and the rural, poor, access to rice fields’ subgroups experienced decreased fat density concurrent with increased carbohydrate density. The latter subgroup also experienced increased protein density, perhaps indicating a larger consumption of rice from their fields.
6. Nutritional status
In this study, MUAC and serum ferritin concentration were used to evaluate the effect of the crisis on nutritional status, as neither MUAC nor serum ferritin is much affected by the pregnancy state. There was no significant effect of the crisis on mothers’ nutritional status as reflected in MUAC. This may be because of too short a time between the emergence of the crisis and individual measurements as well as small sample size of urban poor women.

DISCUSSION
63
In this study, the serum ferritin concentration of the urban poor and the rural, poor, landless subgroups decreased “during crisis”. These two subgroups also experienced lower iron intake during “transition” and “during crisis” (Hartini et al., 2003a). The results of our study are similar to those of the Helen Keller International study (HKI). In 1998 and 1999, the HKI study in Central Java, Surabaya and Jakarta reported an increased prevalence of anaemia, an indicator of iron deficiency among women of reproductive age, compared to data from June 1996 (HKI, 1999).
According to a survey in East Jakarta in 1999, the food aid programme had reached 46.6% of households. The nutritional status of mothers remained relatively unaffected by the economic crisis, while the nutritional status of their children was influenced by the economic crisis (Wasito et al., 2001). In sum, while the cases of malnutrition attributable to the economic crisis are debatable, there is no doubt that a significant number of people in Indonesia are still struggling to secure their food (Soekirman, 2001).
7. Vulnerable groups
Our results are consistent with the theory developed by Sen (1997), in that the negative effects of the emerging economic crisis was most evident among the vulnerable groups. The most affected by the economic crisis was the urban poor. Further the rural, poor, landless subgroup was at high risk to become malnourished. The pregnant poor women with access to rice fields are dependent on agricultural activities for their income. Because of rising prices for agricultural production, their incomes most likely increased, leading to a higher intake of nutrients. Hence, this subgroup did not exhibit similar effects of the crisis as did the two vulnerable groups.
”During crisis” the rural, poor women with access to rice fields and the rural, poor, landless subgroups experienced higher intakes of most nutrients than “before crisis”, due to help from relatives or neighbours or consumption of their own production, indicating the

DISCUSSION
64
existence of food support. These alternative ways of obtaining food are less available in the urban areas. Hence, during crisis, the urban population will be at higher risk (Wasito et al., 2001). However, in a long-term economic crisis, relatives and neighbours who help the poor may face the same problems in their efforts to fulfil their basic needs, as the prices of basic needs remain high. How long will these relatives and neighbours continue to help by supplying these poorer individuals with food?
8. Lessons learned about the dietary intake of pregnant women
during the crisis
Our findings, which cover the issues of food habits, food and nutrient intake and nutritional status before crisis and during crisis, suggest that there are several useful lessons to be learned about the effect of an economic crisis on the dietary intake of vulnerable groups and their coping strategies.
First, developing and using a dietary analysis programme system (Inafood programme) in the study provided good dietary intake data and helped identify groups at higher risk of developing malnutrition. The Inafood programme rapidly analysed the dietary intake data, and is both simple and useful. Even so, the experience gained from developing and using this programme reveal several limitations. Fore one thing, it is difficult to calculate the nutrient intake of consumed food that is not listed in the Indonesian food composition tables. Also, the labels of some pre-packaged foods do not include any information of nutrient content; hence, their nutrient contents were estimated from similar food items. Still, these food items constituted a very minor part of these women’s diets.
Second, we found that rice consumption increased during the economic crisis and that rice remained an important supplier of energy, protein and carbohydrates. This indicates that the women had not yet diversified their staple foods, but continued to consume rice. Dependence on rice affects the rice supply and rice prices. In anticipation of poor harvests and to stabilise both the rice

DISCUSSION
65
supply and rice prices, the government should develop a food stock programme (Caliendo, 1979). This means that if the harvest is good, the government buys foods (rice, corn, etc.) from the farmers, and during poor harvests the government sells food to the people. There is a Government Institution (BULOG = the National Logistic Agency), which is responsible for distributing and stabilising the price of rice. However, misuses of authority by the BULOG have been revealed. Also, rice barns (Figure 14) system had been developed by some villages to sustain the food security. Although the government has responded to the crisis, the use of funds and the cost-effectiveness of the Social Safety Net should be evaluated and be made more easily understandable. Furthermore, the Indonesian Government should continue to recommend a frequent diversification of staple foods into corn or various tubers and plants.
Figure 14. Traditional rice barn (where you store rice) from Lombok Island, East Indonesia.

DISCUSSION
66
Third, Indonesia has been facing this economic crisis for more than six years. In the short-run of the economic crisis, ownership of food is an important property right, and the Indonesian experience demonstrates that rice fields, lands and home gardens are very helpful in meeting food needs. One lesson to emerge from the experiences of the rural, poor women with access to rice fields is that in order to reform the economic programme and increase incomes, the government should take the agricultural sector into consideration. For example, the government should support research and irrigation systems for non-rice staple foods. There have been not only increases in the price of food and basic necessities, but school fees and health costs also have increased. This means that coping strategies related not only to getting foods but also to general well-being had to be developed.

CONCLUSION
67
CONCLUSION
In conclusion, the results of our study show that before the crisis, energy, vitamin A, calcium and iron intake of the women were inadequate. The food pattern of the pregnant Indonesian women was predominately plant-based food. The women consumed inadequate food already before the crisis. Rice was the most important food item. When the price of rice increased, the consumption of rice increased and the consumption of expensive foods such as meat, milk decreased. During the crisis, rice remained an important supplier of energy, protein and carbohydrates. Rural poor women with access to rice fields had a higher rice intake than other sub-groups throughout the crisis. Compared to non-rice staple foods, rice was regarded superior for several reasons: The women had been accustomed to rice since they were born, the taste of rice was better than that non-rice staple foods, rice is essential for survival and to make pregnant women stronger during delivery, cooking methods for rice was easier, rice was easier to combine with common side dishes. For all women, the intake of animal food was low initially and decreased further. Nuts and pulses were an important supplier of calcium and iron and vegetables were important supplier of vitamin A. Rich women were able to maintain a good nutrient intake during the crisis, although their fat intake decreased. Urban poor and rural poor, landless women experienced decreased intake of most nutrients in the “transition” period, but increased intake “during crisis”. To maintain the food security at home, the women developed several coping strategies. As an acute reaction to the crisis, relatives and neighbours gave foods to the poor women. Rice fields, lands, and home gardens constituted important food resources and income for women and their families.

ACKNOWLEDGEMENTS
68
ACKNOWLEDGEMENTS
I wish to express my most sincere gratitude to all my friends and colleagues who have helped me to complete this work, and in particular:
I would like to thank all the women in Purworejo District who participated in the study and shares their practises and experiences on food habit.
I am deeply grateful to the Division of Epidemiology, Department of Public Health & Clinical Medicine, Umeå University, Umeå, Sweden, for the opportunity to study in Umeå. Particular thanks are due to the department head, Stig Wall, for his comments and support.
I wish to acknowledge the Community Health and Nutrition Research Laboratories (CHN-RL), Gadjah Mada University, Jogjakarta, Indonesia: Professor Soenarto Sastrowijoto, Dr. Siswanto Agus Wilopo, Professor Djaswadi Dasuki, Professor Djauhar Ismail, for encouraging me and for giving me a chance to work in the laboratories. To Tunjung, Rosadi, Sigit, Eko, Pithok, Ermi, Utari, Bagus, Fadjar, Antari, Nurwicaksono, Nuriani, Arifin, Fatah, Yuni, Wahab and all the staff and field workers at CHN-RL, for being supportive, for doing data collection and cleaning the data.
I would also like to thank the following organisations for funding the project: Sida/SAREC (the Swedish International Development Authority/the Swedish Agency for Research Cooperation in Developing Countries), Mother Care, John Snow Inc., Washington, D.C, USA, UNICEF, Jakarta, Indonesia, and the World Bank through the Community Health and Nutrition Development Project of the Ministry of Health, Indonesia (IBRD Loan No. 3550-IND).

ACKNOWLEDGEMENTS
69
I would like to thank to all the teachers at the Division of Epidemiology, Department of Public Health & Clinical Medicine, Umeå University, Umeå, Sweden, for sharing their knowledge and experience.
I wish to acknowledge the Minister and Staff at the Ministry of Health, for support and for my leave of absence.
I am very grateful to the Head and the staff at the Ministry of Health-Provincial Level, Jogjakarta, for support and for my leave of absence.
I am particularly grateful to the Director and to colleagues and staff at the Nutrition Academy, Jogjakarta, for support and for my leave of absence.
A special thanks to Anna Winkvist, my supervisor, who always gives me a better perspective regarding my work, for your solid supports, for your valuable comments on my work, for your concerns for the details.
A special thanks to Lars Lindholm, Hans Stenlund and Professor Achmad Suryono, my co-supervisors, who always give me a better perspective regarding my work, for their valuable comments on my work and for supports. Thank you Lars for introducing me health economics and for your concerns for the details. Thank you Hans for excellent guidance through the statistical advice. Thank you Pak Surjono for excellent guidance through the research.
I am grateful to my co-authors: Professor M Hakimi, Detty Siti N, Viveka Persson and Siwi, for being supportive, your valuable criticism and for our collaboration.
A special thanks to Tonny Sadjimin, Michael JD and Marry Serdula, for our work together developing the dietary intake survey and for fruitful collaboration.
I am particularly thankful to Eva Lundin, Måns Rosén, Agneta Hörnell, Urban Janlert and Curt Löfgren for valuable advices and comments.

ACKNOWLEDGEMENTS
70
I am also grateful to Anna-Lena Johansson, Kjerstin Dahlblom, Lena Mustonen, Birgitta Åström, Anita Nilsson, Susanne Walther, Jerzy Pilch and Karin Johansson for providing me with invaluable support and for offering me their friendship.
Special thanks to Indonesian students, Yusuf Jauhari and his family for support, for helping to make this work more enjoyable and for being a friend around the corner and for the hospitality in Umeå on many occasions.
Special thanks to Birgitta Åstrom. Thanks for all for your support and for the excellent layout, for helping to make this work more enjoyable and for being a sister.
To my late parents, and to my brothers and sisters, for encouraging me to continue my studies.
To my beloved husband, Arie, and my children, Ria and Angga, for their patience, support and love long distance.

REFERENCES
71
REFERENCES
ACC/SCN and IFPRI. Nutrition Throughout the Life Cycle. Fourth Report on the World Nutrition Situation. Switzerland:ACC/SCN and IFPRI, 2000.
Achadi EL, Hansell MJ, Sloan NL and Anderson MA. Women’s nutritional status, iron consumption and weight gain during pregnancy in relation to neonatal weight and length in West Java, Indonesia. Int J
Gyn Obs 1995;48 Suppl:S103-S119.
Akre J. Infant feeding: The physiological basis, Bull WHO 1987;67(Suppl):55-65.
Altman DG. Practical Statistics for Medical Research. London: Chapman and Hall, 1991.
Block GA. Review of validation of dietary assessment methods. Am J
Epidemiology 1982;15:492-505.
Braesco VA and Pascal G. Vitamin A in pregnancy: requirements and safety limits. Am J Clin Nutr 2000;71 (suppl):1325S-33S.
Briawan D and Hardiansyah. Penilaian dan Perencanaan Konsumsi
Pangan. Bogor: Gizi Masyarakat-Institut Pertanian Bogor, 1990.
Broner F and Pansu D. Nutritional aspects of calcium absorption. J
Nutr 1999;129:9-12.
Burnard P. A method for analysing interview transcripts in qualitative research. Nurse Education Today 1991;11:461-466.
Buyckx, M. The International Community's Commitment to Combating
Micronutrient Deficiencies. Food, nutrition and Agriculturure. FAO, Vol. 7, 1993.
Buzzard IM and Sievert YA. Research priorities and recom-mendation for dietary assessment methodology. Am J Clin Nutr 1994; 59(1): 275S - 280S.
Caliendo MA. Poverty and its relationship to malnutrition: Strategies
for increasing the purchasing power of the poor in Nutrition and the world food crisis. New York: Macmillan publishing Co., Inc, 1979.
REFERENCES
72
Central Bureau of Statistics, BKKBN, MOH and Macro International Co. Indonesia, Demographic and Health Survey, 1997. Jakarta: CBS, 1998.
Cook JD and Skikne BS. Iron deficiency definition and diagnosis. J
Internal Med 1989;226:349-355.
Department of Information. Republic of Indonesia. Indonesia 1996.Jakarta: Promosi Citra Indonesia, 1996.
de Pee S and Bloom M. 24-VASQ Method for Estimating Vitamin A
Intake (24-hour Vitamin A Semi-quantitative). Draft. Helen Keller International (HKI) Asia Pacific Regional Office, Jakarta, 1999.
Development & Planning Board of District Level and Central Bureau of Statistic. Purworejo Dalam Angka 1996 (Purworejo in Figures
1996). Purworejo:DPBD & CBS, 1997.
Development & Planning Board of District Level and Central Bureau of Statistic. Purworejo Dalam Angka 1997 (Purworejo in Figures
1997). Purworejo:DPBD & CBS, 1998.
Development & Planning Board of District Level (DPBD) and Central Bureau of Statistics (CBS). Purworejo Dalam Angka 1998 (Purworejo
in Figures 1998). Purworejo:DPBD & CBS, 1999.
Food Agricultural Organization (FAO). Requirements of vitamin A, iron, folate and vitamin B-12. Food Nutr Ser 1988;23:74-75.
FAO/WFP Special Report (2000): Global information and early
warning system on food and agriculture. FAO/WFP crop and food supply assessment mission to Indonesia. http://www.fao.org/giews/english/alertes/1999/srins994.htm. Available from Internet. Accessed 2000, September 9.
Gibson RS and Huddle JM (1998): Suboptimal zinc status in pregnant Malawian women: its association with low intakes of poorly available zinc, frequent reproductive cycling and malaria. Am J Clin Nutr 1998; 67:702-709.
Gillespie S. Nutrition and Poverty. ACC/SCN Symposium Report,
Nutrition Policy Paper, November, 1997.

REFERENCES
73
Goverment of Indonesia (GOI) and UNICEF. The Situation Analysis of
Children and women in Indonesia: A Summary, Jakarta: GOI & UNICEF, August, 1995.
Hardwick P, Langmead J and Khan B. An Introduction to Modern
Economics. 5th edition. Singapore: Addison Wesley Longman Singapora (Pte) Ltd. 1999.
Hartini TNS, Dibley MJ, Serdula M, Sadjimin T and Puspitaningrum E. Analisis Kandungan Zat Gizi Makanan Mentah dan Masak. Jogjakarta: Gadjah Mada University, 1995.
Hartini TNS, Winkvist A, Lindholm L, Stenlund H, Surjono A, Hakimi M. Energy intake during economic crisis depends on initial wealth and access to rice fields: the case of pregnant Indonesian women. Health
Policy. 2002. 61(1):57-71.
Hartini TNS, Winkvist A, Lindholm L, Stenlund H, Persson V, Nurdiati DS and Surjono A. Nutrient intake and iron status of urban and rural poor without access to rice fields are affected by the emerging economic crisis: the case of pregnant Indonesian women. Eur J Clin
Nutr 2003a; 57(5):654-666.
Hartini TNS, Winkvist A, Lindholm L, Stenlund H, Surjono A. Food pattern during economic crisis among pregnant women in Purworejo District, Central Java, Indonesia. Food and Nutr Bull 2003b; 24(3):256-267.
Hartini TNS, Padmawati RS, Lindholm L, Surjono A, Winkvist A. The importance of eating rice: qualitative and quantitative study on Indonesian pregnant women’s food habits in relation to the economic crisis. 2004, Submitted.
Hartog, AP, Ramsaransing G, Heijden LV, Van Staveren WA. Migration, nutrition and the elderly. Food habits of elderly Hindustani women in Utrecht, the Netherlands, Scan J Nutr 1996: 40(S81-S83):87-90.
Hartog, AP and Van Staveren WA. Manual for Social Surveys on Food
habits and Consumption in developing Countries. Pudog Wageningen, 1983.
REFERENCES
74
Helen Keller International (HKI). The Posible Impact of the Indonesian
Crisis on Maternal and Child Survival through Micronutrient
Deficiencies: trends toward Higher Rates of Malnutrition in Urban Slums. Jakarta:HKI, 1999.
Huddle JM, Gibson R and Cullinan TR. Is zinc a limiting nutrient in the diets of rural pregnant Malawian women? Br J Nutr 1998;79:257-265.
Hunt IF, Murphy NJ, Martner-Hewes PM, Faraji B, Swendseid ME, Reynolds RD, Sanches A and Meijia A. Zinc, vitamin B-6 and other nutrients in pregnant women attending prenatal clinics in Mexico. Am J
Clin Nutr 1987;46:563-569.
Hytten FE and Leitch I. The Psychology of Human Pregnancy. Second edition, Oxford: Blackwell Scientific Publications, 1971.
Hytten FE. Nutrition. In: F Hytten and G Chamberlain, eds. Clinical
Physiology in Obstetrics. Oxford: Blackwell Scientific Publications, 1980.
IOM, Institute of Medicine, Committee on Nutritional Status during Pregnancy and Lactation. Food and Nutrition Board: Nutrition During
Pregnancy. Washington, D.C: National Academy Press, 1990.
Jawa Pos. Setelah Penduduk Miskin 79,4 Juta (Indonesian Poverty are
79.4 millions), July 4, p. 4, 1998.
Kardjati S, Kusin JA and Renqvist UH. Nutrition during Pregnancy In:
Maternal and Child Nutrition in Madura, Indonesia. The Netherlands: Royal Tropical Institute, 1994.
Karyadi D and Yip R. Berbagai keunggulan tempe untuk meningkatkan status gizi kesehatan. Paper presented in National symposium on
Pemanfaatan tempe untuk peningkatan status gizi dan kesehatan,
Jakarta, October 13, 1997.
Kasryno F. Redesigning agriculture development as the driving force of Indonesia’s economic growth: Strengthening food security and poverty. Prosiding Widya Karya Nasional Pangan dan Gizi VI (National
Symposium on Food and Nutrition). 29 Februari-2 March.
Proceedings. Jakarta:LIPI, 2000.

REFERENCES
75
Kodyat BA, Mukrie N, Latief D, Alhabsyi A and Palupi L. Indonesian Weaning Food Program (lesson learned). Paper in the International
Workshop on infant and young child feeding. Surabaya, January 14-18,
1996a.
Kodyat BA, Minarto, Raoef R, Sianturi G and Iryanis. Status konsumsi Gizi di Indonesia: Analisis data survei konsumsi gizi tahun 1995. Gizi
Indonesia 1996b;21:40-55.
Kompas. Rupiah Indonesia makin terpuruk. June 18, 1998, No. 344.
Krisnamurti B. Food security module Indonesia. Paper in International Conference: Roles of Agriculture Project. Rome, Italy, October 20-22, 2003.
Last JM. A dictionary of epidemiology, Fourth edition. New York: Oxford University Press, 2001.
Latief D, Harianto B and Kartono J: Penanggulangan kekurangan energi kronis pada ibu hamil dengan pemberian makanan tambahan. Gizi Indonesia 1997;12:20-30.
Latief D, Atmarita, Minarto, Johari A and Tilden R. The Tendency of Household Dietary intake Before and During the Crisis in Indonesia. Prosiding Widya Karya Nasional Pangan dan Gizi VI (National
Symposium on Food and Nutrition). 29 February-2 March.
Proceedings. Jakarta:LIPI, 2000.
Launer L, Kardjati S, Kusin J and Reed G. Patterns of variability in the nutrient intake of nutritionally vulnerable pregnant women. Eur J Clin
Nutr 1991;45:131-138.
Mahmud MK, Slamet DS, Apriyanto RR & Hermana. Komposisi Zat
Gizi Pangan Indonesia. Jakarta: Dit. Bina Gizi Masyarakat dan Pusat Penelitian dan Pengembangan Gizi, 1990.
Messer E. Methods for Studying Determinants of Food Intake. In
Research Methods in Nutritional Anthropology, Edited by Pelto GH, Pelto PJ, Messer E. The United Nations University, 1989.
Ministry of Agriculture. Situasi konsumsi dan keragaman pangan penduduk Indonesia tahun 2002. http://www.deptan.go.id/
REFERENCES
76
HomePageBBKP/susenas2002/susenasPKP.htm. Available from Internet. Accessed 2004 February 3.
Ministry of Health, Indonesia. Nutritional guidelines for Indonesia
(basic messages). Jakarta: Directorate of community nutrition, MOH, 1995a.
Ministry of Health, Indonesia. Pedoman penggunaan alat ukur lingkar
lengan atas (MUAC) pada wanita usia subur. Jakarta:MOH, 1995b.
Ministry of Health, Indonesia. Indicators for Evaluation HFA. Jakarta: Centre for Health Data-MOH, 1997.
Ministry of Health (MOH) and WHO. National Plan of Action on Food
and Nutrition 2001-2005. Jakarta: MOH & WHO, 2000.
Ministry of Health, Indonesia. Profil kesehatan Indonesia 2000.
Jakarta: Pusat Data dan Informasi, 2001.
Morgan, D.L. Qualitative content analysis: A guide to paths not taken. Qualitative Health Research 1993;3:112-121.
Muhilal. Peran gizi dalam meningkatkan kualitas sumber daya
manusia: Telaah dari aspek biokimia gizi hingga pedoman gizi seimbang. Pidato pengukuhan jabatan Guru Besar dalam ilmu gizi (Inaugural Speech). Bandung: Universitas Padjadjaran, 2002.
Muhilal, Jalal F and Hardiansyah. Angka Kecukupan yang Dianjurkan (RDA). Prosiding Widya Karya Nasional Pangan dan Gizi VI
(National Symposium on Food and Nutrition). 17-20 Februari 1998.Proceedings. Jakarta:LIPI.
Mukrie NA, Chatijah S, Mosoar S, Alhabsyi A, Djasmidar, Bernadus HA, Mahmud MK, Hermana, Dewi SS. Rossi RA, Soebagyo S and Dedy M. Daftar Komposisi Zat Gizi Pangan Indonesia. Jakarta: Dirjen Binkesmas- Dit. Bina Gizi Masyarakat, Pusat Penelitian dan Pengembangan Gizi, 1995.
National Academy of Science. Dietary Reference Intakes: Calcium, Phosporus, Magnesium, Vitamin D and Fluoride. Food and Nutrition Board, Institute of Medicine, Washington DC: National Academy Press, 1997.

REFERENCES
77
National Development Planning Agency (NDPA). Indonesia’s social
safety nets, programs and safeguarding activities. http://www.pin-jps.or.id/data/publikasi/JPS-English1.htm. Available from Internet. Accessed 2000 May 16.
National Information and Communication Agency, Republic of Indonesia. Indonesia 2001. Jakarta: National Information and Communication Agency, 2001.
National Research Council (NRC). Recommended Dietary Allowances,10th ed. Washington, DC: National Academy Press, 1989.
Nurdiati DS, Hakimi M, Wahab A and Winkvist A. Concurent prevalence of chronic energy deficiency and obesity among women in Purworejo, Central Java, Indonesia. Food and Nutr Bull 1998; 19:321-333.
Persson V, Winkvist A, Hartini TNS, Greiner T, Hakimi M and Stenlund H. Variability in nutrition intakes among pregnant women in Indonesia: Implications for the design of epidemiological studies using the 24-h recall method. J Nutr 2001;131:325-330.
Prentice A, Lasley MA, Shaw J, Hudson GJ, Day KC, Jarjou LM, Dibba B and Paul A. The calcium and phosphorus intakes of rural Gambian women during pregnancy and lactation. Br J Nutr
1993;69:885-896.
Purworejo District Health Office. Profil Kesehatan Kabupaten Purworejo (Purworejo District Health profile) 1999. Purworejo: District Health Office, 2000.
Rad AH, Omidvar N. Mahmood M. Kolahdooz F and Amini M. Dietary intake, anthropometry and birth outcome of rural pregnant women in two Iranian Districts. Nutr Res 1998;18(9):1469-1482.
Rahardjo MD. The myths of tempe and its reality. Paper presented on
International tempe symposium, Bali, July 13-15, 1997.
Rush D and Kristal AR. Methodologic studies during pregnancy: the reliability of the 24-hour dietary recall. Am J Clin Nutr 1982;32:1259-68.

REFERENCES
78
Sen A. Poverty and Famines: An Essay on Entitlement and
Deprivation. NewYork: Clarendon Press-Oxford, 1997.
Shiner C. Jakarta Couples Price Rises with Unrest Warning: Fuel and Power Cost Go Up as IMF Prepares to Release $ 1 Billion from Rescue Funds. Herald Tribune. May 5, 1998:p 1-4.
Siong TE, Noor MI, Azudin MN and Idrus K. Nutrient Composition of
Malaysian Food (Komposisi zat dalam makanan Malaysia). Malaysia: ASEAN Food habits Project-National Sub Committee on Protein, Food Habits Research and Development, 1988.
SMERU. Labour intensive and community fund social safety net programme. Spotlight on, Marh-April, 1999, No. 4.
SMERU. Subsidized Credit Programmes: Who gets the benefit? And the data say, November, 2000, No. 11.
SMERU. From the field: From richer to poorer: The case of Muara Kelawit, East Kalimantan. No. 07, Jul-Sep, 2003b.
Soekirman. Respecting, protecting and fulfilling the right to food and nutrition during the economic crisis: The Indonesian perspective. SCN
News 1999, 18: 56-59.
Soekirman, Tarwotjo I, Jus’at I, Sumodiningrat G and Djalal F. Economic Growth, Equity and Nutritional Improvement in Indonesia.United Nations, ACC/SCN, 1992.
Soekirman. Food and nutrition security and the economic crisis in Indonesia. Asia Pacific J Clin Nutr 2001:10(Suppl.):S57-S61.
Soenarto Y, Sudigbia I Hermana, Karmini M and Karyadi D. Antidiarrheal characteristic of tempe produced traditionally and industrially in children aged 6-24 months with acute diarrhea. Paper
presented in National symposium on Pemanfaatan tempe untuk
peningkatan status gizi dan kesehatan, Jakarta, October 13, 1997.
Sorkin AL. Health Economic: An Introduction. Masshachusetts: D.C. health and Company, 1977.
REFERENCES
79
Stansfeld SA. Social support and social cohesion in Social
determinants of health. Edited by Marmot C and Wilkinson R. London: Oxford University Press, 2000.
Suara Merdeka. Harga Bahan Pokok Melonjak, Pasar Rejowinangun sepi (The prices of basic commodities increase sharply, The Rejowinangun Market is quite). Kamis, 8 January, 1998.
Suharno D, West CE, Muhilal, Logman MHGM, Waart FGD, Karyadi D and Hautvast GAJ. Cross-sectional study on the iron and vitamin A status of pregnant women in West Java, Indonesia. Am J Clin Nutr
1992;56:988-93.
Sumarno I, Latinulu S and Saraswati E. Food consumption pattern of households in Indonesia. Gizi Indonesia 1997;22:39-61.
Summerfield G. Economic reform and the employment of Chinese women. J Econ Iss 1994;28(3):715-732.
Sundararaj R and Pereira SM. Diets of pregnant women in South Indian Community. Trp Geogr Med 1973; 25: 381-386.
Tanski JM. The Impact of crisis, stabilization and structural adjustment on women in Lima, Peru. World Development 1994:22(11):1627-1642.
Tatala S, Svanberg U and Mduma B. Low dietary iron availability is major cause of anemia: a nutrition survey in the Lindi District of Tanzania. Am J Clin Nutr 1998;68:171-8.
The Jakarta Post. Inflation May Hit Triple Digits, Economist Warn,Thursday, July 23, Vol. 16, No. 87, 1998.
UNICEF. The State of the World’s Children. Oxford Univ. Press, 1998.
United Nations. Hand book of Household Surveys, Series F, No. 31. 1984. New York, Department of International Economic and Social Affairs.
Vitolo MR, Gama CM, Kondo MR, Barrere APN and Nobrega FJC. Food intake of pregnant adolescent women. Ann NY Acad Sci
1997;817:386-388.

REFERENCES
80
Wasito E, Pritasari, Susilowati D, Iswarawati DN, Schultink W and Gross R. Temporary stability of urban food and nutrition security: The East Jakarta study. Asia Pacific J Clin Nutr 2001:10(Suppl.): S29-S33.
Wilopo SA. Community Health and Nutrition Research Laboratories
(CHN-RL) Faculty of Medicine, Gadjah Mada University: Key Issues
on the Research Design, Data Collection and Management. http://www.chnrl.org/survaillance/page.htm. Available from Internet. Accessed 2001 November 2.
Winkvist A, Persson V, Hartini TNS. Under reporting of energy intake is less common among pregnant women in Indonesia. Publ Hlth Nutr
2001;5(4):523-529.
WHO. Technical Report Series 797: Diet, nutrition, and the prevention
of chronic disease. Geneva: WHO, 1990.
World Bank. GNP per capita 1998, Atlas method and PPP.
http://www.worldbank.org/data/databytop/GNPPC.pdf. Available from Internet. Accessed 2000 May 21.
Zapata B, Godue CJM. International Maternal and Child Health In: Maternal and Child Health Programs, Problems and Policy in Public Health. Edited by Jonathan B Kotch. Maryland: Aspen Publisher Inc, 1997.