FOOD, GLYCAEMIC RESPONSE AND HEALTH - ILSI...
40
ILSI EUROPE CONCISE MONOGRAPH SERIES FOOD, GLYCAEMIC RESPONSE AND HEALTH International Life Sciences Institute
Transcript of FOOD, GLYCAEMIC RESPONSE AND HEALTH - ILSI...

I LS I EUROPE CONCISE MONOGRAPH SERIES
FOOD, GLYCAEMIC RESPONSE AND HEALTH
International LifeSciences Institute

ABOUT ILSI / ILSI EUROPE
Founded in 1978, the International Life Sciences Institute (ILSI) is a nonprofit, worldwide foundation that seeks to improve the well-being of the general public through the advancement of science. Its goal is to further the understanding of scientific issues relating to nutrition, food safety, toxicology, risk assessment, and the environment. ILSI is recognised around the world for the quality of the research it supports, the global conferences and workshops it sponsors, the educational projects it initiates, and the publications it produces. ILSI is affiliated with the World Health Organization (WHO) as a non-governmental organisation and has special consultative status with the Food and Agricultural Organization (FAO) of the United Nations. By bringing together scientists from academia, government, industry, and the public sector, ILSI fosters a balanced approach to solving health and environmental problems of common global concern. Headquartered in Washington, DC, ILSI accomplishes this work through its worldwide network of branches, the ILSI Health and Environmental Sciences Institute (HESI) and its Research Foundation. Branches currently operate within Argentina, Brazil, Europe, India, Japan, Korea, Mexico, North Africa & Gulf Region, North America, North Andean, South Africa, South Andean, Southeast Asia Region, as well as a Focal Point in China.
ILSI Europe was established in 1986 to identify and evaluate scientific issues related to the above topics through symposia, workshops, expert groups, and resulting publications. The aim is to advance the understanding and resolution of scientific issues in these areas. ILSI Europe is funded primarily by its industry members.
This publication is made possible by support of the ILSI Europe Task Force on Dietary Carbohydrates, which is under the umbrella of the Board of Directors of ILSI Europe. ILSI policy mandates that the ILSI and ILSI branch Boards of Directors must be composed of at least 50% public sector scientists; the remaining directors represent ILSI’s member companies. Listed hereunder are the ILSI Europe Board of Directors and the ILSI Europe Task Force on Dietary Carbohydrates industry members.
Non-industry members
Prof. A. Boobis, Imperial College of London (UK)Prof. P. Calder, University of Southampton (UK)Prof. G. Eisenbrand, University of Kaiserslautern (DE)Prof. A. Grynberg, Université Paris Sud – INRA (FR)Prof. em. G. Pascal, National Institute for Agricultural Research – INRA (FR)Prof. G. Rechkemmer, Max Rubner-Institut – Federal Research Institute of Nutrition and Food (DE)Dr. J. Schlundt, National Food Institute (DK)Prof. V. Tutelyan, National Nutrition Institute (RU)Prof. G. Varela-Moreiras, University San Pablo-CEU of Madrid (ES)
Industry members
Mr. C. Davis, Kraft Foods Europe (CH)Mr. R. Fletcher, Kellogg Europe (IE)Dr. M. Knowles, Coca-Cola Europe (BE)Dr. G. Kozianowski, Südzucker/BENEO Group (DE)Dr. G. Meijer, Unilever (NL)Prof. J. O’Brien, Nestlé (CH)Prof. C. Shortt, McNeil Nutritionals (UK)Dr. J. Stowell, Danisco (UK)Dr. G. Thompson, Danone (FR)Dr. P. Weber, DSM (CH)
ILSI Europe Board of Directors
Barilla G. & R. FratelliCargillCoca-Cola EuropeColloïdes Naturels InternationalDanisco
DanoneKellogg EuropeKraft Foods EuropeMarsNational Starch Food Innovation
NestléPremier FoodsRoquette Group Südzucker/BENEO GroupTereos-Syral
Tate & Lyle IngredientsUnilever
ILSI Europe Dietary Carbohydrates Task Force industry members

FOOD, GLYCAEMIC RESPONSE AND HEALTH
by Michele Sadler

© 2011 ILSI Europe
This publication may be reproduced for non-commercial use as is, and in its entirety, without further permission from ILSI Europe. Partial reproduction and commercial use are prohibited without ILSI Europe’s prior written permission.
A Global Partnership for a Safer, Healthier World”, the International Life Sciences Institute (ILSI) logo image of concentric circles, the word mark “International Life Sciences Institute”, as well as the acronym “ILSI” are trademarks of the International Life Sciences Institute and licensed for use by ILSI Europe. The use of trade names and commercial sources in this document is for purposes of identification only and does not imply endorsement by ILSI Europe. In addition, the opinions expressed herein and the conclusions of this publication are those of the authors and do not necessarily represent the views of ILSI Europe nor those of its member companies.
For more information about ILSI Europe, please contact
ILSI Europe a.i.s.b.l.Avenue E. Mounier 83, Box 6B-1200 BrusselsBelgiumTel.: (+32) 2 771 00 14Fax: (+32) 2 762 00 44E-mail: [email protected]: www.ilsi.eu
Printed in Belgium
D/2011/10.996/28
ISBN 9789078637318
FOREWORD........................................................................................................................................................................ 1
INTRODUCTION ................................................................................................................................................................ 2Definitions ..................................................................................................................................................................... 2How to measure the glycaemic response...................................................................................................................... 5Conclusions ................................................................................................................................................................... 9
GLYCAEMIC PROPERTIES OF FOODS .............................................................................................................................. 10Impact of the food matrix on glycaemic response ....................................................................................................... 10Diet and glycaemic response ........................................................................................................................................ 10Glycaemic impact of the diet ........................................................................................................................................ 11Conclusions ................................................................................................................................................................... 12
INFLUENCE OF GLYCAEMIC RESPONSE ON HEALTH INDICATORS .............................................................................. 12Blood glucose concentration and glycaemic control .................................................................................................... 13Plasma insulin concentration and insulin resistance ...................................................................................................... 16Plasma lipids .................................................................................................................................................................. 17Satiety ............................................................................................................................................................................ 18Body weight ................................................................................................................................................................. 18Other health indicators ................................................................................................................................................. 19Conclusions .................................................................................................................................................................... 20
GLYCAEMIC CONCEPT IN ACTION .................................................................................................................................. 21Guidelines for glycaemic labelling ................................................................................................................................ 21Labelling ........................................................................................................................................................................ 21Experiences from around the world .............................................................................................................................. 22Conclusions .................................................................................................................................................................... 23
ABBREVIATIONS AND GLOSSARY ................................................................................................................................... 24
REFERENCES AND FURTHER READING ........................................................................................................................... 28
CONTENTS
Author: Michele Sadler, Consultant (UK)Scientific Editor: Edith Feskens, University of Wageningen (NL)
Scientific Reviewers: Jacqueline Dekker, Free University of Amsterdam (NL), Martine Laville, University of Lyon (FR)Concise Monograph Series Editor: John Howlett (UK)
Coordinator: Agnès Méheust, ILSI Europe (BE)


Food, Glycaemic Response and Health 1
Carbohydrates typically provide the major energy contribution to our diet. They also lead to rises in blood sugar or blood glucose (glycaemia). The glycaemic response to a food or meal is the effect that food or meal has on blood glucose levels after consumption. It is normal for blood glucose and insulin levels to rise after eating and then return again to fasting levels over a short period of time. This is particularly so after consumption of meals rich in certain carbohydrates. Reducing the size and duration of rises in blood glucose after meals is particularly important for people with diabetes, and may also be of benefit to the general population. Several tools have been developed to help quantify and communicate the effect of food on glycaemic response. These include glycaemic index (GI), glycaemic load (GL) and glycaemic glucose equivalents (GGE).
In 1981, the idea of classifying carbohydrates according to their GI was first published. Since then, many studies have been undertaken to determine the impact of altering the blood glucose-raising potential (glycaemic challenge) of the diet on a wide range of short- and long-term health outcomes. However, evaluating the impact of a single dietary change on health is notoriously complex, and opinions on the relevance of GI, GL and GGE have been divided.
The Dietary Carbohydrates Task Force of ILSI Europe has, over a period of several years, studied selected aspects of the science behind glycaemic response and health, seeking to contribute a balanced perspective on the subject. Firstly, the group commissioned an expert consultation on GI methodology. A comprehensive meta-analysis of intervention studies linking glycaemic response with health outcomes was then undertaken. This culminated in a Workshop entitled Glycaemic response and health, held in Nice, France, on 6–8 December 2006.
The Workshop analysed in detail the findings of the meta-analysis and, whilst the conclusions were in many cases still far from clear, several key points have emerged and been summarized in a supplement of the January 2008 issue of the American Journal of Clinical Nutrition.
Dietary interventions that lower the GI and/or GL of the diet improve fasting blood glucose in individuals with impaired blood glucose control, e.g. diabetics. Similarly, glycated proteins (associated with tissue damage) are reduced, with the effect being greater in subjects with poorer glycaemic control. Insulin sensitivity can also be improved, with the magnitude of the effect being greater, the greater the initial level of dysfunctionality. It should be noted that reductions in the GI and/or GL of the diet are often associated with changes beyond only the available carbohydrate source. These include fat and protein levels and unavailable carbohydrate content, such as dietary fibre.
It is becoming evident that modifying the glycaemic response of the diet should not be seen as a stand-alone strategy but rather as an element of an overall balanced diet and lifestyle.
This Concise Monograph seeks to provide a balanced overview of the ILSI Europe findings to date linking glycaemic response with health outcomes. It includes a summary of the most recently available information and sections on the glycaemic properties of foods and on the glycaemic concept in action. In the tradition of ILSI Europe Concise Monographs, it is hoped that this volume will inform healthcare professionals, students and motivated consumers alike, becoming a useful educational and reference tool.
Julian StowellDanisco Ltd (UK)
FOREWORD

2 Concise Monograph Series
INTRODUCTION
Carbohydrates in foods are traditionally classified according to their chemical structure, i.e. as mono-, di-, oligo- and polysaccharides. Such a classification gives little information about how carbohydrates behave in the gastrointestinal tract, or their rate or ability to be digested and absorbed in the small intestine and thus contribute to blood glucose concentration. Because this variable physiological property of carbohydrates has the potential to influence health, it is important to fully understand this relationship. During the past 30 years much attention has been focused on measuring and classifying carbohydrates on the basis of their glycaemic effects. One aim of such research is to enable improved glycaemic control through the dietary management of postprandial blood glucose concentrations.
In most countries around the globe, dietary guidelines recommend that most of the daily energy consumption should derive from (available) carbohydrates, which are typically glycaemic. Efforts have been made to classify carbohydrates as energy source on the basis of the glycaemic response they mediate. The scope to influence glycaemic response has also been considered. Dietary fibres are another type of dietary carbohydrates. A daily intake of 25 g dietary fibre is recommended due to its association with various health benefits, including effects on the blood glucose response (EFSA, 2010a).
This monograph explains the concept of the glycaemic response and discusses the potential benefits of dietary management of postprandial glycaemia for various health indicators, including a number of key public health priorities.
Definitions
Glycaemic response
After eating a meal, the digestible or glycaemic carbohydrates are absorbed from the intestine into the bloodstream, producing an increase in blood glucose concentration. In time and in response to its tissue disposal, facilitated by the hormone insulin, the blood glucose concentration falls back to or below fasting levels. The magnitude of the rise and fall in blood glucose and the duration over which it occurs has been termed the blood glucose (or glycaemic) response. The glycaemic response varies for different carbohydrates. Fully and readily digestible carbohydrates such as glucose, maltodextrin and cooked potato starch produce a rapid increase in blood glucose, followed by an equally rapid fall. Insulin is released in response to the initial rise in blood glucose and causes blood glucose to fall. Insulin release can also be triggered by other food components such as certain proteins. Over-compensation can result in blood glucose falling below baseline values.
More slowly digestible carbohydrates or minimally processed starchy foods produce a different response. Compared with rapidly digestible carbohydrates they show a slower and more prolonged increase in blood glucose, rising to a lower peak. Non-digestible carbohydrates (e.g. dietary fibres such as polydextrose and inulin) elicit a negligible direct blood glucose response (see Role of unavailable carbohydrate, page 11). However, there are also some absorbed carbohydrates such as fructose and xylitol (which is partially absorbed) that do not result in increased blood glucose levels. In addition to the available carbohydrate level of food, the rest of the composition of food can also influence the glycaemic response. Different fat, protein and unavailable carbohydrate levels can influence the speed with which glucose can enter the blood, e.g. via reduction in the speed of gastric emptying and intestinal transit or the level of access of digestive enzymes.

Food, Glycaemic Response and Health 3
Because blood glucose concentration is influenced by the foods we eat, it is important to have appropriate descriptors to express the differences in the glycaemic response that are characteristic of different carbohydrate-rich foods. Historically the GI has been the main focus of research but more recently GL and GGE have been proposed as alternative descriptors (Figure 1).
These indicators of the glycaemic properties of carbohydrate-rich foods each give different information and, depending on the information required and how it will be used, there is currently much discussion about which is the most appropriate communication tool.
FIGURE 1
Comparison of glycaemic index (GI), glycaemic load (GL) and glycaemic glucose equivalents (GGE)
Food dose: 50 g portion of available carbohydrate
Glycaemic response to 50 g available carbohydrate in food relative to response to 50 g glucose
(i.e. equi-carbohydrate measurement)
x 100
Glycaemic index (GI)(% basis)
× 1/100 of the proportion of the food that is available carbohydrate
Glycaemic load (GL)(per gram basis)
Food dose: relevant quantity
Weight of glucose that causes same response as food (g)
(i.e. equi-glycaemic measurement)
Glycaemic impact (GGE/wt food)
⇓
⇓
⇓
⇓
⇓
⇓
⇓
Source: Monro and Shaw (2008)

4 Concise Monograph Series
Glycaemic index (GI)
The term “glycaemic index” was defined in the early 1980s as one way to numerically express the effect of available carbohydrates in a food on blood glucose concentration (Jenkins, 1981). This research established a method to link foods containing different amounts of available carbohydrates with different glycaemic responses in the blood. Carbohydrate exchange lists previously used in the dietary management of diabetes mellitus were based on food portions containing similar amounts of carbohydrate. GI research clearly showed that similar amounts of carbohydrate from different foods elicit different glycaemic responses (Figure 2).
The GI represents a measure of the average concentration of glucose in the blood following a test food, ingredient or meal (usually containing 50 g available carbohydrate), over a set period of time (usually 2 hours), and is expressed relative to a standard or reference food (usually glucose or white bread). By definition, the reference food has a GI of 100 (Brouns, 2005).
The GI provides a means of expressing the glycaemic potency of a meal or snack. Because it gives comparative information about the glycaemic properties of the available carbohydrate in a food on a weight for weight basis, substitution of a food with a higher GI value for a food with a lower GI value reduces the glycaemic
FIGURE 2
Blood glucose response curves for high and low GI foods
The GI of a food is calculated from the area under the curve (for further details see How GI is calculated, page 5)
High GI (Glucose reference, GI = 100)
Low GI (Veg soup, GI = 20)
Low GI (Meal replacer shake, GI = 33)
Low GI (Muesli bar, GI = 49)
Cha
nge
in p
lasm
a g
luco
se c
onc
entr
atio
n (m
mo
/l)
Time (min)

Food, Glycaemic Response and Health 5
response, assuming that a similar amount is eaten. Knowledge of the GI is thus useful for meal planning or choosing between different carbohydrate staples such as potatoes, pasta or rice within a meal. In such situations, the GI value does not give information about the total glycaemic potency of the meal because this is dependent on the amount and other components of the food that is eaten.
Glycaemic load (GL)
Unlike GI values, which are based on a set amount of available carbohydrate present in a test food or meal relative to a standard, GL provides additional information about the glycaemic quantity in relation to portion size. The concept of GL incorporates the total available carbohydrate in the food portion in addition to the glycaemic quality of the carbohydrate, both being factors that influence postprandial blood sugar concentration. GL thus refers to the cumulative exposure to postprandial glycaemia over a specified time period, which may be used as an indicator of insulin demand.
Glycaemic glucose equivalents (GGE)
GGE is a measure of the glycaemic impact of a food and is an alternative measure to GI or GL. Advocates of GGE contest that it is a more advanced expression of the glycaemic potency of foods than GI or GL.
How to measure the glycaemic responseExpression of the glycaemic index
How GI is calculated
GI is measured in human subjects, in vivo. For each individual subject, the GI value of the test food is calculated as follows:
GI value of test food = [IAUC* of test food/individual subject’s average IAUC of the reference food] × 100
The overall GI is calculated as:
The mean (± SEM) GI value for 10 or more subjects
*The incremental area under the curve (IAUC) includes the area above the baseline and under the curve, ignoring the area beneath the baseline (see Figure 2). This method of calculating the area under the curve is recommended by FAO (FAO/WHO, 1998).
As GI refers to the glycaemic effect of available carbohydrate in food relative to the effect of an equal amount of glucose (i.e. weight glucose/weight available carbohydrate = 50 g/50 g = 1), the GI is an equi-carbohydrate measure.
Hence, the GI is a measure of the glycaemic impact of foods and does not relate to the quantity or the portion size of the food that is eaten. GI values of different foods vary, e.g. with glucose as the reference food, the GI of boiled soya beans is 15±5 and the GI of boiled potato is 82±7 (Table 1). GI values can theoretically exceed 100, the value assigned to the reference food (glucose). This could occur in cases where a food elevates blood glucose concentration to a greater degree than glucose itself, or in association with more rapid gastric emptying. GI tables can therefore provide guidance on the glycaemic influence of foods, but do not provide absolute accuracy.

6 Concise Monograph Series
TABLE 1Examples of GI values
Food no. in tables
Food item GI
945 Apple (Golden Delicious) 39±3
102 Baguette, traditional French 57±9
960 Banana 62±9
1624 Carrot (boiled), mean of 4 studies 39±4
452 Cornflakes with skimmed milk 65±5
1206 Beef lasagne 47±7
1566 Fructose (50 g portion) 23±1
776 Ice cream, raspberry ripple 55±3
N/A Isomaltulose 32±3
1611 Peas (boiled) 51±6
1651 Potato (boiled), mean of 4 studies 82±7
1659 French fries 70±6
1049 Orange juice 46±6
1017 Prunes 29±4
1018 Raisins 64±11
562 Rice, Basmati (boiled), mean of 6 studies 57±4
1124 Soya beans (boiled) 15±5
1367 Spaghetti (boiled) 44±3
1608 Sugar (sucrose) 65±9
172 White bread 59±11
234 Wholemeal bread 68±9
895 Yogurt (low-fat, natural), mean of 4 foods 19±6
Reference food: Glucose
Data are means ± SEM
Adapted from tables given in Atkinson et al. (2008)
It is important that GI values are not used in isolation when selecting foods, but in the context of dietary recommendations on macronutrients. For example, advice for foods that are low GI but high in saturated fat remains “eat them in moderation”. Also, some fruits for example may be high in GI but are low in fat, provide dietary fibre and are a useful source of vitamins and minerals.
Over the past two or three decades, the GI values of many diverse foods have been tested by in vivo human measurements. Atkinson et al. (2008) have systematically tabulated both published and unpublished sources of GI values. Atkinson et al. considered the quality of the data and separated values in healthy subjects from those in individuals with impaired glucose metabolism. The correlation coefficient for 20 staple foods tested in both healthy and diabetic subjects was r=0.94 (P<0.001).
Summary tables of GI values are available in the scientific literature and other media, including the internet (http://www.glycemicindex.com) and the appendix to Atkinson et al. (2008), that are convenient for use by healthy and diabetic consumers.
Reproducibility of GI measurements
A number of methodological variables that effect the determination of GI values in human testing have been observed. These include the method of blood sampling, choice of reference food (usually glucose or white bread), measures to reduce intra-individual variation (the reference food is tested in each subject at least twice) and the method of calculating the AUC. Also, the restrictions placed on the subject’s diet and activity the day before testing can impact the outcomes. A recommended method is available that aims to standardise such variables (FAO/WHO, 1998). Availability of an approved method is important for regulatory and enforcement purposes.
Food, Glycaemic Response and Health 7
How GI is measured
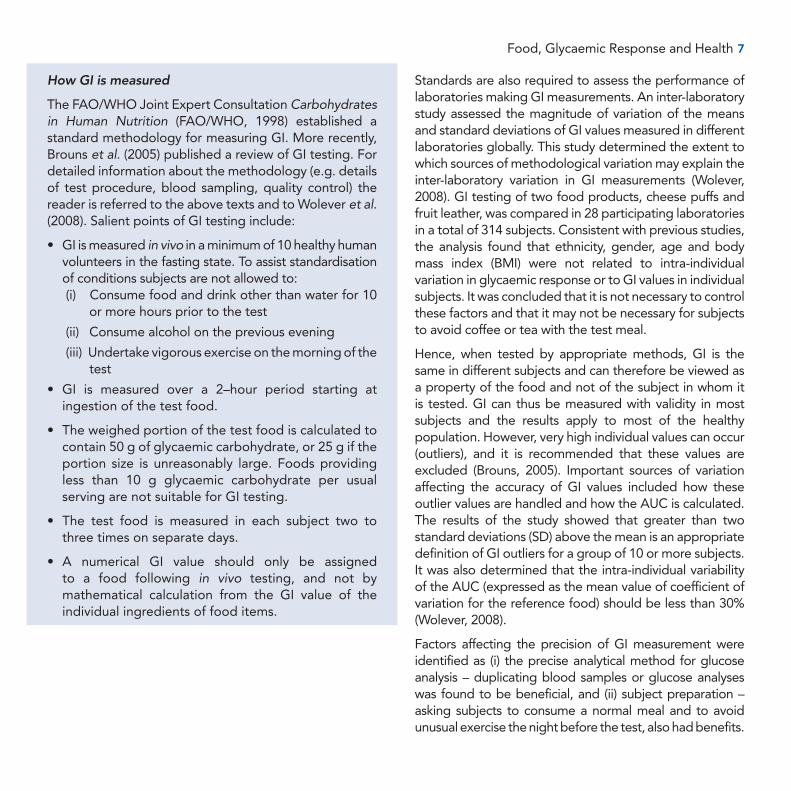
The FAO/WHO Joint Expert Consultation Carbohydrates in Human Nutrition (FAO/WHO, 1998) established a standard methodology for measuring GI. More recently, Brouns et al. (2005) published a review of GI testing. For detailed information about the methodology (e.g. details of test procedure, blood sampling, quality control) the reader is referred to the above texts and to Wolever et al. (2008). Salient points of GI testing include:
• GIismeasuredin vivo in a minimum of 10 healthy human volunteers in the fasting state. To assist standardisation of conditions subjects are not allowed to: (i) Consume food and drink other than water for 10
or more hours prior to the test
(ii) Consume alcohol on the previous evening
(iii) Undertake vigorous exercise on the morning of the test
• GI is measured over a 2–hour period starting atingestion of the test food.
• Theweighedportionofthetestfoodiscalculatedtocontain 50 g of glycaemic carbohydrate, or 25 g if the portion size is unreasonably large. Foods providing less than 10 g glycaemic carbohydrate per usual serving are not suitable for GI testing.
• The test food is measured in each subject two tothree times on separate days.
• A numerical GI value should only be assignedto a food following in vivo testing, and not by mathematical calculation from the GI value of the individual ingredients of food items.
Standards are also required to assess the performance of laboratories making GI measurements. An inter-laboratory study assessed the magnitude of variation of the means and standard deviations of GI values measured in different laboratories globally. This study determined the extent to which sources of methodological variation may explain the inter-laboratory variation in GI measurements (Wolever, 2008). GI testing of two food products, cheese puffs and fruit leather, was compared in 28 participating laboratories in a total of 314 subjects. Consistent with previous studies, the analysis found that ethnicity, gender, age and body mass index (BMI) were not related to intra-individual variation in glycaemic response or to GI values in individual subjects. It was concluded that it is not necessary to control these factors and that it may not be necessary for subjects to avoid coffee or tea with the test meal.
Hence, when tested by appropriate methods, GI is the same in different subjects and can therefore be viewed as a property of the food and not of the subject in whom it is tested. GI can thus be measured with validity in most subjects and the results apply to most of the healthy population. However, very high individual values can occur (outliers), and it is recommended that these values are excluded (Brouns, 2005). Important sources of variation affecting the accuracy of GI values included how these outlier values are handled and how the AUC is calculated. The results of the study showed that greater than two standard deviations (SD) above the mean is an appropriate definition of GI outliers for a group of 10 or more subjects. It was also determined that the intra-individual variability of the AUC (expressed as the mean value of coefficient of variation for the reference food) should be less than 30% (Wolever, 2008).
Factors affecting the precision of GI measurement were identified as (i) the precise analytical method for glucose analysis – duplicating blood samples or glucose analyses was found to be beneficial, and (ii) subject preparation – asking subjects to consume a normal meal and to avoid unusual exercise the night before the test, also had benefits.

8 Concise Monograph Series
Expression of the glycaemic load (GL) and glycaemic glucose equivalents (GGE)
How GL is calculated
GL is calculated from the GI value of a food as follows:
GL = [GI × total available carbohydrate in the food portion]/100
The GL descriptor is not expressed in units and relates to the serving size. For example, the GL of instant mashed potato with a GI of 82 and with 25 g carbohydrate per serving [(82 × 25)/100] is 21. Use of GL requires tables of the GI values of foods and information about the carbohydrate content per serving.
GL is practically useful for managing postprandial glycaemia by manipulating both the choice of carbohydrate-containing food and the portion size that is eaten. However, determination of the portion size is a practical limitation, as this will vary with different pack sizes, and for foods where the consumer selects the portion size, such as for rice and pasta.
How GGE is calculated
GGE is calculated as:
GGE/g = (IAUCfood/IAUCglucose) × (weight glucose/weight food) × 1 g
(IAUCfood/IAUCglucose) = 1 (i.e. equi-glycaemic)
Relative glycaemic impact (RGI) = GGE/g × food weight subsequently consumed
Relative glycaemic impact (RGI) is defined by the American Association of Cereal Chemists as “the weight of glucose that would induce a glycaemic response equivalent to that induced by a given amount of food” (Monro, 2008). RGI expresses the relative glycaemic potential of a food in grams of GGE, per specified amount of food. As a numerical expression, GGE is thus similar to that of other food components (e.g. micrograms of retinol equivalents) in a way that GI and GL are not. GGE differs
from GI and GL because it refers to food rather than to available carbohydrate, is expressed in grams whereas GI is an index without units, and depends on the quantity of food consumed, whereas GI does not.
If a serving of food has a glycaemic impact equivalent to that of 15 g of glucose, the food is said to have a GGE content of 15 g. The GGE descriptor thus expresses a set amount of food that equals a certain amount of glucose in its effect, or expresses the weight of glucose that would have the same effect as a given weight of food. GGE is thus a “virtual food component”, meaning that it can be expressed in terms of a weight of a reference food, such as glucose per unit weight. GGE thus has the potential to be used on food labels and within food tables.
When studying glycaemic response and health, GGE could also be very useful. Potential uses include:
• ToexpresstheRGIoffoodsastheirGGEcontentonfood labels or in food tables
• Todemonstratetheeffectsofdifferentportionsizes,since GGE is directly related to the quantity consumed
• To demonstrate the effects of combining foods byadding together GGE values
• Toassessthequantitiesoffoodsthatmaybeexchangedfor the same glycaemic effect and publish these in food exchange tables for glycaemic management
• Foruseinmealplanningincombinationwithsystemsfor monitoring blood glucose and insulin delivery.

Food, Glycaemic Response and Health 9
Relevance of GI, GL and GGE in the context of a mixed meal
The GI value of an individual food might differ when the food is eaten in combination with other foods. The protein, fat and fibre content, the bulk of food eaten, and other factors can all influence the measured glycaemic response. The rate of gastric emptying, rate of absorption and insulin demand can all be altered depending on the food matrix.
A key question frequently raised is how meaningful are GI, GL and GGE measures relating to individual foods when we generally eat foods in combination or as part of a meal.
When eaten in the context of a test meal, often referred to as a “mixed meal”, the substitution of low glycaemic foods for higher glycaemic foods reduces the glycaemic response to the meal.
ConclusionsHistorically, GI has been the key descriptor for the glycaemic properties of carbohydrates and the main focus of scientific research. Over time, additional expressions of glycaemic response have been developed, depending on the information required and how it will be used. GI provides an indication of the glycaemic impact of carbohydrates present in food, and is useful for meal planning and choosing between different carbohydrate staples within a meal. It does not give information that relates to the quantity consumed. GI should be used in the context of dietary recommendations on macronutrients and not in isolation.
GL has the advantage of providing information about glycaemic quantity, based on serving size, and glycaemic quality. It is useful for managing postprandial glycaemia by manipulating both the choice of carbohydrate-containing food and the portion size.
GGE is an alternative measure to GI and GL. It provides an estimate of the glycaemic impact arising from an ingested quantity of food and is a more complex concept. A potential advantage of GGE is that because of the way it is measured and expressed it is more amenable for potential use in the nutritional labelling panel along with nutrient declarations, provided consumers can understand the concept.
Glycaemic labelling of foods must be based on a generally accepted relationship between the glycaemic properties of foods and health outcomes. The evidence linking glycaemic response and health is discussed in the section starting on page 12.

10 Concise Monograph Series
GLYCAEMIC PROPERTIES OF FOODS
Impact of the food matrix on glycaemic responseGI values of the same food are subject to variation depending on the physical state of the food. However, variation is true of all nutritional values, e.g. the vitamin and mineral content of foods.
Food-related factors that influence the glycaemic impact of a food include:
• The nature and amount of available carbohydratecontained in a food:- The physical form of the carbohydrate (e.g. particle
size, degree of hydration)- The nature of starch (amylose, amylopectin) or
starch hydrolysis products - The content of monosaccharides (glucose, fructose,
galactose, mannose, tagatose)- The content of disaccharides (sucrose, isomaltulose,
trehalose, lactose)- The content of oligosaccharides (maltodextrins)
• Thenatureandamountofotherfoodcomponents:- Fat- Protein- Dietary fibres - Organic acids- Phytochemicals
• Foodformandeffectsofprocessingandpreparation- Degree of cooking- Physical form (solid versus liquid)- Particle size of food
The rate of starch breakdown in the digestive tract has a major influence on GI values. The susceptibility of starch to hydrolysis is thus an important influence, e.g. amylopectin is hydrolysed by pancreatic alpha-amylase more rapidly than amylose. Other important factors include access of the digestive enzymes to starch, which is influenced by the physical form of the food and its structure. For example, the ripeness of fruit, and physical changes to food in food processing and preparation – whether food is served pureed, in large or small pieces, cooked or raw – all influence GI values. The viscosity in the gastrointestinal tract and resulting rate of absorption of the monosaccharides are further determinants of the GI.
Diet and glycaemic responseFactors linked to eating behaviour and physiological factors relating to individuals also influence the glycaemic response. These factors include:
• Howoftenandwhenfoodiseaten
• Howquicklyfoodisingested
• Thecompositionofmealsandsnacks
• Therateofgastricemptying
• Digestiveresponses
• Non-bloodglucosestimulationofinsulinrelease
• Individualvariation
Nutrients that affect gastric emptying and viscosity of the gut contents include fat, protein and fibre. For example, fat delays gastric emptying and is therefore predicted to lower the GI of a food or meal.
Influence of previous meal on glycaemic response
The carbohydrate content of a meal or snack and its postprandial period has been shown to influence the glycaemic response of the next meal eaten (Nilsson, 2006). Hence, glycaemic response and GI values can vary
Food, Glycaemic Response and Health 11
depending on previous consumption. For example, it has been demonstrated that the incorporation of one key low GI food with each meal reduces the GI of the diet and has a statistically significant effect on lowering fasting and 24-hour glucose profiles in healthy subjects and people with diabetes (Brynes, 2005).
It has been shown that consuming low GI foods rather than high GI foods has a positive effect on lowering postprandial glucose levels after the following meal. Similarly, if a high GI snack is eaten, this raises the glycaemic response at the next meal (Frost, 2005). This has implications for the glycaemic impact of the daily diet.
Can the GI of a meal be calculated from the individual components?
There is consensus among experts that the GI of a meal can reasonably be estimated by calculation from measured GI values of the individual meal components (Howlett, 2008). However, the extent to which the observed response to the meal can be related to its GI value is determined by a number of factors including the magnitude of the difference in GI between the intervention and the control diets, the accuracy of the GI values of the individual meal components, and whether the difference in GI is the only variable between the test and control meal.
Glycaemic impact of the dietPostprandial glycaemia and health
Eating more frequent snacks and meals, as opposed to a traditional pattern of three meals a day, means that a higher proportion of the day is spent in the postprandial state. The absorption and metabolism of different carbohydrates influences postprandial glucose, insulin and non-esterified fatty acid concentrations. Postprandial metabolism thus mediates an important influence on disease risk including cardiovascular disease (CVD) and other diseases related to insulin resistance such as type 2 diabetes.
Insulin response
As carbohydrate intake increases, serum insulin concentration increases, though this may not be in proportion. Various factors influence the insulin response including BMI, age and gender, gastric emptying, gut hormone release, and viscosity of the gut contents. The insulin response also varies in different groups of subjects, such as those with impaired glucose tolerance, obese subjects and type 2 diabetics.
Although still an area of debate, lower versus higher GI foods tend to show an attenuated insulin response. In non-diabetics, the insulin response to foods with a wide range of GI values are highly correlated. The possible exception is dairy products, which show a higher insulin response than expected because whey protein stimulates insulin secretion.
Role of unavailable carbohydrate
A key finding from the Livesey meta-analysis (see Influence of glycaemic response on health indicators, page 12) is that, in most of the studies, a decrease in GI and/or GL was accompanied by increased levels of unavailable carbohydrate, i.e. dietary fibre (Livesey, 2008a). Hence, the specific effects of the individual changes in GI and/or GL and unavailable carbohydrate cannot be totally disentangled.
Although GI is measured and calculated on the basis of available carbohydrates, the presence of unavailable carbohydrates such as fibre can also have an effect on the glycaemic response. This may occur due to the slowing down of digestion whilst maintaining the available carbohydrate content or by substitution with a higher fibre diet, reducing the available carbohydrate intake. Livesey et al. found that when non-digestible carbohydrates are used to replace highly digestible carbohydrates in diets and in food products they are capable of reducing the glycaemic response, and hence the glycaemic impact of the diet.
12 Concise Monograph Series
ConclusionsTables of GI values are easily accessible on the Internet and in the scientific literature. There is good correlation for staple foods tested in both healthy and diabetic subjects, such that the tables are applicable to both of these groups.
Methodological variables that affect the determination of GI values in human testing have been observed and are accounted for in recommended methodology. GI can be measured with validity in most subjects and the results apply to most of the healthy population. In an inter-laboratory study, sources of variation in GI values included how outlier values are handled, how the AUC is calculated, the choice of analytical method for glucose analysis, and subject preparation.
Factors that influence GI values include the food matrix, factors linked to eating behaviour and physiological factors. The carbohydrate content and GI of a meal or snack has been shown to influence the glycaemic response of the next meal eaten following the postprandial period. Substituting available carbohydrate with unavailable carbohydrates is another means whereby the glycaemic response to the diet can be reduced. There is consensus among experts that the GI of a meal can be reasonably estimated by calculation from the measured GI values of the individual meal components. The intake of a single low glycaemic food may have impact on 24-hour blood glucose control parameters.
INFLUENCE OF GLYCAEMIC RESPONSE ON HEALTH INDICATORS
There is clear scientific evidence that glycaemic response can influence health outcomes related to key public health priorities like type 2 diabetes and blood glucose control. In Western countries, impaired glucose metabolism is already prevalent in a substantial part of the general adult population. There is suggestive, but not yet proven, evidence that glycaemic response might play a role in weight management and CVD.
A systematic review and meta-analysis has investigated the glycaemic impact of foods on measures relevant to health maintenance and disease management, i.e. whether foods with a low impact on blood glucose have a high impact on reducing risk factors for disease (Livesey, 2008a, 2008b). The markers or outcome measures chosen in the analysis are relevant to a number of health parameters, but require further validation with respect to their ability to predict disease risk (Howlett, 2008).
Livesey et al. comprehensively addressed the contribution of GL compared with GI, the role of unavailable carbohydrate in studies of reduced GI, and whether there are dose-dependent effects of GI on markers of health risk. Altering one dietary component may alter other components and hence the review also analysed which dietary factors are important in affecting markers of health risk.
The meta-analysis investigated effects related to glycaemic response in healthy subjects, glucose intolerant subjects, patients with type 1 and type 2 diabetes, subjects at risk of coronary heart disease (CHD), and hyperlipidaemic

Food, Glycaemic Response and Health 13
groups. A total of 45 relevant human intervention studies (published before January 2005) were included in the meta-analysis and the key findings are summarised in the following sections.
Blood glucose concentration and glycaemic controlIn diabetic patients, blood glucose control is crucial to avoid hyperglycaemia, hypoglycaemia and ketoacidosis. It is also vital in preventing secondary complications such as renal disease, retinopathy, neuropathy and atherosclerosis. Blood glucose is controlled through management with diet alone or with diet and drugs.
Although diabetes mellitus is a recognised disease state, there is a continuum of fasting and post-load glucose tolerance with potential health impacts, ranging from normal values in healthy subjects to impaired fasting glucose (IFG) and impaired glucose tolerance (IGT) (Wolever, 1999a). The oral glucose tolerance test (OGTT) is used to assess the degree of elevation of blood glucose and to test for diabetes mellitus and impaired glucose tolerance. OGTT measures how quickly a 75 g dose of glucose is cleared from the blood in a fasting subject. OGTT is thus suitable to detect mild abnormalities of glucose tolerance and has a potential role in the early detection of poor glycaemic control and diabetes prevention.
The definition of diabetes mellitus is based on general consensus cut-offs for blood glucose concentration (fasting plasma glucose at or above 7.0 mmol/l, 2-hour plasma glucose at or above 11.1 mmol/l after 75 g oral glucose tolerance test). Subjects with IFG and/or IGT may have higher glycation (the bonding of protein or lipid with sugar molecules as indicated by glycated haemoglobin, HbA1c, concentrations) and are at increased risk of developing diabetic complications. They might therefore benefit from dietary management.
HbA1c is a marker of longer-term blood glucose control that depends on the blood glucose concentrations over the previous 3 months. HbA1c concentrations in diabetics are typically ≥6.5%, while values of 5–5.5 % are indicative of impaired glucose tolerance, depending on the assay. Fructosamine is an intermediate measure that is sensitive to changes in blood glucose control over 2–3 weeks, though is seldom used. Both markers result from non-physiological chemical reactions between free glucose and proteins. Such reactions also occur with proteins in vessels and peripheral tissues that are exposed to glucose, which can cause functional damage including ageing.
The issue discussed in the sections below is the value of low GI and low GL foods (including the role of unavailable carbohydrate) in contributing to the improved management of these states, in helping to prevent adverse health effects, and in helping to prevent secondary complications of diabetes. This is determined from studies that have investigated the impact of low GI foods and diets on endpoints such as:
- Fasting blood glucose levels
- Postprandial blood glucose levels
- 24-Hour blood glucose levels
- Concentrations of glycated proteins such as HbA1c and fructosamine
These studies have been conducted against a background of epidemiological evidence that suggest that lower GI diets might be beneficial for health, in particular for people with type 2 diabetes.
Fasting blood glucose concentration
For normal fasting blood glucose levels, the Livesey meta-analysis (2008a) found no difference in the effect of lower GI versus higher GI treatment (study population mean approximately 5 mmol/l). It should be noted that 5 mmol/l is the optimum blood glucose concentration and any
14 Concise Monograph Series
consistent fall of fasting blood glucose below 4.5 mmol/l is counterbalanced by hormonal regulation. A beneficial association was found for low GI compared with a higher GI treatment when the mean fasting blood glucose concentration in the study population was above 5 mmol/l.
The evidence base included 36 studies reporting fasting blood glucose concentration (in venous or capillary blood), with change in GI ranging from -4 to -32 points and with study durations of 2–26 weeks. Subjects included healthy adults, adults with glucose intolerance, type 1 and type 2 diabetics, and subjects at risk of CHD.
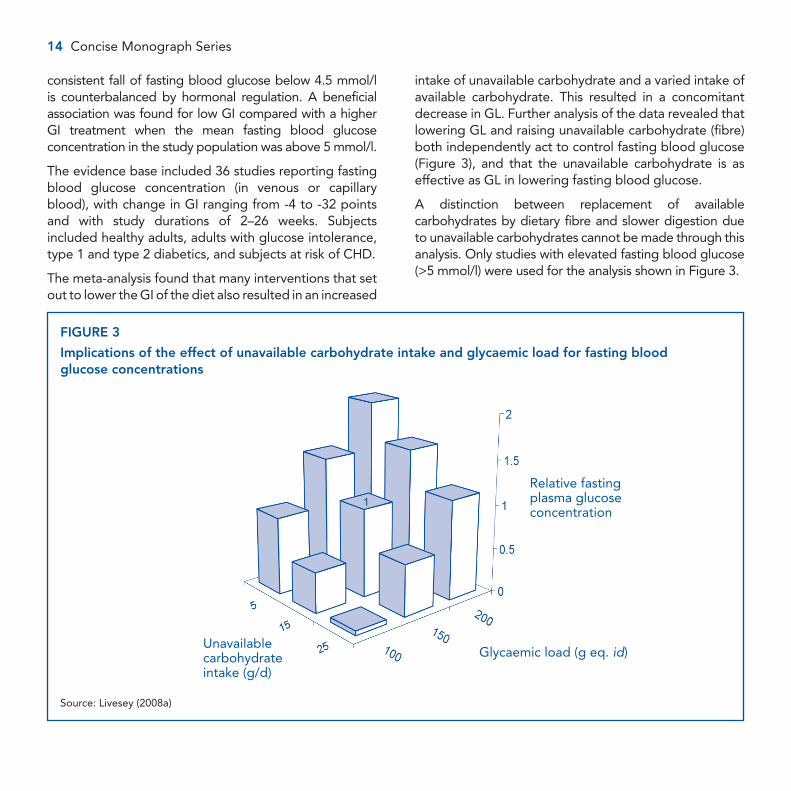
The meta-analysis found that many interventions that set out to lower the GI of the diet also resulted in an increased
intake of unavailable carbohydrate and a varied intake of available carbohydrate. This resulted in a concomitant decrease in GL. Further analysis of the data revealed that lowering GL and raising unavailable carbohydrate (fibre) both independently act to control fasting blood glucose (Figure 3), and that the unavailable carbohydrate is as effective as GL in lowering fasting blood glucose.
A distinction between replacement of available carbohydrates by dietary fibre and slower digestion due to unavailable carbohydrates cannot be made through this analysis. Only studies with elevated fasting blood glucose (>5 mmol/l) were used for the analysis shown in Figure 3.
FIGURE 3
Implications of the effect of unavailable carbohydrate intake and glycaemic load for fasting blood glucose concentrations
Source: Livesey (2008a)
Relative fasting plasma glucose concentration
Unavailable carbohydrate intake (g/d)
Glycaemic load (g eq. id)

Food, Glycaemic Response and Health 15
The meta-analysis found that GL is better reduced by a reduction in GI than by a reduction in available carbohydrate. A further conclusion was that the size of the effect is dependent on the status of the subjects consuming the diet, i.e. the effect was greater in subjects with poor fasting blood glucose control.
Maximum control of fasting blood glucose was achieved by elevation of unavailable carbohydrate together with a lowering of GI. Unavailable carbohydrate had a stronger impact than GL on a per gram weight basis, but remained equally important when taken together with the range of intakes.
In conclusion, sustained reductions in glycaemic response by using lower GI diets or foods (including the use of low GI carbohydrates) have a beneficial effect on elevated fasting blood glucose. Since elevated fasting blood glucose is a risk factor for type 2 diabetes, this effect relates to possibilities for risk reduction. The effect is greater in subjects with poorer control of blood glucose, including those with type 1 and type 2 diabetes. For individuals with fasting blood glucose in excess of 5 mmol/l, the fasting blood glucose is reduced by consuming lower GI foods and diets, or by a lower GL. Higher intakes of unavailable carbohydrate have an additive effect to that of lower GI or GL (directly via stomach emptying or indirectly via fermentation).
Such dietary manipulations thus have potential in helping diabetics to manage their blood glucose concentration. The meta-analysis found that optimum reduction in fasting blood glucose occurs with GI of <45, GL of ≤100 g (glucose equivalents)/day, or intakes of unavailable carbohydrate ≥25 g per day. Whether the beneficial effects found in people with impaired glucose metabolism are also beneficial for healthy subjects (i.e. people with normal glucose metabolism) cannot be concluded from these data. However, it is important to notice that a substantial number of people in the current general population have impaired blood glucose tolerance.
Postprandial and 24-hour blood glucose
GI is a measure of the postprandial glucose response, which supports by definition a short-term effect of low GI foods on postprandial glycaemic control. Second meal and whole-day randomised controlled trials also support the short-term impact of consuming low GI foods on postprandial glycaemic control and demonstrate a positive impact of low GI diets over a period of 24 hours, both in the laboratory and in free living studies.
Henry et al. (2006) investigated the effect on 24-hour blood glucose of high or low GI bread eaten within identical diets. The low GI bread resulted in a lower mean glucose response compared with the high GI bread, and the IAUC following the low GI bread was consistently lower than for the higher GI bread. A simple dietary change can thus favourably alter blood glucose control.
Glycated proteins
The concentration of glycated proteins such as fructosamine and HbA1c can be used as a measure for the retrospective average blood glucose levels over a prolonged period: 2– 3 months for HbA1c and 2–3 weeks for glycated fructosamine. The Livesey meta-analysis (2008a) found that interventions to lower GI reduced blood glycated protein concentration, with a trend for a greater treatment effect in those with poor glycaemic control. This was significant for HbA1c and fructosamine combined, and for fructosamine alone.
The evidence base included 28 studies reporting endpoints of glycated albumin, glycated plasma protein, fructosamine and HbA1c. Reductions in GI ranged from –5 to –31 points and study durations were up to 12 weeks. Subjects included healthy adults, adults with impaired glucose intolerance, type 1 and type 2 diabetic patients and adults at risk of CHD.
As with fasting blood glucose, variability in the effects on glycated proteins was dependent on the variation in

16 Concise Monograph Series
GI and/or GL, and unavailable carbohydrate. Bivariate analysis found that variation in fructosamine concentration is explained by variation in the intake of unavailable carbohydrate and GI, whereas the effect of available carbohydrate intake was not significant.
Similar to the findings for fasting blood glucose, the meta-analysis determined that optimum reduction in fructosamine occurs with GI of <45, GL of ≤100 g (glucose equivalents)/day, or intakes of unavailable carbohydrate ≥25 g per day.
A beneficial long-term effect of low GI foods on markers of blood glucose control has also been supported in two previous meta-analyses and systematic reviews (Brand Miller, 2003a; Opperman, 2004) each citing over 50 individual papers.
The review by Opperman, of 16 pertinent studies concluded that low GI diets significantly reduced fructosamine and HbA1c. In the review by Brand-Miller of 14 pertinent studies with diabetic patients, it was estimated that low GI diets reduced HbA1c by 0.43% points compared with high GI diets. Taking the data for HbA1c and fructosamine together, after adjusting for baseline differences, glycated proteins were reduced 7.4% more on a low GI diet compared with a high GI diet.
Plasma insulin concentration and insulin resistanceInsulin is a hormone secreted by the pancreas. It has a central role in the control of carbohydrate metabolism by signalling insulin-sensitive tissues such as muscle and adipose tissue to absorb glucose, thus lowering blood glucose concentration. When blood glucose falls to normal physiological values insulin release is slowed. In healthy subjects, fasting insulin levels range between 8 and 17 µIU/ml and in those with insulin resistance from 17 to 25 µIU/ml.
Individual responses to insulin vary considerably and a muted response (i.e. “less than normal”) is termed “insulin resistance” (BNF, 2005). In this condition, normal levels of insulin have insufficient effect on muscle and adipose tissue, and blood glucose levels stay raised. This stimulates the release of more insulin, raising plasma insulin levels, which has various physiological effects in the body.
Reduced gluco-regulatory responses to insulin include both a reduction in the maximal response (i.e. unresponsiveness) and a shift to the right of the dose–response curve (insulin insensitivity).
There are various techniques for measuring insulin sensitivity (BNF, 2005). These include the insulin tolerance test in which insulin is given intravenously and the decline in glucose concentration is measured over the short term (e.g. 20 minutes); the clamp method in which insulin is infused followed by determination of the amount of glucose required to “clamp” or maintain the blood glucose concentration; the homeostatic model assessment (HOMA), which is based on an index of fasting glucose and insulin concentrations and modelling based on results of frequently sampled intravenous glucose tolerance tests.
Fasting insulin
The Livesey meta-analysis found no treatment effects or evidence of trends on fasting insulin concentrations where insulin levels were less than 100 pmol/l (14.4 µIU/ml). Similarly to fasting blood glucose concentration (see Fasting blood glucose concentration, page 13) this value (100 pmol/l) represents an optimum, and lower levels would not necessarily reflect an improvement. However, an effect of treatment was observed in subjects with hyperinsulinaemia (>100 pmol/l). The evidence base included 18 studies.
Insulin sensitivity
In the Livesey meta-analysis there were 18 relevant studies, which used a number of techniques to measure insulin sensitivity. Subjects included healthy adults, adults

Food, Glycaemic Response and Health 17
with impaired glucose intolerance, type 1 and type 2 diabetic patients and adults at risk of CHD.
For all studies, lower GI and higher unavailable carbohydrate interventions resulted in a statistically significant 20% improvement in insulin sensitivity. When analysed by subjects’ health status, lower GI resulted in significant increases in insulin sensitivity in non-diabetics and type 2 diabetic patients. Analysed by body weight, lower GI resulted in significant increases in insulin sensitivity in overweight subjects, obese subjects and in both of these groups together. Combined means for all of the methods of measuring insulin sensitivity were positive towards improved sensitivity, and statistically significant for some (insulin tolerance test and frequently sampled intravenous glucose tolerance tests) but not for other techniques.
Plasma lipidsFasting plasma triacylglycerols
Elevated plasma triacylglycerols (also called triglycerides) are a risk factor for CHD (BNF, 2005). The Livesey meta-analysis found a significant effect of GL on fasting triacylglycerols in 30 studies that measured both fat and GL, following treatment with lower GI and/or GL interventions and after adjustment for fat intake. The effect was significant in the 30 studies combined and in studies with subjects in the normal range of body weight. Overall, a 10% fall in fasting triacylglycerols requires a lowering of GL by 30–100 g (glucose equivalents)/day. The effect was only evident when fat intake was considered.
In total, 32 studies reported on fasting plasma triacylglycerols and subjects included healthy adults, hyperlipidaemic subjects, type 1 and type 2 diabetic patients, subjects with impaired glucose intolerance and adults at risk of CHD. There was no clear evidence for a difference following treatment with lower GI, and no interaction with available and unavailable carbohydrate.
Plasma cholesterol concentrations
The Livesey meta-analysis did not analyse the effect of GI and/or GL, and hence the potential influence of unavailable carbohydrate, on plasma cholesterol concentrations. The European Food Safety Authority (EFSA) opinion on dietary reference values for carbohydrates and dietary fibre comments that conflicting results with respect to the effect of GI and/or GL on serum lipids might be due to methodological problems in designing experimental diets that are similar in dietary composition except for differences in GI (EFSA, 2010a).
Three other systematic reviews of intervention trials suggest a positive impact of low GI on plasma total and low density lipoprotein (LDL) cholesterol concentrations (Opperman, 2004; Kelly, 2004; Thomas, 2007). Thomas et al. investigated the effect of low GI or low GL diets on changes in body mass, and additionally on total, LDL and HDL cholesterol. Based on analysis of 3 relevant trials, the total cholesterol decreased significantly more with low GI diets than with higher GI diets (weighted mean difference –0.22 mmol/l, 95% confidence interval (CI) –0.43 to –0.02, P<0.05). The decrease in LDL cholesterol was significantly greater with lower than with higher GI diets (weighted mean difference –0.24 mmol/l, 95% CI –0.44 to –0.05, P<0.05).
Opperman et al. (2004) analysed 16 randomised controlled trials of low vs high GI diets on blood cholesterol concentration. For 13 studies that measured the effect on total cholesterol (in healthy and diabetic subjects, and subjects with CHD), lowering the GI of the intervention diet by 22 (SD 8) units, significantly reduced serum total cholesterol concentration by –0.33 mmol/l (95% CI –0.47 to –0.18, P<0.0001). Larger reductions in total cholesterol concentrations were observed in subjects with elevated total cholesterol at baseline (>5.2 mmol/l). For 10 studies that measured the effect on LDL-cholesterol (including healthy and diabetic subjects and subjects with CHD),
18 Concise Monograph Series
lowering the GI by 21 (SD 10) units tended to reduce LDL-cholesterol, with an overall reduction of –0.15 mmol/l (95% CI –0.31 to –0.00, P=0.06). Larger decreases in LDL-cholesterol were reported for longer studies in well-controlled type 2 diabetic subjects.
Results from epidemiological studies suggest an association between low GI foods and maintenance of high density lipoprotein (HDL) cholesterol concentrations. A cross-sectional study of middle-aged adults found that the GI of the diet was significantly inversely related to serum HDL-cholesterol concentration, suggesting that low GI diets may help to preserve HDL-cholesterol levels, a desirable effect. A negative relation between GI and HDL-cholesterol (i.e. high GI was associated with low HDL-cholesterol concentration), was observed by Ford and Liu (2001). However, intervention trials have generally shown that HDL cholesterol concentration is unaffected by low GI diets.
Satiety The Livesey meta-analysis (2008a) did not analyse the effect of GI and/or GL on satiety. However, several studies suggest a beneficial effect of low GI meals on short-term markers of satiety. Studies undertaken in both children and adults have used validated visual analogue scales to measure subjective feelings of satiety and have measured the impact on energy intake at a subsequent meal, where food intake has been measured 3–4 hours after consuming a low or a high GI meal.
In a systematic review by Bornet et al. (2007) it was found that in short-term studies (1 day or less), low-glycaemic foods or meals have a higher satiating effect than high-glycaemic foods or meals. Whether this was directly affected by changes in glycaemic response could not be determined. When lowering the GI of a food, other nutritional factors are often changed as well. Confounding factors that could influence both GI and satiety were
taken into consideration in the analysis. However, the authors concluded that it is difficult to tease out the separate effect of the lowering of postprandial glycaemia per se and the effect of higher fibre intake. In studies where these compositional factors were controlled, no consistent relationship between GI and satiety was found (Alfenas, 2005). More studies are needed to investigate the relation between blood glucose responses, satiety and food intake in the long term.
Body weightIn the Livesey meta-analysis (2008a), 23 relevant studies assessed changes in body weight in relation to changing from high to low GI diets. Subjects included healthy adults, adults with impaired glucose intolerance, type 1 and type 2 diabetic patients, and adults at risk of CHD. It is important to know that body weight was not a search item for this meta-analysis and it is likely that several studies investigating the relationship between low GI and body weight have not been included.
The meta-analysis found that reduction in GL was associated with a fall in body weight, and vice versa. The trend was statistically significant for all studies and occurred for ad libitum and limited controlled intakes studies, but not for studies with controlled food intake, i.e. with fixed energy intake. Combining the first two of these categories, reductions in body weight occur when GL was reduced by more than 17 g (glucose equivalents)/day and most consistently when GL is reduced by at least 42 g (glucose equivalents)/day (95% confidence interval). Lower GI, lower available carbohydrate and lower metabolisable energy intake were also associated with reductions in body weight.
In a systematic review published after the Livesey meta-analysis, Thomas et al. (2007) investigated the effect of low GI or low GL diets on changes in body weight. Published

Food, Glycaemic Response and Health 19
in the Cochrane Database of Systematic Reviews, the analysis included 6 studies. The meta-analysis found that overweight or obese people following low GI and/or low GL diets lost more weight than those consuming control diets. Low GI and/or low GL diets resulted in significantly greater reductions in body mass, body mass index and total fat mass. Research with longer follow-up is needed to determine whether low GI and/or low GL diets help to improve body weight in the long term. In addition, it will be important to determine whether different approaches to lowering GI and/or GL have the same benefits, or whether specific components particularly contribute towards these effects.
The Diogenes 8 European Country Dietary Intervention Study has investigated the efficacy of 5 reduced-fat diet groups, differing in GI and protein content, on the prevention of weight regain. A difference in GI of >10 units between diets was associated with benefits for weight maintenance, though the effect was less marked than that for a higher protein diet (Larsen, 2010).
Other health indicatorsSeveral studies have reported on the relation between GI and GL and the incidence of various types of cancer. The findings of such research, assessing associations and investigating heterogeneous endpoints, is inconsistent and shows only small, if any, relationships.
Recovery from exercise and sports performance
It has been suggested that consuming low GI carbohydrate foods prior to exercise may attenuate insulin-mediated metabolic effects and help to maintain carbohydrate availability.
A number of studies have investigated whether eating low GI carbohydrates is more effective than higher GI
foods in influencing sports performance and recovery from exercise.
Some data have shown that eating a low GI meal before exercise results in a higher rate of fat oxidation during exercise compared with a high GI meal, and the same effect has been observed in trained men and women consuming low GI carbohydrates before endurance exercise. Some data have also suggested that increased endurance capacity following a low GI post-exercise (recovery) diet is a consequence of increased fat oxidation following the low GI diet. The GI of carbohydrates has also been shown to influence glycogen storage in skeletal muscle and circulating non-esterified fatty acid concentrations. Several studies suggest that high GI foods are beneficial for faster energy uptake while undertaking physical exercise. This is especially important in endurance sports.
However, studies have used different designs with different feeding protocols, different amounts of carbohydrate, and different ranges of GI and hence not all studies demonstrate that lower GI food enhances the metabolic response to exercise or exercise performance.
Cognitive function
The brain is dependent on glucose for its energy source, with consumption estimated at 6 g/hour, which might increase with more demanding tasks. Research has thus focussed on glucose administration and cognitive function. Positive effects of glucose versus non-caloric controls on memory functions have been reported in several studies, including studies in the elderly and in children (Manning, 1990; Benton and Stevens, 2008). Investigations into the effects of rapidly and slowly available glucose suggest a favourable effect of lower glycaemic responses later in the morning (Benton, 2003; Wesnes, 2003). However, a recent meta-analysis of 8 studies on GI and/or GL considering heterogeneous endpoints found that the overall evidence was insufficient to reach firm conclusions (Gilsenan, 2009).
20 Concise Monograph Series
ConclusionsThere is a growing body of scientific evidence that compositional changes affecting the glycaemic response to foods is associated with beneficial health outcomes related to key public health priorities, including type 2 diabetes, weight management and CHD.
Often, dietary interventions to lower GI have also resulted in an increased intake of unavailable carbohydrate and a varied intake of available carbohydrate and other macronutrients. Many studies investigating lower GI interventions have actually used lower GL interventions. Hence, it is difficult to disentangle the specific effects of these various dietary manipulations. Furthermore, for certain outcomes, it is uncertain whether effects can be attributed to changes in the blood glucose itself, or to other characteristics of low GI and low GL diets. It is suggested that changes in unavailable carbohydrate (e.g. dietary fibre) independent of GI, may have at least as big an effect on health outcome as GI itself.
Dietary interventions to lower GI and/or GL have been shown to:
• Improvefastingbloodglucoseinsubjectswithpoorerblood glucose control
• Reduce blood glycated protein concentration, withgreater effects in subjects with poorer glycaemic control
• Improveinsulinsensitivityinnon-diabetics,overweightsubjects, obese subjects and patients with type 2 diabetes, particularly in association with higher unavailable carbohydrate intake
• Reducefastinginsulininsubjectswithhyperinsulinaemia• Reducefastingtriacylglycerolsamongthosewiththe
highest baseline concentrations
Optimum reduction in fasting blood glucose and fructosamine occurs with a GI of <45, GL of ≤100 g (glucose
equivalents)/day or intakes of unavailable carbohydrate ≥25 g/day. A 10% fall in fasting triacylglycerols requires a reduction in GL of 30–100 g (glucose equivalents)/day.
Higher intakes of unavailable carbohydrate have an additive effect on reducing fasting blood glucose to that of lower GI or GL. A combination of these two dietary manipulations achieves optimum effects.
Evidence from prospective randomised controlled trials supports the view that lowering the GI of the diet by 10 points has beneficial effects on total and LDL-cholesterol, with larger decreases in LDL-cholesterol reported for longer studies in well-controlled type 2 diabetics.
Overall, there is evidence of positive health effects from a reduction in dietary glycaemic impact in diabetic patients, but only weak evidence for an effect in healthy subjects. It should be realised, however, that within the general population there is a continuum from normal to impaired glucose tolerance. The greater the divergence of glycaemic control from the norm, the greater the potential benefits of reducing GI or GL or increasing intake of unavailable carbohydrate. This is consistent with the fact that a decrease in blood glucose below the optimum that is maintained in healthy subjects would lead to hypoglycaemia and thus be considered detrimental.
Short-term studies (1 day or less) suggest that low-glycaemic foods or meals might have a higher satiating effect than high-glycaemic foods or meals. Studies are needed to investigate the longer-term effects, and relating any such effects to body weight loss or body weight maintenance.
Lower GI, lower GL, lower available carbohydrate and lower metabolisable energy intake are associated with reductions in body weight. In these studies, a reduction in GL of more than 17 g (glucose equivalents)/day was necessary for reducing body weight.
Food, Glycaemic Response and Health 21
In 2010, the European Food Safety Authority (EFSA) published a Scientific Opinion on the substantiation of health claims related to carbohydrates that induce low/reduced glycaemic responses and carbohydrates with a low glycaemic index (EFSA, 2010b). In the summary of this opinion it was stated:
The Panel considers that carbohydrates that induce a low/reduced glycaemic response and carbohydrates with a low glycaemic index (e.g. <55) are not sufficiently characterised. On the basis of the data presented, the Panel concludes that a cause and effect relationship has not been established between the consumption of carbohydrates that induce a low/reduced glycaemic response or carbohydrates with a low glycaemic index and the claimed effects.
Subsequently, in 2011 the EFSA provided an additional opinion relating to glycaemic response (EFSA, 2011). In the summary of this EFSA opinion it was stated that: “The EFSA acknowledges that a reduction of postprandial blood glucose may be a beneficial physiological effect (as long it does not disproportionally increase the insulinemic response).” In this context, the EFSA has therefore approved reductions of postprandial glucose as well as lower glucose rises as mediated by specific ingredients such as pectin, hydroxymethylcellulose, resistant starch, sucralose, polyols, polydextrose and isomaltulose.
GLYCAEMIC CONCEPT IN ACTION
Guidelines for glycaemic labellingGlobal dietary guidelines recommend that 45–60% of energy intake is derived from carbohydrates (EFSA, 2010a; USDA, 2005; Mann, 2007; FAO/WHO, 1998). These guidelines refer to available carbohydrates, but do not take into account the different glycaemic responses.
Of the different glycaemic concepts available, glycaemic index has mainly been used, especially for people with impaired glucose tolerance to control blood glucose. In addition, communication on GI as a food property has also been used in various countries.
There are global differences in the use of GI by health professionals, such as Diabetes Associations, and their recommendations for diabetic patients. For example, Diabetes Australia is supportive of the concept and recommends diabetics to eat more low and intermediate GI foods, in the context that GI is only one part of a sound approach to healthy eating for diabetics. Diabetes UK recommends diabetics to include a low GI food with each meal or snack. In North America, health professionals have communicated less on the use of GI.
LabellingThere has been much discussion globally on how to regulate labelling the glycaemic properties of foods and there is considerable variation in the ways that regulatory agencies around the world approach this issue. Where statements or claims have been used on food products, GI is the most commonly used, with relatively little use of GL or GGE.
22 Concise Monograph Series
For the practical use of GI values, and to assist communication of the concept, it is useful to refer to low, medium and high GI foods. However, the dose–response relation between GI and health outcomes has not been quantified and such categorisation is therefore subjective. The following cut-offs for categories of foods are based on the work of Brand Miller (Brand Miller, 2003b) and are related to improvement in glycaemic control in subjects with diabetes:
• LowGI:55andbelow• MediumGI:56–69• HighGI:70andabove
Although categorisation is useful, a drawback is the risk of suggested overprecision because the numerical GI values themselves represent ranges and provide guidance for ranking.
Experiences from around the world Australia and New Zealand
Australia and New Zealand are the countries that have adopted GI labelling to the greatest extent. These countries have regulated the use of GI in relation to food communication in the draft standard 1.2.7 (March 2009) for Nutrition, Health and Related Claims, Food Standards Australia and New Zealand (FSANZ). Australia has an approved Australian Standard Glycemic Index of Foods (AS 4694 – 2007) for the determination of the GI of carbohydrate-containing foods (Standards Australia, 2007).
The GI Symbol programme, an independent GI certification programme, was introduced in 2002 as a quality marker to assist consumers with healthy eating. The programme consists of a symbol or signpost label indicating that the GI of the product has been measured and that the product conforms to set nutritional criteria for total fat, saturated fat, sodium and energy, and where appropriate fibre and calcium. A key aim of the
programme is that GI is not used in isolation but in the context of other dietary recommendations, making the symbol a credible signpost for healthier choices. The symbol is a registered trademark in Australia, the European Union, Japan and the United States.
The associated website (www.glycemicindex.com) provides a comprehensive database of GI values for foods that have been tested around the world. The database also includes values for GL and grams of carbohydrate per serving.
In a global consumer research survey about the use of nutrition labelling, 21,261 consumers from 38 markets were interviewed online in spring 2005. Australia had the highest percentage of respondents (82%) that were aware of the low GI diet, closely followed by 76% in New Zealand. Globally awareness was 41% (Nielsen, 2005).
South Africa
Legislation for glycaemic index labelling has previously been discussed in South Africa, but glycaemic index claims were not included in the South African labelling regulations published in March 2010 (South Africa Department of Health, 2010). In the absence of legislation, the Glycaemic Index Foundation South Africa (GIFSA) runs an endorsement scheme with four logos for use by industry. The GIFSA logo aims to direct consumers to low GI, lower fat and reduced sodium alternatives. Four variations of the logo distinguish between “frequent foods” (low GI, very low fat), “often foods” (low GI, low fat), “special treats” (intermediate GI, lower fat) and “best after exercise” (high GI). Use of the Diabetes South Africa logo on “frequent” and “often” foods provides third party verification that the endorsed product meets appropriate criteria and is suitable for diabetics.
Europe
Europe is moving towards a harmonised regulatory system for nutrition and health claims based on the prior

Food, Glycaemic Response and Health 23
approval of health claims, and with nutrition content claims restricted to those on a permitted list. The regulation covers all commercial communications including product labelling, advertising and the presentation of food products sold to consumers.
EFSA has stated that the reduction of postprandial glycaemic responses (as long as postprandial insulinaemic responses are not disproportionally increased) may be a beneficial physiological effect. EFSA has issued several favourably opinions for different ingredients like resistant starch, pectins and several others for which they consider that a cause and effect relation have been established between the consumption of the ingredient in drinks or foods and the reduction of postprandial glucose response. Concomitantly, the EFSA acknowledges that impaired glucose tolerance is common in the general population of adults. The respective food ingredients comprise available carbohydrates as well as fibres (EFSA, 2010b).
Prior to this, GI claims such as “low GI” have been in use in various European countries. In the global consumer research survey on the use of nutrition labelling, 9% of European consumers were found to check labels regularly for low GI. Consumer awareness of low GI was highest in Portugal (74%) followed by Italy (73%), France (61%), Sweden (60%) and Spain (53%) (Nielsen, 2005).
USA In the USA, structure–function claims do not require prior approval, and claims relating to the glycaemic properties of foods can be freely made. Regarding disease risk reduction claims, the FDA operates a system of prior approval and as yet no such claims have been established for GI or other measures of glycaemic response. The Glycaemic Research Institute (a commercial organisation) in the USA has developed Seals of Approval for use on food labels, such as “low glycaemic” and “diabetic friendly”. In the global consumer research survey on the use of nutrition labelling, although America had one
of the highest scores for percentage of respondents interested in carbohydrate labelling, this did not translate to information about GI labelling.
ConclusionsThere seems to be agreement across the world that low GI foods and diets are generally beneficial for people with diabetes and with impaired glucose metabolism. Whether low GI is considered beneficial for healthy people is perceived, legislated and communicated differently in different countries. Clearer insight into the cause and effect of low GI foods on health is important before authorities, such as those in Europe and the USA, will endorse the communication of GI-associated claims to consumers. This situation arises also because there are many different ways of lowering GI or GL, not all of which have the same effects on health. In Europe, consequently, the beneficial effects of ingredients that trigger lower rises in postprandial glucose as well as the reduction of postprandial blood glucose by fibres has recently been positively assessed for subjects with impaired glucose intolerance.
Overall, reducing the glycaemic impact of the diet in association with an enhanced fibre intake, other aspects being equal, can be seen as a valid nutritional objective for those consuming a typical “Western” style diet. However, more research is needed to better understand the underlying mechanisms in different populations. This becomes more important the more the prevalence of hidden impaired glucose intolerance increases in the general population.

24 Concise Monograph Series
ABBREVIATIONS AND GLOSSARY
AbbreviationsAUC Area under the curve BMI Body mass indexCHD Coronary heart diseaseCI Confidence intervalCVD Cardiovascular diseaseEFSA European Food Safety AuthorityFDA US Food and Drug AdministrationFSANZ Food Standards Australia and New ZealandGI Glycaemic index GIFSA Glycaemic Index Foundation South AfricaGL Glycaemic loadGGE Glycaemic glucose equivalentsGRI Glycaemic Research InstituteHbA1c Glycated haemoglobinHDL High density lipoproteinHOMA Homeostatic model assessment of insulin
resistanceIAUC Incremental area under the (blood glucose
response) curveIFG Impaired fasting glucoseIGT Impaired glucose toleranceIU International UnitLDL Low density lipoproteinOGTT Oral glucose tolerance testRCT Randomised controlled trialRGI Relative glycaemic impactSD Standard deviationSEM Standard error of mean
USDA US Department of Agriculture
GlossaryAbsorbed/absorption: The passage of materials,
originating from the diet, from the gastrointestinal tract through the wall of the intestine into the blood.
Blood glucose, fasting: Plasma glucose concentration measured after an overnight fast. The normal level in early morning is ≤5.6 mmol/l; impaired fasting glucose is defined as a level of 6.1–7.0 mmol/l and may be a risk factor for type 2 diabetes.
Blood glucose, postprandial: Plasma glucose concentration following a meal; it is raised and prolonged in diabetics.
Body mass index: Body weight (kg) divided by height (m) squared; defines optimal (18.5–24.9 kg/m2), overweight (25–29.9 kg/m2) and obese (≥30 kg/m2).
Carbohydrates: Components of foods containing carbon, hydrogen and oxygen. The term carbohydrate encompasses simple sugars, monosaccharides (e.g. glucose) and disaccharides (e.g. sucrose), oligosaccharides (several monosaccharide units) and polysaccharides. Starch is the only important food polysaccharide that can be digested in the small intestine. The indigestible polysaccharides are the main components of “dietary fibre”.
Case control study: An observational study that compares the exposure to a suspected cause of a disease in people having that disease (the cases) to the exposure in those without that disease (controls); exposure is thus assessed retrospectively. See also “cross-sectional study”.
Cholesterol: Lipid (sterol) made in the body from acetyl-CoA and present in the diet; a constituent of cell membranes (especially in nervous system tissues), blood and atherosclerotic plaques.
Cholesterol, total: Sum of concentrations of cholesterol in very low, low and high density lipoproteins (VLDL, LDL and HDL).

Food, Glycaemic Response and Health 25
Claim: Any message or representation, including pictorial, graphic or symbolic representation, that states, suggests or implies that a food has particular characteristics.
Clinical study: Study of any therapeutic, prophylactic or diagnostic agent conducted in human subjects.
Cohort study: Prospective observational study in which data on exposure to suspected causes of e.g. a disease, are collected in a selected/recruited group of people who do not yet have the disease(s) under investigation. The subjects are then followed for a period of time, after which it can be assessed whether development of the disease is related to the (presence of) suspected causes.
Confounding factors, confounders: A certain exposure may be associated with a disease or other outcome, without this association being causal. This can result from a third factor being a cause of both; such a factor is referred to as “confounder”.
Coronary heart disease: Restriction of blood flow to the coronary arteries, often characterised by chest pains (angina). May result in a heart attack. The main cause of reduced blood flow is the accumulation of atherosclerotic plaques, a disease known as atherosclerosis. The blockage of an already narrowed artery is thrombosis.
Cardiovascular disease: Any one of numerous abnormal conditions characterised by dysfunction of the heart and blood vessels, e.g. coronary heart disease, congestive heart failure, stroke, cerebrovascular events and peripheral artery disease.
Cross-sectional study: Study design that relates the rates of a certain exposure to the levels of an outcome of interest in a number of individuals or populations. A key feature is that exposure and outcome are measured at the same point in time.
Diabetes mellitus: Metabolic disorder characterised by a chronically elevated glucose level in the blood resulting from either an absolute or relative shortage of insulin. In the case of the first, the pancreas fails to secrete insulin (type 1 or juvenile diabetes). In the case of the latter, the main problem is that target tissues are insensitive to insulin (type 2 or maturity onset diabetes). Patients with type 1 diabetes require regular administration of insulin. In contrast, patients with type 2 diabetes may actually have a high blood concentration of insulin (hyperinsulinaemia).
Dietary fibre: The edible parts of plants or analogues of carbohydrates that are resistant to digestion and absorption in the small intestine and undergo complete or partial fermentation in the large intestine.
Endpoint: Variable or outcome that is relevant in itself, e.g. survival time after medical surgery, time to run a marathon, gastrointestinal discomfort, or risk of a disease. The level of a surrogate or intermediate endpoint – also referred to as “marker” or “biomarker” – is in itself not relevant, but is indirectly relevant because it reflects a relevant endpoint. See also “(bio)marker”.
Energy intake: The chemical energy in foods and drinks that can be metabolized to produce energy available to the body.
Epidemiology: Study of health and the occurrence of diseases and their predictors and causes.
Fructosamine: Glycated serum protein complex reflecting the average blood glucose concentration of the past 2–3 weeks. It is used in the management of insulin therapy for diabetes mellitus.
Glycated haemoglobin (HbA1c): Form of haemoglobin used primarily to identify the average plasma glucose concentration over the past 8–10 weeks.

26 Concise Monograph Series
Glycaemic (available) carbohydrates: Total carbohydrate minus non-glycaemic carbohydrate, i.e. carbohydrates that are absorbed into the blood stream as carbohydrates and capable of increasing blood glucose levels and capable of being metabolized when consumed.
Glycaemic control: Degree to which favourable levels of glycaemia are achieved in diabetic patients. Strict glycaemic control, e.g. near normal, reduces the risk of complications.
Glycaemic index: The incremental area under the blood glucose response curve of a 50 g digestible carbohydrate portion of a test food expressed as a percentage of the response to the same amount of digestible carbohydrate from a standard food (glucose or bread) taken by the same subject. This is a measure of the effect on blood glucose levels produced by consuming a given quantity of a test carbohydrate food, expressed relative to the effect on blood glucose levels produced by consuming the same amount of a reference carbohydrate food, usually glucose.
Glycaemic response: The rise in blood glucose concentration following the ingestion of a food. Glycaemic response is a measure of the increase in postprandial blood glucose concentration after consuming a carbohydrate-containing food.
Health claim: Any representation that states, suggests or implies that a constituent of a food influences health.
High density lipoprotein (HDL): Plasma lipoprotein with high density; contains relatively low amounts of cholesterol and other lipids and a high amount of protein. It is regarded as beneficial because it transports cholesterol from atherosclerotic plaques to the liver, from where it is eliminated in the intestine (see also lipoproteins and low-density lipoproteins, LDL).
Homeostatic model assessment of insulin resistance (HOMA): Method quantifying insulin resistance and beta-cell functions from fasting glucose and insulin concentrations.
Hyperinsulinaemia: Higher than normal level of insulin in the blood.
Hyperlipidaemia: Abnormal elevations of fat (lipids) in the blood, including LDL-cholesterol, and triglycerols.
Hyperglycemia: Higher than normal level of glucose in the blood.
Incremental area under the (blood glucose response) curve (IAUC): The area under the curve is calculated as the incremental area under the blood glucose response curve, including all the area below the curve above the fasting or baseline concentration and ignoring the area beneath the fasting concentration.
Insulin: Hormone secreted by the pancreas that has a central role in the control of carbohydrate metabolism by lowering blood glucose levels.
Insulin resistance: Impaired sensitivity of target tissues to insulin, impairing insulin-stimulated uptake of glucose by tissues.
Intervention study: Study in which investigators intervene by allocating and establishing one or more treatments (“interventions”) to or in certain subjects, after which they observe outcomes of interest. See also “observational study” and”randomised controlled trial”.
Lipoproteins: Particles of protein and lipids that enable lipids to be transported by the blood in the plasma.
Low density lipoproteins (LDL): Plasma lipoproteins containing high concentrations of lipids (which are low in density compared to that of water), including cholesterol. Increased concentrations are a risk factor for coronary heart disease.

Food, Glycaemic Response and Health 27
(Bio)Marker: Variable that is of interest because it marks or reflects a certain phenomenon of interest. See also “endpoint”.
Meta-analysis: Quantitative summary of several individual studies of a similar type. Both intervention and observational studies can be meta-analysed. See also “pooled analysis”.
Observational study: Study in which researchers do not intervene but only observe outcomes of interest and the levels of suspected causes, e.g. cohort or case-control study. See also “cross-sectional study” and “intervention study”. Observational studies are often loosely referred to as epidemiological studies.
Pooled analysis: Analysis of the combined, original data of several individual studies. See also “meta-analysis”.
Postprandial: Occurring after a meal.
Quintile: One fifth of a distribution of a certain parameter.
Randomised controlled trial (RCT): Study design in which subjects are randomly allocated to study groups. As a result, the groups will not be expected to differ systematically, except with regard to an intervention that one group will undergo and the other will not. As a result, the effects observed can principally be ascribed to the intervention. See also “intervention study”.
Relative glycaemic impact: Weight of glucose that would induce a glycaemic response equivalent to that induced by a given amount of a specific food.
Relative risk: Ratio of the outcome rate among persons exposed to a certain factor divided by the outcome rate among persons not exposed.
Satiety: Feeling of fullness and inhibition of further food intake once a meal has finished. It is brought about by the food engaging with body systems to maintain this inhibition over eating and to control appetite.
Sugars: Simple carbohydrates, generally with a sweet taste and soluble in water. The term is usually reserved for mono- and disaccharides. The disaccharide sucrose is commonly referred to as “sugar”.
Unavailable carbohydrates: Carbohydrates that are not absorbed in the small intestine and that become available in the colon for fermentation or excretion (e.g. dietary fibre).

28 Concise Monograph Series
REFERENCES AND FURTHER READING
Alfenas, R.C.G. and Mattes, R.D. (2005). Influence of glycemic index/load on glycemic response, appetite, and food intake in healthy humans. Diabetes Care, 28:2123–2129.
Atkinson, F.S., et al. (2008). International tables of glycemic index and glycemic load values: 2008. Diabetes Care, 31(12):2281–2283.
Barclay, A.W., et al. (2008). Glycemic index, glycemic load, and chronic disease risk – a meta-analysis of observational studies. American Journal of Clinical Nutrition, 87(3):627–637.
Benton, D. et al. (2003). The delivery rate of carbohydrates affects cognitive performance in both rats and humans. Psychopharmacology, 166:86–90.
Benton, D. and Stevens, M.K. (2008). The influence of a glucose containing drink on the behaviour of children in school. Biological Psychology, 78:242–245.
Bornet, F.R., et al. (1987). Insulinemic and glycemic indexes of six starch-rich foods taken alone and in a mixed meal by type 2 diabetics. American Journal of Clinical Nutrition, 45(3):588–595.
Bornet, F.R., et al. (2007). Glycaemic response to foods: impact on satiety and long-term weight regulation. Appetite, 49(3):535–553.
Brand-Miller, J., et al. (2003a). Low-glycemic index diets in the management of diabetes: a meta-analysis of randomized controlled trials. Diabetes Care, 26(8):2261–7.
Brand-Miller, J., et al. (2003b). The new glucose revolution. Marlow & Company, New York.
BNF, Ed. (2005). Cardiovascular disease: diet, nutrition and emerging risk factors. Report of the British Nutrition Foundation Task Force. Blackwell, Oxford.
Brouns, F., et al. (2005). Glycaemic index methodology. Nutrition Research Review, 18(1):145–171.
Brynes, A.E., et al. (2005). The beneficial effect of a diet with low glycaemic index on 24 h glucose profiles in healthy young people as assessed by continuous glucose monitoring. British Journal of Nutrition, 93(2):179–182.
Department of Health (1991). Dietary reference values (DRVs) for food, energy, and nutrients for the UK. The Stationery Office. London.
EFSA (2010a). Scientific Opinion on Dietary Reference Values for carbohydrates and dietary fibre. EFSA Journal, 8(3):1462.
EFSA (2010b). Scientific opinion on the substantiation of health claims related to carbohydrates that induce low/reduced glycaemic responses and carbohydrates with a low glycaemic index pursuant to Article 13(1) of Regulation E(C) No 1924/2006. EFSA Journal, 8(2):1491.
EFSA (2011). Scientific Opinion on the substantiation of health claims related to the sugar replacers xylitol, sorbitol, mannitol, maltitol, lactitol, isomalt, erythritol, D-tagatose, isomaltulose, sucralose and polydextrose and maintenance of tooth mineralisation by decreasing tooth demineralisation (ID 463, 464, 563, 618, 647, 1182, 1591, 2907, 2921, 4300), and reduction of post-prandial glycaemic responses (ID 617, 619, 669, 1590, 1762, 2903, 2908, 2920) pursuant to Article 13(1) of Regulation (EC) No 1924/2006. EFSA Journal, 9(4):2076.
FAO/WHO (1998). Carbohydrates in human nutrition. Report of a Joint FAO/WHO Expert Consultation. FAO Food and Nutrition Paper, 66. FAO/WHO, Rome.

Food, Glycaemic Response and Health 29
FAO/WHO (2003). Diet, nutrition and the prevention of chronic disease. Report of a Joint FAO/WHO Expert Consultation. WHO Technical Report Series, 916. WHO, Geneva.
Food and Nutrition Board. (2005). Dietary reference intakes for energy, carbohydrate, fiber, fat, fatty acids, cholesterol, protein and amino acids. The National Academies Press, Washington DC.
Ford, E.S. and Liu, S. (2001). Glycemic index and serum high-density lipoprotein cholesterol concentration among US adults. Archive of Internal Medicine, 161(4):572–576.
Frost, G.S. and Dornhurst, A. (2005). Glycemic index. In: Encyclopedia of human nutrition, vol. 2, edn 2. Allan, L., Prentice, A. and Caballero B. Eds, Academic Press. pp 413–418.
Gilsenan, M.B. et al. (2009). The influence of carbohydrate on cognitive performance: a critical evaluation from the perspective of glycaemic load. British Journal of Nutrition, 101(7):941–949.
Henry, C.J., et al. (2006). Use of low-glycaemic index bread to reduce 24-h blood glucose: implications for dietary advice to non-diabetic and diabetic subjects. International Journal of Food Sciences and Nutrition, 57(3-4):273–278.
Howlett, J. and Ashwell, M. (2008). Glycemic response and health: summary of a workshop. American Journal of Clinical Nutrition, 87(1):212S–216S.
Jenkins, D.J., et al. (1981). Glycemic index of foods: a physiological basis for carbohydrate exchange. American Journal of Clinical Nutrition, 34(3):362–366.
Kelly, S., et al. (2004). Low glycaemic index diets for coronary heart disease. Cochrane Database of Systematic Reviews, (4):CD004467.
Larsen, T.M., et al. (2010). The diet, obesity and genes (diogenes) dietary study in eight European countries – a comprehensive design for long-term intervention. Obesity Reviews, 11(1):76–91.
Livesey, G., et al. (2008a). Glycemic response and health – a systematic review and meta-analysis: relations between dietary glycemic properties and health outcomes. American Journal of Clinical Nutrition, 87(1):258S–268S.
Livesey, G., et al. (2008b). Glycemic response and health – a systematic review and meta-analysis: the database, study characteristics, and macronutrient intakes. American Journal of Clinical Nutrition, 87(1):223S–236S.
Mann, J., et al. (2007). FAO/WHO scientific update on carbohydrates in human nutrition: conclusions. European Journal of Clinical Nutrition, 61 Suppl 1:S132–S137.
Manning, C.A., et al. (1990). Glucose effects on memory and other neuropsychological tests in elderly humans. Psychological Science, 1:307–311.
Monro, J.A. and Shaw, M. (2008). Glycemic impact, glycemic glucose equivalents, glycemic index, and glycemic load: definitions, distinctions, and implications. American Journal of Clinical Nutrition 87(1):237S–243S.
Nielsen, A.C. (2005). The nutrition-conscious global shopper – consumer attitudes towards nutrition labels on food packaging in Europe. Available at http://www.acnielsen.co.uk/news/pr20050727.shtml
Nilsson, A., et al. (2006). Effects of GI and content of indigestible carbohydrates of cereal-based evening meals on glucose tolerance at a subsequent standardised breakfast. European Journal of Clinical Nutrition, 60(9):1092–1099.
Opperman, A.M., et al. (2004). Meta-analysis of the health effects of using the glycaemic index in meal-planning. British Journal of Nutrition, 92(3):367–381.

30 Concise Monograph Series
Roberts, S.B. (2000). High-glycemic index foods, hunger, and obesity: is there a connection? Nutrition Reviews, 58(6):163–169.
Salmeron, J., et al. (1997). Dietary fiber, glycemic load, and risk of non-insulin-dependent diabetes mellitus in women. Journal of the American Medical Association, 277(6):472–477.
South Africa Department of Health (2010). Foodstuffs, Cosmetics and Disinfectantas Act (54/1972): Regulations: Labelling and advertising of foodstuffs. Government Gazette, 1 March, p. 3.
Standards Australia (2007) Glycemic index of foods. AS 4694–2007. Standards Australia, Sydney
Thomas, D.E., et al. (2007). Low glycaemic index or low glycaemic load diets for overweight and obesity. Cochrane Database of Systematic Reviews, (3):CD005105.
USDA (2005). Dietary Guidelines for Americans. Available at www.health.gov/dietaryguidelines/
Wesnes, K.A., et al. (2003). Breakfast reduces declines in attention and memory over the morning in school children. Appetite, 41:329–331.
Wolever, T.M. (1999a). Glucose tolerance. In: Encyclopedia of human nutrition, vol 2, edn 1. Sadler, M.J., Strain, J.J., Caballero, B. Eds. Academic Press, New York. pp 971–978.
Wolever, T.M. (1999b). Metabolism and maintenance of blood glucose level. In: Encyclopedia of Human Nutrition, vol 2, edn 1. Sadler, M.J., Strain, J.J., Caballero, B. Eds, Academic Press, New York, pp 961–971.
Wolever, T.M., et al. (2008). Measuring the glycemic index of foods: interlaboratory study. American Journal of Clinical Nutrition, 87(1):247S–257S.
Food, Glycaemic Response and Health 31

32 Concise Monograph Series

Concise Monographs• Alcohol–HealthIssuesRelatedtoAlcohol
Consumption• ASimpleGuidetoUnderstandingand
Applying the Hazard Analysis Critical Control Point Concept
• CalciuminNutrition• Carbohydrates:NutritionalandHealth
Aspects• CariesPreventiveStrategies• ConceptsofFunctionalFoods• DietaryFibre• FoodAllergy• FoodBiotechnology–AnIntroduction• FunctionalFoods–FromScienceto
Health and Claims• GeneticModificationTechnologyand
Food–ConsumerHealthandSafety• HealthyLifestyles–NutritionandPhysical
Activity• MicrowaveOvens• NutritionandGenetics–Mapping
Individual Health• NutritionandImmunityinMan• NutritionalandHealthAspectsofSugars–
Evaluation of New Findings• NutritionalEpidemiology,Possibilitiesand
Limitations• OralandDentalHealth-Preventionof
DentalCaries,Erosion,GingivitisandPeriodontitis
• Oxidants,Antioxidants,andDiseasePrevention
• PrinciplesofRiskAssessmentofFoodandDrinkingWaterRelatedtoHumanHealth
• TheAcceptableDailyIntake–AToolforEnsuring Food Safety
• ThresholdofToxicologicalConcern(TTC)• Type2Diabetes–Preventionand
Management
Reports• AdditionofNutrientstoFood:Nutritional
and Safety Considerations• AnEvaluationoftheBudgetMethodfor
ScreeningFoodAdditiveIntake• Animal-BorneVirusesofRelevancetothe
Food Industry• Antioxidants:ScientificBasis,Regulatory
Aspects and Industry Perspectives• ApplicabilityoftheADItoInfantsand
Children• ApplicationoftheMarginofExposure
Approach to Compounds in Food which are both Genotoxic and Carcinogenic
• ApproachtotheControlofEntero-haemorrhagic Escherichia coli (EHEC)
• AssessingandControllingIndustrialImpacts on the Aquatic Environment with Reference to Food processing
• AssessingHealthRisksfromEnvironmentalExposuretoChemicals:TheExampleofDrinkingWater
• BeyondPASSCLAIM–GuidancetoSubstantiate Health Claims on Foods
• CampylobactersasZoonoticPathogens: A Food Production Perspective
• ConsideringWaterQualityforUseintheFood Industry
• ConsumerUnderstandingofHealthClaims• DetectionMethodsforNovelFoods
DerivedfromGeneticallyModifiedOrganisms
• EmergingTechnologiesforEfficacyDemonstration
• EvaluationofAgronomicPracticesforMitigationofNaturalToxins
• EvaluationoftheRisksPosedinEuropebyUnintendedMixingofFoodCropsandFoodCropsDevelopedforNon-FoodUses
• ExposurefromFoodContactMaterials• FoodborneProtozoanParasites• FoodborneViruses:AnEmergingProblem• FoodConsumptionandPackagingUsage
Factors• FoodSafetyManagementTools• FoodSafetyObjectives–Rolein
MicrobiologicalFoodSafetyManagement• FunctionalFoodsinEurope–International
Developments in Science and Health Claims
• FunctionalFoods–ScientificandGlobalPerspectives
• GuidancefortheSafetyAssessmentofBotanicals and Botanical Preparations for Use in Food and Food Supplements
• ImpactofMicrobialDistributionsonFoodSafety
• MarkersofOxidativeDamageandAntioxidantProtection:Currentstatusandrelevance to disease
• 3-MCPDEstersinFoodProducts• MethodDevelopmentinRelation
to Regulatory Requirements for the DetectionofGMOsintheFoodChain
• MicronutrientLandscapeofEurope:ComparisonofIntakesandMethodologieswith Particular Regard to Higher Consumption
• Mycobacterium avium subsp. paratuberculosis(MAP)andtheFoodChain
• NutritioninChildrenandAdolescentsinEurope:WhatistheScientificBasis?
• OverviewoftheHealthIssuesRelatedtoAlcohol Consumption
• OverweightandObesityinEuropeanChildrenandAdolescents:CausesandConsequences–PreventionandTreatment
• PackagingMaterials:1.PolyethyleneTerephthalate(PET)forFoodPackagingApplications
• PackagingMaterials:2.PolystyreneforFoodPackagingApplications
• PackagingMaterials:3.PolypropyleneasaPackagingMaterialforFoodsandBeverages
• PackagingMaterials:4.PolyethyleneforFoodPackagingApplications
• PackagingMaterials:5.PolyvinylChloride(PVC)forFoodPackagingApplications
• PackagingMaterials:6.PaperandBoardforFoodPackagingApplications
• PackagingMaterials:7.MetalPackagingfor Foodstuffs
• PackagingMaterials:9.MultilayerPackagingforFoodandBeverages
• RecontaminationasaSourceofPathogensinProcessedFoods– A Literature Review
• RecyclingofPlasticsforFoodContactUse• SafetyAssessmentofViableGenetically
ModifiedMicro-organismsUsedinFood• SafetyConsiderationsofDNAinFoods• SalmonellaTyphimuriumdefinitivetype
(DT)104:Amulti-resistantSalmonella• SignificanceofExcursionsofIntakeabove
theAcceptableDailyIntake(ADI)• TheSafetyAssessmentofNovelFoods
and Concepts to Determine their Safety in use
• ThresholdofToxicologicalConcernforChemical Substances Present in the Diet
• TransmissibleSpongiformEncephalopathyas a Zoonotic Disease
• TrichotheceneswithaSpecialFocusonDON
• UsingMicrobiologicalRiskAssessment(MRA)inFoodSafetyManagement
• ValidationandVerificationofHACCP• WateruseofOilCrops:CurrentWaterUse
andFutureOutlooks
To orderILSI Europe a.i.s.b.l.83 Avenue E. Mounier, Box 6B-1200 Brussels, BelgiumTel: (+32) 2 771 00 14, Fax (+32) 2 762 00 44E-mail: [email protected]
ILSI Europe’s Concise Monographs and Report Series can be downloaded from www.ilsi.eu
Other ILSI Europe Publications

ISBN 9789078637318