Food Global Market FAO Report 2013
140
June 2013 Food Outlook BIANNUAL REPORT ON GLOBAL FOOD MARKETS ISSN 1560-8182
-
Upload
sanaullah-iqbal -
Category
Documents
-
view
135 -
download
0
description
Food Global Market FAO Report 2013
Transcript of Food Global Market FAO Report 2013

June 2013
Food Outlook B IANNUAL REPORT ON GLOBAL FOOD MARKETS
ISSN 1560-8182
www.fao.org
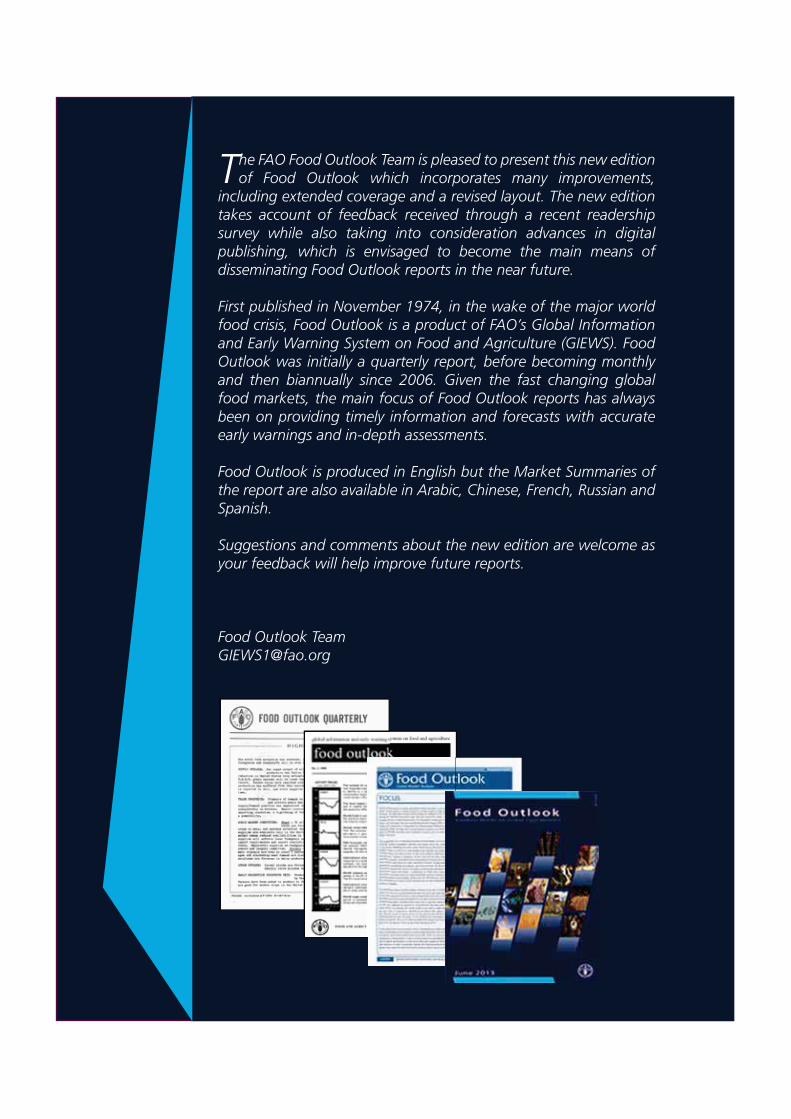
The FAO Food Outlook Team is pleased to present this new edition of Food Outlook which incorporates many improvements,
including extended coverage and a revised layout. The new edition takes account of feedback received through a recent readership survey while also taking into consideration advances in digital publishing, which is envisaged to become the main means of disseminating Food Outlook reports in the near future.
First published in November 1974, in the wake of the major world food crisis, Food Outlook is a product of FAO’s Global Information and Early Warning System on Food and Agriculture (GIEWS). Food Outlook was initially a quarterly report, before becoming monthly and then biannually since 2006. Given the fast changing global food markets, the main focus of Food Outlook reports has always been on providing timely information and forecasts with accurate early warnings and in-depth assessments.
Food Outlook is produced in English but the Market Summaries of the report are also available in Arabic, Chinese, French, Russian and Spanish.
Suggestions and comments about the new edition are welcome as your feedback will help improve future reports.
Food Outlook [email protected]

International rice prices were
generally stable in the first five
months of 2013. The market
attention is now focusing on future
decisions regarding releases from
public stocks in Thailand and on
India’s availabilities for export. The
pace of China’s imports is also
becoming critical.
RICE
World production of coarse grains is
set to rebound strongly in 2013. While
the overall utilization is also projected
to increase, total supply would exceed
demand, helping in replenishing the
heavily depleted stocks and resulting
in a more comfortable world supply
and demand balance than witnessed
in recent years.
COARSE GRAINS
World sugar production is estimated
to reach a new record in 2012/13 –
one that will be more than
sufficient to cover projected global
consumption. On the other hand,
world sugar trade is anticipated to
contract reflecting expectations of
falling import demand from the
traditional importing countries.
SUGARExpectations of a marked rebound
in global oilseed output for
2012/13, combined with a slowing
consumption growth, have led to
a softening in world prices. Positive
early production forecasts for
2013/14 suggest a more balanced
world supply and demand situation
and thus a general easing of prices.
OILSEEDS
International prices of dairy products
have risen in the face of limited
export supplies. Milk production
continues to increase steadily in
2013 in many countries, especially
in Asia, but growth in the main
exporting countries is anticipated to
be limited.
DAIRY
Record world wheat production in
2013 will boost supplies and help
increase inventories. With world trade
contracting in 2013/14 on lower import
demand by several countries, due
to their higher domestic production,
global wheat markets are likely to
experience more stable conditions
under generally lower prices.
WHEAT
World meat production is anticipated
to grow by only 1.4 percent in 2013,
to 308.2 million tonnes. Meat prices
remain at historically high levels
which, as of May, have not shown
signs of decreasing in spite of
reduced feed costs.
MEAT
The special feature on Quinoa examines the fundamentals
of this ancient Andean commodity with the potential
for becoming a new important food crop. The growing
global demand and booming exports from Bolivia and
Peru have benefitted the smallholder producers, but also
pose new challenges as market dynamics change.
Quinoa
The special feature “Commodity hedge funds in
retreat?”, examines the declining performance of
this sector following multiple years of profitability. It
reviews the factors that helped propel the growth of
commodity hedge funds against those surrounding
today’s trading environment.
Commodity Hedge Funds in Retreat?
Tight supply and higher feed costs
for several key traded species such
as salmon and shrimp are pushing
international seafood prices higher.
Overall supply is still growing thanks
to aquaculture, with strong local and
regional demand sustaining production
growth in the developing countries.
FISHERIES
ood commodity markets are set to be more balanced in 2013/14, in particular cereals. The global food import bill is
forecast to reach USD 1.09 trillion in 2013, 13 percent below the record of 2011 but close to the 2012 estimate, as higher bills for fish and livestock products are anticipated to offset lower expenditures on most other commodities, especially sugar.
F
HIGHLIGHTS
SPECIAL FEATURES

The Food Outlook report is a product of the FAO Trade and Markets Division. The report is prepared under the overall guidance of David Hallam, Director; Boubaker
BenBelhassen, Principal Officer; Concepcion Calpe, Senior Economist; and Abdolreza Abbassian, Senior Economist and Food Outlook Team Leader. It is written by a team of economists, whose names and email contacts appear under their respective market summary contributions. The report benefited from research support by many staff, namely, David Bedford, Claudio Cerquiglini, Julie Claro, Berardina Forzinetti, Grace Karumathy, David Mancini, Patrizia Mascianá, Marco Milo, Fiorella Picchioni, Barbara Senfter and the fisheries statistical team.
Special thanks go to Rita Ashton for compiling the report and overall administrative support, as well as to Claudio Cerquiglini, for preparing the charts and statistical tables. Additionally, the team is grateful to Nancy Hart for her editorial assistance.
ACKNOWLEDGEMENTS
The designations employed and the presentation of material in this infor-mation product do not imply the expression of any opinion whatsoever on the part of the Food and Agriculture Organization of the United Nations (FAO) concerning the legal or development status of any country, terri-tory, city or area or of its authorities, or concerning the delimitation of its frontiers or boundaries. The mention of specific companies or products of manufacturers, whether or not these have been patented, does not imply that these have been endorsed or recommended by FAO in preference to others of a similar nature that are not mentioned.
ISSN: 0251-1959 (print)
© FAO 2013
FAO encourages the use, reproduction and dissemination of material in this information product. Except where otherwise indicated, material may be copied, downloaded and printed for private study, research and teach-ing purposes, or for use in non-commercial products or services, provided that appropriate acknowledgement of FAO as the source and copyright holder is given and that FAO’s endorsement of users’ views, products or services is notimplied in any way.
All requests for translation and adaptation rights, and for resale and other commercial use rights should be made via www.fao.org/contact-us/licen-cerequest
or addressed to [email protected].
FAO information products are available on the FAO website (www.fao.org/publications) and can be purchased through [email protected]

CONTENTS
1-9
10-57
11
16
22
29
37
42
47
52
58-69
59
66
MARKET SUMMARIES
Wheat
MARKET ASSESSMENTS
SPECIAL FEATURES
Coarse grains
Rice
Oilseeds, oils and meals
Sugar
Meat and meat products
Milk and milk products
Fish and fishery products
Commodity hedge funds in retreat
Quinoa
2013International year of Quinoa
58
The FAO price indices
Other market indicators
Food import bills
Ocean freight rates
Investment flows
GrainsRiceOilseedsSugarMeatDairy
MAJOR POLICY DEVELOPMENTS
STATISTICAL TABLES
MARKET INDICATORS
70-87
7174
79
8584
87
88-123
124-133
125
127
128
129
132
150
200
250
300
350
MAMFJDNOSAJJM
2012 2013
2002-2004=100
Dairy
Oils & Fats Cereals
Sugar
Meat
129

MAR
KET
SUM
MAR
IES
MAR
KET
SUM
MAR
IES
Ma
rke
t sum
ma
ries
Ma
rke
t sum
ma
ries
1
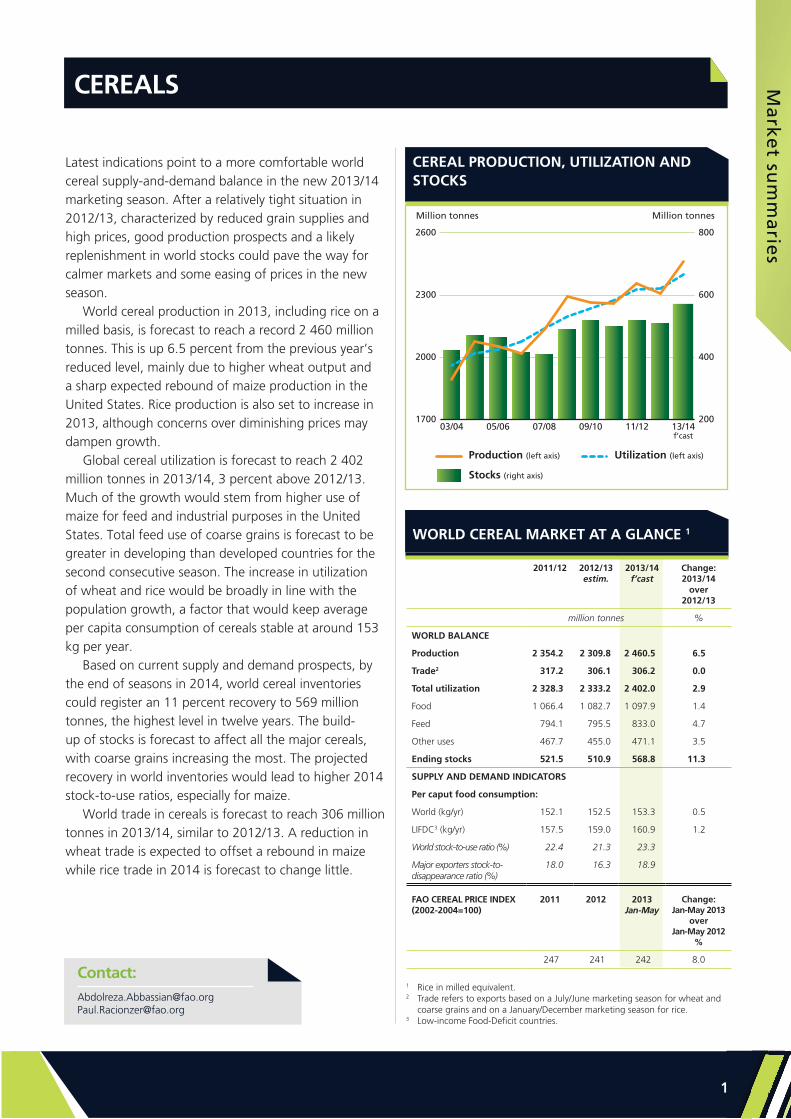
Latest indications point to a more comfortable world cereal supply-and-demand balance in the new 2013/14 marketing season. After a relatively tight situation in 2012/13, characterized by reduced grain supplies and high prices, good production prospects and a likely replenishment in world stocks could pave the way for calmer markets and some easing of prices in the new season.
World cereal production in 2013, including rice on a milled basis, is forecast to reach a record 2 460 million tonnes. This is up 6.5 percent from the previous year’s reduced level, mainly due to higher wheat output and a sharp expected rebound of maize production in the United States. Rice production is also set to increase in 2013, although concerns over diminishing prices may dampen growth.
Global cereal utilization is forecast to reach 2 402 million tonnes in 2013/14, 3 percent above 2012/13. Much of the growth would stem from higher use of maize for feed and industrial purposes in the United States. Total feed use of coarse grains is forecast to be greater in developing than developed countries for the second consecutive season. The increase in utilization of wheat and rice would be broadly in line with the population growth, a factor that would keep average per capita consumption of cereals stable at around 153 kg per year.
Based on current supply and demand prospects, by the end of seasons in 2014, world cereal inventories could register an 11 percent recovery to 569 million tonnes, the highest level in twelve years. The build-up of stocks is forecast to affect all the major cereals, with coarse grains increasing the most. The projected recovery in world inventories would lead to higher 2014 stock-to-use ratios, especially for maize.
World trade in cereals is forecast to reach 306 million tonnes in 2013/14, similar to 2012/13. A reduction in wheat trade is expected to offset a rebound in maize while rice trade in 2014 is forecast to change little.
CEREALS
Contact:[email protected]@fao.org
CEREAL PRODUCTION, UTILIZATION AND STOCKS
WORLD CEREAL MARKET AT A GLANCE 1
2011/12 2012/13 estim.
2013/14 f’cast
Change: 2013/14
over 2012/13
million tonnes %
WORLD BALANCE
Production 2 354.2 2 309.8 2 460.5 6.5
Trade2 317.2 306.1 306.2 0.0
Total utilization 2 328.3 2 333.2 2 402.0 2.9
Food 1 066.4 1 082.7 1 097.9 1.4
Feed 794.1 795.5 833.0 4.7
Other uses 467.7 455.0 471.1 3.5
Ending stocks 521.5 510.9 568.8 11.3
SUPPLY AND DEMAND INDICATORS
Per caput food consumption:
World (kg/yr) 152.1 152.5 153.3 0.5
LIFDC3 (kg/yr) 157.5 159.0 160.9 1.2
World stock-to-use ratio (%) 22.4 21.3 23.3
Major exporters stock-to-disappearance ratio (%)
18.0 16.3 18.9
FAO CEREAL PRICE INDEX (2002-2004=100)
2011 2012 2013 Jan-May
Change: Jan-May 2013
over Jan-May 2012
%
247 241 242 8.0
1 Rice in milled equivalent.2 Trade refers to exports based on a July/June marketing season for wheat and
coarse grains and on a January/December marketing season for rice.3 Low-income Food-Deficit countries.
200
400
600
800
1700
2000
2300
2600
13/1411/1209/1007/0805/0603/04
Million tonnes Million tonnes
f’cast
Stocks (right axis)
Production (left axis) Utilization (left axis)

Foo
d O
utl
oo
k -
Jun
e 2
01
3FFo
od
Ou
tlo
ok
- Ju
ne
2200
1133
2
FAO’s latest wheat production forecast for 2013 has been raised by 7 million tonnes since May, to a new record level of 702 million tonnes. At this level, world production of wheat would be 6.5 percent higher than the reduced harvest in 2012. The bulk of the recovery is forecast to be concentrated in some of the major producing countries that harvested poor crops in 2012, in particular in Europe and the Black Sea region. The anticipated higher production is a welcome development, especially as the 2012/13 run-down took global inventories to their lowest level since 2009. FAO’s first forecast for global stocks at the end of the seasons in 2014 points to a strong rebound from the reduced opening levels which, given the current expectations regarding global utilization in 2013/14, would result in a higher world stock-to-use ratio. The largest increases in world inventories are forecast for China, which is heading towards another record crop, and for the EU and the Russian Federation. Although total wheat utilization is forecast to resume its growth after a decline in 2012/13, the increase would only concern wheat consumption as food, since feed utilization, which rose sharply in 2011/12 as a result of very tight supplies and high prices of coarse grains, is likely to remain close to the 2012/13 level. FAO’s first forecast for world wheat trade in 2013/14 points to a reduction of 2.5 percent from 2012/13. This contraction mainly reflects reduced imports by countries expecting improved supplies in 2013/14, which include some traditional exporting countries, such as the Russian Federation and Ukraine. Based on this preliminary supply and demand assessment for 2013/14 and barring any major unexpected developments, especially with regard to production, global markets are likely to face more stable conditions, with prices retreating from the highs seen during the 2012/13 marketing season.
WHEAT
Contact:[email protected]@fao.org
WHEAT PRODUCTION, UTILIZATION AND STOCKS
WORLD WHEAT MARKET AT A GLANCE
1 Trade refers to exports based on a common July/June marketing season.2 Major exporters include Argentina, Australia, Canada, EU, Kazakhstan,
Russian Fed., Ukraine and the United States.3 Derived from the International Grains Council (IGC) wheat index.
2011/12 2012/13 estim.
2013/14 f’cast
Change: 2013/14
over 2012/13
million tonnes %
WORLD BALANCE
Production 701.5 659.1 702.0 6.5
Trade1 146.8 139.5 136.0 -2.5
Total utilization 697.2 686.2 693.8 1.1
Food 471.2 474.6 480.3 1.2
Feed 146.5 132.9 133.7 0.6
Other uses 79.4 78.7 79.7 1.3
Ending stocks 183.1 164.2 173.1 5.4
SUPPLY AND DEMAND INDICATORS
Per caput food consumption:
World (kg/yr) 67.2 66.9 67.1 0.3
LIFDC (kg/yr) 47.8 47.7 48.4 1.5
World stock-to-use ratio (%) 26.7 23.7 24.5
Major exporters stock-to-disappearance ratio2 (%)
18.4 14.2 15.5
FAO WHEAT PRICE INDEX3 (2002-2004=100)
2011 2012 2013 Jan-May
Change: Jan-May 2013
over Jan-May 2012
%
222 210 212 10.3
100
140
180
220
260
520
570
620
670
720
13/1411/1209/1007/0805/0603/04
Million tonnes Million tonnes
f’cast
Stocks (right axis)
Production (left axis) Utilization (left axis)
Ma
rke
t sum
ma
ries
Ma
rke
t sum
ma
ries
33
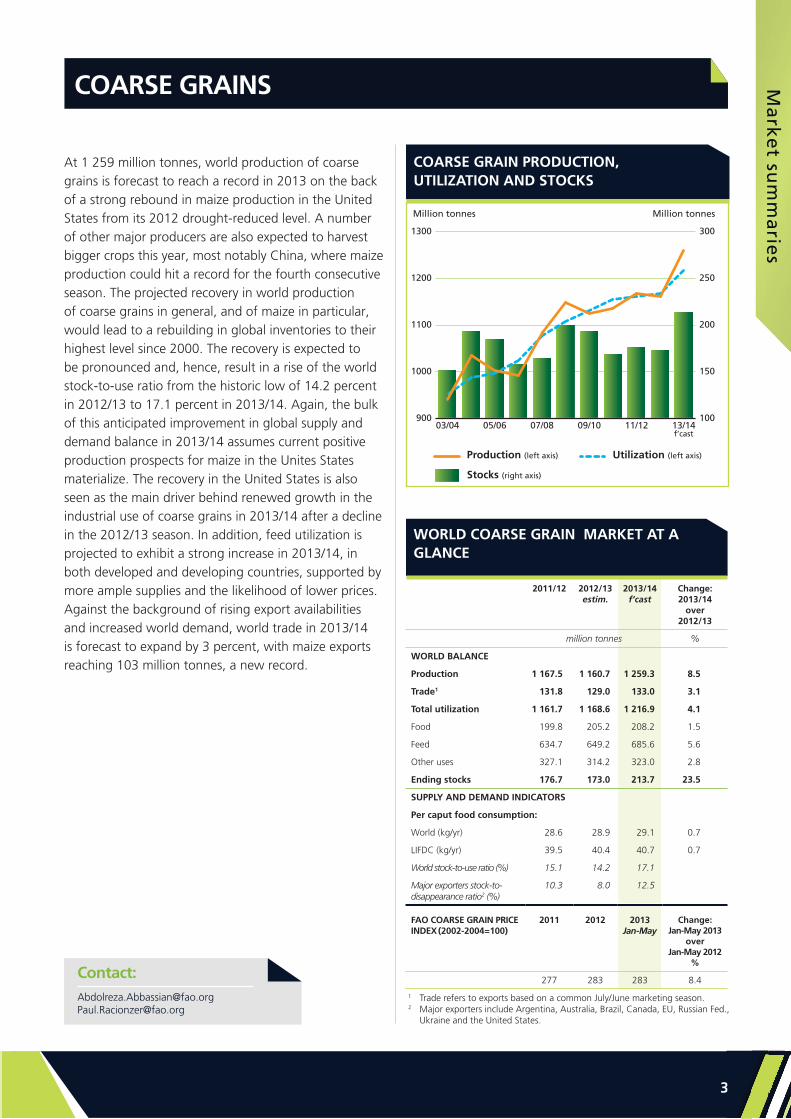
At 1 259 million tonnes, world production of coarse grains is forecast to reach a record in 2013 on the back of a strong rebound in maize production in the United States from its 2012 drought-reduced level. A number of other major producers are also expected to harvest bigger crops this year, most notably China, where maize production could hit a record for the fourth consecutive season. The projected recovery in world production of coarse grains in general, and of maize in particular, would lead to a rebuilding in global inventories to their highest level since 2000. The recovery is expected to be pronounced and, hence, result in a rise of the world stock-to-use ratio from the historic low of 14.2 percent in 2012/13 to 17.1 percent in 2013/14. Again, the bulk of this anticipated improvement in global supply and demand balance in 2013/14 assumes current positive production prospects for maize in the Unites States materialize. The recovery in the United States is also seen as the main driver behind renewed growth in the industrial use of coarse grains in 2013/14 after a decline in the 2012/13 season. In addition, feed utilization is projected to exhibit a strong increase in 2013/14, in both developed and developing countries, supported by more ample supplies and the likelihood of lower prices. Against the background of rising export availabilities and increased world demand, world trade in 2013/14 is forecast to expand by 3 percent, with maize exports reaching 103 million tonnes, a new record.
COARSE GRAINS
Contact:[email protected]@fao.org
COARSE GRAIN PRODUCTION, UTILIZATION AND STOCKS
WORLD COARSE GRAIN MARKET AT A GLANCE
1 Trade refers to exports based on a common July/June marketing season.2 Major exporters include Argentina, Australia, Brazil, Canada, EU, Russian Fed.,
Ukraine and the United States.
2011/12 2012/13 estim.
2013/14 f’cast
Change: 2013/14
over 2012/13
million tonnes %
WORLD BALANCE
Production 1 167.5 1 160.7 1 259.3 8.5
Trade1 131.8 129.0 133.0 3.1
Total utilization 1 161.7 1 168.6 1 216.9 4.1
Food 199.8 205.2 208.2 1.5
Feed 634.7 649.2 685.6 5.6
Other uses 327.1 314.2 323.0 2.8
Ending stocks 176.7 173.0 213.7 23.5
SUPPLY AND DEMAND INDICATORS
Per caput food consumption:
World (kg/yr) 28.6 28.9 29.1 0.7
LIFDC (kg/yr) 39.5 40.4 40.7 0.7
World stock-to-use ratio (%) 15.1 14.2 17.1
Major exporters stock-to-disappearance ratio2 (%)
10.3 8.0 12.5
FAO COARSE GRAIN PRICE INDEX (2002-2004=100)
2011 2012 2013 Jan-May
Change: Jan-May 2013
over Jan-May 2012
%
277 283 283 8.4
100
150
200
250
300
900
1000
1100
1200
1300
13/1411/1209/1007/0805/0603/04
Million tonnes Million tonnes
f’cast
Stocks (right axis)
Production (left axis) Utilization (left axis)

Foo
d O
utl
oo
k -
Jun
e 2
01
3FFo
od
Ou
tlo
ok
- Ju
ne
2200
1133
4
International rice prices have been stable since January, but still averaged higher in the first five months than in the corresponding period in 2012. However, prices have followed different directions, depending on the type of rice and its origin. World rice production is forecast to expand by 1.9 percent in 2013, reaching close to 500 million tonnes (in milled rice equivalent), on expectations of improved weather conditions in Asia. Low returns are encouraging farmers to cut plantings, especially in Latin America and the Caribbean, North America and the EU, a tendency likely to dampen production growth. Weakening import demand is behind expectations of a 2.8 percent contraction in international rice trade in 2013. Among exporters, India is anticipated to cut shipments most, but will nonetheless remain the leading rice exporter again this year. Much of India’s export shortfall is anticipated to be filled by Viet Nam, but also by Egypt, Pakistan, Myanmar and the United States. Thailand is anticipated to keep sales abroad at about the same level as last year, thus falling well short of the 2011 record performance. On the import side, reduced purchases by Indonesia, Nigeria, the Philippines and Thailand are behind the expected decline in trade. China’s imports, on the other hand, are anticipated to remain close to the highs witnessed last year, reflecting a wide differential between domestic and international prices.
RICE
Contact:[email protected]@fao.org
RICE PRODUCTION, UTILIZATION AND STOCKS
WORLD RICE MARKET AT A GLANCE
2010/11 2011/12 estim.
2012/13 f’cast
Change: 2012/13
over 2011/12
million tonnes %
WORLD BALANCE
Production 469.1 485.3 489.9 0.9
Trade 1 36.2 38.6 37.6 -2.6
Total utilization 460.4 469.5 478.4 1.9
Food 387.9 395.4 402.9 1.9
Ending stocks 145.7 161.7 173.7 7.4
SUPPLY AND DEMAND INDICATORS
Per caput food consumption:
World (kg/yr) 56.1 56.4 56.8 0.7
LIFDC (kg/yr) 69.3 70.2 70.9 1.0
World stock-to-use ratio (%) 31.0 33.8 35.3
Major exporters stock-to-disappearance ratio2 (%)
21.1 25.2 26.8
FAO RICE PRICE INDEX (2002-2004=100)
2011 2012 2013 Jan-May
Change: Jan-May 2013
over Jan-May 2012
%
251 240 241 2.3
1 Calendar year exports (second year shown).2 Major exporters include India, Pakistan, Thailand, the United States and Viet
Nam.
50
100
150
200
350
400
450
500
12/1310/1108/0906/0704/0502/03
Million tonnes, milled eq. Million tonnes, milled eq.
f’cast
Stocks (right axis)
Production (left axis) Utilization (left axis)

Ma
rke
t sum
ma
ries
Ma
rke
t sum
ma
ries
55
Even if crops suffered from unfavourable weather in several countries, a marked rebound in global oilseed output is forecast for 2012/13. While current crop estimates should allow a conspicuous year-on-year rise in meal output, oil production growth is likely to remain below trend. Global supplies are expected to grow at a slower pace than production, due to low stock levels at the beginning of the season.
Subdued global economic growth is likely to slow demand for oils and meals in 2012/13. Oils/fats consumption could also be affected by weaker demand from the biodiesel sector, whereas persistently high meal prices are expected to result in an unusual contraction in global meal/cake utilization. End-of-season stocks of oilseeds and derived products are anticipated to increase, both in absolute terms and relative to consumption. Nonetheless, stock-to-use ratios are likely to remain low compared to previous years, in particular for meals.
International trade in oilseeds and sub-products is forecast to decline, especially in meals/cakes, mirroring weak growth in domestic consumption in some of the worlds major importing countries. As for meals, near-record prices have lowered appetite for imported material.
In general, international prices for oilseeds, oils and meals have softened since the start of this season, amid improved production prospects and weak consumption growth. The decrease has been less marked for meals, whose values remained close to all-time highs reflecting the market’s concerns about persistent supply tightness during the first half of the season. During the second half, prices in the oilseed complex could ease further as South America’s record harvests enter the market and provided the positive forecasts for next season’s Northern Hemisphere crops are confirmed. Combined with continued weak consumption growth, the production gains anticipated for next season should permit global stocks levels and stock-to-use ratios to rise further in 2013/14, especially in the meals/cakes subsector, thus suggesting a further general relaxation of prices.
OILSEEDS
Contact:[email protected]
FAO MONTHLY INTERNATIONAL PRICE INDICES FOR OILSEEDS, OILS/FATS AND MEALS/CAKES (2002-2004=100)
WORLD OILSEED AND PRODUCT MARKET AT A GLANCE
2010/11 2011/12 estim.
2012/13 f’cast
Change: 2012/13
over 2011/12
million tonnes %
TOTAL OILSEEDS
Production 468.9 453.6 477.5 5.3
OILS AND FATS
Production 180.4 183.3 188.7 2.9
Supply 208.0 214.5 220.3 2.7
Utilization 176.0 184.7 188.4 2.0
Trade 92.5 97.9 101.0 3.1
Stock-to-utilization ratio (%) 17.7 17.1 17.4
Major exporters stock-to-disappearance ratio
11.2 10.1 10.0
MEALS AND CAKES
Production 118.6 110.3 118.0 7.0
Supply 137.5 131.6 134.8 2.5
Utilization 114.1 117.1 115.9 -1.1
Trade 69.6 72.6 72.9 0.4
Stock-to-utilization ratio (%) 18.7 14.4 15.5
Major exporters stock-to-disappearance ratio
9.3 5.6 7.5
FAO PRICE INDICES (Jan/Dec) (2002-2004=100)
2011 2012 2013 Jan-May
Change: Jan-May 2013
overJan-May 2012
%
Oilseeds 211 224 217 4.3
Meals/cakes 212 245 265 2.7
Oils/fats 252 225 202 -16.0
NOTE: Refer to table 9 for explanations regarding definitions and coverage.
50
100
150
200
250
300
20132012201120102009200820072006
Meals/cakes
Oils/fats
Oilseeds

Foo
d O
utl
oo
k -
Jun
e 2
01
3FFo
od
Ou
tlo
ok
- Ju
ne
2200
1133
6
World sugar production in 2012/13 is set to increase by 4.8 million tonnes, or 2.8 percent, to 180 million tonnes. For the second consecutive season, production is anticipated to surpass consumption, with the surplus expected to hover around 6.5 million tonnes, contributing to a rebuilding of sugar stocks to relatively comfortable levels. The growth in world output is mainly attributed to an upturn in Brazil, the world’s largest producer, where sugar production is set to recover from the sharp fall of the previous season. The expansions in Brazil, but also in the United States, Australia and China, are anticipated to offset declines in India, the EU and Thailand. World sugar consumption is forecast to grow by about 2 percent in 2012/13, amid falling domestic sugar prices. World sugar trade is anticipated to contract in 2012/13, reflecting expectations of lukewarm import demand from the traditional importing countries, which are holding large supplies.
SUGAR
Contact:[email protected]
INTERNATIONAL SUGAR PRICES*
WORLD SUGAR MARKET AT A GLANCE
2010/11 2011/12 estim.
2012/13 f’cast
Change: 2012/13
over 2011/12
million tonnes %
WORLD BALANCE
Production 165.6 175.2 180.0 2.75
Trade 54.8 52.5 51.1 -2.62
Total utilization 159.8 169.8 173.5 2.18
Ending stocks 62.9 65.6 69.4 5.80
SUPPLY AND DEMAND INDICATORS
Per caput food consumption:
World (kg/yr) 23.13 24.30 24.55 1.03
LIFDC (kg/yr) 15.19 16.64 16.87 1.35
World stock-to-use ratio (%) 39.36 38.62 39.99
ISA DAILY PRICE AVERAGE (US cents/lb)
2011 2012 2013 Jan-Apr
Change: Jan-Apr 2013
over Jan-Apr 2012
%
26.0 21.5 18.35 -22.41
* As measured by the International Sugar Agreement (ISA)

Ma
rke
t sum
ma
ries
Ma
rke
t sum
ma
ries
77
World meat production is anticipated to grow modestly in 2013, when it is forecast to reach 308.2 million tonnes, an increase of 4.3 million tonnes or 1.4 percent compared to 2012. In many countries, producers continue to struggle against elevated feed prices; however, although remaining high by historical standards, they began to fall during the second half of 2012 and continued to diminish during 2013. This has offered greater scope for profitable meat production, particularly in the pig and poultry sectors, which are the most dependent on concentrated feed. Meat production is anticipated to grow most vigorously in the developing countries, which are the main centres of demand expansion.
Meat prices have remained at historically high levels since the early part of 2011. The FAO Meat Price Index averaged 179 in May 2013, having moved within the narrow band of 177–179 since October 2012. Export reference prices for the different types of meat have followed varying directions so far this year, rising marginally for poultry and pork, remaining largely stable for beef and falling for ovine meat.
Meat trade is expected to grow more slowly in 2013 than in recent years, as a result of adequate national supplies in a number of importing countries and a reduction in production among some of the major exporters. Global meat exports are anticipated to reach 30.2 million tonnes in 2013, an increase of 1.1 percent over 2012.
MEAT AND MEAT PRODUCTS
Contact:[email protected]
FAO INTERNATIONAL MEAT PRICE INDICES (2002-2004 = 100)
WORLD MEAT MARKET AT A GLANCE
2011 2012estim.
2013f’cast
Change: 2013 over 2012
million tonnes %
WORLD BALANCE
Production 297.6 303.9 308.2 1.4
Bovine meat 67.3 67.6 68.1 0.9
Poultry meat 102.1 104.6 106.4 1.8
Pigmeat 109.0 112.5 114.2 1.5
Ovine meat 13.5 13.6 13.8 1.2
Trade 29.2 29.9 30.2 1.1
Bovine meat 8.1 8.2 8.6 4.6
Poultry meat 12.8 13.1 13.3 1.5
Pigmeat 7.3 7.5 7.2 -4.1
Ovine meat 0.7 0.8 0.9 5.8
SUPPLY AND DEMAND INDICATORS
Per caput food consumption:
World (kg/yr) 42.5 43.0 43.1 0.4
Developed (kg/yr) 78.7 79.1 79.3 0.3
Developing (kg/yr) 32.5 33.1 33.3 0.7
FAO MEAT PRICE INDEX(2002-2004=100)
2011 2012 2013 Jan-May
Change: Jan-May 2013
over Jan-May 2012
%
177 175 179 0.9
70
100
130
160
190
220
201320122011201020092008
Bovine
Poultry
Ovine
Total meat
Pigmeat

Foo
d O
utl
oo
k -
Jun
e 2
01
3FFo
od
Ou
tlo
ok
- Ju
ne
2200
1133
8
International dairy products prices registered strong growth during the first four months of 2013, particularly in March and April. Although prices fell back in May, they remained at elevated levels, substantially above a year earlier. The main cause of the leap in prices was a steep fall-off in New Zealand’s milk production. The FAO Dairy Price Index reached 259 points in April, close to its historic peak in late 2007, before dropping to 250 points in May. The absence of substantial growth in milk output in the principal exporting countries implies that supplies to the international market will be finely balanced until at least the latter part of 2013, indicating that the current elevated prices are likely to remain for some months.
World milk production in 2013 is forecast to grow by 2.2 percent to 784 million tonnes – a similar rate to recent years. Asia and Latin America and the Caribbean are expected to account for most of the increase, with only limited growth elsewhere.
World trade in dairy products is expected to expand in 2013; however, supply limitations are anticipated to stem growth. Consequently, trade is forecast to increase by 1.9 percent, compared with an average of 7 percent in recent years, to reach 54.7 million tonnes of milk equivalent. Asia will remain the main market for dairy products, accounting for some 54 percent of world imports, followed by Africa, with 16 percent.
MILK AND MILK PRODUCTS
Contact:[email protected]
FAO INTERNATIONAL DAIRY PRICE INDEX (2002-2004 = 100)
WORLD DAIRY MARKET AT A GLANCE 1
2011 2012estim.
2013f’cast
Change: 2013 over 2012
million tonnes %
WORLD BALANCE
Total milk production 745.5 767.4 784.4 2.2
Total trade 49.7 53.7 54.7 1.9
SUPPLY AND DEMAND INDICATORS
Per caput food consumption:
World (kg/yr) 105.7 107.6 108.7 1.1
Developed (kg/yr) 235.3 237.9 238.0 0.1
Developing (kg/yr) 72.1 74.1 75.9 2.4
Trade share of prod. (%) 6.7 7.0 7.0 -0.3
FAO DAIRY PRICE INDEX(2002-2004=100)
2011 2012 2013 Jan-May
Change: Jan-May 2013
over Jan-May 2012
%
221 189 227 17.0
50
150
250
350
201320112009200720052003200119991997
The index is derived from a trade-weighted average of a selectionof representative internationally traded dairy products.

Ma
rke
t sum
ma
ries
Ma
rke
t sum
ma
ries
99
Buoyant demand in developing countries has driven world aquaculture production to new heights, yet, at the same time, consumption has slackened in many traditional developed country markets. Capture fisheries have registered a small rebound after the 2012 downturn related to the El Niño. As a result, global production is expected to reach another record level in 2013, topping 160 million tonnes for the first time. Fish for direct human consumption will also increase significantly during 2013 as a smaller share of captures is destined for fish meal production. On a per capita basis, overall fish consumption is approaching 20 kg, with aquaculture contributing close to half.
World trade continues to grow, thanks to strong demand from emerging markets, with both volumes and values progressing in 2013. Prices on a number of farmed species, including salmon, shrimp and selected bivalves, have risen sharply, due to supply problems and higher feed costs. Some capture fisheries species, including tuna, have also registered sharp increases. As a result, the Fish Price Index has risen to the record levels witnessed during the summer of 2011. In the coming months, supply constraints for several important species are likely to keep world fish prices on the rise.
FISH AND FISHERY PRODUCTS
Contact:[email protected]
FAO FISH PRICE INDEX (2002-2004 = 100)
WORLD FISH MARKET AT A GLANCE
2011 2012estim.
2013f’cast
Change: 2013 over 2012
million tonnes %
WORLD BALANCE
Production 156.2 156.7 161.2 2.9
Capture fisheries 93.5 90.2 91.0 0.9
Aquaculture 62.7 66.5 70.2 5.6
Trade value (exports USD billion) 127.6 128.2 130.8 2.0
Trade volume (live weight) 57.2 57.4 57.8 0.7
Total utilization 156.2 156.7 161.2 2.9
Food 131.8 135.7 140.5 3.5
Feed 18.3 15.5 15.7 1.0
Other uses 6.0 5.5 5.1 -7.3
SUPPLY AND DEMAND INDICATORS
Per caput food consumption:
Food fish (kg/yr) 18.9 19.2 19.7 2.4
From capture fisheries (kg/year) 9.9 9.8 9.9 0.5
From aquaculture (kg/year) 9.0 9.4 9.8 4.4
FAO FISH PRICE INDEX 1
(2002-2004=100)2011 2012 2013
Jan-MayChange:
Jan-May 2013 over
Jan-May 2012 %
154 145 156 7.7
1 Data source: Norwegian Seafood Council
80
105
130
155
180
201320112009200720052003200119991997
Data source: Norwegian Seafood Council
FAO total fish price index
Capture totalAquaculture Total

MAR
KET
ASSE
SSM
ENTS
0
15
30
MAR
KET
ASSE
SSM
ENTS

Ma
rke
t asse
ssme
nts
MMaa
rke
t asse
ssme
nts
111
Figure 1. Wheat export price (US No. 2 H.W. Gulf) Figure 2. CBOT wheat futures for September
Major Wheat Exporters and Importers
Major ExportersMajor Importers
WHEAT
PRICES
Good crop prospects for 2013 put downward pressure on pricesCompared with the first half of the current marketing
season, international wheat prices were generally weaker
during its second half, which began in January 2013. A
poor harvest in Argentina and concerns over winter wheat
conditions in the United States plus a strong increase in the
use of wheat for feed (as a result of the tightness in maize)
provided some support. However, favourable prospects
for 2013 harvests, especially in the Black Sea, slower trade
activity and large supplies of old crop (2012 production)
in non-traditional exporting countries, such as in India,
continued to put pressure on prices. The benchmark
United States wheat, No.2 Hard Red Winter, f.o.b. Gulf, averaged USD 329 per tonne in May, some 5 percent
below its level at the start of the year but still almost
18 percent higher than in May 2012.
Wheat futures also weakened during the second half
of the season. Although less than ideal weather conditions
in Australia, parts of Europe and the United States were
supportive, the US quotations were depressed by the
continued slow pace of exports, weakness in maize prices
100
200
300
400
2010/11
2009/10
2012/13
2011/12
USD per tonne
JMAMFJDNOSAJ
200
250
300
350
USD per tonne
S O N D J F M A M
2012 values 2013 values

Foo
d O
utl
oo
k -
Jun
e 2
01
3FFoo
od
Ou
tlo
ok
- Ju
ne
2200
113
12
Table 2. Wheat production: leading producers*
Table 1. World wheat market at a glance
2012 estim.
2013 f”cast
Change:2013 over 2012
million tonnes %
European Union 131.3 139.0 5.9
China (Mainland) 120.6 121.8 1.0
India 94.9 93.6 -1.4
United States 61.8 56.0 -9.4
Russian Federation 37.7 55.0 45.9
Canada 27.2 29.4 8.1
Australia 22.1 24.0 8.6
Pakistan 24.0 26.3 9.6
Turkey 20.1 21.0 4.5
Ukraine 15.8 20.2 27.8
Kazakhstan 9.8 14.1 43.9
Iran Islamic Rep. of 13.8 14.5 5.1
Argentina 9.0 11.0 22.2
Egypt 8.8 9.4 6.8
Uzbekistan 6.7 6.7 0.0
Other countries 55.5 60.0 8.1
World 659.1 702.0 6.5
* Countries listed according to their position in global production (average 2011-2013)
1 Trade refers to exports based on a common July/June marketing season.
2 Major exporters include Argentina, Australia, Canada, EU, Kazakhstan, Russian Fed., Ukraine and the United States.
3 Derived from the International Grains Council (IGC) wheat index.
2011/12 2012/13 estim.
2013/14 f’cast
Change: 2013/14
over 2012/13
million tonnes %
WORLD BALANCE
Production 701.5 659.1 702.0 6.5
Trade1 146.8 139.5 136.0 -2.5
Total utilization 697.2 686.2 693.8 1.1
Food 471.2 474.6 480.3 1.2
Feed 146.5 132.9 133.7 0.6
Other uses 79.4 78.7 79.7 1.3
Ending stocks 183.1 164.2 173.1 5.4
SUPPLY AND DEMAND INDICATORS
Per caput food consumption:
World (kg/yr) 67.2 66.9 67.1 0.3
LIFDC (kg/yr) 47.8 47.7 48.4 1.5
World stock-to-use ratio (%) 26.7 23.7 24.5
Major exporters stock-to-disappearance ratio2 (%)
18.4 14.2 15.5
FAO WHEAT PRICE INDEX3 (2002-2004=100)
2011 2012 2013 Jan-May
Change: Jan-May 2013
over Jan-May 2012
%
222 210 212 10.3
and the forecasts for a large increase in world wheat
production in 2013. In May 2013, wheat futures in Chicago for September delivery averaged USD 260 per
tonne, down 11 percent from the beginning of 2013, but
ten percent higher than the corresponding period last year.
PRODUCTION
Global wheat output could reach record high in 2013 Based on indications as of late May, FAO’s forecast for
global wheat production in 2013 has been raised to a new
record level of 702 million tonnes, 6.5 percent up from last
year’s reduced harvest. Increased plantings for the 2013
crop, in response to strong prices, are largely behind the
expected growth, although a recovery of yields in some
areas affected by drought last year is also contributing
to the positive outlook. The upward adjustment in the
past month largely reflects increased forecasts for the EU
and China, but also for several smaller wheat producing
nations.
In North America, latest indications for wheat
production in the United States confirm the possibility of
a sharp decline in output this year. Although winter wheat
plantings for 2013 were estimated marginally up from last
year, the rate of abandonment is expected to be above
normal, reflecting the impact of drought. As a result, the
harvested area of winter wheat is forecast to drop by about
4 percent compared with 2012, with yields also expected
to be below average in areas where drought persists.
Regarding spring wheat, farmers’ intentions pointed to
increased plantings, but the slow pace of fieldwork as of
late May raises some doubt over the final planted area.
Based on latest indications, the country’s total wheat
production in 2013 is forecast at 56 million tonnes, some
9 percent down from 2012. In Canada, the main spring
wheat crop planting was underway as of April and, based
on an official survey, the area is expected to increase
sharply by some 12 percent, largely at the expense of
canola, the major oilseed crop.
In Europe, the 2013 spring growing period got
off to a slow start in northern and central areas where
temperatures have been below the long-term average, with
consequent delays in winter crop development and spring
planting. Although it is still too early to judge the impact
of the adverse weather, it likely precludes anything better
than average yields in the affected areas. In the EU, the
aggregate wheat area is estimated some 2 percent higher
than last year and, assuming yields are average, output
is forecast to increase by about 6 percent, to 139 million
tonnes. In the Russian Federation, winter wheat plantings

Ma
rke
t asse
ssme
nts
MMaa
rke
t asse
ssme
nts
133
were down from the previous year due to dry weather
but winter survival rates are estimated above normal after
generally favourable winter conditions. The spring wheat
area is expected to increase in response to high price
prospects but the prolonged winter weather in many parts
could impact on the final area sown. In the main producing
southern regions, above-normal temperatures and reduced
precipitation in recent weeks have raised concern over yield
prospects for winter crops and could impact spring sowing
in these areas. At this stage, assuming conditions return
to normal for the remainder of the season, aggregate
wheat output is forecast to recover sharply from last
year’s drought-reduced level to about 55 million tonnes.
In Ukraine, the winter wheat conditions are also reported
to be generally good, and spring planting is progressing
well. Wheat output in 2013 is forecast to recover from the
previous year’s reduced level to 20 million tonnes.
In Asia, where harvesting of the 2013 wheat crops in
the Far East subregion is already underway or due to start
soon, prospects are mostly good in the main producing
countries following generally favourable weather. In China,
the latest official forecast points to a wheat crop of 121.8
million tonnes, surpassing by 1 percent last year’s record.
Apart from satisfactory weather, the good outcome is
attributable to subsidized inputs, including high-quality
seeds, fertilizers and fuel. In India, the official forecast for
2013 wheat production has been raised to 93.6 million
tonnes, a good harvest, although down by 1.4 percent
from last year’s high. In Pakistan, a record 2013 harvest is
expected – officially forecast at 26.3 million tonnes, it will
be some 10 percent above the 2012 reduced harvest.
In the Asian CIS subregion, Kazakhstan is the major
wheat producer and the bulk of its crop is spring sown
from April to May. Plantings are forecast at about 13
million hectares, slightly down from 2012, but a return to
normal yields after last year’s reduced levels is expected to
lift production back up, to some 14 million tonnes.
In North Africa, weather conditions remain favourable
for harvesting the 2013 winter wheat. In Egypt, the 2013
wheat crop is officially forecast at a record 9.4 million
tonnes. In Algeria and Tunisia, outputs are forecast to be
similar to last year’s satisfactory levels while, in Morocco,
wheat production is set to recover sharply to 6.5 million
tonnes, after a reduction in the previous year due to
adverse weather.
In the Southern Hemisphere, winter wheat sowing is
underway in Australia. Early indications point to about
a 4 percent increase in plantings in response to attractive
prices. Assuming average yields, this could lift output to 24
million tonnes. However, as of mid-May, soil moisture was
still lacking in many parts of the eastern grain belt. Without
good rains in the coming weeks, this would impact the final
area sown. In Argentina, early indications for the 2013
wheat crop, to be planted from June, suggest an increase
of area from last year’s sharply reduced level to about 3.5
million hectares. Assuming normal weather conditions and
a recovery in yields from last year, production is tentatively
forecast to increase to 11 million tonnes. In Brazil, where
planting of the 2013 crop was underway as of May, output
is officially forecast to increase by about 25 percent from
last year’s poor level to 5.5 million tonnes, remaining still
below average. Planted area is expected to increase only
marginally, while yields are seen to recover by almost 18
percent from the low levels of 2012.
TRADE
Wheat trade to decline in 2013/14 for the second consecutive season FAO’s first forecast for world wheat trade in 2013/14
(July/June) is put at 136 million tonnes, 3.5 million tonnes
less than the latest estimate for 2012/13 and almost 11
million tonnes, or 7 percent, below the all-time high of
146.8 million tonnes registered in 2011/12. The anticipated
decline in world trade is mainly attributable to projected
lower import demand by several countries in Asia and
Europe, mostly due to higher domestic production.
In Asia, aggregate imports in 2013/14 are forecast
at 63.2 million tonnes, down 1.6 million tonnes from
2012/13. Smaller purchases are foreseen for the Islamic Republic of Iran, which had doubled imports in 2012/13
to replenish stocks. As a result, the country is estimated
to import only 1.5 million tonnes in 2012/13, down from
4.7 million tonnes in 2012/13. Feed wheat imports by the
Republic of Korea are expected to decline by at least 400
000 tonnes as larger maize supplies in the new season may
encourage a switch to maize instead. By contrast, larger
purchases are forecast for Saudi Arabia, given the falling
trend in domestic production associated with the gradual
phasing out of subsidies to domestic producers. In China,
in spite of the projected record wheat crop this year,
imports of high quality wheat could increase by around
500 000 tonnes should prices remain favourable. China
surprised the market in April when it purchased almost 1
million tonnes of soft red winter wheat from the United
States. This came after a sharp price decline in international
markets, which put the US prices below the domestic prices
of China’s Juangsu red wheat.
In Europe, total imports in 2013/14 are projected to
reach 10 million tonnes, down more than 2 million tonnes
from the estimated imports in 2012/13. Most of this decline
is expected in the Russian Federation where this year’s

Foo
d O
utl
oo
k -
Jun
e 2
01
3FFoo
od
Ou
tlo
ok
- Ju
ne
2200
113
14
anticipated recovery in production could result in a decline
of 2 million tonnes in imports. While still a net exporter
in the 2012/13 marketing season, in April the country
suspended its 5 percent import duty on wheat until July
2013 to check rising domestic prices. Wheat imports by
Ukraine, another net-exporting country, are also forecast
to decline sharply, by at least 800 000 tonnes, given
the current prospects for a strong rebound in domestic
production. By contrast, wheat imports by the EU are
expected to increase by 500 000 in the new season despite
the projected increase in production. Larger imports may
be required by the UK, where crops have been negatively
affected by prolonged cold and wet weather conditions.
In Africa, aggregate wheat imports in 2013/14 could
increase slightly from the current season’s reduced level.
In North Africa, wheat purchases by Morocco are set to
decrease by 900 000 tonnes because of the anticipated
recovery in domestic production. Lower imports are also
forecast for Algeria. However, in Egypt, the world’s
largest wheat importer, they may increase to 9 million
tonnes on growing demand. Most countries in the sub-
Saharan region are forecast to import as much as in the
current season. Only Kenya may buy significantly more
wheat in 2013/14, due to rising demand.
In Latin America and the Caribbean, total imports in
2013/14 are forecast to change little with most countries
keeping their imports at about 2012/13 levels. Wheat
imports by Brazil, the world’s second largest wheat
importer after Egypt, are forecast at 7.5 million tonnes,
unchanged from the estimated purchases in the current
season, during which, in April, Brazil doubled the non-
Mercosur import quota (to 2 million tonnes) and waived
the 10 percent tariff until July 2013. This was intended
to facilitate imports from non-traditional suppliers so as
to offset reduced exports from Argentina, which had
harvested a poor crop in 2012/13.
Regarding exports, the expected recovery in wheat
production could boost shipments from the Russian Federation and Ukraine in the new season. Slightly higher
exports are also forecast for Canada, but sales from a
number of other major exporters are expected to decline,
in particular from Argentina, Australia and the United States due to reduced crops, and from the EU, largely
on assumption of rising competition with Black Sea-origin
wheat and shrinking demand in world wheat markets in
2013/14. Among the non-traditional exporters, shipments
from India could remain at the same level as in 2012/13
(7 million tonnes), given the large surplus generated by
consecutive years of bumper crops.
UTILIZATION
Modest growth in world wheat utilization projected for 2013/14Following a small decline in 2012/13, total wheat utilization
in 2013/14 is forecast to increase to 694 million tonnes,
1 percent higher than 2012/13 but still about 1 percent
below the 10-year trend.
Strong demand for feed lifted world wheat utilization to
a record high of 697 million tonnes in 2011/12. The sudden
increase in the feed use of wheat in 2011/12 was driven by
very tight supply and high prices of maize and barley. While
supplies of coarse grains have been short again in 2012/13,
and their prices also very high, feed wheat use is not
expected to increase as much as it did in 2011/12 largely
because of the overall difficult macro-economic conditions.
Figure 3. Wheat imports by region Figure 4. Major wheat exporters
0
20
40
60
80
2012/13 estimate
2013/14 forecast
Million tonnes
Asia Africa EuropeSouthAmerica
CentralAmerica
0 10 20 30
2012/13 estimate 2013/14 forecast
Million tonnes
UnitedStates
EU
Canada
Argentina
Ukraine
Kazakhstan
Australia
RussianFederation

Ma
rke
t asse
ssme
nts
MMaa
rke
t asse
ssme
nts
155
Figure 5. Wheat stocks and ratiosThese very same conditions are expected to weigh on feed
demand in 2013/14.
Total feed use in 2013/14 is projected at nearly 134
million tonnes, well below the peak of 147 million tonnes
registered in 2011/12 and up slightly from 2012/13.
Contrary to the situation in 2012/13, the EU, the largest
user of wheat for animal feed, is anticipated to account for
much of the world increase in wheat feed use in 2013/14.
By contrast, feed use of wheat in the United States is
forecast to decline sharply from the peak registered this
season, provided the expected strong recovery in domestic
maize supply in 2013/14 is confirmed.
World utilization of wheat in 2013/14 for direct human consumption is expected to reach 480 million tonnes,
up 1.2 percent from 2012/13. At this level, world wheat
consumption, on a per capita basis, would be steady at
around 67.00 kg per annum. Per capita wheat consumption
is expected to remain at around 60 kg in the developing
countries and at 96 kg in the developed countries.
STOCKS
Higher production pushing up world inventories in 2013/14Based on the latest production forecasts for 2013 and
the projected utilization in 2013/14, FAO’s first forecast
for world wheat stocks by the close of crop seasons in
2014 stands at around 173 million tonnes, representing
a 5 percent, or 8.4 million tonnes, rebound from their
opening levels. The bulk of this increase is projected for
China (+3.9 million tonnes), the EU (+3.5 million tonnes)
and the Russian Federation (+ 3.2 million tonnes), more
than offsetting possible declines in a few countries, most
notably, Egypt (- 600 000 tonnes), Ukraine (-800 000
tonnes) and the United States (-1.6 million tonnes). In
India, inventories are again likely to be above normal levels
given the consecutive years of bumper crops.
At the current forecast levels, the world wheat stocks-to-use ratio in 2013/14 would reach 24.6 percent, up
from 23.5 percent in 2012/13 and well above the historical
low of 19.9 percent registered in 2007/08. Furthermore,
the ratio of major wheat exporters’ closing stocks to their total disappearance (defined as domestic
utilization plus exports) is set to increase from 14.2 percent
in 2012/13 to 15.5 percent in 2013/14. This ratio would
be 2.6 percentage points higher than in 2007/08 when
international prices surged on growing supply concerns.
Given the importance of wheat as a food staple, the
increase in these ratios is a positive development for global
food security.
0
100
200
300
2013/142012/132011/122010/112009/105
15
25
35
Million tonnes Percent
Major Exporters Rest of the World
World Stock-to-use ratioStock-to-disappearance ratio of Major Exporters
estim. f’cast
Foo
d O
utl
oo
k -
Jun
e 2
01
3FFoo
od
Ou
tlo
ok
- Ju
ne
2200
113
16
Figure 2. CBOT maize futures for DecemberFigure 1. Maize export price (US No. 2 yellow, Gulf)
COARSE GRAINS
Major Coarse Grain Exporters and Importers
Major ExportersMajor Importers
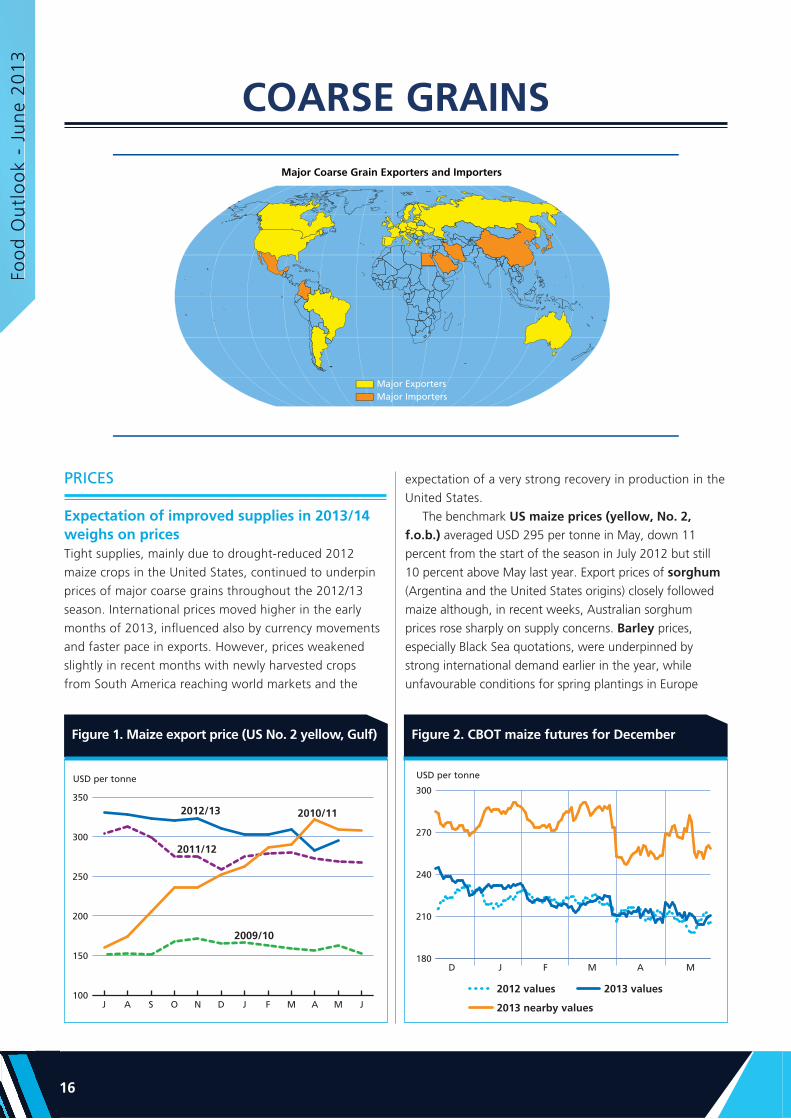
PRICES
Expectation of improved supplies in 2013/14 weighs on pricesTight supplies, mainly due to drought-reduced 2012
maize crops in the United States, continued to underpin
prices of major coarse grains throughout the 2012/13
season. International prices moved higher in the early
months of 2013, influenced also by currency movements
and faster pace in exports. However, prices weakened
slightly in recent months with newly harvested crops
from South America reaching world markets and the
expectation of a very strong recovery in production in the
United States.
The benchmark US maize prices (yellow, No. 2, f.o.b.) averaged USD 295 per tonne in May, down 11
percent from the start of the season in July 2012 but still
10 percent above May last year. Export prices of sorghum
(Argentina and the United States origins) closely followed
maize although, in recent weeks, Australian sorghum
prices rose sharply on supply concerns. Barley prices,
especially Black Sea quotations, were underpinned by
strong international demand earlier in the year, while
unfavourable conditions for spring plantings in Europe
100
150
200
250
300
350
2010/11
2009/10
2012/13
2011/12
USD per tonne
JMAMFJDNOSAJ
180
210
240
270
300
USD per tonne
D J F M A M
2012 values 2013 values
2013 nearby values

Ma
rke
t asse
ssme
nts
MMaa
rke
t asse
ssme
nts
177
Figure 3. World maize production Figure 4. Soybean/maize ratio
were also supportive. Barley values (feed barley) weakened
as crop conditions improved and trade activity slowed
down.
Good prospects for a strong recovery in coarse grains
production in general, and maize in particular, have put
downward pressure on prices in the futures markets. In
May, the Chicago maize futures for December delivery
averaged USD 223 per tonne, 8 percent below their nearby
(July) values. This situation is very much a reflection of tight
supplies of the old crop while markets anticipate prices to
drop below current levels by the end of year with the arrival
of a bumper new crop in the United States.
PRODUCTION
Global output of coarse grains could recover strongly in 2013 FAO’s latest forecast for world production of coarse grains in 2013 stands at 1 259 million tonnes, 8.5 percent
up from last year and a new record level, well above the
previous high of 1 167 million tonnes in 2011. The bulk
of the increase is anticipated in the United States, the
world’s largest producer, where a sharp expansion in
maize plantings is forecast, but it also reflects record crop
prospects in China and good harvests already underway in
South America.
Global output of maize in 2013 is forecast at about 963
million tonnes, 10 percent up from 2012. In the United States, the world’s largest maize producer, the early pace
of maize planting was much slower than normal due to
adverse weather. However, weather improved in mid-May
and farmers made up quickly for the lost time. If weather
conditions remain clement, survey data indicates that
producers intend to plant the largest area since 1936. If
these intentions are realized and yields return to normal
after last year’s drought-reduced levels, the country’s
maize output could increase to about 340 million tonnes.
In China, the world’s second largest maize producer, 2013
production is expected to increase 2.8 percent above last
year’s level to a new record of 214 million tonnes. In the
EU, maize plantings are forecast to increase slightly this
year and, assuming yields recover, output could increase
by some 16 percent or 9 million tonnes to about 65 million
tonnes.
In the Southern Hemisphere, the main 2013 maize
harvests are underway or already complete in some
countries. In South America, in Brazil, harvesting of the
2013 first maize season is progressing, while planting
of the second season crop was completed in March.
Official forecasts point to an aggregate production in
2013 of 77.8 million tonnes, a new record level, 9 percent
above last year’s peak. This mainly reflects an expected 9
percent increase overall in the area harvested, driven by
higher market prices. In Argentina, where harvesting of
the 2013 maize crop is almost complete, production is
officially forecast to increase by 21 percent from 2012,
reaching 25.7 million tonnes. Higher yields in the key
growing areas have more than offset a reduction in the
area planted caused by excessive rains at sowing time. In
Southern Africa, where the main maize harvest is already
underway, aggregate output is forecast to decrease for the
third year in succession, albeit slightly, to about 23 million
tonnes, which would still remain above the short-term
average. In South Africa, the subregion’s main producer
and exporter, prospects have deteriorated since earlier in
the season mainly because of dry conditions in western
0
250
500
750
1000
2013/142012/132011/122010/112009/10
Million tonnes
United States
Brazil
China (Mainland) EU
Others
estim. f’cast
1.7
1.8
1.9
2.0
2.1
2.2
2.3
2.4
2.5
1.7
1.8
1.9
2.0
2.1
2.2
2.3
2.4
2.5
S O DN J F M A M2012 2013
From a historical perspective in the USA, whenever this ratioexceeds 2.4, the general bias favours soybean over maize,resulting in a shift of planting area from maize to soybeans.

Foo
d O
utl
oo
k -
Jun
e 2
01
3FFoo
od
Ou
tlo
ok
- Ju
ne
2200
113
18
areas of the country’s maize triangle, predominantly a
white maize producing region. Growing conditions remain
more favourable in the yellow maize growing eastern
areas. Based on latest indications, the country’s aggregate
maize output is expected at 12.1 million tonnes, about 5
percent below the 2012 harvest, which was recently revised
upwards.
World output of barley in 2013 is forecast at about 138
million tonnes, 4.9 percent up from 2012. Larger harvests
are expected in all the major barley producing countries
throughout the world, but the most significant increases
would be in North Africa and the CIS countries in Europe,
where outputs are forecast to recover from last year’s
drought-reduced levels.
TRADE
World trade in coarse grains to increase in 2013/14FAO’s first forecast for world trade in coarse grains in
2013/14 (July/June) points to a 3 percent (4 million tonnes)
expansion from the 2012/13 estimated level to an all-time
high of 133 million tonnes.
The anticipated increase would be largely on account of
a larger volume of maize trade, which is forecast to reach
a record 103 million tonnes, up 3.5 percent (3.5 million
tonnes) from 2012/13. The bulk of the increase is expected
in Asia, where total maize imports could rise by 11 percent
and reach 55.6 million tonnes. Imports by China alone are
forecast to climb by 3 million tonnes in 2013/14 in spite
of anticipated record production this year. China’s imports
have been on the rise since 2010/11 and, while recent
episodes of animal diseases slowed the pace of China’s
Table 1. World coarse grain market at a glance
Table 2. Coarse grain production: leading producers*
2012
estim.
2013
f”cast
Change: 2013
over 2012
million tonnes %
United States 286.3 357.1 24.7
China (Mainland) 217.0 222.8 2.7
European Union 142.3 152.9 7.4
Brazil 74.1 80.8 9.0
India 42.2 38.8 -8.1
Russian Federation 30.8 34.0 10.4
Argentina 31.1 34.3 10.3
Ukraine 29.9 31.8 6.4
Mexico 30.0 30.3 1.0
Canada 24.4 26.0 6.6
Nigeria 22.6 22.6 0.0
Indonesia 19.0 19.0 0.0
Ethiopia 17.4 17.4 0.0
Turkey 12.4 12.8 3.2
South Africa 13.3 12.6 -5.3
Other countries 167.9 166.1 -1.1
World 1 160.7 1259.3 8.5
* Countries listed according to their position in global production (average 2011-2013)
1 Trade refers to exports based on a common July/June marketing season.
2 Major exporters include Argentina, Australia, Brazil, Canada, EU, Russian Fed., Ukraine and the United States.
2011/12 2012/13 estim.
2013/14 f’cast
Change: 2013/14
over 2012/13
million tonnes %
WORLD BALANCE
Production 1 167.5 1 160.7 1 259.3 8.5
Trade1 131.8 129.0 133.0 3.1
Total utilization 1 161.7 1 168.6 1 216.9 4.1
Food 199.8 205.2 208.2 1.5
Feed 634.7 649.2 685.6 5.6
Other uses 327.1 314.2 323.0 2.8
Ending stocks 176.7 173.0 213.7 23.5
SUPPLY AND DEMAND INDICATORS
Per caput food consumption:
World (kg/yr) 28.6 28.9 29.1 0.7
LIFDC (kg/yr) 39.5 40.4 40.7 0.7
World stock-to-use ratio (%) 15.1 14.2 17.1
Major exporters stock-to-disappearance ratio2 (%)
10.3 8.0 12.5
FAO COARSE GRAIN PRICE INDEX (2002-2004=100)
2011 2012 2013 Jan-May
Change: Jan-May 2013
over Jan-May 2012
%
277 283 283 8.4
Figure 5. World barley production
0
60
120
180
2013/142012/132011/122010/112009/10
Million tonnes
EU
Canada
CIS
Others
estim. f’cast

Ma
rke
t asse
ssme
nts
MMaa
rke
t asse
ssme
nts
199
Figure 6. Coarse grain imports by region Figure 7. Major coarse grain exporters
feed grains purchases from world markets, the overall trend
still points to further increases. Larger maize imports are
also forecast for the Republic of Korea as the country
is expected to take advantage of lower maize prices and
reduce its purchase of feed wheat instead. Maize imports
in Africa are forecast to increase significantly as well, from
13.2 million tonnes in 2012/13 to 15 million tonnes in
2013/14. Most of this increase is expected in Egypt where
this year’s maize production could fall short of 2012/13
levels. Also in Latin America and the Caribbean, maize
imports are forecast higher, especially in Mexico where,
despite an increase in production, they could rise to 9
million tonnes in order to meet the growing demand from
the feed sector. By contrast, imports into Europe are
expected to fall sharply in 2013/14, mostly in the EU, given
this year’s anticipated recovery in the production of wheat,
a major feed grain in the Union. Elsewhere, imports by the
United States are likely to return to a normal level of less
than 1 million tonnes, down from an exceptionally high
level of 3 million tonnes in 2012/13.
World barley trade is likely to remain steady at 19 million
tonnes. Countries in Asia are expected to account for 81
percent of the world import volume with Saudi Arabia
alone accounting for half of the volume flowing into the
region. In Africa, current indications point to a small
reduction in barley imports to just above 1 million tonnes
with most of the decrease in Algeria, facilitated by higher
domestic production. Likewise, in Europe, imports by the
Russian Federation and Ukraine are seen to decline
slightly, given the anticipated recovery in domestic supplies
in 2013/14.
Global trade in sorghum is forecast to reach 7.5
million tonnes in 2013/14, up 500 000 tonnes from
2012/13. Purchases by Mexico, the world largest
sorghum importer, are forecast to increase by 1 million
tonnes, bringing total purchases to 3 million tonnes to
meet rising domestic demand. Mexico’s increase will be
partially offset by lower EU imports, now forecast to be
halved to 300 000 tonnes in 2013/14. Global trade in
other coarse grains (millet, rye and oats) is anticipated
to total 3.5 million tonnes in 2013/14, unchanged from
2012/13 level.
Regarding coarse grains exports, a recovery in supplies
of maize in the United States is expected to boost its
shipments to over 34 million tonnes, which would be at
least 10 million tonnes higher than the current season’s
reduced level. Of this total, maize exports are put at
30 million tonnes. Coarse grains exports by Argentina
are forecast to decline to 23.5 million tonnes on lower
shipments of barley. Maize exports from Brazil may reach
23 million tonnes. In 2012/13, Brazil became the world’s
largest maize exporter, with total shipments of 27 million
tonnes, surpassing even the United States. However, the
forecast decline in Brazil’s exports to 23 million tonnes
would place the country as the second largest maize
exporter in 2013/14, after the United States. Among the
other major coarse grains exporters, total shipments from
the EU are forecast to rise slightly, to 6.2 million tonnes,
of which barley would account for 72 percent. While
exports from Canada and Australia are likely to decline
somewhat, maize exports from the Russian Federation
and Ukraine are anticipated to increase. However,
exports of barley from the two countries could remain
close to 2012/13 levels.
0
20
40
60
80
2012/13 estimate
2013/14 forecast
Million tonnes
Asia Africa EuropeSouthAmerica
CentralAmerica
0 10 20 30 40
2012/13 estimate 2013/14 forecast
Million tonnes
UnitedStates
EU
Canada
Brazil
Ukraine
Argentina
Australia
RussianFederation

Foo
d O
utl
oo
k -
Jun
e 2
01
3FFoo
od
Ou
tlo
ok
- Ju
ne
2200
113
202
Figure 8. Coarse grain utilization
2006/07 2007/08 2008/09 2009/10 2010/11 2011/12 2012/13
estim.
2013/14*
(f’cast)
Thousand tonnes
Maize production 267 503 311 177 307 142 332 549 316 165 313 949 273 832 359 173
Ethanol use 53 837 77 453 93 396 116 616 127 538 127 284 116 845 123 195
Yearly change (%) 32 44 21 25 9 -0.2 -8 5
As production (%) 20 23 30 35 40 41 43 34
UTILIZATION
Falling prices could boost feed and industrial utilization of coarse grainsBased on early indications, total utilization of coarse grains
in 2013/14 could be heading for the first significant year-
on-year expansion in more than five years. FAO’s first
forecast for global utilization of coarse grains points to
a 4 percent increase from the 2012/13 stagnated level,
to an all-time high of 1 217 million tonnes. In contrast
to the situation in the current season (2012/13), when
total utilization in the developed countries is estimated to
have contracted by over 2 percent against an expansion
of 3.6 percent in the developing countries, the forecast
growth in 2013/14 is likely to be shared equally between
the developed and developing countries, with their
use increasing by around 4 percent in each group. The
expansions are mostly driven by expectations of much
higher feed use, largely reflecting the anticipated rebound
in maize supplies in the new season.
Total feed utilization of coarse grains is forecast to
reach 686 million tonnes in 2013/14, some 5.6 percent
higher than in 2012/13. In the developing countries, as a
group, the aggregate feed use is projected at 349 million
tonnes, 6 percent higher than the latest estimate for the
current marketing season and exceeding the projected feed
use in the developed countries for the second consecutive
season. However, most of this increase is expected to be
concentrated in few countries, primarily in the emerging
markets such as Brazil and China. In the developed
countries, where total feed use in 2013/14 is projected to
rise by 5 percent (about 17 million tonnes) to 337 million
tonnes, the bulk of the growth is expected in the United
States, where a recovery in maize production and falling
prices could boost its domestic feed utilization by as much
as 16 percent (18 million tonnes) to 130 million tonnes.
World food consumption of coarse grains is forecast
to increase by 1.5 percent in 2013/14, to 208 million
tonnes. Although globally, direct human consumption of
coarse grains may seem far less significant than that of
rice or wheat, coarse grains do account for an important
share of human food consumption in Central America
and the Caribbean as well as many countries in Africa. At
the global level, the anticipated rate of increase in food
consumption of coarse grains would closely trail growth
in world population, thus leading to a stable average
per capita consumption of around 29 kg. In Africa, per
capita consumption is projected at 78 kg while, in Central
America, it is put at 99 kg.
Total industrial use of coarse grains is forecast to reach
at least 292 million tonnes in 2013/14, up 3 percent from
the estimated level in 2012/13. Globally, nearly one-half of
total industrial utilization of coarse grains is concentrated
in the United States (at over 150 million tonnes), of which
at least 117 million tonnes will be used for production of
ethanol in 2012/13 (October/September) according to the
official estimates. This would be down 8.2 percent from
2011/12 as high prices weigh on ethanol production.
However, based on the expectation of a record US maize
crop this year, early projections point to a significant (5.4
percent) rebound in the US use of maize for production of
ethanol in the new marketing season (2013/14), increasing
to 123 million tonnes, which is still below the 127 million
tonnes record hit in 2010/11.
Table 3. Maize use for ethanol (excluding non-fuel in the United States)
0
350
700
1050
1400
2013/142012/132011/122010/112009/10
Million tonnes
Feed use
Other uses
Food use
estim. f’cast

Ma
rke
t asse
ssme
nts
MMaa
rke
t asse
ssme
nts
211
Figure 9. Coarse grain stocks and ratiosSTOCKS
Inventories to rebound from a 2-year low to highest in 14 yearsAssuming current production forecasts for 2013
materialize and based on FAO’s early projections for
total utilization in 2013/14, global inventories of coarse
grains are likely to reach 214 million tonnes by the close
of seasons in 2014. This is as much as 24 percent (41
million tonnes) above their 2-year low opening levels of
only 173 million tonnes and the highest level since 2000.
This will lift the global stock-to-use ratio from the
historically low level of 14.2 percent in 2012/13 to at least
17 percent in 2013/14, signalling a notable improvement
in the global supply and demand balance in the new
season after an exceptionally tight situation in 2012/13.
This improvement is also evidenced by the sharp increase
in the major exporters’ stock-to-disappearance ratio
(i.e. domestic consumption plus exports), which is forecast
to rebound from the historical low level of 8 percent in
2012/13 to 12.5 percent in 2013/14 – the highest level
since 2009/10.
The bulk of the recovery in world stocks of coarse grains
is expected in the United States, where maize stocks,
having fallen to a critically low level of 19 million tonnes
in 2012/13, are forecast to more than double and reach
at least 45 million tonnes, their highest since 2005/06.
Significantly larger inventories are anticipated in China,
where based on current expectation of another record
maize crop this year, inventories could reach 67 million
tonnes, 5 million tonnes higher than their opening levels.
Brazil is also expected to end the new season with much
larger maize stocks, given this year’s bumper harvest and
reduced export prospects compared to 2012/13. Larger
carryovers, driven by the projected strong recovery in maize
production this year, are also forecast for the EU.
0
100
200
300
2013/142012/132011/122010/112009/105
10
15
20
Million tonnes Percent
United States Rest of the World
World Stock-to-use ratioStock-to-disappearance ratio of Major Exporters
estim. f’cast
Foo
d O
utl
oo
k -
Jun
e 2
01
3FFoo
od
Ou
tlo
ok
- Ju
ne
2200
113
222
Figure 1. Export prices for lower quality rice
RICE
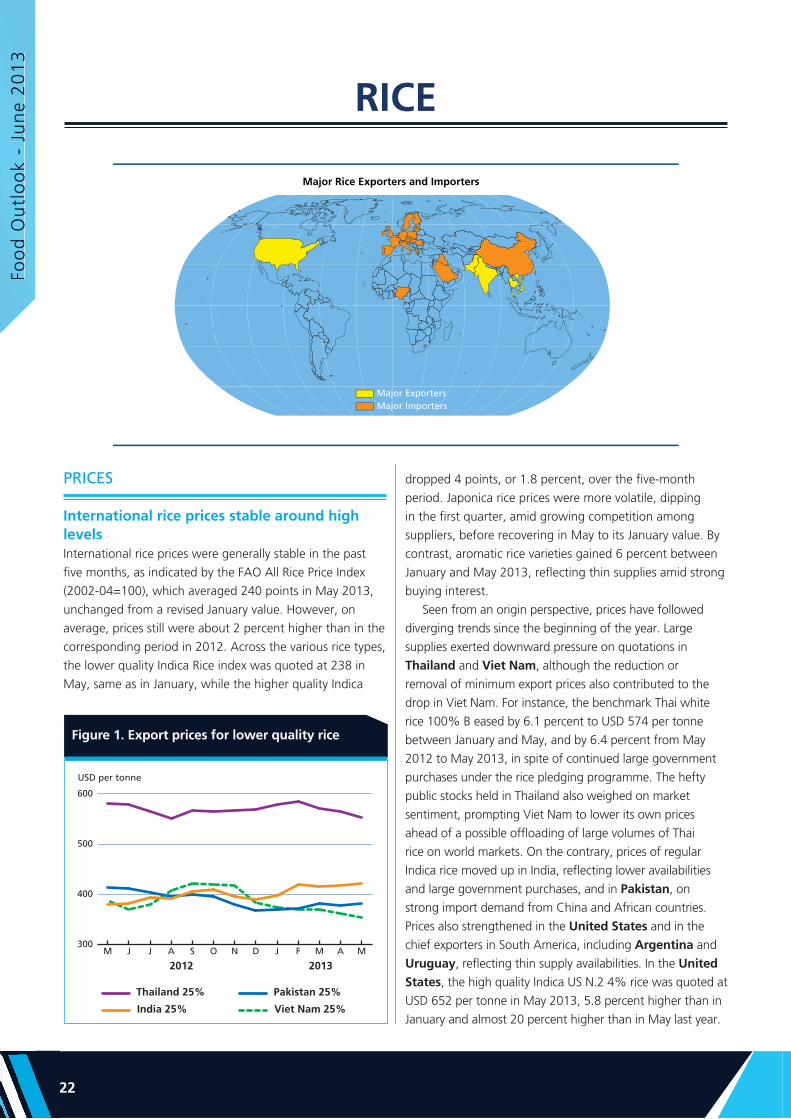
PRICES
International rice prices stable around high levelsInternational rice prices were generally stable in the past
five months, as indicated by the FAO All Rice Price Index
(2002-04=100), which averaged 240 points in May 2013,
unchanged from a revised January value. However, on
average, prices still were about 2 percent higher than in the
corresponding period in 2012. Across the various rice types,
the lower quality Indica Rice index was quoted at 238 in
May, same as in January, while the higher quality Indica
dropped 4 points, or 1.8 percent, over the five-month
period. Japonica rice prices were more volatile, dipping
in the first quarter, amid growing competition among
suppliers, before recovering in May to its January value. By
contrast, aromatic rice varieties gained 6 percent between
January and May 2013, reflecting thin supplies amid strong
buying interest.
Seen from an origin perspective, prices have followed
diverging trends since the beginning of the year. Large
supplies exerted downward pressure on quotations in
Thailand and Viet Nam, although the reduction or
removal of minimum export prices also contributed to the
drop in Viet Nam. For instance, the benchmark Thai white
rice 100% B eased by 6.1 percent to USD 574 per tonne
between January and May, and by 6.4 percent from May
2012 to May 2013, in spite of continued large government
purchases under the rice pledging programme. The hefty
public stocks held in Thailand also weighed on market
sentiment, prompting Viet Nam to lower its own prices
ahead of a possible offloading of large volumes of Thai
rice on world markets. On the contrary, prices of regular
Indica rice moved up in India, reflecting lower availabilities
and large government purchases, and in Pakistan, on
strong import demand from China and African countries.
Prices also strengthened in the United States and in the
chief exporters in South America, including Argentina and
Uruguay, reflecting thin supply availabilities. In the United States, the high quality Indica US N.2 4% rice was quoted at
USD 652 per tonne in May 2013, 5.8 percent higher than in
January and almost 20 percent higher than in May last year.
300
400
500
600
MAMFJDNOSAJJM
2012 2013
USD per tonne
Thailand 25%
India 25%
Pakistan 25%
Viet Nam 25%
Major Rice Exporters and Importers
Major ExportersMajor Importers

Ma
rke
t asse
ssme
nts
MMaa
rke
t asse
ssme
nts
233
In the next few months, the market attention is likely to
focus on Thailand, regarding the possible release of large
volumes of pledged rice from public stocks, but also on
India, where the planned widening of the subsidized rice
distribution programme may have an impact on export
availabilities and prices. The pace of rice imports by China
will also be critical, as the country emerged as one of the
leading rice importers in the last year.
PRODUCTION
Preliminary forecasts for 2013 point to stronger production growth Since the May 2013 release of global rice supply and
demand balances, the only critical revision to the 2012
world rice production estimate concerned India, where
output was officially raised by 2.4 million tonnes. India’s
new production figure implies that the losses caused by
the 2012 erratic monsoon rains were much less severe
than originally believed. The revision lifts the 2012 global
production aggregate to nearly 490 million tonnes, in
milled rice terms, resulting in a 1.0 percent increase from
2011, equivalent to about 4.6 million tonnes, a relatively
modest performance if compared to the 13 million tonne
and 16 million tonne gains recorded by the sector in
2010 and 2011, respectively. The global pattern of the
2012 season follows closely the outcome of crops in
Asia, where 444.5 million tonnes were harvested, some
4.4 million tonnes more than in 2011. The increase
was supported by large gains in China, Indonesia, the
Philippines, Thailand and Viet Nam, which more than
compensated for shortfalls in India, Nepal and Pakistan,
where crops were hit by unfavourable weather. In Africa,
some 17.5 million tonnes are estimated to have been
harvested, 5.4 percent more than in 2011. Much of the
gain originated in Egypt, where high prices induced
farmers to exceed their official cultivation limits, but also
in Guinea, Madagascar, Mali and Senegal. In most of
the region, the sector continued to benefit from special
development programmes, as well as renewed investor
interest. By contrast, output fell in Nigeria, reflecting
excessive precipitation and flooding, and in Tanzania,
because of delayed and erratic rainfall. In Latin America
and the Caribbean, 2012 production contracted by almost
7 percent to 18.3 million tonnes, following weather and
price-induced reductions in Argentina, Brazil, Ecuador and Uruguay. In the other regions, output in 2012
rose by 30 percent in Australia and by 8 percent in the
United States, but stagnated in the EU and the Russian Federation.
With the 2012 rice season now concluded, the market
attention is shifting to the 2013 crops. While countries
along and south of the equator are already harvesting their
main crops, in the Northern Hemisphere, countries have
just completed the sowing of their 2013 first (or single)
crop, or are still waiting for the rains to come to start
planting. The bulk of production will only be garnered in
the second half of the year. Still tentatively, and assuming
normal weather conditions prevail in the coming months,
FAO forecasts world rice production in 2013 to reach 499.1
million tonnes, which is 1.9 percent, or 9 million tonnes,
more than in 2012. The expected increase falls short of
those realized in 2010 and 2011, largely because of the
existing global supply overhang, which could depress world
prices and, ultimately, farm prices. However, the effect on
plantings of a possible drop in world quotations is likely
to be uneven, as many governments, especially in Asia,
guarantee relatively high support price levels to producers,
shielding them against international price dips. Farmers
are more exposed in the Americas and Europe, where
the transmission of prices from international to domestic
markets looks stronger.
Under more regular climatic conditions, production
in Asia is forecast to grow by 1.9 percent, or 8.6 million
tonnes, to 453.0 million tonnes in 2013. Monsoon rains,
which determine much of the outcome of the season in the
region, have been predicted to reach 98 percent of their
long-run average in India. If confirmed, they could support
a 2 percent upturn of production in the country to a record
106 million tonnes, with much of the increase likely to be
concentrated in the seven eastern states that have been
targeted for production expansion under India’s “Extending
the Green Revolution to Eastern States” programme. The
raising of official paddy procurement prices and/or other
Figure 2. Global rice paddy production and area
550
600
650
700
750
13121110090807060504130
140
150
160
170
Million tonnes Million ha
Production Area
estim. f’cast

Foo
d O
utl
oo
k -
Jun
e 2
01
3FFoo
od
Ou
tlo
ok
- Ju
ne
2200
113
242
Figure 3. World rice trade and FAO rice export price index
support measures are expected to foster a continued
expansion of outputs, especially in Bangladesh, China,
Indonesia, Malaysia and the Philippines. However, at
this preliminary stage, virtually all producing countries
in the region look set to harvest larger crops, with the
possible exceptions of Japan, which last year benefited
from exceptionally favourable weather conditions, and Viet Nam, where official forecasts point to a slight decline of
output. In 2013, 18.1 million tonnes of rice are expected
to be harvested in Africa, 3.9 percent more than in 2012,
with the largest absolute gains expected in Egypt, Mali, Nigeria and Tanzania. In Egypt, the recent decision to
raise the permitted area for rice cultivation is foreseen to
boost output by 4 percent. Large investments in the sector
are also expected to underpin production in Western
and Eastern Africa. However, prospects are negative for
Madagascar, where the 2013 main crops are already
at an advanced growing stage, reflecting mainly the
possible negative effects of locust outbreaks on yields.
Likewise, production in Mozambique has been hit by
excessive precipitation and floods, which may result in a
15 percent shortfall from last season. In Latin America and
the Caribbean, where the 2013 crops are already at the
harvesting stage, production is forecast to rebound to 18.5
million tonnes, still remaining short of the 2011 record,
as many producers cut rice planting in favour of more
remunerative crops. In the other regions, prospects for
2013 are positive for Australia, with a 15 percent increase
forecast by the Government, but remain downbeat in the
United States and the EU, where adverse weather and
unattractive price expectations may result in a contraction
of the rice area.
TRADE
Weak import demand to result in a 2 percent contraction of rice trade in 2013 FAO has raised its previous forecasts of international rice
trade in 2013 by about 200 000 tonnes to 37.6 million
tonnes (milled basis). The revision mainly accounts for
larger than previously forecast imports by China. On the
supply side, it reflects more buoyant expectations for
exports by India, Myanmar and Viet Nam, which more
than offset downward adjustments for Thailand and the United States.
Compared to the 2012 record, the volume of rice
trade in 2013 would be 2.6 percent lower, but still the
second highest in history. The international trade in rice
is now approaching 8 percent of world production, up
from less than 7 percent in the previous decade. Much of
the expected contraction of rice trade in 2013 would be
0
15
30
45
131211100908070605040
100
200
300
*
* January-May average for prices
Million tonnes, milled eq. 2002-2004=100
Exports FAO Rice ExportPrice Index
estim. f’cast
Figure 4. Rice imports by region
0
5
10
15
131211100908070605
Near East
Far East Africa
Lat. Am.
Million tonnes, milled eq.
Others
Europe
estim. f’cast
Figure 5. Rice exports by the major exporters
0
4
8
12
2012 estimate
2013 forecast
Million tonnes, milled eq.
India Pakistan Thailand USA Viet Nam Others

Ma
rke
t asse
ssme
nts
MMaa
rke
t asse
ssme
nts
255
Figure 6. Wholesale rice prices in China (Mainland) vs export prices in Vietnam
associated with reduced purchases by Indonesia, Nigeria,
the Philippines and Thailand, partly the result of good
crops and, in the last three countries, of their efforts to
thwart illegal rice inflows. Imports by the Islamic Republic of Iran and Egypt may also decline, following their fast
paced purchases last year, which enabled them to refurbish
stocks. On the other hand, official imports by China
are predicted to remain at last year’s level of 2.4 million
tonnes, as domestic prices are still substantially above
nearby exporter’s quotations, making imports particularly
attractive. China’s import figure does not make provision
for unofficial inflows, which have been reported to be
rising.
As for exports, India is anticipated to ship 8.6 million
tonnes this year, much less than the 10.3 million tonnes
delivered in 2012 , but still sufficient for it to retain its
leading position among international suppliers. The
anticipated decline reflects rising prices in India and
anticipation of larger domestic requirements, once
the National Food Security Act, which guarantees very
cheap rice supplies to a widened set of the population,
is implemented. Reduced availabilities could also hinder
exports from Argentina, Brazil and Uruguay. A large part
of these shortfalls is expected to be covered by Viet Nam,
which may see exports rising by 6 percent to 8.2 million
tonnes. Indeed, the country has taken an aggressive stance
to buoy sales, first by reducing or suspending its minimum
export prices, fearing a reversal of policies in Thailand
will result in a large release of supplies from stocks in the
country and, hence, falling international prices. Egypt, Pakistan and the United States are also forecast to step
up exports. Among the other important sources, Thailand
is foreseen to export around 7 million tonnes, a similar level
to last year, as the high prices guaranteed to Thai producers
under the rice pledging programme continue to translate
into export quotations far above those of competitors.
However, shipments from Thailand could rebound sharply,
should government procurement purchases under the
pledging programme be discontinued or large supplies
from public stocks be downloaded on the market.
UTILIZATION
Demand for food consumption continues to underpin world rice utilization Global rice utilization in 2012/13 is estimated to hover
around 478 million tonnes, almost 2 percent more than
in the previous year, with most of the increase sustained
by growing demand for food. Overall, this is gauged at
close to 403 million tonnes, 7.5 million tonnes more than
in 2011/12, which lifts the average world rice food intake
per capita from 56.4 kg in 2011/12 to 56.8 kg in 2012/13.
Rice remains a major staple for developing countries, where
consumption is now estimated at 67.6 kg per person in
2012/13 compared to 12.3 kg per person in the developed
countries. The increase in average rice food consumption
is being facilitated in various countries by declining retail
prices (Table 7) and, in others, by special subsidized
distribution programmes targeting vulnerable population
groups. However, retail prices remain high, exceeding USD
1.00 per kg in several markets, and have shown a tendency
to rise in important countries such as China, India, Indonesia and Myanmar.
Based on expectations for a large increase in world
supplies, under current prospects for a good 2013
production turnout, global rice utilization in 2013/14 is
anticipated to expand strongly, by 2.7 percent or almost 13
million tonnes, to 491 million tonnes. Much of the increase
would correspond to rice utilization as food, which will
contribute to lifting per capita food consumption further.
Demand of rice for food, however, could be affected by
the very recent news regarding the detection of cadmium
in rice produced in China’s Hunan province. Cadmium
is a carcinogenic metal that can cause severe damage to
kidneys and bones. This event could have implications at
the national level, and divert a wider share of the country’s
supplies towards feed and other utilizations, which include
rice post-harvest losses. Based on current expectations,
world rice per capita food consumption is anticipated
to average 57.1 kg in 2013/14, up 0.4 percent from the
previous year – rising in the developing countries, albeit by
only 0.1 percent to 67.7 kg, and falling in the developed
countries by 2.4 percent to 12.0 kg.
350
450
550
650
2013201220112010
Viet Nam 5%broken (f.o.b.)
China: Hubei(Indica, first quality)
USD per tonne

Foo
d O
utl
oo
k -
Jun
e 2
01
3FFoo
od
Ou
tlo
ok
- Ju
ne
2200
113
262
Figure 7. Rice production, utilization and stocks
Figure 8. Stocks held by the five major rice exporters and stock-to-disappearance ratio
Table 1. World rice market at a glance
1 Calendar year exports (second year shown).2 Major exporters include India, Pakistan, Thailand, the United States
and Viet Nam.
STOCKS
Exporting countries to account for the increase in world stocksFAO’s forecast of global rice carryover stocks at the close
of crop seasons in 2013 have been raised by about 2
million tonnes since May, to 173.7 million tonnes, mainly
reflecting upward revisions for India, following the release
of new production figures for 2012, and for Thailand,
on lowered export prospects. At that level, inventories
would be 7 percent larger than their opening level, with
much of the increase concentrated in China and Thailand
where inventories are bulging. The Chinese and Thai
Governments are actively purchasing rice from the market
to support producer prices. Based on the current estimates,
the increase in carryover stocks would lift the world rice
stock-to-use ratio from 33.8 percent in 2012 to 35.3
percent in 2013. Seen from a trade status perspective,
inventories held by exporting countries are set to end close
to 10 percent higher at 145 million tonnes, while importing
countries may cut their reserves by 3 percent to 28.1 million
tonnes. Large supplies are expected to be carried forward
to next season by the major exporters, especially Thailand
and India, where public stocks are reaching very high
levels. Overall, the five major rice exporters (India, Pakistan,
Thailand, United States and Viet Nam) are anticipated to
increase their end-of-season inventories from 41.2 million
tonnes in 2012 to 44.9 million tonnes in 2013, resulting
in their stock-to-disappearance ratio rising from 25.2
percent to 26.8 percent over the two years.
Based on the current forecasts for 2013 production
and very early prospects for 2014 trade, global rice
carryover stocks at the close of marketing years in 2014
are anticipated to reach 182.0 million tonnes, an increase
of 5 percent from their opening levels. This would lift
the world stock-to-use ratio further to 36.3 percent in
2014.
2010/11 2011/12 estim.
2012/13 f’cast
Change: 2012/13
over 2011/12
million tonnes %
WORLD BALANCE
Production 469.1 485.3 489.9 0.9
Trade 1 36.2 38.6 37.6 -2.6
Total utilization 460.4 469.5 478.4 1.9
Food 387.9 395.4 402.9 1.9
Ending stocks 145.7 161.7 173.7 7.4
SUPPLY AND DEMAND INDICATORS
Per caput food consumption:
World (kg/yr) 56.1 56.4 56.8 0.7
LIFDC (kg/yr) 69.3 70.2 70.9 1.0
World stock-to-use ratio (%) 31.0 33.8 35.3
Major exporters stock-to-disappearance ratio2 (%)
21.1 25.2 26.8
FAO RICE PRICE INDEX (2002-2004=100)
2011 2012 2013 Jan-May
Change: Jan-May 2013
over Jan-May 2012
%
251 240 241 2.3
50
100
150
200
350
400
450
500
12/1310/1108/0906/0704/0502/03
Million tonnes, milled eq. Million tonnes, milled eq.
f’cast
Stocks (right axis)
Production (left axis) Utilization (left axis)
0
20
40
60
12/1310/1108/0906/0704/0502/030
10
20
30
Million tonnes, milled eq. Percent
f’cast
Closing Stocks
Stock-to-disappearance ratio

Ma
rke
t asse
ssme
nts
MMaa
rke
t asse
ssme
nts
277
ASI
AM
on
thU
SD
/Kg
3 m
on
ths
ea
rlie
r1
ye
ar
ea
rlie
r2
ye
ars
ea
rlie
r
Ba
ng
lad
esh
: D
ha
ka
(co
ars
e)
Ap
r-1
30
.40
5
%9
%-8
%
Ca
mb
od
ia:
Ph
no
m P
en
h (
mix
)*A
pr-
13
0.4
5
6%
13
%1
3%
Ch
ina
: 5
0 C
ity
Avg
. (j
ap
on
ica
se
con
d q
ua
lity)
Ap
r-1
30
.91
-1
%6
%6
%
Ind
ia:
De
lhi
Ap
r-1
30
.52
8
%1
4%
21
%
Ind
on
esi
a:
Ntl
. A
vg.
(me
diu
m q
ua
lity)
Ap
r-1
30
.85
-1
%4
%1
8%
Lao
PD
R:
Vie
nti
an
e (
glu
tin
ou
s fi
rst
qu
alit
y)M
ar-
13
0.9
5
-6%
-6%
-6%
Mo
ng
olia
: U
laa
nb
aa
tar
A
pr-
13
1.2
1
0%
4%
2%
Mya
nm
ar:
Ya
ng
on
(m
an
aw
thu
kh
a F
Q)*
Ap
r-1
30
.42
1
4%
35
%6
%
Ne
pa
l: K
ath
ma
nd
u (
coa
rse
)Ja
n-1
30
.41
0
%3
%6
%
Pa
kis
tan
: K
ara
chi (
irri
) A
pr-
13
0.5
2
0%
6%
24
%
Ph
ilip
pin
es:
Ntl
. A
vg.
(we
ll-m
ille
d)
Ap
r-1
30
.86
0
%0
%2
%
Sri L
an
ka
: C
olo
mb
o (
wh
ite
)A
pr-
13
0.4
6
-5%
11
%0
%
Th
aila
nd
: B
an
gk
ok
(5
% b
rok
en
)*M
ar-
13
0.5
2
-5%
1%
16
%
Vie
t N
am
: D
on
g T
ha
p (
25
% b
rok
en
)A
pr-
13
0.3
4
-4%
-5%
-17
%
WES
TER
N A
FRIC
A
Be
nin
: C
oto
no
u (
imp
ort
ed
)M
ar-
13
1.0
5
0%
0%
10
%
Bu
rkin
a F
aso
: O
ua
ga
do
ug
ou
(im
po
rte
d)*
Ap
r-1
30
.75
0
%4
%-1
%
Ca
pe
Ve
rde
: Sa
nti
ag
o (
imp
ort
ed
)D
ec-
12
1.2
3
2%
11
%1
0%
Ch
ad
: N
'Dja
me
na
(im
po
rte
d)
Ma
r-1
30
.99
0
%-5
%6
%
Ma
li: B
am
ak
o*
A
pr-
13
0.6
3
-3%
-20
%0
%
Ma
uri
tan
ia:
No
ua
kch
ott
(im
po
rte
d)
Fe
b-1
30
.80
-1
%2
0%
-16
%
Nig
er:
Nia
me
y (i
mp
ort
ed
)*A
pr-
13
0.8
5
2%
8%
-9%
Se
ne
ga
l: D
ak
ar
(im
po
rte
d)
Ma
r-1
30
.93
5
%-6
%1
9%
CEN
TRA
L A
FRIC
A
Ca
me
roo
n:
Ya
un
dé
D
ec-
12
0.9
4
4%
4%
8%
De
m.
Re
p.
Co
ng
o:
Kin
sha
sa (
imp
ort
ed
)A
pr-
13
1.6
4
33
%5
2%
43
%
EAST
ERN
AFR
ICA
Bu
run
di: B
uju
mb
ura
M
ar-
13
1.1
6
-3%
-16
%3
4%
Djib
ou
ti:
Djib
ou
ti (
Be
lem
)*D
ec-
12
0.5
9
-4%
-16
%-1
6%
Rw
an
da
: K
iga
li*
Ap
r-1
31
.03
-1
9%
-14
%3
2%
Som
alia
: M
og
ad
ish
u (
imp
ort
ed
) M
ar-
13
0.6
5
-14
%-3
7%
-48
%
Ug
an
da
: K
am
pa
la*
A
pr-
13
1.1
6
-4%
-21
%2
4%
Un
ite
d R
ep
. o
f T
an
zan
ia:
Da
r e
s Sa
laa
m*
A
pr-
13
0.9
3
-30
%-3
7%
13
%
La
test
qu
ota
tio
n a
vaila
ble
co
mp
are
d t
o:
/1
mo
nth
ly p
rice
tre
nd
His
tori
cal
La
test
ava
ilab
le:
20
13
-1
00
0
5%
5%
-10
00
10
0
9%
10
0
0
9%
10
00
-10
0
0
-8%10
0
8%
01
00
-10
0
20
08
2
01
2
hly
pr
20
10
2
00
7
e t
ren
d2
01
1
mo
nthh
22
00
9
20
13
-1
00
0
0%
0%
-10
00
10
0
0%
10
0
0
0%
10
00
-10
0
0
10
%10
0
10
%
01
00
-10
0
20
08
2
01
2
20
10
2
00
7
20
11
2
20
09
20
13
-1
00
0
4%
4%
-10
00
10
0
4%
10
0
0
4%
10
00
-10
0
0
8%1
00
8%
01
00
-10
0
20
08
2
01
2
20
10
2
00
7
20
11
2
20
09
20
13
-1
00
0
-3%
3%
-10
00
10
0
-16
%
10
0
0
16
%
10
00
-10
0
0
34
%10
0
34
%
01
00
-10
0
20
08
2
01
2
20
10
2
00
7
20
11
2
20
09
Tabl
e 2.
Mon
thly
reta
il pr
ices
of r
ice
in s
elec
ted
mar
kets

Foo
d O
utl
oo
k -
Jun
e 2
01
3FFoo
od
Ou
tlo
ok
- Ju
ne
2200
113
282
SOU
THER
N A
FRIC
AM
on
thU
SD/K
g3
mo
nth
s e
arl
ier
1 y
ea
r e
arl
ier
2 y
ea
rs e
arl
ier
Ma
da
ga
sca
r: N
tl.
Avg
. (l
oca
l)A
pr-
13
0.5
9
2%
6%
9%
Ma
law
i: Li
lon
gw
e
Ma
r-1
31
.00
4
%2
7%
-
Mo
zam
biq
ue
: M
ap
uto
A
pr-
13
0.8
2
0%
9%
-10
%
CEN
TRA
L A
MER
ICA
AN
D T
HE
CARI
BB
EAN
Co
sta
Ric
a:
Ntl
. A
vg.
(fir
st q
ua
lity)
M
ar-
13
1.5
5
-1
%-7
%
Do
min
ica
n R
ep
: Sa
nto
Do
min
go
(fi
rst
qu
alit
y)
Ap
r-1
31
.11
0
%-6
%-2
%
El S
alv
ad
or:
Sa
n S
alv
ad
or
Ma
r-1
31
.00
-7
%-7
%-7
%
Gu
ate
ma
la:
Ntl
. A
vg.
(se
con
d q
ua
lity)
M
ar-
13
1.1
7
0%
2%
6%
Ha
iti:
Po
rt-a
u-P
rin
ce (
imp
ort
ed
)A
pr-
13
1.0
8
0%
6%
14
%
Ho
nd
ura
s: T
eg
uci
ga
lpa
(se
con
d q
ua
lity)
*A
pr-
13
0.8
8
1%
12
%6
%
Me
xico
: M
exi
co C
ity
(sin
alo
a)*
Ap
r-1
30
.88
-3
%6
%-2
%
Nic
ara
gu
a:
Ntl
. A
vg.
(se
con
d q
ua
lity)
Ap
r-1
30
.91
0
%4
%1
0%
Pa
na
ma
: P
an
am
a C
ity
(fir
st q
ua
lity)
M
ar-
13
1.2
0
-8
%1
0%
SOU
TH A
MER
ICA
Bo
livia
: La
Pa
z (g
ran
o d
e o
ro)*
Ap
r-1
30
.97
1
8%
12
%3
%
Bra
zil:
São
Pa
ulo
A
pr-
13
1.2
1
-5%
29
%3
1%
Co
lom
bia
: B
og
otá
(fi
rst
qu
alit
y)*
Ap
r-1
31
.21
-9
%-
5%
Ecu
ad
or:
Qu
ito
(lo
ng
gra
in)*
Ap
r-1
31
.05
1
%8
%2
4%
Pe
ru:
Lim
a (
corr
ien
te)
Ap
r-1
30
.95
0
%-1
%1
%
NO
RTH
AM
ERIC
A
Un
ite
d S
tate
s: C
ity
Avg
. (l
on
g g
rain
, u
nco
ok
ed
)
Ap
r-1
31
.60
1
%4
%-1
%
EURO
PE
Ita
ly:
Mila
n (
arb
ori
o v
ola
no
)*A
pr-
13
0.9
7
-6%
-20
%-4
8%
Ru
ssia
n F
ed
era
tio
n:
Ntl
. A
vg.
A
pr-
13
1.2
2
-2%
-11
%-1
8%
Late
st q
uo
tati
on
ava
ilab
le c
om
pa
red
to
: /1
His
tori
cal
/1 Q
uota
tions
in th
e m
onth
spe
cifie
d in
the
four
th c
olum
n w
ere
com
pare
d to
thei
r le
vels
in th
e pr
eced
ing
thre
e, tw
elve
and
twen
ty-fo
ur m
onth
s. P
rice
com
pari
sons
wer
e m
ade
in n
omin
al lo
cal c
urre
ncy
units
.*
Who
lesa
le p
rice
s.
Sour
ces:
FAO
/GIE
WS
Food
Pri
ce D
ata
and
Anal
ysis
Too
l; U
.S. B
urea
u of
Lab
or S
tatis
tics
(BLS
); A
ssoc
iazi
one
Indu
stri
e Ri
sier
e Ita
liane
(AIR
I).
Late
st a
vaila
ble
:
mo
nth
ly p
rice
tre
nd
20
13
-1
00
0
2%
2%
-10
00
10
0
6%
10
0
0
6%
10
00
-10
0
0
9%1
00
9%
01
00
-10
0
20
08
2
01
2
hly
pr
20
10
2
00
7
e t
ren
d2
01
1
mo
nthh
22
00
9
20
13
-1
00
0
-
-10
00
10
0
1%
10
0
0
1%
10
00
-10
0
0
-7%10
0
7%
01
00
-10
0
20
08
2
01
2
20
10
2
00
7
20
11
2
20
09
20
13
-1
00
0
18
%1
8%
-10
00
10
0
12
%
10
0
0
12
%
10
00
-10
0
0
3%1
00
3%
01
00
-10
0
20
08
2
01
2
20
10
2
00
7
20
11
2
20
09
20
13
-1
00
0
1%
1%
-10
00
10
0
4%
10
0
0
4%
10
00
-10
0
0
-1%10
0
1%
01
00
-10
0
20
08
2
01
2
20
10
2
00
7
20
11
2
20
09
20
13
-1
00
0
-6%
6%
-10
00
10
0
-20
%
10
0
0
20
%
10
00
-10
0
0
-48
%
10
0
48
%
01
00
-10
0
20
08
2
01
2
20
10
2
00
7
20
11
2
20
09
Tabl
e 2.
Mon
thly
reta
il pr
ices
of r
ice
in s
elec
ted
mar
kets
(Con
t’d)

Ma
rke
t asse
ssme
nts
MMaa
rke
t asse
ssme
nts
299
OILSEEDS, OILS AND MEALS1
1 Almost the entire volume of oilcrops harvested worldwide is crushed to obtain oils and fats for human nutrition or industrial purposes, and to obtain cakes and meals which are used as feed ingredients. Therefore, rather than referring to oilseeds, the analysis of the market situation is mainly undertaken in terms of oils/fats and cakes/meals. Production data for oils (cakes) derived from oilseeds refer to the oil (cake) equivalents of national production of the relevant oilseeds, i.e. they do not reflect the outcome of actual oilseed crush in individual countries. Furthermore, the data on trade in and stocks of oils (cakes) refer to the sum of trade in and stocks of oils and cakes plus the oil (cake) equivalent of oilseed trade and stocks.
Major oilseeds exporters and importers
Major ExportersMajor Importers
PRICES2
As the 2011/12 season (October/September) drew to a
close, international prices for both, oilseeds and meals/
cakes started to ease, ending a spell of steady price rises.
However, during the first seven months of the current
2012/13 season, oilseed quotations were, on average,
above the level recorded during the corresponding period
of the last three seasons, while those of meals remained
close to all-time highs. In the meantime, oils/fats values
continued to lose strength, following the downward path
that commenced in 2011.
Oilseed prices eased, as forecasts of a full rebound and
possibly a record performance in total oilseed production
in 2012/13 allayed market concerns regarding global
supply tightness. In particular, the prospect of record
South American soy crops brought relief to the market,
making up for the poor US soybean harvest. Additional
factors contributing to the easing of soybean prices include
relatively weak demand growth in China and the EU,
2 For details on prices and corresponding indices, see appendix table 24.
Figure 1. FAO monthly international price indices for oilseeds, oils/fats and meals/cakes (2002-2004=100)
the softening of international grains prices and forecasts
of a possible bumper 2013/14 soy crop in the United
States. However, a number of factors prevented oilseed
prices from falling more markedly, notably unexpected
weather problems in parts of South America, the market’s
protracted, strong reliance on thinning old crop supplies
from the United States and, more recently, the emergence
of logistical bottlenecks in Brazil and sluggish sales of
soybeans by Argentine farmers.
The world market for protein meals/cakes, which is
dominated by soybean meal, largely followed the dynamics
50
100
150
200
250
300
20132012201120102009200820072006
Meals/cakes
Oils/fats
Oilseeds
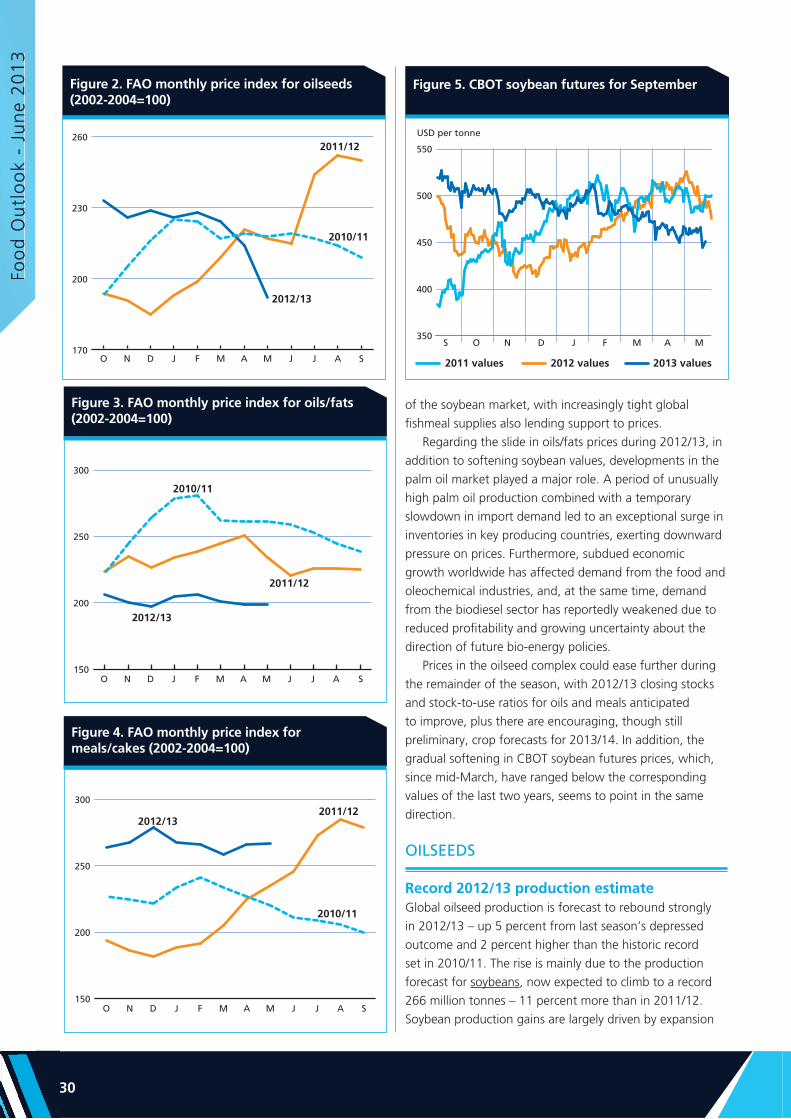
Foo
d O
utl
oo
k -
Jun
e 2
01
3FFoo
od
Ou
tlo
ok
- Ju
ne
2200
113
303
Figure 5. CBOT soybean futures for SeptemberFigure 2. FAO monthly price index for oilseeds (2002-2004=100)
Figure 3. FAO monthly price index for oils/fats (2002-2004=100)
Figure 4. FAO monthly price index for meals/cakes (2002-2004=100)
of the soybean market, with increasingly tight global
fishmeal supplies also lending support to prices.
Regarding the slide in oils/fats prices during 2012/13, in
addition to softening soybean values, developments in the
palm oil market played a major role. A period of unusually
high palm oil production combined with a temporary
slowdown in import demand led to an exceptional surge in
inventories in key producing countries, exerting downward
pressure on prices. Furthermore, subdued economic
growth worldwide has affected demand from the food and
oleochemical industries, and, at the same time, demand
from the biodiesel sector has reportedly weakened due to
reduced profitability and growing uncertainty about the
direction of future bio-energy policies.
Prices in the oilseed complex could ease further during
the remainder of the season, with 2012/13 closing stocks
and stock-to-use ratios for oils and meals anticipated
to improve, plus there are encouraging, though still
preliminary, crop forecasts for 2013/14. In addition, the
gradual softening in CBOT soybean futures prices, which,
since mid-March, have ranged below the corresponding
values of the last two years, seems to point in the same
direction.
OILSEEDS
Record 2012/13 production estimateGlobal oilseed production is forecast to rebound strongly
in 2012/13 – up 5 percent from last season’s depressed
outcome and 2 percent higher than the historic record
set in 2010/11. The rise is mainly due to the production
forecast for soybeans, now expected to climb to a record
266 million tonnes – 11 percent more than in 2011/12.
Soybean production gains are largely driven by expansion
170
200
230
2602011/12
2012/13
2010/11
SAJJMAMFJDNO
150
200
250
300
2012/13
2011/12
2010/11
SAJJMAMFJDNO
150
200
250
3002011/12
2012/13
2010/11
SAJJMAMFJDNO
350
400
450
500
550
USD per tonne
S O N D J F M A M
2011 values 2012 values 2013 values

Ma
rke
t asse
ssme
nts
MMaa
rke
t asse
ssme
nts
311
in area cultivated, given that, in several growing regions,
unfavourable weather conditions have affected yields. As
the season progressed, forecasts had to be successively
lowered due to extreme weather conditions, first in the
United States and then in some key production areas of
South America, in particular in Argentina. In the United
States, the crop suffered from an exceptional drought,
driving down production for the second consecutive year.
In Argentina, production prospects deteriorated as a result
of excessive rainfall towards the beginning of the growing
season. Despite spells of dry weather, Brazil and Paraguay
reported record harvests thanks to further expansion in
plantings and near-record yield levels. With the decline
in US production, Brazil’s output should – for the first
time – almost match that of the United States. Meanwhile,
in Asia, China has reported a further production drop,
due to additional cuts in area planted, whereas India has
harvested a bumper crop, thanks to a yield increase that
followed average rainfalls.
Record outputs are also expected for rapeseed,
groundnut and palmkernel. For rapeseed, production
declines – caused by bad weather in Canada and planting
reduction in Europe – should be more than offset by
production gains in India, China and the United States.
Higher global palmkernel production is largely based on
further expansion of mature oil palm area in Indonesia,
whereas the projected rise in groundnut mainly comes
from record yields in the United States and from higher
plantings combined with productivity increases in China.
By contrast, a noticeable production drop is forecast
for cottonseed and sunflowerseed. The projected decrease
in cottonseed output is mostly driven by lower plantings
2010/11 2011/12estim.
2012/13 f’cast
Change 2012/13
over 2011/12
%
million tonnes
Soybeans 265.4 239.8 266.0 10.9
Rapeseed 60.8 61.4 62.6 1.9
Cottonseed 44.1 46.5 44.4 -4.3
Groundnuts (unshelled)
37.3 37.3 38.7 3.8
Sunflower seed 33.0 39.0 35.6 -8.9
Palm kernels 12.6 13.3 13.8 4.1
Copra 4.9 5.4 5.3 -1.0
Total 458.1 442.7 466.4 5.4
Note: The split years bring together northern hemisphere annual crops harvested in the latter part of the first year shown, with southern hemisphere annual crops harvested in the early part of the second year shown. For tree crops, which are produced throughout the year, calendar year production for the second year shown is used.
Table 1. World production of major oilseeds
Table 2. World oilseed and product market ata glance
1 Includes oils and fats of vegetable, animal and marin origin.2 Production plus opening stocks.3 Residual of the balance.4 Trade data refer to exports based on a common October/September
marketing season and relate to the sum of trade in oils (meals) plus the oil (meal) equivalent of oilcrops traded.
5 Major exporters include Argentina, Brazil, Canada, Indonesia, Malaysia and the United States.
6 All meal figures are expressed in protein equivalent; meals include all meals and cakes derived from oilcrops as well as meals of marine and animal origin.
7 Major exporters include Argentina, Brazil, Canada, India, Indonesia, Malaysia, Paraguay and the United States.
2010/11 2011/12 estim.
2012/13 f’cast
Change: 2012/13
over 2011/12
million tonnes %
TOTAL OILSEEDS
Production 468.9 453.6 477.5 5.3
OILS AND FATS1
Production 180.4 183.3 188.7 2.9
Supply2 208.0 214.5 220.3 2.7
Utilization3 176.0 184.7 188.4 2.0
Trade4 92.5 97.9 101.0 3.1
Stock-to-utilization ratio (%)
17.7 17.1 17.4
Major exporters stock-to-disappearance ratio 5 (%)
11.2 10.1 10.0
MEALS AND CAKES6
Production 118.6 110.3 118.0 7.0
Supply2 137.5 131.6 134.8 2.5
Utilization3 114.1 117.1 115.9 -1.1
Trade4 69.6 72.6 72.9 0.4
Stock-to-utilization ratio (%)
18.7 14.4 15.5
Major exporters stock-to-disappearance ratio 7 (%)
9.3 5.6 7.5
FAO PRICE INDICES (Oct/Sept) (2002-2004=100)
2010/11 2011/12 2012/13 Oct-May
Change: Oct-May 2012/13
overOct-May 2011/12
%
Oilseeds 215 214 221 10.1
Meals/cakes 221 224 267 33.0
Oils/fats 256 232 202 -14.6
and yields in Brazil, India, Pakistan and Australia,
which are only partially offset by good harvests in China
and the United States. With regard to sunflowerseed,
less favourable weather in the Russian Federation and
the Ukraine prevented a repeat of last season’s bumper
crop.

Foo
d O
utl
oo
k -
Jun
e 2
01
3FFoo
od
Ou
tlo
ok
- Ju
ne
2200
113
323
Figure 6. Global production and utilizationof oils/fats
OILS AND FATS3
Growth in global oils/fats supplies to remain below trendCurrent crop forecasts for 2012/13 translate into a year-
on-year increase of 3 percent in global oils/fats production.
Although above last season’s rate, the expected expansion
remains well below trend growth. The fact that much of
this year’s oilseed production rise comes from soybeans,
which is a low oil-yielding crop, together with the prospect
of only a moderate increase in palm oil production, explains
the relatively modest growth in global output. Palm oil
gains continue to be concentrated in Indonesia, thanks to
expansion in mature oil palm area. However, compared with
the past two years and given the absence of significant yield
improvements, Indonesian production growth is poised to
slow. In Malaysia, where unfavourable weather curtailed
output last year, production should rebound thanks to a
recovery in yields and small rises in mature area.
Global oils/fats supplies, which comprise 2012/13
production and 2011/12 ending stocks, are forecast to
increase by less than 3 percent. Commodity-wise, robust
growth in soy and palm oil supplies is to be partially offset
by a contraction in global rape, sunflower and olive oil.
Much of the projected rise in soyoil availabilities (referring
to oil obtained from domestic crops) is expected to occur
in Brazil, Argentina and China. Palm oil supply growth
remains concentrated in Indonesia and Malaysia, the
reduction in global rape oil availabilities originates in
Canada, and the fall in sunflower and olive oil supplies
concerns primarily the CIS region and the EU.
Oils/fats consumption growth to slow down in 2012/13Estimated at 188 million tonnes, global consumption of
oils/fats is predicted to expand by only 2 percent, compared
with an average growth rate of over 4 percent for the
last four years. The slowdown mainly reflects subdued
global economic growth as well as weak demand from the
biodiesel sector. The growth leader is palm oil, given its
competitive price relative to soy and other oils. With palm
oil demand expanding by a steady 5–6 percent per year,
its share of total oils/fats consumption is set to approach
30 percent in 2012/13. By contrast, consumption growth
should slow down in the case of soy and sunflower oil,
while an absolute fall is forecast for rapeseed oil.
Consumption growth occurs almost exclusively in
developing countries, in particular in Asia, where continued
3 This section refers to oils from all origins, which – in addition to products derived from the oil crops discussed under the section on oilseeds – include palm oil, marine oils as well as animal fats.
economic growth keeps stimulating demand for food
and oleochemical products. The expansion of oils and fats
consumption is expected to concentrate in China, India
and Indonesia, partly reflecting national policy measures
in support of domestic crushing and refining industries.
In South America and Africa, consumption growth could
slow down relative to previous years. Meanwhile, among
developed nations, oils/fats consumption is bound to
stagnate due to poor economic growth.
Demand from the biodiesel industry will continue
contributing to global consumption growth, though
considerably less than before. Unlike past years, industrial
demand is expected to grow primarily among developing
nations, where biodiesel production capacities have
expanded and national policies continue to encourage
biofuel production for either domestic use or export.
Countries where biodiesel production should keep
expanding include Argentina, Brazil, Colombia,
Indonesia, Malaysia, Thailand and the Philippines,
with Paraguay, Honduras, the Islamic Republic of Iran and the Republic of Cuba standing ready to join
the list of biodiesel producing countries. By contrast,
among developed countries – which include the world’s
leading biodiesel producers and consumers – oils/fats
demand for biofuel production is forecast to grow only
modestly. Several developed economies, notably within
the EU, are considering to cap mandatory blending
requirements and to limit subsidies granted to crop-based
or “first generation” biofuels, due to concerns over the
environmental footprint of such fuels. The exception is the
United States, where domestic consumption targets for
the current year have been raised and the tax break granted
-6
-3
0
3
6
150
160
170
180
190
2012/132011/122010/112009/102008/09
Million tonnes Million tonnes
estim. f’cast
Balance (production minus utilization, right axis)
Production (left axis) Utilization (left axis)

Ma
rke
t asse
ssme
nts
MMaa
rke
t asse
ssme
nts
333
Figure 7. World stocks and ratios of oils/fats (including the oil contained in seeds stored)
to blenders extended. The practice of producing biodiesel
from imported feedstock or directly importing biodiesel is
expected to continue in several developed countries.
2012/13 end-of-season stocks anticipated to rise Based on the above supply and demand forecasts, 2012/13
global closing stocks (which comprise oil/fat inventories
plus the oil contained in stored oilseeds) are anticipated
to rise to about 33 million tonnes, up almost 4 percent
from last season. The increase concerns primarily palm
oil and, to a lesser extent, soy and rapeseed oil, while a
sizeable reduction in inventories is anticipated for sunflower
and olive oil. With regard to individual countries, China
remains by far the largest stockholder. By the end of the
season, China’s private and public stocks, comprising the oil
contained in stored oilseeds, are expected to top 11 million
tonnes. As for other major importers, India’s inventories
should grow, whereas EU stocks are expected to drop
below the level of past years. Among exporters, Malaysia is set for a reduction in its record palm oil inventories,
while Indonesia is likely to expand its reserves. Among the
world’s leading soy exporters, the United States should
draw down inventories for the third consecutive year,
dragging them to the lowest level in nine years. National
stocks continue to be released to meet growing export
demand. The same situation applies to Canada regarding
rapeseed. By contrast, a replenishment of stocks should be
possible in Argentina and especially Brazil. Considering the relatively modest growth in world
oils/fats consumption currently anticipated, the global
stock-to-use ratio should improve slightly compared with
last season. This, in part, explains the recent easing of
international oils/fats prices.
Trade in oils/fats to expand further during 2012/13
After growing by 5 percent on average during the last
five years, global trade in oils/fats is forecast to expand in
2012/13 by 3 percent to 101 million tonnes (including the
oil contained in traded oilseeds). The slowdown mirrors
this season’s sluggish consumption growth. Shipments of
the two most traded oils, palm and soy, are estimated to
rise by, respectively, 8 and 5 percent, while global trade in
rape and sunflower oil should drop markedly – a pattern
that reflects the prevailing price structure. Concerning
exports, Indonesia and Malaysia are responsible for the
expansion in palm oil shipments. Incremental soyoil sales
should originate mainly in Argentina, where reduced
domestic demand from the biodiesel industry (caused by
lower EU biofuel imports) should raise export availabilities.
The prospective drop in world sales of rapeseed oil mainly
reflects Canada’s poor crop outturn, while the decline of
sunflower oil trade is related to poor harvests in various
parts of Europe, which have curbed export availability in the
region.
As for global oils/fats imports, the three leading buyers,
China, India and the EU, are forecast to expand their
purchases. In China, the increase in domestic supplies
is not sufficient to meet growing consumer demand,
which is expected to boost the country’s imports to a
record 23 million tonnes (including the oil equivalent
contained in oilseed purchases). China could also take
advantage of easing import prices to replenish domestic
stocks. In India, the stagnation in domestic supplies is
forecast to push imports above 11 million tonnes. In both
countries, reliance on foreign purchases to satisfy domestic
Figure 8. Oil/fat exports by major exporters (including the oil contained in seed exports)
0
10
20
30
40
2012/132011/122010/112009/102008/096
9
12
15
18
Million tonnes Percent
Major Exporters Rest of the World
World Stock-to-use ratioStock-to-disappearance ratio of Major Exporters
estim. f’cast
0
5
10
15
20
252011/12 estimate
2012/13 forecast
Million tonnes
UnitedStates
IndonesiaCanada MalaysiaArgentina Brazil

Foo
d O
utl
oo
k -
Jun
e 2
01
3FFoo
od
Ou
tlo
ok
- Ju
ne
2200
113
343
Figure 10. Global production and utilization of meals/cakes (in protein equivalent)
demand is bound to rise further. Regarding other Asian
importers, a slowdown in domestic consumption growth
is anticipated to curb aggregate purchases. The EU’s
imports are expected to grow, even within the context of a
stagnating domestic consumption, as they will be needed
to compensate for the supply drawdown caused by poor
rapeseed harvests. In Africa, where numerous countries are
import-dependent, only a marginal increase in imports is
expected, mirroring subdued consumption growth.
MEALS AND CAKES4
Global meal supplies to recover only partially in 2012/13 Current crop estimates translate into a conspicuous year-
on-year rise in overall meals/cakes production. Estimated
at 118 million tonnes (expressed in protein equivalents),
global production should recover almost entirely from
last year’s decline, almost matching the 2010/11 record.
Soymeal will be the main source of growth, although
production of rapeseed, groundnut and palmkernel meal
would also improve. By contrast, production of sunflower
and cottonseed meal is likely to fall, following poor crop
outturns. The rise in total output concerns primarily
soymeal producing countries in South America, notably
Brazil, whereas sizeable year-on-year drops are expected
for some other major players, in particular the United States and the EU.
4 This section refers to meals from all origins. In addition to products derived from the oil crops discussed under the section on oilseeds, this also includes fish meal and meals of animal origin.
Global supplies of meals/cakes, which comprise 2012/13
production plus 2011/12 ending stocks, are forecast to
grow by less than 3 percent. Due to last season’s sharp
drawdown in stocks, 2012/13 availabilities will only recover
partially from last season’s significant drop. In the United States, the world’s leading meal producer, domestic
availability is set to shrink for the second consecutive
season, pushing supplies to a multi-year low. While sizeable
supply drops are also expected in the EU and Canada,
global availability of meals/cakes will still increase, thanks
to massive improvements in Brazil, Argentina and
Paraguay.
Global meal consumption to contract slightly in 2012/13Persistently high meal/cake prices combined with weak
economic growth world-wide should lead to an unusual
contraction in global meal consumption, involving primarily
soybean meal. Estimated at 116 million tonnes (expressed
in protein equivalents), global utilization in 2012/13 will
still be the second highest on record. Consumption falls
are expected primarily in developed nations, whereas
developing countries are likely to face a slowdown in
growth. In Asia, the world’s major consuming region,
demand is estimated to increase by merely 1 percent,
which compares with an average of 8 percent in the
last three years. In China, utilization is forecast to grow
by no more than 2 percent, due to reduced growth in
meat production. In India, meal demand may fall by 2–3
percent. By contrast, across South America, the steep rise in
domestic availabilities should stimulate meal consumption.
As a whole, developing countries should account for over
60 percent of global utilization compared with 53 percent
Figure 9. Total oil/fat imports by region or major country (including the oil contained in seed imports)
0
10
20
30
40
2012/132010/112008/092006/072004/05
Latin America
Asia excl. China (total) Europe
China (total)
Million tonnes
United States & Canada Africa
f’cast
-8
-4
0
4
8
85
95
105
115
125
2012/132011/122010/112009/102008/09
Million tonnes Million tonnes
estim. f’cast
Balance (production minus utilization, right axis)
Production (left axis) Utilization (left axis)

Ma
rke
t asse
ssme
nts
MMaa
rke
t asse
ssme
nts
355
Figure 11. World stocks and ratios of meals/cakes (in protein equivalent and including the meal contained in seeds stored)
only five years ago. In many developed countries, high feed
costs eroded profitability in livestock production, eventually
driving down meal demand. In the EU and the United States, meal consumption is projected to contract by,
respectively, 4 and 9 percent, dragging meal utilization to
multi-year lows.
Partial recovery in meals/cakes inventories likelyThis season’s recovery in global production combined with
the slowdown in consumption should allow a rebuilding of
global meal/cake stocks. Led by soybeans, end-of-season
stocks are forecast to rise to 18 million tonnes (expressed in
protein equivalent and comprising meal contained in stored
oilseeds), up 6 percent from their opening level. Considering
that global stocks dropped by 21 percent last year, the
recovery expected for this year would only be a partial one. It
is important to note that, among key stockholding countries,
only Argentina and Brazil are expected to rebuild stocks. In
the United States, as the country strives to satisfy demands
of both domestic users and foreign buyers, inventory levels
are set to shrink for the second consecutive season, falling
to the lowest level in nine years. As to meal importing
countries, China and the EU are expected to cut down their
reserves for the second season in a row, reflecting efforts to
compensate for stagnating or falling imports.
If realized, the anticipated reconstitution in global stocks
would lead to an improvement in the global stock-to-use
ratio. However, the ratio would still remain well below the
level prevailing in past years, which explains the relative
firmness of international meal prices during the past
months.
Global meal trade unchanged from last season After years of steady expansion, the 2012/13 global
trade in meals/cakes is anticipated to remain mostly
unchanged. Higher soymeal shipments should be offset by
lower transactions of rape, sunflower and fish meal. The
stagnation in total trade is directly related to subdued meal
consumption in the world’s key importing countries. In
China, imports (comprising the meal contained in imported
seeds) should remain virtually unchanged, much in contrast
to the steady expansion observed in previous years. The
halt mainly reflects the unusual slowdown in domestic
meal consumption. The EU is expected to cut its imports
further, despite the anticipated drop in domestic supplies.
Figure 12. Meals/cake imports by region or major country (in protein equivalent and inclduing the meal contained in seed imports)
Figure 13. Meal/cake exports by major exporters (in protein equivalent and including the meal contained in seed exports)
0
7
14
21
28
2012/132011/122010/112009/102008/090
5
10
15
20
Million tonnes Percent
Major Exporters Rest of the World
World Stock-to-use ratioStock-to-disappearance ratio of Major Exporters
estim. f’cast
0
5
10
15
20
25
2012/132010/112008/092006/072004/05
Latin America Asia excl. China (total) Europe
China (total)
Million tonnes
United States & Canada Africa
f’cast
0
5
10
15
20
252011/12 estimate
2012/13 forecast
Million tonnes
UnitedStates
Canada India ParaguayArgentina Brazil

Foo
d O
utl
oo
k -
Jun
e 2
01
3FFoo
od
Ou
tlo
ok
- Ju
ne
2200
113
363
For the developed country group, purchases could fall
below 25 million tonnes (expressed in protein equivalents),
a 3-year low, while developing country imports might reach
47 million tonnes, exceeding last year’s record by a small
margin. Clearly, the record high international meal prices
prevailing since the middle of 2012 have dampened the
global appetite for imported meals.
The bulk of the world’s export supplies continues to
come from the Americas. South America is expected to
expand its shipments by only 2 percent, which, considering
ample domestic availabilities, leaves sufficient room for the
reconstitution of national stocks. In Brazil, limitations in
domestic transport and port facilities are also behind the
country’s weak export performance. In the United States,
falling domestic supplies will force overseas sales down for
the third consecutive year.
2013/14 PRODUCTION OUTLOOK
With the 2012/13 season still on-going, it is too early to
provide supply and demand projections for 2013/14. The
only preliminary, though incomplete, information that can
be offered is based on planting intentions in the Northern
Hemisphere, where preparations for the next oilcrop
campaign are underway.
Although relatively firm world prices for oilseeds
should stimulate plantings of crops for harvest in 2013/14,
the competition for land remains strong due to the fact
that also prices of other crops, in particular maize, are
historically high. Accordingly, with regard to soybeans, in
the United States, only minimal expansion is expected
in area planted. Output is nonetheless projected to climb
to a new record, as yields are assumed to return to trend
levels. While production could also grow in India, a further
drop in output is expected in China, due to cuts in area
planted. In South America, a recovery in yields is expected
to boost Argentina’s output. In Brazil, persistently
high transportation costs are likely to continue weighing
on farmers’ returns, possibly limiting expansion in area
planted and, in turn, production gains. On the whole, a
steep rise in global soybean production seems possible,
provided normal weather conditions prevail. A similar
picture is emerging for rapeseed production. A return to
average yields should lift Canada’s harvest to near-record
levels, despite a likely reduction in planted area in favour
of wheat. In the EU, production is anticipated to rise on
account of higher plantings, provided weather conditions
continue to be favourable. Conversely, China’s production
is forecast to drop as farmers increase plantings of wheat
and other grains at the expense of rapeseed. By contrast,
global sunflowerseed output should recover only partially
from last season’s drop. Production gains would be led
by the EU and Ukraine, mostly based on a recovery in
yields. World cottonseed production is forecast to remain
unchanged from last season, with reduced crops in China
and the United States offsetting larger harvests in Brazil and India. Aggregate groundnut output is projected to fall,
mainly reflecting likely reductions in planted area and yields
in the United States.
Together, the above tentative forecasts point to
a conspicuous increase in total oilseed production in
2013/14, led by soybean production gains in the United States and Argentina. As the anticipated production may
outstrip consumption, the current supply and demand
tightness could come to an end. This would mean that
during 2013/14, the United States, Canada, the EU and
China will be in a position to reconstitute their inventories,
further improving the stock-to-use ratios and, potentially,
facilitating a general easing of international prices for
oilseeds and oilseed products.

Ma
rke
t asse
ssme
nts
MMaa
rke
t asse
ssme
nts
377
SUGAR
PRICES
International sugar prices easingWorld sugar prices, as measured by the ISA daily prices
(for raw sugar), have been on a declining trend since the
release of the November 2012 issue of Food Outlook.
Prices averaged US 19.31 cents per pound in December
2012 and fell to US 18.26 cents per pound in February
2013. They rose slightly to US 18.46 cents per pound in
March, reflecting short-term supply tightness, but then
retreated to US 17.80 cents per pound in April, when a
Figure 1. International sugar prices*
Major Sugar Exporters and Importers
Major ExportersMajor Importers
larger than expected harvest in Brazil, the world’s largest
sugar producer, was announced. Overall, from January to
April 2013, sugar quotations were 22 percent lower than
in the corresponding period in 2012, confirming the steady
decline initiated in January 2011. The downward trend
is attributed to an expansion of production in response
to an historically low global stock-to-use ratio, which
underpinned the market between 2008/09 and 2010/11.
Prices in the second half of 2013 are likely to remain
under downward pressure, given prospects of a second
consecutive world production surplus which would bring
12
17
22
27
32
2012
2013 2010
2011
US cents per lb.
DNOSAJJMAMFJ
* As measured by the International Sugar Agreement (ISA)
Figure 2. World closing stocks and stock-to-use ratio
0
30
60
90
2012/132011/122010/112009/102008/092007/0820
30
40
50
Million tonnes Percent
Closing Stocks Stock-to-use ratio
Stock-to-disappearance ratio
f’castestim.

Foo
d O
utl
oo
k -
Jun
e 2
01
3FFoo
od
Ou
tlo
ok
- Ju
ne
2200
113
383
the global stock-to-use ratio to a comfortable level of 40
percent.
PRODUCTION1
World sugar production to reach a new record level in 2012/13With most of the 2012/13 sugarcane and sugar beet crops
already harvested in the main producing areas, FAO’s
current estimate for world sugar production in 2012/13, at
180 million tonnes, is becoming firmer. The figure points
to a new record production which surpasses the November
2012 preliminary forecast by 2.7 million tonnes. Much
of this upward revision is due to production in Brazil, China, Mexico and the United States, which is more
than compensating for the reduced forecasts in, mainly,
EU, India and Thailand. World production is predicted to
increase 2.8 percent over the previous season, with most of
the gain stemming from developing countries, in particular
Brazil, Mexico and China, which are predicted to harvest
137 million tonnes overall, 4.3 percent more than in
2011/12. By contrast, output in the developed countries
is anticipated to contract by 1.8 percent to 42.5 million
tonnes, mostly on account of the EU. Under the current
forecast, world production in 2012/13 will be more than
sufficient to allow for an increase in total consumption and
a rebuilding of world inventories. The surplus is currently
predicted to reach 6.5 million tonnes, although it is likely to
be subject to revisions as the new season progresses in the
southern hemisphere.
The expected expansion in world sugar production
in 2012/13 season is attributed to an overall increase in
area planted to sugarcane in response to the relatively
high sugar returns witnessed over the past three seasons.
In addition, attractive prices encouraged the use of
fertilizers and other inputs, which boosted sugar crop
yields. In South America, production is anticipated to
increase by 5.9 percent, amid generally favourable weather
conditions and larger plantings. The expansion in the
region would be mainly on account of Brazil, where the
sector is set to rebound by 6.8 percent to 38.6 million
tonnes. Sugar production also responds to changes in the
ethanol/sugar price ratio, which eventually determines
how much of the two products will be produced out
of sugarcane. The higher the price ratio, the larger the
amount of cane converted into ethanol at the expense of
sugar. The Government of Brazil recently introduced two
measures that have the potential to divert a greater share
of sugarcane output into ethanol. First, it increased the
mandatory amount of ethanol to be blended into gasoline
back to 25 percent beginning in May 2013. The blending
rate had been cut to 20 percent in October 2011, following
a poor 2011/12 sugarcane harvest. Second, after keeping
gasoline prices unchanged since 2006 to check inflation,
it raised them by 7 percent, a move that improves the
competiveness of ethanol against gasoline at the pump.
Sugar production is also expected to increase in Colombia,
the second largest producer in the region, but it will
remain about unchanged in Argentina, where less than
favourable weather, mostly in the main producing region of
Tucuman, prevented expansion in sugarcane production.
Figure 3. Sugar production by major producing countries
Figure 4. World sugar surplus/deficit
0
15
30
45
2011/12 estimate
2012/13 forecast
Million tonnes
USAMexicoIndia BrazilChina Thailand EU
-15
0
15
30
201220102008200620042002-15
0
15
30
Million tonnes US cents per lb.
Surplus/Deficit ISA price
f’cast
1 Sugar production figures refer to centrifugal sugar derived from sugar cane or beet, expressed in raw equivalents. Data relate to the October/September season.

Ma
rke
t asse
ssme
nts
MMaa
rke
t asse
ssme
nts
399
Table 1. World sugar market at a glance
Table 2. World sugar production
2011/12 2012/13
million tonnes
Asia 67.6 68.7
Africa 10.4 10.8
Central America 12.6 14.1
South America 44.0 46.6
North America 7.8 8.5
Europe 28.7 26.6
Oceania 4.2 4.7
World 175.2 180.0
Developing countries 131.9 137.5
Developed countries 43.3 42.5
In Central America, revised forecasts for 2012/13
indicate that sugar production in Mexico will increase,
prompted by favourable rains and the introduction of
high-yielding plant varieties. In Guatemala, higher
than expected sugarcane yields boosted sugar output in
2011/12, no further increase is anticipated for the new
season. In Cuba, sugar production is expected to continue
its moderate recovery, driven by investment in increasing
sugar productive capacities at farm and factory levels. A
series of policy measures, including higher official support
to cane prices, also helped incentivise farmers. In Africa,
2012/13 sugar production is projected to rise on the back
of largely favourable weather conditions. South Africa,
Swaziland and Sudan are set to harvest larger crops,
while output is expected to remain at last year’s level in
Egypt. In Swaziland, area planted under sugarcane has
increased 20 percent since 2000, driven by investment
in irrigation and price incentives provided under the EU
Economic Partnership Agreement (EPA) introduced in 2009.
Sugarcane production is expected to benefit from improved
climatic conditions in South Africa, the largest producer in
the region, after the country was hit by the worst drought
in 20 years in 2010/11 and 2011/12, affecting yields and
reducing harvested areas.
In Asia, sugar output is expected to increase by 1.7
percent compared to the 2011/12 marketing season,
sustained by expansions in China and Pakistan.
At the same time, production is set to fall in India and
Thailand. In India, relatively attractive returns in 2010
and 2011 encouraged farmers to increase their sugarcane
plantings and use of fertilizers. However, below average
monsoon rains during the cane’s critical growing stage
hindered yields. As a result, sugar production in the
country is anticipated to decline by 5 percent to 26.6
million tonnes. In April 2013, the government approved a
partial deregulation of the sugar industry, abolishing the
required 10 percent levy on sugar mills and deregulating
sales in the open market. These measures are likely to
moderate the amplitude of the production cycles which
characterize the sugar subsector in India. Latest estimates
indicate that 2012/13 sugar output in Thailand, the
world’s second largest sugar exporter, could fall below
the all-time high recorded in the previous season, as less
than favourable weather conditions led to weaker sugar
extraction rates. Still, sugar output is to remain around the
relatively high levels of the past two seasons, sustained
by recent expansions in harvested areas and investments
at factory level. Sugar production in China is expected
to surge in 2012/13, notably in Guangxi, China’s largest
sugar producing province, and Yunnan, its second largest.
Financial assistance, as well as the subsidized inputs that
sugar mills provided to farmers, were major contributing
factors in boosting plantings. In Pakistan, sugar output
is expected to reach a record in 2012/13, following
favourable monsoon rains, which lifted yields and harvested
areas. Outputs in 2012/13 are also likely to increase in
Indonesia and Vietnam, but may remain stagnant in
Turkey and Japan.
In Europe, the latest estimates for the EU point to a
decrease in sugar production, largely due to unfavourable
weather conditions hampering beet yields, notably in
France and Germany. Nonetheless, the EU’s ending stocks
are foreseen to return to historic levels, as about 900 000
tonnes of sugar are expected to be carried over from the
2011/12 season into 2012/13. The final decision regarding
the elimination of sugar production quotas and minimum
sugar beet prices, which would likely foster an expansion
2010/11 2011/12 estim.
2012/13 f’cast
Change: 2012/13
over 2011/12
million tonnes %
WORLD BALANCE
Production 165.6 175.2 180.0 2.75
Trade 54.8 52.5 51.1 -2.62
Total utilization 159.8 169.8 173.5 2.18
Ending stocks 62.9 65.6 69.4 5.80
SUPPLY AND DEMAND INDICATORS
Per caput food consumption:
World (kg/yr) 23.13 24.30 24.55 1.03
LIFDC (kg/yr) 15.19 16.64 16.87 1.35
World stock-to-use ratio (%) 39.36 38.62 39.99
ISA DAILY PRICE AVERAGE (US cents/lb)
2011 2012 2013 Jan-May
Change: Jan-May 2013
over Jan-May 2012
%
26.0 21.5 18.35 -22.41

Foo
d O
utl
oo
k -
Jun
e 2
01
3FFoo
od
Ou
tlo
ok
- Ju
ne
2200
113
404
Figure 5. Sugar imports by major importing countries
Figure 6. Sugar exports by major exporting countries
in sugar production, is expected sometime in June 2013.
The EU Commission, Parliament and Council are all
proposing different years for their abolition. Production
in 2011/12 is expected to fall in the Russian Federation,
as a result of delays in planting due to cold weather. The
decline would also reflect the decision by farmers not to
expand area, given the scarcity of storage facilities – an
issue they dealt with last year when they harvested a
record-level crop. Sugar production is expected to remain
relatively unchanged from last season in Ukraine, despite
further contraction of beet plantings. Beet prices are less
competitive than alternative crops such as maize, sunflower
and wheat. In Australia, sugar production is set to rise by
12.5 percent, spurred by favourable growing conditions as
well as favourable sugarcane prices, which stimulated sharp
increases in sugarcane area. Gains in average sugarcane
yields to about 85 tonnes per hectare also helped boost
production, as compared to 2011/2012. In the rest of
the world, production in the United States is forecast to
surpass its 2011/12 level and reach a record high, sustained
by increases in both beet and cane sugar outputs, amid
conducive weather conditions.
UTILIZATION
World sugar consumption sustained by lower prices Global sugar consumption is anticipated to reach 173.5
million tonnes in 2012/13, 3.7 million tonnes, or 2.2
percent more than in 2011/12, perfectly in line with
the 10-year trend. Large supply availabilities and lower
international and domestic prices are expected to support
increases in per capita sugar intake in 2012/13. Falling
domestic sugar prices were witnessed in all the major
markets, including Brazil, China and India. Under
current prospects, world per capita sugar consumption
is anticipated to rise slightly, from 24.3 kg in 2011/12 to
24.6 kg in 2012/13. In developing countries, aggregate
sugar utilization is estimated to expand by 2.6 percent, or
3.1 million tonnes, to 121.8 million tonnes, equivalent to
70 percent of global consumption. In the generally more
mature markets of developed countries, consumption is to
increase by 1.1 percent, to 51.7 million tonnes. However,
a deterioration of the 2013 global economic prospects
could undermine demand expansion, as manufacturing
and food preparation sectors, which account for the bulk
of aggregate sugar consumption, are highly influenced by
the economic environment. Also, the depreciation of the
currency of several major sugar importers against the US
dollar – which makes imports in domestic currency more
expensive – could lead to weaker intake of sugar in these
countries, which include Egypt, Syrian Arab Republic
and Japan.
TRADE
Weaker import demand behind a contraction of world sugar trade in 2012/13The forecast for world sugar trade in 2012/13 (October/
September) stands at 51.1 million tonnes, 2.6 percent less
than in the previous season. The main feature of sugar
trade in the 2012/13 season is the rebounding of deliveries
from Brazil, the world’s largest exporter, which had fallen
in 2011/12 amid tight domestic supplies. Brazil is expected
to supply 50 percent of world trade in 2012/13. However,
the final volume sold abroad by the country will very
0
2
4
6
2011/12 estimate
2012/13 forecast
Million tonnes
Indonesia USA AlgeriaEU China Korea Rep.
0
10
20
30
2011/12 estimate
2012/13 forecast
Million tonnes
Australia Guatemala Mexico IndiaBrazil Thailand EU

Ma
rke
t asse
ssme
nts
MMaa
rke
t asse
ssme
nts
411
much depend on the quantity of sugarcane production
processed into ethanol, especially considering the recent
increase in the mandated blend ratio and gasoline prices,
as explained in the production section. Demand for ethanol
will also be driven by the need of the United States to meet
its advanced mandate requirements through imported
ethanol-based sugarcane from Brazil.
Likewise, Thailand, the second largest exporter, is
expected to expand sugar deliveries, but only slightly above
last year’s record, spurred by abundant supply availability.
The bulk of the country’s exports is forecast to be shipped
in raw form (about 60 percent) to neighbouring countries,
including Indonesia, Malaysia and the Republic of Korea.
Exports to China are expected to contract given the
increase in Chinese production. Thailand is also expected
to fill its 2013 tariff rate quota (TRQ) with imports from
the United States of 15 027 metric tonnes (raw value).
Due to the expected reduction in sugar output, shipments
from India are estimated at 800 000 tonnes, down from
3.7 million tonnes last season. India’s competitiveness on
the international market is being constrained by rising
production costs and falling world prices, which may
depress exports below last’s year level, despite relatively
comfortable supply availability. Supported by greater
domestic production and exportable surplus, deliveries
from Australia, the world’s third largest supplier, are set
to rise, to just below the country’s historic high of 3.61
million tonnes. A bumper crop is also expected to raise
deliveries by South Africa, with the bulk of shipments
directed to the Southern Africa Customs Union (SACU)
market, and to the United States to fill its 2013 TRQ
allocation. Exports by Guatemala are foreseen to hover
around the same level as last year, given ample supply
availabilities and competitive pricing. Sugar has become a
key source of foreign exchange earnings for the country,
with large investments targeting refined sugar export
markets, especially in the United States, the Republic of
Korea and Canada, the main destinations of Guatemala’s
sugar export. Sales by Mexico are anticipated to increase
in 2012/13, due to greater production. The Government
of Mexico recently established a trust fund to facilitate
exports of sugar surplus to NAFTA and international
markets, in an attempt to lift internal prices. However,
the final amount of shipped sugar still will depend on
the extent to which high fructose corn syrup (HFCS)
substitutes for domestic sugar use. Production gains are
also anticipated to enable Cuba to step up exports, with
the bulk of the sales directed to China.
Imports by Asian countries are forecast to decline
somewhat in 2012/13 as a result of higher sugar
production. Much of the reductions would result from
lower purchases by China, reflecting expectations of
an increasing domestic output and a slowdown in state
purchases as stocks return to comfortable levels. After
being the main driver of imports between 2009 and 2011,
and with shipments growing by 41 percent per year,
China is expected to rely less on international markets in
2012/13. On the other hand, shipments into Japan and
Malaysia are predicted to change little, while imports into
Indonesia may increase, as demand from the food and
beverages industry remains steady. In Europe, shipments
to the EU are forecast to fall due to ample domestic
availabilities. However, estimates for imports may be
revised upwards considering the conclusion of a free
trade agreement between Colombia, Peru and the EU.
The agreement took effect provisionally for the EU and
Peru on 1 March 2013, and the agreement with Colombia
will follow at a later date. A similar agreement between
the EU and six countries in Central America – Costa
Rica, El Salvador, Guatemala, Honduras, Nicaragua and
Panama – also could take effect next year, which would
add pressure for EU’s imports to increase further. These
free trade agreements will allow additional duty-free TRQs,
amounting to 264 000 tonnes of sugar and increasing at
annual rate of 3 percent. As a result of falling domestic
production, imports by the Russian Federation, once the
world’s largest sugar market, are expected to rise from
800 000 tonnes in 2011/12 to about 1 million tonnes in
2012/13, far below the 2.8 million tonnes imported in
2010/11. In the rest of the world, purchases by the United States, about half of which are managed through a
TRQ system of 1.4 million tonnes, may drop somewhat
in light of expected higher output while, overall, African countries are expected to import 2.7 percent more, as
increasing population and per capita income triggered
strong increases in demand.

Foo
d O
utl
oo
k -
Jun
e 2
01
3FFoo
od
Ou
tlo
ok
- Ju
ne
2200
113
424
Figure 1. Gains in global meat trade in 2013
MEAT AND MEAT PRODUCTS
Moderate meat production growth; trade to slowWorld meat production, is anticipated to grow modestly
in 2013 to 308.2 million tonnes, an increase of 4.3 million
tonnes or 1.4 percent compared with 2012. In many
countries, producers continue to struggle against elevated
feed prices; however, although remaining high by historical
standards, they began to fall during the second half of
2012 and have continued to diminish during 2013. This
has offered greater scope for profitable meat production,
particularly in the pig and poultry sectors, which are the
most dependent on concentrated feed. Meat production is
anticipated to grow the most vigorously in the developing
countries, which are the main centres of demand growth.
Meat prices have remained at historically high levels
since the early part of 2011. The FAO Meat Price Index
averaged 179 in May 2013, having moved within the
narrow band of 177–179 since October 2012. Export
reference prices for the different types of meat have
followed varying directions so far this year, rising marginally
for poultry and pork, remaining largely stable for beef, and
falling for ovine meat.
Meat trade is expected to grow more slowly in 2013
than in recent years due to adequate national supplies
in a number of importing countries and a reduction in
production among some of the major exporters. Global
meat exports are anticipated to rise to 30.2 million tonnes
in 2013, an increase of 1.1 percent over 2012.
Major Meat Exporters and Importers
Major ExportersMajor Importers
BOVINE MEAT
Herd rebuilding over the past two years promotes production growth in 2013Bovine meat production is forecast to reach 68.1 million
tonnes in 2013, representing a further increase over
2012, which had followed two years of stagnation
in 2010 and 2011. The resurgence in output is being
led by the developing countries, which collectively
account for almost 60 percent of the world total, while
-400
-200
0
200
400
Thousand tonnes
Beef Poultry Pigmeat
Total Developedcountries
Developingcountries

Ma
rke
t asse
ssme
nts
MMaa
rke
t asse
ssme
nts
433
Table 1. World meat market at a glance
climatic factors have restrained beef production in many
developed countries.
In South America, cattle availabilities and slaughter have
been rising, particularly in Argentina, Brazil, Paraguay
and Uruguay, following two years of herd rebuilding. For
Argentina, this process may be amplified in 2013, due to
an augmentation of slaughter rates in the face of higher
production costs. In addition, as a result of government-
imposed restrictions on exports, external market demand
is less of a factor in expanding meat production than in
neighbouring Paraguay and Uruguay. In Brazil, the world’s
second largest beef producer after the US, production
is expected to reach a record 9.5 million tonnes, as
pasture conditions are good, the industry is improving its
management practices, and international demand is strong.
In Asia, India, the fifth largest bovine meat producer,
is anticipated to show additional production growth, as
is Vietnam, thanks to its investments in new processing
operations. Beef output is forecast to continue to increase
in the Republic of Korea, reflecting government slaughter
subsidies and challenges to profitability in the light of low-
priced domestic pork. In China, production is expected to
remain around 6.5 million tonnes, which is similar to the
previous three years, as the sector comes to terms with
2011 2012estim.
2013f’cast
Change: 2013 over 2012
million tonnes %
WORLD BALANCE
Production 297.6 303.9 308.2 1.4
Bovine meat 67.3 67.6 68.1 0.9
Poultry meat 102.1 104.6 106.4 1.8
Pigmeat 109.0 112.5 114.2 1.5
Ovine meat 13.5 13.6 13.8 1.2
Trade 29.2 29.9 30.2 1.1
Bovine meat 8.1 8.2 8.6 4.6
Poultry meat 12.8 13.1 13.3 1.5
Pigmeat 7.3 7.5 7.2 -4.1
Ovine meat 0.7 0.8 0.9 5.8
SUPPLY AND DEMAND INDICATORS
Per caput food consumption:
World (kg/yr) 42.5 43.0 43.1 0.4
Developed (kg/yr) 78.7 79.1 79.3 0.3
Developing (kg/yr) 32.5 33.1 33.3 0.7
FAO MEAT PRICE INDEX(2002-2004=100)
2011 2012 2013 Jan-May
Change: Jan-May 2013
over Jan-May 2012
%
177 175 179 0.9
labour shortages and high production costs that have led
many small-scale producers to cease operations.
For Africa, bovine meat production in Egypt could show
limited recovery in 2013, following extensive culling due to
a foot-and-mouth disease (FMD) outbreak in 2012. Output
in South Africa is also anticipated to increase. Elsewhere
in the region, weather conditions have generally been
favourable for pasture growth and feed grains – presenting
the prospect of rising beef production for the continent
overall.
In developed countries, production of bovine meat
is anticipated to be constrained in a number of the
principal producers, offsetting some of the growth in the
developing countries. In the United States, the world’s
largest beef producer, output is expected to fall by 3
percent. This is due to a drop in cattle slaughtered – a
situation that stems from a decline in the production
of calves linked to drought-related herd reduction. US
producers also have had to cope with elevated feed
costs. The same factors are expected to cause a similar
decline in production in neighbouring Canada. In the
EU, the world’s third largest beef producer, production
is expected to contract to 7.6 million tonnes. However,
it will be at 0.5 percent, a much slower rate than the
4 percent fall in 2012, which perhaps represents a slowing
of the long-term decline in the Union’s cattle herd amidst
some indications that production may grow in 2014. In
Oceania, dry conditions in recent months and the carry-
over effect of higher feed costs in 2012 are anticipated
to raise slaughter rates and boost production in both
Australia and New Zealand. In the Russian Federation,
reduced profitability is expected to lead to further herd
reduction, with a resultant increase in beef production. In
Figure 2. Limited supplies and elevated feed costs sustain meat prices
80
130
180
230
2013201220112010200920082007
Poultry price index
Pigmeat price index
Ovine price index
Beef price index

Foo
d O
utl
oo
k -
Jun
e 2
01
3FFoo
od
Ou
tlo
ok
- Ju
ne
2200
113
444
Japan, bovine meat output is projected to remain stable
at around the 0.5 million tonne mark.
Trade in bovine meat to rise: Brazil and India vie for premier exporter positionAlthough for the past two years, prices have been at the
highest levels of the past two decades, trade in bovine
meat increased in 2012 and is expected to register further
growth in 2013, with world exports expanding by 4 percent
to 8.6 million tonnes. A shortage of domestic supplies in a
number of countries has been an important contributor to
the trade expansion.
Marked increases in imports are expected for the
United States, the world’s largest beef importer (and a
major exporter) and, to a lesser degree for Canada, to
compensate for domestic shortfalls. Demand from China
is also anticipated to remain firm and imports may increase
by over 20 percent compared to 2012 levels – especially
as some consumers switch from poultry to other meat,
following an outbreak of avian influenza. Elsewhere in
Asia, imports by Japan, Malaysia and Vietnam are
expected to increase moderately, while purchases by the
Republic of Korea are anticipated to remain depressed,
as a consequence of ample domestic supplies and price
competition from other types of meat. Deliveries to the
Russian Federation, the second largest importer, could
also be below those of the previous year, as a result of
a rise in domestic supplies. In the EU, 2013 imports are
expected to be similar to 2012.
The development of buffalo meat exports by India is
boosting the country’s deliveries to Asian neighbours and
to the Near East and North Africa. India’s principal markets
are Vietnam and Malaysia; however, the meat has found a
ready outlet in many other countries. Overall, India’s 2013
bovine meat exports may grow by as much as 15 percent
to 1.6 million tonnes. At this level, sales would equal those
of Brazil, and be above those of the other two principal
beef exporting countries, Australia and the United States.
In total, these four countries together supply 65 percent of
bovine meat trade.
Higher production means that increased shipments
are expected for both Brazil and Australia, by 6 percent
and 4 percent, respectively. At the same time, limited
domestic supplies will keep United States’ trade at a
level similar to 2012. Elsewhere, and in order of volume of
trade, New Zealand, Uruguay, Paraguay, Mexico and
Argentina, which together represent approximately a
further 20 percent of trade, are all anticipated to increase
sales, while shipments by the EU, Canada, Belarus and
Nicaragua are forecast to remain stable or dip slightly
lower.
PIGMEAT
Growth in Asia to sustain world pigmeat production Production of pig meat is expected to grow by 1.5 percent
to a record level of 114.2 million tonnes in 2013. However,
the rate of growth will be slower than in the previous
year, as a result of higher slaughter rates in 2012 in
response to the elevated price of feed and, in some cases,
abundant stocks, which depressed prices. Almost two-
thirds of pig meat production originates in the developing
countries, which is where most of the increase in output
is forecast. Conversely, composite production by the
developed countries is expected to show a small decline.
Asia is the principal region, accounting for almost 60
percent of world pig meat production. Strong consumer
demand and government support policies are anticipated
to result in China’s pork output reaching 53.8 million
tonnes, or almost half of the world total. Recovery from
FMD-depletion should boost production in the Republic of Korea. Elsewhere in Asia, listed by magnitude of
production, output is forecast to be moderately higher
in Vietnam, the Philippines, Japan, Thailand and
Indonesia – in some instances, growth in the sector is
being limited by competition from other types of meat.
In the Americas, Brazil, the world’s fourth largest
producing country, is expected to see pigmeat output
increase, stimulated by improved pig prices. In Mexico,
production continues to expand, underpinned by improved
genetics and productivity, which are translating into more
piglets per litter and higher animal weights.
In the EU – at 22.4 million tonnes, the second most
important pork producer after China – compliance with
animal welfare requirements relating to the housing of
sows is expected to depress output for a second year, with
an anticipated fall of 2 percent. In the United States,
the third largest producing country, lower feed costs and
increased slaughter, associated with an expansion of the
breeding herd could lead to limited growth. In Canada,
producers’ struggles to remain profitable have resulted in a
number ceasing operations –consequently a small decrease
in output is anticipated. In the Russian Federation, where
a sustained 4 percent growth is forecast, the industry is
being assisted by reduced feed prices and is benefitting
from government policies favouring large-scale farms
Pig meat trade stalls in the face of reduced demand in Asia and lower export availabilitiesReduced output among some of the principal exporting
countries and a decrease in demand by several major
importing countries are expected to result in a decline in

Ma
rke
t asse
ssme
nts
MMaa
rke
t asse
ssme
nts
455
Figure 3. Pork and poultry producers strugglewith high feed costs
pig meat trade during 2013. Shipments are anticipated to
fall by 4 percent to 7.2 million tonnes. Pig meat imports by
Asian countries, which as a group represent approximately
half of world demand, are expected to fall for a second
year: after being down by 4 percent in 2012, a 6 percent
decrease is anticipated for 2013. Procurement by the
Republic of Korea is forecast to register a substantial
drop for the second year in a row, decreasing by around
150 000 tonnes, or 30 percent. This reflects a build-up of
stocks and a fall in domestic prices stemming from a strong
recovery of production following the 2011 FMD outbreak.
Japan, the largest importer, is anticipated to cut purchases
by 2.5 percent, reflecting expanding production and strong
competition from poultry and imported beef. Imports by
China are expected to be stable, following notable growth
in recent years, as a consequence of a rise in production.
Elsewhere, the Russian Federation, Mexico, the United States and Canada are anticipated to maintain purchases
at a similar level to last year, while Ukraine’s purchases
may fall due to restrictions on imports established in favour
of national producers.
In terms of exports, reduced availability in the United States, the EU and Canada – which account for 75
percent of world trade – is expected to constrain sales,
especially in the EU, where shipments are anticipated to
fall by 10 percent. Brazil, the fourth largest exporter,
is facing restrictions on pig meat trade in some markets,
such as the Ukraine, and thus may also see a decline
in sales. Moderate growth in shipments by smaller scale
exporting countries will go some way to counterbalance
reduced exports by the main trading countries. Sales by
non-traditional exporters, such as Chile and Mexico, are
expected to rise, especially in Mexico due in part to its
newly recognized status as free of Classical Swine Fever.
Shipments from Belarus are also set to increase, facilitated
by a newly negotiated customs union with the Russian
Federation.
POULTRY MEAT
Production growth continues despite disease outbreaksGlobal poultry production is anticipated to increase 1.8
percent to 106 million tonnes in 2013. While growing,
output remains constrained by the cost of feed, although
this may fall further during the year. Unlike bovine and pig
meat, production growth is foreseen in both developing
and developed country groupings. Competitive pricing of
poultry relative to other meats is an important element
in its momentum. Estimating 2013 output for China –
currently the second largest producer, but on trend to
replace the United States as the main producing country
in the next few years – remains difficult because of culling
and limitations on the retail sale of live poultry following an
outbreak of H7N9 influenza strain in March. Furthermore,
consumer confidence in poultry meat has diminished and
sales are reported to have suffered. Consequently, China’s
poultry output has been provisionally set as unchanged
from 2012, in contrast with the 2.6 percent increase
originally projected. An outbreak of the H7N3 strain in
Mexico in April is also causing concern. In the United States, a 1.6 percent increase in output is anticipated as
production has recovered from the 2012 slump, aided by
improved prices and a reduction in feed costs. Elsewhere,
production growth is anticipated for the EU, Brazil and
the Russian Federation, which collectively account for 26
percent of world production. Continued rapid expansion
is forecast for India, where output may rise by 8 percent.
Among the top 20 producing countries, apart from the
uncertainty surrounding China, only Japan is expected to
register a fall in output, which could decline by 0.7 percent
in response to oversupply and associated reduced prices
stemming from a sharp increase in production in 2012 and
a subsequent build-up of stocks.
Trade slows Poultry, the most traded category of meat, represents
almost 45 percent of world commerce. Although the
volume of sales doubled over the past decade, growth
has stalled since 2010. This slowdown is expected to
continue in 2013, when trade is forecast to increase by
1.5 percent to 13.3 million tonnes. Purchases by Asia,
the main importing region, are anticipated to increase
by 0.6 percent, due to growth in purchases by Saudi
0.4
0.7
1.0
1.3
130
180
230
280
2013201220112010200920082007
2002-2004=100 Ratio
Feed price index (left axis)
Pigmeat/feed index (right axis)
Poultry/feed index (right axis)

Foo
d O
utl
oo
k -
Jun
e 2
01
3FFoo
od
Ou
tlo
ok
- Ju
ne
2200
113
464
Arabia, Vietnam, Iraq, the United Arab Emirates and Kazakhstan, among others. However, abundant
domestic supplies in Japan and the Republic of Korea,
and concerns over avian influenza that have led to
decreased consumption in China, are expected to curb
imports. Compared to other regions, imports for Africa
as a whole are forecast to show strong growth in 2013,
increasing by 6 percent. Among the main importing
countries, South Africa, Angola, Benin, Ghana and Egypt are all anticipated to purchase more, as income
growth strengthens demand. In Egypt, culling associated
with avian influenza, combined with FMD-induced high
beef prices, will provide an additional stimulus to imports.
Deliveries to the Russian Federation in 2013 are expected
to increase moderately, in part due to the recent customs
agreement with Ukraine and Belarus. Imports by the
Federation remain at less than half what they were in the
mid-2000s, because of a considerable increase in domestic
production. Rising poultry production within the European Union could lead to reduced purchases in 2013, while
imports by Mexico and Canada are anticipated to change
little, amid stable domestic demand.
Subdued import demand and reduced margins are
expected to restrain overall world poultry exports; however,
a rising trend in medium-sized exporting countries’ trade
is discernible. The most important trading countries,
Brazil, the United States and the EU, which together
account for almost three-quarters of global trade, have
had little expansion in sales in recent years. Instead, most
growth has come from second-tier exporters, including
Thailand, China, Argentina, Turkey, Chile, the Ukraine and Belarus. This pattern is expected to be maintained
for 2013, with the exception of China. Shipments
from Thailand to the EU are forecast to rise vigorously,
supported by competitive pricing and EU’s lifting of an
eight-year AI-induced ban on fresh and chilled products.
Likewise, exports from Turkey, which have benefited from
a rising regional demand, especially from Iraq, are forecast
to grow by over 15 percent. Government investments
are supporting record Argentine exports, particularly to
regional markets, including Venezuela and Chile.
OVINE MEAT
Production rising steadily Production of ovine meat continues to show modest
growth, following a period of stagnation, and is forecast
to rise 1.2 percent, to 13.8 million tonnes, in 2013.
Developing countries account for three-quarters of output,
with the largest producers in this grouping being China, India, Sudan and Nigeria. Furthermore, ovine meat is
an important element in the markets of many countries
in North Africa and the Near East. Satisfactory pasture
conditions have set the basis for flock rebuilding for
many of the major producing areas of Asia and Africa.
In developed countries, the main production growth is
expected to come from Australia and New Zealand. Output in Australia is anticipated to register a particularly
strong rise – increasing by 10 percent. In the EU, the long-
term decline in output is expected to continue, as a result
of high production costs and limited returns to producers.
Demand rising in China and the Near East Import demand for ovine meat is expected to register a
second strong year, growing by over 6 percent to 850 000
tonnes in 2013. Most of the increase is anticipated to come
from China, but will also encompass the EU and a number
of countries in the Near East, including Saudi Arabia, Jordan and Qatar. Almost 90 percent of world trade is
supplied by Australia and New Zealand. Of the two
countries, Australia is anticipated to record the strongest
growth in sales, although those of New Zealand are also
expected to grow substantially. A shift in market demand
to China and the Near East is also leading to a change in
the type of meat shipped, with a movement towards whole
carcasses, including offal, as opposed to a preference for
only the higher value cuts which characterizes the markets
of the EU and the United States.
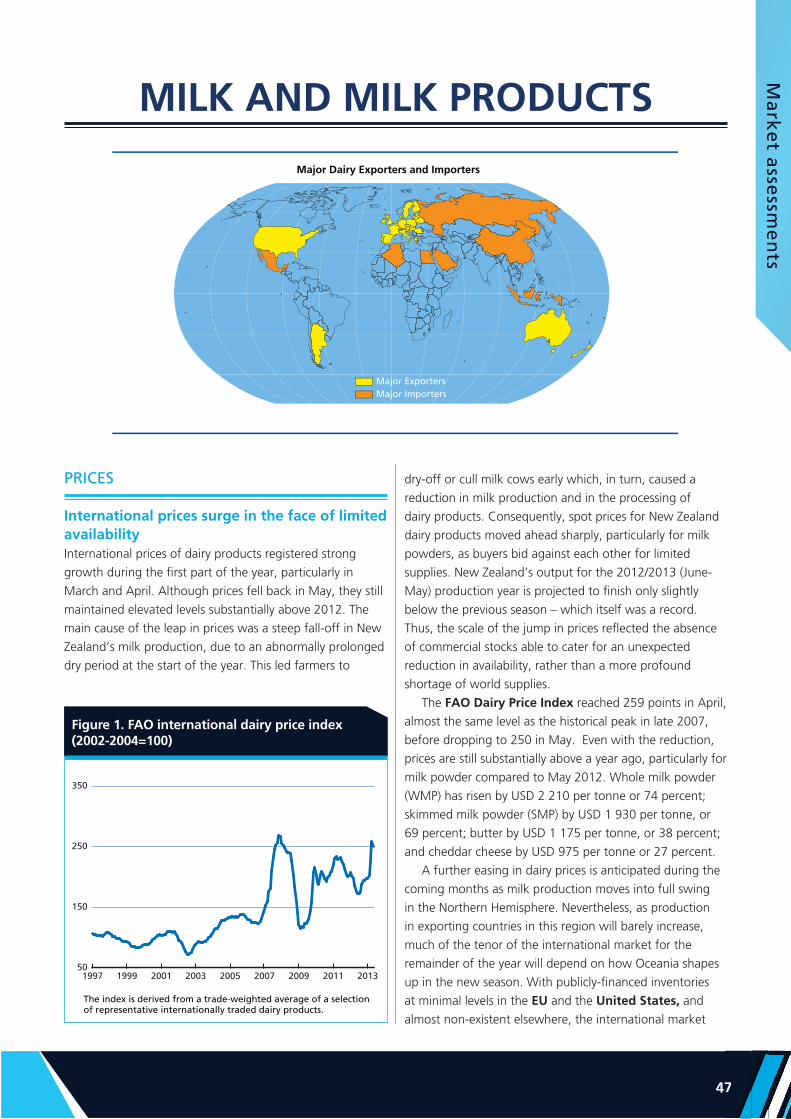
Ma
rke
t asse
ssme
nts
MMaa
rke
t asse
ssme
nts
477
Figure 1. FAO international dairy price index(2002-2004=100)
MILK AND MILK PRODUCTS
Major Dairy Exporters and Importers
Major ExportersMajor Importers
PRICES
International prices surge in the face of limited availability International prices of dairy products registered strong
growth during the first part of the year, particularly in
March and April. Although prices fell back in May, they still
maintained elevated levels substantially above 2012. The
main cause of the leap in prices was a steep fall-off in New
Zealand’s milk production, due to an abnormally prolonged
dry period at the start of the year. This led farmers to
dry-off or cull milk cows early which, in turn, caused a
reduction in milk production and in the processing of
dairy products. Consequently, spot prices for New Zealand
dairy products moved ahead sharply, particularly for milk
powders, as buyers bid against each other for limited
supplies. New Zealand’s output for the 2012/2013 (June-
May) production year is projected to finish only slightly
below the previous season – which itself was a record.
Thus, the scale of the jump in prices reflected the absence
of commercial stocks able to cater for an unexpected
reduction in availability, rather than a more profound
shortage of world supplies.
The FAO Dairy Price Index reached 259 points in April,
almost the same level as the historical peak in late 2007,
before dropping to 250 in May. Even with the reduction,
prices are still substantially above a year ago, particularly for
milk powder compared to May 2012. Whole milk powder
(WMP) has risen by USD 2 210 per tonne or 74 percent;
skimmed milk powder (SMP) by USD 1 930 per tonne, or
69 percent; butter by USD 1 175 per tonne, or 38 percent;
and cheddar cheese by USD 975 per tonne or 27 percent.
A further easing in dairy prices is anticipated during the
coming months as milk production moves into full swing
in the Northern Hemisphere. Nevertheless, as production
in exporting countries in this region will barely increase,
much of the tenor of the international market for the
remainder of the year will depend on how Oceania shapes
up in the new season. With publicly-financed inventories
at minimal levels in the EU and the United States, and
almost non-existent elsewhere, the international market
50
150
250
350
201320112009200720052003200119991997
The index is derived from a trade-weighted average of a selectionof representative internationally traded dairy products.

Foo
d O
utl
oo
k -
Jun
e 2
01
3FFoo
od
Ou
tlo
ok
- Ju
ne
2200
113
484
remains exposed to sudden changes in milk production and
availability of milk products, as seen so far this year, and
which may become a common feature in the future.
PRODUCTION
World milk production to show steady growth in 2013World milk production in 2013 is forecast to grow by 2.2
percent to 784 million tonnes – a similar rate to recent
years. Asia is expected to account for most of the increase,
with output in India, the world’s largest milk producing
country, forecast to rise by 5.3 million tonnes to 139 million
tonnes: per capita milk consumption is estimated to have
grown by almost 30 percent in the past decade, while
India’s population increased by 17.6 percent from 2001
to 2011. This dynamic domestic demand is providing the
main impetus for growth, as India is largely absent from
the international dairy markets. Unlike in many countries,
expansion in herd size, in addition to a rise in productivity,
is an important engine in the development of India’s
milk production. Increased output is also anticipated in
China, Pakistan and Turkey, spurred by steady growth
in consumer demand. The Republic of Korea is slowly
recovering from the 2011 foot-and-mouth disease outbreak
which required the slaughter of 8 percent of its dairy herd
and led to a corresponding drop in milk production.
In Africa, a moderate increase in milk output is
anticipated for 2013, assisted by overall favourable
weather conditions. Expansion in output is anticipated
for Algeria, Morocco and Uganda, where government
policies in support of dairy development and an expansion
of processing capacity have contributed to the increase.
In Uganda, restocking in the conflict-affected northern
parts of the country has also aided growth. For East Africa
overall, a good start to the rainy season has assisted
pasture growth in Kenya, Uganda and Tanzania. For
Kenya, it is unclear whether the January introduction of a
ban on the sale of raw milk, the common way of retailing
milk, will reduce overall demand. In South Africa, where
milk production has been running below 2012 levels as
producers struggle to remain profitable, a fall in maize
prices may provide some respite for the remainder of the
year.
Rising incomes and firm regional and international
demand have favoured dairy production growth in several
countries in Latin America and the Caribbean. Additionally,
most South American countries had very good pasture
conditions during the 2012/2013 production year. Overall,
South American milk production is foreseen to expand by
3 percent in 2013, a rate similar to 2012, to 72 million
tonnes. Gains are forecast for Brazil, Chile, Ecuador and
Uruguay. In addition to rising domestic demand, a number
of these countries stand to benefit from the prevailing
elevated prices for dairy products in both regional and
international markets. The overall positive outlook has
stimulated investment in new technology and improved
animal genetics. In Argentina, although there has been
substantial investment in new processing capacity, milk
output has stagnated in the past two years, in the face of
falling domestic demand and limitations on exports – with
no growth foreseen in 2013. For Central America, milk
output in Mexico, the largest producer in the subregion,
is expected to be constrained by chronically dry to drought
Table 1. World dairy market at a glance
2011 2012estim.
2013f’cast
Change: 2013 over 2012
million tonnes %
WORLD BALANCE
Total milk production 745.5 767.4 784.4 2.2
Total trade 49.7 53.7 54.7 1.9
SUPPLY AND DEMAND INDICATORS
Per caput food consumption:
World (kg/yr) 105.7 107.6 108.7 1.1
Developed (kg/yr) 235.3 237.9 238.0 0.1
Developing (kg/yr) 72.1 74.1 75.9 2.4
Trade share of prod. (%) 6.7 7.0 7.0 -0.3
FAO DAIRY PRICE INDEX(2002-2004=100)
2011 2012 2013 Jan-May
Change: Jan-May 2013
over Jan-May 2012
%
221 189 227 17.0
Figure 2. EU intervention prices, price and export refund for butter and skim milk powder
0
1500
3000
4500
1312111009080706050403
SMP (interv. price)
SMP Refund
SMP (export price) Butter (export price)Butter (interv. price)
Butter Refund
Euro per tonne

Ma
rke
t asse
ssme
nts
MMaa
rke
t asse
ssme
nts
499
Figure 3. FAO indices of dairy and feed prices (2002-2004=100)
conditions in many parts of the country, leading to herd
reduction and the withdrawal of a number of small-scale
producers from the industry. Production in Costa Rica is
expected to show a moderate increase.
In North America, milk production in the United States
is forecast to increase by only 0.7 percent to 91.5 million
tonnes. Sustained dry conditions, during the first part of the
year, lingering from 2012, have affected pastures in central
and western parts of the country. Furthermore, a prolonged
unfavourable milk/feed price ratio has caused some farmers
to cut back on output and may lead to a reduction in cow
numbers. Production in Canada is set to remain stable at
8.5 million tonnes, within the limits set by the milk quota
system.
In Europe, EU milk production is forecast to remain
unchanged in 2013 at 156 million tonnes, as improved milk
yields per cow continue to compensate for reduced cow
numbers. Output within the EU suffered from exceptionally
bad weather conditions in some areas in 2012. It was
both unusually dry, especially in Romania, Hungary and
Bulgaria, and excessively wet, in the case of Ireland,
the United Kingdom and northern France – both had a
negative impact on grass production for silage, as well as
yields of feed grains grown on-farm. This raised the cost
of milk production, as affected producers had to purchase
high-priced grains and concentrate, which coincided with
falling milk prices. EU production quotas were raised by
1 percent in April, in preparation for their abolition in
2015; however, the experience of recent years has shown
that most countries have failed to fully utilise their quota,
with the short-fall for the Union overall being around 5
percent. Milk production in the Russian Federation is
anticipated to show a second year of modest increase in
2013, following declines in 2010 and 2011, supported by
improved profitability and a concomitant slowing in dairy
herd contraction. In neighbouring Ukraine and Belarus,
milk production is on an upward trend, subsequent to a
prolonged period of decline. In both countries, government
incentives are provided to promote farm-level efficiency
and the use of modern technology; however, as in the
case of the neighbouring EU, producers have faced similar
challenges in maintaining profitability in the face of
increases in the cost of feed and reduced prices for milk.
In Oceania, sustained high prices for dairy products
on the international market and associated levels of
profitability have stimulated the dairy sector; however, both
Australia and New Zealand experienced prolonged hot, dry
weather at the start of 2013, which led to a sharp fall-off in
milk production. In New Zealand, up until January, output
was running 6 percent ahead of the 2011/12 season, itself
a record, but subsequently plummeted. As a result, the
2009-11
Average
2012
prelim.
2013
f’cast
thousand tonnes
WHOLE MILK POWDER
World 2 155 2 437 2 464
New Zealand 959 1 261 1 350
EU* 432 388 350
Argentina 159 201 180
Australia 121 109 99
SKIM MILK POWDER
World 1 502 1 827 1 853
EU* 376 523 497
United States 356 445 432
New Zealand 371 390 400
Australia 146 168 190
BUTTER
World 848 898 923
New Zealand 420 463 460
EU* 142 127 137
Belarus 69 82 90
United States 51 50 55
Australia 60 53 65
CHEESE
World 2 229 2 583 2 658
European Union* 645 776 815
Saudi Arabia 231 341 350
New Zealand 269 306 317
United States 170 262 254
Egypt 160 111 100
Australia 163 163 170
Table 2. Major exporters of dairy products
* Excluding trade between the EU Member States. From 2007: EU-27
100
150
200
250
300
201320122011201020092008
Dairy price index Feed price index

Foo
d O
utl
oo
k -
Jun
e 2
01
3FFoo
od
Ou
tlo
ok
- Ju
ne
2200
113
505
current season is expected close slightly down, at 19.6
million tonnes. Abundant rain in April helped pastures
re-establish themselves and set the basis for a reasonable
start to the 2013/2014 season. In Australia, the 2012/13
milk year opened with less than favourable, cool and
wet weather, only to experience widespread hot and dry
conditions at the start of 2013. Consequently, for 2012/13,
milk output is forecast to be moderately lower than the
previous season, at 9.3 million tonnes. As a consequence
of the unfavourable climatic conditions, herd rebuilding
in both Australia and New Zealand was temporarily
suspended in 2012/2013.
TRADE
Trade to grow in 2013, but limited export availability drives up international dairy prices World trade in dairy products is expected to continue
to expand in 2013 sustained by strong import demand,
although supply limitations are anticipated to place a
brake on growth. Consequently, trade is forecast to
grow by 1.9 percent, compared with an average of 7
percent in recent years, to reach 54.7 million tonnes of
milk equivalent. Demand remains firm and, in the context
of limited supplies, has led to a substantial rise in prices
during the first part of the year. Asia will continue to be
the main market for dairy products, accounting for some
54 percent of world imports. In 2013, imports are expected
to rise in China, the United Arab Emirates, the Islamic Republic of Iran, Saudi Arabia, Indonesia, the Republic of Korea, Japan, Malaysia and Oman. Elsewhere in
Asia, the Philippines, Vietnam and Thailand should also
remain important markets, but the level of their imports
is not expected to rise. Elevated international prices are
projected to reduce imports by Africa as a whole. The
principal importers that may be affected include Egypt, Algeria and Libya. A number of significant milk powder
importing countries in Latin America and the Caribbean,
including Mexico, Venezuela and Brazil, may also see
purchases constrained by high prices. Finally, imports by the
Russian Federation are anticipated to increase, stimulated
by strong demand for butter and cheese, while those of the
United States are forecast to be unchanged.
International prices are expected to remain at elevated
levels until at least the latter part of 2013, as limited
growth in milk production and strong demand cast a
shadow of uncertainty over the future availability of milk
products. In this context, exporting countries will have
to strike a delicate balance between maintaining core
markets and pursuing long-term market development, and
adjusting their product mix to ensure maximum returns.
For imports, some lower income countries and those that
purchase milk products for social programmes may reduce
the scale of their acquisitions in the light of elevated prices.
In general, processing industries which rely on imports
are likely to seek means of substituting less expensive
ingredients, such as whey powder or vegetable fat, where
possible. Furthermore, the elevated cost of imported
products will provide a fillip to domestic milk production in
many countries.
Whole milk powder (WMP) – Prices surge on supply concerns World exports of WMP are projected to register only a
small increase 2013, rising by 1 percent to 2.5 million
tonnes. This compares with average annual growth of
6 percent in the previous three years. High international
prices will lead many countries to re-evaluate their import
needs, including the potential for substitution. Sustained
demand is forecast for Asia, the main market. However,
some importers in North Africa and Latin America and
the Caribbean may limit or reduce purchases in the face
of elevated prices. China is expected to retain its position
as the principal importer of WMP and may see further
expansion in purchases, although processors may also
seek to utilize lower value ingredients, such as whey
powder, where possible, for recombination. Elsewhere
in Asia, increased purchases are expected for the United Arab Emirates, Saudi Arabia and Oman. Conversely,
in Algeria and Venezuela, which are second and third,
respectively in terms of world imports, social programmes
are an important driving force behind demand, and the
countries may see imports reduced as a result of budgetary
restrictions. In Brazil, rising domestic production could
lead to imports being displaced. Demand for WMP is very
geographically diverse, stemming from its wide use in
both the processing industry and for direct retail sale. As
for the exporters, New Zealand, Belarus and Uruguay
will supply most of the increase in trade, as restricted milk
supplies and a move into producing other milk products
are expected to curb WMP export availability from the
EU, Australia and Argentina. As a group, the above
six countries supply 85 percent of the international WMP
market.
Skim milk powder (SMP) – Prices also up markedlyTrade in SMP is anticipated to record limited growth
in 2013, rising by 1.5 percent to 1.9 million tonnes,
and contrasting with an average annual increase of
11 percent for the previous three years. In the face of
tight export availability, SMP prices have risen alongside
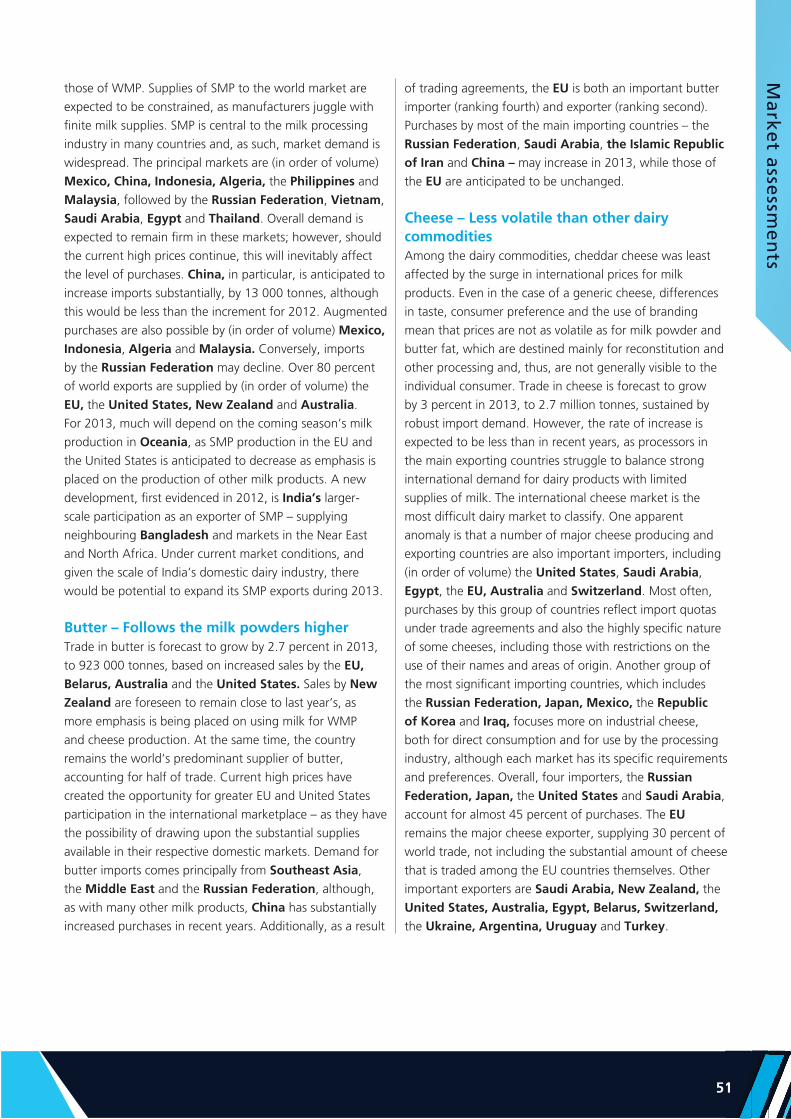
Ma
rke
t asse
ssme
nts
MMaa
rke
t asse
ssme
nts
511
those of WMP. Supplies of SMP to the world market are
expected to be constrained, as manufacturers juggle with
finite milk supplies. SMP is central to the milk processing
industry in many countries and, as such, market demand is
widespread. The principal markets are (in order of volume)
Mexico, China, Indonesia, Algeria, the Philippines and
Malaysia, followed by the Russian Federation, Vietnam,
Saudi Arabia, Egypt and Thailand. Overall demand is
expected to remain firm in these markets; however, should
the current high prices continue, this will inevitably affect
the level of purchases. China, in particular, is anticipated to
increase imports substantially, by 13 000 tonnes, although
this would be less than the increment for 2012. Augmented
purchases are also possible by (in order of volume) Mexico, Indonesia, Algeria and Malaysia. Conversely, imports
by the Russian Federation may decline. Over 80 percent
of world exports are supplied by (in order of volume) the EU, the United States, New Zealand and Australia.
For 2013, much will depend on the coming season’s milk
production in Oceania, as SMP production in the EU and
the United States is anticipated to decrease as emphasis is
placed on the production of other milk products. A new
development, first evidenced in 2012, is India’s larger-
scale participation as an exporter of SMP – supplying
neighbouring Bangladesh and markets in the Near East
and North Africa. Under current market conditions, and
given the scale of India’s domestic dairy industry, there
would be potential to expand its SMP exports during 2013.
Butter – Follows the milk powders higherTrade in butter is forecast to grow by 2.7 percent in 2013,
to 923 000 tonnes, based on increased sales by the EU, Belarus, Australia and the United States. Sales by New Zealand are foreseen to remain close to last year’s, as
more emphasis is being placed on using milk for WMP
and cheese production. At the same time, the country remains the world’s predominant supplier of butter,
accounting for half of trade. Current high prices have
created the opportunity for greater EU and United States
participation in the international marketplace – as they have
the possibility of drawing upon the substantial supplies
available in their respective domestic markets. Demand for
butter imports comes principally from Southeast Asia,
the Middle East and the Russian Federation, although,
as with many other milk products, China has substantially
increased purchases in recent years. Additionally, as a result
of trading agreements, the EU is both an important butter
importer (ranking fourth) and exporter (ranking second).
Purchases by most of the main importing countries – the Russian Federation, Saudi Arabia, the Islamic Republic of Iran and China – may increase in 2013, while those of
the EU are anticipated to be unchanged.
Cheese – Less volatile than other dairy commoditiesAmong the dairy commodities, cheddar cheese was least
affected by the surge in international prices for milk
products. Even in the case of a generic cheese, differences
in taste, consumer preference and the use of branding
mean that prices are not as volatile as for milk powder and
butter fat, which are destined mainly for reconstitution and
other processing and, thus, are not generally visible to the
individual consumer. Trade in cheese is forecast to grow
by 3 percent in 2013, to 2.7 million tonnes, sustained by
robust import demand. However, the rate of increase is
expected to be less than in recent years, as processors in
the main exporting countries struggle to balance strong
international demand for dairy products with limited
supplies of milk. The international cheese market is the
most difficult dairy market to classify. One apparent
anomaly is that a number of major cheese producing and
exporting countries are also important importers, including
(in order of volume) the United States, Saudi Arabia, Egypt, the EU, Australia and Switzerland. Most often,
purchases by this group of countries reflect import quotas
under trade agreements and also the highly specific nature
of some cheeses, including those with restrictions on the
use of their names and areas of origin. Another group of
the most significant importing countries, which includes
the Russian Federation, Japan, Mexico, the Republic of Korea and Iraq, focuses more on industrial cheese,
both for direct consumption and for use by the processing
industry, although each market has its specific requirements
and preferences. Overall, four importers, the Russian Federation, Japan, the United States and Saudi Arabia,
account for almost 45 percent of purchases. The EU
remains the major cheese exporter, supplying 30 percent of
world trade, not including the substantial amount of cheese
that is traded among the EU countries themselves. Other
important exporters are Saudi Arabia, New Zealand, the
United States, Australia, Egypt, Belarus, Switzerland, the Ukraine, Argentina, Uruguay and Turkey.

Foo
d O
utl
oo
k -
Jun
e 2
01
3FFoo
od
Ou
tlo
ok
- Ju
ne
2200
113
525
FISH AND FISHERY PRODUCTS
Major Exporters and Importers of Fish and Fishery Products
Major ExportersMajor Importers
GLOBAL FISH ECONOMY IN 2013
OverviewThe lingering economic crisis in the major seafood
importing markets of northern Europe and North America
has contributed to generally sluggish growth in seafood
imports, although with some exceptions where demand for
specific products has remained strong, namely salmon and
tuna. Fluctuating wild catch landings, mid-season quota
adjustments and major incidences of disease in aquaculture
facilities have contributed to supply uncertainty. As a result,
the direction of international prices and import volumes of
fish and fishery products in 2013 remains unclear.
A combination of chronic disease in Southeast Asian
shrimp farms and low wild shrimp catches continue to
put upward pressure on shrimp prices. Despite record high
prices, demand for tuna remains strong in the US and EU.
Canned tuna prices are expected to remain stable in the
face of low supply relative to demand. Cephalopod prices
have stabilized, despite falling or weak demand in key
markets of Europe and Japan. Tilapia demand in Europe
and North America remains stable with good supplies from
China, the main producer, while farmed tilapia production
has expanded in some developing countries in Asia, Africa
and Latin America and the Caribbean to meet growing
domestic demand. Abundant supplies of cod and a parallel
drop in cod prices in European markets have had negative
effects on cod fishers and producers who find cod farming
less profitable.
Weak demand for seabass and seabream in
key markets and credit problems in southern Europe
encouraged some producers to harvest early, resulting in
smaller-sized fish reaching the markets. Strong salmon
demand, despite rising salmon prices, implies a structural
shift in consumer demand, which is positive for salmon
producers. Mackerel demand increased in response to
the lower prices last season, and price is expected to
rise, although gradually, in 2013. The situation remains
difficult in the mackerel fishery due to overcapacity of
fishing fleets and the recent failure to regulate the South
Figure 1. The FAO Fish Price Index(2002-2004=100)
80
105
130
155
180
201320112009200720052003200119991997
Data source: Norwegian Seafood Council
FAO total fish price index
Capture totalAquaculture Total

Ma
rke
t asse
ssme
nts
MMaa
rke
t asse
ssme
nts
533
Table 1. World fish market at a glance
1 Data source: Norwegian Seafood Council
2011 2012estim.
2013f’cast
Change: 2013 over 2012
million tonnes %
WORLD BALANCE
Production 156.2 156.7 161.2 2.9
Capture fisheries 93.5 90.2 91.0 0.9
Aquaculture 62.7 66.5 70.2 5.6
Trade value (exports USD billion) 127.6 128.2 130.8 2.0
Trade volume (live weight) 57.2 57.4 57.8 0.7
Total utilization 156.2 156.7 161.2 2.9
Food 131.8 135.7 140.5 3.5
Feed 18.3 15.5 15.7 1.0
Other uses 6.0 5.5 5.1 -7.3
SUPPLY AND DEMAND INDICATORS
Per caput food consumption:
Food fish (kg/yr) 18.9 19.2 19.7 2.4
From capture fisheries (kg/year) 9.9 9.8 9.9 0.5
From aquaculture (kg/year) 9.0 9.4 9.8 4.4
FAO FISH PRICE INDEX 1
(2002-2004=100)2011 2012 2013
Jan-MayChange:
Jan-May 2013 over
Jan-May 2012 %
154 145 156 7.7
Pacific jack mackerel fishery, which is the world’s largest
fishery. Pressure on fishmeal prices remained strong in
2012 as a result of South American supply constraints in
an El Niño year, coupled with strong demand in European
and Asian markets. Despite the economic crisis, firm
consumer demand for carnivorous fish (which feed on
other fish species) and shrimp continue to support fish oil prices. Scallop catch levels in the United States for 2013
are expected to drop by 30–35 percent, which could lead
to rising prices in the main import markets. Oyster prices
are expected to remain strong in 2013, after more than
doubling over the last three years.
REVIEW BY FISH PRODUCT
ShrimpShrimp prices continue to rise, given expectations of
lower supplies due to delays in the start of the season
in Southeast Asia. Disease stands as a major issue for
the shrimp market in the coming year. Shrimp farmers
in Thailand sustained heavy losses due to early mortality
syndrome (EMS), a continuation of EMS problems
experienced across Southeast Asian – from China to
Malaysia – in 2012 EMS affected 80 percent of shrimp
2007 2008 2009 2010 2011 2012
(thousand tonnes)
Ecuador 70.0 83.1 74.6 80.6 97.2 92.0
Greenland 81.1 80.3 74.3 72.6 68.3 61.2
India 57.0 61.3 65.2 59.8 59.4 60.7
Argentina 45.2 38.6 47.1 55.5 62.1 54.9
Thailand 32.9 39.9 52.8 68.2 63.1 53.4
Denmark 57.7 50.1 46.3 49.4 44.8 43.1
Bangladesh 29.8 32.5 39.0 41.2 43.2 41.9
Netherlands 39.3 36.7 37.0 41.1 44.2 40.5
China 42.4 39.2 40.0 40.6 38.6 35.8
Viet Nam 23.4 31.8 38.1 42.8 45.2 35.3
Canada 53.8 33.5 31.4 30.5 27.8 30.0
Spain 19.8 19.9 21.8 25.9 25.0 28.1
Belgium 20.4 24.5 24.2 23.4 27.7 20.6
Others 277.5 243.3 231.2 215.4 202.6 175.3
Grand Total 850.1 814.8 822.9 847.1 849.1 772.6
Total intra imports 203.4 187.0 187.5 202.4 202.2 181.8
Total extra imports 646.8 627.8 635.3 644.7 646.9 590.9
Source: GLOBEFISH
Table 3. Shrimp imports EU-27 (by country of origin)
2007 2008 2009 2010 2011 2012
(thousand tonnes)
Thailand 188.3 182.4 192.8 203.2 185.8 136.1
Ecuador 59.1 56.3 61.6 65.0 73.8 81.5
Indonesia 59.1 84.0 69.3 61.1 70.3 74.1
India 20.8 15.2 19.9 30.2 48.1 65.6
Viet Nam 39.3 47.9 44.1 48.4 45.5 41.2
China 48.4 47.8 42.2 48.1 43.0 35.7
Mexico 40.6 34.5 41.1 23.5 30.7 26.4
Malaysia 22.8 30.1 18.4 24.3 29.3 23.5
Honduras 7.3 5.7 8.7 10.2 10.4 9.1
Guyana 8.9 9.1 8.9 7.8 6.5 9.0
Peru 7.2 7.5 8.5 7.0 8.3 8.4
Nicaragua 4.2 2.4 4.8 4.4 3.4 4.7
Panama 4.5 3.6 3.6 3.3 3.3 3.2
Bangladesh 14.9 13.7 9.9 8.1 4.5 2.7
Others 31.6 23.9 18.4 16.1 13.9 13.5
TOTAL 556.9 564.2 552.2 560.8 576.8 534.7
Source: NMFS; GLOBEFISH
Table 2. Shrimp imports USA
farms in the Mekong Delta with a major impact on
Vietnamese producers. News that a research team at the
University of Arizona has identified the pathogen causing
the syndrome may pave the way for a recovery of the
Southeast Asian shrimp industry. On the other hand,

Foo
d O
utl
oo
k -
Jun
e 2
01
3FFoo
od
Ou
tlo
ok
- Ju
ne
2200
113
545
Figure 4. CFR prices canned tuna (USA and Europe)
the industry also has to overcome the problem of the
presence of high levels of the antioxidant ethoxyquin used
in fishmeal fed to shrimp. The new Japanese regulations
introducing maximum levels of ethoxyquin, have resulted
in quarantine of shrimp from Viet Nam and India and
restricted their exports to Japan.
The supply of vannamei and black tiger shrimp from
Indian farmers is also expected to be lower due to
conservative production decisions and the lack of brood
stock. White spot disease in Latin America is affecting
production. Meanwhile, wild shrimp landings along its
Pacific coast have been disappointing.
Price pressure from low global supply has been slightly
offset by the weak yen impacting Japanese import
demand, a major import market. Import demand from the
United States and European markets has been sporadic,
making for uncertain demand and supply conditions in
2013. Given the recent decision by the US International
Trade Commission to investigate shrimp production in
seven countries, namely China, Ecuador, India, Indonesia,
Malaysia, Thailand and Viet Nam, the future for US demand
is uncertain, as countervailing duties and higher import
prices could be applied. The main EU markets, Spain and
Italy, saw sharp drops in demand, at 15.4 percent and
12.4 percent respectively. With the EU’s new Generalized
System of Preferences to be implemented in January 2014,
the tariff on Argentine shrimp imports will no longer
receive specialized treatment in the EU market and will
increase to 12 percent from the current rate of 4.5 percent.
This price rise will likely put further strain on EU import
demand and negatively impact Argentine shrimp producers.
In Southeast Asia, the combination of chronic disease
in farms and low wild catches will continue to put upward
Figure 2. Shrimp prices (16-20 count) in main wholesale markets
pressure on prices. However, import volumes are expected
to fall in all major markets, especially the United States
and EU-27, causing uncertainty about the future of shrimp
prices in 2013.
TunaThe sashimi tuna market in Japan remained firm in early
2013, mainly in anticipation of the spring festival in April/
May. The United States market for non-canned tuna also
remains stable, despite the high price of USD 2 000 per
tonne. In early 2013, the EU agreed to increase the annual
import quota for pre-cooked tuna loins to 22 000 tonnes
from 15 000 tonnes at zero duty for the next three years.
European canners, mostly from Spain, quickly snapped up
almost all the allotted duty-free quota in the first quarter of
Figure 3. CFR prices frozen skipjack (Thailand and Africa)
400
900
1400
1900
2400
201320122011201020092008200720062005
USD per tonne
Thailand Africa
10
20
30
40
50
201320122011201020092008200720062005
USD per carton
Europe United States
0
5
10
15
201220112010200920082007
USD Billion
United States
EU 27 (intra)
EU 27 (extra)
Japan

Ma
rke
t asse
ssme
nts
MMaa
rke
t asse
ssme
nts
555
2013, mainly for supplies from Thailand, Viet Nam, China,
Indonesia and the Philippines. Evidence shows that the
record high tuna prices are not hindering import demand in
the major markets. However, frozen yellow fin tuna steaks
and loins treated with carbon monoxide (CO) and exported
to the US market could face a tariff charge in the future, if
US Customs reclassifies CO-treated tuna as a prepared or
preserved product. If so, the tariff would escalate from the
current zero tariff for raw fish or fillets up to 12.5 percent,
with negative effects on imports.
Tuna supplies to Asian canners are down this year,
leading to rising prices for canned tuna. The US remains
the largest buyer of Thai canned tuna, despite the fact
that US canned tuna imports had fallen over the years
and remain flat, as does EU imports. Eco-labeled canned
tuna, indicating pole-and-line fisheries and absence of
fish aggregating devices (FAD-free fishing), are expected
to become available in European and North American
supermarkets later this year. This may lead to a rebound
in demand for canned tuna in these eco-friendly markets,
although overall volumes from pole-and-line fisheries
are limited. EU importers are also looking for alternative
suppliers of canned tuna with lower import duties. For
example, ACP countries such as Mauritius, Cote d’Ivoire
and Papua New Guinea can export to the EU at zero tariffs.
Canned tuna prices are expected to remain strong in the
face of low supply relative to demand.
GroundfishAbundant supplies of cod and falling prices in European
markets have boded badly for fishermen and cod farmers
who find that cod farming is becoming less profitable.
While the increasing supply may be a sign of successful
management of cod catch fisheries, it could also indicate
the need for structural adjustments in the cod industry
to reach a stable equilibrium in the market. From
an optimistic point of view, it could also present an
opportunity to market white fish as an alternate meat,
given its relatively lower price, and to increase overall
consumption of white fish. Hake prices are following
cod in a downward trend, along with other substitute
white fish. Haddock prices, currently lower than cod, are
likely to catch up as haddock landings are not expected to
increase in the near future.
Seabass and seabreamWeak demand for seabass and seabream in key markets
and credit problems encouraged some producers to harvest
early, resulting in smaller sized fish reaching the markets.
This has implications for future supplies and may put upward
pressure on prices in 2013. This price pressure is in addition
Figure 6. Prices of seabass and seabream in Italy, origin Greece
Figure 5. CFR prices groundfish blocks (USA)
0.5
1.0
1.5
2.0
2.5
3.0
201320122011201020092008200720062005
Cod fillets
USD per lb.
Alaska Pollack filletsHake fillets
3
4
5
6
7
201320122011201020092008200720062005
Euro per kg.
Seabream Seabass
to normal price rises for seabass and seabream in spring and
early summer due to the natural growth cycle of the species.
Greece and Italy are integral players in the production and
distribution chain of seabass and seabream, and the current
economic climate in Southern Europe is squeezing credit
available to producers, importers and distributers. Under
these circumstances, Turkey has an opportunity to emerge
as a major supplier. Although import demand is growing
in Russia, the UK and the US, this has not been enough to
offset falling demand in traditional markets of Southern
Europe, and may lead farmers to cut future production.
CephalopodsThe lingering effects of the global economic crisis are
impacting sales of cephalopods in Europe, where imports

Foo
d O
utl
oo
k -
Jun
e 2
01
3FFoo
od
Ou
tlo
ok
- Ju
ne
2200
113
565
are down. Squid prices in Europe declined significantly
towards the end of 2012 and remain stagnant in 2013.
Squid prices in Japan remain stable, despite low inventories
of squid in cold storage. Octopus prices have stabilized
in the European and Japanese markets and this stability is
expected to continue. Cuttlefish prices in Japan remain
high.
PangasiusGlobal production of pangasius will most likely slow as
a result of problems facing Viet Nam, the world’s largest
producer, where the current market price is below farm
costs and falling ex-farm prices. Viet Nam has shifted
its policy from increasing farming areas to focusing on
more efficient and sustainable farm management. The
introduction of improved traceability systems should have a
positive long-term impact on Viet Nam’s exports. Pangasius
demand remains mixed, with slow import growth in the
Americas, stable imports in Asian markets and declining
imports in Europe. The latter is somewhat surprising, given
the competitive pricing of pangasius. However it could
indicate that the extreme focus on prices may have hurt the
image of the product.
TilapiaChina remains the world’s largest producer of tilapia
and the largest supplier to the European market. Tilapia
production continues to interest some countries in Africa,
Asia and Latin American for supplying emerging domestic
demand. European demand for freshwater fillets is
currently stable but expected to increase over time. US
imports of tilapia, especially frozen fillets, increased in 2012
after a low season in 2011, but dipped again slightly during
the first quarter of 2013. As the biggest market for Chinese
tilapia, the US absorbed 60 percent of Chinese exports in
2012. Availability of certified tilapia as of August 2012 is
projected to stimulate demand for tilapia fillets in European
and North American markets where consumer demand
for private certification of seafood products is on the rise.
As expected, seasonal Asian demand for tilapia peaked in
spring 2013 for Chinese Lunar New Year celebrations and
Lent celebrations in the Philippines.
SalmonDespite a 13 percent increase in farmed Atlantic and Pacific salmon production between 2011 and 2012,
salmon prices continue to recover from the very low levels
reached in 2011. Strong demand in the face of rising
salmon price implies a structural shift in consumer demand,
which is good news for salmon producers. Production is
expected to increase by only 2–3 percent in 2013, and Source: GLOBEFISH AN 12201*Estimate
Table 4. Production farmed salmon: World
2008 2009 2010 2011 2012* 2013*
(thousand tonnes)
ATLANTIC SALMON
Norway 743 863 955 990 1075 1050
Chile 389 233 135 200 310 330
UK 129 133 145 155 160 155
Canada 104 100 115 115 120 115
Faeroe Is. 39 51 45 52 60 60
Australia 25 30 31 31 31 31
Ireland 10 12 15 15 15 15
USA 17 14 17 16 16 15
Others 1 5 2 2 3 3
Total 1 457 1 441 1 460 1 576 1 790 1 774
PACIFIC SALMON
Japan 13 16 9 8 8 8
Chile 92 158 155 175 195 210
Canada 7 5 10 12 12 10
New Zealand 9 12 12 12 12 12
Total 121 191 186 207 227 240
Grand total 1 578 1 632 1 646 1 783 2 017 2 014
prices are expected to remain high. Some added supply is
foreseen for the second half of the year, but it will be less
than previously expected, due to production problems in
Chile and Norway.
Small pelagicsRecent changes in mackerel migratory patterns in the
waters of Iceland and Greenland have contributed to
ongoing disputes over quota allocations among Iceland, the
Faroe Islands, Norway and the EU. Recent negotiations to
regulate the South Pacific jack mackerel, the world’s largest
fishery, also failed. Major quota reductions anticipated in
2013 will lead to reduced supplies of mackerel and rising
prices. Fishmeal producers, expressing concern about
sustainability of the Peruvian anchovy fishery, are calling
for reduced quotas in 2013. Herring exports from Norway,
the main supplier of frozen herring and herring fillets,
fell 50 percent between 2010 and 2012. Expectations
of further reductions in herring supplies will put further
pressure on the already high prices.
Fishmeal and fish oilPressure on fishmeal prices remained strong in 2012
as a result of Latin American supply constraints in an El
Niño year coupled with strong demand in European and
especially Asian markets. Fishmeal prices reached high
levels not seen since the first quarter of 2010 and carried

Ma
rke
t asse
ssme
nts
MMaa
rke
t asse
ssme
nts
577
Source: IFFO*These figures refer only to IFFO member countries
Table 5. Production fishmeal: Selected countries
2007 2008 2009 2010 2011 2012
(thousand tonnes)
Peru/Chile 2120 2063 2039 1274 2160 1302
Denmark/Norway 317 302 274 345 256 114
Iceland 135 251 198 146 134 185
Total 2 572 2 616 2 511 1 855 2 607 1 691
Source: IFFO*These figures refer only to IFFO member countries
Table 6. Production fishoil: Selected countries
2007 2008 2009 2010 2011 2012
(thousand tonnes)
Peru/Chile 577 459 410 279 450 325
Denmark/Norway 74 93 79 116 92 39
Iceland 46 81 44 69 67 74
Total 697 633 532 471 612 444
over into the first quarter of 2013. Strong global demand
for animal feeds for terrestrial livestock helps support
fishmeal prices. Fish oil prices have climbed steadily since
February 2009 in response to strong growth in demand
for both high-value aquaculture and human consumption.
Despite the economic crisis, strong consumer demand for
carnivorous fish and shrimp continue to support fish oil
prices. Although human consumption of fish oil is small
as compared with aquaculture utilization, future growth
in direct human consumption of fish oils is expected to
contribute to rising fish oil demand. Coupled with weak
supplies in 2012, fish oil prices are expected to continue to
rise in 2013.
BivalvesScallop catch levels in the US for 2013 are expected to
drop by 30–35 percent, which could see prices rising in the
main import markets. In response to decreased US landings,
US imports of scallops from Peru are expected to increase
in 2013. China is emerging as the new leading market
for high-end shellfish products, with Chinese demand for
oysters and mussels growing as much as 20 percent per
year. Oyster prices are expected to remain strong in 2013,
after more than doubling over the last three years.
Figure 7. Oyster prices (Ireland/France)
1
2
3
4
5
20132012201120102009
Euro per kg.

SPEC
IAL
FEAT
URES
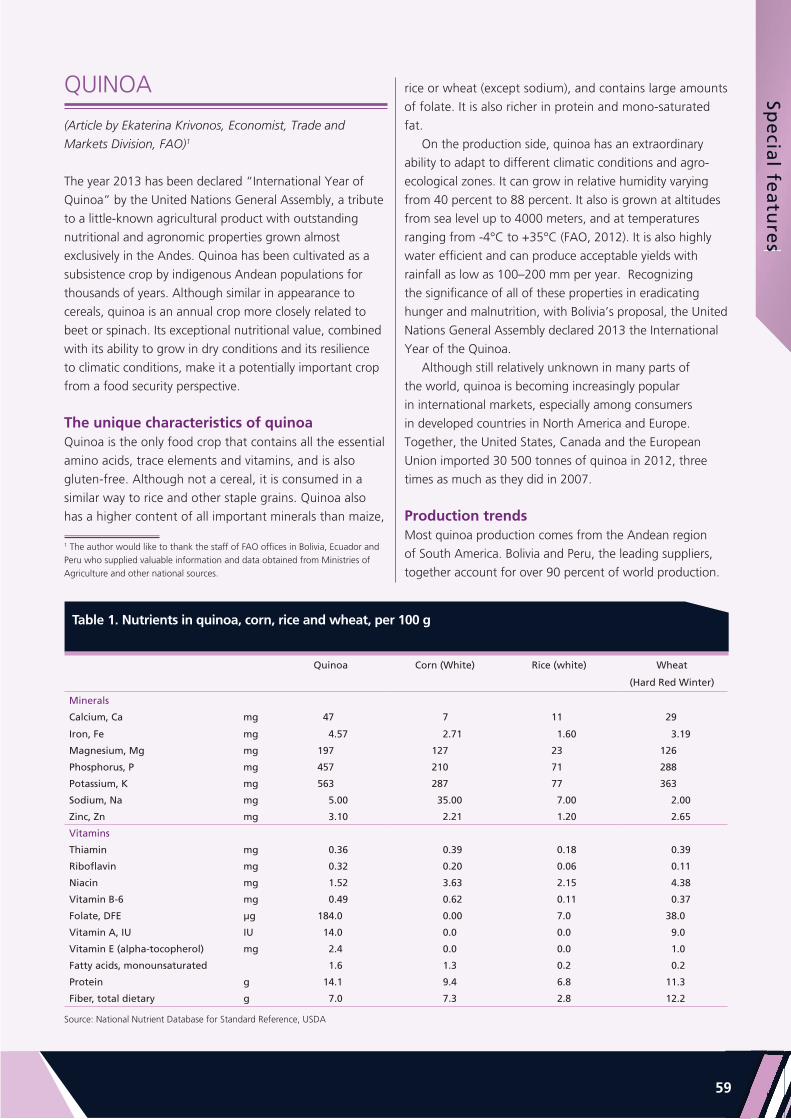
Spe
cial fe
atu
res
Spe
cial fe
atu
res
599
QUINOA
(Article by Ekaterina Krivonos, Economist, Trade and
Markets Division, FAO)1
The year 2013 has been declared “International Year of
Quinoa” by the United Nations General Assembly, a tribute
to a little-known agricultural product with outstanding
nutritional and agronomic properties grown almost
exclusively in the Andes. Quinoa has been cultivated as a
subsistence crop by indigenous Andean populations for
thousands of years. Although similar in appearance to
cereals, quinoa is an annual crop more closely related to
beet or spinach. Its exceptional nutritional value, combined
with its ability to grow in dry conditions and its resilience
to climatic conditions, make it a potentially important crop
from a food security perspective.
The unique characteristics of quinoa Quinoa is the only food crop that contains all the essential
amino acids, trace elements and vitamins, and is also
gluten-free. Although not a cereal, it is consumed in a
similar way to rice and other staple grains. Quinoa also
has a higher content of all important minerals than maize,
1 The author would like to thank the staff of FAO offices in Bolivia, Ecuador and Peru who supplied valuable information and data obtained from Ministries of Agriculture and other national sources.
rice or wheat (except sodium), and contains large amounts
of folate. It is also richer in protein and mono-saturated
fat.
On the production side, quinoa has an extraordinary
ability to adapt to different climatic conditions and agro-
ecological zones. It can grow in relative humidity varying
from 40 percent to 88 percent. It also is grown at altitudes
from sea level up to 4000 meters, and at temperatures
ranging from -4°C to +35°C (FAO, 2012). It is also highly
water efficient and can produce acceptable yields with
rainfall as low as 100–200 mm per year. Recognizing
the significance of all of these properties in eradicating
hunger and malnutrition, with Bolivia’s proposal, the United
Nations General Assembly declared 2013 the International
Year of the Quinoa.
Although still relatively unknown in many parts of
the world, quinoa is becoming increasingly popular
in international markets, especially among consumers
in developed countries in North America and Europe.
Together, the United States, Canada and the European
Union imported 30 500 tonnes of quinoa in 2012, three
times as much as they did in 2007.
Production trendsMost quinoa production comes from the Andean region
of South America. Bolivia and Peru, the leading suppliers,
together account for over 90 percent of world production.
Quinoa Corn (White) Rice (white) Wheat
(Hard Red Winter)
Minerals
Calcium, Ca mg 47 7 11 29
Iron, Fe mg 4.57 2.71 1.60 3.19
Magnesium, Mg mg 197 127 23 126
Phosphorus, P mg 457 210 71 288
Potassium, K mg 563 287 77 363
Sodium, Na mg 5.00 35.00 7.00 2.00
Zinc, Zn mg 3.10 2.21 1.20 2.65
Vitamins
Thiamin mg 0.36 0.39 0.18 0.39
Riboflavin mg 0.32 0.20 0.06 0.11
Niacin mg 1.52 3.63 2.15 4.38
Vitamin B-6 mg 0.49 0.62 0.11 0.37
Folate, DFE μg 184.0 0.00 7.0 38.0
Vitamin A, IU IU 14.0 0.0 0.0 9.0
Vitamin E (alpha-tocopherol) mg 2.4 0.0 0.0 1.0
Fatty acids, monounsaturated 1.6 1.3 0.2 0.2
Protein g 14.1 9.4 6.8 11.3
Fiber, total dietary g 7.0 7.3 2.8 12.2
Source: National Nutrient Database for Standard Reference, USDA
Table 1. Nutrients in quinoa, corn, rice and wheat, per 100 g

Foo
d O
utl
oo
k -
Jun
e 2
01
3Fo
od
Ou
tlo
ok
- Ju
ne
20
1133
606
Chile and Ecuador are also traditional producers, although
on a smaller scale. In recent years, quinoa cultivation has
expanded from South America to the United States and,
to a lesser extent, to Europe (Denmark, England, Germany,
Italy, France and Spain) and Africa (Kenya and Mali). In the
traditional producing areas, quinoa has been cultivated
mainly as a subsistence crop by the indigenous populations,
especially by women, who play a particularly important role
in its production and marketing.
Bolivia accounted for 45 percent of global quinoa
production in 2011. Production in the country has grown
steadily since the mid-1990s, with annual growth rates
averaging 4.5 percent between 1995 and 2011. According
to Bolivia’s Ministry of Rural Development and Land, the
country’s quinoa output expanded from 38 257 tonnes in
2011 to 50 566 tonnes in 2012, although this very high
estimate remains provisional, pending the collection of
hard data on areas planted. If confirmed, Bolivia would
have overtaken Peru as the major quinoa producer. Oruro
and Potosí, Bolivia’s main quinoa producing regions, each
produce a 40 percent share of the national quinoa output,
while La Paz produces the remaining 20 percent. Since
2011, Bolivia has exported approximately half of all the
quinoa it produces.
Peru’s quinoa production has expanded at more
than 7 percent per year since the mid-1990s. It was the
world’s leading quinoa producer from 1997 to 2011, and
accounted for 48 percent of global production in 2011.
In 2012, preliminary official estimates put production at
44 207 tonnes, which made the country slide to second
place behind Bolivia. Most quinoa in Peru is grown in the
southern highlands, particularly the Puno region, which
accounts for 80 percent of national output (Peru Ministry
of Agriculture, 2012) Although most Peruvian quinoa
is consumed in the domestic market, its exports have
grown steadily since 2007, accounting for 23.2 percent of
production in 2012.
In Chile, most of the crop is grown in the Tarapacá
region, under climatic conditions similar to the highlands of
Bolivia and Peru. Recently, production expanded to central
regions. The country’s production remains small, declining
from 1 448 tonnes in 2011 to an estimated 1 007 tonnes
in 2012. In Ecuador, Chimborazo Province accounts for
70–80 percent of total output. The volume of Ecuador’s
quinoa production was estimated at a modest 712 tonnes
in 2012.
The United States and a few countries in Europe,
Asia and Africa have taken up quinoa cultivation in recent
years. In the United States, the crop has been grown on a
small scale since the mid-1980s, principally in the Colorado
Rockies, but now expanding to the western states of
California, Oregon, Nevada and Washington, albeit in small
volumes. In absence of official data, quinoa output in the
country has been gauged at some 3 000 tonnes per year
(FAO, 2011). Other emerging producers include Australia,
Canada, China, Denmark, Italy, India, Kenya, Morocco and
the Netherlands. These countries are already producing
quinoa or carrying out research and agronomic trials to
establish commercial production of the crop (FAO, 2012).
Crop prospects in 2013 and beyondIn Bolivia, current estimates by the Ministry of Rural
Development and Land show the area planted with
quinoa in recent years has increased dramatically – from
64 789 ha in the 2010/11 season (the last year for which
official figures by the National Statistics Institute of Bolivia
are available) to 104 365 ha in 2012/13 – a 61 percent
increase over two years. Given the expansion in sown area,
the Bolivian government expects quinoa production to
increase from 50 566 tonnes in 2012 to 58 040 tonnes in
2013. However, given a lack of firm area and production
estimates from remote sensing or other crop monitoring
methods, the numbers for 2012 and 2013 are still
tentative. Peru reported planting 45 323 ha with quinoa in
the 2012/13 season, 8.1 percent above the previous year.
Assuming no changes in yields, the 2013 crop could reach
47 772 tonnes.
Given the nutritional value and strong export potential
of quinoa, the governments of the main quinoa producing
countries in the Andean region have made development
of the sector national priorities, with several announcing
strategic plans and investment programmes for quinoa. For
Figure 1. Quinoa production in Peru and Bolivia, 1992-2012
Sources: INE (Bolivia), Ministry of Rural Development and Land (Bolivia) and Ministry of Agriculture (Peru).
0
20
40
60
1210080604020098969492estim.
Thousand tonnes
Bolivia Peru
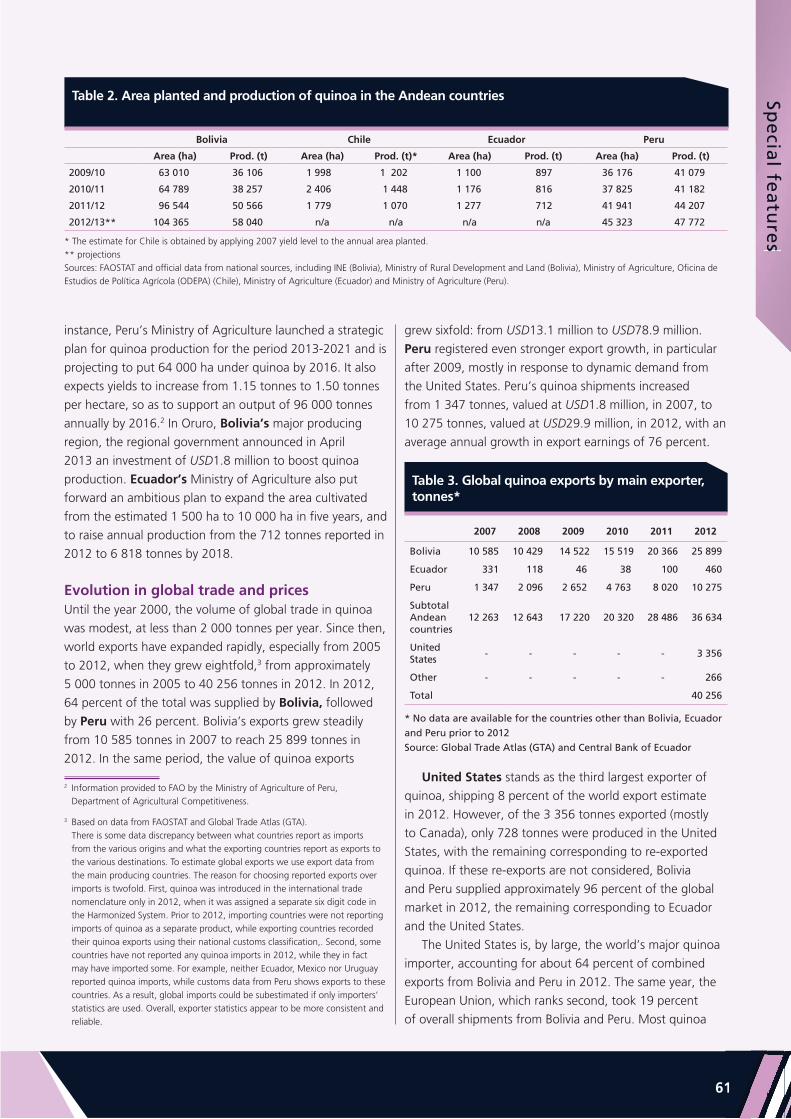
Spe
cial fe
atu
res
Spe
cial fe
atu
res
611
instance, Peru’s Ministry of Agriculture launched a strategic
plan for quinoa production for the period 2013-2021 and is
projecting to put 64 000 ha under quinoa by 2016. It also
expects yields to increase from 1.15 tonnes to 1.50 tonnes
per hectare, so as to support an output of 96 000 tonnes
annually by 2016.2 In Oruro, Bolivia’s major producing
region, the regional government announced in April
2013 an investment of USD1.8 million to boost quinoa
production. Ecuador’s Ministry of Agriculture also put
forward an ambitious plan to expand the area cultivated
from the estimated 1 500 ha to 10 000 ha in five years, and
to raise annual production from the 712 tonnes reported in
2012 to 6 818 tonnes by 2018.
Evolution in global trade and pricesUntil the year 2000, the volume of global trade in quinoa
was modest, at less than 2 000 tonnes per year. Since then,
world exports have expanded rapidly, especially from 2005
to 2012, when they grew eightfold,3 from approximately
5 000 tonnes in 2005 to 40 256 tonnes in 2012. In 2012,
64 percent of the total was supplied by Bolivia, followed
by Peru with 26 percent. Bolivia’s exports grew steadily
from 10 585 tonnes in 2007 to reach 25 899 tonnes in
2012. In the same period, the value of quinoa exports
2 Information provided to FAO by the Ministry of Agriculture of Peru, Department of Agricultural Competitiveness.
3 Based on data from FAOSTAT and Global Trade Atlas (GTA). There is some data discrepancy between what countries report as imports from the various origins and what the exporting countries report as exports to the various destinations. To estimate global exports we use export data from the main producing countries. The reason for choosing reported exports over imports is twofold. First, quinoa was introduced in the international trade nomenclature only in 2012, when it was assigned a separate six digit code in the Harmonized System. Prior to 2012, importing countries were not reporting imports of quinoa as a separate product, while exporting countries recorded their quinoa exports using their national customs classification,. Second, some countries have not reported any quinoa imports in 2012, while they in fact may have imported some. For example, neither Ecuador, Mexico nor Uruguay reported quinoa imports, while customs data from Peru shows exports to these countries. As a result, global imports could be subestimated if only importers’ statistics are used. Overall, exporter statistics appear to be more consistent and reliable.
grew sixfold: from USD13.1 million to USD78.9 million.
Peru registered even stronger export growth, in particular
after 2009, mostly in response to dynamic demand from
the United States. Peru’s quinoa shipments increased
from 1 347 tonnes, valued at USD1.8 million, in 2007, to
10 275 tonnes, valued at USD29.9 million, in 2012, with an
average annual growth in export earnings of 76 percent.
United States stands as the third largest exporter of
quinoa, shipping 8 percent of the world export estimate
in 2012. However, of the 3 356 tonnes exported (mostly
to Canada), only 728 tonnes were produced in the United
States, with the remaining corresponding to re-exported
quinoa. If these re-exports are not considered, Bolivia
and Peru supplied approximately 96 percent of the global
market in 2012, the remaining corresponding to Ecuador
and the United States.
The United States is, by large, the world’s major quinoa
importer, accounting for about 64 percent of combined
exports from Bolivia and Peru in 2012. The same year, the
European Union, which ranks second, took 19 percent
of overall shipments from Bolivia and Peru. Most quinoa
Bolivia Chile Ecuador Peru
Area (ha) Prod. (t) Area (ha) Prod. (t)* Area (ha) Prod. (t) Area (ha) Prod. (t)
2009/10 63 010 36 106 1 998 1 202 1 100 897 36 176 41 079
2010/11 64 789 38 257 2 406 1 448 1 176 816 37 825 41 182
2011/12 96 544 50 566 1 779 1 070 1 277 712 41 941 44 207
2012/13** 104 365 58 040 n/a n/a n/a n/a 45 323 47 772
* The estimate for Chile is obtained by applying 2007 yield level to the annual area planted. ** projectionsSources: FAOSTAT and official data from national sources, including INE (Bolivia), Ministry of Rural Development and Land (Bolivia), Ministry of Agriculture, Oficina de Estudios de Política Agrícola (ODEPA) (Chile), Ministry of Agriculture (Ecuador) and Ministry of Agriculture (Peru).
Table 2. Area planted and production of quinoa in the Andean countries
2007 2008 2009 2010 2011 2012
Bolivia 10 585 10 429 14 522 15 519 20 366 25 899
Ecuador 331 118 46 38 100 460
Peru 1 347 2 096 2 652 4 763 8 020 10 275
Subtotal Andean countries
12 263 12 643 17 220 20 320 28 486 36 634
United States
- - - - - 3 356
Other - - - - - 266
Total 40 256
Table 3. Global quinoa exports by main exporter, tonnes*
* No data are available for the countries other than Bolivia, Ecuador and Peru prior to 2012Source: Global Trade Atlas (GTA) and Central Bank of Ecuador
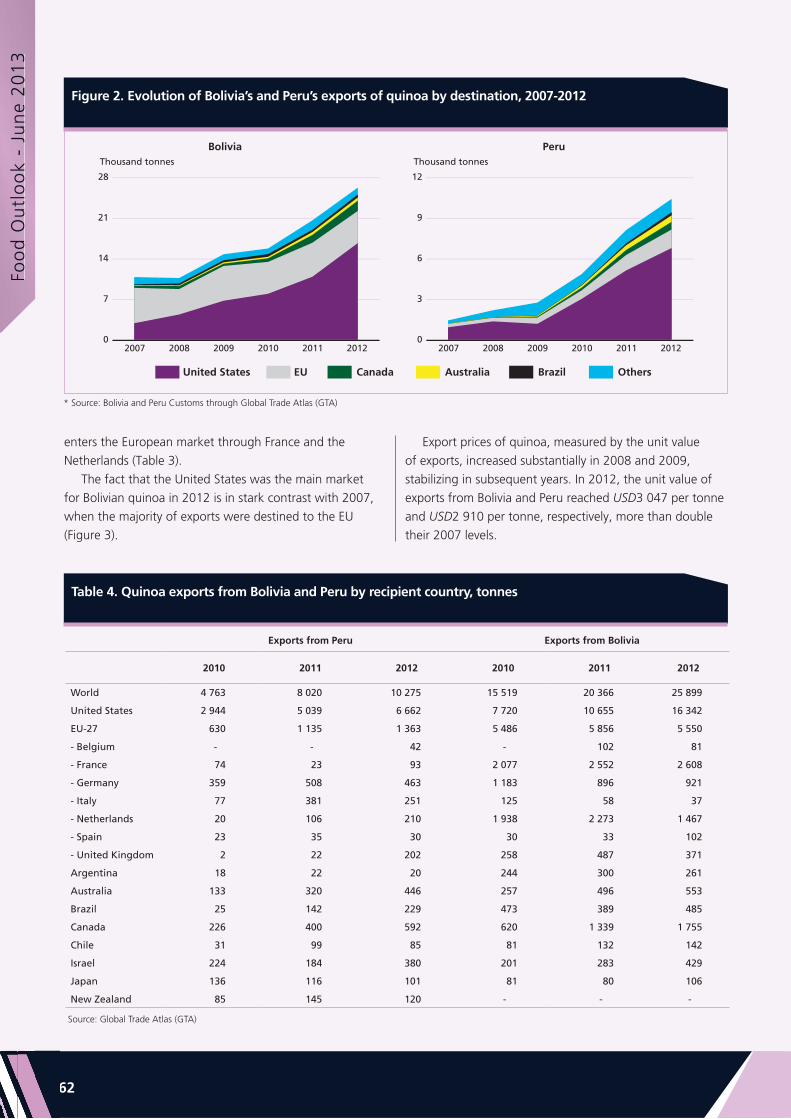
Foo
d O
utl
oo
k -
Jun
e 2
01
3Fo
od
Ou
tlo
ok
- Ju
ne
20
1133
626
enters the European market through France and the
Netherlands (Table 3).
The fact that the United States was the main market
for Bolivian quinoa in 2012 is in stark contrast with 2007,
when the majority of exports were destined to the EU
(Figure 3).
Export prices of quinoa, measured by the unit value
of exports, increased substantially in 2008 and 2009,
stabilizing in subsequent years. In 2012, the unit value of
exports from Bolivia and Peru reached USD3 047 per tonne
and USD2 910 per tonne, respectively, more than double
their 2007 levels.
Figure 2. Evolution of Bolivia’s and Peru’s exports of quinoa by destination, 2007-2012
* Source: Bolivia and Peru Customs through Global Trade Atlas (GTA)
Table 4. Quinoa exports from Bolivia and Peru by recipient country, tonnes
Exports from Peru Exports from Bolivia
2010 2011 2012 2010 2011 2012
World 4 763 8 020 10 275 15 519 20 366 25 899
United States 2 944 5 039 6 662 7 720 10 655 16 342
EU-27 630 1 135 1 363 5 486 5 856 5 550
- Belgium - - 42 - 102 81
- France 74 23 93 2 077 2 552 2 608
- Germany 359 508 463 1 183 896 921
- Italy 77 381 251 125 58 37
- Netherlands 20 106 210 1 938 2 273 1 467
- Spain 23 35 30 30 33 102
- United Kingdom 2 22 202 258 487 371
Argentina 18 22 20 244 300 261
Australia 133 320 446 257 496 553
Brazil 25 142 229 473 389 485
Canada 226 400 592 620 1 339 1 755
Chile 31 99 85 81 132 142
Israel 224 184 380 201 283 429
Japan 136 116 101 81 80 106
New Zealand 85 145 120 - - -
Source: Global Trade Atlas (GTA)
0
7
14
21
28
2012201120102009200820070
3
6
9
12
201220112010200920082007
Thousand tonnes
Bolivia
United States
PeruThousand tonnes
EU Canada Australia Brazil Others

Spe
cial fe
atu
res
Spe
cial fe
atu
res
633
Consumption in Bolivia and PeruIn the Andean countries, most quinoa was traditionally
consumed domestically and, for the most part, within the
locations where it was produced. However, with exports
from both Bolivia and Peru growing vigorously, the share
of production that is exported has increased dramatically in
the past five years – in Peru from only 4.2 percent in 2007
to 23.2 percent in 2012 and, in Bolivia, from 37.5 percent
to 51.2 percent in the same period.
Notwithstanding the dynamic production growth, the
fast pace of exports has meant domestic availabilities have
fallen in Bolivia and Peru since the mid-2000s. In Bolivia,
total consumption, calculated as production net of exports,
is estimated to have dropped from 22 000 tonnes in 2005
to 17 600 tonnes in 2007, translating into a falling per
capita intake from 2.4 kg to 1.9 kg over the period. From
2007 to 2010, aggregate consumption appears to have
rebounded, reaching 20 600 tonnes in 2010, equivalent
to 2.1 kg per person, per year, but falling again in 2011
to 1.8 kg per person, per year. If the current production
estimate for 2012 is confirmed, per capita consumption in
Bolivia would have recovered to some 2.4 kg, although still
less than the 2.6 kg consumed in 2005. In Peru, domestic
availabilities could only be estimated from 2006. Based
on the data available, consumption per capita has been
relatively low, fluctuating around 1.0–1.2 kg between 2006
and 2011.
Emerging issuesAs quinoa production and trade systems are undergoing
profound changes, reflecting a shift from a traditional
crop, primarily produced for own consumption, to
a globally traded commodity, several issues have
emerged that require attention. First is the question of
whether traditional quinoa producers will remain the
main beneficiaries of the crop’s growing popularity in
the coming years. There are at least 130 000 small-
scale quinoa growers in South America (FAO, 2012),
The majority belong to poor households, with women
directly involved in the crop production, processing
and marketing. In Bolivia, some 55 000 farmers
produce quinoa on an irregular basis, primarily for their
own consumption, 13 000 farmers produce quinoa
permanently for their own consumption and for the
market, and 2 000 farmers produce quinoa mainly for
the market (FAO, 2011). In Peru, quinoa is grown by
approximately 60 000 small producers, who are mostly
subsistence farmers. These farmers are deeply affected
by the swift changes in global supply and demand for
quinoa, and generally lack the instruments to respond to
the challenges and opportunities arising from the growing
Figure 3. Share of quinoa exports from Bolivia to US and EU-27
Source: Bolivia Customs through Global Trade Atlas (GTA)
Source: FAOSTAT, Global Trade Atlas (GTA), TradeMap, and WDINote: Peru’s quinoa trade datais only available from 2006.
Figure 4. Unit values of quinoa exports from Bolivia and Peru
Source: Bolivia and Peru Customs through Global Trade Atlas (GTA)
0
1000
2000
3000
4000
201220112010200920082007
Peru
Bolivia
USD per kg.
Figure 5. Annual per capita consumption of quinoa in Bolivia and Peru
0.5
1.0
1.5
2.0
2.5
3.0
111009080706050403020100
Kg. per year
Bolivia Peru
0
20
40
60
80
201220112010200920082007
United States
European Union
Percent

Foo
d O
utl
oo
k -
Jun
e 2
01
3Fo
od
Ou
tlo
ok
- Ju
ne
20
1133
646
world demand. Thus, while quinoa is still produced mostly
by smallholder farmers in the Andean countries, this might
change rapidly in the future, as many commercial farms
in the Andean countries and elsewhere are responding to
the surge of demand and investing in the crop. Therefore,
the question arises as to whether smallholder farmers
will continue to dominate the quinoa market or will face
increasing competition from larger commercial farms, with
the risk of becoming marginalized.
A second concern has to do with the level of prices that
quinoa producers may receive over the medium term. Since
the mid-2000s, the strong growth in revenues generated
by quinoa exports has benefitted the economies in the
producing countries as a whole, as well as traditional quinoa
growers, who have seen producer prices rise rapidly. For
instance, in Peru, producer prices doubled in real terms from
2008 to 2009, reaching Nuevo Sol 3.10 (approximately
USD1.1) per kg in 2011, while the export unit price was
USD3.2 per kg – meaning that Peruvian producers captured
approximately one-third of the export price. So far, strong
world import demand and the relatively thin supplies
available for trade have defined the quinoa market as a
“seller” market. As a result, producers hold significant
power in the transactions, able to reap better prices from
the exporting agents. With production expanding, this state
of play may change rapidly, which could eventually trim
much of the benefits currently reaped by Andean quinoa
producers.
From the government policy perspective, it will be
important in the coming years to guide and support the
process of reorientation of the sector from a traditional,
subsistence crop to an export-oriented cash product, so as
to ensure that quinoa growers and their families benefit
from the dynamic world demand. Additional measures are
needed to help smallholder farmers realize the commercial
potential of their product by encouraging joint marketing
actions through producer organizations, providing technical
assistance and market information, and ensuring fair
competition within marketing channels.
A final concern relates to the possible negative impacts
of surging local prices on the nutritional status of the
indigenous Andean populations. Because producer prices
have increased along with export prices, poor households
have been enticed to replace quinoa with less expensive, but
nutritionally inferior, food products, such as bread, pasta or
rice. For instance, in Bolivia, the nominal quinoa retail prices
in Oruro, one of the main producing regions, increased by
80 percent from April 2008 to April 2009 and remained at
Bs 22 (USD3.1) per kg until September 2012. From then
on, domestic prices increased further and reached Bs 24
in January 2013. By then, producers received Bs 8 per kg,
which was one-third of the price paid by consumers. By
March 2013, the quinoa retail price stood at Bs 27 per kg,
more than double its level in April 2008. During the same
period, the price of bread remained unchanged and the price
of rice actually declined by over 10 percent.4 The change in
the relative food prices is very likely to have prompted most
households to cut quinoa intake (either by selling more of
4 Source: INE, Bolivia (http://www.ine.gob.bo/ipc/ipcprecios.aspx)
Figure 6. Annual quinoa producer prices at farm-gate in Peru, nuevo soles/kg, 2000-2011, in real terms (2005=100)
Source: Ministry of Agriculture of Peru: http://frenteweb.minag.gob.pe/sisca/?mod=consulta_cult
Figure 7. Consumer and producer price of quinoa in Bolivia, Bs/kg in real terms (2007=100)
Note: Consumer prices are the prices in the town of Oruro. Producer prices are the prices in the Challapata market. Both locations are in Oruro Province.Source: INE, Bolivia and Fundación Valles / Servicio de Información y Análisis de Mercados
1.0
1.5
2.0
2.5
3.0
3.5
111009080706050403020100
Nuevo soles per kg.
0
5
10
15
20
25
201320122011201020092008
Producer price Consumer price
Bs per kg.

Spe
cial fe
atu
res
Spe
cial fe
atu
res
655
their production or buying less from the market) in favour of
these other basic food products.
However, the implications of such consumption shift for
the food and nutrition security of the indigenous Andean
populations are not necessarily negative, as they depend
on the relative importance of quinoa in their diets, the
revenues generated by quinoa’s sales and how the farmers
spend any additional income.
For example, looking at the relative importance of
quinoa in the Bolivian diet, Oruro is the only Bolivian
province that considers quinoa in the calculation of the
Consumer Price Index (CPI). As such, the crop is assigned a
weight of only 0.6 percent in the food CPI, compared with
13.2 percent for bread and 6.4 percent for rice. However,
rather than an actual low contribution of quinoa to the
diet, this low weight probably reflects the fact that most
of the quinoa consumed is produced by the household
itself with little purchased from the market. On the other
hand, at the national level, quinoa per capita consumption
in Bolivia is estimated at about 2 kg per year, highlighting
the relatively low importance of the crop for the average
Bolivian and suggesting that, on the aggregate, the
nutritional effects of substitution of other food for quinoa
might have been limited.
This does not exclude the possibility that specific
population groups in the Altiplano, where quinoa is an
important part of the local diet, may have suffered from
the dietary shift. Thus, although most quinoa smallholder
farmers have likely benefited from the expansion in trade
and rising producer prices, the longer term implications
of switching towards nutritionally inferior foods remains
a public policy concern and a topic under investigation by
various national and international organizations.
OutlookQuinoa is still a relatively new product in the international
markets, with vast potential for production and trade
expansion. World demand is expected to keep growing
vigorously in the coming years, driven primarily by
developed countries, where expenditure on healthier and
natural foods is on an upward trend. In other parts of
the world, there is interesting potential for introducing
quinoa as a new crop, given its resilience and low water
requirements, and several governments have expressed
interest in exploring this option.
In the future, quinoa could play a more important
role in the global food system, given its adaptability to
different agro-ecological regions and superior nutritional
qualities. However, in the short term, the high price of this
product, which has thus far catered to the niche market of
health-conscious consumers in high-income countries, will
preclude the expansion of consumption in poor countries.
Given the current export price of over USD3 000 per
tonne, quinoa cannot compete with other food crops such
as rice, which is quoted approximately five times lower
on international markets. In the short run, the growing
consumption in developed countries will continue to be
satisfied by exports from Bolivia and Peru. In the longer
term, productivity increases are expected to take place
not only in the Andean producing countries but also in
the new producing areas, where investments are being
made to cultivate the crop for commercial purposes. The
current plans to expand quinoa production are expected
to translate into much larger world supplies and declining
prices at the producer, consumer and international levels,
which may alter the current dynamics driving the crop.
However, it remains to be seen whether quinoa will ever
become a major and world-wide staple.
References:FAO (2011) “Quinoa: An ancient crop to contribute to
world food security”, FAO Regional Office for Latin
America and the Caribbean, July 2011
http://www.fao.org/alc/file/media/pubs/2011/cultivo_
quinua_en.pdf
FAO (2012) “Celebrating the International Year of Quinoa:
A future Sown Thousands of Years Ago”, Concept
Note, Bioversity and FAO, June 2012
Peru Ministry of Agriculture (2012)
http://agroaldia.minag.gob.pe/biblioteca/download/pdf/
manuales-boletines/quinua/quinua2012.pdf

Foo
d O
utl
oo
k -
Jun
e 2
01
3Fo
od
Ou
tlo
ok
- Ju
ne
20
1133
666
COMMODITY HEDGE FUNDS IN RETREAT?
(Article by Ann Berg, Senior Commodity Analyst)
Once admired for turning profits year after year by riding
the ups and downs of market waves, commodity hedge
funds, it seems, have lost their momentum. For two
years in a row, after enjoying double digit returns as
high as 40 percent, commodity hedge funds have shown
negative results. According to Newedge Index tracking
fund, commodity hedge funds, including those focused
in agriculture, registered slightly negative returns in 2011
and, in 2012, those returns fell to minus 3.7 percent. Poor
performance led investors to withdraw 20 percent of their
moneys from these funds last year.
Commodity hedge funds have existed since 1979, when
the Commodity Futures Trading Commission (CFTC), the
US regulator charged with overseeing all futures trading,
required funds to register as either Commodity Trading
Advisors or Commodity Pool Operators. These funds
solicited customer moneys to trade in the US futures
markets, using a variety of bullish or bearish strategies with
the sole aim of maximizing returns for themselves and their
customers. However, up until 2000, these funds were slow
to take off.
The investment public generally viewed commodity
futures trading as volatile and risky, and suspected that
the trading pits in Chicago or New York City, then the
dominant global futures trading centers, were biased in
favor of the exchange members. After all, throughout
the 1980s and 1990s, these exchanges maintained their
original non-profit membership structure, and upheld a
mission of “enhancing membership opportunity”.
Market manipulation was also a recurrent theme. In
1976, a default on the potato contract at the New York
Mercantile Exchange ended with CFTC charging both longs
and shorts with manipulation. Three years later, perceived
“corners” in the silver and wheat markets at the largest
exchange, the Chicago Board of Trade (CBOT), prompted
both the exchange and the CFTC to declare emergencies.
In 1989, when a large exporter took ownership of virtually
all of the soybeans in the Chicago and Toledo delivery
houses, causing soybean futures to soar, the CFTC revoked
the exporter’s hedge status. The CBOT acted by declaring
an emergency and ordered traders holding positions in July
soybeans to trade for “liquidation only.”1 The subsequent
1 Trade for liquidation means that traders cannot initiate new positions in a particular futures contract and must sell any existing long positions or conversely buy back any existing short positions.
price collapse resulted in years of recriminations.
Farmers staged tractor protests around the famed CBOT
building and lodged several lawsuits against the trading
establishment over a ten-year period.
From 2000 onwards, a cascade of events transformed
commodities futures trading from an arcane business into
a mainstream activity. Legislative events in the US were
pivotal in this transformation: in 2000, the US Congress
passed the Commodity Futures Modernization Act and
the Graham, Leach, Bliley Act. The former exempted the
over-the-counter [OTC] market and energy futures, such
as crude oil, from CFTC oversight. The latter repealed the
Depression-era Glass-Steagall Act, dissolving the barriers
that had separated banking, insurance and brokering for
70 years. These two acts unleashed a flood of new players
and money into the commodity futures arena and created
pressure on the CBOT, then the primary agricultural
exchange, to raise the speculative limits on its grain and
oilseed contracts. Once restricted to 600 contracts (75 000
MT), these limits grew geometrically to as high as 22 000
contracts [2.8 million MT] by the middle of the decade.
When two renowned academics, Gary Gorton and
Geert Rouwenhorst, wrote “Facts and Fantasies about
Commodity Futures” in 2004, asserting that commodity
futures were a distinct asset class and largely uncorrelated
with equity markets, they turned commodity futures into
an irresistible money magnet. Commodity index funds
and similar vehicles such as commodity-based exchange
traded funds (ETFs) attracted enormous investment
interest. Commodity futures prices became a daily staple
of financial news programmes, their prices streaming
across the televised banners alongside equity prices. Unlike
commodity hedge funds, the index funds and ETFs, defined
as securities offerings, allowed for passive ownership of
a basket of commodities by tracking the prices of the
underlying futures contracts. Interest in commodities
prices spread globally. The German-based Deutsche Bank
launched a purely agricultural ETF in 2006, which today
is the largest agricultural fund by market capitalization.
No longer considered a form of gambling, commodity
futures had achieved worthy status as a means for portfolio
diversification.
Electronic trading rapidly deposed face-to-face pit
trading throughout the 2000s, spurring an unprecedented
increase in trade volumes. Instantaneous trade
confirmations replaced the relay system of floor runners
shuttling between pit broker and floor booth, which had
sometimes delayed transaction reporting by an hour.
Trading firms hired mathematicians to write algorithmic
programmes that could trade without human intervention
and arbitrage small price anomalies within milliseconds.
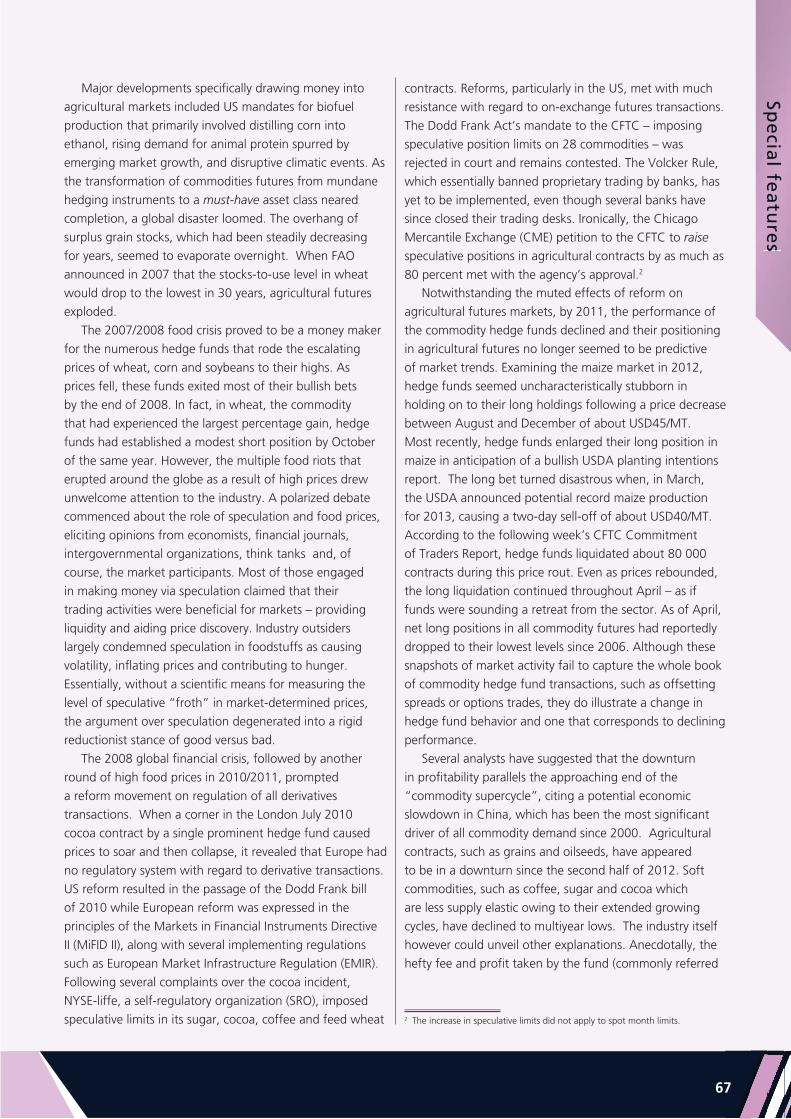
Spe
cial fe
atu
res
Spe
cial fe
atu
res
677
Major developments specifically drawing money into
agricultural markets included US mandates for biofuel
production that primarily involved distilling corn into
ethanol, rising demand for animal protein spurred by
emerging market growth, and disruptive climatic events. As
the transformation of commodities futures from mundane
hedging instruments to a must-have asset class neared
completion, a global disaster loomed. The overhang of
surplus grain stocks, which had been steadily decreasing
for years, seemed to evaporate overnight. When FAO
announced in 2007 that the stocks-to-use level in wheat
would drop to the lowest in 30 years, agricultural futures
exploded.
The 2007/2008 food crisis proved to be a money maker
for the numerous hedge funds that rode the escalating
prices of wheat, corn and soybeans to their highs. As
prices fell, these funds exited most of their bullish bets
by the end of 2008. In fact, in wheat, the commodity
that had experienced the largest percentage gain, hedge
funds had established a modest short position by October
of the same year. However, the multiple food riots that
erupted around the globe as a result of high prices drew
unwelcome attention to the industry. A polarized debate
commenced about the role of speculation and food prices,
eliciting opinions from economists, financial journals,
intergovernmental organizations, think tanks and, of
course, the market participants. Most of those engaged
in making money via speculation claimed that their
trading activities were beneficial for markets – providing
liquidity and aiding price discovery. Industry outsiders
largely condemned speculation in foodstuffs as causing
volatility, inflating prices and contributing to hunger.
Essentially, without a scientific means for measuring the
level of speculative “froth” in market-determined prices,
the argument over speculation degenerated into a rigid
reductionist stance of good versus bad.
The 2008 global financial crisis, followed by another
round of high food prices in 2010/2011, prompted
a reform movement on regulation of all derivatives
transactions. When a corner in the London July 2010
cocoa contract by a single prominent hedge fund caused
prices to soar and then collapse, it revealed that Europe had
no regulatory system with regard to derivative transactions.
US reform resulted in the passage of the Dodd Frank bill
of 2010 while European reform was expressed in the
principles of the Markets in Financial Instruments Directive
II (MiFID II), along with several implementing regulations
such as European Market Infrastructure Regulation (EMIR).
Following several complaints over the cocoa incident,
NYSE-liffe, a self-regulatory organization (SRO), imposed
speculative limits in its sugar, cocoa, coffee and feed wheat
contracts. Reforms, particularly in the US, met with much
resistance with regard to on-exchange futures transactions.
The Dodd Frank Act’s mandate to the CFTC – imposing
speculative position limits on 28 commodities – was
rejected in court and remains contested. The Volcker Rule,
which essentially banned proprietary trading by banks, has
yet to be implemented, even though several banks have
since closed their trading desks. Ironically, the Chicago
Mercantile Exchange (CME) petition to the CFTC to raise
speculative positions in agricultural contracts by as much as
80 percent met with the agency’s approval.2
Notwithstanding the muted effects of reform on
agricultural futures markets, by 2011, the performance of
the commodity hedge funds declined and their positioning
in agricultural futures no longer seemed to be predictive
of market trends. Examining the maize market in 2012,
hedge funds seemed uncharacteristically stubborn in
holding on to their long holdings following a price decrease
between August and December of about USD45/MT.
Most recently, hedge funds enlarged their long position in
maize in anticipation of a bullish USDA planting intentions
report. The long bet turned disastrous when, in March,
the USDA announced potential record maize production
for 2013, causing a two-day sell-off of about USD40/MT.
According to the following week’s CFTC Commitment
of Traders Report, hedge funds liquidated about 80 000
contracts during this price rout. Even as prices rebounded,
the long liquidation continued throughout April – as if
funds were sounding a retreat from the sector. As of April,
net long positions in all commodity futures had reportedly
dropped to their lowest levels since 2006. Although these
snapshots of market activity fail to capture the whole book
of commodity hedge fund transactions, such as offsetting
spreads or options trades, they do illustrate a change in
hedge fund behavior and one that corresponds to declining
performance.
Several analysts have suggested that the downturn
in profitability parallels the approaching end of the
“commodity supercycle”, citing a potential economic
slowdown in China, which has been the most significant
driver of all commodity demand since 2000. Agricultural
contracts, such as grains and oilseeds, have appeared
to be in a downturn since the second half of 2012. Soft
commodities, such as coffee, sugar and cocoa which
are less supply elastic owing to their extended growing
cycles, have declined to multiyear lows. The industry itself
however could unveil other explanations. Anecdotally, the
hefty fee and profit taken by the fund (commonly referred
2 The increase in speculative limits did not apply to spot month limits.

Foo
d O
utl
oo
k -
Jun
e 2
01
3Fo
od
Ou
tlo
ok
- Ju
ne
20
1133
686
to as “2 and 20”3) have soured customers who, besides
paying annual fees, now find themselves saddled with
100 percent of the losses. Indeed, this trend is visible in
the commodity index fund investment data which shows
a 20 percent drawdown since April 2011, mirroring the
level of withdrawal from hedge funds. Also, sophisticated
algorithmic programmes, which were once uncommon and
highly profitable, have now saturated the system. These
programmes, especially those specializing in arbitraging
market anomalies, might have been instrumental in
reducing the level of price volatility. High volatility –
peaking at 80 during the food crisis five years ago but
declining to levels around 12–20 for most of the past
year and a half – was most likely a significant factor in
commodity hedge fund success in years past. As with most
mature businesses, commodity hedge funds are finding
profitability harder to come by. Finally, the sobering truth
about the nature of commodity futures may have re-
emerged: they are not investments at all but risk-shifting
instruments, always generating a loss for every gain.
3 “2 and 20” refers to an annual management fee of 2 percent and the fund’s share of the accrued profits of 20 percent.
Hedge funds beat retreat in face of market turmoil
Maize futures
240
250
260
270
280
290
300
March 2013 April 2013 May 2013
USD
per
to
nn
e
Max
Min
Close
50
100
150
200
250
07302316090226191205
March2013
Maize managed money (net positions)
April2013
May2013
Tho
usa
nd
co
ntr
acts

6969

MA
JOR
POLI
CY
DEV
ELO
PMEN
TS
MAR
KET
POLIC
Y
DEVE
LOPM
ENTS

Ma
jor p
olicy d
eve
lop
me
nts
Ma
jor p
olicy d
eve
lop
me
nts
711
GRA
INS:
M
AJO
R PO
LICY
DEV
ELO
PMEN
TS: M
ID-O
CTO
BER
2012
- M
ID M
AY
201
3*
CO
UN
TRY
PRO
DU
CT
DA
TEPO
LIC
Y C
ATE
GO
RY
/INST
RU
MEN
TD
ESC
RIP
TIO
N
Arg
enti
na
Mai
zeFe
b-1
3Ex
po
rt q
uo
taA
uth
ori
zed
exp
ort
of
3 m
illio
n t
on
nes
of
mai
ze in
ad
dit
ion
to
15
mill
ion
to
nn
es a
lrea
dy
gra
nte
d.
Wh
eat
Mar
-13
Exp
ort
qu
ota
Au
tho
rize
d 5
mill
ion
to
nn
es o
f w
hea
t ex
po
rt f
rom
th
e 20
13/1
4 cr
op
. In
ad
dit
ion
, ap
pro
ved
exp
ort
of
1 m
illio
n t
on
nes
of
old
cro
p w
hea
t, b
rin
gin
g t
he
tota
l allo
wed
to
3 m
illio
n t
on
nes
, hal
f o
f w
hat
was
o
rig
inal
ly a
gre
ed, d
ue
to lo
w s
up
plie
s.
Mai
zeA
pr-
13Ex
po
rt q
uo
taA
pp
rove
d a
dd
itio
nal
exp
ort
s o
f 4.
4 m
illio
n t
on
nes
of
mai
ze f
rom
201
2/13
cro
p.
Wh
eat
May
-13
Fin
ance
an
d c
red
it f
acili
ties
Pro
vid
e p
rod
uce
rs a
ref
un
d o
f U
SD 3
0 p
er t
on
ne
of
exp
ort
ed w
hea
t.
Arg
enti
na/
Bra
zil/U
nit
ed
Stat
es o
f A
mer
ica
Mai
zeM
ay-1
3Tr
ade
allia
nce
Form
ed a
n a
llian
ce o
f m
aize
pro
du
cers
, co
llect
ivel
y ca
lled
MA
IZA
LL.
Ban
gla
des
hW
hea
tM
ar-1
3Pr
ocu
rem
ent
pri
ceIn
crea
sed
pro
cure
men
t p
rice
of
wh
eat
by
4 p
erce
nt
to B
DT
25 (
USD
0.3
2) p
er k
g, a
nd
set
go
vern
men
t p
rocu
rem
ent
at 1
50 0
00 t
on
nes
fo
r th
e cu
rren
t ye
ar.
Bra
zil
Wh
eat
Feb
-13
Imp
ort
du
ty
Exem
pte
d 1
mill
ion
to
nn
es o
f w
hea
t fr
om
no
n-M
erco
sur
ori
gin
s fr
om
th
e 10
per
cen
t im
po
rt d
uty
b
etw
een
Ap
ril a
nd
Ju
ly 2
013.
Wh
eat
Ap
r-13
Imp
ort
qu
ota
Do
ub
led
no
n-M
erco
sur
imp
ort
qu
ota
fo
r w
hea
t an
d w
aive
d t
arif
f. T
he
qu
ota
will
rem
ain
in p
lace
un
til
31 J
uly
201
3.
Ch
ileM
aize
Ap
r-13
Imp
ort
tar
iff
Intr
od
uce
d 9
.7 p
erce
nt
cou
nte
rvai
ling
imp
ort
tar
iff
on
imp
ort
s o
f A
rgen
tin
e m
aize
on
gro
un
ds
of
un
fair
co
mp
etit
ion
an
d d
um
pin
g.
Ch
ina
(Mai
nla
nd
)
Mai
zeN
ov-
12G
ove
rnm
ent
pro
cure
men
t fr
om
fa
rmer
s In
crea
sed
go
vern
men
t p
rocu
rem
ent
pri
ce f
or
mai
ze in
201
3 b
y 7
per
cen
t. M
aize
will
be
pro
cure
d in
n
ort
hea
ster
n m
aize
pro
du
cin
g r
egio
n a
t C
NY
2 1
00 p
er t
on
nes
(U
SD 3
40).
Wh
eat
Mar
-13
Sto
ck R
elea
seSo
ld 1
.29
mill
ion
to
nn
es o
f w
hea
t fr
om
sta
te r
eser
ves
to e
ase
tig
ht
mar
ket
con
dit
ion
s.
Mai
zeM
ay-1
3Pr
ocu
rem
ent
pri
ceA
nn
ou
nce
d in
crea
se o
f p
rocu
rem
ent
pri
ce f
or
mai
ze in
201
3
Ecu
ado
rM
aize
Dec
-12
Pro
du
ctiv
e as
sets
A
pp
rove
d t
he
Plan
Sem
illas
de
Alt
o R
end
imie
nto
fo
r m
aize
, wh
ich
fin
ance
s th
e ac
cess
of
smal
l-sc
ale
farm
ers
ow
nin
g le
ss t
han
10
ha
of
lan
d, t
o m
od
ern
, yie
ld-i
ncr
easi
ng
tec
hn
olo
gie
s, w
ith
th
e vi
ew i
to
enh
anci
ng
mai
ze y
ield
s fr
om
3.5
to
nn
es p
er h
a to
6 t
on
nes
per
ha.
Egyp
t
Wh
eat
No
v-12
Imp
ort
res
tric
tio
ns
Rem
ove
d U
krai
ne
fro
m li
st o
f ap
pro
ved
wh
eat
sup
plie
rs d
uri
ng
201
3, a
fter
th
e U
krai
nia
n G
ove
rnm
ent
hin
ted
ban
nin
g e
xpo
rts
of
wh
eat.
Wh
eat
Feb
-13
Go
vern
men
t p
rocu
rem
ent
and
p
rocu
rem
ent
pri
ceIn
crea
sed
pro
cure
men
t p
rice
fo
r w
hea
t in
201
3/14
mar
keti
ng
yea
r b
y 5
per
cen
t to
EG
P 2
666,
5 p
er
ton
nes
(U
SD 4
00 p
er t
on
nes
). G
ove
rnm
ent
has
allo
cate
d E
GP
11 b
illio
n (
USD
1.6
bill
ion
) to
bo
ost
d
om
esti
c w
hea
t p
rocu
rem
ent
to 4
.5 m
illio
n t
on
nes
.
Wh
eat
Mar
-13
Go
vern
men
t m
arke
t in
terv
enti
on
An
no
un
ced
pla
ns
to b
uild
150
silo
s ah
ead
of
the
2014
wh
eat
har
vest
.
Wh
eat
Ap
r-13
Go
vern
men
t p
rocu
rem
ent
Allo
cate
d E
GP
11 b
illio
n (
USD
1.6
bill
ion
) fo
r th
e p
urc
has
e o
f 4.
5 m
illio
n t
on
nes
of
wh
eat
fro
m f
arm
ers
to r
eple
nis
h s
tock
s.
Euro
pea
n U
nio
n
Bar
ley
and
Wh
eat
No
v-12
Imp
ort
tar
iff
Exte
nd
ed s
usp
ensi
on
of
imp
ort
du
ties
on
wh
eat
of
low
an
d m
ediu
m q
ual
ity
and
fee
d b
arle
y fr
om
th
e en
d o
f D
ecem
ber
201
2 to
th
e en
d o
f th
e 20
12/1
3 m
arke
tin
g y
ear
(Ju
ly/J
un
e).
Wh
eat
Jan
-13
Futu
res
mar
ket
dev
elo
pm
ent
An
no
un
ced
th
e fi
rst
Euro
pe-
bas
ed d
uru
m f
utu
res
mar
ket
wo
uld
be
lau
nch
ed o
n 2
1 Ja
nu
ary
2013
. A
nn
ou
nce
d b
y B
ors
a It
alia
na,
th
e n
ew A
GR
EX f
utu
res
will
be
trad
ed o
n t
he
Ital
ian
Der
ivat
ives
Exc
han
ge
Mar
ket,
wit
h M
arch
, May
, Sep
tem
ber
an
d D
ecem
ber
as
del
iver
y m
on
ths.
Gra
ins
May
-13
Seed
reg
ula
tio
nA
do
pti
on
by
the
Euro
pea
n C
om
mis
sio
n o
f a
pac
kag
e o
f m
easu
res
to s
tren
gth
en t
he
enfo
rcem
ent
of
hea
lth
an
d s
afet
y st
and
ard
s fo
r th
e w
ho
le a
gri
foo
d c
hai
n. I
t p
rovi
des
mo
re s
imp
lified
an
d fl
exib
le r
ule
s fo
r th
e m
arke
tin
g o
f se
eds
and
oth
er p
lan
t re
pro
du
ctiv
e m
ater
ial.
Wh
eat
and
bar
ley
May
-13
Imp
ort
du
tyEx
ten
sio
n o
f ze
ro im
po
rt d
uti
es f
or
feed
wh
eat
and
bar
ley
qu
ota
s b
eyo
nd
th
e en
d o
f th
e cu
rren
t se
aso
n
(Ju
ne
30).

Foo
d O
utl
oo
k -
Jun
e 2
01
3Fo
od
Ou
tlo
ok
- Ju
ne
20
13
727
CO
UN
TRY
PRO
DU
CT
DA
TEPO
LIC
Y C
ATE
GO
RY
/INST
RU
MEN
TD
ESC
RIP
TIO
N
Ind
ia
Wh
eat
No
v-12
Rel
easi
ng
sto
cks
Ap
pro
ved
rel
ease
of
500
000
ton
nes
fro
m g
ove
rnm
ent
sto
cks
thro
ug
h r
etai
l ou
tlet
s, t
o e
ase
hig
h
do
mes
tic
pri
ces.
Wh
eat
Dec
-12
Exp
ort
lim
itA
pp
rove
d t
he
2013
wh
eat
exp
ort
lim
it a
t 2.
5 m
illio
n t
on
nes
, 500
000
to
nn
es h
igh
er t
han
in 2
012.
Wh
eat
Dec
-12
Min
imu
m s
up
po
rt p
rice
Incr
ease
d m
inim
um
su
pp
ort
pri
ce f
or
wh
eat
in 2
013
by
5 p
erce
nt,
to
INR
1 3
50 p
er 1
00 k
g (
USD
248
per
to
nn
e).
Gra
ins
Feb
-13
Bu
dg
etar
y al
loca
tio
n, f
oo
d
sub
sid
ies
As
par
t o
f it
s 20
13-2
014
bu
dg
etar
y al
loca
tio
ns,
set
asi
de
Ru
pee
s 10
0 b
illio
n (
USD
1.8
bill
ion
) o
f ex
tra
ou
tlay
s to
fu
nd
th
e g
rad
ual
ro
ll-o
ut
of
the
Nat
ion
al F
oo
d S
ecu
rity
Act
.
Wh
eat
Feb
-13
Bu
dg
etar
y al
loca
tio
ns,
pro
du
ctio
n
sup
po
rt, c
rop
div
ersi
fica
tio
n,
agri
cult
ura
l cre
dit
, sto
rag
e
Furt
her
Ru
pee
s 5.
0 b
illio
n (
USD
92
mill
ion
) w
ere
allo
cate
d t
o e
nco
ura
ge
cro
p d
iver
sifi
cati
on
in o
rig
inal
G
reen
Rev
olu
tio
n s
tate
s. T
arg
eted
ag
ricu
ltu
ral c
red
it d
isb
urs
emen
ts a
lso
rai
sed
, th
e su
bsi
diz
ed c
red
it
sch
eme
ren
ewed
an
d e
xpan
ded
, wit
h f
un
ds
assi
gn
ed t
o e
xpan
d p
ub
lic a
nd
pri
vate
sto
rag
e ca
pac
ity.
Wh
eat
Mar
-13
Exp
ort
mea
sure
sA
llow
ed p
riva
te t
rad
ers
to e
xpo
rt 5
mill
ion
to
nn
es o
f w
hea
t fr
om
th
e 20
12 h
arve
st f
rom
go
vern
men
t st
ock
s b
etw
een
Feb
ruar
y an
d M
ay 2
013.
Set
th
e p
rice
at
INR
14
800
per
to
nn
e (U
SD 3
15 p
er t
on
nes
) p
lus
taxe
s.
Gra
ins
Mar
-13
Foo
d s
ub
sid
ies
A r
evis
ed v
ersi
on
of
the
Nat
ion
al F
oo
d S
ecu
rity
Act
ap
pro
ved
by
the
Ind
ian
Cab
inet
. Th
e re
vise
d b
ill
envi
sag
es g
ran
tin
g le
gal
en
titl
emen
t o
f 5
kilo
gra
ms
of
gra
ins
per
per
son
per
mo
nth
to
th
e g
ener
al
po
pu
lati
on
, wit
h m
ore
vu
lner
able
fam
ilies
rec
eivi
ng
a m
on
thly
rat
ion
of
35 k
ilos
of
foo
dg
rain
s p
er
ho
use
ho
ld. F
or
the
firs
t th
ree
year
s o
f im
ple
men
tati
on
of
the
sch
eme,
th
e ra
tio
ns
wo
uld
be
mad
e av
aila
ble
at
sub
sid
ized
pri
ces
of
Ru
pee
s 3
(USD
0.0
5) p
er k
ilo o
f ri
ce, R
up
ees
2 in
th
e ca
se o
f a
kilo
of
wh
eat
(USD
0.0
4) a
nd
Ru
pee
s 1(
USD
0.0
2) p
er k
ilo o
f m
illet
. Th
e sc
hem
e is
exp
ecte
d t
o c
ove
r u
p t
o 7
5 p
erce
nt
of
the
rura
l po
pu
lati
on
an
d 5
0 p
erce
nt
of
urb
an d
wel
lers
, wh
en e
nac
ted
.
Wh
eat
May
-13
Targ
eted
fo
od
su
bsi
die
sEx
ten
ded
th
e al
loca
tio
n o
f su
bsi
diz
ed g
rain
s d
uri
ng
201
3-14
to
fam
ilies
ab
ove
th
e p
ove
rty
line,
un
der
th
e Ta
rget
ed P
ub
lic D
istr
ibu
tio
n S
yste
m (
TPD
S) –
4.2
mill
ion
to
nn
es o
f w
hea
t w
ill b
e d
istr
ibu
ted
to
th
e ta
rget
ed f
amili
es.
Ind
on
esia
Wh
eat
flo
ur
Dec
-12
Imp
ort
Tar
iff
Rai
sed
imp
ort
tar
iff
for
wh
eat
flo
ur
to 2
0 p
erce
nt
for
200
day
s .
Iran
Wh
eat
May
-13
Exp
ort
ban
Intr
od
uct
ion
of
exp
ort
ban
on
wh
eat
in o
rder
to
cu
rb c
ross
-bo
rder
tra
din
g o
f w
hea
t fr
om
wes
tern
b
ord
ers.
Jap
an
Mai
ze a
nd
so
rgh
um
Feb
-13
Incr
ease
an
imal
fee
d r
eser
ves
Incr
ease
d a
nim
al f
eed
gra
in r
eser
ves,
incl
ud
ing
mai
ze s
org
hu
m, b
y 44
per
cen
t ye
ar-o
n-y
ear
, to
1.1
5 m
illio
n t
on
nes
, fo
r th
e fi
scal
yea
r b
egin
nin
g 1
Ap
ril 2
013.
Th
is in
clu
des
go
vern
men
t re
serv
es o
f 60
0 0
00
ton
nes
an
d 5
50 0
00 t
on
nes
hel
d b
y fe
ed s
up
plie
rs.
Wh
eat
Feb
-13
Pric
e co
ntr
ol
Incr
ease
d t
he
do
mes
tic
sale
pri
ce b
y 10
per
cen
t, f
or
imp
ort
ed w
hea
t as
of
Ap
ril 2
013
to a
n a
vera
ge
¥ 54
90
0 p
er t
on
ne
(USD
600
).
Mo
rocc
oW
hea
tD
ec-1
2Im
po
rt D
uty
Ex
ten
ded
th
e ze
ro d
uty
on
imp
ort
s o
f so
ft w
hea
t u
nti
l th
e en
d o
f A
pri
l 201
3, d
ue
to p
oo
r g
rain
har
vest
in
th
e co
un
try
and
des
ire
of
the
loca
l au
tho
riti
es t
o in
crea
se t
hei
r st
ock
s o
f th
e p
rod
uct
.
Paki
stan
Wh
eat
Mar
-13
Go
vern
men
t p
rocu
rem
ent
Purc
has
e o
f 9
mill
ion
to
nn
es o
f w
hea
t fr
om
far
mer
s b
y th
e Pa
kist
an A
gri
cult
ura
l Sto
rag
e an
d S
ervi
ces
Co
rpo
rati
on
(PA
SSC
O)
and
pro
vin
ces,
in o
rder
to
mee
t 20
13 p
rocu
rem
ent
targ
et.
Peru
Mai
zeA
pr-
13Fa
rmer
s In
com
e Ta
x R
edu
ce m
aize
far
mer
s´ in
com
e ta
x b
y 1.
5 p
erce
nt.
Phili
pp
ines
Mai
zeFe
b-1
3Fi
nan
ce a
nd
cre
dit
fac
iliti
esPr
ovi
de
insu
ran
ce c
ove
rag
e fo
r m
aize
far
mer
s, t
hro
ug
h t
he
Pro
vin
cial
Go
vern
men
t o
f N
ort
her
n S
amar
an
d t
he
Phili
pp
ine
Cro
p In
sura
nce
Co
rpo
rati
on
. Un
der
th
e p
rog
ram
me,
90
per
cen
t o
f th
e in
sura
nce
p
rem
ium
will
be
cove
red
by
the
pro
vin
cial
go
vern
men
t an
d 1
0 p
erce
nt
by
the
farm
er.
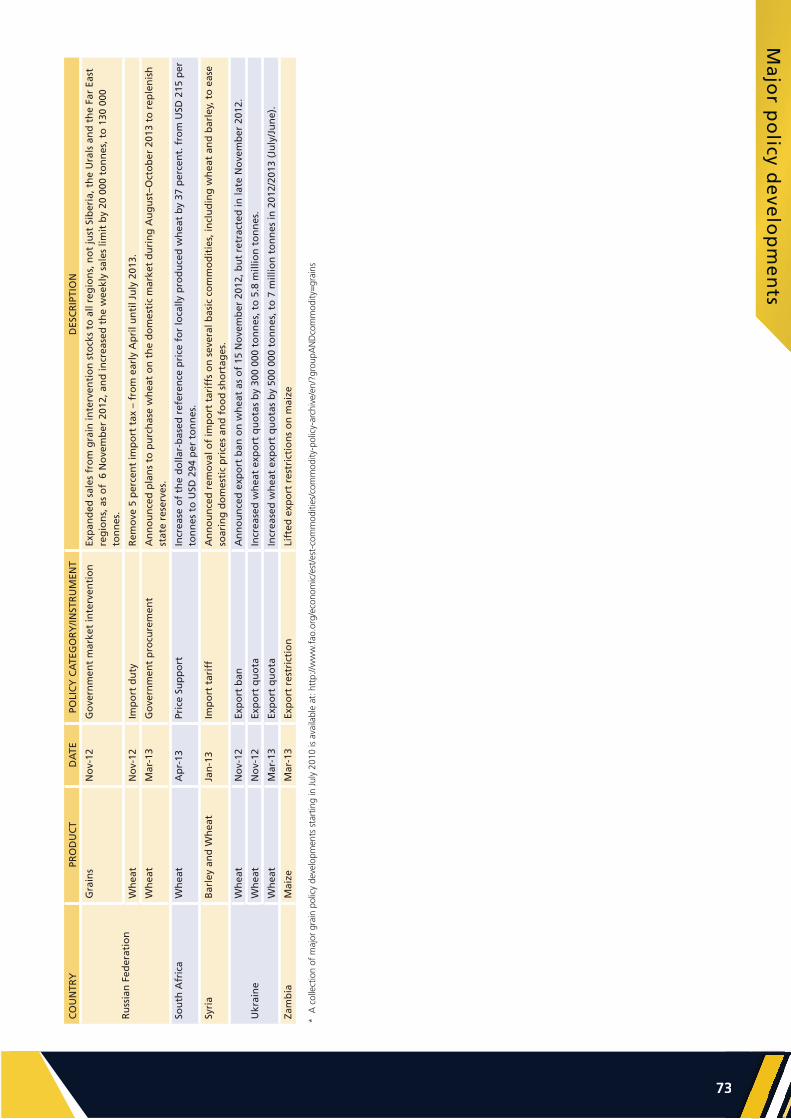
Ma
jor p
olicy d
eve
lop
me
nts
Ma
jor p
olicy d
eve
lop
me
nts
733
CO
UN
TRY
PRO
DU
CT
DA
TEPO
LIC
Y C
ATE
GO
RY
/INST
RU
MEN
TD
ESC
RIP
TIO
N
Ru
ssia
n F
eder
atio
n
Gra
ins
No
v-12
Go
vern
men
t m
arke
t in
terv
enti
on
Ex
pan
ded
sal
es f
rom
gra
in in
terv
enti
on
sto
cks
to a
ll re
gio
ns,
no
t ju
st S
iber
ia, t
he
Ura
ls a
nd
th
e Fa
r Ea
st
reg
ion
s, a
s o
f 6
No
vem
ber
201
2, a
nd
incr
ease
d t
he
wee
kly
sale
s lim
it b
y 20
000
to
nn
es, t
o 1
30 0
00
ton
nes
.
Wh
eat
No
v-12
Imp
ort
du
ty
Rem
ove
5 p
erce
nt
imp
ort
tax
– f
rom
ear
ly A
pri
l un
til J
uly
201
3.
Wh
eat
Mar
-13
Go
vern
men
t p
rocu
rem
ent
An
no
un
ced
pla
ns
to p
urc
has
e w
hea
t o
n t
he
do
mes
tic
mar
ket
du
rin
g A
ug
ust
–Oct
ob
er 2
013
to r
eple
nis
h
stat
e re
serv
es.
Sou
th A
fric
aW
hea
tA
pr-
13Pr
ice
Sup
po
rtIn
crea
se o
f th
e d
olla
r-b
ased
ref
eren
ce p
rice
fo
r lo
cally
pro
du
ced
wh
eat
by
37 p
erce
nt.
fro
m U
SD 2
15 p
er
ton
nes
to
USD
294
per
to
nn
es.
Syri
aB
arle
y an
d W
hea
t Ja
n-1
3Im
po
rt t
arif
fA
nn
ou
nce
d r
emo
val o
f im
po
rt t
arif
fs o
n s
ever
al b
asic
co
mm
od
itie
s, in
clu
din
g w
hea
t an
d b
arle
y, t
o e
ase
soar
ing
do
mes
tic
pri
ces
and
fo
od
sh
ort
ages
.
Ukr
ain
e
Wh
eat
No
v-12
Exp
ort
ban
An
no
un
ced
exp
ort
ban
on
wh
eat
as o
f 15
No
vem
ber
201
2, b
ut
retr
acte
d in
late
No
vem
ber
201
2.
Wh
eat
No
v-12
Exp
ort
qu
ota
Incr
ease
d w
hea
t ex
po
rt q
uo
tas
by
300
000
ton
nes
, to
5.8
mill
ion
to
nn
es.
Wh
eat
Mar
-13
Exp
ort
qu
ota
Incr
ease
d w
hea
t ex
po
rt q
uo
tas
by
500
000
ton
nes
, to
7 m
illio
n t
on
nes
in 2
012/
2013
(Ju
ly/J
un
e).
Zam
bia
Mai
zeM
ar-1
3Ex
po
rt r
estr
icti
on
Lift
ed e
xpo
rt r
estr
icti
on
s o
n m
aize
* A
col
lect
ion
of m
ajor
gra
in p
olic
y de
velo
pmen
ts s
tart
ing
in J
uly
2010
is a
vaila
ble
at: h
ttp:
//ww
w.f
ao.o
rg/e
cono
mic
/est
/est
-com
mod
ities
/com
mod
ity-p
olic
y-ar
chiv
e/en
/?gr
oupA
ND
com
mod
ity=
grai
ns

Foo
d O
utl
oo
k -
Jun
e 2
01
3Fo
od
Ou
tlo
ok
- Ju
ne
20
13
747
RICE
: M
AJO
R PO
LICY
DEV
ELO
PMEN
TS: N
OV
EMBE
R 20
12 -
MID
MA
Y 2
013*
CO
UN
TRY
PRO
DU
CT
DA
TEPO
LIC
Y C
ATE
GO
RY
/INST
RU
MEN
TD
ESC
RIP
TIO
N
Au
stra
liaR
ice
Dec
-12
Exp
ort
an
d m
arke
tin
g a
rran
gem
ents
Sin
gle
-des
k ar
ran
gem
ent
for
rice
ren
ewed
by
the
Go
vern
men
t o
f N
ew S
ou
th W
ales
un
til 3
0 Ju
ne
2017
, m
ain
tain
ing
th
e N
ew S
ou
th W
ales
Ric
e M
arke
tin
g B
oar
d's
so
le a
nd
exc
lusi
ve r
igh
t to
exp
ort
pro
du
ce g
row
n in
th
e st
ate.
Ban
gla
des
h
Ric
eN
ov-
12G
ove
rnm
ent
pro
cure
men
t, p
urc
has
ing
p
rice
sSe
t a
pro
cure
men
t ta
rget
of
250
000
ton
nes
of
par
bo
iled
ric
e an
d 5
0 00
0 to
nn
es o
f w
hit
e ri
ce f
rom
th
e A
man
h
arve
st. V
olu
mes
are
to
be
pu
rch
ased
at
Taka
26
per
kg
(U
SD 3
21 p
er t
on
ne)
an
d T
aka
25 p
er k
g (
USD
309
per
to
nn
e), r
esp
ecti
vely
, bet
wee
n 9
Dec
emb
er 2
012
and
28
Feb
ruar
y 20
13.
Ric
eD
ec-1
2Im
po
rt a
gre
emen
tA
gre
ed t
o r
enew
th
e m
emo
ran
du
m o
f u
nd
erst
and
ing
wit
h T
hai
lan
d u
nti
l 201
6, e
nvi
sag
ing
th
e su
pp
ly o
f u
p t
o
1.0
mill
ion
to
nn
es o
f Th
ai r
ice
to B
ang
lad
esh
, on
a n
eed
bas
is.
Ric
eFe
b-1
3Ex
po
rt b
anIn
clu
ded
no
n-a
rom
atic
ric
e in
th
e lis
t o
f it
ems
pro
hib
ited
fo
r ex
po
rt u
nd
er t
he
cou
ntr
y’s
exp
ort
po
licy
for
2012
–201
5.
Ric
eM
ar-1
3G
ove
rnm
ent
pro
cure
men
t, p
urc
has
ing
p
rice
sA
nn
ou
nce
d t
hat
go
vern
men
t w
ill b
uy
900
000
ton
nes
of
rice
an
d 1
50 0
00 t
on
nes
of
pad
dy
fro
m t
he
2012
–201
3 B
oro
har
vest
, bet
wee
n M
ay a
nd
Sep
tem
ber
201
3. V
olu
mes
are
to
be
pu
rch
ased
at
Taka
29
per
kg
(U
SD 3
65 p
er
ton
ne)
of
rice
an
d T
aka
18.5
per
kg
of
pad
dy
(USD
233
per
to
nn
e).
Ric
eM
ar-1
3Pr
od
uct
ion
su
pp
ort
Allo
cate
d T
aka
430
mill
ion
(U
SD 5
.4 m
illio
n)
to s
up
po
rt A
us
cro
p c
ult
ivat
ion
du
rin
g t
he
2013
sea
son
. Th
e su
pp
ort
pac
kag
e w
ill p
rovi
de
an e
stim
ated
325
500
sm
allh
old
ers
wit
h f
ree
fert
ilize
r an
d s
eed
of
hig
h-y
ield
ing
an
d N
eric
a ri
ce v
arie
ties
. Th
e in
itia
tive
is t
arg
eted
to
rai
se p
rod
uct
ion
fro
m t
his
sm
all c
rop
by
110
000
ton
nes
, th
us
hel
pin
g a
llevi
ate
con
cern
s o
ver
dep
leti
ng
wat
er t
able
s fr
om
th
e ex
ten
sive
cu
ltiv
atio
n o
f th
e ir
rig
ated
B
oro
cro
p.
Ben
inR
ice
Mar
-13
Foo
d s
ub
sid
ies
Exte
nd
ed t
he
sub
sid
ized
sal
es p
rog
ram
me
for
rice
an
d m
aize
fo
r a
seco
nd
ro
un
d. L
oca
lly p
rod
uce
d r
ice
will
co
nti
nu
e to
be
sold
to
vu
lner
able
gro
up
s at
a s
ub
sid
ized
pri
ce o
f FC
FA 2
00 p
er k
g (
USD
0.4
per
kg
).
Bo
livia
Ric
eD
ec-1
2G
ove
rnm
ent
pro
cure
men
tA
nn
ou
nce
d p
lan
s to
pro
cure
up
to
60
000
ton
nes
fro
m t
he
2013
har
vest
.
Ric
eA
pr-
13G
ove
rnm
ent
pro
cure
men
t, p
urc
has
ing
p
rice
sA
nn
ou
nce
d t
hat
th
e st
ate
ente
rpri
se E
MA
PA w
ou
ld p
rocu
re s
up
plie
s fr
om
th
e 20
13 h
arve
st a
t U
SD 5
5 fo
r 20
0 kg
fan
ega
(USD
275
per
to
nn
e), u
p 2
0 p
erce
nt
fro
m 2
012.
Bra
zil
Ric
eJa
n-1
3St
ock
rel
ease
An
no
un
ced
th
at p
ub
lic s
tock
rel
ease
s w
ou
ld b
e st
op
ped
so
as
to a
vert
do
wn
war
d p
ress
ure
on
loca
l qu
ota
tio
ns
du
rin
g t
he
app
roac
hin
g c
rop
har
vest
per
iod
.
Ric
eM
ar-1
3Ta
x p
olic
yEx
on
erat
ed p
rod
uct
s co
mp
osi
ng
th
e b
asic
fo
od
bas
ket,
incl
ud
ing
ric
e, f
rom
So
cial
Inte
gra
tio
n P
rog
ram
(PI
S),
Co
ntr
ibu
tio
n t
o S
oci
al S
ecu
rity
Fin
anci
ng
(C
OFI
NS)
an
d In
du
stri
aliz
ed P
rod
uct
s Ta
x (I
PI)
taxe
s. T
he
mo
ve w
ill
mak
e th
e ex
emp
tio
n p
erm
anen
t in
th
e ca
se o
f ri
ce, w
hic
h h
ad b
een
inte
rmit
ten
tly
exem
pte
d f
rom
th
e fe
der
al
levi
es in
rec
ent
year
s. T
he
init
iati
ve is
inte
nd
ed t
o a
ssis
t th
e p
op
ula
tio
n in
co
pin
g w
ith
infl
atio
nar
y p
ress
ure
.
Bu
run
di
Ric
eD
ec-1
2C
on
sum
er p
rice
s, v
alu
e ad
ded
tax
esEx
ten
ded
th
e ex
emp
tio
n o
f va
lue
add
ed t
axes
an
d o
ther
ad
min
istr
ativ
e ch
arg
es le
vied
on
ric
e an
d 1
1 o
ther
im
po
rted
fo
od
co
mm
od
itie
s u
nti
l 30
of
Jun
e 20
13.
Ch
ina
(Mai
nla
nd
)R
ice
Feb
-13
Sup
po
rt p
rice
sR
aise
d g
ove
rnm
ent
pad
dy
pro
cure
men
t p
rice
s fo
r th
e 20
13 s
easo
n b
y 10
per
cen
t to
Yu
an 1
32 p
er 5
0 kg
bag
(U
SD 4
20 p
er t
on
ne)
of
earl
y in
dic
a ri
ce; b
y 8
per
cen
t to
Yu
an 1
35 p
er 5
0 kg
bag
(U
SD 4
30 p
er t
on
ne)
of
late
/in
term
edia
te in
dic
a ri
ce; a
nd
by
7 p
erce
nt
to Y
uan
150
per
50
kg b
ag o
f ja
po
nic
a ri
ce (
USD
478
per
to
nn
e).
Co
lom
bia
Ric
eN
ov-
12Im
po
rt q
uo
taA
pp
rove
d im
po
rts
of
250
000
ton
nes
of
rice
, in
a b
id t
o e
ase
loca
l su
pp
ly t
igh
tnes
s an
d k
eep
pri
ces
un
der
ch
eck.
Th
e vo
lum
e in
clu
des
160
000
to
nn
es o
rig
inat
ing
in t
he
Un
ited
Sta
tes,
as
par
t o
f th
e 20
12 a
nd
201
3 ta
riff
ra
te q
uo
ta s
et o
ut
un
der
th
e U
S-C
olo
mb
ia T
rad
e Pr
om
oti
on
Ag
reem
ent,
as
wel
l as
an a
dd
itio
nal
90
000
ton
nes
o
f ri
ce f
rom
An
dea
n C
om
mu
nit
y co
un
trie
s f
or
imp
ort
bet
wee
n M
arch
an
d M
ay 2
013.
Ric
eM
ar-1
3Su
pp
ort
pri
ces,
war
eho
use
rec
eip
ts
pro
gra
mA
gre
ed t
o in
stit
ute
ref
eren
ce fl
oo
r/ce
ilin
g p
rice
s fo
r p
add
y. P
rod
uce
rs a
re t
o r
ecei
ve a
min
imu
m o
f Pe
sos
108
000–
122
000
per
125
kg
(U
SD 4
75–
537
per
to
nn
e) d
epen
din
g o
n t
he
vari
ou
s p
rod
uct
ion
are
as, a
nd
no
m
ore
th
an P
eso
s 11
8 00
0–13
2 00
0 (U
SD 5
19–5
81 p
er t
on
ne)
. Th
e p
rice
ban
d w
ill b
e im
ple
men
ted
wit
hin
th
e fr
amew
ork
of
the
sto
rag
e in
cen
tive
pro
gra
mm
e, w
hic
h is
to
op
erat
e b
etw
een
1 A
ug
ust
an
d 3
0 N
ove
mb
er
2013
, an
d w
ill b
e ac
com
pan
ied
by
effo
rts
to in
crea
se b
ord
er p
rote
ctio
n a
nd
su
pp
ort
th
e in
du
stry
gai
n
com
pet
itiv
enes
s.

Ma
jor p
olicy d
eve
lop
me
nts
Ma
jor p
olicy d
eve
lop
me
nts
755
CO
UN
TRY
PRO
DU
CT
DA
TEPO
LIC
Y C
ATE
GO
RY
/INST
RU
MEN
TD
ESC
RIP
TIO
N
Co
sta
Ric
aR
ice
No
v-12
Safe
gu
ard
mea
sure
sR
ejec
ted
a lo
cal i
nd
ust
ry r
equ
est
to im
po
se s
afeg
uar
d m
easu
res
agai
nst
sel
ecte
d c
lass
es o
f m
illed
ric
e im
po
rts
carr
ied
ou
t o
uts
ide
of
CA
FTA
an
d o
ther
Cen
tral
Am
eric
an p
refe
ren
tial
tra
de
com
mit
men
ts.
Cô
te d
'Ivo
ire
Ric
eJa
n-1
3Fo
reig
n a
gri
cult
ura
l in
vest
men
tSi
gn
ed a
fra
mew
ork
ag
reem
ent
wit
h L
ou
is D
reyf
us,
a m
ult
inat
ion
al c
om
mo
dit
y tr
adin
g c
om
pan
y, t
hat
will
se
ek t
o b
oo
st r
ice
pro
du
ctio
n b
y 30
0 00
0 to
nn
es. T
he
pla
n e
nvi
sag
es c
ult
ivat
ing
up
to
200
000
ha
in t
he
no
rth
ern
are
as o
f Po
ro, T
cho
log
o a
nd
Bag
ou
é.
Ecu
ado
r
Ric
eD
ec-1
2Pr
od
uct
ion
su
pp
ort
An
no
un
ced
th
e in
tro
du
ctio
n o
f a
sup
po
rt p
rog
ram
me
for
smal
l-sc
ale
pro
du
cers
of
mai
ze a
nd
ric
e. T
he
init
iati
ve w
ill g
ran
t an
est
imat
ed 3
000
sm
all r
ice
farm
ers
(wit
h h
old
ing
s o
f 10
ha
or
less
) a
sub
sid
y o
f U
SD 1
23
per
hec
tare
fo
r th
e ac
qu
isit
ion
of
hig
h-y
ield
ing
see
d v
arie
ties
, fer
tiliz
ers
and
oth
er a
gro
chem
ical
s, s
tart
ing
w
ith
th
e 20
13 w
inte
r cr
op
.
Ric
eFe
b-1
3R
efer
ence
pri
ces
Ap
pro
ved
th
e in
stit
uti
on
of
refe
ren
ce w
ho
lesa
le p
rice
s fo
r a
set
of
46 p
rod
uct
s, in
clu
din
g s
elec
ted
qu
alit
ies
of
rice
. Th
ese
are
to a
ssis
t in
mo
nit
ori
ng
loca
l qu
ota
tio
ns
and
th
war
tin
g f
oo
d p
rice
sp
ecu
lati
on
.
Ric
eA
pr-
13Pr
od
uct
ion
su
pp
ort
, su
pp
ort
pri
ces
Follo
win
g a
mee
tin
g o
f th
e R
ice
Co
nsu
ltat
ive
Co
un
cil,
ann
ou
nce
d a
4 p
erce
nt
incr
ease
in p
add
y p
rod
uce
r p
rice
s to
USD
34.
5 p
er 2
00 p
ou
nd
s (U
SD 3
80 p
er t
on
ne)
fo
r th
e 20
13 w
inte
r h
arve
st.
Ad
dit
ion
al s
up
po
rt
mea
sure
s to
th
e se
cto
r w
ill in
clu
de
gre
ater
bo
rder
pro
tect
ion
, cap
acit
y b
uild
ing
an
d h
igh
er s
ub
sid
ies
on
see
ds,
w
hic
h w
ill b
e ra
ised
fro
m U
SD 1
13 t
o U
SD 2
00 p
er h
ecta
re.
Egyp
t
Ric
eD
ec-1
2Ex
po
rt li
cen
ses
Aw
ard
ed e
xpo
rt li
cen
ses
for
188
000
ton
nes
of
rice
th
rou
gh
a t
end
er h
eld
on
3 D
ecem
ber
201
3. V
olu
mes
wer
e to
be
ship
ped
by
31 J
anu
ary
2013
.
Ric
eFe
b-1
3Ex
po
rt li
cen
ses
Aw
ard
ed e
xpo
rt li
cen
ses
for
173
000
ton
es t
hro
ug
h a
ten
der
hel
d o
n 1
4 Fe
bru
ary
2013
. Vo
lum
es w
ere
to b
e d
eliv
ered
by
15 A
pri
l 201
3.
Ric
eM
ar-1
3C
ult
ivat
ion
lim
its
Dec
lare
d t
hat
su
ffici
ent
irri
gat
ion
wat
er w
ou
ld b
e p
rovi
ded
to
cu
ltiv
ate
1.76
mill
ion
fed
dan
s (7
39 0
00 h
a) o
f ri
ce d
uri
ng
th
e 20
13 s
easo
n.
Euro
pea
n U
nio
nR
ice
Feb
-13
Pro
tect
ed g
eog
rap
hic
al in
dic
atio
nEn
tere
d T
hai
“K
hao
Ho
m M
ali T
hu
ng
Ku
la R
on
g-H
ai”
rice
into
th
e re
gis
ter
of
pro
tect
ed d
esig
nat
ion
s o
f o
rig
in
and
pro
tect
ed g
eog
rap
hic
al in
dic
atio
ns.
Gu
inea
Ric
eM
ar-1
3Im
po
rt a
gre
emen
tSi
gn
ed a
Mem
ora
nd
um
of
Un
der
stan
din
g w
ith
Vie
t N
am f
or
the
ann
ual
pro
visi
on
of
300
000
ton
nes
of
rice
u
nti
l 201
5.
Gu
yan
a/V
enez
uel
aR
ice
May
-13
Trad
e ag
reem
ent
Ag
reed
to
ren
ew t
he
Petr
oC
arib
e ri
ce t
rad
e ag
reem
ent
for
an a
dd
itio
nal
yea
r. U
nd
er t
he
acco
rd, G
uya
na
is t
o
pro
vid
e 14
0 00
0 to
nn
es o
f p
add
y an
d 7
0 00
0 to
nn
es o
f ri
ce t
o V
enez
uel
a in
201
3, p
aym
ent
for
wh
ich
will
be
ded
uct
ed f
rom
Gu
yan
a's
oil
arre
ars
to V
enez
uel
a.
Hai
tiR
ice
Dec
-12
Imp
ort
ag
reem
ent,
pro
du
ctio
n s
up
po
rtR
each
ed a
go
vern
men
t-to
-go
vern
men
t ag
reem
ent
wit
h V
iet
Nam
fo
r th
e p
rovi
sio
n o
f ri
ce o
n p
refe
ren
tial
te
rms.
Ad
dit
ion
ally
, Vie
tnam
is t
o p
rovi
de
tech
nic
al a
ssis
tan
ce t
o H
aiti
in it
s ef
fort
s to
bo
ost
ric
e p
rod
uct
ion
an
d s
tora
ge
cap
acit
y.
Ind
ia
Ric
eN
ov-
12Ex
po
rt r
estr
icti
on
sD
ecid
ed t
o c
on
tin
ue
per
mit
tin
g t
he
un
rest
rict
ed e
xpo
rt o
f n
on
-bas
mat
i ric
e an
d w
hea
t, in
lig
ht
of
the
mo
re
than
ad
equ
ate
do
mes
tic
sup
ply
sit
uat
ion
.
Ric
eN
ov-
12Fo
od
su
bsi
die
sA
pp
rove
d a
n a
dd
itio
nal
allo
cati
on
of
500
000
ton
nes
of
rice
an
d a
n e
qu
al a
mo
un
t o
f w
hea
t fo
r sa
le b
y st
ate
and
un
ion
ter
rito
ry g
ove
rnm
ents
an
d n
atio
nal
co
op
erat
ives
, un
der
th
e O
pen
Mar
ket
Sale
s Sc
hem
e.
Ric
eN
ov-
12Pr
od
uct
ion
su
pp
ort
Exte
nd
ed t
he
Nat
ion
al F
oo
d S
ecu
rity
Mis
sio
n-R
ice
cove
rag
e to
an
ad
dit
ion
al 2
4 st
ates
.
Ric
eN
ov-
12Tr
ade
pro
mo
tio
nIn
clu
ded
ric
e, a
lon
g w
ith
21
oth
er c
om
mo
dit
ies,
am
on
g t
he
list
of
item
s p
erm
itte
d t
o b
e tr
aded
alo
ng
th
e In
do
-Mya
nm
ar b
ord
er.
Ric
eFe
b-1
3B
ud
get
ary
allo
cati
on
s, p
rod
uct
ion
su
pp
ort
, cr
op
div
ersi
fica
tio
n, a
gri
cult
ura
l cre
dit
, st
ora
ge
Ren
ewed
th
e “B
rin
gin
g t
he
Gre
en R
evo
luti
on
to
Eas
tern
Ind
ia”
(BG
REI
) sc
hem
e th
rou
gh
a R
up
ees
10.0
bill
ion
(U
SD 1
83 m
illio
n)
allo
tmen
t, a
s p
art
of
its
2013
-201
4 b
ud
get
ary
allo
cati
on
s. A
lloca
ted
a f
urt
her
Ru
pee
s 5.
0 b
illio
n (
USD
92
mill
ion
) to
en
cou
rag
e cr
op
div
ersi
fica
tio
n in
ori
gin
al G
reen
Rev
olu
tio
n s
tate
s. T
arg
eted
ag
ricu
ltu
ral c
red
it d
isb
urs
emen
ts w
ere
also
rai
sed
, an
d t
he
sub
sid
ized
cre
dit
sch
eme
ren
ewed
an
d e
xpan
ded
, w
ith
fu
nd
s as
sig
ned
to
en
larg
e p
ub
lic a
nd
pri
vate
sto
rag
e ca
pac
ity.

Foo
d O
utl
oo
k -
Jun
e 2
01
3Fo
od
Ou
tlo
ok
- Ju
ne
20
13
767
CO
UN
TRY
PRO
DU
CT
DA
TEPO
LIC
Y C
ATE
GO
RY
/INST
RU
MEN
TD
ESC
RIP
TIO
N
Ind
on
esia
Ric
eA
pr-
13Fo
od
su
bsi
die
sA
nn
ou
nce
d t
hat
eff
ecti
ve J
anu
ary
2014
, rat
ion
s u
nd
er t
he
pu
blic
su
bsi
diz
ed d
istr
ibu
tio
n s
chem
e (R
aski
n)
will
be
rais
ed b
y 5
kg t
o 2
0 kg
per
ho
use
ho
ld a
nd
will
co
nti
nu
e to
be
sold
at
Ru
pia
h 1
600
(U
SD 0
.2)
per
kg
. H
ow
ever
, th
e n
um
ber
of
elig
ible
fam
ilies
was
rev
ised
do
wn
fro
m 1
7.5
mill
ion
in 2
012
to 1
5.5
mill
ion
in 2
013.
Ric
eA
pr-
13Im
po
rt a
gre
emen
tSi
gn
ed a
Mem
ora
nd
um
of
Un
der
stan
din
g w
ith
Mya
nm
ar f
or
the
ann
ual
pro
visi
on
of
up
to
500
000
to
nn
es o
f ri
ce, o
n a
nee
ds
bas
is.
Iraq
Ric
eM
ar-1
3Im
po
rt r
equ
irem
ents
Ag
reed
to
mo
dif
y te
nd
er s
pec
ifica
tio
ns
for
rice
ori
gin
atin
g in
th
e U
nit
ed S
tate
s. C
erti
fica
tio
n o
f n
on
-GM
O
pre
sen
ce b
y p
riva
te la
bo
rato
ries
will
no
w b
e p
erm
itte
d. B
ulk
sh
ipm
ents
will
als
o b
e al
low
ed, p
rovi
ded
cer
tain
cr
iter
ia a
re m
et, a
nd
th
e U
S d
efin
itio
n a
nd
tes
t fo
r ch
alky
ker
nel
s ac
cep
ted
.
Ken
yaR
ice
No
v-12
Pro
du
ctio
n s
up
po
rtW
aive
d S
hill
ing
s 44
2 m
illio
n (
USD
5.0
mill
ion
) w
ort
h o
f d
ebt
accr
ued
by
pad
dy
farm
ers
in t
he
Mw
ea ir
rig
atio
n
sch
eme.
Lib
eria
Ric
eJa
n-1
3Im
po
rt t
arif
fR
enew
ed im
po
rt t
arif
f ex
emp
tio
ns
on
sem
i/wh
olly
mill
ed r
ice
and
bro
ken
ric
e, in
an
eff
ort
to
kee
p lo
cal p
rice
s st
able
.
Mya
nm
ar
Ric
eN
ov-
12G
ove
rnm
ent
pro
cure
men
tIn
co
llab
ora
tio
n w
ith
th
e M
yan
mar
Ric
e Fe
der
atio
n, l
aun
ched
a p
rocu
rem
ent
rou
nd
fo
r 25
per
cen
t b
roke
n
rice
th
rou
gh
a t
end
erin
g p
roce
ss. P
urc
has
es a
re g
eare
d a
t re
furb
ish
ing
go
vern
men
t st
ock
pile
s an
d s
up
po
rtin
g
farm
ers
du
rin
g h
arve
st t
ime.
Ric
eD
ec-1
2G
ove
rnm
ent
pro
cure
men
tA
nn
ou
nce
d t
hat
th
e M
yan
mar
Ric
e Fe
der
atio
n w
ou
ld p
rocu
re 1
00 0
00 t
on
nes
of
rice
bet
wee
n D
ecem
ber
an
d
Jan
uar
y to
rep
len
ish
go
vern
men
t st
ock
pile
s an
d s
up
po
rt fl
oo
d-a
ffec
ted
far
mer
s.
Ric
eJa
n-1
3Pr
od
uct
ion
su
pp
ort
, cre
dit
An
no
un
ced
th
at s
easo
nal
loan
lim
its
for
sum
mer
pad
dy
cro
ps
wo
uld
be
rais
ed f
rom
Kya
t 80
000
to
100
000
p
er a
cre
(USD
284
per
hec
tare
), w
ith
th
e re
pay
men
t p
erio
d f
or
loan
s fo
r w
et s
easo
n c
rop
s fu
rth
er e
xten
ded
to
M
arch
201
3. T
he
mea
sure
is g
eare
d a
t su
stai
nin
g f
arm
ers
that
hav
e in
curr
ed lo
sses
du
e to
flo
od
s.
Ric
eA
pr-
13G
ove
rnm
ent
pro
cure
men
t, s
up
po
rt p
rice
sA
nn
ou
nce
d p
lan
s to
pro
cure
100
000
to
nn
es o
f ri
ce d
uri
ng
th
e 20
13–2
014
fisc
al y
ear
to r
efu
rbis
h p
ub
lic s
tock
s an
d s
up
po
rt lo
cal p
rice
s. P
urc
has
es a
re t
o b
e u
nd
erta
ken
th
rou
gh
ten
der
s.
Nig
eria
Ric
eN
ov-
12Pr
od
uct
ion
su
pp
ort
An
no
un
ced
a p
rog
ram
me
to b
ols
ter
off
-sea
son
pad
dy
pro
du
ctio
n t
o s
up
ple
men
t b
road
er fl
oo
d r
eco
very
ef
fort
s, w
hic
h f
ore
see
the
rele
ase
of
gra
in s
up
plie
s fr
om
pu
blic
res
erve
s an
d d
istr
ibu
tio
n o
f su
bsi
diz
ed
inp
uts
to
aff
ecte
d p
rod
uce
rs. T
he
init
iati
ve a
ims
to r
aise
dry
-sea
son
ou
tpu
t b
y 1.
3 m
illio
n t
on
nes
, off
erin
g
par
tici
pat
ing
far
mer
s im
pro
ved
see
d f
ree
of
cost
s, a
s w
ell a
s a
50 p
erce
nt
sub
sid
y o
n f
erti
lizer
s.
Ric
eM
ay-1
3Im
po
rt r
estr
icti
on
sA
nn
ou
nce
d t
hat
it w
ou
ld s
tep
-up
bo
rder
pro
tect
ion
in o
rder
to
cu
rb r
ice
smu
gg
ling
. All
rice
bro
ug
ht
into
N
iger
ia v
ia la
nd
bo
rder
s w
ill b
e co
nsi
der
ed c
on
trab
and
, wit
h r
ice
imp
ort
s o
nly
per
mit
ted
th
rou
gh
sea
po
rts
afte
r ap
plic
able
du
ties
are
pai
d.
Pan
ama
Ric
eA
pr-
13C
red
it, m
arke
tin
g a
ssis
tan
ceA
nn
ou
nce
d t
hat
USD
6 m
illio
n w
ort
h o
f cr
edit
an
d m
arke
tin
g a
ssis
tan
ce w
ou
ld b
e p
rovi
ded
to
th
e in
du
stry
.
Peru
Ric
eA
pr-
13Pr
od
uct
ion
su
pp
ort
, exp
ort
pro
mo
tio
n,
pro
mo
tio
n o
f lo
cal p
rod
uct
sA
gre
ed w
ith
ind
ust
ry r
epre
sen
tati
ves
to p
rom
ote
exp
ort
s to
fel
low
An
dea
n c
ou
ntr
ies,
gre
ater
do
mes
tic
con
sum
pti
on
of
loca
l ric
e, w
hile
co
nti
nu
ing
to
en
cou
rag
e p
rod
uce
rs in
no
rth
ern
co
asta
l reg
ion
s to
rep
lace
ric
e w
ith
mai
ze. T
he
mea
sure
s ar
e g
eare
d a
t ar
rest
ing
fu
rth
er d
eclin
es in
loca
l pro
du
cer
pri
ces.

Ma
jor p
olicy d
eve
lop
me
nts
Ma
jor p
olicy d
eve
lop
me
nts
777
CO
UN
TRY
PRO
DU
CT
DA
TEPO
LIC
Y C
ATE
GO
RY
/INST
RU
MEN
TD
ESC
RIP
TIO
N
Phili
pp
ines
Ric
eFe
b-1
3Im
po
rt q
uo
taSi
gn
ed a
n a
gre
emen
t w
ith
ind
ust
ry r
epre
sen
tati
ves
in L
uzo
n t
o c
om
bat
ric
e sm
ug
glin
g. T
he
acco
rd e
nvi
sag
es
rice
imp
ort
s to
be
carr
ied
ou
t p
rim
arily
by
the
Nat
ion
al F
oo
d A
uth
ori
ty, w
ith
invo
lvem
ent
of
the
pri
vate
sec
tor
in t
he
dis
trib
uti
on
of
imp
ort
ed r
ice
per
mit
ted
th
rou
gh
th
e ag
ency
's “
Inst
itu
tio
nal
ized
Far
mer
s as
Dis
trib
uto
rs
Pro
gra
m”.
Pro
ced
ure
s to
iden
tify
, sei
ze, s
tore
an
d d
isp
ose
of
smu
gg
led
su
pp
lies
wer
e al
so c
ove
red
un
der
th
e ag
reem
ent.
Ric
eM
ar-1
3Im
po
rt q
uo
taA
nn
ou
nce
d p
lan
s to
imp
ort
187
000
to
nn
es o
f ri
ce b
y 30
Ju
ne
2013
, as
par
t o
f it
s M
inim
um
Acc
ess
Vo
lum
e (M
AV
) co
mm
itm
ents
un
der
th
e W
TO. P
urc
has
es a
re t
o b
e u
nd
erta
ken
so
lely
by
the
Nat
ion
al F
oo
d A
uth
ori
ty
and
will
ser
ve t
o r
eco
nst
itu
te r
eser
ves
ahea
d o
f le
an m
on
ths.
Ric
eM
ar-1
3Im
po
rt q
uo
taA
nn
ou
nce
d t
hat
ap
plic
atio
ns
to im
po
rt 1
63 0
00 t
on
nes
of
rice
un
der
Min
imu
m A
cces
s V
olu
me
(MA
V)
co
un
try-
spec
ific
qu
ota
s w
ou
ld b
e o
pen
ed t
o t
he
pri
vate
sec
tor,
star
tin
g 1
0 A
pri
l 201
3. Im
po
rted
vo
lum
es a
re t
o a
rriv
e n
o la
ter
than
31
Dec
emb
er 2
013.
Ric
eA
pr-
13Im
po
rt a
gre
emen
tSi
gn
ed a
Mem
ora
nd
um
of
Un
der
stan
din
g w
ith
Cam
bo
dia
, en
ablin
g t
he
Nat
ion
al F
oo
d A
uth
ori
ty t
o im
po
rt r
ice
thro
ug
h t
he
Cam
bo
dia
n s
tate
-ow
ned
en
terp
rise
Gre
en T
rad
e.
Ric
eA
pr-
13Pr
od
uct
ion
su
pp
ort
Allo
cate
d P
eso
s 50
0 m
illio
n (
USD
12
mill
ion
) to
en
cou
rag
e g
reat
er h
ybri
d r
ice
cult
ivat
ion
in 2
013
and
201
4.
The
init
iati
ve a
ims
to r
aise
hyb
rid
ric
e co
vera
ge
to 2
84 0
00 h
a in
201
3 an
d t
o 3
90 0
00 h
a th
e fo
llow
ing
yea
r, u
p
fro
m a
n e
stim
ated
165
000
ha
in 2
012.
Rep
ub
lic o
f K
ore
a
Ric
eJa
n-1
3Im
po
rt q
uo
taA
nn
ou
nce
d it
s 20
13 M
inim
um
Mar
ket
Acc
ess
(MM
A)
pu
rch
ase
pla
n a
hea
d o
f ti
me,
in o
rder
to
an
tici
pat
e d
eliv
erie
s an
d k
eep
loca
l qu
ota
tio
ns
un
der
ch
eck.
Un
der
its
MM
A c
om
mit
men
ts, t
he
cou
ntr
y is
to
bu
y 38
8 35
3 to
nn
es in
201
3.
Ric
eJa
n-1
3St
ock
rel
ease
An
no
un
ced
th
at t
he
go
vern
men
t w
ou
ld r
elea
se 2
11 0
00 t
on
nes
of
rice
fro
m r
eser
ves
to lo
cal m
arke
ts t
o
ensu
re d
om
esti
c p
rice
s re
mai
n s
tab
le a
hea
d o
f th
e Lu
nar
New
Yea
r.
Ru
ssia
Ric
eD
ec-1
2Im
po
rt r
estr
icti
on
s, p
hyt
osa
nit
ary
mea
sure
sC
alle
d f
or
urg
ent
con
sult
atio
ns
wit
h In
dia
n o
ffici
als,
aft
er k
hap
ra b
eetl
e w
as f
ou
nd
in a
sm
all c
on
sig
nm
ent
of
rice
fro
m In
dia
.
Ric
eFe
b-1
3Im
po
rt r
estr
icti
on
s, p
hyt
osa
nit
ary
mea
sure
sA
nn
ou
nce
d t
hat
tem
po
rary
imp
ort
res
tric
tio
ns
on
Ind
ian
ric
e w
ou
ld b
e im
po
sed
du
e to
det
ecti
on
of
khap
ra
bee
tle
in a
co
nsi
gn
men
t o
f ri
ce f
rom
Ind
ia in
Dec
emb
er 2
012.
Res
tric
tio
ns
bec
ame
effe
ctiv
e 19
Feb
ruar
y 20
13.
Sri L
anka
Ric
eN
ov-
12Pr
od
uct
ion
su
pp
ort
, pro
cure
men
t, s
up
po
rt
pri
ces,
insu
ran
ce, c
red
itA
nn
ou
nce
d t
hat
an
est
imat
ed 1
00 0
00 d
rou
gh
t-st
rick
en f
arm
ers
wo
uld
be
pro
vid
ed w
ith
cre
dit
rel
ief
and
se
eds
free
of
char
ge,
as
par
t o
f 20
13 b
ud
get
ary
allo
cati
on
s, a
nd
th
at a
cro
p in
sura
nce
sch
eme
wo
uld
be
intr
od
uce
d a
lon
gsi
de
the
exis
tin
g f
erti
lizer
su
bsi
dy
pro
gra
mm
e. In
ord
er t
o s
up
po
rt o
ffici
al p
urc
has
ing
ac
tivi
ties
, th
e Pa
dd
y M
arke
tin
g B
oar
d’s
sto
rag
e ca
pac
ity
is t
o b
e b
ols
tere
d a
nd
gu
aran
teed
pri
ces
for
pad
dy
rais
ed b
y 14
per
cen
t to
Ru
pee
s 32
per
kg
(U
SD 2
53 p
er t
on
ne)
in t
he
case
of
Nad
u p
add
y an
d b
y 17
per
cen
t to
Ru
pee
s 35
per
kg
(U
SD 2
77 p
er t
on
ne)
fo
r Sa
mb
a p
add
y. O
ffici
als
also
an
no
un
ced
th
e in
tro
du
ctio
n o
f a
gu
aran
teed
pri
ce f
or
pad
dy
gro
wn
usi
ng
org
anic
fer
tiliz
ers
of
Ru
pee
s 40
per
kg
(U
SD 3
16 p
er t
on
ne)
.
Syri
aR
ice
Jan
-13
Imp
ort
tar
iff
An
no
un
ced
pla
ns
to e
limin
ate
imp
ort
du
ties
on
ric
e an
d 1
6 o
ther
sta
ple
pro
du
cts,
in a
dd
itio
n t
o p
erm
itti
ng
p
riva
te e
nti
ties
to
pu
rch
ase
fuel
fro
m a
bro
ad.

Foo
d O
utl
oo
k -
Jun
e 2
01
3Fo
od
Ou
tlo
ok
- Ju
ne
20
13
787
CO
UN
TRY
PRO
DU
CT
DA
TEPO
LIC
Y C
ATE
GO
RY
/INST
RU
MEN
TD
ESC
RIP
TIO
N
Thai
lan
d
Ric
eN
ov-
12St
ock
rel
ease
Ap
pro
ved
th
e re
leas
e o
f 60
0 00
0 to
nn
es o
f fr
agra
nt
rice
an
d 5
00 0
00 t
on
nes
of
wh
ite
rice
fro
m g
ove
rnm
ent
sto
cks
for
exp
ort
th
rou
gh
ten
der
s.R
ice
No
v-12
Trad
e p
rom
oti
on
Min
iste
rial
pro
po
sals
to
en
han
ce r
ice
trad
e co
op
erat
ion
wit
h f
ou
r o
ther
ASE
AN
nat
ion
s (C
amb
od
ia, L
ao P
DR
, M
yan
mar
an
d V
ietn
am)
app
rove
d b
y Th
ai C
abin
et. T
he
init
iati
ve is
gea
red
at
pre
ven
tin
g in
tern
atio
nal
ric
e p
rice
s fr
om
fal
ling
bel
ow
pro
fita
ble
leve
ls a
nd
en
visa
ges
th
e es
tab
lish
men
t o
f ri
ce t
rad
e zo
nes
alo
ng
bo
rder
ing
ar
eas.
R
ice
Dec
-12
Sto
ck r
elea
seSc
aled
bac
k ea
rlie
r an
no
un
ced
pla
ns
to r
elea
se 6
00 0
00 t
on
nes
of
frag
ran
t ri
ce f
rom
go
vern
men
t st
ock
s th
rou
gh
ten
der
s, o
n c
on
cern
s o
ver
ten
der
s' t
erm
s an
d c
on
dit
ion
s.R
ice
Mar
-13
Go
vern
men
t p
rocu
rem
ent,
su
pp
ort
pri
ces
Ap
pro
ved
th
e ex
ten
sio
n o
f th
e Pa
dd
y Pl
edg
ing
Pro
gra
m f
or
2012
–201
3 o
ff-s
easo
n c
rop
s. F
arm
ers
will
co
nti
nu
e re
ceiv
ing
bet
wee
n B
aht
13 8
00–2
0 00
0 (U
SD 4
68–6
78)
per
to
nn
e o
f p
add
y p
led
ged
, bu
t w
ill n
ot
be
per
mit
ted
to
mo
rtg
age
18 t
ypes
of
low
-qu
alit
y, s
ho
rt-d
ura
tio
n v
arie
ties
. Mo
rtg
aged
am
ou
nts
will
be
add
itio
nal
ly s
ub
ject
to
a v
alu
e ce
ilin
g o
f B
aht
500
000
(USD
16
900)
per
far
m h
ou
seh
old
. Up
to
7 m
illio
n t
on
nes
are
offi
cial
ly
anti
cip
ated
to
be
mo
rtg
aged
un
der
th
e o
ff-s
easo
n r
un
of
the
pro
gra
mm
e, b
etw
een
Ap
ril a
nd
Sep
tem
ber
201
3,
for
an e
stim
ated
co
st o
f B
aht
105
bill
ion
(U
SD 3
.6 b
illio
n).
Ric
eM
ar-1
3St
ock
rel
ease
Ap
pro
ved
th
e re
leas
e o
f 20
000
to
nn
es o
f H
om
Mal
i ric
e an
d 1
0 00
0 to
nn
es o
f 5
per
cen
t b
roke
n r
ice
for
sale
to
th
e d
om
esti
c m
arke
t. A
fu
rth
er 4
0 00
0 to
nn
es o
f p
add
y fr
om
th
e 20
03–2
004
cro
p a
re t
o b
e re
leas
ed t
o t
he
feed
sec
tor,
wit
h 2
0 00
0 to
nn
es o
f fr
agra
nt
rice
exp
ort
s to
Ch
ina
(Mai
nla
nd
) ad
dit
ion
ally
ap
pro
ved
.R
ice
Mar
-13
Sto
ck r
elea
seA
nn
ou
nce
d a
tar
get
of
red
eem
ing
Bah
t 18
0 b
illio
n (
USD
6.1
bill
ion
) w
ort
h o
f re
ven
ue
fro
m t
he
sale
of
pu
blic
st
ock
s b
y th
e en
d o
f Se
pte
mb
er 2
013
in o
rder
to
fin
ance
th
e p
add
y p
led
gin
g p
rog
ram
me.
Ric
eA
pr-
13St
ock
rel
ease
An
no
un
ced
a p
lan
to
rel
ease
500
000
to
nn
es o
f w
hit
e ri
ce f
rom
go
vern
men
t st
ock
s th
rou
gh
ten
der
.R
ice
Ap
r-13
Sto
ck r
elea
seD
elay
ed p
lan
s to
rel
ease
500
000
to
nn
es o
f w
hit
e ri
ce f
rom
Go
vern
men
t st
ock
s th
rou
gh
ten
der
, giv
en d
eclin
es
in d
om
esti
c p
rice
s an
d a
loca
l cu
rren
cy a
pp
reci
atio
n.
Ric
eM
ay-1
3St
ock
rel
ease
An
no
un
ced
pla
ns
to e
xped
ite
the
rele
ase
of
rice
fro
m G
ove
rnm
ent
sto
cks
to d
om
esti
c an
d in
tern
atio
nal
m
arke
ts.
Thai
lan
d/C
hin
a (M
ain
lan
d)
Ric
eN
ov-
12C
oo
per
atio
n a
gre
emen
t, im
po
rt a
gre
emen
tSi
gn
ed a
mem
ora
nd
um
of
un
der
stan
din
g t
o e
nh
ance
co
op
erat
ion
an
d e
xpan
d t
rad
e in
ric
e b
etw
een
th
e tw
o
nat
ion
s. A
sep
arat
e ag
reem
ent
bet
wee
n p
riva
te p
arti
es f
rom
th
e tw
o c
ou
ntr
ies
secu
red
th
e p
rovi
sio
n o
f 26
0 00
0 to
nn
es o
f Th
ai r
ice
to C
hin
a (M
ain
lan
d).
Turk
eyR
ice
Ap
r-13
Imp
ort
qu
ota
, im
po
rt t
arif
fsA
lloca
ted
a 1
00 0
00 t
on
ne,
fre
e o
f d
uty
, im
po
rt q
uo
ta t
o t
he
Turk
ish
Gra
in B
oar
d (
TMO
). T
he
rice
is t
o b
e b
rou
gh
t b
y 1
Sep
tem
ber
201
5.
Ven
ezu
ela
Ric
eD
ec-1
2Pr
ice
con
tro
lsR
aise
d c
eilin
gs
on
co
nsu
mer
pri
ces
by
28 p
erce
nt
to B
olív
ares
7.2
(U
SD 1
.7 )
per
kg
of
Typ
e I r
ice,
to
Bo
lívar
es
6.69
(U
SD 1
.6)
per
kg
of
Typ
e II
rice
an
d t
o B
olív
ares
6.3
4 p
er k
g o
f Ty
pe
III r
ice
(USD
1.5
).R
ice
May
-13
Pro
du
ctio
n s
up
po
rtA
pp
rove
d a
on
e-ti
me
sub
sid
y fo
r th
e 20
13 w
inte
r cr
op
cyc
le. P
rod
uce
rs a
re t
o r
ecei
ve B
olív
ares
1.1
per
kg
(U
SD
175
per
to
nn
e) o
f Ty
pe
A o
r Ty
pe
B p
add
y p
rod
uce
d, b
etw
een
1 J
anu
ary
and
30
Jun
e 20
13, o
n t
op
of
sup
po
rt
pri
ces
of
Bo
lívar
es 2
.50–
2.58
per
kg
(U
SD 3
97–4
10 p
er t
on
ne)
.
Vie
tnam
Ric
eD
ec-1
2Im
po
rt q
uo
taEx
emp
ted
70
000
ton
nes
of
rice
ori
gin
atin
g f
rom
th
e La
o P
DR
fro
m im
po
rt d
uti
es, v
alid
th
rou
gh
201
3.R
ice
Dec
-12
Min
imu
m e
xpo
rt p
rice
sIn
tro
du
ced
a M
inim
um
Exp
ort
Pri
ce (
MEP
) o
f U
SD 3
70 p
er t
on
ne
for
35 p
erce
nt
bro
ken
ric
e, e
ffec
tive
27
Dec
emb
er 2
012.
Ric
eJa
n-1
3G
ove
rnm
ent
pro
cure
men
tA
nn
ou
nce
d t
hat
mem
ber
co
mp
anie
s o
f th
e V
ietn
am F
oo
d A
sso
ciat
ion
wo
uld
pu
rch
ase
1 m
illio
n t
on
nes
of
win
ter-
spri
ng
pad
dy
fro
m f
arm
ers,
sta
rtin
g 2
0 Fe
bru
ary
2013
. Par
tici
pat
ing
co
mp
anie
s ar
e to
pay
no
less
th
an
Do
ng
5 0
00 p
er k
g (
USD
239
per
to
nn
e) o
f p
add
y b
ou
gh
t an
d w
ill r
ecei
ve c
red
it a
t su
bsi
diz
ed r
ates
fo
r th
e p
urp
ose
.R
ice
Feb
-13
Min
imu
m e
xpo
rt p
rice
sSe
t m
inim
um
exp
ort
pri
ces
for
5 p
erce
nt
bro
ken
ric
e at
USD
410
per
to
nn
e an
d a
t U
SD 3
65 p
er t
on
ne
in t
he
case
of
35 p
erce
nt
bro
ken
ric
e, e
ffec
tive
6 F
ebru
ary
2013
.R
ice
Mar
-13
Min
imu
m e
xpo
rt p
rice
sSu
spen
ded
min
imu
m e
xpo
rt p
rice
s fo
r 5
per
cen
t b
roke
n r
ice
and
rai
sed
th
em f
or
35 p
erce
nt
bro
ken
by
USD
5
to U
SD 3
70 p
er t
on
ne.
Ric
eA
pr-
13M
inim
um
exp
ort
pri
ces
Low
ered
flo
or
pri
ces
for
35 p
erce
nt
bro
ken
ric
e b
y U
SD 5
to
USD
365
per
to
nn
e.
* A
col
lect
ion
of m
ajor
ric
e po
licy
deve
lopm
ents
sta
rtin
g in
Jan
uary
201
1 is
ava
ilabl
e at
: htt
p://w
ww
.fao
.org
/eco
nom
ic/e
st/e
st-c
omm
oditi
es/c
omm
odity
-pol
icy-
arch
ive/
en/?
grou
pAN
Dco
mm
odity
=ric
e.

Ma
jor p
olicy d
eve
lop
me
nts
Ma
jor p
olicy d
eve
lop
me
nts
799
OIL
SEED
S:
MA
JOR
POLI
CY D
EVEL
OPM
ENTS
: APR
IL 2
012
- MA
RCH
201
3*C
OU
NTR
YPR
OD
UC
TD
ATE
POLI
CY
CA
TEG
OR
Y/IN
STR
UM
ENT
DES
CR
IPTI
ON
Alg
eria
Soym
eal
Oct
-12
Imp
ort
po
licy
Tem
po
rari
ly s
usp
end
ed im
po
rt d
uti
es o
n s
oym
eal (
and
oth
er f
eed
stu
ff)
to c
on
tain
co
sts
for
do
mes
tic
lives
tock
in
du
stry
an
d t
hu
s ch
eck
rise
s in
loca
l ret
ail p
rice
s.
Arg
enti
na
Bio
die
sel
Ap
r-12
Ren
ewab
le e
ner
gy
po
licy
Post
po
ned
th
e in
crea
se in
man
dat
ory
bio
die
sel b
len
din
g (
fro
m B
7 to
B10
) to
201
3.
Ara
ble
lan
dM
ay-1
2La
nd
tax
atio
nC
arri
ed o
ut
reva
luat
ion
of
agri
cult
ura
l lan
d w
ith
a v
iew
to
rai
se r
eal e
stat
e ta
xati
on
.
Soyb
ean
Au
g-1
2Im
po
rt p
olic
yTe
mp
ora
rily
allo
wed
so
ybea
n im
po
rts
to a
dd
ress
pro
ble
ms
of
exce
ss c
apac
ity
in d
om
esti
c cr
ush
ing
.
Bio
die
sel
Au
g-1
2Tr
ade
po
licy
File
d a
co
mp
lain
t at
th
e W
TO a
gai
nst
th
e EU
ove
r Sp
ain
’s b
iofu
el im
po
rt p
olic
y (l
ater
pu
t o
n h
old
as
Spai
n
amen
ded
its
imp
ort
reg
ula
tio
ns,
res
tori
ng
acc
ess
to t
he
loca
l bio
fuel
s m
arke
t).
Soyb
ean
Oct
-12
Mar
ket
con
tro
lPe
nal
ized
lead
ing
gra
in fi
rms
du
rin
g in
vest
igat
ion
s in
to a
lleg
ed e
xpo
rt t
ax e
vasi
on
.
Bio
fuel
Oct
-12
Exp
ort
po
licy
Ad
just
ed le
vel o
f ex
po
rt t
ax a
nd
of
do
mes
tic
reta
il p
rice
fo
r so
yoil-
bas
ed d
iese
l wit
h a
vie
w t
o s
tim
ula
te
do
mes
tic
bio
die
sel c
on
sum
pti
on
, wh
ile a
t th
e sa
me
tim
e g
uar
ante
ein
g a
deq
uat
e m
arg
ins
for
exp
ort
-ori
ente
d
pro
cess
ors
.
Veg
etab
le
oils
Jan
-13
Imp
ort
po
licy
Tem
po
rari
ly r
aise
d im
po
rt t
arif
fs a
bo
ve M
ERC
OSU
R's
co
mm
on
ext
ern
al t
arif
f.
Au
stra
liaB
iofu
elM
ay-1
2R
enew
able
en
erg
y p
olic
yG
ran
ted
fed
eral
tax
exe
mp
tio
ns
plu
s fi
nan
cial
ass
ista
nce
fro
m s
tate
go
vern
men
ts t
o b
iofu
el c
om
pan
ies.
Ban
gla
des
hPa
lm o
ilA
ug
-12
Imp
ort
po
licy/
mar
ket
reg
ula
tio
nSt
arte
d r
egu
lar
imp
ort
s b
y st
ate
agen
cy t
o g
uar
ante
e d
om
esti
c su
pp
lies
and
sta
bili
ze p
rice
s.
Can
ada
Soyb
ean
May
-12
Sect
or
dev
elo
pm
ent
assi
stan
ceSu
pp
ort
ed d
iver
sifi
cati
on
of
soyb
ean
mar
keti
ng
to
tap
into
new
exp
ort
an
d d
om
esti
c m
arke
ts.
Rap
esee
dO
ct-1
2Se
cto
r d
evel
op
men
t as
sist
ance
Sup
po
rted
R&
D p
roje
cts
to s
ecu
re c
on
tin
ued
gro
wth
in t
he
sect
or.
Bra
ssic
a ca
rin
ata
oil
No
v-12
Ren
ewab
le e
ner
gy
po
licy
Bac
ked
res
earc
h o
n in
du
stri
al a
pp
licat
ion
s o
f ca
rin
ata
oil,
incl
ud
ing
as
avia
tio
n b
iofu
el.
Gra
ins
and
o
ilsee
ds
Feb
-13
Sect
or
dev
elo
pm
ent
assi
stan
ceLa
un
ched
, to
get
her
wit
h c
on
cern
ed p
riva
te s
ecto
r b
od
ies,
vo
lun
tary
sta
nd
ard
s to
co
ntr
ol m
ajo
r p
lan
t p
ests
an
d
dis
ease
s in
gra
in a
nd
oils
eed
cu
ltiv
atio
n.
Rap
esee
d,
soyb
ean
, su
nfl
ow
er
seed
Feb
-13
Sect
or
dev
elo
pm
ent
assi
stan
ceR
aise
d c
ove
rag
e an
d a
reas
incl
ud
ed u
nd
er t
he
cro
p in
sura
nce
pro
gra
mm
e o
f M
anit
ob
a p
rovi
nce
; ad
ded
so
ybea
n a
nd
su
nfl
ow
er s
eed
cro
ps.
Bio
fuel
Feb
-13
Ren
ewab
le e
ner
gy
po
licy
An
no
un
ced
ph
asin
g o
ut
of
bio
fuel
pro
du
ctio
n s
ub
sid
ies
by
2017
– d
raw
ing
att
enti
on
to
th
e b
iod
iese
l in
du
stry
's
inab
ility
to
mee
t th
e n
atio
nal
ble
nd
ing
tar
get
– b
ut
com
mit
ted
to
co
nti
nu
e su
pp
ort
ing
th
e d
evel
op
men
t o
f se
con
d g
ener
atio
n b
iofu
els.
Rap
esee
d
and
oth
er
agri
cult
ura
l co
mm
od
itie
s
Mar
-13
Sect
or
dev
elo
pm
ent
assi
stan
ceLa
un
ched
th
ree
sup
po
rt p
rog
ram
mes
fo
cusi
ng
on
th
e ad
apta
tio
n t
o e
mer
gin
g m
arke
t o
pp
ort
un
itie
s,
com
mer
cial
izat
ion
of
new
pro
du
cts
and
tec
hn
olo
gie
s, a
nd
im
pro
ved
fo
od
saf
ety
and
tra
ceab
ility
.

Foo
d O
utl
oo
k -
Jun
e 2
01
3Fo
od
Ou
tlo
ok
- Ju
ne
20
13
808
CO
UN
TRY
PRO
DU
CT
DA
TEPO
LIC
Y C
ATE
GO
RY
/INST
RU
MEN
TD
ESC
RIP
TIO
N
Ch
ina
Edib
le o
ilsA
ug
-12
Mar
ket
con
tro
lA
sked
to
p e
dib
le o
il p
rod
uce
rs t
o r
egu
larl
y re
po
rt t
hei
r ra
w m
ater
ial,
wh
ole
sale
an
d r
etai
l pri
ces,
th
us
clo
sely
m
on
ito
rin
g p
rice
tre
nd
s an
d in
flat
ion
ris
ks.
Rap
esee
d
soyb
ean
2012
cro
p
year
Stat
e re
serv
esR
aise
d s
tate
pro
cure
men
t p
rice
fo
r ra
pes
eed
an
d s
oyb
ean
to
mai
nta
in in
cen
tive
s fo
r d
om
esti
c p
rod
uct
ion
.
Soyb
ean
Oct
-12
GM
O p
olic
ies
and
reg
ula
tio
ns
Del
ayed
imp
ort
ap
pro
val f
or
seco
nd
gen
erat
ion
GM
so
y va
riet
y m
ean
t fo
r d
irec
t h
um
an c
on
sum
pti
on
.
Veg
etab
le o
ilsD
ec-1
2Im
po
rt/e
xpo
rt p
olic
yLo
wer
ed a
dm
inis
trat
ive
cust
om
fee
s fo
r ex
po
rts
and
imp
ort
s to
sti
mu
late
tra
de
gro
wth
.
Rap
esee
dD
ec-1
2M
arke
t re
gu
lati
on
Enco
ura
ged
fu
ture
s tr
adin
g in
rap
esee
d a
nd
rap
esee
d m
eal (
in a
dd
itio
n t
o r
apes
eed
oil)
.
Soyb
ean
, so
yoil
Ap
r to
No
v 20
12St
ate
rese
rves
Rel
ease
d s
tate
res
erve
s w
ith
a v
iew
to
eas
e su
pp
ly t
igh
tnes
s, t
hu
s ch
ecki
ng
th
e ri
se in
do
mes
tic
oil/
mea
l pri
ces.
Veg
etab
le o
ilsJa
n-1
3Q
ual
ity
stan
dar
ds
Intr
od
uce
d s
tric
ter
qu
alit
y co
ntr
ols
on
ed
ible
oil
imp
ort
s to
gu
aran
tee
pro
du
ct s
afet
y.
Rap
esee
dFe
b-1
3Im
po
rt p
olic
yR
elax
ed 3
-yea
r o
ld b
an o
n r
apes
eed
imp
ort
s fr
om
Au
stra
lia.
Gra
ins
Feb
-13
Pro
du
ctio
n s
up
po
rtR
enew
ed c
om
mit
men
t to
rea
ch s
elf-
suffi
cien
cy in
gra
ins
as
a m
ean
s to
tac
kle
rura
l po
vert
y an
d f
oo
d in
secu
rity
n
ot
exte
nd
ed t
o o
ilsee
ds.
Rap
esee
dFe
b-1
3Im
po
rt r
estr
icti
on
sC
on
sid
ered
rem
ova
l of
rem
ain
ing
imp
ort
res
tric
tio
ns
for
rap
esee
d (
intr
od
uce
d in
200
9 o
n p
hyt
osa
nit
ary
gro
un
ds)
.
Soyb
ean
, ra
pes
eed
oil
Feb
-13
Stat
e re
serv
esR
elea
sed
sta
te r
eser
ves
to e
ase
do
mes
tic
sup
ply
tig
htn
ess
and
sta
bili
ze d
om
esti
c p
rice
s.
Ch
ina/
Sri L
anka
Co
con
ut
pro
du
cts
Dec
-12
Sou
th-S
ou
th c
oo
per
atio
nC
hin
a ag
reed
to
hel
p d
evel
op
th
e co
con
ut
ind
ust
ry in
Sri
Lan
ka, t
o e
nh
ance
exp
ort
atio
n o
f co
con
ut-
bas
ed
pro
du
cts
to C
hin
a.
Co
lom
bia
Soyb
ean
, so
y m
eal,
soyo
ilA
pr-
12B
ilate
ral t
rad
eSi
gn
ed t
rad
e ag
reem
ent
wit
h t
he
Un
ited
Sta
tes,
allo
win
g im
pro
ved
acc
ess
for
US
soyb
ean
pro
du
cts
to t
he
loca
l m
arke
t.
Cu
ba
(Rep
ub
lic o
f)B
iod
iese
lFe
b-1
3R
enew
able
en
erg
y p
olic
y Pr
om
ote
d t
he
esta
blis
hm
ent
of
a n
atio
nal
bio
die
sel i
nd
ust
ry b
ased
on
loca
lly p
rod
uce
d ja
tro
ph
a o
il.
Den
mar
kO
ils a
nd
fat
sN
ov-
12H
ealt
h p
olic
yR
epea
led
on
e-ye
ar o
ld t
ax o
n f
at c
on
sum
pti
on
as
it d
id n
ot
pro
du
ce t
he
chan
ges
so
ug
ht.
Eura
sian
Eco
no
mic
C
om
mu
nit
y (B
elar
us,
K
azak
hst
an,
Kyr
gys
tan
, R
uss
ia, T
ajik
ista
n,
Uzb
ekis
tan
)
Edib
le o
ilsA
pr-
12Im
po
rt p
olic
yEx
ten
ded
imp
ort
du
ty a
pp
lied
to
tro
pic
al v
eget
able
oils
.
Euro
pea
n U
nio
n
Bu
tter
, oliv
e o
ilM
ar-1
2St
ora
ge
aid
Ag
reed
to
pro
vid
e te
mp
ora
ry s
up
po
rt t
o p
riva
te s
tora
ge
of
bu
tter
an
d o
live
oil
to a
dd
ress
sh
ort
-ter
m
mar
keti
ng
pro
ble
ms.
GM
cro
ps
Oct
-12
GM
O p
olic
ies
and
reg
ula
tio
ns
Dec
lare
d il
leg
itim
ate
the
nat
ion
al b
ans
on
GM
cu
ltiv
atio
n in
tro
du
ced
by
sin
gle
mem
ber
Sta
tes
on
to
p o
f t
he
pro
ced
ure
s an
d r
egu
lati
on
s es
tab
lish
ed b
y th
e Eu
rop
ean
Fo
od
Saf
ety
Au
tho
rity
.
Firs
t-g
ener
atio
n
bio
fuel
s
Oct
-12
Ren
ewab
le e
ner
gy
po
licy
Pro
po
sed
to
lim
it c
on
trib
uti
on
of
firs
t-g
ener
atio
n b
iofu
els
to t
he
EU t
ran
spo
rt f
uel
co
nsu
mp
tio
n t
arg
et a
t 5
per
cen
t b
y 20
20, i
n a
n e
ffo
rt t
o m
inim
ize
adve
rse
effe
cts
on
clim
ate
and
glo
bal
fo
od
pro
du
ctio
n.
Oils
eed
sO
ct-1
2M
arke
t re
gu
lati
on
Co
nsi
der
ed m
ean
s to
co
ntr
ol e
xces
sive
sp
ecu
lati
on
in c
om
mo
dit
ies
futu
res
trad
ing
, in
par
ticu
lar
in f
oo
d-r
elat
ed
com
mo
dit
ies.
Oliv
e o
ilN
ov-
12M
arke
t re
gu
lati
on
Co
nsi
der
ed c
han
ges
to
th
e EU
's o
live
oil
mar
keti
ng
reg
ime,
fo
cusi
ng
on
incr
ease
d q
ual
ity
con
tro
ls a
nd
a
po
ssib
le in
crea
se in
th
e tr
igg
er p
rice
fo
r p
riva
te s
tora
ge
aid
.
Bio
die
sel
Jan
-13
Imp
ort
po
licy
Intr
od
uce
d m
and
ato
ry r
egis
trat
ion
of
bio
die
sel i
mp
ort
s o
rig
inat
ing
fro
m A
rgen
tin
a an
d In
do
nes
ia in
th
e co
nte
xt o
f an
ti-d
um
pin
g/a
nti
-su
bsi
dy
inve
stig
atio
ns.
Fiji
Co
con
ut
Feb
-13
Sect
or
dev
elo
pm
ent
assi
stan
ceSu
pp
ort
ed c
oco
nu
t in
du
stry
reh
abili
tati
on
th
rou
gh
en
cou
rag
emen
t o
f p
lan
tin
g/r
epla
nti
ng
act
ivit
ies
usi
ng
im
pro
ved
see
dlin
gs.
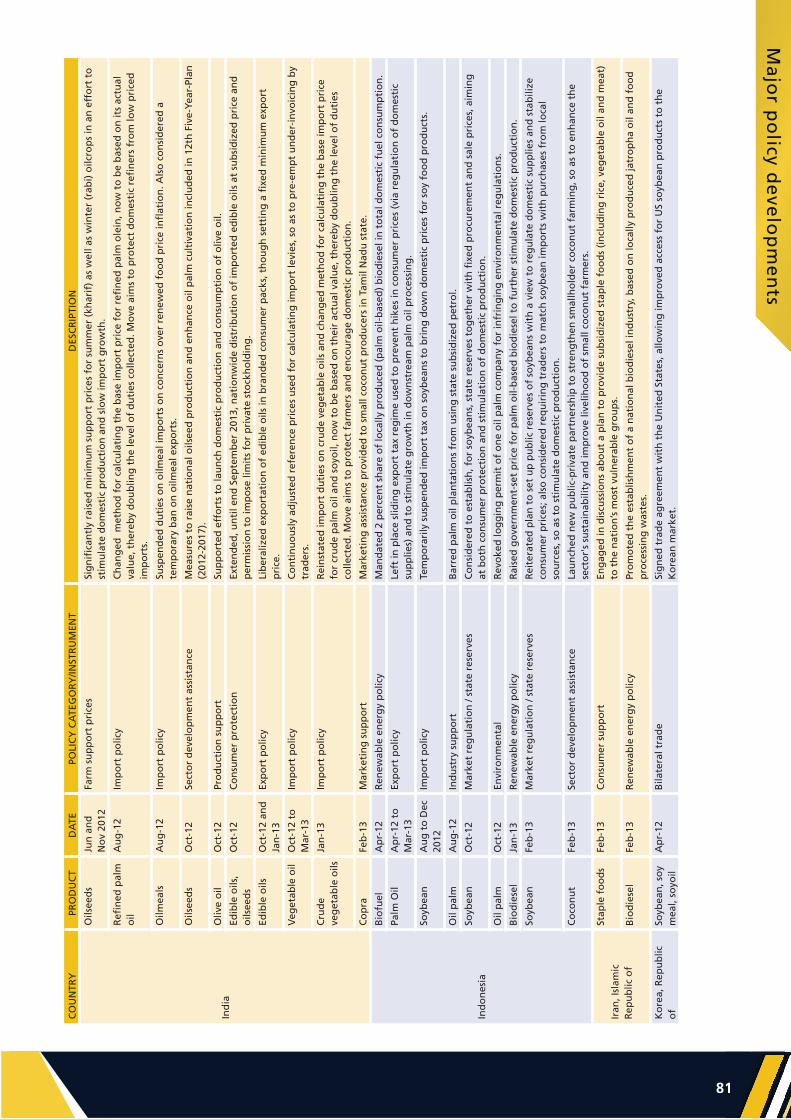
Ma
jor p
olicy d
eve
lop
me
nts
Ma
jor p
olicy d
eve
lop
me
nts
811
CO
UN
TRY
PRO
DU
CT
DA
TEPO
LIC
Y C
ATE
GO
RY
/INST
RU
MEN
TD
ESC
RIP
TIO
N
Ind
ia
Oils
eed
sJu
n a
nd
N
ov
2012
Fa
rm s
up
po
rt p
rice
sSi
gn
ifica
ntl
y ra
ised
min
imu
m s
up
po
rt p
rice
s fo
r su
mm
er (
khar
if)
as w
ell a
s w
inte
r (r
abi)
oilc
rop
s in
an
eff
ort
to
st
imu
late
do
mes
tic
pro
du
ctio
n a
nd
slo
w im
po
rt g
row
th.
Refi
ned
pal
m
oil
Au
g-1
2Im
po
rt p
olic
yC
han
ged
met
ho
d f
or
calc
ula
tin
g t
he
bas
e im
po
rt p
rice
fo
r re
fin
ed p
alm
ole
in, n
ow
to
be
bas
ed o
n it
s ac
tual
va
lue,
th
ereb
y d
ou
blin
g t
he
leve
l of
du
ties
co
llect
ed. M
ove
aim
s to
pro
tect
do
mes
tic
refi
ner
s fr
om
low
pri
ced
im
po
rts.
Oilm
eals
Au
g-1
2Im
po
rt p
olic
ySu
spen
ded
du
ties
on
oilm
eal i
mp
ort
s o
n c
on
cern
s o
ver
ren
ewed
fo
od
pri
ce in
flat
ion
. Als
o c
on
sid
ered
a
tem
po
rary
ban
on
oilm
eal e
xpo
rts.
Oils
eed
sO
ct-1
2Se
cto
r d
evel
op
men
t as
sist
ance
Mea
sure
s to
rai
se n
atio
nal
oils
eed
pro
du
ctio
n a
nd
en
han
ce o
il p
alm
cu
ltiv
atio
n in
clu
ded
in 1
2th
Fiv
e-Y
ear-
Plan
(2
012-
2017
).
Oliv
e o
ilO
ct-1
2Pr
od
uct
ion
su
pp
ort
Sup
po
rted
eff
ort
s to
lau
nch
do
mes
tic
pro
du
ctio
n a
nd
co
nsu
mp
tio
n o
f o
live
oil.
Edib
le o
ils,
oils
eed
sO
ct-1
2C
on
sum
er p
rote
ctio
nEx
ten
ded
, un
til e
nd
Sep
tem
ber
201
3, n
atio
nw
ide
dis
trib
uti
on
of
imp
ort
ed e
dib
le o
ils a
t su
bsi
diz
ed p
rice
an
d
per
mis
sio
n t
o im
po
se li
mit
s fo
r p
riva
te s
tock
ho
ldin
g.
Edib
le o
ilsO
ct-1
2 an
d
Jan
-13
Exp
ort
po
licy
Lib
eral
ized
exp
ort
atio
n o
f ed
ible
oils
in b
ran
ded
co
nsu
mer
pac
ks, t
ho
ug
h s
etti
ng
a fi
xed
min
imu
m e
xpo
rt
pri
ce.
Veg
etab
le o
ilO
ct-1
2 to
M
ar-1
3Im
po
rt p
olic
yC
on
tin
uo
usl
y ad
just
ed r
efer
ence
pri
ces
use
d f
or
calc
ula
tin
g im
po
rt le
vies
, so
as
to p
re-e
mp
t u
nd
er-i
nvo
icin
g b
y tr
ader
s.
Cru
de
veg
etab
le o
ilsJa
n-1
3Im
po
rt p
olic
yR
ein
stat
ed im
po
rt d
uti
es o
n c
rud
e ve
get
able
oils
an
d c
han
ged
met
ho
d f
or
calc
ula
tin
g t
he
bas
e im
po
rt p
rice
fo
r cr
ud
e p
alm
oil
and
so
yoil,
no
w t
o b
e b
ased
on
th
eir
actu
al v
alu
e, t
her
eby
do
ub
ling
th
e le
vel o
f d
uti
es
colle
cted
. Mo
ve a
ims
to p
rote
ct f
arm
ers
and
en
cou
rag
e d
om
esti
c p
rod
uct
ion
.
Co
pra
Feb
-13
Mar
keti
ng
su
pp
ort
M
arke
tin
g a
ssis
tan
ce p
rovi
ded
to
sm
all c
oco
nu
t p
rod
uce
rs in
Tam
il N
adu
sta
te.
Ind
on
esia
Bio
fuel
Ap
r-12
Ren
ewab
le e
ner
gy
po
licy
Man
dat
ed 2
per
cen
t sh
are
of
loca
lly p
rod
uce
d (
pal
m o
il-b
ased
) b
iod
iese
l in
to
tal d
om
esti
c fu
el c
on
sum
pti
on
.
Palm
Oil
Ap
r-12
to
M
ar-1
3Ex
po
rt p
olic
yLe
ft in
pla
ce s
lidin
g e
xpo
rt t
ax r
egim
e u
sed
to
pre
ven
t h
ikes
in c
on
sum
er p
rice
s (v
ia r
egu
lati
on
of
do
mes
tic
sup
plie
s) a
nd
to
sti
mu
late
gro
wth
in d
ow
nst
ream
pal
m o
il p
roce
ssin
g.
Soyb
ean
Au
g t
o D
ec
2012
Imp
ort
po
licy
Tem
po
rari
ly s
usp
end
ed im
po
rt t
ax o
n s
oyb
ean
s to
bri
ng
do
wn
do
mes
tic
pri
ces
for
soy
foo
d p
rod
uct
s.
Oil
pal
m
Au
g-1
2In
du
stry
su
pp
ort
B
arre
d p
alm
oil
pla
nta
tio
ns
fro
m u
sin
g s
tate
su
bsi
diz
ed p
etro
l.
Soyb
ean
Oct
-12
Mar
ket
reg
ula
tio
n /
stat
e re
serv
esC
on
sid
ered
to
est
ablis
h, f
or
soyb
ean
s, s
tate
res
erve
s to
get
her
wit
h fi
xed
pro
cure
men
t an
d s
ale
pri
ces,
aim
ing
at
bo
th c
on
sum
er p
rote
ctio
n a
nd
sti
mu
lati
on
of
do
mes
tic
pro
du
ctio
n.
Oil
pal
m
Oct
-12
Envi
ron
men
tal
Rev
oke
d lo
gg
ing
per
mit
of
on
e o
il p
alm
co
mp
any
for
infr
ing
ing
en
viro
nm
enta
l reg
ula
tio
ns.
Bio
die
sel
Jan
-13
Ren
ewab
le e
ner
gy
po
licy
Rai
sed
go
vern
men
t-se
t p
rice
fo
r p
alm
oil-
bas
ed b
iod
iese
l to
fu
rth
er s
tim
ula
te d
om
esti
c p
rod
uct
ion
.
Soyb
ean
Feb
-13
Mar
ket
reg
ula
tio
n /
stat
e re
serv
es
Rei
tera
ted
pla
n t
o s
et u
p p
ub
lic r
eser
ves
of
soyb
ean
s w
ith
a v
iew
to
reg
ula
te d
om
esti
c su
pp
lies
and
sta
bili
ze
con
sum
er p
rice
s; a
lso
co
nsi
der
ed r
equ
irin
g t
rad
ers
to m
atch
so
ybea
n im
po
rts
wit
h p
urc
has
es f
rom
loca
l so
urc
es, s
o a
s to
sti
mu
late
do
mes
tic
pro
du
ctio
n.
Co
con
ut
Feb
-13
Sect
or
dev
elo
pm
ent
assi
stan
ceLa
un
ched
new
pu
blic
-pri
vate
par
tner
ship
to
str
eng
then
sm
allh
old
er c
oco
nu
t fa
rmin
g, s
o a
s to
en
han
ce t
he
sect
or'
s su
stai
nab
ility
an
d im
pro
ve li
velih
oo
d o
f sm
all c
oco
nu
t fa
rmer
s.
Iran
, Isl
amic
R
epu
blic
of
Stap
le f
oo
ds
Feb
-13
Co
nsu
mer
su
pp
ort
Eng
aged
in d
iscu
ssio
ns
abo
ut
a p
lan
to
pro
vid
e su
bsi
diz
ed s
tap
le f
oo
ds
(in
clu
din
g r
ice,
veg
etab
le o
il an
d m
eat)
to
th
e n
atio
n’s
mo
st v
uln
erab
le g
rou
ps.
Bio
die
sel
Feb
-13
Ren
ewab
le e
ner
gy
po
licy
Pro
mo
ted
th
e es
tab
lish
men
t o
f a
nat
ion
al b
iod
iese
l in
du
stry
, bas
ed o
n lo
cally
pro
du
ced
jatr
op
ha
oil
and
fo
od
p
roce
ssin
g w
aste
s.
Ko
rea,
Rep
ub
lic
of
Soyb
ean
, so
y m
eal,
soyo
ilA
pr-
12B
ilate
ral t
rad
e Si
gn
ed t
rad
e ag
reem
ent
wit
h t
he
Un
ited
Sta
tes,
allo
win
g im
pro
ved
acc
ess
for
US
soyb
ean
pro
du
cts
to t
he
Ko
rean
mar
ket.

Foo
d O
utl
oo
k -
Jun
e 2
01
3Fo
od
Ou
tlo
ok
- Ju
ne
20
13
828
CO
UN
TRY
PRO
DU
CT
DA
TEPO
LIC
Y C
ATE
GO
RY
/INST
RU
MEN
TD
ESC
RIP
TIO
N
Mal
aysi
a
Palm
Oil
Au
g-1
2M
arke
t re
gu
lati
on
/ ex
po
rt p
olic
yR
aise
d d
uty
fre
e ex
po
rt q
uo
ta f
or
cru
de
pal
m o
il w
ith
a v
iew
to
ch
eck
bu
ild-u
p in
do
mes
tic
sto
cks
and
su
pp
ort
fa
rmg
ate
pri
ces.
Palm
Oil
Oct
-12
Mar
ket
reg
ula
tio
n /
exp
ort
po
licy
Dis
con
tin
ued
du
ty f
ree
exp
ort
qu
ota
s fo
r cr
ud
e p
alm
oil
wit
h a
vie
w t
o s
ecu
re a
deq
uat
e su
pp
lies
for
refi
ner
s.
Palm
oil
Oct
-12
Mar
ket
reg
ula
tio
n /
exp
ort
po
licy
Low
ered
exp
ort
tax
on
cru
de
pal
m o
il to
ch
eck
bu
ild-u
p in
do
mes
tic
sto
cks,
wh
ich
pu
sh d
ow
n f
arm
gat
e p
rice
s,
and
intr
od
uce
d s
lidin
g t
ax r
egim
e w
her
e le
vel o
f ta
xati
on
fo
llow
s th
e p
reva
ilin
g m
arke
t p
rice
.
Palm
Oil
Oct
-12
Pro
du
ctio
n s
up
po
rtLa
un
ched
new
oil
pal
m r
epla
nti
ng
sch
eme
wit
h t
he
imm
edia
te o
bje
ctiv
e o
f h
alti
ng
th
e ri
se in
do
mes
tic
pal
m
oil
sto
cks
and
th
e lo
ng
er t
erm
go
al o
f ra
isin
g t
he
aver
age
leve
l of
pro
du
ctiv
ity.
Palm
Oil
Oct
-12
Envi
ron
men
tal p
olic
yEn
forc
ed e
nvi
ron
men
tal l
aws
reg
ard
ing
po
lluti
on
co
ntr
ol i
n p
alm
oil
mill
s.
Palm
Oil
No
v-12
Pro
du
ctio
n p
olic
yLa
un
ched
new
oil
pal
m r
epla
nti
ng
sch
eme
wit
h t
he
imm
edia
te o
bje
ctiv
e o
f h
alti
ng
th
e ri
se in
do
mes
tic
pal
m
oil
sto
cks
and
th
e lo
ng
er t
erm
go
al o
f ra
isin
g t
he
aver
age
leve
l of
pro
du
ctiv
ity.
Palm
oil
No
v-12
to
M
ar-1
3Ex
po
rt p
olic
yPe
rio
dic
ally
ad
just
ed e
xpo
rt t
axes
in li
ne
wit
h t
he
new
ly in
tro
du
ced
slid
ing
tax
reg
ime.
Bio
fuel
Jan
-13
Ren
ewab
le e
ner
gy
po
licy
Mo
ved
to
nat
ion
wid
e im
ple
men
tati
on
of
5 p
erce
nt
man
dat
ory
fu
el b
len
din
g r
ate
(pal
m o
il-b
ased
bio
die
sel)
an
d c
on
sid
ered
intr
od
uci
ng
10
per
cen
t ra
te b
y en
d 2
013.
Bio
die
sel
Feb
-13
Ren
ewab
le e
ner
gy
po
licy
An
no
un
ced
pla
ns
to s
hif
t to
10
per
cen
t m
and
ato
ry b
len
din
g b
y m
id-2
014,
wit
h a
im t
o p
urs
ue
envi
ron
men
tal
ob
ject
ives
an
d in
crea
se d
om
esti
c p
alm
oil
con
sum
pti
on
, th
us
con
trib
uti
ng
to
pri
ce s
tab
iliza
tio
n.
Palm
oil
Feb
-13
Envi
ron
men
tal p
olic
ySu
pp
ort
ed t
he
lau
nch
of
two
nat
ion
al s
chem
es f
or
the
cert
ifica
tio
n o
f su
stai
nab
ly p
rod
uce
d p
alm
oil.
Mex
ico
Oils
an
d f
ats
Oct
-12
Mar
ket
reg
ula
tio
nLo
wer
ed t
arif
fs o
n c
rud
e an
d r
efin
ed v
eget
able
/an
imal
oils
an
d f
ats
in a
n e
ffo
rt t
o c
on
tro
l do
mes
tic
foo
d p
rice
in
flat
ion
.
New
Zea
lan
dB
iofu
elO
ct-1
2R
enew
able
en
erg
y p
olic
yA
llow
ed g
ove
rnm
ent
pro
gra
mm
e in
su
pp
ort
of
bio
die
sel p
rod
uct
ion
, in
clu
din
g in
vest
men
t ai
ds
and
su
bsi
diz
ed
sale
s o
f d
om
esti
cally
pro
du
ced
bio
die
sel,
to e
xpir
e w
ith
ou
t re
new
al.
Paki
stan
Sun
flo
wer
No
v-12
Sup
po
rt p
rice
Rai
sed
pu
rch
ase
pri
ce o
f su
nfl
ow
er s
eed
wit
h a
vie
w t
o s
tim
ula
te d
om
esti
c p
rod
uct
ion
gro
wth
.
Para
gu
aySo
ybea
nN
ov-
12Ex
po
rt p
olic
yC
on
sid
ered
tax
ing
exp
ort
s o
f so
ybea
ns
wit
h a
vie
w t
o e
nco
ura
ge
ship
men
t o
f va
lue-
add
ed s
oyo
il an
d s
oym
eal.
Peru
Fish
mea
l an
d
oil
Dec
-12
Res
ou
rce
man
agem
ent
Cu
t th
e ca
tch
qu
ota
cu
t fo
r th
e ke
y fi
shin
g m
on
ths
of
Dec
emb
er-J
anu
ary
2012
/13
to a
llow
rep
op
ula
tio
n, t
hu
s re
du
cin
g e
xpo
rt a
vaila
bili
ties
.
Phili
pp
ines
Co
con
ut
Feb
-13
Sect
or
dev
elo
pm
ent
assi
stan
ceLa
un
ched
new
pu
blic
-pri
vate
par
tner
ship
to
str
eng
then
sm
allh
old
er c
oco
nu
t fa
rmin
g, a
imin
g a
t th
e d
evel
op
men
t o
f a
sust
ain
able
cer
tifi
ed c
oco
nu
t o
il su
pp
ly c
hai
n.
Serb
iaSo
ybea
n,
sun
flo
wer
Oct
-12
Emer
gen
cy r
elie
f In
tro
du
ced
tem
po
rary
exp
ort
lim
itat
ion
s fo
r so
ybea
n a
nd
su
nfl
ow
er a
nd
pro
vid
ed fi
nan
cial
ass
ista
nce
to
fa
rmer
s af
ter
dro
ug
ht
dec
imat
ed d
om
esti
c cr
op
s.
Ru
ssia
n
Fed
erat
ion
Soyb
ean
Ap
r to
Au
g
2012
Exp
ort
po
licy
Tem
po
rari
ly lo
wer
ed e
xpo
rt d
uty
on
so
ybea
ns
to f
acili
tate
exp
ort
atio
n f
ollo
win
g a
bu
mp
er c
rop
.
Sau
di A
rab
iaB
iod
iese
lFe
b-1
3R
enew
able
en
erg
y p
olic
y En
do
rsed
est
ablis
hm
ent
of
a n
atio
nal
bio
die
sel i
nd
ust
ry u
sin
g u
sed
co
oki
ng
oil
as f
eed
sto
ck.
Tan
zan
iaO
il p
alm
A
ug
-12
Sect
or
dev
elo
pm
ent
assi
stan
ceR
enew
ed c
om
mit
men
t to
su
pp
ort
th
e d
evel
op
men
t o
f th
e o
il p
alm
sec
tor.
Thai
lan
d
Palm
oil
Ap
r to
May
20
12C
on
sum
er p
rote
ctio
nEn
forc
ed r
etai
l pri
ce c
ap a
nd
ho
ard
ing
pro
hib
itio
n f
or
pal
m o
il to
pro
tect
co
nsu
mer
s, a
nd
intr
od
uce
d a
te
mp
ora
ry t
ax o
n p
alm
oil
exp
ort
s to
pre
ven
t sh
ort
ages
in d
om
esti
c su
pp
lies.
Co
con
ut
No
v-12
Sect
or
dev
elo
pm
ent
assi
stan
ceIs
sued
5-y
ear
acti
on
pla
n f
or
the
dev
elo
pm
ent
of
nat
ion
al c
oco
nu
t p
rod
uct
ion
.
Bio
fuel
No
v-12
Bio
fuel
reg
ula
tio
nR
aise
d m
and
ato
ry f
uel
ble
nd
ing
rat
e (w
ith
pal
m o
il-b
ased
bio
die
sel)
to
5 p
erce
nt.
Palm
oil
Dec
-12
Pro
du
cer
sup
po
rt /
con
sum
er p
rote
ctio
nEs
tab
lish
ed a
min
imu
m p
rice
ran
ge
for
oil
pal
m f
ruit
pu
rch
ases
by
pal
m o
il fa
cto
ries
so
as
to p
rote
ct f
arm
ers,
ev
entu
ally
sec
uri
ng
do
mes
tic
pro
du
ctio
n a
nd
pre
ven
tin
g s
urg
es in
co
nsu
mer
pri
ces.
Palm
oil
Jan
-13
Mar
ket
reg
ula
tio
nA
ccep
ted
to
tak
e p
alm
oil
into
pu
blic
sto
ck t
o s
tem
a f
all i
n f
arm
gat
e p
rice
.

Ma
jor p
olicy d
eve
lop
me
nts
Ma
jor p
olicy d
eve
lop
me
nts
833
CO
UN
TRY
PRO
DU
CT
DA
TEPO
LIC
Y C
ATE
GO
RY
/INST
RU
MEN
TD
ESC
RIP
TIO
N
Ukr
ain
e
Soyb
ean
sO
ct-1
2Ex
po
rt p
olic
ySo
ug
ht
acce
ss t
o C
hin
ese
soyb
ean
imp
ort
mar
ket
un
der
go
vern
men
t-to
-go
vern
men
t lo
an-f
or-
cro
p d
eal.
Sun
flo
wer
Feb
-13
Mar
ket
reg
ula
tio
nA
dju
sted
do
wn
war
d t
he
min
imu
m p
rice
s o
f su
nfl
ow
er s
eed
, oil
and
mea
l to
refl
ect
wea
ken
ing
do
mes
tic
mar
ket
pri
ces.
Soyb
ean
Feb
-13
Pro
du
ctio
n s
up
po
rtEx
ten
ded
su
bsi
diz
atio
n o
f cr
op
insu
ran
ce t
o m
aize
, so
ybea
n a
nd
su
gar
bee
t.
Un
ited
Sta
tes
Soyb
ean
, so
y m
eal,
soyo
ilA
pr-
12B
ilate
ral t
rad
eSi
gn
ed t
rad
e ag
reem
ent
wit
h C
olo
mb
ia, s
ecu
rin
g im
pro
ved
acc
ess
for
soyb
ean
pro
du
cts
to t
he
Co
lom
bia
n
mar
ket.
Soyb
ean
, so
y m
eal,
soyo
ilA
pr-
12B
ilate
ral t
rad
eSi
gn
ed t
rad
e ag
reem
ent
wit
h t
he
Rep
ub
lic o
f K
ore
a, s
ecu
rin
g im
pro
ved
acc
ess
for
soyb
ean
pro
du
cts
to t
he
Ko
rean
mar
ket.
Gra
ins
and
o
ilsee
ds
Ap
r-12
Mar
ket
reg
ula
tio
nR
aise
d m
arg
in p
arti
cip
ants
nee
d t
o d
epo
sit,
in o
rder
to
gu
aran
tee
spec
ula
tive
fu
ture
s p
osi
tio
ns
for
all
com
mo
dit
ies.
Bio
fuel
Ap
r-12
to
Ja
n-1
3R
enew
able
en
erg
y p
olic
yPr
ovi
ded
fin
anci
al a
ssis
tan
ce t
o p
rod
uce
rs o
f b
iofu
el a
nd
to
en
titi
es c
on
du
ctin
g r
esea
rch
on
ad
van
ced
bio
fuel
s,
esp
ecia
lly t
ho
se b
ased
on
no
n-e
dib
le f
eed
sto
cks.
Ag
ricu
ltu
ral
com
mo
dit
ies
Au
g-1
2Em
erg
ency
rel
ief
Pro
vid
ed a
ssis
tan
ce t
o f
arm
ers
affe
cted
by
exce
pti
on
al d
rou
gh
t.
Bio
fuel
Oct
-12
Bio
fuel
reg
ula
tio
nR
aise
d t
he
req
uir
ed a
mo
un
t o
f b
io-b
ased
die
sel t
o b
e in
corp
ora
ted
into
th
e n
atio
nal
fu
el m
arke
t in
201
3.
Gra
ins
and
o
ilsee
ds
Oct
-12
Mar
ket
reg
ula
tio
nC
on
sid
ered
mea
ns
to c
on
tro
l exc
essi
ve s
pec
ula
tio
n in
co
mm
od
itie
s fu
ture
s tr
adin
g, i
n p
arti
cula
r in
fo
od
-rel
ated
co
mm
od
itie
s.
Bio
die
sel
Dec
-12
Tax
cred
itG
ran
ted
ret
roac
tive
fed
eral
tax
cre
dit
fo
r b
iod
iese
l fo
r al
l of
2012
, an
d e
xten
ded
up
to
en
d 2
013.
Ag
ricu
ltu
ral
com
mo
dit
ies
Jan
-13
Ag
ricu
ltu
ral p
olic
yPr
ovi
sio
nal
ly e
xten
ded
200
8-20
12 F
arm
Bill
fo
r n
ine
mo
nth
s, i.
e. t
hro
ug
h t
he
2013
cro
p-g
row
ing
sea
son
, wit
h
the
exce
pti
on
of
som
e p
rog
ram
mes
su
ch a
s th
e co
nse
rvat
ion
sch
eme
and
em
erg
ency
rel
ief
mea
sure
s.
Rap
esee
dFe
b-1
3Pr
od
uct
ion
su
pp
ort
Ad
apte
d f
eder
al c
rop
insu
ran
ce p
rog
ram
me
to s
pec
ific
nee
ds
of
farm
ers
gro
win
g h
igh
-ole
ic r
apes
eed
.
Cam
elin
a o
ilFe
b-1
3R
enew
able
en
erg
y p
olic
yA
pp
rove
d o
il o
f ca
mel
ina
seed
as
bio
die
sel f
eed
sto
ck, m
eeti
ng
th
e 50
per
cen
t G
HG
red
uct
ion
th
resh
old
re
qu
ired
to
qu
alif
y u
nd
er U
S b
ioen
erg
y p
olic
ies.
Vie
tnam
Refi
ned
so
y,
pal
m o
ilJa
n-1
3Im
po
rt p
olic
yC
on
sid
ered
ch
arg
ing
“em
erg
ency
imp
ort
tar
iffs
” o
n r
efin
ed s
oy
and
pal
m o
il to
pre
ven
t ri
sin
g im
po
rts
fro
m
hu
rtin
g d
om
esti
c p
rod
uce
rs.
Zim
bab
we
Soyb
ean
No
v-12
Sect
or
dev
elo
pm
ent
assi
stan
cePr
ovi
ded
ince
nti
ves
for
the
dev
elo
pm
ent
of
soyb
ean
pro
du
ctio
n.
* A
col
lect
ion
of m
ajor
oils
eed
polic
y de
velo
pmen
ts s
tart
ing
in J
anua
ry 2
011
is a
vaila
ble
at: h
ttp:
//ww
w.f
ao.o
rg/e
cono
mic
/est
/est
-com
mod
ities
/com
mod
ity-p
olic
y-ar
chiv
e/en
/?gr
oupA
ND
com
mod
ity=
Oils
eeds
,%20
oils
%20
and%
20m
eals
.

Foo
d O
utl
oo
k -
Jun
e 2
01
3Fo
od
Ou
tlo
ok
- Ju
ne
20
13
848
SUG
AR:
M
AJO
R PO
LICY
DEV
ELO
PMEN
TS: J
AN
UA
RY 2
013
- MID
-MA
Y 2
013*
CO
UN
TRY
PRO
DU
CT
GR
OU
PPR
OD
UC
TD
ATE
POLI
CY
CA
TEG
ORY
/ IN
STR
UM
ENT
DES
CR
IPTI
ON
Bra
zil
Sug
ar
Eth
ano
lM
ay-1
3B
len
d r
atio
Go
vern
men
t o
f B
razi
l in
crea
sed
th
e am
ou
nt
of
eth
ano
l ble
nd
ed in
to g
aso
line
fro
m 2
0 p
erce
nt
to 2
5 p
erce
nt.
Euro
pea
n U
nio
nSu
gar
Sug
ar a
nd
is
og
luco
seM
ar-1
3Ta
xes
and
qu
ota
sA
do
pte
d o
n 2
2 M
arch
201
3. C
om
mis
sio
n Im
ple
men
tin
g R
egu
lati
on
(EU
) N
o. 2
81/2
013
sets
mea
sure
s w
ith
re
spec
t to
th
e re
leas
e o
f o
ut-
of-
qu
ota
su
gar
an
d is
og
luco
se o
n t
he
EU m
arke
t at
red
uce
d s
urp
lus
levy
du
rin
g
the
2012
-201
3 m
arke
tin
g y
ear.
EUR
172
/to
nn
e fi
xed
as
surp
lus
levy
fo
r a
max
imu
m q
uan
tity
of
150
000
ton
nes
o
f su
gar
(in
wh
ite
sug
ar e
qu
ival
ent)
an
d 8
000
to
nn
es o
f is
og
luco
se (
dry
mat
ter)
pro
du
ced
in e
xces
s o
f th
e q
uo
ta fi
xed
in R
egu
lati
on
No
. 123
4/20
07.
Ind
ia
Sug
ar
Sug
arJa
n-1
3Ta
xes
and
qu
ota
sG
ove
rnm
ent
ease
s p
enal
ty f
or
con
vers
ion
of
un
sold
su
gar
into
levy
su
gar
in t
he
giv
en p
erio
d o
f re
leas
e fr
om
Dec
emb
er t
o M
arch
. Als
o, D
ec-M
ar p
rod
uct
ion
qu
ota
low
ered
to
6.6
5 m
illio
n t
on
nes
fro
m 6
.80
mill
ion
to
nn
es.
Sug
ar
Sug
arM
ar-1
3Q
uo
tas
Mill
ers
per
mit
ted
to
sel
l 10.
4 m
illio
n t
on
nes
of
no
n-l
evy
sug
ar f
rom
Ap
ril t
o S
epte
mb
er in
th
e o
pen
mar
ket.
Sug
ar
Sug
arA
pr-
13Ta
xes
and
qu
ota
sR
emo
ved
levy
qu
ota
mec
han
ism
un
der
wh
ich
su
gar
mill
s h
ad t
o s
ell 1
0 p
erce
nt
of
pro
du
ctio
n a
t b
elo
w
mar
ket
pri
ces
for
Pub
lic D
istr
ibu
tio
n S
yste
m; a
bo
lish
ed m
ech
anis
m w
hic
h r
equ
ired
mill
s to
sel
l sp
ecifi
ed
qu
ota
of
sug
ar.
Bila
tera
l/M
ult
ilate
ral
Sug
ar
Sug
arM
ay-1
3Im
po
rt d
uti
esTh
e C
ust
om
s U
nio
n o
f R
uss
ia, B
elar
us
and
Kaz
akh
stan
do
ub
led
th
e ra
w s
ug
ar im
po
rt d
uty
to
US$
205
per
to
nn
e st
arti
ng
fro
m M
ay 2
013.
Paki
stan
Sug
ar
Sug
arM
ar-1
3Ex
po
rt s
ub
sid
y an
d
taxe
sFr
eig
ht
sub
sid
y o
f R
s 1.
75/k
g (
$18/
ton
ne)
ap
pro
ved
by
the
Eco
no
mic
Co
ord
inat
ion
Co
mm
itte
e o
f th
e C
abin
et
(EC
C)
for
the
exp
ort
of
up
to
1.2
mill
ion
to
nn
es o
f su
gar
. Fed
eral
exc
ise
du
ty lo
wer
ed b
y Fe
der
al B
oar
d o
f R
even
ue
on
do
mes
tic
sug
ar s
ales
fro
m 8
.0 p
erce
nt
to 0
.5 p
erce
nt.
* A
col
lect
ion
of m
ajor
sug
ar p
olic
y de
velo
pmen
ts s
tart
ing
in J
anua
ry 2
013
is a
lso
avai
labl
e at
: htt
p://w
ww
.fao
.org
/eco
nom
ic/e
st/e
st-c
omm
oditi
es/c
omm
odity
-pol
icy-
arch
ive/
en/?
grou
pAN
Dco
mm
odity
=Su
gar

Ma
jor p
olicy d
eve
lop
me
nts
Ma
jor p
olicy d
eve
lop
me
nts
855
MEA
T:
MA
JOR
RICE
PO
LICY
DEV
ELO
PMEN
TS: N
OV
EMBE
R 2
012
- MA
Y 2
013*
CO
UN
TRY
PRO
DU
CT
DA
TEPO
LIC
Y C
ATE
GO
RY/
INST
RU
MEN
TD
ESC
RIP
TIO
N
Bel
aru
s
Bee
fJa
n-1
3Im
po
rt b
anSu
spen
ded
imp
ort
s o
f B
razi
lian
bee
f d
ue
to t
he
ou
tbre
ak o
f b
ovi
ne
spo
ng
ifo
rm e
nce
ph
alo
pat
hy
(BSE
) in
th
e co
un
try.
Pou
ltry
Jan
-13
Imp
ort
ban
Imp
ose
d t
emp
ora
ry r
estr
icti
on
s o
n t
he
imp
ort
of
po
ult
ry a
nd
po
ult
ry p
rod
uct
fro
m B
ulg
aria
to
pre
ven
t a
spre
ad o
f N
ewca
stle
dis
ease
.
Pig
mea
t, p
ou
ltry
Mar
-13
Imp
ort
ban
lift
edLi
fted
th
e b
an it
had
imp
ose
d in
ear
ly J
anu
ary
on
th
e im
po
rt o
f p
ork
, po
ult
ry a
nd
rea
dy
mea
t p
rod
uct
s co
nta
inin
g
po
rk f
rom
Ger
man
y.
Pou
ltry
Ap
r-13
Imp
ort
ban
lift
edLi
fted
th
e b
an o
n t
he
imp
ort
of
po
ult
ry m
eat
fro
m C
zech
Rep
ub
lic.
Bila
tera
l/Mu
ltila
tera
lPo
ult
ryFe
b-1
3A
nim
al h
ealt
h
reg
ula
tio
ns
Ru
ssia
-Bel
aru
s-K
azak
hst
an: A
pp
rove
d v
eter
inar
y ce
rtifi
cate
fo
r ex
po
rt o
f p
ou
ltry
fro
m U
SA t
o t
he
Cu
sto
ms
Un
ion
.
Can
ada
Bee
fA
pr-
13St
ate
mar
ket
inte
rven
tio
nEx
ten
ded
th
e n
atio
nal
bee
f le
vy u
nti
l 30
Jun
e 20
15. T
he
no
n-r
efu
nd
able
nat
ion
al le
vy (
exp
ecte
d t
o b
e w
ort
h m
ore
th
an C
AD
600
000
) h
as b
een
au
tho
rize
d t
o c
on
tin
ue
pro
vid
ing
ind
ust
ry s
tab
ility
th
rou
gh
fu
nd
ing
nat
ion
al m
arke
tin
g,
pro
mo
tio
n a
nd
res
earc
h a
ctiv
itie
s.
Ch
ile
Bee
f Fe
b-1
3Im
po
rt b
an li
fted
End
ed it
s b
an o
n U
S b
eef
and
bee
f p
rod
uct
s, im
po
sed
in 2
003
afte
r a
US
cow
tes
ted
po
siti
ve f
or
bo
vin
e sp
on
gif
orm
en
cep
hal
op
ath
y (B
SE).
Bee
fA
pr-
13Ex
po
rt b
anSu
spen
ded
bee
f ex
po
rts
to t
he
EU w
hile
it in
vest
igat
es s
up
ply
ch
ain
wea
knes
ses
iden
tifi
ed b
y a
Euro
pea
n v
eter
inar
y m
issi
on
.
Ch
ina
Bee
fD
ec-1
2Im
po
rt b
anSu
spen
ded
imp
ort
s o
f B
razi
lian
bee
f d
ue
to t
he
ou
tbre
ak o
f b
ovi
ne
spo
ng
ifo
rm e
nce
ph
alo
pat
hy
(BSE
) in
th
e co
un
try.
Co
lom
bia
Mea
tA
pr-
13Ex
po
rt b
anR
estr
icte
d m
eat
exp
ort
s to
Ven
ezu
ela
to p
reve
nt
do
mes
tic
sho
rtag
es a
nd
ris
ing
do
mes
tic
pri
ces.
Egyp
tB
eef
Dec
-12
Imp
ort
ban
Susp
end
ed im
po
rts
of
Bra
zilia
n b
eef
du
e to
th
e o
utb
reak
of
bo
vin
e sp
on
gif
orm
en
cep
hal
op
ath
y (B
SE)
in t
he
cou
ntr
y.
Ind
on
esia
Pou
ltry
Dec
-12
Imp
ort
ban
Susp
end
ed t
he
imp
ort
of
po
ult
ry f
rom
Au
stra
lia f
ollo
win
g n
oti
fica
tio
n f
rom
th
e W
orl
d O
rgan
izat
ion
fo
r A
nim
al
Hea
lth
(O
IE)
abo
ut
infe
ctio
us
dis
ease
s af
fect
ing
po
ult
ry in
th
e co
un
try.
Jap
anB
eef
Dec
-12
Imp
ort
ban
Susp
end
ed im
po
rts
of
Bra
zilia
n b
eef
du
e to
th
e o
utb
reak
of
bo
vin
e sp
on
gif
orm
en
cep
hal
op
ath
y (B
SE)
in t
he
cou
ntr
y.
Bee
fFe
b-1
3Im
po
rt b
an li
fted
Lift
ed it
s b
an o
n im
po
rts
of
bee
f fr
om
th
e U
S, F
ran
ce a
nd
th
e N
eth
erla
nd
s.
Jord
anB
eef
Jan
-13
Imp
ort
ban
Susp
end
ed im
po
rts
of
Bra
zilia
n b
eef
du
e to
th
e o
utb
reak
of
bo
vin
e sp
on
gif
orm
en
cep
hal
op
ath
y (B
SE)
in t
he
cou
ntr
y.
Kyr
gyz
stan
Pou
ltry
Ap
r-13
Imp
ort
ban
Ban
ned
imp
ort
s o
f p
ou
ltry
an
d p
ou
ltry
pro
du
cts
fro
m C
hin
a in
co
nn
ecti
on
wit
h t
he
spre
ad o
f th
e n
ew H
7N9
viru
s in
C
hin
a.
Mal
aysi
aPo
ult
ryA
pr-
13Im
po
rt b
anSu
spen
ded
tem
po
rari
ly t
he
imp
ort
of
chic
ken
pro
du
cts
fro
m C
hin
a as
a p
reca
uti
on
ag
ain
st t
he
H7N
9 av
ian
infl
uen
za.
Peru
Bee
fJa
n-1
3Im
po
rt b
anSu
spen
ded
imp
ort
s o
f B
razi
lian
bee
f d
ue
to t
he
ou
tbre
ak o
f b
ovi
ne
spo
ng
ifo
rm e
nce
ph
alo
pat
hy
(BSE
) in
th
e co
un
try.
Phili
pp
ines
Pou
ltry
No
v-12
Imp
ort
ban
Susp
end
ed t
emp
ora
rily
th
e im
po
rtat
ion
of
po
ult
ry a
nd
oth
er p
ou
ltry
pro
du
cts
fro
m A
ust
ralia
bec
ause
of
the
rece
nt
ou
tbre
ak o
f H
igh
ly P
ath
og
enic
Avi
an In
flu
enza
(H
PAI)
.
Pou
ltry
No
v-13
Imp
ort
ban
lift
edLi
fted
th
e b
an o
n p
ou
ltry
pro
du
cts
imp
ort
ed f
rom
th
e C
hin
ese
Pro
vin
ce o
f Ta
iwan
aft
er g
lob
al h
ealt
h a
uth
ori
ties
d
ecla
red
it f
ree
of
the
bir
d fl
u v
iru
s.
Qat
arB
eef
Jan
-13
Imp
ort
ban
Susp
end
ed im
po
rts
of
Bra
zilia
n b
eef
du
e to
th
e o
utb
reak
of
bo
vin
e sp
on
gif
orm
en
cep
hal
op
ath
y (B
SE)
in t
he
cou
ntr
y.
Rep
ub
lic o
f K
ore
aB
eef
Dec
-12
Imp
ort
ban
Susp
end
ed im
po
rts
of
Bra
zilia
n b
eef
du
e to
th
e o
utb
reak
of
bo
vin
e sp
on
gif
orm
en
cep
hal
op
ath
y (B
SE)
in t
he
cou
ntr
y.

Foo
d O
utl
oo
k -
Jun
e 2
01
3Fo
od
Ou
tlo
ok
- Ju
ne
20
13
868
CO
UN
TRY
PRO
DU
CT
DA
TEPO
LIC
Y C
ATE
GO
RY/
INST
RU
MEN
TD
ESC
RIP
TIO
N
Ru
ssia
Pou
ltry
Jan
-13
Imp
ort
ban
Res
tric
ted
tem
po
rari
ly im
po
rts
fro
m t
he
on
e sp
ecifi
c p
ou
ltry
far
m in
Ukr
ain
e, a
nd
in
tro
du
ced
en
han
ced
lab
ora
tory
co
ntr
ol o
f p
rod
uct
s co
min
g f
rom
a a
no
ther
co
mp
any.
Mea
tFe
b-1
3Im
po
rt b
anB
ann
ed im
po
rts
of
chill
ed p
ork
, bee
f an
d p
ou
ltry
fro
m G
erm
any
for,
alle
ged
ly,
exce
ssiv
ely
lax
foo
d s
afet
y co
ntr
ols
, ci
tin
g u
ncl
ear
ori
gin
of
the
mea
t, m
isre
pre
sen
tati
on
of
the
mea
t p
rod
uct
s, la
ck o
f m
on
ito
rin
g o
f ch
emic
al in
gre
die
nts
an
d c
on
tam
inat
ion
.
Bee
f, p
igm
eat,
p
ou
ltry
Feb
-13
Imp
ort
ban
Ban
ned
th
e im
po
rts
of
fro
zen
po
rk a
nd
bee
f, a
s w
ell a
s tu
rkey
mea
t an
d b
y-p
rod
uct
s fr
om
th
e U
S. T
he
mo
ve w
as
bas
ed o
n t
he
pre
sen
ce o
f th
e b
ann
ed g
row
th p
rom
ote
r, ra
cto
pam
ine,
in t
he
pro
du
cts.
Pou
ltry
Mar
-13
Imp
ort
ban
lift
edA
pp
rove
d im
po
rts
of
po
ult
ry f
rom
tw
o p
roce
ssin
g p
lan
ts in
Bra
zil,
in a
firs
t co
ncr
ete
step
to
war
ds
lifti
ng
a b
an o
n
mea
t im
po
rts
fro
m t
hre
e so
uth
ern
Bra
zilia
n s
tate
s.
Live
sto
ckM
ar-1
3St
ate
mar
ket
inte
rven
tio
nA
pp
rove
d,w
ith
Res
olu
tio
n N
r 33
8, t
he
dis
bu
rsem
ent
of
sub
sid
ies
fro
m t
he
2013
fed
eral
bu
dg
et t
o a
gri
cult
ura
l p
rod
uce
rs a
nd
an
imal
bre
eder
s. T
he
sub
sid
ies
amo
un
t to
RU
B 6
,77
bill
ion
(U
SD 2
21 m
illio
n).
Bee
f, p
igm
eat
Ap
r-13
Imp
ort
ban
Ban
ned
vir
tual
ly a
ll b
eef
and
po
rk f
rom
Can
ada,
aft
er C
anad
ian
far
mer
s w
ere
gra
nte
d p
erm
issi
on
to
use
Pay
lean
an
d
Op
tafl
exx
as d
ieta
ry g
row
th p
rom
ota
nts
.
Bee
fA
pr-
13Im
po
rt b
anB
ann
ed a
lmo
st a
ll im
po
rts
of
Mex
ican
bee
f b
ecau
se o
f co
nce
rns
that
Mex
ican
pro
du
cers
had
no
t co
mp
lied
wit
h a
co
mm
itm
ent
to r
efra
in f
rom
usi
ng
th
e an
imal
fee
d a
dd
itiv
e, r
acto
pam
ine,
wh
ich
pro
mo
tes
lean
nes
s in
an
imal
s ra
ised
fo
r th
eir
mea
t.
Sau
di A
rab
iaB
eef
Dec
-12
Imp
ort
ban
Susp
end
ed im
po
rts
of
Bra
zilia
n b
eef
du
e to
th
e o
utb
reak
of
bo
vin
e sp
on
gif
orm
en
cep
hal
op
ath
y (B
SE)
in t
he
cou
ntr
y.
Sou
th A
fric
aB
eef
Dec
-12
Imp
ort
ban
Susp
end
ed im
po
rts
of
Bra
zilia
n b
eef
du
e to
th
e o
utb
reak
of
bo
vin
e sp
on
gif
orm
en
cep
hal
op
ath
y (B
SE)
in t
he
cou
ntr
y.
Thai
lan
dB
eef
Feb
-13
Imp
ort
ban
lift
edLi
fted
th
e b
an o
n im
po
rts
of
bee
f p
rod
uct
s fr
om
th
e EU
wh
ich
was
imp
ose
d in
200
1 af
ter
the
ou
tbre
ak o
f b
ovi
ne
spo
ng
ifo
rm e
nce
ph
alo
pat
hy
(BSE
). T
hai
lan
d p
arti
ally
rel
axed
th
e m
easu
re in
200
6, b
ut
kep
t a
ban
in p
lace
on
bee
f an
d
bee
f p
rod
uct
s co
min
g f
rom
a n
um
ber
of
EU m
emb
er s
tate
s.
Ukr
ain
e
Live
sto
ckJa
n-1
3St
ate
mar
ket
inte
rven
tio
nA
nn
ou
nce
d a
rec
ord
allo
cati
on
of
UA
H 6
50 m
illio
n (
USD
80.
4 m
illio
n)
fro
m t
he
stat
e b
ud
get
to
be
inve
sted
in s
up
po
rt
of
the
lives
tock
sec
tor
in 2
013.
Pig
mea
tM
ar-1
3Im
po
rt b
anB
ann
ed im
po
rts
of
po
rk f
rom
Bra
zil,
on
cla
ims
that
var
iou
s co
mp
anie
s fr
om
Bra
zil d
id n
ot
mee
t p
ork
saf
ety
ind
icat
ors
req
uir
ed b
y U
krai
nia
n la
w.
Pou
ltry
May
-13
Exp
ort
ban
Susp
end
ed e
xpo
rts
of
chic
ken
mea
t to
th
e R
uss
ian
Fed
erat
ion
fro
m t
wo
pro
du
cin
g fi
rms
wh
ile in
vest
igat
ing
a R
uss
ian
al
leg
atio
n o
f co
nta
min
atio
n.
Pig
mea
t, p
igs
May
-13
Imp
ort
ban
Ban
ned
imp
ort
s o
f p
igs,
po
rk a
nd
pro
du
cts
mad
e o
f it
fro
m B
elar
us,
du
e to
th
e p
oss
ible
ou
tbre
ak o
f A
fric
an s
win
e fe
ver
(ASF
) in
a d
istr
ict
of
Bel
aru
s.
Un
ited
Ara
b E
mir
ates
Pou
ltry
Feb
-13
Imp
ort
ban
Ban
ned
po
ult
ry im
po
rts
fro
m B
ulg
aria
to
pre
ven
t th
e en
try
of
epid
emic
dis
ease
s .
Vie
tnam
Pou
ltry
Ap
r-13
Imp
ort
ban
Susp
end
ed p
ou
ltry
imp
ort
s fr
om
Ch
ina
afte
r d
etec
tio
n o
f th
e n
ew a
vian
infl
uen
za s
trai
n H
7N9.
* A
col
lect
ion
of m
ajor
mea
t po
licy
deve
lopm
ents
sta
rtin
g in
Jan
uary
201
1 is
ava
ilabl
e at
: htt
p://w
ww
.fao
.org
/eco
nom
ic/e
st/e
st-c
omm
oditi
es/c
omm
odity
-pol
icy-
arch
ive/
en/?
grou
pAN
Dco
mm
odity
=M
eat

Ma
jor p
olicy d
eve
lop
me
nts
Ma
jor p
olicy d
eve
lop
me
nts
877
DA
IRY:
M
AJO
R PO
LICY
DEV
ELO
PMEN
TS: N
OV
EMBE
R 2
012
- MA
Y 2
013*
CO
UN
TRY
PRO
DU
CT
DA
TEPO
LIC
Y C
ATE
GO
RY
/IN
STR
UM
ENT
DES
CR
IPTI
ON
Bra
zil
Dai
ry p
rod
uct
sA
pr-
13Ta
riff
rat
e q
uo
ta
Esta
blis
hed
a t
arif
f ra
te q
uo
ta (
TRQ
) o
n la
cto
se p
rod
uct
s fo
r 4
476
ton
nes
, su
bje
ct t
o a
n im
po
rt d
uty
of
2 p
erce
nt.
Th
e o
ut-
of-
qu
ota
imp
ort
tar
iff
rem
ain
s 16
per
cen
t. T
he
pre
fere
nti
al t
arif
f q
uo
ta, i
ntr
od
uce
d t
o h
elp
alle
viat
e th
e h
igh
p
rod
uct
ion
co
sts
faci
ng
Bra
zil’s
sw
ine
and
dai
ry in
du
stry
, is
valid
fo
r a
12-m
on
th p
erio
d.
Bu
lgar
iaD
airy
pro
du
cts
Jan
-13
Mar
keti
ng
an
d T
rad
eIn
tro
du
ced
a r
egu
lati
on
to
lim
it p
rod
uct
ion
of
dai
ry p
rod
uct
s co
nta
inin
g v
eget
able
oil
(pal
m o
il) in
gre
die
nts
.
Ind
ia
Dai
ry p
rod
uct
sN
ov-
12Ex
po
rt b
an li
fted
Lift
ed t
he
ban
on
th
e ex
po
rt o
f m
ilk a
nd
cre
am, c
on
cen
trat
ed a
nd
/or
swee
ten
ed m
ilk a
nd
cre
am, w
ho
le m
ilk p
ow
der
, d
airy
wh
iten
er a
nd
infa
nt
milk
fo
od
s.
Milk
po
wd
erN
ov-
12TR
Q r
evis
edR
evis
ed t
arif
f ra
te q
uo
ta o
n s
kim
milk
po
wd
er t
o p
erm
it im
po
rts
up
to
10
000
MT
at a
15
per
cen
t ta
riff
rat
e.
Iraq
Milk
, Dai
ry p
rod
uct
sA
pr-
13Ex
po
rt b
an li
fted
Lift
ed im
po
rt b
an o
n m
ilk a
nd
dai
ry p
rod
uct
s fr
om
Eg
ypt,
wh
ich
had
bee
n in
pla
ce f
or
seve
ral m
on
ths
on
san
itar
y g
rou
nd
s.
Ken
yaR
aw m
ilkJa
n-1
3B
anK
enya
Dai
ry B
oar
d (
KD
B)
imp
ose
d a
ban
on
th
e sa
le o
f ra
w m
ilk.
Mex
ico
Dai
ry p
rod
uct
sD
ec-1
2Im
po
rt q
uo
taA
nn
ou
nce
d it
will
allo
w a
to
tal o
f 44
200
met
ric
ton
nes
of
dai
ry p
rod
uct
pre
par
atio
ns
(dai
ry b
len
ds)
to
be
imp
ort
ed
fro
m a
ny
cou
ntr
y u
nd
er a
mix
ed a
lloca
tio
n (
dir
ect
and
pu
blic
bid
) sc
hem
e.
Milk
po
wd
erD
ec-1
2Im
po
rt q
uo
taA
nn
ou
nce
d o
pen
ing
of
a d
uty
fre
e 80
,000
to
nn
e im
po
rt q
uo
ta f
or
milk
po
wd
er im
po
rted
fro
m M
ost
Fav
ou
red
Nat
ion
s (M
FN)
as p
art
of
its
Wo
rld
Tra
de
Org
aniz
atio
n (
WTO
) co
mm
itm
ents
. Th
e p
rovi
sio
ns
bec
ame
effe
ctiv
e fr
om
1 J
anu
ary
2013
.
Bila
tera
l/Mu
ltila
tera
lM
ilk, D
airy
pro
du
cts
Dec
-12
Free
tra
de
agre
emen
tN
ew Z
eala
nd
-US:
ag
reem
ent
sig
ned
bet
wee
n N
ew Z
eala
nd
an
d t
he
US
Foo
d a
nd
Dru
g A
dm
inis
trat
ion
(FD
A)
that
re
cog
niz
es t
hei
r re
spec
tive
fo
od
saf
ety
syst
ems
Bila
tera
l/Mu
ltila
tera
lM
ilk, D
airy
pro
du
cts
Mar
-13
Imp
ort
du
ties
Ru
ssia
-Bel
aru
s-K
azak
hst
an: C
ust
om
s U
nio
n in
crea
sed
th
e im
po
rt d
uti
es o
n c
erta
in t
ypes
of
chee
se b
y 5–
10 p
erce
nt
USA
Dai
ry p
rod
uct
sFe
b-1
3D
airy
TR
QFo
reig
n A
gri
cult
ura
l Ser
vice
(FA
S) p
ub
lish
ed a
n a
dva
nce
no
tice
of
pro
po
sed
ru
lem
akin
g, r
equ
esti
ng
pu
blic
co
mm
ents
on
p
oss
ible
ch
ang
es t
o t
he
Dai
ry T
RQ
Lic
ensi
ng
Pro
gra
m.
* A
col
lect
ion
of m
ajor
dai
ry p
olic
y de
velo
pmen
ts s
tart
ing
in J
anua
ry 2
012
is a
vaila
ble
at: h
ttp:
//ww
w.f
ao.o
rg/e
cono
mic
/est
/est
-com
mod
ities
/com
mod
ity-p
olic
y-ar
chiv
e/en
/?gr
oupA
ND
com
mod
ity=
Milk
,%20
Dai
ry%
20pr
oduc
ts

Foo
d O
utl
oo
k -
Jun
e 2
01
3Fo
od
Ou
tloo
ookk
- Ju
ne
20
13
888
Appendix Table 1 (a) & (b) Cereal statistics 90-91
Appendix Table 2 (a) & (b) Wheat statistics 92-93
Appendix Table 3 (a) & (b) Coarse grains statistics 94-95
Appendix Table 4 (a) & (b) Maize statistics 96-97
Appendix Table 5 (a) & (b) Barley statistics 98-99
Appendix Table 6 (a) & (b) Sorghum statistics 100-101
Appendix Table 7 (a) & (b) Other Coarse grains statistics 100-101
Appendix Table 8 (a) & (b) Rice statistics 102-103
Appendix Table 9 Cereal supply and utilization in main exporting countries 104
Appendix Table 10 Total oilcrops statistics 105
Appendix Table 11 Total oils and fats statistics 106
Appendix Table 12 Total meals and cakes statistics 107
Appendix Table 13 Sugar statistics 108s
Appendix Table 14 Total meat statistics 109
Appendix Table 15 Bovine meat statistics 110
Appendix Table 16 Ovine meat statistics 111
Appendix Table 17 Pigmeat statistics 112
Appendix Table 18 Poultry meat statistics 113
Appendix Table 19 Milk and milk products statistics 114
Appendix Table 20 Fish and fishery products statistics 115
Appendix Table 21 Selected international prices for wheat and coarse grains 116
Appendix Table A22 Wheat and maize futures prices 116
Appendix Table 23 Selected international prices for rice and price indices 117
Appendix Table 24 Selected international prices for oilcrop products and price indices 118
Appendix Table 25 Selected international prices for sugar and sugar price index 119
Appendix Table 26 Selected international prices for milk products and dairy price indices 120
Appendix Table 27 Selected international meat prices 121
Appendix Table 28 Selected international meat prices and FAO meat price index 122
Appendix Table 29 Fish price indices 123
Appendix Table 30 Selected international commodity prices 123
Statistical appendix tables

Statistica
l ap
pe
nd
ixSta
tistical aa
pppp
en
dix
899
NOTES
General• FAO estimates and forecasts are
based on official and unofficial
sources.
• Unless otherwise stated, all charts
and tables refer to FAO data as
source.
• Estimates of world imports and
exports may not always match, mainly
because shipments and deliveries
do not necessarily occur in the same
marketing year.
• Tonnes refer to metric tonnes.
• All totals are computed from
unrounded data.
• Regional totals may include estimates
for countries not listed. The countries
shown in the tables were chosen
based on their importance of either
production or trade in each region.
The totals shown for Central America
include countries in the Caribbean.
• Estimates for China also include those
for the Taiwan Province, Hong Kong
SAR and Macao SAR, unless otherwise
stated.
• Up to 2012/13, the European
Union includes 27 member states.
For 2013/14, the European Union
includes 28 member states.
• ‘-‘ means nil or negligible.
Production• Cereals: Data refer to the calendar
year in which the whole harvest or
bulk of harvest takes place.
• Sugar: Figures refer to centrifugal
sugar derived from sugar cane or
beet, expressed in raw equivalents.
Data relate to the October/September
season.
Utilization• Cereals: Data are on individual
country’s marketing year basis.
• Sugar: Figures refer to centrifugal
sugar derived from sugar cane or
beet, expressed in raw equivalents.
Data relate to the October/September
season.
Trade• Trade between European Union
member states is excluded, unless
otherwise stated.
• Wheat: Trade data include wheat
flour in wheat grain equivalent. The
time reference period is July/June,
unless otherwise stated.
• Coarse grains: The time reference
period is July/June, unless otherwise
stated.
• Rice, dairy and meat products:
The time reference period is January/
December.
• Oilseeds, oils and fats and meals
and sugar: The time reference
period is October/September, unless
otherwise stated.
Stocks• Cereals: Data refer to carry-overs at
the close of national crop seasons
ending in the year shown.
COUNTRY CLASSIFICATION
In the presentation of statistical
material, countries are subdivided
according to geographical location as
well as into the following two main
economic groupings: “developed
countries” (including the developed
market economies and the transition
markets) and “developing countries”
(including the developing market
economies and the Asia centrally
planned countries). The designation
“Developed” and “Developing”
economies is intended for statistical
convenience and does not necessarily
express a judgement about the stage
reached by a particular country or area
in the development process.
References are also made to special country groupings: Low-Income Food-Deficit Countries (LIFDCs), Least Developed Countries (LDCs). The LIFDCs include 62 countries that are net importers of basic foodstuffs with per caput income below the level used by the World Bank to determine eligibility for International Development Aid (IDA) assistance (i.e. USD 1 915 in 2010). The LDCs group currently includes 49 countries with low income as well as weak human resources and low level of economic diversification. The list is reviewed every three years by the Economic and Social Council of the United Nations.
DISCLAIMER
The designations employed and
the presentation of material in
this publication do not imply the
expression of any opinion whatsoever
on the part of the Food and
Agriculture Organization of the United
Nations concerning the legal status
of any country, territory, city or area
or of its authorities, or concerning
the delimitation of its frontiers or
boundaries.

Foo
d O
utl
oo
k -
Jun
e 2
01
3Fo
od
Ou
tloo
ookk
- Ju
ne
20
13
909
APPENDIX TABLE 1(A): CEREAL STATISTICS
,1,2,3,4,5,*,1,> Production Imports Exports
2009-2011 2012 2013
09/10-11/122012/13 2013/14
09/10-11/12 2012/13 2013/14
average average average estim. f’cast estim. f’cast estim. f’cast
(. . . . . . . . . . . . . . . . . . . . . . . . . . . . . . . . . . . . . . . . million tonnes . . . . . . . . . . . . . . . . . . . . . . . . . . . . . . . . . . . . . . .)
ASIA 1 027.7 1 092.2 1 111.4 144.2 150.3 153.8 49.0 55.2 54.7 Bangladesh 35.4 36.8 37.2 3.8 2.4 2.4 - - - China 439.1 478.7 487.5 14.1 19.3 22.3 1.3 1.2 1.6 India 219.5 241.2 238.4 0.2 0.1 0.1 9.3 18.6 17.1 Indonesia 59.2 62.5 64.4 9.9 9.3 9.7 0.2 0.2 0.2 Iran, Islamic Republic of 19.9 20.3 21.0 7.9 11.8 8.8 0.6 0.2 0.2 Iraq 3.6 3.3 3.4 5.0 5.4 5.4 - - - Japan 8.5 8.8 8.7 25.2 24.8 25.6 0.4 0.5 0.5 Kazakhstan 19.7 12.3 17.1 - - - 8.6 6.8 7.4 Korea, Republic of 4.7 4.2 4.4 13.2 14.0 13.9 0.1 0.1 0.1 Myanmar 21.9 21.7 22.2 0.2 0.2 0.2 0.7 0.9 0.9 Pakistan 34.1 33.5 36.7 0.3 0.3 0.3 3.8 3.2 3.4 Philippines 17.5 19.2 19.2 5.3 4.3 4.8 - 0.1 0.1 Saudi Arabia 1.6 1.2 1.1 12.8 13.3 14.2 - - - Thailand 27.8 29.0 29.3 2.8 2.3 2.6 9.6 7.4 8.2 Turkey 33.5 33.0 34.3 4.1 3.8 3.6 3.8 3.9 3.4 Viet Nam 31.6 33.9 33.6 4.0 4.0 4.1 7.2 8.2 7.7
AFRICA 158.6 166.4 168.3 68.1 64.2 66.1 8.0 8.3 7.7 Algeria 5.0 5.0 5.5 8.6 9.1 8.6 - - - Egypt 19.7 21.1 21.3 17.0 12.9 14.9 0.3 0.5 0.5 Ethiopia 18.8 21.0 21.0 1.4 1.0 0.9 0.8 1.0 0.9 Morocco 8.9 5.3 9.3 5.6 6.0 5.1 0.1 0.1 0.1 Nigeria 24.5 25.2 25.3 6.6 6.8 7.1 1.0 0.9 0.9 South Africa 14.6 15.1 14.3 2.8 2.9 3.0 2.6 2.0 2.2 Sudan 4.0 5.9 5.3 2.3 2.1 2.2 - 0.3 -
CENTRAL AMERICA 38.1 39.9 40.8 26.2 24.9 28.0 1.4 1.0 1.0 Mexico 31.5 33.4 34.2 15.9 14.7 17.2 1.2 0.9 0.8
SOUTH AMERICA 137.9 155.9 168.5 24.8 25.6 26.5 43.8 70.0 61.2 Argentina 40.5 41.1 46.3 - - - 27.0 33.4 29.6 Brazil 71.0 86.3 94.2 8.4 9.1 8.8 11.6 29.9 25.5 Chile 3.4 3.6 3.3 2.1 2.2 2.2 0.1 0.1 0.1 Colombia 3.5 3.7 3.6 5.3 5.4 6.0 0.1 0.1 0.1 Peru 3.9 4.0 3.9 3.6 3.8 4.0 - - - Venezuela 3.3 4.1 4.1 3.5 3.3 3.7 - 0.1 0.1
NORTH AMERICA 447.6 406.0 474.6 8.0 10.9 8.6 103.5 78.2 86.3 Canada 47.9 51.6 55.4 2.0 1.2 1.3 20.3 22.8 22.9 United States of America 399.7 354.4 419.2 6.0 9.7 7.3 83.2 55.4 63.5
EUROPE 444.5 414.5 459.4 17.1 28.7 21.8 63.5 67.8 72.0 European Union 288.9 275.5 293.7 13.1 19.6 15.9 25.2 27.7 24.0 Russian Federation 82.9 69.2 89.8 0.8 3.3 1.0 17.6 15.2 20.3 Serbia 9.1 6.4 8.9 - 0.1 0.1 1.8 1.4 1.4 Ukraine 46.5 45.8 52.0 0.1 1.8 0.8 18.4 22.8 25.7
OCEANIA 39.7 34.8 37.4 1.5 1.4 1.4 24.1 25.5 23.4 Australia 38.8 34.0 36.5 0.2 0.1 0.1 24.1 25.5 23.4
WORLD 2 294.0 2 309.8 2 460.5 289.8 306.1 306.2 293.2 306.1 306.2 Developing countries 1 305.1 1 403.4 1 433.7 226.2 228.2 236.5 90.0 124.5 113.6 Developed countries 988.9 906.4 1 026.8 63.6 77.9 69.7 203.3 181.6 192.6 LIFDCs 502.5 543.4 541.6 81.6 73.3 78.0 16.6 27.6 25.2 LDCs 153.5 164.4 163.8 25.3 23.1 23.4 5.5 7.3 6.4

Statistica
l ap
pe
nd
ixSta
tistical aa
pppp
en
dix
911
APPENDIX TABLE 1(B): CEREAL STATISTICS
,1,2,3,4,5,*,1,> Total Utilization Stocks ending in Per caput food use
09/10-11/12 2012/13 2013/14
2010-20122013 2014
09/10-11/12 2012/13 2013/14
average average average estim. f’cast estim. f’cast estim. f’cast
(. . . . . . . . . . . . . . . . . . . . . . . . . . million tonnes . . . . . . . . . . . . . . . . . . . . .) (. . . . . . . . . . Kg/year . . . . . . .)
ASIA 1 104.5 1 165.2 1 195.2 303.4 353.0 367.7 160.9 161.7 163.2 Bangladesh 38.0 39.6 39.5 9.5 9.9 10.0 174.2 175.9 175.2 China 445.8 476.9 494.5 168.7 194.3 208.0 151.7 151.4 151.4 India 208.1 218.2 223.2 38.4 51.2 48.8 152.7 154.3 158.2 Indonesia 66.6 72.1 74.8 10.3 12.1 11.4 207.3 213.7 220.7 Iran, Islamic Republic of 26.7 28.2 29.3 5.9 11.0 11.3 198.9 200.3 200.3 Iraq 8.1 8.8 8.8 1.1 1.5 1.5 190.1 193.5 193.5 Japan 33.3 33.5 33.4 4.9 4.9 5.0 129.3 129.2 128.8 Kazakhstan 9.5 9.4 9.6 4.0 3.1 3.2 161.9 161.6 161.5 Korea, Republic of 17.6 18.2 17.8 4.1 4.1 4.6 123.7 120.9 120.8 Myanmar 21.4 21.5 21.6 6.3 5.6 5.6 243.2 243.7 244.0 Pakistan 30.9 32.2 33.4 3.1 1.3 1.4 148.7 146.5 146.9 Philippines 23.0 23.9 24.1 4.2 3.3 3.1 163.1 166.3 164.8 Saudi Arabia 14.0 15.0 15.2 4.6 4.5 4.5 146.4 153.6 153.0 Thailand 18.5 19.8 20.5 9.7 17.7 20.9 145.8 148.2 148.2 Turkey 33.5 34.0 34.7 4.5 4.2 4.0 225.2 225.1 224.5 Viet Nam 28.4 30.0 30.2 5.0 4.9 4.7 206.5 206.8 206.6
AFRICA 215.1 226.3 230.3 37.4 35.9 32.9 150.9 153.0 152.5 Algeria 13.2 13.9 14.1 4.0 4.7 4.8 233.1 233.7 232.9 Egypt 35.5 36.0 36.3 6.9 5.6 5.1 270.8 272.7 272.3 Ethiopia 19.1 20.8 21.1 1.8 2.0 1.9 185.3 188.5 187.2 Morocco 13.4 13.1 14.1 3.9 2.7 2.9 250.6 252.9 252.9 Nigeria 30.0 31.1 31.5 1.3 1.1 1.0 136.0 135.5 134.8 South Africa 14.9 15.4 15.8 3.2 3.1 2.4 171.6 177.4 177.5 Sudan 6.8 7.5 7.6 1.7 1.5 1.4 140.8 141.9 142.2
CENTRAL AMERICA 63.1 63.7 67.1 4.5 4.3 5.0 163.7 161.8 162.4 Mexico 46.5 47.1 49.9 2.7 2.6 3.2 198.0 197.9 198.9
SOUTH AMERICA 120.1 123.5 128.0 23.1 18.6 24.6 123.0 120.6 121.0 Argentina 13.7 15.4 15.9 4.5 2.8 3.7 133.0 132.9 132.8 Brazil 69.5 69.7 73.6 9.3 5.8 10.0 118.4 114.0 115.2 Chile 5.4 5.6 5.3 0.7 0.7 0.7 144.1 139.6 137.0 Colombia 8.8 9.1 9.4 2.1 2.0 2.2 106.7 106.8 106.4 Peru 7.5 7.7 7.7 1.3 1.6 1.7 145.7 145.8 145.2 Venezuela 7.0 7.4 7.6 0.7 0.7 0.8 133.3 134.0 133.9
NORTH AMERICA 358.3 346.5 368.7 72.2 50.7 78.4 108.5 108.2 107.4 Canada 28.5 29.7 29.9 11.4 7.8 10.4 96.9 96.0 96.6 United States of America 329.9 316.8 338.7 60.8 42.9 68.0 109.7 109.5 108.5
EUROPE 403.1 393.0 397.6 64.9 42.9 54.5 137.7 137.9 137.8 European Union 281.5 274.6 279.8 35.4 23.8 29.8 136.0 137.4 137.3 Russian Federation 67.2 64.5 67.0 17.9 7.5 11.1 131.4 128.7 128.5 Serbia 7.4 5.6 5.5 1.2 0.2 2.4 164.0 162.4 162.1 Ukraine 27.3 28.2 28.2 7.5 7.3 6.3 172.4 169.4 169.6
OCEANIA 15.8 14.9 15.2 8.5 5.4 5.7 93.1 92.5 91.1 Australia 13.7 12.7 13.0 8.0 4.9 5.2 103.9 103.4 101.7
WORLD 2 280.1 2 333.2 2 402.0 514.0 510.9 568.8 151.8 152.5 153.3 Developing countries 1 423.1 1 497.4 1 538.6 351.0 393.9 412.2 156.9 157.6 158.7 Developed countries 856.9 835.8 863.4 163.0 117.0 156.6 131.5 131.6 131.2 LIFDCs 557.7 589.0 599.6 100.7 115.1 109.8 156.8 159.0 160.9 LDCs 170.7 180.8 182.5 36.0 36.6 35.4 149.7 151.8 151.5

Foo
d O
utl
oo
k -
Jun
e 2
01
3Fo
od
Ou
tloo
ookk
- Ju
ne
20
13
929
APPENDIX TABLE 2(A): WHEAT STATISTICS
,1,2,3,4,5,*,1,> Production Imports Exports
2009-2011 2012 2013
09/10-11/122012/13 2013/14
09/10-11/12 2012/13 2013/14
average average average estim. f’cast estim. f’cast estim. f’cast
(. . . . . . . . . . . . . . . . . . . . . . . . . . . . . . . . . . . . . . . . million tonnes . . . . . . . . . . . . . . . . . . . . . . . . . . . . . . . . . . . . . . .)
ASIA 300.9 310.3 318.5 62.2 64.8 63.2 15.4 20.2 20.4 Bangladesh 0.9 1.0 1.0 3.0 2.2 2.2 - - - China 115.9 120.6 121.8 3.5 4.9 5.4 0.5 0.4 0.4 of which Taiwan Prov. - - - 1.3 1.4 1.4 - - - India 82.8 94.9 93.6 0.1 - - 0.2 7.0 7.0 Indonesia - - - 6.2 6.5 6.5 0.1 0.1 - Iran, Islamic Republic of 13.8 13.8 14.5 2.0 4.7 1.5 0.6 0.2 0.2 Iraq 2.3 2.1 2.2 3.6 3.7 3.7 - - - Japan 0.7 0.9 0.9 5.7 6.0 6.0 0.3 0.3 0.3 Kazakhstan 16.6 9.8 14.1 - - - 8.0 6.5 7.0 Korea, Republic of - - - 4.7 5.4 5.0 0.1 0.1 0.1 Pakistan 24.2 24.0 26.3 0.2 0.2 0.2 0.7 0.3 0.5 Philippines - - - 3.3 3.2 3.5 - - - Saudi Arabia 1.2 0.8 0.7 2.2 2.2 3.0 - - - Thailand - - - 2.0 1.6 2.0 0.2 0.1 0.2 Turkey 20.7 20.1 21.0 3.4 3.0 2.8 3.4 3.5 3.0
AFRICA 24.7 24.8 28.2 39.4 35.8 35.8 1.1 1.1 1.0 Algeria 3.1 3.4 3.6 5.8 5.8 5.4 - - - Egypt 8.0 8.8 9.4 10.6 8.0 9.0 - - - Ethiopia 3.2 3.5 3.5 1.3 1.0 0.9 - - - Morocco 5.8 3.9 6.5 3.3 3.4 2.5 0.1 0.1 0.1 Nigeria 0.1 0.1 0.1 3.9 3.9 3.9 0.5 0.5 0.5 South Africa 1.8 1.9 1.7 1.5 1.5 1.6 0.2 0.3 0.2 Tunisia 1.4 1.8 1.8 1.7 1.5 1.5 0.1 0.1 0.1
CENTRAL AMERICA 3.8 3.2 3.8 7.8 8.1 8.1 0.8 0.8 0.8 Cuba - - - 0.8 0.8 0.8 - - - Mexico 3.8 3.2 3.8 3.9 4.3 4.3 0.7 0.8 0.7
SOUTH AMERICA 23.7 17.8 21.2 12.9 14.1 14.4 11.8 11.8 8.8 Argentina 13.1 9.0 11.0 - - - 8.0 7.5 5.5 Brazil 5.6 4.4 5.5 6.5 7.5 7.5 1.9 2.0 1.3 Chile 1.4 1.4 1.3 0.7 0.8 0.8 - - - Colombia - - - 1.5 1.4 1.6 - - - Peru 0.2 0.2 0.2 1.6 1.7 1.7 - - - Venezuela - - - 1.6 1.7 1.8 - - -
NORTH AMERICA 83.4 89.0 85.4 3.0 3.6 3.6 46.1 46.5 45.0 Canada 25.1 27.2 29.4 0.1 0.1 0.1 17.2 18.5 19.0 United States of America 58.3 61.8 56.0 2.9 3.5 3.5 28.9 28.0 26.0
EUROPE 217.6 191.7 220.7 7.6 12.4 10.1 40.7 39.1 42.0 European Union 137.5 131.3 139.0 5.6 6.0 6.5 19.7 21.5 17.5 Russian Federation 53.2 37.7 55.0 0.1 2.5 0.5 14.4 10.3 15.0 Ukraine 20.0 15.8 20.2 - 1.3 0.5 6.0 6.8 9.0
OCEANIA 26.7 22.4 24.3 0.7 0.7 0.7 18.4 20.0 18.0 Australia 26.4 22.1 24.0 - - - 18.4 20.0 18.0
WORLD 680.9 659.1 702.0 133.7 139.5 136.0 134.4 139.5 136.0 Developing countries 322.7 331.8 343.0 108.0 107.9 106.7 20.2 26.1 22.8 Developed countries 358.2 327.3 359.1 25.7 31.6 29.3 114.2 113.4 113.2 LIFDCs 113.3 127.5 127.2 51.0 45.9 47.5 1.4 8.2 8.2 LDCs 11.2 12.7 12.9 16.0 14.2 14.2 0.1 - -

Statistica
l ap
pe
nd
ixSta
tistical aa
pppp
en
dix
933
APPENDIX TABLE 2(B): WHEAT STATISTICS
,1,2,3,4,5,*,1,> Total Utilization Stocks ending in Per caput food use
09/10-11/12 2012/13 2013/14 2010-2012 2013 2014 09/10-11/12 2012/13 2013/14 average average average
estim. f’cast estim. f’cast estim. f’cast
(. . . . . . . . . . . . . . . . . . . . . . . . . . million tonnes . . . . . . . . . . . . . . . . . . . . .) (. . . . . . . . . . Kg/year . . . . . . . .)
ASIA 341.6 357.1 358.1 92.9 95.9 98.4 64.3 64.1 64.7 Bangladesh 3.3 3.4 3.2 2.9 2.9 2.9 19.0 19.0 18.1 China 121.1 126.0 122.8 43.5 35.9 39.8 64.2 63.6 63.5 of which Taiwan Prov. 1.2 1.4 1.4 0.3 0.4 0.4 47.1 47.2 47.1 India 80.7 84.0 86.6 12.9 21.7 21.2 59.8 59.8 61.8 Indonesia 5.7 6.3 6.7 1.8 2.1 1.9 18.9 19.1 19.9 Iran, Islamic Republic of 15.1 16.0 16.2 4.3 6.9 6.6 166.3 166.5 166.5 Iraq 5.5 5.8 5.9 0.8 1.4 1.4 141.4 141.6 141.5 Japan 6.0 6.4 6.4 0.7 0.9 0.9 41.9 42.3 42.3 Kazakhstan 7.0 7.1 7.2 3.8 2.9 2.9 147.2 146.3 146.3 Korea, Republic of 4.6 5.7 4.9 0.9 0.8 0.9 48.1 48.1 48.4 Pakistan 23.8 25.0 26.0 1.5 0.1 0.1 125.5 124.6 124.7 Philippines 3.0 3.3 3.5 1.0 1.4 1.4 25.1 25.1 26.0 Saudi Arabia 3.2 3.2 3.7 2.6 2.5 2.5 100.2 103.5 103.9 Thailand 1.7 1.9 1.8 0.4 0.3 0.3 14.2 12.9 12.1 Turkey 20.1 20.7 21.0 2.6 2.3 2.1 199.4 199.8 199.3
AFRICA 60.8 63.5 64.6 16.9 15.0 13.9 51.0 50.5 50.1 Algeria 8.6 9.0 9.1 3.0 3.8 3.9 210.9 211.6 211.1 Egypt 17.6 18.9 19.0 5.1 4.1 3.5 183.3 183.9 183.8 Ethiopia 4.4 4.5 4.5 0.6 0.2 0.1 44.3 44.4 42.0 Morocco 8.2 8.5 8.9 2.4 1.8 1.8 196.6 199.0 199.6 Nigeria 3.4 3.3 3.5 0.3 0.2 0.2 17.7 16.7 17.5 South Africa 3.1 3.2 3.2 0.6 0.6 0.5 59.3 60.2 60.2 Tunisia 3.0 3.1 3.2 0.8 1.0 1.0 216.9 217.4 215.2
CENTRAL AMERICA 10.5 10.4 10.9 0.9 1.1 1.2 45.4 44.9 44.9 Cuba 0.8 0.8 0.8 - - - 57.3 57.3 57.3 Mexico 6.8 6.7 7.2 0.4 0.5 0.7 50.5 50.1 50.5
SOUTH AMERICA 24.9 25.0 25.3 6.4 4.1 5.4 59.4 59.1 59.2 Argentina 5.1 5.1 5.1 2.2 0.7 1.1 116.8 116.9 117.0 Brazil 10.7 10.7 11.0 1.0 0.5 1.2 52.3 52.3 52.8 Chile 2.1 2.1 2.1 0.2 0.2 0.2 113.8 109.2 106.5 Colombia 1.4 1.4 1.4 0.3 0.4 0.6 27.3 27.4 27.6 Peru 1.8 1.8 1.8 0.4 0.6 0.7 57.4 56.9 56.2 Venezuela 1.7 1.7 1.8 0.2 0.2 0.2 56.4 56.1 56.8
NORTH AMERICA 39.3 47.2 45.5 30.5 24.8 24.2 79.8 79.7 79.7 Canada 8.0 9.7 9.6 7.1 4.9 6.0 81.4 81.1 81.8 United States of America 31.3 37.6 36.0 23.4 19.9 18.2 79.6 79.5 79.5
EUROPE 185.6 176.1 182.2 32.7 20.4 27.0 110.9 110.8 110.6 European Union 125.7 119.2 124.6 12.5 8.0 11.5 112.3 112.6 112.4 Russian Federation 38.6 35.8 37.3 13.9 5.7 8.9 101.6 100.7 100.6 Ukraine 13.0 12.5 12.5 4.6 4.7 3.8 122.9 121.0 121.0
OCEANIA 7.7 6.9 7.0 5.5 3.0 3.0 69.2 68.3 67.4 Australia 6.7 5.9 6.0 5.1 2.6 2.6 82.7 82.0 81.1
WORLD 670.5 686.2 693.8 185.9 164.2 173.1 67.3 66.9 67.1 Developing countries 404.5 421.2 424.0 107.3 105.6 108.2 60.0 59.7 60.0 Developed countries 266.1 265.0 269.7 78.6 58.7 64.9 96.4 96.4 96.1 LIFDCs 156.7 164.5 168.0 37.6 45.9 44.2 47.8 47.7 48.4 LDCs 26.4 27.8 27.7 9.4 8.1 7.9 27.5 27.5 26.9

Foo
d O
utl
oo
k -
Jun
e 2
01
3Fo
od
Ou
tloo
ookk
- Ju
ne
20
13
949
APPENDIX TABLE 3(A): COARSE GRAIN STATISTICS
,1,2,3,4,5,*,1,> Production Imports Exports
2009-2011 2012 2013
09/10-11/122012/13 2013/14
09/10-11/12 2012/13 2013/14
average average average estim. f’cast estim. f’cast estim. f’cast
(. . . . . . . . . . . . . . . . . . . . . . . . . . . . . . . . . . . . . . . . million tonnes . . . . . . . . . . . . . . . . . . . . . . . . . . . . . . . . . . . . . . .)
ASIA 301.2 337.5 339.9 64.8 67.8 73.5 6.0 5.5 5.2 China 186.9 217.0 222.9 8.8 11.5 14.4 0.4 0.4 0.3 of which Taiwan Prov. 0.1 0.1 0.1 4.5 4.5 4.8 - - - India 39.9 42.2 38.8 - - - 3.2 3.0 2.5 Indonesia 17.9 19.0 19.0 1.8 1.5 2.0 0.1 0.1 0.1 Iran, Islamic Republic of 4.6 4.9 5.0 4.6 5.8 6.0 - - - Japan 0.2 0.2 0.2 18.8 18.1 18.9 - - - Korea, D.P.R. 2.0 2.4 2.4 0.3 0.3 0.3 - - - Korea, Republic of 0.2 0.2 0.2 8.1 8.1 8.5 - - - Malaysia 0.1 0.1 0.1 3.1 3.1 3.3 - - - Pakistan 3.9 4.1 4.1 - - - - - - Philippines 6.8 7.4 6.8 0.4 0.1 0.3 - - - Saudi Arabia 0.4 0.4 0.4 9.4 9.7 9.8 - - - Thailand 5.0 5.1 5.2 0.3 0.2 0.4 0.6 0.3 0.5 Turkey 12.3 12.4 12.8 0.5 0.5 0.5 0.3 0.3 0.3 Viet Nam 4.6 4.8 4.6 1.2 1.3 1.4 - - -
AFRICA 117.7 124.1 122.0 17.0 15.5 17.2 6.4 6.6 6.1 Algeria 1.9 1.6 1.9 2.8 3.2 3.1 - - - Egypt 8.1 7.8 7.3 6.1 4.6 5.6 - - - Ethiopia 15.5 17.4 17.4 0.1 - - 0.8 1.0 0.9 Kenya 3.4 3.9 3.5 0.7 0.2 0.9 - - - Morocco 3.1 1.4 2.8 2.4 2.6 2.6 - - - Nigeria 21.9 22.6 22.6 0.2 0.2 0.2 0.5 0.4 0.4 South Africa 12.8 13.3 12.6 0.3 0.2 0.2 2.4 1.7 2.0 Sudan 3.7 5.7 4.8 0.4 0.3 0.4 - 0.3 - Tanzania, United Rep. of 4.9 5.0 4.9 - - - 0.1 0.1 -
CENTRAL AMERICA 32.4 34.8 35.1 16.4 14.7 17.8 0.5 0.2 0.2 Mexico 27.6 30.0 30.3 11.4 9.8 12.2 0.5 0.1 0.1
SOUTH AMERICA 97.4 121.7 130.7 10.5 10.0 10.5 28.9 55.1 49.0 Argentina 26.4 31.1 34.3 - - - 18.3 25.3 23.5 Brazil 57.0 74.1 80.8 1.2 0.9 0.6 8.8 27.0 23.0 Chile 1.9 2.1 1.9 1.3 1.3 1.3 0.1 0.1 0.1 Colombia 1.7 1.9 1.8 3.8 3.8 4.2 - - - Peru 1.8 1.8 1.8 1.8 1.9 2.1 - - - Venezuela 2.7 3.5 3.5 1.7 1.2 1.5 - 0.1 0.1
NORTH AMERICA 357.3 310.7 383.2 4.0 6.3 4.0 53.9 28.3 38.1 Canada 22.8 24.4 26.0 1.5 0.8 0.8 3.1 4.3 3.9 United States of America 334.6 286.3 357.1 2.5 5.5 3.1 50.8 24.0 34.3
EUROPE 224.2 220.1 236.1 7.8 14.5 9.9 22.3 28.3 29.5 European Union 149.5 142.3 152.9 6.3 12.2 8.0 5.2 6.0 6.2 Russian Federation 29.1 30.8 34.0 0.5 0.6 0.4 3.0 4.7 5.1 Serbia 7.1 4.5 6.8 - - - 1.5 1.0 1.0 Ukraine 26.3 29.9 31.8 0.1 0.5 0.3 12.3 16.0 16.7
OCEANIA 12.8 11.8 12.4 0.2 0.2 0.2 5.5 5.0 4.9 Australia 12.2 11.3 11.8 - - - 5.5 5.0 4.9
WORLD 1 143.0 1 160.7 1 259.3 120.7 129.0 133.0 123.4 129.0 133.0 Developing countries 530.2 599.6 609.3 87.6 87.8 97.9 38.8 65.5 58.0 Developed countries 612.8 561.1 650.1 33.1 41.1 35.2 84.6 63.5 75.0 LIFDCs 175.5 188.8 181.6 13.2 10.6 13.2 7.7 8.7 7.3 LDCs 68.6 77.0 74.5 2.4 2.1 2.4 3.6 5.1 4.1

Statistica
l ap
pe
nd
ixSta
tistical aa
pppp
en
dix
955
APPENDIX TABLE 3(B): COARSE GRAIN STATISTICS
,1,2,3,4,5,*,1,> Total Utilization Stocks ending in Per caput food use
09/10-11/12 2012/13 2013/14
2010-20122013 2014
09/10-11/12 2012/13 2013/14
average average average estim. f’cast estim. f’cast estim. f’cast
(. . . . . . . . . . . . . . . . . . . . . . . . . . million tonnes . . . . . . . . . . . . . . . . . . . . .) (. . . . . . . . . . Kg/year . . . . . . . .)
ASIA 358.5 387.7 404.5 69.7 90.0 93.7 15.3 15.7 15.8 China 194.2 216.9 231.9 48.2 64.0 69.0 10.8 11.2 11.5 of which Taiwan Prov. 4.8 4.6 4.8 0.4 0.2 0.3 7.0 7.0 7.0 India 36.2 38.2 38.0 3.3 6.0 4.2 21.6 22.1 22.1 Indonesia 19.1 20.7 21.5 3.2 3.6 3.0 29.5 29.6 32.2 Iran, Islamic Republic of 9.0 9.4 10.3 1.3 3.6 4.3 1.4 1.3 1.3 Japan 19.2 19.0 18.9 1.6 1.3 1.4 29.3 29.3 29.4 Korea, D.P.R. 2.3 2.6 2.6 - 0.1 0.2 77.9 86.3 85.5 Korea, Republic of 8.4 8.1 8.4 1.6 1.7 2.0 4.4 4.3 4.3 Malaysia 3.2 3.2 3.4 0.3 0.1 0.1 1.7 1.6 1.6 Pakistan 4.1 4.3 4.2 1.1 0.9 0.9 9.2 9.1 8.3 Philippines 7.4 7.5 7.2 0.5 0.4 0.3 16.5 16.6 14.1 Saudi Arabia 9.6 10.5 10.2 1.8 1.9 1.9 3.7 3.5 3.4 Thailand 4.7 5.1 5.3 0.4 0.4 0.2 2.7 2.7 2.7 Turkey 12.6 12.6 13.0 1.8 1.8 1.8 16.9 16.5 16.3 Viet Nam 5.9 6.2 6.2 0.5 0.4 0.2 5.3 5.3 5.2
AFRICA 127.2 132.7 134.7 17.6 17.8 16.2 76.9 77.9 77.6 Algeria 4.5 4.8 4.9 1.0 0.9 0.9 19.9 19.7 19.4 Egypt 14.1 12.9 13.0 1.1 0.9 0.8 46.6 46.2 45.4 Ethiopia 14.6 16.2 16.5 1.2 1.8 1.8 140.1 143.4 144.4 Kenya 4.1 4.3 4.4 0.8 0.5 0.5 85.4 85.6 85.1 Morocco 5.1 4.6 5.2 1.4 0.9 1.1 52.9 52.9 52.2 Nigeria 21.7 22.3 22.4 0.6 0.6 0.6 91.9 89.9 88.4 South Africa 10.9 11.1 11.3 2.6 2.4 1.8 95.7 94.9 94.7 Sudan 4.4 5.1 5.1 0.2 0.6 0.6 86.7 89.2 90.2 Tanzania, United Rep. of 5.0 5.1 5.0 0.7 0.5 0.4 86.0 85.9 85.3
CENTRAL AMERICA 48.8 49.3 52.2 3.2 3.0 3.5 99.8 98.3 98.9 Mexico 39.0 39.6 41.9 2.3 2.1 2.6 140.8 141.1 141.5
SOUTH AMERICA 79.6 83.6 87.5 14.3 13.0 17.6 27.3 27.2 27.2 Argentina 8.2 9.9 10.4 2.3 2.1 2.5 7.4 7.3 7.2 Brazil 50.2 51.4 54.9 6.8 4.4 7.9 24.7 24.7 24.9 Chile 3.1 3.3 3.0 0.5 0.5 0.5 19.0 18.7 18.5 Colombia 5.6 5.7 6.0 1.7 1.6 1.5 42.2 41.4 40.9 Peru 3.6 3.7 3.8 0.6 0.6 0.7 25.0 24.5 24.2 Venezuela 4.3 4.7 4.8 0.4 0.5 0.6 50.4 51.2 50.4
NORTH AMERICA 314.8 295.1 319.2 40.3 24.8 53.0 18.2 17.9 17.7 Canada 20.1 19.7 20.0 4.3 2.9 4.4 5.3 4.8 4.8 United States of America 294.7 275.4 299.2 36.1 21.9 48.7 19.6 19.3 19.1
EUROPE 213.7 212.9 211.4 31.6 22.0 27.0 22.0 22.0 22.2 European Union 153.0 152.4 152.2 22.4 15.4 17.9 18.5 19.3 19.4 Russian Federation 28.0 28.1 29.0 3.9 1.8 2.1 25.3 23.5 23.5 Serbia 5.7 3.9 3.8 0.8 0.1 2.1 20.9 19.8 19.8 Ukraine 14.2 15.6 15.6 3.0 2.7 2.4 46.3 45.1 45.3
OCEANIA 7.5 7.3 7.5 3.0 2.4 2.6 8.1 8.1 8.0 Australia 6.8 6.5 6.7 2.9 2.3 2.5 10.5 10.2 10.1
WORLD 1 150.0 1 168.6 1 216.9 179.8 173.0 213.7 28.5 28.9 29.1 Developing countries 577.2 616.7 641.7 99.9 119.1 126.4 29.8 30.4 30.6 Developed countries 572.8 551.9 575.2 79.9 53.8 87.3 23.1 23.0 23.0 LIFDCs 179.3 189.5 190.9 20.7 25.3 21.9 39.6 40.4 40.7 LDCs 66.6 72.7 73.7 10.2 12.3 11.4 56.7 58.5 59.3

Foo
d O
utl
oo
k -
Jun
e 2
01
3Fo
od
Ou
tloo
ookk
- Ju
ne
20
13
969
APPENDIX TABLE 4(A): MAIZE STATISTICS
,1,2,3,4,5,*,1,> Production Imports Exports
2009-2011 2012 2013
09/10-11/122012/13 2013/14
09/10-11/12 2012/13 2013/14
average average average estim. f’cast estim. f’cast estim. f’cast
(. . . . . . . . . . . . . . . . . . . . . . . . . . . . . . . . . . . . . . . . million tonnes . . . . . . . . . . . . . . . . . . . . . . . . . . . . . . . . . . . . . . .)
ASIA 253.0 289.3 292.8 48.3 50.2 55.6 5.0 5.0 4.5 China 178.0 208.2 214.0 6.4 8.7 11.6 0.2 0.3 0.2 of which Taiwan Prov. - - - 4.4 4.3 4.5 - - - India 20.1 21.8 20.3 - - - 3.1 3.0 2.5 Indonesia 17.9 19.0 19.0 1.7 1.4 1.9 0.1 0.1 0.1 Iran, Islamic Republic of 1.7 1.7 1.7 3.7 4.5 4.5 - - - Japan - - - 15.7 15.0 15.5 - - - Korea, D.P.R. 1.9 2.3 2.3 0.3 0.3 0.3 - - - Korea, Republic of 0.1 0.1 0.1 8.0 8.0 8.4 - - - Malaysia 0.1 0.1 0.1 3.1 3.1 3.3 - - - Pakistan 3.4 3.5 3.5 - - - - - - Philippines 6.8 7.4 6.8 0.3 0.1 0.3 - - - Thailand 4.8 5.0 5.0 0.3 0.2 0.4 0.6 0.3 0.5 Turkey 4.3 4.6 4.6 0.3 0.4 0.4 0.2 0.2 0.2 Viet Nam 4.6 4.8 4.6 1.1 1.2 1.4 - - -
AFRICA 65.3 68.8 66.5 14.5 13.2 15.0 5.0 4.8 4.5 Algeria - - - 2.5 2.8 2.9 - - - Egypt 7.2 7.0 6.5 6.0 4.6 5.5 - - - Ethiopia 5.8 7.2 7.2 - - - 0.3 0.6 0.5 Kenya 3.1 3.6 3.2 0.6 0.2 0.8 - - - Morocco 0.2 0.1 0.2 1.9 2.1 2.1 - - - Nigeria 9.2 9.7 9.7 0.2 0.2 0.2 0.4 0.3 0.3 South Africa 12.3 12.8 12.1 0.2 - - 2.3 1.7 2.0 Tanzania, United Rep. of 3.8 3.9 3.8 - - - 0.1 0.1 -
CENTRAL AMERICA 24.8 26.3 26.8 14.1 12.5 14.5 0.5 0.2 0.2 Mexico 20.4 21.8 22.4 9.1 7.6 9.0 0.5 0.1 0.1
SOUTH AMERICA 86.0 106.2 116.8 8.6 8.3 8.7 25.4 48.7 43.9 Argentina 19.9 21.2 25.7 - - - 15.0 19.0 18.5 Brazil 54.5 71.3 77.8 0.7 0.7 0.4 8.8 27.0 23.0 Chile 1.4 1.5 1.4 0.7 0.6 0.6 - - - Colombia 1.6 1.8 1.7 3.3 3.3 3.5 - - - Peru 1.5 1.5 1.5 1.7 1.8 2.0 - - - Venezuela 2.2 3.0 3.0 1.6 1.2 1.5 - 0.1 0.1
NORTH AMERICA 331.9 286.9 353.8 1.9 3.7 1.4 47.8 22.7 30.6 Canada 11.0 13.1 13.8 1.4 0.7 0.7 0.5 1.2 0.6 United States of America 320.9 273.8 340.0 0.5 3.0 0.7 47.3 21.5 30.0
EUROPE 92.4 94.5 105.5 6.1 11.7 7.7 12.5 18.1 19.3 European Union 60.9 56.0 64.8 5.5 11.0 7.0 1.9 1.0 1.5 Russian Federation 4.8 8.2 8.7 0.1 0.1 0.1 0.8 2.3 2.5 Serbia 6.7 4.0 6.4 - - - 1.5 1.0 1.0 Ukraine 14.6 21.0 22.0 - - - 8.2 13.5 14.0
OCEANIA 0.5 0.6 0.6 - - - - 0.1 0.1
WORLD 853.9 872.7 962.8 93.7 99.5 103.0 96.3 99.5 103.0 Developing countries 415.1 476.0 488.8 68.4 67.9 76.9 33.5 56.8 51.0 Developed countries 438.8 396.6 474.0 25.3 31.7 26.1 62.8 42.6 52.1 LIFDCs 106.3 114.5 110.7 12.0 9.6 12.1 6.3 6.8 5.7 LDCs 36.0 39.6 38.7 1.7 1.6 1.7 2.4 3.3 2.7
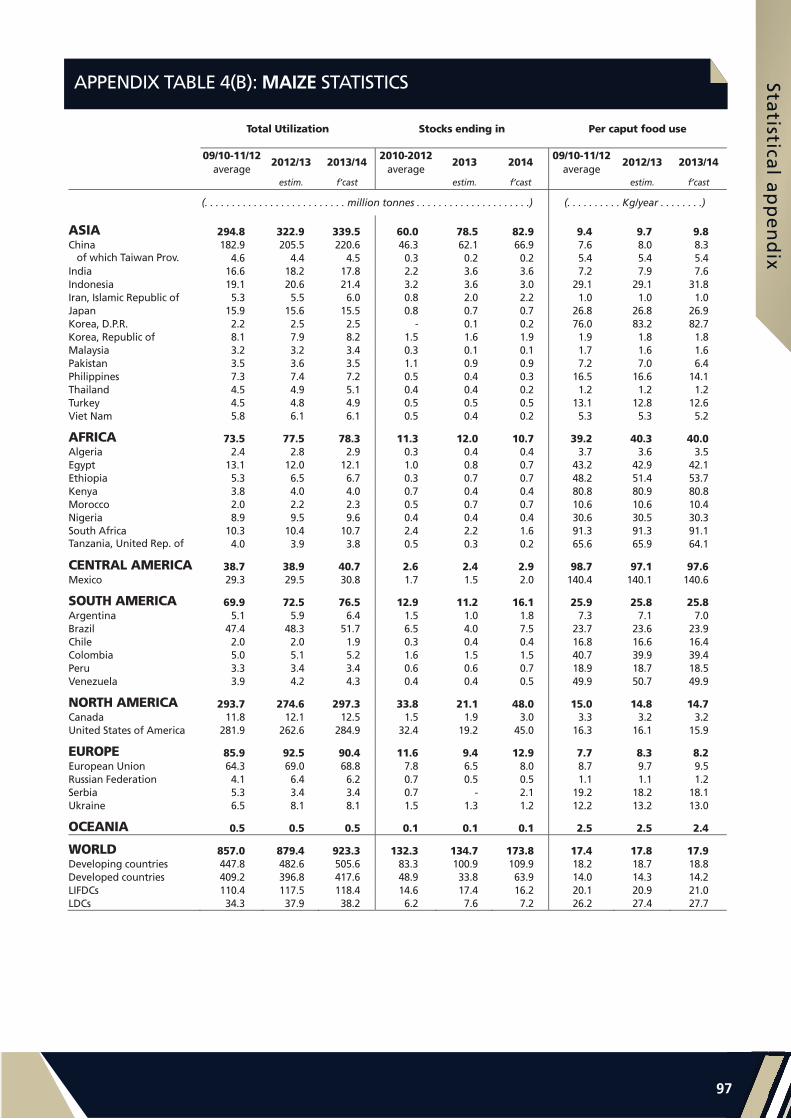
Statistica
l ap
pe
nd
ixSta
tistical aa
pppp
en
dix
977
APPENDIX TABLE 4(B): MAIZE STATISTICS
,1,2,3,4,5,*,1,> Total Utilization Stocks ending in Per caput food use
09/10-11/12 2012/13 2013/14
2010-20122013 2014
09/10-11/12 2012/13 2013/14
average average average estim. f’cast estim. f’cast estim. f’cast
(. . . . . . . . . . . . . . . . . . . . . . . . . . million tonnes . . . . . . . . . . . . . . . . . . . . .) (. . . . . . . . . . Kg/year . . . . . . . .)
ASIA 294.8 322.9 339.5 60.0 78.5 82.9 9.4 9.7 9.8 China 182.9 205.5 220.6 46.3 62.1 66.9 7.6 8.0 8.3 of which Taiwan Prov. 4.6 4.4 4.5 0.3 0.2 0.2 5.4 5.4 5.4 India 16.6 18.2 17.8 2.2 3.6 3.6 7.2 7.9 7.6 Indonesia 19.1 20.6 21.4 3.2 3.6 3.0 29.1 29.1 31.8 Iran, Islamic Republic of 5.3 5.5 6.0 0.8 2.0 2.2 1.0 1.0 1.0 Japan 15.9 15.6 15.5 0.8 0.7 0.7 26.8 26.8 26.9 Korea, D.P.R. 2.2 2.5 2.5 - 0.1 0.2 76.0 83.2 82.7 Korea, Republic of 8.1 7.9 8.2 1.5 1.6 1.9 1.9 1.8 1.8 Malaysia 3.2 3.2 3.4 0.3 0.1 0.1 1.7 1.6 1.6 Pakistan 3.5 3.6 3.5 1.1 0.9 0.9 7.2 7.0 6.4 Philippines 7.3 7.4 7.2 0.5 0.4 0.3 16.5 16.6 14.1 Thailand 4.5 4.9 5.1 0.4 0.4 0.2 1.2 1.2 1.2 Turkey 4.5 4.8 4.9 0.5 0.5 0.5 13.1 12.8 12.6 Viet Nam 5.8 6.1 6.1 0.5 0.4 0.2 5.3 5.3 5.2
AFRICA 73.5 77.5 78.3 11.3 12.0 10.7 39.2 40.3 40.0 Algeria 2.4 2.8 2.9 0.3 0.4 0.4 3.7 3.6 3.5 Egypt 13.1 12.0 12.1 1.0 0.8 0.7 43.2 42.9 42.1 Ethiopia 5.3 6.5 6.7 0.3 0.7 0.7 48.2 51.4 53.7 Kenya 3.8 4.0 4.0 0.7 0.4 0.4 80.8 80.9 80.8 Morocco 2.0 2.2 2.3 0.5 0.7 0.7 10.6 10.6 10.4 Nigeria 8.9 9.5 9.6 0.4 0.4 0.4 30.6 30.5 30.3 South Africa 10.3 10.4 10.7 2.4 2.2 1.6 91.3 91.3 91.1 Tanzania, United Rep. of 4.0 3.9 3.8 0.5 0.3 0.2 65.6 65.9 64.1
CENTRAL AMERICA 38.7 38.9 40.7 2.6 2.4 2.9 98.7 97.1 97.6 Mexico 29.3 29.5 30.8 1.7 1.5 2.0 140.4 140.1 140.6
SOUTH AMERICA 69.9 72.5 76.5 12.9 11.2 16.1 25.9 25.8 25.8 Argentina 5.1 5.9 6.4 1.5 1.0 1.8 7.3 7.1 7.0 Brazil 47.4 48.3 51.7 6.5 4.0 7.5 23.7 23.6 23.9 Chile 2.0 2.0 1.9 0.3 0.4 0.4 16.8 16.6 16.4 Colombia 5.0 5.1 5.2 1.6 1.5 1.5 40.7 39.9 39.4 Peru 3.3 3.4 3.4 0.6 0.6 0.7 18.9 18.7 18.5 Venezuela 3.9 4.2 4.3 0.4 0.4 0.5 49.9 50.7 49.9
NORTH AMERICA 293.7 274.6 297.3 33.8 21.1 48.0 15.0 14.8 14.7 Canada 11.8 12.1 12.5 1.5 1.9 3.0 3.3 3.2 3.2 United States of America 281.9 262.6 284.9 32.4 19.2 45.0 16.3 16.1 15.9
EUROPE 85.9 92.5 90.4 11.6 9.4 12.9 7.7 8.3 8.2 European Union 64.3 69.0 68.8 7.8 6.5 8.0 8.7 9.7 9.5 Russian Federation 4.1 6.4 6.2 0.7 0.5 0.5 1.1 1.1 1.2 Serbia 5.3 3.4 3.4 0.7 - 2.1 19.2 18.2 18.1 Ukraine 6.5 8.1 8.1 1.5 1.3 1.2 12.2 13.2 13.0
OCEANIA 0.5 0.5 0.5 0.1 0.1 0.1 2.5 2.5 2.4
WORLD 857.0 879.4 923.3 132.3 134.7 173.8 17.4 17.8 17.9 Developing countries 447.8 482.6 505.6 83.3 100.9 109.9 18.2 18.7 18.8 Developed countries 409.2 396.8 417.6 48.9 33.8 63.9 14.0 14.3 14.2 LIFDCs 110.4 117.5 118.4 14.6 17.4 16.2 20.1 20.9 21.0 LDCs 34.3 37.9 38.2 6.2 7.6 7.2 26.2 27.4 27.7

Foo
d O
utl
oo
k -
Jun
e 2
01
3Fo
od
Ou
tloo
ookk
- Ju
ne
20
13
989
APPENDIX TABLE 5(A): BARLEY STATISTICS
,1,2,3,4,5,*,1,> Production Imports Exports
2009-2011 2012 2013
09/10-11/122012/13 2013/14
09/10-11/12 2012/13 2013/14
average average average estim. f’cast estim. f’cast estim. f’cast
(. . . . . . . . . . . . . . . . . . . . . . . . . . . . . . . . . . . . . . . . million tonnes . . . . . . . . . . . . . . . . . . . . . . . . . . . . . . . . . . . . . . .)
ASIA 19.9 19.3 20.3 14.2 14.9 15.4 0.7 0.4 0.5 China 2.0 2.0 2.1 2.2 2.3 2.5 - - - India 1.6 1.6 1.7 - - - - - - Iran, Islamic Republic of 2.9 3.2 3.2 0.9 1.3 1.5 - - - Iraq 0.9 0.8 0.8 - 0.1 0.1 - - - Japan 0.2 0.2 0.2 1.3 1.4 1.6 - - - Kazakhstan 2.2 1.5 2.0 - - - 0.5 0.2 0.4 Saudi Arabia - - - 7.4 7.5 7.5 - - - Syria 0.7 0.8 0.8 0.4 0.4 0.4 - - - Turkey 7.4 7.1 7.5 0.1 0.1 0.1 0.2 0.2 0.2
AFRICA 7.7 6.0 7.7 1.4 1.4 1.1 - - - Algeria 1.8 1.5 1.8 0.3 0.4 0.2 - - - Ethiopia 1.8 1.9 1.9 - - - - - - Libya 0.1 0.1 0.1 0.4 0.4 0.4 - - - Morocco 2.9 1.2 2.6 0.4 0.3 0.3 - - - Tunisia 0.6 0.8 0.8 0.3 0.3 0.2 - - -
CENTRAL AMERICA 0.6 1.0 0.8 0.1 0.1 0.1 - - - Mexico 0.6 1.0 0.8 0.1 0.1 0.1 - - -
SOUTH AMERICA 3.7 6.0 5.0 0.8 0.6 0.6 1.8 3.6 3.1 Argentina 2.8 5.1 4.0 - - - 1.7 3.5 3.0
NORTH AMERICA 12.4 12.8 13.3 0.3 0.4 0.5 1.3 1.7 1.8 Canada 8.3 8.0 8.5 - - - 1.2 1.5 1.6 United States of America 4.1 4.8 4.8 0.3 0.4 0.5 0.1 0.2 0.2
EUROPE 85.0 79.0 82.9 0.8 1.6 1.3 9.2 9.6 9.6 Belarus 1.9 2.0 2.0 - 0.2 0.2 - 0.1 0.1 European Union 56.6 54.4 55.7 0.2 0.3 0.4 3.0 4.8 4.5 Russian Federation 15.1 14.0 16.0 0.3 0.5 0.3 2.1 2.3 2.5 Ukraine 9.8 7.0 7.7 - 0.5 0.3 4.0 2.4 2.5
OCEANIA 8.4 7.4 8.2 - - - 4.5 3.8 4.0 Australia 8.1 7.1 7.9 - - - 4.5 3.8 4.0
WORLD 137.8 131.6 138.1 17.6 19.0 19.0 17.6 19.0 19.0 Developing countries 28.1 29.1 29.9 14.5 15.0 15.0 1.9 3.8 3.3 Developed countries 109.7 102.6 108.2 3.1 3.9 4.0 15.6 15.3 15.7 LIFDCs 5.6 5.6 5.6 0.2 0.2 0.2 - - - LDCs 2.4 2.3 2.3 - - - - - -

Statistica
l ap
pe
nd
ixSta
tistical aa
pppp
en
dix
999
APPENDIX TABLE 5(B): BARLEY STATISTICS
,1,2,3,4,5,*,1,> Total Utilization Stocks ending in Per caput food use
09/10-11/12 2012/13 2013/14
2010-20122013 2014
09/10-11/12 2012/13 2013/14
average average average estim. f’cast estim. f’cast estim. f’cast
(. . . . . . . . . . . . . . . . . . . . . . . . . . million tonnes . . . . . . . . . . . . . . . . . . . . .) (. . . . . . . . . . Kg/year . . . . . . . .)
ASIA 33.6 33.8 34.1 6.7 7.3 8.5 0.6 0.7 0.7 China 4.3 4.2 4.2 0.9 1.0 1.3 0.1 0.1 0.1 India 1.6 1.6 1.7 - - - 1.1 1.1 1.2 Iran, Islamic Republic of 3.7 3.9 4.2 0.5 1.6 2.1 0.4 0.4 0.3 Iraq 0.9 1.0 0.9 0.1 - - 3.9 3.9 3.8 Japan 1.6 1.6 1.7 0.5 0.4 0.5 2.4 2.4 2.4 Kazakhstan 1.7 1.4 1.5 0.2 0.1 0.2 1.2 1.2 1.2 Saudi Arabia 7.3 7.9 7.5 1.8 1.8 1.8 1.1 1.0 1.0 Syria 1.5 1.3 1.2 0.9 0.4 0.4 12.3 12.2 12.2 Turkey 7.4 7.1 7.4 1.2 1.2 1.2 1.1 1.1 1.0
AFRICA 8.9 8.0 8.6 2.2 1.2 1.4 3.6 3.5 3.5 Algeria 1.9 1.9 1.9 0.6 0.5 0.5 16.3 16.2 15.9 Ethiopia 1.8 1.9 1.9 0.1 0.1 0.1 18.7 18.2 17.8 Libya 0.5 0.5 0.5 - - - 12.6 12.0 11.8 Morocco 3.0 2.1 2.7 1.0 0.2 0.4 42.2 42.2 41.7 Tunisia 1.0 1.1 1.1 0.3 0.2 0.2 8.7 8.5 8.4
CENTRAL AMERICA 0.7 1.0 0.8 0.1 0.2 0.2 - - - Mexico 0.7 1.0 0.8 0.1 0.2 0.2 - - -
SOUTH AMERICA 2.6 2.7 2.6 0.4 0.4 0.3 0.5 0.5 0.5 Argentina 1.0 1.2 1.2 0.4 0.4 0.2 - - -
NORTH AMERICA 11.3 11.0 11.2 3.7 2.4 2.6 0.5 0.5 0.5 Canada 6.9 6.2 6.2 1.8 0.8 1.0 0.3 0.3 0.3 United States of America 4.4 4.8 5.0 1.9 1.6 1.6 0.6 0.5 0.5
EUROPE 79.6 72.8 74.3 14.6 8.8 9.1 1.6 1.5 1.5 Belarus 1.9 1.9 1.9 0.2 0.3 0.5 - - - European Union 55.6 50.9 51.5 11.1 6.4 6.5 0.8 0.8 0.8 Russian Federation 14.5 12.6 13.7 1.9 0.7 0.8 0.4 0.3 0.3 Ukraine 5.7 5.6 5.6 1.2 1.1 1.0 13.9 12.5 12.6
OCEANIA 3.8 3.7 3.9 2.1 1.7 2.0 0.2 0.2 0.2 Australia 3.4 3.4 3.6 2.1 1.7 2.0 0.3 0.3 0.3
WORLD 140.4 133.1 135.6 29.8 22.1 24.0 1.2 1.1 1.1 Developing countries 40.6 40.4 40.8 8.3 7.9 8.7 1.1 1.1 1.1 Developed countries 99.8 92.7 94.8 21.5 14.1 15.2 1.3 1.2 1.2 LIFDCs 5.7 5.9 5.7 0.6 0.6 0.7 1.2 1.2 1.2 LDCs 2.4 2.3 2.3 0.2 0.2 0.2 1.9 1.9 1.9

Foo
d O
utl
oo
k -
Jun
e 2
01
3Fo
od
Ou
tloo
ookk
- Ju
ne
20
13
1001
APPENDIX TABLE 6(A): SORGHUM STATISTICS
APPENDIX TABLE 7(A): OTHER COARSE GRAIN STATISTICS: MILLET, RYE, OATS AND OTHER GRAINS
,1,2,3,4,5,*,1,> Production Imports Exports
2009-2011 2012 2013
09/10-11/122012/13 2013/14
09/10-11/12 2012/13 2013/14
average average average estim. f’cast estim. f’cast estim. f’cast
(. . . . . . . . . . . . . . . . . . . . . . . . . . . . . . . . . . . . . . . . million tonnes . . . . . . . . . . . . . . . . . . . . . . . . . . . . . . . . . . . . . . .)
ASIA 9.6 9.0 9.0 1.8 2.1 1.9 0.1 0.1 0.1 China 2.1 2.0 2.0 0.1 0.4 0.2 - - - India 6.6 6.0 6.0 - - - 0.1 - - Japan - - - 1.5 1.4 1.5 - - -
AFRICA 25.7 27.6 27.2 0.9 0.8 0.9 0.8 0.9 0.7 Burkina Faso 1.7 1.9 1.8 - - - 0.1 0.2 0.2 Ethiopia 3.8 3.8 3.8 0.1 - - 0.3 0.2 0.2 Nigeria 8.8 8.9 8.9 - - - 0.1 0.1 0.1 Sudan 3.1 4.5 4.0 0.4 0.3 0.3 - 0.1 -
CENTRAL AMERICA 6.9 7.4 7.4 2.1 2.0 3.0 - - - Mexico 6.5 7.0 7.0 2.1 2.0 3.0 - - -
SOUTH AMERICA 6.1 7.7 7.4 0.9 0.9 1.1 1.6 2.8 2.0 Argentina 3.2 4.3 4.1 - - - 1.6 2.8 2.0 Brazil 1.7 2.0 2.1 - - - - - - Venezuela 0.5 0.5 0.5 - - - - - -
NORTH AMERICA 8.0 6.3 10.8 - 0.3 - 3.2 2.2 4.0 United States of America 8.0 6.3 10.8 - 0.3 - 3.2 2.2 4.0
EUROPE 0.7 0.9 0.8 0.4 0.7 0.4 - - - European Union 0.7 0.6 0.6 0.3 0.6 0.3 - - -
OCEANIA 2.0 2.2 1.7 0.1 0.1 0.1 0.7 1.0 0.6 Australia 2.0 2.2 1.7 - - - 0.7 1.0 0.6
WORLD 59.2 61.1 64.3 6.3 7.0 7.5 6.5 7.0 7.5 Developing countries 48.2 51.6 50.8 4.1 4.3 5.4 2.6 3.7 2.8 Developed countries 11.0 9.6 13.5 2.2 2.6 2.1 4.0 3.3 4.7 LIFDCs 32.7 34.1 33.6 0.9 0.6 0.8 0.9 0.9 0.8 LDCs 15.2 17.4 16.9 0.6 0.4 0.6 0.7 0.8 0.7
,1,2,3,4,5,*,1,> Production Imports Exports
2009-2011 2012 2013
09/10-11/122012/13 2013/14
09/10-11/12 2012/13 2013/14
average average average estim. f’cast estim. f’cast estim. f’cast
(. . . . . . . . . . . . . . . . . . . . . . . . . . . . . . . . . . . . . . . . million tonnes . . . . . . . . . . . . . . . . . . . . . . . . . . . . . . . . . . . . . . .)
ASIA 18.7 19.8 17.8 0.5 0.6 0.6 0.2 0.1 0.1
AFRICA 19.0 21.6 20.7 0.1 0.1 0.1 0.6 1.0 0.9
CENTRAL AMERICA 0.1 0.1 0.1 0.1 0.2 0.2 - - -
SOUTH AMERICA 1.5 1.8 1.6 0.2 0.1 0.1 0.1 0.1 0.1
NORTH AMERICA 5.1 4.7 5.3 1.8 1.9 2.0 1.6 1.7 1.7
EUROPE 46.0 45.7 46.8 0.4 0.6 0.5 0.5 0.6 0.6
OCEANIA 1.8 1.6 1.8 0.1 0.1 0.1 0.2 0.1 0.2
WORLD 92.2 95.4 94.2 3.2 3.5 3.5 3.0 3.5 3.5

Statistica
l ap
pe
nd
ixSta
tistical aa
pppp
en
dix
10101
APPENDIX TABLE 7(B): OTHER COARSE GRAIN STATISTICS: MILLET, RYE, OATS AND OTHER GRAINS
APPENDIX TABLE 6(B): SORGHUM STATISTICS
,1,2,3,4,5,*,1,> Total Utilization Stocks ending in Per caput food use
09/10-11/12 2012/13 2013/14
2010-20122013 2014
09/10-11/12 2012/13 2013/14
average average average estim. f’cast estim. f’cast estim. f’cast
(. . . . . . . . . . . . . . . . . . . . . . . . . . million tonnes . . . . . . . . . . . . . . . . . . . . .) (. . . . . . . . . . Kg/year . . . . . . . .)
ASIA 11.4 11.1 10.9 1.1 1.0 1.0 1.6 1.5 1.5 China 2.2 2.3 2.2 0.5 0.5 0.5 0.3 0.4 0.4 India 6.6 6.0 6.0 0.1 0.1 0.1 4.8 4.2 4.2 Japan 1.5 1.5 1.5 0.3 0.2 0.2 - - -
AFRICA 26.2 27.3 27.7 2.1 1.8 1.5 20.0 19.8 19.8 Burkina Faso 1.6 1.7 1.7 0.1 0.2 0.1 81.3 79.0 79.2 Ethiopia 3.6 3.7 3.6 0.2 0.1 0.1 33.8 33.4 31.5 Nigeria 8.8 8.8 8.8 0.1 0.1 0.1 43.1 42.1 41.1 Sudan 3.7 4.3 4.3 0.2 0.4 0.4 74.1 76.0 75.0
CENTRAL AMERICA 9.2 9.2 10.4 0.6 0.4 0.4 0.9 0.7 0.7 Mexico 8.7 8.8 10.0 0.5 0.4 0.4 - - -
SOUTH AMERICA 5.4 6.5 6.7 0.9 1.2 1.0 0.1 0.1 0.1 Argentina 1.6 2.3 2.3 0.4 0.7 0.5 - - - Brazil 1.7 2.0 2.1 0.2 0.4 0.4 - - - Venezuela 0.5 0.5 0.5 - 0.1 0.1 - - -
NORTH AMERICA 5.0 4.6 6.1 0.8 0.6 1.4 - - - United States of America 5.0 4.6 6.1 0.8 0.6 1.4 - - -
EUROPE 1.3 1.6 1.2 0.3 0.2 0.2 0.3 0.3 0.3 European Union 1.1 1.2 0.9 0.3 0.2 0.2 0.4 0.4 0.4
OCEANIA 1.6 1.5 1.3 0.6 0.3 0.3 0.2 0.2 0.2 Australia 1.5 1.4 1.2 0.6 0.3 0.3 - - -
WORLD 60.1 61.8 64.3 6.2 5.5 5.8 4.0 4.0 4.0 Developing countries 50.3 52.4 53.9 4.2 4.3 3.7 5.0 4.9 4.9 Developed countries 9.8 9.4 10.4 2.0 1.2 2.1 0.3 0.3 0.3 LIFDCs 33.0 33.5 33.9 2.2 2.0 1.7 9.4 9.2 9.2 LDCs 15.5 16.7 17.1 1.8 1.7 1.4 14.7 14.9 15.2
,1,2,3,4,5,*,1,> Total Utilization Stocks ending in Per caput food use
09/10-11/12 2012/13 2013/14
2010-20122013 2014
09/10-11/12 2012/13 2013/14
average average average estim. f’cast estim. f’cast estim. f’cast
(. . . . . . . . . . . . . . . . . . . . . . . . . . million tonnes . . . . . . . . . . . . . . . . . . . . .) (. . . . . . . . . . Kg/year . . . . . . . .)
ASIA 18.8 19.9 20.1 1.9 3.1 1.3 3.7 3.8 3.9
AFRICA 18.5 19.9 20.1 2.0 2.8 2.6 14.2 14.3 14.4
CENTRAL AMERICA 0.2 0.3 0.3 - - - 0.2 0.5 0.5
SOUTH AMERICA 1.6 1.8 1.6 0.1 0.1 0.1 0.9 0.8 0.8
NORTH AMERICA 4.7 4.9 4.5 2.0 0.8 1.0 2.6 2.6 2.5
EUROPE 46.9 45.9 45.5 5.2 3.6 4.9 12.5 12.0 12.2
OCEANIA 1.6 1.6 1.7 0.2 0.3 0.3 5.2 5.2 5.2
WORLD 92.4 94.3 93.8 11.5 10.7 10.2 5.9 6.0 6.0

Foo
d O
utl
oo
k -
Jun
e 2
01
3Fo
od
Ou
tloo
ookk
- Ju
ne
20
13
1021
APPENDIX TABLE 8(A): RICE STATISTICS
,1,2,3,4,5,*,1,> Production Imports Exports
09/10-11/12 2012/13 2013/14
2009-20112012 2013
2009-2011 2012 2013
average average average estim. f’cast estim. f’cast estim. f’cast
(. . . . . . . . . . . . . . . . . . . . . . . . . . . . . . . . million tonnes, milled equivalent . . . . . . . . . . . . . . . . . . . . . . . . . . . . . . .)
ASIA 425.5 444.5 453.0 15.7 18.2 17.7 25.1 30.3 29.5 Bangladesh 33.1 33.7 34.1 0.8 0.1 0.1 - - - China 136.3 141.1 142.8 1.1 3.0 3.0 0.7 0.3 0.3 of which Taiwan Prov. 1.1 1.2 1.2 0.3 0.2 0.3 0.1 0.1 - India 96.8 104.2 106.0 0.1 0.1 0.1 3.1 10.3 8.6 Indonesia 41.3 43.5 45.4 1.4 1.8 1.3 - - - Iran, Islamic Republic of 1.4 1.5 1.5 1.2 1.5 1.3 - - - Iraq 0.1 0.1 0.1 1.2 1.4 1.4 - - - Japan 7.7 7.7 7.7 0.7 0.6 0.7 0.2 0.2 0.2 Korea, D.P.R. 1.6 1.8 1.7 0.1 0.3 0.3 - - - Korea, Republic of 4.5 4.0 4.2 0.4 0.2 0.5 - - - Malaysia 1.6 1.7 1.8 1.0 1.1 1.1 - - - Myanmar 20.3 19.8 20.5 - - - 0.8 0.6 0.7 Pakistan 6.0 5.4 6.2 - 0.1 0.1 3.2 2.8 2.9 Philippines 10.7 11.8 12.4 1.8 1.1 1.0 - - 0.1 Saudi Arabia - - - 1.1 1.3 1.4 - - - Sri Lanka 2.7 2.6 2.8 0.1 - - - - - Thailand 22.8 23.8 24.2 0.4 0.8 0.5 9.4 7.0 7.0 Viet Nam 27.0 29.1 29.0 0.5 0.6 0.6 6.7 7.7 8.2
AFRICA 16.2 17.5 18.1 10.4 13.5 12.9 0.5 0.5 0.6 Cote d’Ívoire 0.4 0.4 0.4 1.0 1.3 1.3 - - - Egypt 3.6 4.5 4.7 0.2 0.4 0.3 0.4 0.4 0.5 Madagascar 3.0 3.0 2.9 0.1 0.3 0.3 - - - Nigeria 2.5 2.5 2.6 2.1 3.0 2.7 - - - Senegal 0.4 0.5 0.5 0.7 1.2 0.9 - - - South Africa - - - 0.9 1.3 1.2 - - - Tanzania, United Rep. of 1.0 0.7 0.9 0.1 0.2 0.2 - - -
CENTRAL AMERICA 1.9 1.8 1.9 2.0 2.1 2.1 - 0.1 - Cuba 0.4 0.4 0.4 0.5 0.4 0.4 - - - Mexico 0.1 0.1 0.1 0.6 0.6 0.6 - - -
SOUTH AMERICA 16.8 16.4 16.6 1.2 1.6 1.6 2.8 3.4 3.1 Argentina 1.0 1.1 1.0 - - - 0.6 0.6 0.6 Brazil 8.5 7.8 8.0 0.7 0.7 0.7 0.8 1.1 0.9 Peru 1.9 2.0 1.9 0.1 0.3 0.2 - - - Uruguay 1.0 1.0 1.0 - - - 0.9 1.0 0.9
NORTH AMERICA 6.9 6.3 6.0 1.0 1.0 1.1 3.4 3.3 3.4 Canada - - - 0.3 0.3 0.4 - - - United States of America 6.9 6.3 6.0 0.6 0.6 0.7 3.4 3.3 3.4
EUROPE 2.7 2.7 2.7 1.6 1.7 1.8 0.3 0.6 0.5 European Union 1.9 1.9 1.8 1.2 1.3 1.4 0.2 0.3 0.3 Russian Federation 0.7 0.7 0.7 0.2 0.2 0.2 0.1 0.3 0.2
OCEANIA 0.2 0.6 0.7 0.5 0.5 0.4 0.1 0.4 0.5 Australia 0.2 0.6 0.7 0.2 0.1 0.1 0.1 0.4 0.5
WORLD 470.2 489.9 499.1 32.4 38.6 37.6 32.4 38.6 37.6 Developing countries 452.2 471.9 481.5 27.7 33.4 32.4 28.3 34.1 33.0 Developed countries 17.9 18.0 17.7 4.7 5.1 5.2 4.1 4.6 4.6 LIFDCs 213.6 227.1 232.7 15.8 18.0 16.8 4.7 12.1 10.6 LDCs 73.7 74.8 76.4 6.5 7.0 6.8 2.0 1.9 2.2
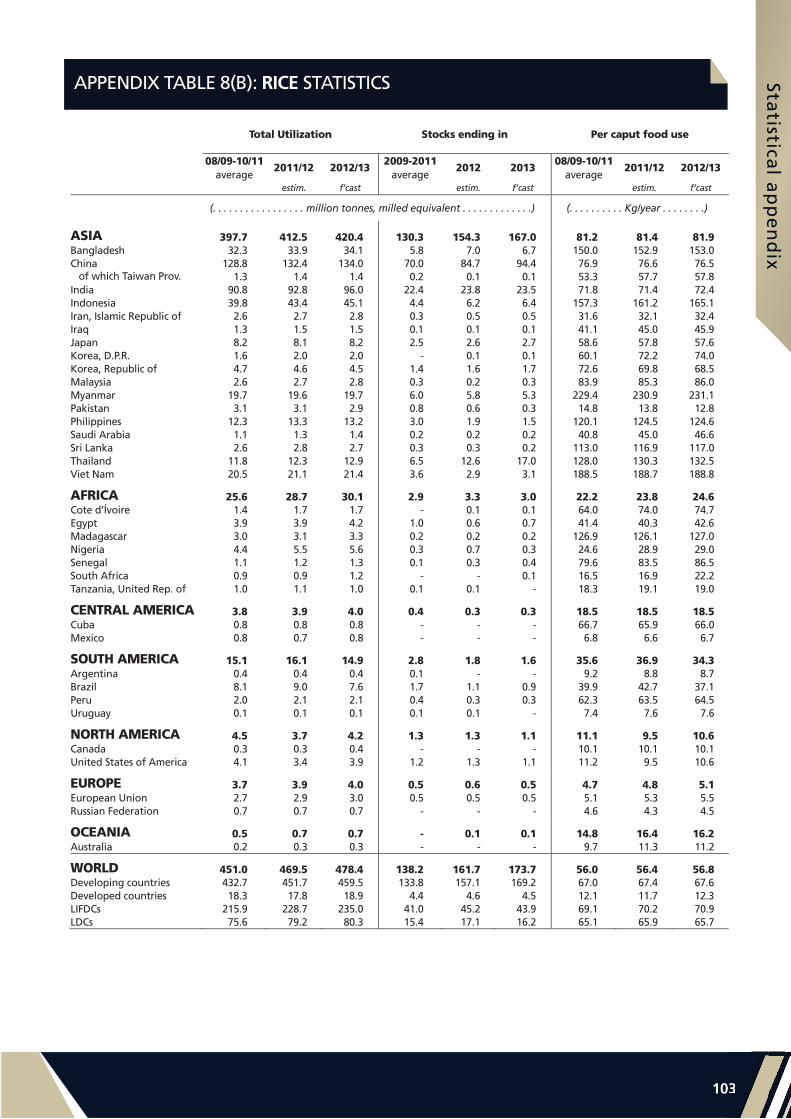
Statistica
l ap
pe
nd
ixSta
tistical aa
pppp
en
dix
10303
APPENDIX TABLE 8(B): RICE STATISTICS
,1,2,3,4,5,*,1,> Total Utilization Stocks ending in Per caput food use
08/09-10/11 2011/12 2012/13
2009-20112012 2013
08/09-10/11 2011/12 2012/13
average average average estim. f’cast estim. f’cast estim. f’cast
(. . . . . . . . . . . . . . . . . million tonnes, milled equivalent . . . . . . . . . . . . .) (. . . . . . . . . . Kg/year . . . . . . . .)
ASIA 397.7 412.5 420.4 130.3 154.3 167.0 81.2 81.4 81.9 Bangladesh 32.3 33.9 34.1 5.8 7.0 6.7 150.0 152.9 153.0 China 128.8 132.4 134.0 70.0 84.7 94.4 76.9 76.6 76.5 of which Taiwan Prov. 1.3 1.4 1.4 0.2 0.1 0.1 53.3 57.7 57.8 India 90.8 92.8 96.0 22.4 23.8 23.5 71.8 71.4 72.4 Indonesia 39.8 43.4 45.1 4.4 6.2 6.4 157.3 161.2 165.1 Iran, Islamic Republic of 2.6 2.7 2.8 0.3 0.5 0.5 31.6 32.1 32.4 Iraq 1.3 1.5 1.5 0.1 0.1 0.1 41.1 45.0 45.9 Japan 8.2 8.1 8.2 2.5 2.6 2.7 58.6 57.8 57.6 Korea, D.P.R. 1.6 2.0 2.0 - 0.1 0.1 60.1 72.2 74.0 Korea, Republic of 4.7 4.6 4.5 1.4 1.6 1.7 72.6 69.8 68.5 Malaysia 2.6 2.7 2.8 0.3 0.2 0.3 83.9 85.3 86.0 Myanmar 19.7 19.6 19.7 6.0 5.8 5.3 229.4 230.9 231.1 Pakistan 3.1 3.1 2.9 0.8 0.6 0.3 14.8 13.8 12.8 Philippines 12.3 13.3 13.2 3.0 1.9 1.5 120.1 124.5 124.6 Saudi Arabia 1.1 1.3 1.4 0.2 0.2 0.2 40.8 45.0 46.6 Sri Lanka 2.6 2.8 2.7 0.3 0.3 0.2 113.0 116.9 117.0 Thailand 11.8 12.3 12.9 6.5 12.6 17.0 128.0 130.3 132.5 Viet Nam 20.5 21.1 21.4 3.6 2.9 3.1 188.5 188.7 188.8
AFRICA 25.6 28.7 30.1 2.9 3.3 3.0 22.2 23.8 24.6 Cote d’Ívoire 1.4 1.7 1.7 - 0.1 0.1 64.0 74.0 74.7 Egypt 3.9 3.9 4.2 1.0 0.6 0.7 41.4 40.3 42.6 Madagascar 3.0 3.1 3.3 0.2 0.2 0.2 126.9 126.1 127.0 Nigeria 4.4 5.5 5.6 0.3 0.7 0.3 24.6 28.9 29.0 Senegal 1.1 1.2 1.3 0.1 0.3 0.4 79.6 83.5 86.5 South Africa 0.9 0.9 1.2 - - 0.1 16.5 16.9 22.2 Tanzania, United Rep. of 1.0 1.1 1.0 0.1 0.1 - 18.3 19.1 19.0
CENTRAL AMERICA 3.8 3.9 4.0 0.4 0.3 0.3 18.5 18.5 18.5 Cuba 0.8 0.8 0.8 - - - 66.7 65.9 66.0 Mexico 0.8 0.7 0.8 - - - 6.8 6.6 6.7
SOUTH AMERICA 15.1 16.1 14.9 2.8 1.8 1.6 35.6 36.9 34.3 Argentina 0.4 0.4 0.4 0.1 - - 9.2 8.8 8.7 Brazil 8.1 9.0 7.6 1.7 1.1 0.9 39.9 42.7 37.1 Peru 2.0 2.1 2.1 0.4 0.3 0.3 62.3 63.5 64.5 Uruguay 0.1 0.1 0.1 0.1 0.1 - 7.4 7.6 7.6
NORTH AMERICA 4.5 3.7 4.2 1.3 1.3 1.1 11.1 9.5 10.6 Canada 0.3 0.3 0.4 - - - 10.1 10.1 10.1 United States of America 4.1 3.4 3.9 1.2 1.3 1.1 11.2 9.5 10.6
EUROPE 3.7 3.9 4.0 0.5 0.6 0.5 4.7 4.8 5.1 European Union 2.7 2.9 3.0 0.5 0.5 0.5 5.1 5.3 5.5 Russian Federation 0.7 0.7 0.7 - - - 4.6 4.3 4.5
OCEANIA 0.5 0.7 0.7 - 0.1 0.1 14.8 16.4 16.2 Australia 0.2 0.3 0.3 - - - 9.7 11.3 11.2
WORLD 451.0 469.5 478.4 138.2 161.7 173.7 56.0 56.4 56.8 Developing countries 432.7 451.7 459.5 133.8 157.1 169.2 67.0 67.4 67.6 Developed countries 18.3 17.8 18.9 4.4 4.6 4.5 12.1 11.7 12.3 LIFDCs 215.9 228.7 235.0 41.0 45.2 43.9 69.1 70.2 70.9 LDCs 75.6 79.2 80.3 15.4 17.1 16.2 65.1 65.9 65.7

Foo
d O
utl
oo
k -
Jun
e 2
01
3Fo
od
Ou
tloo
ookk
- Ju
ne
20
13
1041
APPENDIX TABLE 9: CEREAL SUPPLY AND UTILIZATION IN MAIN EXPORTING COUNTRIES (million tonnes)
,1,2,3,4,12,20,28,36,44,*,1,>
Wheat1 Coarse Grains2 Rice (milled basis)
2011/12 2012/13 2013/14 2011/12 2012/13 2013/14 2011/12 2012/13 2013/14 estim. f’cast estim. f’cast estim. f’cast
UNITED STATES (June/May) UNITED STATES UNITED STATES (Aug./July) Opening stocks 23.5 20.2 19.9 32.3 27.8 21.9 1.5 1.3 1.1 Production 54.4 61.8 56.0 324.0 286.3 357.1 5.9 6.3 6.0 Imports 3.1 3.4 3.5 2.9 5.8 2.9 0.6 0.7 0.7 Total Supply 80.9 85.4 79.4 359.2 319.9 382.0 8.0 8.3 7.8 Domestic use 32.2 37.6 36.0 290.3 275.4 299.2 3.5 3.8 3.7 Exports 28.6 27.9 25.2 41.1 22.6 34.1 3.2 3.4 3.1 Closing stocks 20.2 19.9 18.2 27.8 21.9 48.7 1.3 1.1 1.1
CANADA (August/July) CANADA THAILAND (Nov./Oct.)3 Opening stocks 7.5 5.9 4.9 3.7 3.4 2.9 7.7 12.6 17.0 Production 25.3 27.2 29.4 23.0 24.4 26.0 23.4 23.8 24.2 Imports 0.1 0.1 0.1 1.0 0.6 0.5 0.8 0.5 0.2 Total Supply 32.8 33.2 34.4 27.6 28.4 29.5 31.8 36.9 41.4 Domestic use 9.4 9.7 9.6 19.1 19.7 20.0 12.3 12.9 13.5 Exports 17.5 18.7 18.8 5.1 5.8 5.1 7.0 7.0 7.5 Closing stocks 5.9 4.9 6.0 3.4 2.9 4.4 12.6 17.0 20.4
ARGENTINA (Dec./Nov.) ARGENTINA INDIA (Oct./Sept.)3 Opening stocks 3.7 1.6 0.7 1.9 4.1 2.1 21.5 23.8 23.5 Production 14.5 9.0 11.0 32.8 31.1 34.3 105.3 104.2 106.0 Imports 0.0 0.0 0.0 0.0 0.0 0.0 0.1 0.1 0.1 Total Supply 18.2 10.6 11.7 34.8 35.2 36.4 126.9 128.1 129.6 Domestic use 5.1 5.1 5.1 9.8 9.9 10.4 92.8 96.0 98.6 Exports 11.5 4.8 5.5 20.8 23.3 23.5 10.3 8.6 7.6 Closing stocks 1.6 0.7 1.1 4.1 2.1 2.5 23.8 23.5 23.4
AUSTRALIA (Oct./Sept.) AUSTRALIA PAKISTAN (Nov./Oct.)3 Opening stocks 6.3 4.9 2.6 3.0 2.5 2.3 0.3 0.6 0.3 Production 29.9 22.1 24.0 12.6 11.3 11.8 6.2 5.4 6.2 Imports 0.0 0.0 0.0 0.0 0.0 0.0 0.1 0.1 0.1 Total Supply 36.2 27.0 26.6 15.6 13.7 14.1 6.5 6.0 6.5 Domestic use 6.7 5.9 6.0 6.8 6.5 6.7 3.1 2.9 3.2 Exports 24.7 18.5 18.0 6.3 4.9 4.9 2.8 2.9 2.9 Closing stocks 4.9 2.6 2.6 2.5 2.3 2.5 0.6 0.3 0.4
EU (July/June) EU VIET NAM (Nov./Oct.)3 Opening stocks 10.7 11.4 8.0 19.9 19.3 15.4 2.9 2.9 3.1 Production 137.6 131.3 139.0 149.0 142.3 152.9 28.2 29.1 29.0 Imports 7.1 6.0 6.5 7.3 12.2 8.0 0.6 0.6 0.6 Total Supply 155.5 148.7 153.5 176.2 173.8 176.2 31.7 32.7 32.6 Domestic use 127.6 119.2 124.6 150.5 152.4 152.2 21.1 21.4 21.6 Exports 16.5 21.5 17.5 6.5 6.0 6.2 7.7 8.2 7.7 Closing stocks 11.4 8.0 11.5 19.3 15.4 17.9 2.9 3.1 3.4
TOTAL OF ABOVE TOTAL OF ABOVE TOTAL OF ABOVE Opening stocks 51.6 44.0 36.1 60.8 57.1 44.5 33.9 41.2 44.9 Production 261.8 251.3 259.4 541.4 495.4 582.2 168.9 168.9 171.4 Imports 10.3 9.5 10.1 11.2 18.6 11.4 2.1 1.9 1.6 Total Supply 323.6 304.8 305.6 613.4 571.1 638.1 204.9 212.1 217.9 Domestic use 180.9 177.4 181.2 476.6 463.9 488.4 132.7 137.1 140.5 Exports 98.8 91.3 85.0 79.7 62.6 73.8 31.0 30.1 28.8 Closing stocks 44.0 36.1 39.4 57.1 44.5 76.0 41.2 44.9 48.6
1 Trade data include wheat flour in wheat grain equivalent. For the EU semolina is also included. 2 Argentina (December/November) for rye, barley and oats, (March/February) for maize and sorghum; Australia (November/October) for rye, barley and oats, (March/February) for maize and sorghum; Canada (August/July); EU (July/June); United States (June/May) for rye, barley and oats, (September/August) for maize and sorghum. 3 Rice trade data refer to the calendar year of the second year shown.

Statistica
l ap
pe
nd
ixSta
tistical aa
pppp
en
dix
10505
APPENDIX TABLE 10: TOTAL OILCROPS STATISTICS (million tonnes)
,1,2,3,4,*,1,> Production1 Imports Exports
08/09-10/11 2011/12 2012/13
08/09-10/112011/12 2012/13
08/09-10/11 2011/12 2012/13
average average average estim. f’cast estim. f’cast estim. f’cast
ASIA 128.0 133.4 133.6 73.0 84.6 86.1 2.3 3.0 2.3China 59.3 60.2 60.4 53.0 64.6 65.7 1.2 1.2 1.1 of which Taiwan Prov. 0.1 0.1 0.1 2.4 2.2 2.4 - - - India 35.5 37.6 37.5 0.2 0.2 0.2 0.6 1.0 0.6 Indonesia 8.9 9.9 10.3 2.0 2.1 2.1 0.1 0.1 0.1 Iran, Islamic Republic of 0.7 0.9 0.9 0.8 0.6 0.7 - - - Japan 0.3 0.2 0.3 5.9 5.5 5.5 - - - Korea, Republic of 0.2 0.2 0.2 1.6 1.4 1.4 - - - Malaysia 4.6 4.9 5.0 0.7 0.5 0.7 - - - Pakistan 4.8 5.8 5.3 1.2 1.4 1.1 - - - Thailand 0.7 0.8 0.8 1.9 2.1 2.2 - - - Turkey 2.3 2.5 2.5 2.3 2.2 2.0 0.1 0.1 0.1
AFRICA 17.1 16.9 17.4 3.1 3.1 3.2 0.9 0.9 0.9Nigeria 4.8 5.1 4.9 - - - 0.2 0.2 0.1
CENTRAL AMERICA 1.2 1.2 1.3 5.9 6.4 5.7 0.2 0.2 0.2 Mexico 0.7 0.8 0.8 5.2 5.8 5.2 - - -
SOUTH AMERICA 131.0 126.1 153.9 1.8 1.2 1.3 46.0 51.3 56.5Argentina 49.0 44.9 53.9 0.5 0.3 0.2 9.7 8.3 11.3 Brazil 70.2 70.3 84.4 0.1 0.1 0.1 30.0 36.4 37.0 Paraguay 6.9 4.7 8.8 - - - 4.4 3.9 5.1
NORTH AMERICA 114.5 113.0 112.9 2.0 2.0 1.9 50.6 51.7 49.1Canada 17.8 20.1 19.6 0.7 0.5 0.5 10.8 12.5 11.4 United States of America 96.7 92.9 93.3 1.3 1.4 1.3 39.8 39.3 37.8
EUROPE 50.1 57.5 53.5 19.6 17.7 18.2 4.1 4.7 4.2 European Union 28.8 29.6 27.8 17.8 16.3 16.7 0.8 0.8 0.6 Russian Federation 8.2 12.4 11.1 1.1 0.9 1.0 0.3 0.5 0.3 Ukraine 10.9 13.1 12.3 - - - 2.7 3.0 3.0
OCEANIA 3.4 5.4 5.0 0.1 0.1 - 1.6 3.1 3.2 Australia 3.0 5.0 4.6 - - - 1.5 3.0 3.1
WORLD 445.2 453.6 477.5 105.4 115.0 116.4 105.6 115.0 116.4 Developing countries 271.9 272.6 300.7 76.9 88.9 89.9 49.2 55.3 59.6 Developed countries 173.2 181.0 176.9 28.5 26.1 26.5 56.4 59.7 56.8 LIFDCs 131.9 136.8 136.9 57.6 69.7 70.4 3.1 3.8 3.0 LDCs 10.8 10.7 11.0 0.4 0.6 0.3 0.4 0.4 0.5
1 The split years bring together northern hemisphere annual crops harvested in the latter part of the first year shown, with southern hemisphere annual crops harvested in the early part of the second year shown; for tree crops which are produced throughout the year, calendar year production for the second year shown is used.

Foo
d O
utl
oo
k -
Jun
e 2
01
3Fo
od
Ou
tloo
ookk
- Ju
ne
20
13
1061
APPENDIX TABLE 11: TOTAL OILS AND FATS STATISTICS (million tonnes)
,1,2,3,4,*,1,> Imports Exports Utilization
08/09-10/11 2011/12 2012/13
08/09-10/112011/12 2012/13
08/09-10/11 2011/12 2012/13
average average average estim. f’cast estim. f’cast estim. f’cast
ASIA 36.4 41.4 43.3 41.7 44.9 48.0 83.1 93.6 97.0Bangladesh 1.3 1.5 1.6 - - - 1.6 1.8 1.8 China 10.6 10.8 12.2 0.6 0.5 0.6 30.7 33.9 35.9 of which Taiwan Prov. 0.4 0.4 0.4 - - - 0.8 0.9 0.9 India 8.8 10.2 11.0 0.5 0.5 0.5 18.3 19.8 20.1 Indonesia 0.1 0.1 0.1 19.1 21.2 22.7 6.4 9.1 9.6 Iran 1.3 1.5 1.6 0.2 0.2 0.1 1.7 1.8 1.9 Japan 1.2 1.3 1.3 - - - 3.0 3.2 3.1 Korea, Republic of 0.9 1.0 1.0 - - - 1.3 1.4 1.4 Malaysia 2.0 2.9 2.3 18.1 19.0 20.3 3.7 4.2 4.4 Pakistan 2.2 2.4 2.6 0.1 0.1 0.1 3.8 4.2 4.2 Philippines 0.5 0.6 0.6 1.1 0.9 1.1 1.2 1.2 1.1 Singapore 0.7 1.1 1.0 0.3 0.2 0.2 0.4 0.8 0.8 Turkey 1.2 1.6 1.6 0.3 0.6 0.5 2.3 2.5 2.6
AFRICA 8.1 8.5 8.8 1.6 1.7 1.8 13.5 14.2 14.4Algeria 0.6 0.7 0.6 - - - 0.7 0.8 0.7 Egypt 1.8 1.9 1.9 0.3 0.4 0.4 2.0 1.9 2.1 Nigeria 1.0 0.9 1.1 0.1 0.1 0.1 2.6 2.7 2.8 South Africa 0.7 0.8 0.8 0.1 0.1 0.1 1.1 1.3 1.2
CENTRAL AMERICA 2.3 2.5 2.5 0.7 0.9 1.0 4.5 4.9 4.8 Mexico 1.2 1.4 1.4 0.1 0.1 0.1 2.9 3.3 3.2
SOUTH AMERICA 2.4 2.9 2.9 9.0 8.8 8.9 13.3 15.4 15.5Argentina 0.1 0.1 0.1 5.8 5.2 5.4 2.4 3.5 3.3Brazil 0.5 0.6 0.6 1.9 2.1 2.0 7.1 7.4 7.6
NORTH AMERICA 4.3 4.8 4.8 6.5 6.7 7.0 17.4 19.1 19.0Canada 0.6 0.6 0.6 2.7 3.4 3.3 1.0 1.2 1.0 United States of America 3.7 4.2 4.3 3.8 3.2 3.8 16.5 17.9 17.9
EUROPE 13.3 12.7 13.7 6.0 8.5 8.1 36.3 36.5 36.6 European Union 10.7 10.3 11.2 2.3 2.9 2.8 30.1 30.0 30.0 Russian Federation 1.1 1.0 1.1 0.8 1.8 1.6 3.9 4.0 4.1 Ukraine 0.5 0.3 0.4 2.6 3.4 3.3 1.0 1.0 1.1
OCEANIA 0.6 0.6 0.7 1.8 1.9 1.9 1.0 1.1 1.1 Australia 0.4 0.4 0.5 0.6 0.7 0.7 0.7 0.7 0.7
WORLD 67.3 73.4 76.7 67.3 73.3 76.7 169.3 184.7 188.4 Developing countries 46.8 52.8 55.0 53.4 56.9 60.3 109.4 122.6 126.4 Developed countries 20.4 20.6 21.7 13.8 16.5 16.4 59.9 62.1 62.0 LIFDCs 32.0 34.4 37.3 23.4 25.5 27.6 76.1 84.8 88.0 LDCs 4.7 5.2 5.3 0.5 0.4 0.4 7.7 8.3 8.4
1 Includes oils and fats of vegetable, marine and animal origin.

Statistica
l ap
pe
nd
ixSta
tistical aa
pppp
en
dix
10707
APPENDIX TABLE 12: TOTAL MEALS AND CAKES STATISTICS1 (million tonnes)
,1,2,3,4,*,1,> Imports Exports Utilization
08/09-10/11 2011/12 2012/13
08/09-10/112011/12 2012/13
08/09-10/11 2011/12 2012/13
average average average estim. f’cast estim. f’cast estim. f’cast
ASIA 27.6 31.0 31.2 13.8 15.1 15.7 115.1 131.6 132.9China 3.4 3.2 2.7 1.5 1.3 1.9 60.6 72.3 73.8 of which Taiwan Prov. 0.4 0.5 0.5 - - - 2.3 2.4 2.4 India 0.1 0.1 0.2 4.8 5.5 5.4 11.9 11.7 11.4 Indonesia 2.9 3.6 3.7 3.0 3.3 3.6 3.5 5.6 5.6 Japan 2.7 2.8 2.9 - - - 7.0 6.8 6.8 Korea, Republic of 3.4 3.5 3.5 0.1 0.1 0.1 4.7 4.6 4.5 Malaysia 1.0 1.1 1.2 2.3 2.5 2.5 1.8 1.8 1.9 Pakistan 0.5 0.7 0.7 0.2 0.2 0.1 3.0 3.5 3.6 Philippines 1.7 1.8 1.9 0.5 0.5 0.5 2.2 2.2 2.2 Saudi Arabia 0.5 0.6 0.6 - - - 0.5 0.6 0.7 Thailand 2.8 3.2 3.3 0.1 0.1 0.1 4.8 5.5 5.6 Turkey 1.0 1.9 1.7 - 0.4 0.2 3.3 3.9 3.9 Viet Nam 3.2 3.3 3.5 0.1 0.1 0.1 3.3 4.0 4.1
AFRICA 3.9 4.6 4.6 0.9 0.9 0.9 10.0 11.1 11.1Egypt 0.7 1.0 1.0 - - - 2.1 2.7 2.6 South Africa 1.1 1.2 1.2 0.1 0.1 0.1 1.8 1.9 1.9
CENTRAL AMERICA 3.3 3.6 3.4 0.2 0.2 0.2 7.9 8.3 8.1 Mexico 1.8 2.0 1.8 0.1 0.1 0.1 5.8 6.2 6.1
SOUTH AMERICA 4.5 5.0 5.3 43.4 45.9 44.3 23.5 23.0 23.8Argentina - - - 26.3 27.1 25.4 2.5 2.9 3.1 Bolivia - - - 1.1 1.4 1.5 0.2 0.2 0.2 Brazil 0.2 0.3 0.3 13.2 14.7 14.5 14.9 13.4 13.9 Chile 0.9 1.0 1.1 0.4 0.3 0.4 1.3 1.4 1.4 Paraguay - - - 0.9 0.8 1.5 0.4 0.6 0.6 Peru 0.8 0.9 0.9 1.4 1.3 0.8 0.9 1.1 1.1 Venezuela 1.3 1.2 1.4 - - - 1.4 1.4 1.4
NORTH AMERICA 3.2 4.4 4.7 12.2 13.5 13.8 33.5 36.2 33.1Canada 1.2 1.2 1.2 3.1 4.2 4.4 2.2 2.3 2.2 United States of America 2.0 3.2 3.5 9.1 9.3 9.4 31.4 33.8 30.9
EUROPE 31.0 32.5 30.9 5.1 7.6 7.4 61.2 62.0 60.3 European Union 28.6 29.4 28.1 1.2 1.6 1.6 54.4 53.8 51.9 Russian Federation 0.5 0.6 0.6 1.0 2.1 1.8 3.5 4.5 4.7 Ukraine 0.1 0.1 - 2.5 3.3 3.4 0.8 0.8 0.9
OCEANIA 2.1 2.3 2.5 0.2 0.2 0.2 2.7 3.0 3.2Australia 0.7 0.8 0.8 - 0.1 0.1 1.3 1.4 1.5
WORLD 75.6 83.5 82.6 75.8 83.4 82.6 254.0 275.2 272.6Developing countries 35.1 39.6 39.9 58.1 61.9 61.0 146.0 163.5 165.3 Developed countries 40.6 43.9 42.7 17.7 21.6 21.2 108.0 111.7 107.2 LIFDCs 11.9 13.6 13.3 11.1 12.0 12.8 90.2 105.3 106.3 LDCs 0.5 0.6 0.6 0.4 0.4 0.4 3.6 3.7 3.7
1 Expressed in product weight; includes meals and cakes derived from oilcrops as well as fish meal and other meals from animal origin.

Foo
d O
utl
oo
k -
Jun
e 2
01
3Fo
od
Ou
tloo
ookk
- Ju
ne
20
13
1081
APPENDIX TABLE 13: SUGAR STATISTICS (million tonnes)
,1,2,3,*,1,> Production Imports Exports Utilization
2011/12 2012/13 2011/12 2012/13 2011/12 2012/13 2011/12 2012/13 estim. f’cast estim. f’cast estim. f’cast estim. f’cast
ASIA 67.6 68.7 26.5 25.5 15.0 11.3 77.6 79.6 China 12.6 14.7 5.1 3.3 0.1 0.1 17.3 17.5 India 28.1 26.6 0.2 0.9 3.7 0.8 23.2 24.5 Indonesia 2.5 2.6 3.0 3.1 - - 5.6 5.8 Japan 0.8 0.8 1.4 1.4 - - 2.3 2.2 Korea, Republic of - - 1.7 1.6 0.4 0.3 1.3 1.4 Malaysia - - 1.6 1.6 0.1 0.1 1.5 1.6 Pakistan 5.2 5.3 0.1 0.1 0.2 0.2 5.1 5.2 Philippines 2.2 2.4 - - 0.4 0.4 1.9 2.1 Thailand 10.6 10.3 - - 7.9 8.0 2.2 2.3 Turkey 2.4 2.4 - 0.2 - - 2.4 2.6 Viet Nam 1.5 1.6 - 0.1 0.2 0.3 1.3 1.4
AFRICA 10.4 10.8 9.8 10.1 2.6 2.2 18.1 18.6 Algeria - - 1.6 1.6 0.3 0.3 1.4 1.3 Egypt 2.0 2.0 1.2 1.2 - - 3.1 3.2 Ethiopia 0.4 0.4 0.1 0.1 - - 0.5 0.5 Kenya 0.6 0.6 0.3 0.3 - - 0.9 0.9 Mauritius 0.4 0.4 - - 0.4 0.4 0.1 0.1 Mozambique 0.4 0.5 - - 0.2 0.3 0.2 0.2 South Africa 1.9 2.0 0.2 0.2 0.3 0.4 1.9 2.0 Sudan 0.7 0.9 0.5 0.5 - - 1.2 1.3 Swaziland 0.7 0.7 - - 0.6 0.6 0.1 0.1 Tanzania, United Rep. of 0.3 0.3 0.2 0.2 - - 0.5 0.5
CENTRAL AMERICA 12.6 14.1 0.9 0.6 4.9 5.2 8.5 8.7 Cuba 1.4 1.6 - - 0.7 0.9 0.7 0.7 Dominican Republic 0.6 0.6 0.1 - 0.2 0.2 0.4 0.4 Guatemala 2.7 2.7 - 0.1 1.9 1.9 0.9 0.8 Mexico 5.3 6.6 0.5 0.1 1.1 1.7 4.5 4.6
SOUTH AMERICA 44.0 46.6 2.0 2.2 23.4 26.7 21.8 22.1 Argentina 2.1 2.1 - - 0.2 0.3 1.8 1.8 Brazil 36.2 38.6 - - 22.1 25.6 13.3 13.6 Colombia 2.3 2.4 0.3 0.3 0.8 0.7 1.8 2.0 Peru 1.1 1.1 0.3 0.3 - - 1.3 1.4 Venezuela 0.6 0.6 0.7 0.6 - - 1.1 1.2
NORTH AMERICA 7.8 8.5 4.6 3.9 0.3 0.2 12.2 12.1 United States of America 7.7 8.4 3.3 2.6 0.2 0.2 10.6 10.6
EUROPE 28.7 26.6 5.7 5.8 3.3 2.1 30.1 31.0 European Union 18.9 17.3 3.7 3.6 2.2 1.3 19.3 19.5 Russian Federation 5.5 5.2 0.8 0.9 0.2 0.2 6.1 6.2 Ukraine 2.5 2.4 - - 0.2 0.3 2.0 2.2
OCEANIA 4.2 4.7 0.3 0.3 3.1 3.5 1.4 1.5 Australia 4.0 4.5 - - 3.0 3.5 1.1 1.1 Fiji 0.2 0.2 - - 0.1 0.1 - 0.1
WORLD 175.2 180.0 49.9 48.5 52.5 51.1 169.8 173.5 Developing countries 131.9 137.5 35.1 34.2 45.6 45.0 118.7 121.8 Developed countries 43.3 42.5 14.8 14.3 7.0 6.2 51.1 51.7 LIFDCs 61.0 62.6 21.8 21.2 6.6 2.9 76.0 78.1 LDCs 3.9 4.3 5.3 5.6 0.7 0.5 8.9 9.0

Statistica
l ap
pe
nd
ixSta
tistical aa
pppp
en
dix
10909
APPENDIX TABLE 14: TOTAL MEAT STATISTICS1 (million tonnes)
,1,2,3,*,1,> Production Imports Exports Utilization
2012 2013 2012 2013 2012 2013 2012 2013 estim. f’cast estim. f’cast estim. f’cast estim. f’cast
ASIA 128 342 131 140 14 589 14 685 4 791 5 011 138 140 140 814China 83 736 85 255 3 726 3 877 1 816 1 692 85 647 87 440 of which Hong Kong, SAR 201 201 1 926 2 012 840 722 1 287 1 491 India 6 593 7 072 2 2 1 365 1 567 5 230 5 507 Indonesia 3 050 3 100 51 46 5 5 3 096 3 141 Iran, Islamic Republic of 2 256 2 322 201 176 32 33 2 425 2 464 Japan 3 259 3 242 3 149 3 133 10 11 6 397 6 365 Korea, Republic of 2 136 2 369 1 039 852 35 36 3 140 3 184 Malaysia 1 698 1 706 264 269 43 46 1 919 1 929 Pakistan 2 793 2 910 4 4 49 52 2 748 2 861 Philippines 2 871 2 936 350 342 26 28 3 195 3 250 Saudi Arabia 775 782 1 037 1 059 61 65 1 751 1 776 Singapore 115 116 317 336 25 25 407 428 Thailand 2 682 2 698 91 95 850 927 1 923 1 867 Turkey 2 646 2 685 94 100 331 381 2 408 2 404 Viet Nam 4 229 4 305 1 161 1 176 20 20 5 370 5 460
AFRICA 17 265 17 549 2 810 2 927 143 146 19 932 20 330Algeria 619 622 100 106 - - 719 727 Angola 236 245 563 618 - - 799 863 Egypt 1 910 1 958 442 426 4 4 2 349 2 380 Nigeria 1 454 1 469 1 1 - - 1 456 1 470 South Africa 2 876 2 913 463 489 31 31 3 307 3 371
CENTRAL AMERICA 8 879 8 954 2 629 2 707 545 582 10 962 11 079 Cuba 300 305 267 272 - - 567 577 Mexico 6 108 6 133 1 651 1 758 293 334 7 465 7 557
SOUTH AMERICA 38 878 39 862 1 085 1 091 7 704 8 005 32 259 32 948Argentina 4 838 5 119 40 43 552 608 4 326 4 553 Brazil 24 083 24 518 72 70 6 222 6 407 17 933 18 181 Chile 1 485 1 526 278 281 314 330 1 449 1 477 Colombia 2 256 2 263 96 107 11 14 2 340 2 357 Uruguay 648 668 31 33 362 379 318 322 Venezuela 1 680 1 785 477 461 - - 2 157 2 246
NORTH AMERICA 46 829 46 809 2 407 2 573 9 373 9 176 39 863 40 206Canada 4 312 4 233 809 835 1 720 1 715 3 402 3 354 United States of America 42 516 42 575 1 584 1 723 7 653 7 461 36 447 36 837
EUROPE 57 636 57 621 5 190 5 163 4 746 4 578 58 081 58 206 Belarus 1 035 1 071 166 172 390 404 811 838 European Union 45 018 44 696 1 393 1 390 4 094 3 856 42 317 42 230 Russian Federation 7 705 7 951 2 733 2 759 28 32 10 409 10 678 Ukraine 2 049 2 059 389 328 129 175 2 308 2 212
OCEANIA 6 021 6 232 420 439 2 583 2 703 3 858 3 967 Australia 4 141 4 264 220 235 1 720 1 804 2 641 2 695 New Zealand 1 389 1 470 54 56 860 896 583 631
WORLD 303 850 308 167 29 130 29 585 29 885 30 200 303 095 307 552Developing countries 184 137 188 220 16 966 17 219 13 129 13 689 187 974 191 750 Developed countries 119 713 119 947 12 164 12 366 16 756 16 511 115 122 115 802 LIFDCs 28 406 29 283 2 977 3 011 1 567 1 769 29 816 30 525 LDCs 10 320 10 499 1 418 1 491 6 5 11 732 11 984
1 Including “other meat”.

Foo
d O
utl
oo
k -
Jun
e 2
01
3Fo
od
Ou
tloo
ookk
- Ju
ne
20
13
1101
APPENDIX TABLE 15: BOVINE MEAT STATISTICS (thousand tonnes, carcass weight equivalent)
,1,2,3,*,1,> Production Imports Exports Utilization
2012 2013 2012 2013 2012 2013 2012 2013 estim. f’cast estim. f’cast estim. f’cast estim. f’cast
ASIA 17 175 17 624 3 571 3 746 1 697 1 885 19 000 19 482China 6 474 6 532 566 702 154 132 6 887 7 102 India 2 761 3 032 1 1 1 346 1 548 1 416 1 485 Indonesia 530 560 45 40 1 1 574 599 Iran, Islamic Republic of 250 260 152 140 2 2 401 399 Japan 519 505 739 776 2 2 1 256 1 276 Korea, Republic of 312 336 349 320 3 3 606 653 Malaysia 31 32 163 170 9 10 185 192 Pakistan 1 500 1 500 3 3 27 28 1 476 1 475 Philippines 305 310 129 125 6 8 428 427
AFRICA 6 723 6 814 718 703 75 77 7 365 7 440Algeria 127 125 94 100 - - 221 225 Angola 102 104 129 135 - - 231 239 Egypt 800 816 317 285 1 1 1 116 1 100 South Africa 850 870 9 8 11 10 848 868
CENTRAL AMERICA 2 549 2 543 371 407 381 402 2 539 2 548 Mexico 1 820 1 800 231 277 182 205 1 869 1 872
SOUTH AMERICA 15 025 15 411 493 494 2 219 2 367 13 298 13 538Argentina 2 500 2 675 2 2 185 200 2 317 2 477 Brazil 9 307 9 500 62 60 1 458 1 550 7 911 8 010 Chile 198 195 173 176 7 7 364 364 Colombia 945 930 2 2 10 12 937 920 Uruguay 488 500 - - 325 340 163 160 Venezuela 496 498 235 235 - - 731 733
NORTH AMERICA 12 925 12 500 1 266 1 424 1 505 1 479 12 653 12 486Canada 1 057 1 000 301 315 317 312 1 012 1 018 United States of America 11 868 11 500 961 1 105 1 188 1 167 11 637 11 464
EUROPE 10 367 10 340 1 426 1 430 574 547 11 218 11 223 European Union 7 641 7 603 305 315 377 347 7 569 7 571 Russian Federation 1 649 1 665 996 990 8 9 2 636 2 646 Ukraine 365 360 7 7 18 20 353 347
OCEANIA 2 801 2 908 58 55 1 765 1 841 1 082 1 107Australia 2 131 2 188 12 10 1 290 1 343 842 840 New Zealand 650 700 10 10 472 495 188 215
WORLD 67 564 68 140 7 903 8 259 8 216 8 598 67 155 67 824Developing countries 38 357 39 260 4 269 4 420 4 358 4 717 38 219 38 962 Developed countries 29 206 28 881 3 634 3 839 3 859 3 881 28 936 28 862 LIFDCs 10 604 11 005 698 666 1 510 1 712 9 792 9 958 LDCs 4 184 4 240 189 196 4 3 4 369 4 434

Statistica
l ap
pe
nd
ixSta
tistical aa
pppp
en
dix
1111
APPENDIX TABLE 16: OVINE MEAT STATISTICS (thousand tonnes, carcass weight equivalent)
,1,2,3,*,1,> Production Imports Exports Utilization
2012 2013 2012 2013 2012 2013 2012 2013 estim. f’cast estim. f’cast estim. f’cast estim. f’cast
ASIA 7 827 7 884 442 487 47 48 8 222 8 323Bangladesh 205 210 - - - - 205 210 China 3 932 3 932 159 185 6 5 4 085 4 113 India 910 920 - - 12 13 898 908 Iran, Islamic Republic of 240 245 11 12 - - 251 257 Pakistan 450 455 - - 18 20 432 435 Saudi Arabia 88 89 55 58 5 5 138 142 Turkey 300 310 1 1 - - 301 311
AFRICA 2 906 2 942 31 31 27 28 2 910 2 944Algeria 195 195 3 4 - - 198 199 Nigeria 470 475 - - - - 470 475 South Africa 163 160 5 5 - - 168 165 Sudan 482 484 - - - - 482 484
CENTRAL AMERICA 132 134 18 17 - - 150 150 Mexico 102 104 8 7 - - 110 111
SOUTH AMERICA 324 325 6 7 22 23 308 309 Brazil 115 117 6 7 - - 121 123
NORTH AMERICA 87 89 95 93 6 5 176 177United States of America 72 73 79 77 6 5 144 145
EUROPE 1 287 1 276 174 181 29 31 1 432 1 426 European Union 972 956 154 160 22 24 1 104 1 092 Russian Federation 195 200 10 10 - - 205 210
OCEANIA 1 035 1 105 31 34 692 735 375 404Australia 565 622 1 1 342 375 224 248 New Zealand 470 483 2 2 350 360 122 125
WORLD 13 599 13 755 798 849 823 871 13 573 13 733Developing countries 10 415 10 502 500 548 96 99 10 819 10 951 Developed countries 3 184 3 253 297 301 727 772 2 754 2 782 LIFDCs 4 075 4 145 39 42 14 15 4 100 4 173 LDCs 1 859 1 899 5 5 - - 1 864 1 905

Foo
d O
utl
oo
k -
Jun
e 2
01
3Fo
od
Ou
tloo
ookk
- Ju
ne
20
13
1121
APPENDIX TABLE 17: PIGMEAT STATISTICS (thousand tonnes, carcass weight equivalent)
,1,2,3,*,1,> Production Imports Exports Utilization
2012 2013 2012 2013 2012 2013 2012 2013 estim. f’cast estim. f’cast estim. f’cast estim. f’cast
ASIA 63 944 65 717 3 429 3 239 451 472 66 882 68 473China 53 361 54 806 1 252 1 233 377 392 54 236 55 648 of which Hong Kong, SAR 140 140 524 500 122 120 541 520 India 329 329 1 1 - - 330 330 Indonesia 730 737 1 1 - - 731 737 Japan 1 297 1 305 1 283 1 251 1 1 2 580 2 555 Korea, D.P.R. 115 120 2 2 - - 117 122 Korea, Republic of 1 086 1 280 508 356 2 1 1 551 1 625 Malaysia 230 230 13 10 7 8 236 232 Philippines 1 655 1 700 101 101 6 6 1 750 1 795 Thailand 870 875 3 3 28 35 844 843 Viet Nam 3 160 3 200 37 35 20 20 3 177 3 215
AFRICA 1 300 1 320 268 295 8 8 1 560 1 606Madagascar 56 56 - - - - 56 56 Nigeria 243 245 - - - - 243 245 South Africa 320 320 43 45 4 4 360 361 Uganda 120 123 - - - - 120 123
CENTRAL AMERICA 1 758 1 795 801 826 121 135 2 438 2 487 Cuba 180 182 42 45 - - 222 227 Mexico 1 227 1 255 614 645 100 116 1 741 1 784
SOUTH AMERICA 5 218 5 334 172 189 888 921 4 502 4 603Argentina 331 350 32 35 1 1 361 384 Brazil 3 330 3 370 1 2 711 733 2 620 2 639 Chile 584 620 25 30 174 185 435 465 Colombia 185 187 36 46 - - 221 233 Venezuela 175 178 29 25 - - 204 203
NORTH AMERICA 12 538 12 616 703 706 3 540 3 380 9 663 9 931Canada 1 980 1 952 264 268 1 206 1 200 1 039 1 020 United States of America 10 558 10 664 434 433 2 334 2 180 8 620 8 906
EUROPE 27 256 26 901 1 664 1 613 2 479 2 260 26 440 26 254 Belarus 427 443 135 139 145 154 417 428 European Union 22 813 22 357 20 20 2 266 2 040 20 567 20 337 Russian Federation 2 518 2 608 1 088 1 098 2 2 3 604 3 704 Serbia 290 290 19 15 10 10 299 295 Ukraine 600 590 263 200 29 25 833 765
OCEANIA 493 482 254 272 35 34 713 721Australia 352 340 195 211 34 33 514 518 Papua New Guinea 67 67 6 6 - - 73 73
WORLD 112 506 114 165 7 290 7 141 7 522 7 211 112 198 114 074Developing countries 70 394 72 329 3 302 3 206 1 463 1 532 72 192 73 994 Developed countries 42 112 41 836 3 989 3 935 6 058 5 679 40 006 40 080 LIFDCs 4 045 4 119 245 251 10 10 4 280 4 360 LDCs 1 432 1 466 187 208 - - 1 619 1 674

Statistica
l ap
pe
nd
ixSta
tistical aa
pppp
en
dix
1133
APPENDIX TABLE 18: POULTRY MEAT STATISTICS (thousand tonnes, carcass weight equivalent)
,1,2,3,*,1,> Production Imports Exports Utilization
2012 2013 2012 2013 2012 2013 2012 2013 estim. f’cast estim. f’cast estim. f’cast estim. f’cast
ASIA 37 474 37 978 7 093 7 137 2 571 2 580 41 994 42 535China 18 510 18 517 1 743 1 751 1 263 1 148 18 990 19 121 of which Hong Kong, SAR 47 47 1 073 1 075 649 550 470 572 India 2 447 2 643 - - 6 5 2 441 2 638 Indonesia 1 671 1 681 - - - - 1 671 1 681 Iran, Islamic Republic of 1 750 1 800 37 - 29 30 1 758 1 770 Japan 1 430 1 420 1 093 1 073 7 8 2 516 2 485 Korea, Republic of 727 742 169 162 30 32 866 872 Kuwait 39 39 133 120 1 1 172 159 Malaysia 1 435 1 442 68 67 27 28 1 476 1 481 Saudi Arabia 590 595 810 818 30 32 1 370 1 381 Singapore 96 96 146 155 11 11 231 240 Thailand 1 550 1 560 2 2 770 840 782 721 Turkey 1 700 1 712 84 90 311 360 1 473 1 442 Yemen 155 160 105 105 - - 260 265
AFRICA 4 926 5 034 1 762 1 866 24 25 6 664 6 876Angola 23 24 301 330 - - 324 354 South Africa 1 520 1 540 405 431 10 11 1 914 1 960
CENTRAL AMERICA 4 321 4 362 1 420 1 440 41 43 5 700 5 758 Cuba 36 37 210 215 - - 246 252 Mexico 2 857 2 872 784 815 10 12 3 631 3 675
SOUTH AMERICA 18 004 18 481 412 400 4 508 4 627 13 908 14 254Argentina 1 825 1 910 6 6 331 371 1 500 1 545 Brazil 11 300 11 500 2 2 4 029 4 100 7 273 7 402 Chile 675 685 79 75 125 130 629 630 Venezuela 1 000 1 100 213 200 - - 1 213 1 300
NORTH AMERICA 21 031 21 354 332 338 4 284 4 273 17 013 17 428Canada 1 237 1 243 225 233 177 183 1 284 1 293 United States of America 19 794 20 111 102 100 4 107 4 090 15 723 16 130
EUROPE 17 531 17 908 1 761 1 773 1 579 1 654 17 713 18 027 European Union 12 550 12 738 814 795 1 347 1 363 12 017 12 170 Russian Federation 3 252 3 388 593 615 17 20 3 828 3 983 Ukraine 1 035 1 060 118 120 81 130 1 072 1 050
OCEANIA 1 272 1 308 72 73 50 52 1 296 1 328Australia 1 071 1 092 11 12 40 40 1 044 1 064 New Zealand 175 190 1 1 10 12 166 179
WORLD 104 560 106 425 12 852 13 026 13 059 13 254 104 288 106 205 Developing countries 60 992 62 094 8 803 8 932 7 117 7 245 62 677 63 779 Developed countries 43 568 44 331 4 048 4 095 5 942 6 009 41 611 42 426 LIFDCs 7 970 8 264 1 961 2 018 27 25 9 904 10 257 LDCs 2 215 2 246 1 010 1 055 1 1 3 224 3 300

Foo
d O
utl
oo
k -
Jun
e 2
01
3Fo
od
Ou
tloo
ookk
- Ju
ne
20
13
1141
APPENDIX TABLE 19: MILK AND MILK PRODUCTS STATISTICS (thousand tonnes, milk equivalent)
,1,2,3,4,*,1,> Production Imports Exports
2009-2011 2012 2013 2009-2011 2012 2013 2009-2011 2012 2013
average average average
estim. f’cast estim. f’cast estim. f’cast
ASIA 266 731 289 431 301 619 23 223 28 013 29 598 5 245 5 881 6 032China 41 128 44 233 46 745 4 407 6 478 7 080 176 211 191 India1 122 057 133 700 139 000 281 162 122 223 411 510 Indonesia 1 307 1 395 1 465 1 535 1 746 1 833 165 87 77 Iran, Islamic Republic of 7 460 7 900 8 200 330 401 546 232 316 319 Japan 7 702 7 632 7 532 1 203 1 385 1 436 12 2 2 Korea, Republic of 2 059 1 899 1 918 504 560 615 12 13 15 Malaysia 74 76 77 1 053 1 221 1 269 270 405 446 Pakistan 35 503 37 866 39 115 155 317 343 31 38 42 Philippines 15 18 20 1 375 1 379 1 397 288 168 159 Saudi Arabia 1 877 2 100 2 200 2 071 2 948 3 200 1 531 1 923 1 925 Singapore - - - 1 355 1 341 1 303 597 571 559 Thailand 850 870 880 782 973 860 127 116 113 Turkey 13 714 16 700 18 400 215 161 160 182 200 221
AFRICA 42 754 45 684 46 564 9 292 8 841 8 764 1 424 1 208 1 165Algeria 2 527 3 180 3 339 2 432 2 504 2 463 9 10 10Egypt 5 751 5 850 5 900 1 273 1 436 1 403 768 581 511 Kenya 4 229 4 280 4 350 23 24 21 33 15 10 South Africa 3 198 3 340 3 375 104 211 227 89 100 100 Sudan 7 472 7 600 7 675 290 274 264 - - -Tunisia 1 088 1 120 1 130 65 78 78 54 41 41
CENTRAL AMERICA 16 238 16 510 16 582 4 025 4 446 4 367 532 534 506 Costa Rica 943 1 014 1 065 31 40 42 109 128 120 Mexico 10 813 11 111 11 107 2 338 2 636 2 651 151 128 113
SOUTH AMERICA 64 229 69 520 71 818 2 330 3 836 3 223 3 180 3 800 3 617Argentina 10 787 11 493 11 500 23 39 36 1 749 2 074 1 882 Brazil 30 777 33 045 34 036 658 969 906 175 72 76 Colombia 7 532 7 600 7 650 27 173 103 18 5 3 Uruguay 1 916 2 200 2 266 13 20 20 840 1 150 1 162 Venezuela 2 293 2 481 2 580 1 100 1 867 1 391 - - -
NORTH AMERICA 95 743 99 307 100 038 1 609 1 698 1 691 4 329 5 384 5 282Canada 8 285 8 450 8 500 261 259 263 148 159 169 United States of America 87 457 90 856 91 537 1 332 1 420 1 410 4 180 5 224 5 112
EUROPE 214 226 217 662 218 816 5 218 5 936 6 092 14 440 16 145 16 295 Belarus 6 569 6 863 7 200 37 52 57 2 013 2 234 2 618 European Union 153 251 156 400 156 550 906 906 913 10 974 12 477 12 261 Russian Federation 32 015 31 912 32 230 3 456 3 987 4 117 158 96 90 Ukraine 11 315 11 380 11 722 154 189 183 616 601 571
OCEANIA 26 369 29 292 28 990 807 848 851 17 680 20 715 21 779Australia2 9 171 9 480 9 320 563 574 584 3 244 3 245 3 451 New Zealand3 17 129 19 742 19 600 72 86 64 14 433 17 466 18 324
WORLD 726 290 767 407 784 427 46 503 53 618 54 587 46 830 53 667 54 676Developing countries 359 349 389 182 404 015 37 054 43 119 43 870 10 227 11 285 11 180 Developed countries 366 941 378 225 380 413 9 450 10 499 10 714 36 603 42 380 43 494 LIFDCs 174 522 189 439 196 017 11 066 10 472 10 450 2 182 1 932 1 951 LDCs 30 895 33 084 33 786 3 003 3 073 3 049 123 136 149
1 Dairy years starting April of the year stated (production only). 2 Dairy years ending June of the year stated (production only).
3 Dairy years ending May of the year stated (production only). Note: Trade figures refer to the milk equivalent trade in the following products: butter (6.60), cheese (4.40), milk powder (7.60), skim condensed/evaporated milk (1.90), whole condensed/evaporated milk (2.10), yoghurt (1.0), cream (3.60), casein (7.40), skim milk (0.70). The conversion factors cited refer to the solids content method. Refer to IDF Bulletin No. 390 (March 2004).
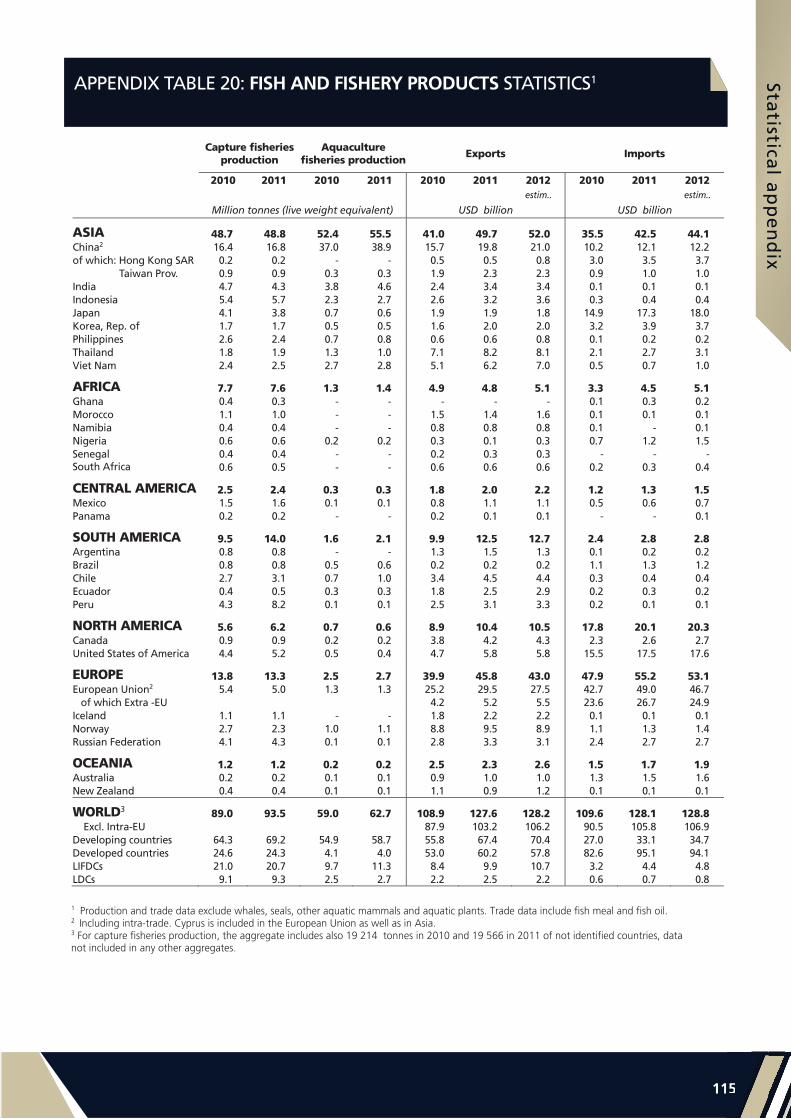
Statistica
l ap
pe
nd
ixSta
tistical aa
pppp
en
dix
1155
APPENDIX TABLE 20: FISH AND FISHERY PRODUCTS STATISTICS1
,1,2,3,4,*,1,> Capture fisheries production
Aquaculture fisheries production Exports Imports
2010 2011 2010 2011 2010 2011 2012 2010 2011 2012 estim.. estim..
Million tonnes (live weight equivalent) USD billion USD billion
ASIA 48.7 48.8 52.4 55.5 41.0 49.7 52.0 35.5 42.5 44.1 China2 16.4 16.8 37.0 38.9 15.7 19.8 21.0 10.2 12.1 12.2 of which: Hong Kong SAR 0.2 0.2 - - 0.5 0.5 0.8 3.0 3.5 3.7 Taiwan Prov. 0.9 0.9 0.3 0.3 1.9 2.3 2.3 0.9 1.0 1.0 India 4.7 4.3 3.8 4.6 2.4 3.4 3.4 0.1 0.1 0.1 Indonesia 5.4 5.7 2.3 2.7 2.6 3.2 3.6 0.3 0.4 0.4 Japan 4.1 3.8 0.7 0.6 1.9 1.9 1.8 14.9 17.3 18.0 Korea, Rep. of 1.7 1.7 0.5 0.5 1.6 2.0 2.0 3.2 3.9 3.7 Philippines 2.6 2.4 0.7 0.8 0.6 0.6 0.8 0.1 0.2 0.2 Thailand 1.8 1.9 1.3 1.0 7.1 8.2 8.1 2.1 2.7 3.1 Viet Nam 2.4 2.5 2.7 2.8 5.1 6.2 7.0 0.5 0.7 1.0
AFRICA 7.7 7.6 1.3 1.4 4.9 4.8 5.1 3.3 4.5 5.1 Ghana 0.4 0.3 - - - - - 0.1 0.3 0.2 Morocco 1.1 1.0 - - 1.5 1.4 1.6 0.1 0.1 0.1 Namibia 0.4 0.4 - - 0.8 0.8 0.8 0.1 - 0.1 Nigeria 0.6 0.6 0.2 0.2 0.3 0.1 0.3 0.7 1.2 1.5 Senegal 0.4 0.4 - - 0.2 0.3 0.3 - - - South Africa 0.6 0.5 - - 0.6 0.6 0.6 0.2 0.3 0.4
CENTRAL AMERICA 2.5 2.4 0.3 0.3 1.8 2.0 2.2 1.2 1.3 1.5 Mexico 1.5 1.6 0.1 0.1 0.8 1.1 1.1 0.5 0.6 0.7 Panama 0.2 0.2 - - 0.2 0.1 0.1 - - 0.1
SOUTH AMERICA 9.5 14.0 1.6 2.1 9.9 12.5 12.7 2.4 2.8 2.8 Argentina 0.8 0.8 - - 1.3 1.5 1.3 0.1 0.2 0.2 Brazil 0.8 0.8 0.5 0.6 0.2 0.2 0.2 1.1 1.3 1.2 Chile 2.7 3.1 0.7 1.0 3.4 4.5 4.4 0.3 0.4 0.4 Ecuador 0.4 0.5 0.3 0.3 1.8 2.5 2.9 0.2 0.3 0.2 Peru 4.3 8.2 0.1 0.1 2.5 3.1 3.3 0.2 0.1 0.1
NORTH AMERICA 5.6 6.2 0.7 0.6 8.9 10.4 10.5 17.8 20.1 20.3 Canada 0.9 0.9 0.2 0.2 3.8 4.2 4.3 2.3 2.6 2.7 United States of America 4.4 5.2 0.5 0.4 4.7 5.8 5.8 15.5 17.5 17.6
EUROPE 13.8 13.3 2.5 2.7 39.9 45.8 43.0 47.9 55.2 53.1 European Union2 5.4 5.0 1.3 1.3 25.2 29.5 27.5 42.7 49.0 46.7 of which Extra -EU 4.2 5.2 5.5 23.6 26.7 24.9 Iceland 1.1 1.1 - - 1.8 2.2 2.2 0.1 0.1 0.1 Norway 2.7 2.3 1.0 1.1 8.8 9.5 8.9 1.1 1.3 1.4 Russian Federation 4.1 4.3 0.1 0.1 2.8 3.3 3.1 2.4 2.7 2.7
OCEANIA 1.2 1.2 0.2 0.2 2.5 2.3 2.6 1.5 1.7 1.9 Australia 0.2 0.2 0.1 0.1 0.9 1.0 1.0 1.3 1.5 1.6 New Zealand 0.4 0.4 0.1 0.1 1.1 0.9 1.2 0.1 0.1 0.1
WORLD3 89.0 93.5 59.0 62.7 108.9 127.6 128.2 109.6 128.1 128.8 Excl. Intra-EU 87.9 103.2 106.2 90.5 105.8 106.9 Developing countries 64.3 69.2 54.9 58.7 55.8 67.4 70.4 27.0 33.1 34.7 Developed countries 24.6 24.3 4.1 4.0 53.0 60.2 57.8 82.6 95.1 94.1 LIFDCs 21.0 20.7 9.7 11.3 8.4 9.9 10.7 3.2 4.4 4.8 LDCs 9.1 9.3 2.5 2.7 2.2 2.5 2.2 0.6 0.7 0.8
1 Production and trade data exclude whales, seals, other aquatic mammals and aquatic plants. Trade data include fish meal and fish oil. 2 Including intra-trade. Cyprus is included in the European Union as well as in Asia. 3 For capture fisheries production, the aggregate includes also 19 214 tonnes in 2010 and 19 566 in 2011 of not identified countries, data not included in any other aggregates.

Foo
d O
utl
oo
k -
Jun
e 2
01
3Fo
od
Ou
tloo
ookk
- Ju
ne
20
13
1161
APPENDIX TABLE 21: SELECTED INTERNATIONAL PRICES FOR WHEAT AND COARSE GRAINS (USD/tonne)
APPENDIX TABLE 22: TOTAL WHEAT AND MAIZE FUTURES PRICES (USD/tonne
Wheat Maize Barley Sorghum
Period US No. 2 Hard
Red Winter
Ord. Prot. 1
US Soft Red
Winter No. 2 2
Argentina
Trigo Pan 3
US No. 2
Yellow 2
Argentina 3 France feed
Rouen
Australia feed
Eastern States
US No. 2
Yellow 2
Annual (July/June)
2004/05 154 138 123 97 90 132 123 99
2005/06 175 138 138 104 101 133 128 109
2006/07 212 176 188 150 145 185 185 155
2007/08 361 311 322 200 192 319 300 206
2008/09 270 201 234 188 180 178 179 170
2009/10 209 185 224 160 168 146 154 165
2010/11 316 289 311 254 260 274 247 248
2011/12 300 259 264 281 269 276 250 264
2012 – May 279 252 251 269 246 274 248 219
2012 – June 288 250 263 268 238 260 254 234
2012 – July 352 318 314 330 285 294 303 293
2012 – August 362 332 335 328 294 299 311 296
2012 – September 372 341 336 323 278 313 310 286
2012 – October 382 339 332 320 274 312 308 290
2012 – November 373 346 345 324 294 318 309 289
2012 – December 359 325 360 310 288 312 310 288
2013 – January 328 311 362 303 294 309 308 287
2013 – February 328 297 358 303 283 301 302 288
2013 – March 323 286 346 309 276 286 284 296
2013 – April 324 279 324 282 242 289 281 261
2013 – May 329 278 315 295 257 273 289 254
1 Delivered United States f.o.b. Gulf; 2 Delivered United States Gulf; 3 Up River f.o.b. Sources: International Grain Council and USDA
July September December March
July 2013 July 2012 Sep. 2013 Sep. 2012 Dec. 2013 Dec. 2012 Mar. 2014 Mar. 2013
Wheat
Apr 17 260 228 262 233 267 241 272 247
Apr 24 254 232 257 238 262 247 267 253
May 1 265 236 268 242 274 250 279 257
May 8 259 226 263 231 269 240 275 248
May 15 255 224 258 229 264 237 270 244
May 22 253 252 256 256 261 263 267 268
Maize
Apr 17 252 239 226 213 215 209 219 213
Apr 24 243 239 215 219 208 213 212 218
May 1 255 248 226 217 217 212 221 217
May 8 249 245 218 212 209 208 214 212
May 15 256 235 222 206 209 203 213 207
May 22 259 235 220 207 209 205 213 210
Source: Chicago Board of Trade (CBOT)

Statistica
l ap
pe
nd
ixSta
tistical aa
pppp
en
dix
1177
APPENDIX TABLE 23: SELECTED INTERNATIONAL PRICES FOR RICE AND PRICE INDICES
International prices (USD per tonne) FAO indices (2002-2004=100)
Indica
Period Thai 100% B1 Thai
broken 2
US long
grain 3
Pakisan
Basmati4
Total High quality Low
quality
Japonica Aromatic
Annual (Jan/Dec)
2007 335 275 436 677 161 156 160 168 157
2008 695 506 782 1077 294 296 287 314 251
2009 587 329 545 937 253 229 196 341 232
2010 518 386 510 881 229 211 212 264 231
2011 565 464 577 1060 251 237 250 274 227
2012 588 540 567 1137 240 230 242 248 236
Monthly
2012 – May 613 554 544 1138 240 233 243 246 235
2012 – June 619 545 565 1121 239 233 240 249 231
2012 – July 600 537 573 1150 241 230 241 254 234
2012 – August 584 532 585 1142 242 232 242 252 240
2012 – September 602 540 600 1149 247 236 248 259 241
2012 – October 595 544 600 1120 246 234 248 256 241
2012 – November 598 545 608 1185 244 235 244 254 244
2012 – December 599 546 608 1312 240 229 237 246 258
2013 – January 611 558 616 1350 240 230 239 241 269
2013 – February 616 562 624 1369 242 232 242 239 282
2013 – March 594 557 644 1365 242 231 242 237 285
2013 – April 586 551 649 1362 240 228 240 237 286
2013 – May 574 539 652 1375 240 226 238 241 286
1 White rice, 100 percent second grade, f.o.b. Bangkok.2 A1 super, f.o.b. Bangkok.3 United States No.2, 4 percent brokens f.o.b.4 Up to May 2011: Basmati ordinary, f.o.b. Karachi; from June 2011 onwards: Super Kernel White Basmati Rice 2%.Note: The FAO Rice Price Index is based on 16 rice export quotations. ‘Quality’ is defined by the percentage of broken kernels, with high (low) quality referring to rice with less (equal to or more) than 20 percent brokens. The sub-index for Aromatic Rice follows movements in prices of Basmati and Fragrant rice.Sources: FAO for indices. Rice prices: Livericeindex.com, Thai Department of Foreign Trade (DFT) and other public sources.
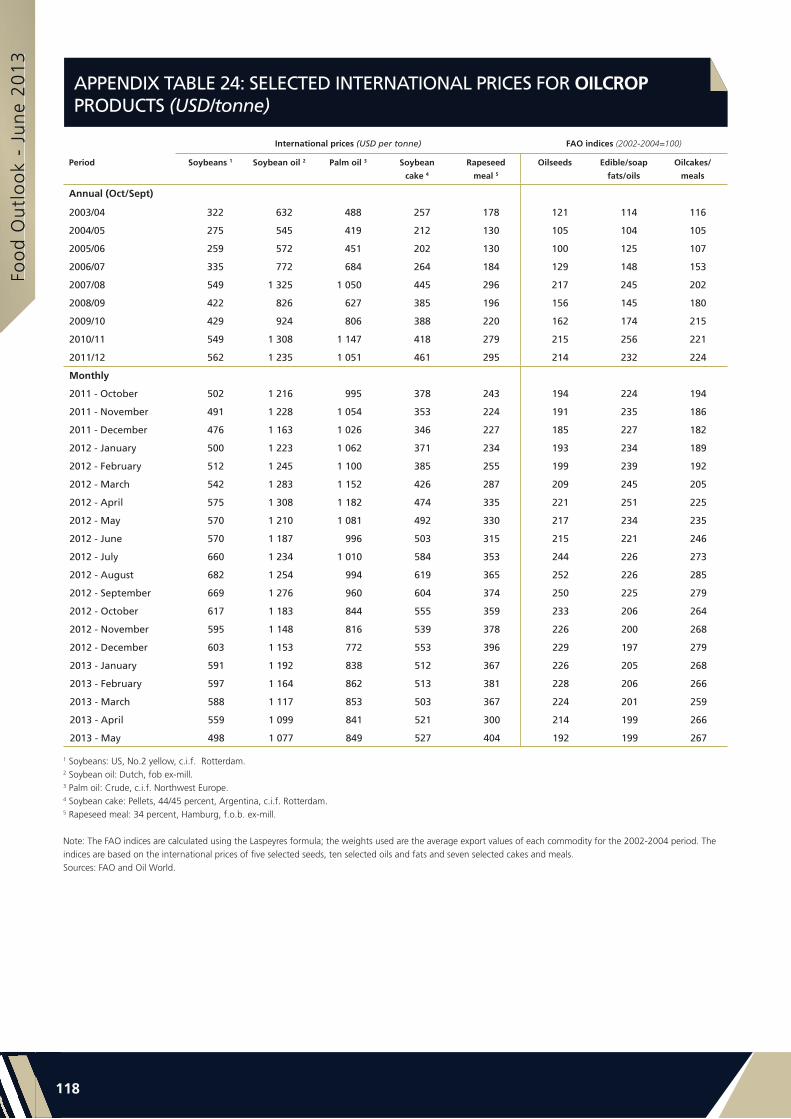
Foo
d O
utl
oo
k -
Jun
e 2
01
3Fo
od
Ou
tloo
ookk
- Ju
ne
20
13
1181
APPENDIX TABLE 24: SELECTED INTERNATIONAL PRICES FOR OILCROP PRODUCTS (USD/tonne)
International prices (USD per tonne) FAO indices (2002-2004=100)
Period Soybeans 1 Soybean oil 2 Palm oil 3 Soybean
cake 4
Rapeseed
meal 5
Oilseeds Edible/soap
fats/oils
Oilcakes/
meals
Annual (Oct/Sept)
2003/04 322 632 488 257 178 121 114 116
2004/05 275 545 419 212 130 105 104 105
2005/06 259 572 451 202 130 100 125 107
2006/07 335 772 684 264 184 129 148 153
2007/08 549 1 325 1 050 445 296 217 245 202
2008/09 422 826 627 385 196 156 145 180
2009/10 429 924 806 388 220 162 174 215
2010/11 549 1 308 1 147 418 279 215 256 221
2011/12 562 1 235 1 051 461 295 214 232 224
Monthly
2011 - October 502 1 216 995 378 243 194 224 194
2011 - November 491 1 228 1 054 353 224 191 235 186
2011 - December 476 1 163 1 026 346 227 185 227 182
2012 - January 500 1 223 1 062 371 234 193 234 189
2012 - February 512 1 245 1 100 385 255 199 239 192
2012 - March 542 1 283 1 152 426 287 209 245 205
2012 - April 575 1 308 1 182 474 335 221 251 225
2012 - May 570 1 210 1 081 492 330 217 234 235
2012 - June 570 1 187 996 503 315 215 221 246
2012 - July 660 1 234 1 010 584 353 244 226 273
2012 - August 682 1 254 994 619 365 252 226 285
2012 - September 669 1 276 960 604 374 250 225 279
2012 - October 617 1 183 844 555 359 233 206 264
2012 - November 595 1 148 816 539 378 226 200 268
2012 - December 603 1 153 772 553 396 229 197 279
2013 - January 591 1 192 838 512 367 226 205 268
2013 - February 597 1 164 862 513 381 228 206 266
2013 - March 588 1 117 853 503 367 224 201 259
2013 - April 559 1 099 841 521 300 214 199 266
2013 - May 498 1 077 849 527 404 192 199 267
1 Soybeans: US, No.2 yellow, c.i.f. Rotterdam.2 Soybean oil: Dutch, fob ex-mill.3 Palm oil: Crude, c.i.f. Northwest Europe.4 Soybean cake: Pellets, 44/45 percent, Argentina, c.i.f. Rotterdam.5 Rapeseed meal: 34 percent, Hamburg, f.o.b. ex-mill. Note: The FAO indices are calculated using the Laspeyres formula; the weights used are the average export values of each commodity for the 2002-2004 period. The indices are based on the international prices of five selected seeds, ten selected oils and fats and seven selected cakes and meals.Sources: FAO and Oil World.

Statistica
l ap
pe
nd
ixSta
tistical aa
pppp
en
dix
1199
APPENDIX TABLE 25: SELECTED INTERNATIONAL PRICES FOR SUGAR AND SUGAR PRICE INDEX
I.S.A. average of daily prices ISO (Euronext, Liffe) white sugar price index
FAO sugar price index (2002/04 = 100)
Raw Sugar White
Annual (Jan/Dec) (US cents/lb)
2005 9.9 13.18 140.3
2006 14.8 18.97 209.6
2007 10.1 13.96 143.0
2008 12.8 16.07 181.6
2009 18.1 22.16 257.3
2010 21.3 27.25 302.0
2011 26.0 31.41 368.9
2012
Monthly
2011 - October 25.5 30.7 361.2
2011 - November 24.0 28.8 339.9
2011 - December 23.0 27.4 326.9
2012 - January 23.6 28.2 334.3
2012 - February 24.1 28.8 342.3
2012 - March 24.1 29.0 341.9
2012 - April 22.8 27.3 324.0
2012 - May 20.8 25.2 294.6
2012 - June 20.5 25.9 290.4
2012 - July 22.9 28.2 324.3
2012 - August 20.9 25.8 296.2
2012 - September 20.0 25.4 283.7
2012 - October 20.3 25.3 288.2
2012 - November 19.3 23.7 274.5
2012 - December 19.3 23.5 274.0
2013 - January 18.9 22.9 267.8
2013 - February 18.3 22.6 259.2
2013 - March 18.5 23.5 262.0
2013 - April 17.8 22.7 252.6
2013 - May 17.6 21.9 250.1

Foo
d O
utl
oo
k -
Jun
e 2
01
3Fo
od
Ou
tloo
ookk
- Ju
ne
20
13
1201
APPENDIX TABLE 26: SELECTED INTERNATIONAL PRICES FOR MILK PRODUCTS AND DAIRY PRICE INDEX
International prices (USD per tonne) FAO dairy price index
(2002-2004=100)
Period Butter 1 Skim milk powder 2 Whole milk powder 3 Cheddar cheese 4
Annual (Jan/Dec)
2006 1 774 2 218 2 193 2 681 128
2007 2 959 4 291 4 185 4 055 212
2008 3 607 3 278 3 846 4 633 220
2009 2 335 2 255 2 400 2 957 142
2010 4 043 3 127 3 464 4 010 200
2011 4 473 3 657 3 860 4 310 221
2012 3 310 3 163 3 232 3 821 189
Monthly
2012 - May 3 100 2 807 3 000 3 625 176
2012 - June 2 975 2 863 2 800 3 600 173
2012 - July 2 850 2 838 2 875 3 600 173
2012 - August 2 942 2 975 2 955 3 600 176
2012 - September 3 175 3 325 3 194 3 775 188
2012 - October 3 250 3 400 3 300 3 925 194
2012 – November 3 250 3 363 3 375 3 950 195
2012 – December 3 292 3 408 3 333 4 000 197
2013 – January 3 375 3 463 3 363 4 000 198
2013 – February 3 575 3 588 3 538 4 025 203
2013 – March 4 138 4 020 4 525 4 225 225
2013 – April 4 588 5 394 5 550 4 500 259
2013 - May 4 275 4 738 5 206 4 600 250
1 Butter, 82 percent butterfat, f.o.b. Oceania; indicative traded prices2 Skim Milk Powder, 1.25 percent butterfat, f.o.b. Oceania, indicative traded prices3 Whole Milk Powder, 26 percent butterfat, f.o.b. Oceania, indicative traded prices4 Cheddar Cheese, 39 percent maximum moisture, f.o.b. Oceania, indicative traded prices
Note: The FAO Dairy Price Index is derived from a trade-weighted average of a selection of representative internationally-traded dairy productsSources: FAO for indices. Product prices: Mid-point of price ranges reported by Dairy Market News (USDA)

Statistica
l ap
pe
nd
ixSta
tistical aa
pppp
en
dix
12121
APPENDIX TABLE 27: SELECTED INTERNATIONAL MEAT PRICES
Bovine meat prices
(USD per tonne)
Ovine meat
price
(USD per tonne)
Pig meat prices
(USD per tonne)
Period Australia United States Brazil New Zealand United States Brazil Germany
Annual (Jan/Dec)
2006 2 547 3 803 2 219 4 033 1 986 2 134 1 935
2007 2 603 4 023 2 367 4 120 2 117 2 200 1 907
2008 3 138 4 325 3 785 4 585 2 270 3 000 2 364
2009 2 636 3 897 3 118 4 276 2 202 2 223 2 035
2010 3 351 4 378 3 919 5 045 2 454 2 747 1 913
2011 4 041 4 516 4 816 6 631 2 648 3 023 2 169
2012 4 142 4 913 4 492 6 091 2 676 2 784 2 233
Monthly
2012 – March 4 269 5 003 4 544 6 451 2 790 2 755 2 177
2012 – April 4 236 5 095 4 611 6 443 2 704 2 848 2 250
2012 – May 4 109 5 059 4 536 6 193 2 569 2 790 2 162
2012 – June 4 045 4 781 4 422 5 913 2 608 2 663 2 118
2012- July 3 988 4 660 4 313 5 927 2 650 2 618 2 029
2012 – August 4 041 4 650 4 418 5 816 2 655 2 657 2 253
2012 – September 3 974 4 748 4 365 5 882 2 640 2 772 2 512
2012 – October 4 010 4 722 4 512 5 866 2 719 2 929 2 507
2012 – November 4 247 4 947 4 495 5 827 2 636 2 901 2 372
2012 – December 4 316 5 326 4 436 5 893 2 705 2 854 2 280
2013 – January 4 307 5 171 4 382 5 751 2 753 2 852 2 253
2013 – February 4 280 5 562 4 365 5 490 2 710 2 898 2 283
2013 - March 4 227 5 271 4 430 5 354 2 781 2 955 2 221
Bovine meat prices:Australia: up to Oct02 : cow forequarters frozen boneless, 85% chemical lean, cif US port (East Coast) ex-dock; from Nov02: chucks and cow forequartersUSA: Frozen beef, export unit valueBrazil: Frozen beef, export unit value
Ovine meat pricesNew Zealand: Lamb, frozen whole carcasses,wholesale price Smithfield Mkt. London
Pig meat prices:USA: Frozen pigmeat, export unit valueBrazil: Frozen pigmeat, export unit valueGermany: Monthly market price for pig carcase grade E

Foo
d O
utl
oo
k -
Jun
e 2
01
3Fo
od
Ou
tloo
ookk
- Ju
ne
20
13
1221
APPENDIX TABLE 28: SELECTED INTERNATIONAL MEAT PRICES AND FAO MEAT PRICE INDICES
Poultry meat prices
(USD per tonne)
FAO indices
(2002-2004=100)
Period United States Brazil Total meat Bovine meat Ovine meat Pig meat Poultry meat
Annual (Jan/Dec)
2006 734 1 180 119 119 103 123 122
2007 935 1 443 125 125 105 125 151
2008 997 1 896 153 157 117 152 184
2009 989 1 552 133 134 109 131 162
2010 1 032 1 781 152 163 128 138 177
2011 1 147 2 083 177 189 169 153 206
2012 1 228 1 931 175 190 155 153 201
Monthly
2012 – March 1 243 1 921 178 194 164 152 201
2012 – April 1 267 1 945 180 196 164 154 204
2012 – May 1 272 1 899 175 192 158 148 202
2012 – June 1 228 1 768 170 186 150 146 190
2012- July 1 206 1 775 167 182 151 143 189
2012 – August 1 207 1 845 170 185 148 151 194
2012 – September 1 227 2 035 175 184 150 161 208
2012 – October 1 249 2 066 177 186 149 164 211
2012 – November 1 232 2 062 178 193 148 158 210
2012 – December 1 206 2 093 179 198 150 155 210
2013 – January 1 248 2 009 177 195 146 155 207
2013 – February 1 218 2 113 179 199 140 156 212
2013 - March 1 210 2 191 178 195 136 156 217
Poultry meat prices:USA : Broiler cuts, export unit valueBrazil : Export unit value for chicken (f.o.b.)
The FAO Meat Price Indices consist of 2 poultry meat product quotations (the average weighted by assumed fixed trade weights), 3 bovine meat product quotations (average weighted by assumed fixed trade weights), 3 pig meat product quotations (average weighted by assumed fixed trade weights), 1 ovine meat product quotation (average weighted by assumed fixed trade weights): the four meat group average prices are weighted by world average export trade shares for 2002/2004.

Statistica
l ap
pe
nd
ixSta
tistical aa
pppp
en
dix
12323
APPENDIX TABLE 29: FISH PRICE INDICES (2002-2004=100)
APPENDIX TABLE 30: SELECTED INTERNATIONAL COMMODITY PRICES
Period Total Aquaculture Capture White fish Salmon Shrimp Pelagic
e/tuna
Tuna Other fish
Annual (Jan/Dec)
2006 102 99 105 110 109 98 112 102 93
2007 109 100 116 119 110 101 118 116 98
2008 119 104 130 130 114 108 134 139 104
2009 109 103 114 113 120 96 126 126 98
2010 119 119 119 121 141 107 130 125 110
2011 154 149 157 195 124 173 175 166 151
2012 144 124 157 146 107 207 195 176 145
Monthly
2012 - May 145 128 154 148 156 101 202 198 179
2012 - June 143 125 154 145 146 105 203 194 176
2012 - July 141 121 153 143 140 103 225 196 173
2012 - August 144 121 159 140 139 101 244 215 176
2012 - September 142 119 156 149 137 102 235 193 168
2012 - October 142 117 158 142 138 107 207 193 172
2012 - November 143 122 156 142 141 110 230 187 171
2012 - December 148 123 164 143 150 110 192 203 184
2013 - January 149 125 165 140 158 112 190 210 185
2013 - February 152 131 168 138 163 115 185 214 182
2013 - March 155 142 170 136 174 118 185 214 184
2013 - April 158 151 171 132 186 119 182 221 182
2013 - May 168 161 173 132 195 123 182 221 183
Source= Norwegian Seafood Council.Note: The FAO Fish Price Index is based on nominal import values expressed in CIF in the three major import markets; Japan, USA and EU. Separate indexes exist for products from aquaculture and from capture fisheries. Additional sub-indexes exist for the major commodity groups based on species.
Currency and unit Effective date Latest quotation One month ago One year ago Average
2008-2012
Sugar (ISA daily price) US cents per lb 23-05-13 17.32 17.82 20.14 19.95
Coffee (ICO daily price) US cents per lb 22-05-13 123.33 129.55 157.68 150.78
Cocoa (ICCO daily price) US cents per lb 22-05-13 105.84 105.80 104.96 126.77
Tea (FAO Tea Composite Price) USD per kg 30-04-13 2.80 2.98 2.89 2.72
Cotton (COTLOOK A index) US cents per lb 30-04-13 92.57 94.45 100.10 96.31
Jute “BTD” USD per tonne 22-05-13 600.00 600.00 490.00 610.63
(Fob Bangladesh Port)

MA
RKET
IND
ICAT
ORS
MAR
KET
INDI
CATO
RS

Ma
rke
t ind
icato
rsM
ark
ett iinn
ddiiccaa
ttoors
12525
INVESTMENT FLOWS Article by Ann Berg, Senior Commodity Analyst
For the first time in over a decade, global trading volumes
in futures contracts declined in North America, Europe and
Pacific/Asia in 2012 – falling by about 15 percent. However,
agricultural volumes proved an exception, experiencing
an increase of 24 percent over 2011, which was a year
of steep volume drop following the collapse of two US
brokerage firms. In spite of the increase, the 2012 volumes
still did not exceed those of 2010, which was a record
volume year for the sector. In 2013, declining prices and
subdued volatility seem to be depressing the hedge fund
and passive index fund product sector, which had seen
customer withdrawals after two years of negative returns
[see “Commodity Hedge Funds in Retreat?” in the Special
Feature section of this report]. Most components of the
commodity sector – industrial metals, such as aluminum
and copper, soft commodities, such as cocoa, coffee and
sugar, and livestock – seem to be in a downtrend. A recent
sharp drop in the price of gold, a market once revered as
the ultimate safe haven, has left some commodity investors
disillusioned. Contrarily, the impacts of the much debated
US and European Regulatory reform measures appear to
have been negligible for agricultural futures trade volumes,
since they mostly focused on the OTC swaps market, of
which agriculture comprises a very small fraction.
Forward curvesOne persistent feature of the US maize, soybean and wheat
markets has been their forward curve structures. Owing
to their yearly production cycles, grain markets normally
exhibit ascendant prices referred to as “contango” for
the first 6 to 9 months of the crop year and thereafter
descendant prices, referred to as “backwardation”.
However, maize and soybeans exhibited high levels of
backwardation soon after the 2012 harvest. The maize
situation was exacerbated by the much reduced supply
and the continued diversion of the grain into fuel Holding
excess storage, farmers have been unwilling to sell their
maize unless paid high cash premiums, while ethanol plants
have drawn available maize away from the narrow band
of delivery points located along the Illinois River, creating
a constant shortage of delivery supplies. The net result has
been an abnormally backwardated structure with calendar
spreads such as Mar/May and May/July reaching historically
high inversions. Similarly in soybeans, shifting demand from
South American ports to US Gulf, particularly by China,
has kept cash basis levels at premiums to futures, leading
to almost no soybean deliveries for current crop year.
Figure 4. Forward curves snapshots as of 15 May 2011, 2012, 2013
200
220
240
260
280
19M15M10M5M1M
2011
2012
2013
USD per tonne
Maize
Soybeans
Wheat
400
450
500
550
24M20M16M12M8M4M1M
2013
2012
2011
USD per tonne
200
250
300
350
16M12M8M4M1M
2013
2012
2011
USD per tonne

Foo
d O
utl
oo
k -
Jun
e 2
01
3Fo
od
Ouu
ttlloo
ookk
- Ju
ne
20
133
1261
Figure 1. CME futures prices
100
300
500
700
2013201220112010
Wheat Maize Soybeans
USD per tonne
Figure 2. CME futures volumes
0
1
2
3
2013201220112010
Wheat Maize Soybeans
Million tonnes
Figure 3. Historical volatility (30 days)
5
25
45
65
2013 201220112010
Wheat Maize Soybeans
Percent
Figure 4. Implied volatility
5
25
45
65
2013 201220112010
Wheat Maize Soybeans
Percent
and steeply backwardated forward curves. The Soft Red
Wheat contract has remained mostly in contango, but at
levels less upward sloping than previous years as cash and
futures convergence has improved. In general, markets
have performed their proper function by encouraging some
demand rationing and an expansion of planted hectares for
the 2013/2014 marketing season.

Ma
rke
t ind
icato
rsM
ark
ett iinn
ddiiccaa
ttoors
12727
OCEAN FREIGHT RATES Contributed by the International Grains Council (IGC) www.igc.org.uk
OCEAN FREIGHT MARKET (OCTOBER 2012 - MID-MAY 2013)
Over the past seven months, dry bulk ocean freight
rates in the grain-carrying sectors registered some gains
from mid-February on the back of improved demand for
commodities, notably on routes from South America and
the US Gulf. Atlantic demand continued to draw tonnage
from South East Asia, thus underpinning the Pacific market.
A severe congestion in Brazil’s ports was also supportive. In
March, the Baltic Dry Index (BDI) increased by one-fourth,
to the highest level of 2013, while the average of indices
of three grains-carrying sectors soared by 35 percent.
However, surplus tonnage continued to weigh and in
April and the beginning of May rates in the Panamax and
Supramax sectors started to retreat amid reduced volumes
of trade, partly due to early-May holidays. Overall, since
last September, the average of the three grain-carrying
indices registered a net gain of some 38 percent, while the
Baltic Dry Index (BDI) added just 11 percent, following a
nearly 20 percent fall in Capesize values due to a weaker
demand for raw materials. In the near-term, the market is
expected to remain rather weak due to an over-capacity of
Selected routes (monthly averages) USD/tonne
Brazil/EU ARAH US Gulf/EU ARAH US Gulf/Japan US Gulf/S. Korea
Vessel size Handysize Panamax Panamax Panamax
Origin Brazil US (Gulf) US (Gulf) US (Gulf)
Destination EU (ARAH) EU (ARAH) Japan South Korea
April 2012 36 22 52 53
May 2012 39 22 52 53
June 2012 40 20 51 52
July 2012 39 21 53 54
August 2012 34 18 48 49
September2012 30 17 46 47
October 2012 30 18 47 48
November 2012 28 16 44 45
December 2012 28 18 42 43
January 2013 29 19 43 44
February 2013 28 20 44 45
March 2013 30 23 46 47
April 2013 32 23 45 46
tonnage and insufficient demand. Piracy continued to be
a problem, pushing insurance premiums higher on routes
along Africa’s east and west coasts, the Arabian Sea and
the Indian Ocean.
Panamax rates remained volatile in both basins, with a
sharp rise in mid-November, followed by a fall in December/
January due to limited trading. However, from mid-February
the market firmed on improved chartering activity and
tightening supply of early vessels, notably on routes from
the US Gulf and South America, underpinned by grain and
soyabeans shipments. In the Pacific, the market continued
to draw support from mineral shipments, particularly from
Australia and Indonesia. Overall, since the beginning of
October 2012, the Baltic Panamax Index (BPI) more than
doubled by the end of March, to the highest level in ten
months. The Atlantic market eased more recently on
surplus tonnage, with vessels ballasting from the Pacific
and Indian Oceans into the Atlantic in search of better rates
putting pressure on Atlantic rates.
Similarly to the Panamax sector, Handysize/Supramax rates rebounded in mid-February, with good
returns for spot tonnage in the Atlantic, notably on routes
from South America and the US Gulf. In the Pacific, mineral
shipments from Indonesia to China and India continued to

Foo
d O
utl
oo
k -
Jun
e 2
01
3Fo
od
Ouu
ttlloo
ookk
- Ju
ne
20
133
1281
Ocean freight indices May 2012 - mid-May 2013
provide support. In April/early May Atlantic rates slipped
amid sluggish demand, with South America remaining one
of the major loading areas. Over the October/mid-May
period, the Baltic Handysize Index (BHSI) advanced by 19
percent, while the Baltic Supramax Index (BSI) gained 4
percent.
Capesize rates fell sharply in December 2012 due to an
oversupply of tonnage and a weak demand for minerals.
The market remained weak during the following months,
with the Baltic Capesize Index decreasing by nearly 20
percent since the beginning of October 2012.
400
600
800
1000
1200
MAMFJDNOSAJJM
2012 2013
Baltic dry index
Average ofgrain-carrying
indices
FOOD IMPORT BILLS
Global food import bills expected to stabilize in 2013
At USD 1.09 trillion, world expenditures on imported
foodstuffs in 2013 are tentatively forecast to remain close
to last year’s level, but 13 percent below the record of
2011.
The stability of the global import expenditure masks
considerable movements across individual product bills.
Freight costs, which are not expected to vary significantly
from 2012 levels, also contribute to stability. Of the
commodities foreseen to undergo the largest changes,
products in the animal protein category, including meat,
dairy and fish, could rise together by as much as 8 percent
to around USD 354 billion. The expected increase in these
bills is based on much larger volumes of imports as well as
higher world quotations, especially for dairy products and
fish. By contrast, lower international prices anticipated
for sugar and vegetable oils could result in import bills
falling by 18 percent and 6 percent, respectively, for
these products. Similarly, falling prices of beverages
are expected to result in a decline of 9 percent in total
expenditures on coffee, tea and cocoa. As for cereals,
reduced import volumes of rice and wheat could bring
cereal bills down by 2 percent, notwithstanding firm
international quotations.
The tendency for global import bills to be steady
in 2013 extends to many of the most economically
vulnerable nations, such as those in the groups of Least
Developed Countries (LDCs), Low Income Food Deficit
Countries (LIFDCs) and those geographically situated in
sub-Saharan Africa. Prospects for abundant domestic
crops in these countries in 2013, particularly for staples,
are expected to limit their need to rely on foreign supplies.
However, with much lower international prices for key
export primary commodities, such as sugar and tropical
beverages, the terms-of-trade in food and agriculture for
commodity-dependent countries may also deteriorate.
Forecast changes in global food import bills by type 2013 over 2012 (%)
-20 -10 0 10 20 30Percent
Dairy
Meat
Wheat
Rice
Vegetablesand Fruits
Vegetable Oilsand Animal Fats
Oilseeds
Fish
Sugar
Coarse Grains

Ma
rke
t ind
icato
rsM
ark
ett iinn
ddiiccaa
ttoors
12929
World Developed Developing LDC LIFDC Sub-Saharan Africa
2012 2013 2012 2013 2012 2013 2012 2013 2012 2013 2012 2013
TOTAL FOOD (of which) 1 091.7 1 094.0 675.7 677.7 416.0 416.3 29.1 28.6 193.3 193.9 36.9 37.5
Vegetable and fruits 190.6 191.8 144.7 145.6 45.8 46.1 2.6 2.6 17.8 17.9 2.7 2.7
Cereals 164.4 163.3 76.9 73.2 87.4 90.1 9.4 9.7 35.9 38.4 12.7 13.5
Meat 118.8 128.7 89.3 92.1 29.5 36.6 1.8 1.8 6.9 10.3 2.4 2.6
Fish 112.5 121.8 85.5 92.5 27.0 29.3 0.6 0.6 7.9 8.5 3.1 3.4
Dairy 45.8 56.2 29.6 36.3 16.2 19.9 0.9 1.0 4.4 5.3 1.3 1.6
Veg. oils and animal fats 99.1 92.8 44.0 41.2 55.0 51.5 5.8 5.3 33.6 32.7 4.7 4.2
Oilseeds 77.3 76.2 25.5 25.3 51.8 50.9 0.6 0.4 43.8 43.4 0.3 0.3
Sugar 47.0 38.7 22.5 18.5 24.5 20.3 3.2 2.8 12.7 10.5 3.3 2.9
Forecast import bills of total food and major foodstuffs (USD billion)
FAO PRICE INDICES
FAO Global Food Consumption Price Index remain stable1
The FAO Global Food Consumption Price Index tracks
changes in the cost of the global food basket as depicted
by the latest FAO world food balance sheet (see http://
faostat.fao.org/).
From the end of last year through May 2013, the
index has registered little movement, in contrast to the
volatility of earlier months. This pattern reflects relatively
stable prices of wheat and rice, as cereals carry a much
higher weight in total consumption than in trade (50
percent versus 18 percent), which also explain the
index’s departure from the FAO Food Price Index.
1 The FAO Global Food Consumption Price Index is published twice a year in Food Outlook.
The FAO global food consumption and food price indices
(April 2011 to April 2013)
150
170
190
210
230
250
2013201220112010
2002-2004=100
FAO global foodconsumption price index
FAO foodprice index

Foo
d O
utl
oo
k -
Jun
e 2
01
3Fo
od
Ouu
ttlloo
ookk
- Ju
ne
20
133
1301
The FAO Food Price Index nearly unchanged in May at 215 points2, 3
The FAO Food Price Index averaged 215.2 points in
May 2013, very close to its April value of 215.8 points
but 10 points (5 percent) higher than in May last year. At
that level, the index is nearly 10 percent below the peak
reached in February 2011. The small decline in May was
the result of falling dairy and sugar prices, which more than
offset an increase in cereals. Oils and meat prices remained
unchanged.
The FAO Cereal Price Index averaged 238.9 points in
May, up 4 points (1.9 percent) from April and nearly 17
points (7.8 percent) above May last year. Last month’s
increase was mostly associated with a strong rebound in
maize prices, mostly a reaction to tightening export supplies
and planting delays in the United States. By contrast, wheat
and rice quotations were largely unchanged from the
previous month.
The FAO Oils/Fats Price Index averaged 199.0 points in
May, unchanged from April. While palm oil prices gained
strength following a drop in global inventories from their
recent record-high levels, soy oil values eased further
reflecting higher than anticipated export availabilities in
Argentina and the encouraging outlook for the United
States’ 2013/14 soybean crop.
The FAO Dairy Price Index averaged 249.8 points in
May, a fall of 9 points (3.5 percent) from the exceptionally
high level recorded in April. Amongst the products that
make up the index, skimmed milk powder experienced
the sharpest fall (-12.2 percent), followed by butter (-6.8
percent) and whole milk powder (-6.2 percent), while the
average price of cheddar cheese rose slightly. Supplies
of milk products for trade are still constrained by weather
related factors affecting milk production in most of the
major exporting countries.
The FAO Meat Price Index averaged 179.3 points in
May – about the same as in April. The index has remained
within the narrow band of 177 – 179 points since October
2012. For the different categories of meat which compose
the index, poultry prices continued to edge higher, reaching
an all-time high. Prices were also up for ovine meat, but
largely unchanged for the other meat categories.
The FAO Sugar Price Index averaged 250.1 points in
May, down 2.6 points (1 percent) from April. Sugar prices
continued to soften in May, driven by favourable harvesting
conditions in Brazil, the world’s largest producers and
exporter, which boosted cane harvest. More generally, the
price slide reflects the prospect of more abundant global
supplies, combined with weaker import demand.
2 The FAO food price indices are updated on a monthly basis and are available on: http://www.fao.org/worldfoodsituation
3 All changes referred to in this section, in absolute or percentage terms, are calculated based on unrounded figures.
130
160
190
220
250
2002-2004=100
2011
2010
2009
2013
2012
FAO Food Price Index
DNOSAJJMAMFJ150
200
250
300
350
2012 2013
2002-2004=100
Dairy
Oils & Fats Cereals
Sugar
Meat
FAO Food Commodity Price Indices
MAMFJDNOSAJJM

Ma
rke
t ind
icato
rsM
ark
ett iinn
ddiiccaa
ttoors
13131
Food Price Index1 Meat2 Dairy3 Cereals4 Oils and Fats5 Sugar6
2000 90.4 95.8 95.4 85.2 67.8 116.1
2001 93.4 96.5 107.1 86.5 67.6 122.6
2002 89.9 89.5 82.2 94.4 87.0 97.8
2003 97.7 96.8 95.1 98.1 100.8 100.6
2004 112.4 113.7 122.6 107.5 112.2 101.7
2005 117.3 120.1 135.4 103.5 103.6 140.3
2006 126.7 118.5 128.0 121.7 112.5 209.6
2007 158.7 125.1 212.4 166.9 170.0 143.0
2008 199.8 153.2 219.6 237.8 227.2 181.6
2009 156.9 132.9 141.6 173.7 150.9 257.3
2010 185.3 152.2 200.4 182.6 194.2 302.0
2011 227.6 176.6 220.5 246.9 252.3 368.9
2012 211.8 175.1 188.6 241.3 225.3 305.7
2012 May 204.8 175.0 176.1 221.7 233.8 294.6
June 200.5 169.5 173.4 222.4 220.7 290.4
July 213.0 166.8 172.9 260.5 226.1 324.3
August 212.6 170.5 175.6 260.3 226.0 296.2
September 215.9 174.9 187.7 263.0 224.7 283.7
October 214.6 177.2 194.0 259.8 206.4 288.2
November 212.1 177.8 195.0 256.0 200.4 274.5
December 210.9 179.5 196.8 250.7 196.5 274.0
2013 January 210.5 177.5 198.2 248.0 205.2 267.8
February 210.9 179.2 203.0 245.9 206.1 259.2
March 213.2 177.6 225.3 244.7 201.1 262.0
April 215.8 179.5 258.8 234.6 199.0 252.6
May 215.2 179.3 249.8 238.9 199.0 250.1
1 Food Price Index: Consists of the average of five commodity group price indices mentioned above weighted with the average export shares of each of
the groups for 2002-2004: in total 55 commodity quotations considered by FAO Commodity Specialists as representing the international prices of the food
commodities noted are included in the overall index.
2 Meat Price Index: Computed from average prices of four types of meat, weighted by world average export trade shares for 2002-2004. Quotations include
two poultry products, three bovine meat products, three pig meat products, and one ovine meat product. Where more than one quotation exists for a given meat
type, they are weighted by assumed fixed trade shares. Prices for the two most recent months may be estimates and subject to revision.
3 Dairy Price Index: Consists of butter, SMP, WMP, cheese, casein price quotations; the average is weighted by world average export trade shares for 2002-2004.
4 Cereals Price Index: This index is compiled using the grains and rice price indices weighted by their average trade share for 2002-2004. The grains Price
Index consists of International Grains Council (IGC) wheat price index, itself average of nine different wheat price quotations, and one maize export quotation;
after expressing the maize price into its index form and converting the base of the IGC index to 2002-2004. The Rice Price Index consists of three components
containing average prices of 16 rice quotations: the components are Indica, Japonica and Aromatic rice varieties and the weights for combining the three
components are assumed (fixed) trade shares of the three varieties.
5 Oil and Fat Price Index: Consists of an average of 11 different oils (including animal and fish oils) weighted with average export value shares of each oil product
for 2002-2004.
6 Sugar Price Index: Index form of the International Sugar Agreement prices with 2002-2004 as base.
FAO food price index
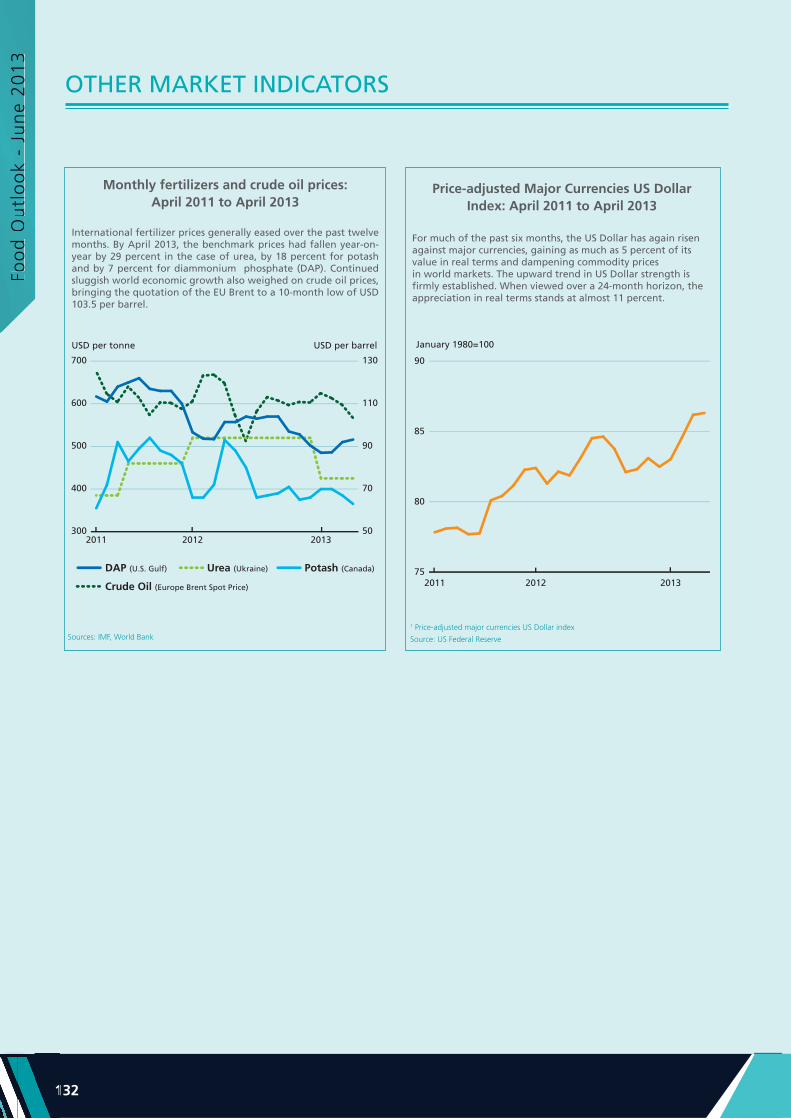
Foo
d O
utl
oo
k -
Jun
e 2
01
3Fo
od
Ouu
ttlloo
ookk
- Ju
ne
20
133
1321
OTHER MARKET INDICATORS
Monthly fertilizers and crude oil prices: April 2011 to April 2013
International fertilizer prices generally eased over the past twelve months. By April 2013, the benchmark prices had fallen year-on-year by 29 percent in the case of urea, by 18 percent for potash and by 7 percent for diammonium phosphate (DAP). Continued sluggish world economic growth also weighed on crude oil prices, bringing the quotation of the EU Brent to a 10-month low of USD 103.5 per barrel.
Price-adjusted Major Currencies US Dollar Index: April 2011 to April 2013
For much of the past six months, the US Dollar has again risenagainst major currencies, gaining as much as 5 percent of itsvalue in real terms and dampening commodity pricesin world markets. The upward trend in US Dollar strength isfirmly established. When viewed over a 24-month horizon, theappreciation in real terms stands at almost 11 percent.
1 Price-adjusted major currencies US Dollar index
Source: US Federal ReserveSources: IMF, World Bank
50
70
90
110
130
300
400
500
600
700
201320122011
USD per tonne USD per barrel
DAP (U.S. Gulf) Urea (Ukraine)
Crude Oil (Europe Brent Spot Price)
Potash (Canada) 75
80
85
90
201320122011
January 1980=100

AGRICULTURAL MARKETINFORMATION SYSTEM
AMIS
http://www.amis-outlook.org/amis-monitoring/indicators

Food Outlook is published by the Trade and Market Division of FAO under Global Information and Early Warning System (GIEWS). It is a
biannual publication focusing on developments affecting global food and feed markets. Each report provides comprehensive assessments and short term forecasts for production, utilization, trade, stocks and prices on a commodity by commodity basis and includes feature articles on topical issues. Food Outlook maintains a close synergy with another major GIEWS publication, Crop Prospects and Food Situation, especially with regard to the coverage of cereals. Food outlook is available in English. The summary section is also available in Arabic, Chinese, French, Spanish and Russian.
Food Outlook and other GIEWS reports are available on the internet as part of the FAO world wide web (http://www.fao.org/) at the following URL address: http://www.fao.org/giews/. Other relevant studies on markets and global food situation can be found at:http://www.fao.org/worldfoodsituation.
This report is based on information available up to late May 2013. The next Food Outlook report will be published in November 2013.
For enquiries or further information contact:
Abdolreza Abbassian
Trade and Markets Division
Food and Agriculture Organization of the United Nations
Via delle Terme di Caracalla
00153 Rome - Italy
Telephone: 0039-06-5705-3264
Facsimile: 0039-06-5705-4495
E-mail: [email protected] or [email protected]