Food & Function · View Journal. 2. Materials and ... skimmed milk powder, emulsi-fier: lecithin,...
11
Food & Function PAPER Cite this: DOI: 10.1039/c5fo01137j Received 17th September 2015, Accepted 16th October 2015 DOI: 10.1039/c5fo01137j www.rsc.org/foodfunction Glycemic index and microstructure analysis of a newly developed fiber enriched cookie† Jan Philipp Schuchardt,* a Jasmin Wonik, a Ute Bindrich, b Michaela Heinemann, a Heike Kohrs, a Inga Schneider, a Katharina Möller a and Andreas Hahn a A diet with a high glycemic index (GI) is associated with an elevated risk for obesity or type 2 diabetes. We investigated the GI of a newly-developed fiber enriched cookie and characterized the microstructure of ingredients used. In a study with 26 non-diabetic healthy volunteers it was shown that the fiber enriched cookie has a GI of 58.9 in relation to white bread as reference. Using a conversion factor of 1.4, the GI of the fiber enriched cookie in relation to a glucose-solution is 42.0 and can be classified as a low-GI food. Postprandial insulin concentration was significantly lower after consumption of fiber enriched cookies compared to white bread. Glucose release after in vitro digestion was significantly lower from fiber enriched cookies compared to other cookies tested. In addition to its high percentage of fiber, the cookies’ low GI can be attributed to the limited gelatinization potential of the starch granules found in the ingredients used. Using confocal laser scanning microscopy it is shown that starch granule surface area of whole grain barley flour, spelt flour and oat flakes bears cluster-shaped protein–NSPS complexes that preferentially absorb water in conditions of water shortage and thereby prevent starch gelatinization. 1. Introduction The glycemic index (GI) indicates the extent to which a carbo- hydrate containing food affects postprandial blood glucose levels compared with a reference product (glucose or white bread) containing the same amount of available carbohydrate. Foods with a high GI cause a high increase in postprandial blood glucose concentrations, while the increase is less pro- nounced for foods with a low GI. A high postprandial blood glucose response, in turn, triggers a disproportionately high insulin response and is associated with the development of hyperinsulinemia and insulin resistance. A diet of foods that has a high GI is associated with obesity, 1 type 2 diabetes melli- tus (DM2), 2 coronary heart disease 3 and colon cancer. 4 A reduction in glycemic load is associated with reduced body weight. 5 Therefore, the concept of eating foods with a low GI in the dietary therapy of DM2 and obesity is included in various international guidelines. 6,7 For starch-containing foods like baked goods, the GI largely depends on the starch granules’ accessibility to starch-splitting enzymes. Native starch exists in the form of compact starch granules that are made up of amylose and amylopectin. Starch can change its structure and gelatinize when water is present, due to thermal effects or because of shear forces. Native starch granules are only vulnerable to enzymes in the surface layers, while gelatinization changes the structure, enlarges the surface area and thereby increases the starch’s vulnerability to enzymes. 8,9 This increases the starch’s digestibility and thus also the GI. According to own findings (un-published so far), in addition to protein adsorption, non-starch polysaccharides (NSPS) such as glucans and pentosans also bind to starch granules’ surface layers; these lower the starch granules’ vul- nerability to enzymes. Soluble fibers like NSPS thus play a sig- nificant role in reducing GI. They not only reduce starch gelatinization in the food itself but also, because of their gel- forming characteristics, slow down glucose absorption in the small intestine. 10,11 The present study determined the GI of a newly developed fiber enriched cookie and described the microstructural and techno-functional characteristics of the ingredients used. The cookie’s glucose and insulin responses were investigated in a nutritional physiological study with non-diabetic volunteers. Additionally, in vitro digestion of the fiber enriched cookies was carried out to compare the glucose release with short bread and digestive cookies. The gelatinization characteristics of the starch-containing raw materials and the microstructure of the starches they contain were analytically and microscopi- cally investigated. † Electronic supplementary information (ESI) available. See DOI: 10.1039/ c5fo01137j a Institute of Food Science and Human Nutrition, Leibniz University of Hannover, Germany. E-mail: [email protected]; Fax: +49 (0)511 762 5729; Tel: +49 (0)511 762 2987 b Center of Food Physics, German Institute of Food Technologies, Quakenbrück, Germany This journal is © The Royal Society of Chemistry 2015 Food Funct. Open Access Article. Published on 21 October 2015. Downloaded on 12/01/2016 10:24:39. This article is licensed under a Creative Commons Attribution 3.0 Unported Licence. View Article Online View Journal
Transcript of Food & Function · View Journal. 2. Materials and ... skimmed milk powder, emulsi-fier: lecithin,...
Food &Function
PAPER
Cite this: DOI: 10.1039/c5fo01137j
Received 17th September 2015,Accepted 16th October 2015
DOI: 10.1039/c5fo01137j
www.rsc.org/foodfunction
Glycemic index and microstructure analysis of anewly developed fiber enriched cookie†
Jan Philipp Schuchardt,*a Jasmin Wonik,a Ute Bindrich,b Michaela Heinemann,a
Heike Kohrs,a Inga Schneider,a Katharina Möllera and Andreas Hahna
A diet with a high glycemic index (GI) is associated with an elevated risk for obesity or type 2 diabetes. We
investigated the GI of a newly-developed fiber enriched cookie and characterized the microstructure of
ingredients used. In a study with 26 non-diabetic healthy volunteers it was shown that the fiber enriched
cookie has a GI of 58.9 in relation to white bread as reference. Using a conversion factor of 1.4, the GI of
the fiber enriched cookie in relation to a glucose-solution is 42.0 and can be classified as a low-GI food.
Postprandial insulin concentration was significantly lower after consumption of fiber enriched cookies
compared to white bread. Glucose release after in vitro digestion was significantly lower from fiber
enriched cookies compared to other cookies tested. In addition to its high percentage of fiber, the
cookies’ low GI can be attributed to the limited gelatinization potential of the starch granules found in the
ingredients used. Using confocal laser scanning microscopy it is shown that starch granule surface area of
whole grain barley flour, spelt flour and oat flakes bears cluster-shaped protein–NSPS complexes that
preferentially absorb water in conditions of water shortage and thereby prevent starch gelatinization.
1. Introduction
The glycemic index (GI) indicates the extent to which a carbo-hydrate containing food affects postprandial blood glucoselevels compared with a reference product (glucose or whitebread) containing the same amount of available carbohydrate.Foods with a high GI cause a high increase in postprandialblood glucose concentrations, while the increase is less pro-nounced for foods with a low GI. A high postprandial bloodglucose response, in turn, triggers a disproportionately highinsulin response and is associated with the development ofhyperinsulinemia and insulin resistance. A diet of foods thathas a high GI is associated with obesity,1 type 2 diabetes melli-tus (DM2),2 coronary heart disease3 and colon cancer.4 Areduction in glycemic load is associated with reduced bodyweight.5 Therefore, the concept of eating foods with a low GIin the dietary therapy of DM2 and obesity is included invarious international guidelines.6,7
For starch-containing foods like baked goods, the GI largelydepends on the starch granules’ accessibility to starch-splitting
enzymes. Native starch exists in the form of compact starchgranules that are made up of amylose and amylopectin. Starchcan change its structure and gelatinize when water is present,due to thermal effects or because of shear forces. Native starchgranules are only vulnerable to enzymes in the surface layers,while gelatinization changes the structure, enlarges the surfacearea and thereby increases the starch’s vulnerability toenzymes.8,9 This increases the starch’s digestibility and thusalso the GI. According to own findings (un-published so far),in addition to protein adsorption, non-starch polysaccharides(NSPS) such as glucans and pentosans also bind to starchgranules’ surface layers; these lower the starch granules’ vul-nerability to enzymes. Soluble fibers like NSPS thus play a sig-nificant role in reducing GI. They not only reduce starchgelatinization in the food itself but also, because of their gel-forming characteristics, slow down glucose absorption in thesmall intestine.10,11
The present study determined the GI of a newly developedfiber enriched cookie and described the microstructural andtechno-functional characteristics of the ingredients used. Thecookie’s glucose and insulin responses were investigated in anutritional physiological study with non-diabetic volunteers.Additionally, in vitro digestion of the fiber enriched cookieswas carried out to compare the glucose release with shortbread and digestive cookies. The gelatinization characteristicsof the starch-containing raw materials and the microstructureof the starches they contain were analytically and microscopi-cally investigated.
†Electronic supplementary information (ESI) available. See DOI: 10.1039/c5fo01137j
aInstitute of Food Science and Human Nutrition, Leibniz University of Hannover,
Germany. E-mail: [email protected]; Fax: +49 (0)511 762 5729;
Tel: +49 (0)511 762 2987bCenter of Food Physics, German Institute of Food Technologies, Quakenbrück,
Germany
This journal is © The Royal Society of Chemistry 2015 Food Funct.
Ope
n A
cces
s A
rtic
le. P
ublis
hed
on 2
1 O
ctob
er 2
015.
Dow
nloa
ded
on 1
2/01
/201
6 10
:24:
39.
Thi
s ar
ticle
is li
cens
ed u
nder
a C
reat
ive
Com
mon
s A
ttrib
utio
n 3.
0 U
npor
ted
Lic
ence
.
View Article OnlineView Journal
2. Materials and methods
To determine the blood glucose and insulin effects of the fiberenriched cookies, a nutritional physiological study was con-ducted at the Institute of Food Sciences and Human Nutritionat Leibniz University of Hannover. The tests on starch gelatini-zation characteristics and microstructure were conducted atthe German Institute of Food Technologies in Quakenbrück,Germany.
2.1 Test products
The fiber enriched cookie investigated in the study was develo-ped and manufactured by Bahlsen GmbH & Co. KG (Hannover,Germany). The ingredients were (in descending order): Flour(whole grain wheat flour, wheat flour, spelt flour), sucrose, oatflakes, sunflower oil, hazelnuts, oligo fructose, cocoa, bakingagent: ammonium and sodium carbonate, oat fiber, wholegrain barley flour, salt, flavour, skimmed milk powder, emulsi-fier: lecithin, acidifier: citric acid, cocoa butter. Sensory ana-lysis according to the sequential monadic approach showedthat the fiber enriched cookies reached the action standard foroverall liking and therefore shows a significant acceptancelevel (data not shown). For compliance reasons, GI was notdetermined by means of the standard method of the Food andAgriculture Organization of the United Nations (FAO) using aglucose solution.12 Instead, subjects were given conventionalwhite bread as a reference product to determine the GI. Thenutrient content of the test and reference products used weretested in the LUFA ITL GmbH and biotask AG analytic labora-tories. Total glucan and pentosan analysis in the test and refer-ence products as well as the polysaccharide componentanalysis in starchy raw materials were carried out in theGerman Institute of Food Technologies.
2.2 Degree of gelatinization of test products
Since starch gelatinization is an endothermic process underthe conditions of available water and atmospheric pressure,heat supply is necessary to induce this reaction. Therefore, thedegree of gelatinization of the test and reference products, aswell as a butter cookie (provided by Bahlsen GmbH & Co KG)for comparison, were determined using differential scanningcalorimetry (DSC). The foods to be tested were heated with anexcess of water (starch/water ratio: 1/4 w/w) in the DSC measur-ing cell and the integral transition enthalpy. Because proteinsin baked goods are already irreversibly denatured and othercomponents (e.g., lipids) do not contribute to the endothermicreaction in the temperature range of starch gelatinization, thetransition enthalpy is closely related to the starch’s gelatiniza-tion enthalpy. The degree of gelatinization was calculatedrelated to analytically determined total starch content of theproducts.
2.3 Gelatinization potential of separated starch from starch-containing raw materials
To determine the gelatinization potential of starch from softwheat dunst and whole grain wheat flour, the native starch was
first separated out through elutriation. For the other starch-containing raw materials (whole grain barley flour, spelt flour,oat flakes), separation was performed by suspending theground products in water, followed by separation usingcentrifugation, as the starch granules have the greatest densitycompared with the other components. The starch obtained inthis process was subsequently dried non-thermally usingethanol. For measurement of the enthalpy, the native or par-tially gelatinized starch was weighed into standard DSCaluminium pans and heated under following conditions:sample mass about 50 mg (10 mg starch + 40 mg water); start-ing temperature 10 °C; final temperature 98 °C; ramp rate2 K min−1. The resulting heat flow from the endothermic reac-tion was measured and the enthalpy was calculated as surfacearea between heat flow function and baseline (in reference tothe initial starch weight). To measure the residual enthalpyafter partial gelatinization of the starch from the raw materials,gelatinization was carried out with only 40% water (based onthe dry mass (DM) starch), i.e., under conditions of waterdeprivation. The gelatinization state of these samples was thentested using light microscopy using potassium iodide solution(Lugol’s solution) for labeling of starch. In a second step, theresidual enthalpy was tested using DSC under the condition ofwater excess (see above).
2.4 Determination of protein and starch in starch-containingraw materials
The raw protein content was determined via the nitrogen contentby the Kjeldahl method using the official ASU 18.00-5method according to § 64 of the German food and feed code(LFGB). The starch content was determined polarimetricallyusing the official ASU F13.00 method according to § 64 LFGB.
2.5 Determination of glucan and pentosan attachments toseparated starch granules
The analysis of the β-Glucan content was performed photo-metrically according to McCleary and Codd (1991)13 with thecommercially available Enzyme Kit K-BGLU 07/11 from Mega-zyme (Wicklow, Ireland). The determination of pentosancontent was performed with the phloroglucinol methodaccording to Douglas 1981 based on the optimized version byKiszonas et al. (2012).14
2.6 Topography and adhesiveness of the surface area ofseparated starch granules
The topography and adhesiveness of the surface area of thestarch granules was characterized using atomic forcemicroscopy (AFM). Therefore, starch granules were glued ontoa mica disc using two-step-preparation method according toNeuner (G3305A, Plano GmbH, Wetzlar, Germany). AFMexperiments were carried out using a MFP-3D SA (AsylumResearch, Santa Barbara, California, U.S.A.) with standardsilicon cantilevers of a nominal spring constant of 2 N m−1
(AC 240, Olympus Corporation, Tokyo, Japan). Topographicalimaging was performed in intermittent contact mode with acantilever resonant frequency around 75 kHz. Adhesion forces
Paper Food & Function
Food Funct. This journal is © The Royal Society of Chemistry 2015
Ope
n A
cces
s A
rtic
le. P
ublis
hed
on 2
1 O
ctob
er 2
015.
Dow
nloa
ded
on 1
2/01
/201
6 10
:24:
39.
Thi
s ar
ticle
is li
cens
ed u
nder
a C
reat
ive
Com
mon
s A
ttrib
utio
n 3.
0 U
npor
ted
Lic
ence
.View Article Online
were calculated after performing 40 × 40 force-versus-distance-curves per force map of a size of 2 × 2 µm in contact mode. Foreach tip, exact cantilever’s spring constant was determined viathermal noise method.15 Contact trigger point was 1 V; scanvelocity was 2 µm s−1. Two force maps per granule at differentsurface areas were examined, maps were captured as dupli-cates. Per sample, at least 8 granules were analyzed. Forcemaps were converted into a histogram in which quantity ofoccurrence of a certain adhesion force per map in % wasopposed to each other. Images and maps were measured andanalyzed using IGOR Pro Software (WaveMetrics, Portland,USA) and Microsoft Excel 2010.
2.7 Detecting protein–NSPS complexes on separated starchgranules
Confocal laser scanning microscopy (CLSM) Nikon ECLIIPSE E600 (Nikon, Düsseldorf, Germany) with rhodamine R (reactingwith amine groups of molecules) as fluorescent dye (absorp-tion 570 nm; emission 590 nm, effecting red color in themicrographs) was performed in order to visualize proteinsattached to the starch granules. Complexes of proteins andNSPS can be identified as regions of highly intensive coloring.This is caused by strong interactions between proteins andswollen NSPS molecules resulting in a compact structure.Separated starch granules were suspended in glycerine andmixed with the fluorescing dye. Adsorption of the dye atprotein molecules is diffusion controlled and takes about2 hours. Laser beam is focused on an appropriate imageplane. CLSM micrographs are saved electronically.
2.8 In vitro digestion assays
For each sample 200 g cookies (short bread, digestive cookies[commercial products] and fiber enriched cookies) and whitebread were finely crushed in a kitchen shredder (Moulinette,Krups, Offenbach/Main, Germany) and mixed. 100 mg samplewas suspended in 25 ml phosphate buffer (ph 6.9) and homo-genized with an Ultra-turrax® (IKA®, Staufen, Germany) for 30s. Subsequently, 10U invertase (Sigma-Aldrich, Seelze,Germany), 25U pancreatin (Merck, Darmstadt, Germany) and40U amyloglucosidase (Sigma-Aldrich, Seelze, Germany) wereadded. Samples were gently shacken and put in a water bath at37 °C. At each time point after 0, 15, 30, 60, 120, and 180 minprior incubation 1 ml was taken from the samples and trans-ferred into a preheated tube. To stop enzymatic reactionsamples were incubated for 5 min at 99 °C and 750 rpm in athermomixer (Eppendorf, Hamburg, Germany). Samples werestored in a fridge until spectrometric measurement. Directlybefore spectrometric measurement 4 ml de-ionized water wasadded to each sample and centrifuged for 5 min at 2000 rpm.Glucose concentrations were measured using a D-Glucose test-kit (R-Biopharm, Darmstadt, Germany) according to the manu-factures protocol and using a spectral photometer (Specord205, Analytik Jena, Jena, Germany). Experiments were repeatedeightfold.
2.9 Study design of the nutritional physiological study
The nutritional physiological study was designed in accord-ance with the Helsinki Declaration and conducted in accord-ance with Good Clinical Practice (GCP) principles and receiveda positive ethics vote. The study consisted of a screening andan intervention phase and lasted four weeks. During the inter-vention, four tests took place at intervals of 6 to 8 days. On testdays, fasting blood samples were taken to determine the zerovalue (glucose and insulin); participants’ body weight andheight were also measured. Participants subsequently receivedthe test product to be investigated and the reference product.Each portion of the test product (84.5 g, 402 kcal) or the refer-ence product (112 g, 272 kcal) was equivalent to a 50 g amountof available carbohydrates. The participants were instructed tothoroughly chew and consume the test and reference alongwith 300 ml water within a maximum of five minutes. The two-armed study was conducted in a cross-over design, with repeatdetermination of the test and reference product, in which eachsubject received both the cookies and the reference producttwo times. During the intervention phase, the subjects weregiven 250 ml of water after 60 and 120 minutes. To determineblood glucose and insulin concentrations, blood was drawnseven times (basal, 15, 30, 45, 60, 90 and 120 min after intakeof the test or reference products). The timing of the sub-sequent blood samples was determined on the basis of thefirst bite taken during consumption of the test meals. Theblood samples were prepared and analyzed by the HannoverMedical Care Center of the LADR network. The blood glucoseconcentration was measured in 2.4 ml of venous sodium fluor-ide whole blood. The insulin concentration was measured in2.7 ml of serum. After each sampling, the blood samples wereimmediately cooled to 4–6 °C in order to prevent breakdown ofthe blood glucose in the monovette. Any adverse events wererecorded in order to monitor the tolerability of the cookies.
2.10 Subjects
Healthy, non-smoking, non-diabetic men and women n = 26(male: 14, female: 12) were included in the nutritional physio-logical study. Subjects were recruited via notices posted atLeibniz University of Hannover. The inclusion criteria forparticipation were a body mass index (BMI) between 18 and28 kg m−2 and an age between 18 and 50 years. Exclusioncriteria included severe chronic disease (e.g. tumors, manifestcoronary heart disease, DM1, DM2, severe kidney or liver con-ditions, endocrine and immunological conditions), gastro-intestinal disorders (e.g. ulcers, chronic inflammatory boweldisease, celiac disease, pancreatitis) as well as status postgastrointestinal tract surgery (e.g. gastrectomy, short bowelsyndrome, stomach reduction, gastric band, gastric balloon),lactose intolerance, pregnancy, competitive sports, lactationand alcohol or drug dependency. All subjects gave theirwritten consent to participate in the study. Subjects wererecommended not to donate blood for four weeks prior to thestart of the intervention in order to avoid potential compli-cations. In order to minimize fluctuations in fasting blood
Food & Function Paper
This journal is © The Royal Society of Chemistry 2015 Food Funct.
Ope
n A
cces
s A
rtic
le. P
ublis
hed
on 2
1 O
ctob
er 2
015.
Dow
nloa
ded
on 1
2/01
/201
6 10
:24:
39.
Thi
s ar
ticle
is li
cens
ed u
nder
a C
reat
ive
Com
mon
s A
ttrib
utio
n 3.
0 U
npor
ted
Lic
ence
.View Article Online
glucose and postprandial blood glucose response, the subjectswere instructed not to consume any alcohol for three daysprior to the study date, not to engage in a greater-than-usuallevel of physical activity and not to adhere to any weight-reduction diets. In addition, each subject was provided with astandardized pasta dish as a last meal on the evening prior toeach test day.
2.11 Data analysis and statistics
All data (age, height, weight, BMI, blood glucose, insulin) aregiven as mean value ± standard deviation. For blood glucoseand insulin, the incremental area under the curve (iAUC)values were calculated as per Brouns et al. 2005.16 Only thearea under the curve through the fasting concentration wastaken into account; the area below that was ignored. To calcu-late the iAUC, the raw data of the blood glucose and insulinconcentrations were used and were determined for eachsubject as well as for both test and reference products. To cal-culate glucose and insulin concentrations at the various timepoints, the raw data were zero-value corrected. To calculate theiAUCs for blood glucose and insulin, a period of time fromzero to two hours was taken into account. The GI of thecookies was then calculated from the iAUCs that were recordedfor blood glucose. For this a ratio was created using the meanvalue of all individual iAUCs of the cookies (cookie) iAUC) andthe reference iAUC. To calculate the iAUCs for insulin, a periodof time from zero to two hours was likewise taken intoaccount. As an additional parameter to compare the course ofthe blood glucose and insulin concentration, the cmax for thezero-value corrected values was calculated in each case. Stat-istical analysis was performed on the basis of the data’s distri-bution type (Kolmogorov–Smirnov adjustment test). In thecase of normal distribution, analysis was performed usingsingle-factor analysis of variance (ANOVA); in the case of abnor-mally distributed data, the Mann–Whitney U test was used.Statistical significance was determined to be p < 0.05 andmarked using an asterisk: *p < 0.05, **p < 0.005, ***p < 0.001.All statistical data analyses were performed with SPSS 19.0(SPSS Inc., Chicago, Illinois, US).
3. Results3.1 Composition of test and reference products and starch-containing raw materials
Table 1 shows the nutritional composition of the test andreference products. The total fiber content’s in the fiberenriched cookies (6.5 g per 100 g) and the digestive cookies(7.5 g per 100 g) were more than three times as high as inwhite bread. The amount of polysaccharide components in thestarch-containing raw materials of the fiber enriched cookiesis summarized in Table 2. The relatively high levels of glucans(3.91 g per 100 g DM) and pentosans (4.06 g per 100 g DM) –both of them NSPS – in whole grain barley flour as well as thehigh glucan content (4.35 g per 100 g DM) in oat flakes arenoteworthy here.
3.2 Gelatinization characteristics of test and referenceproducts and starch-containing raw materials
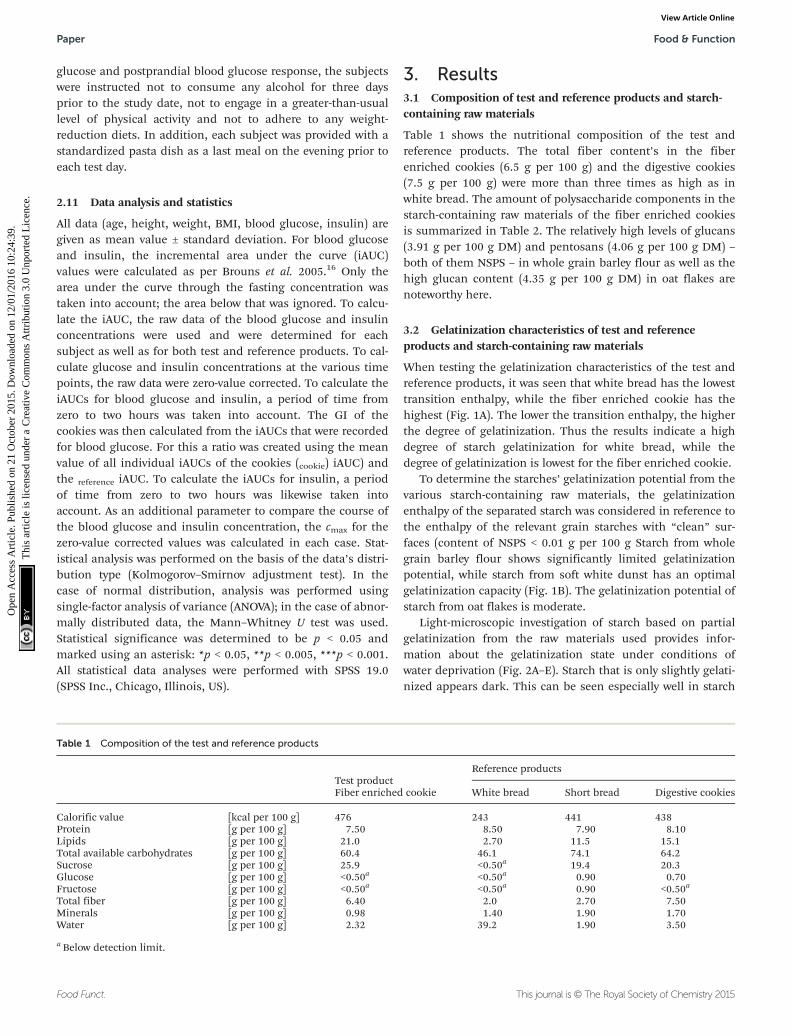
When testing the gelatinization characteristics of the test andreference products, it was seen that white bread has the lowesttransition enthalpy, while the fiber enriched cookie has thehighest (Fig. 1A). The lower the transition enthalpy, the higherthe degree of gelatinization. Thus the results indicate a highdegree of starch gelatinization for white bread, while thedegree of gelatinization is lowest for the fiber enriched cookie.
To determine the starches’ gelatinization potential from thevarious starch-containing raw materials, the gelatinizationenthalpy of the separated starch was considered in reference tothe enthalpy of the relevant grain starches with “clean” sur-faces (content of NSPS < 0.01 g per 100 g Starch from wholegrain barley flour shows significantly limited gelatinizationpotential, while starch from soft white dunst has an optimalgelatinization capacity (Fig. 1B). The gelatinization potential ofstarch from oat flakes is moderate.
Light-microscopic investigation of starch based on partialgelatinization from the raw materials used provides infor-mation about the gelatinization state under conditions ofwater deprivation (Fig. 2A–E). Starch that is only slightly gelati-nized appears dark. This can be seen especially well in starch
Table 1 Composition of the test and reference products
Test productReference products
Fiber enriched cookie White bread Short bread Digestive cookies
Calorific value [kcal per 100 g] 476 243 441 438Protein [g per 100 g] 7.50 8.50 7.90 8.10Lipids [g per 100 g] 21.0 2.70 11.5 15.1Total available carbohydrates [g per 100 g] 60.4 46.1 74.1 64.2Sucrose [g per 100 g] 25.9 <0.50a 19.4 20.3Glucose [g per 100 g] <0.50a <0.50a 0.90 0.70Fructose [g per 100 g] <0.50a <0.50a 0.90 <0.50a
Total fiber [g per 100 g] 6.40 2.0 2.70 7.50Minerals [g per 100 g] 0.98 1.40 1.90 1.70Water [g per 100 g] 2.32 39.2 1.90 3.50
a Below detection limit.
Paper Food & Function
Food Funct. This journal is © The Royal Society of Chemistry 2015
Ope
n A
cces
s A
rtic
le. P
ublis
hed
on 2
1 O
ctob
er 2
015.
Dow
nloa
ded
on 1
2/01
/201
6 10
:24:
39.
Thi
s ar
ticle
is li
cens
ed u
nder
a C
reat
ive
Com
mon
s A
ttrib
utio
n 3.
0 U
npor
ted
Lic
ence
.View Article Online
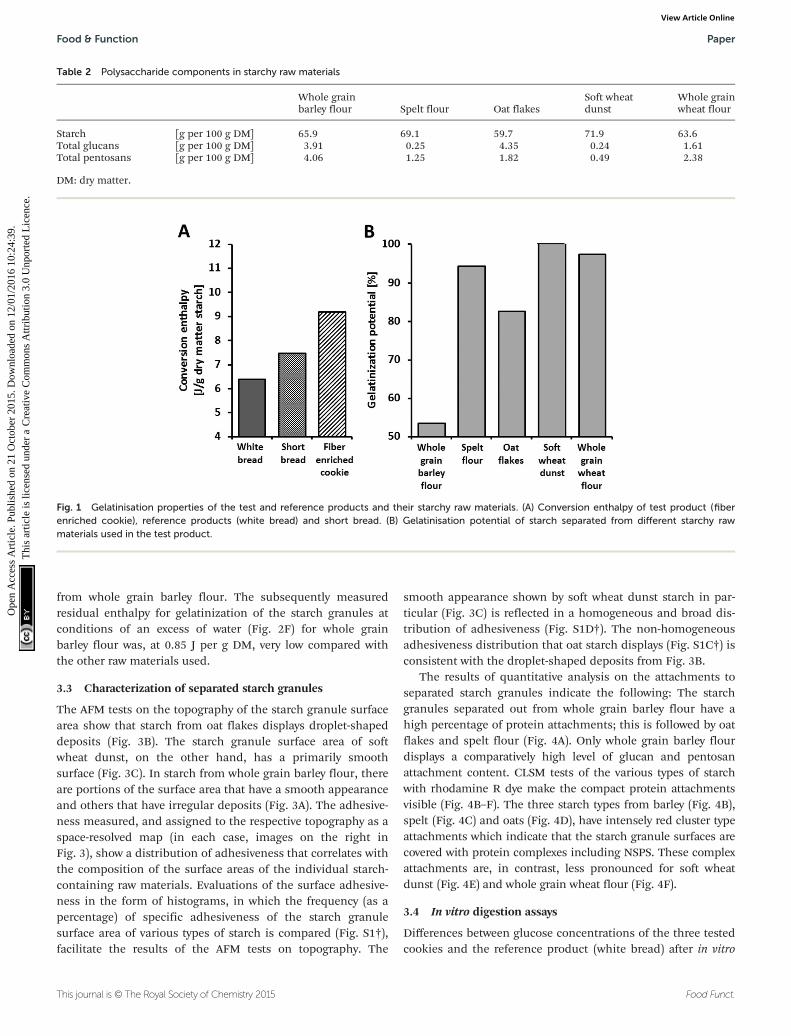
from whole grain barley flour. The subsequently measuredresidual enthalpy for gelatinization of the starch granules atconditions of an excess of water (Fig. 2F) for whole grainbarley flour was, at 0.85 J per g DM, very low compared withthe other raw materials used.
3.3 Characterization of separated starch granules
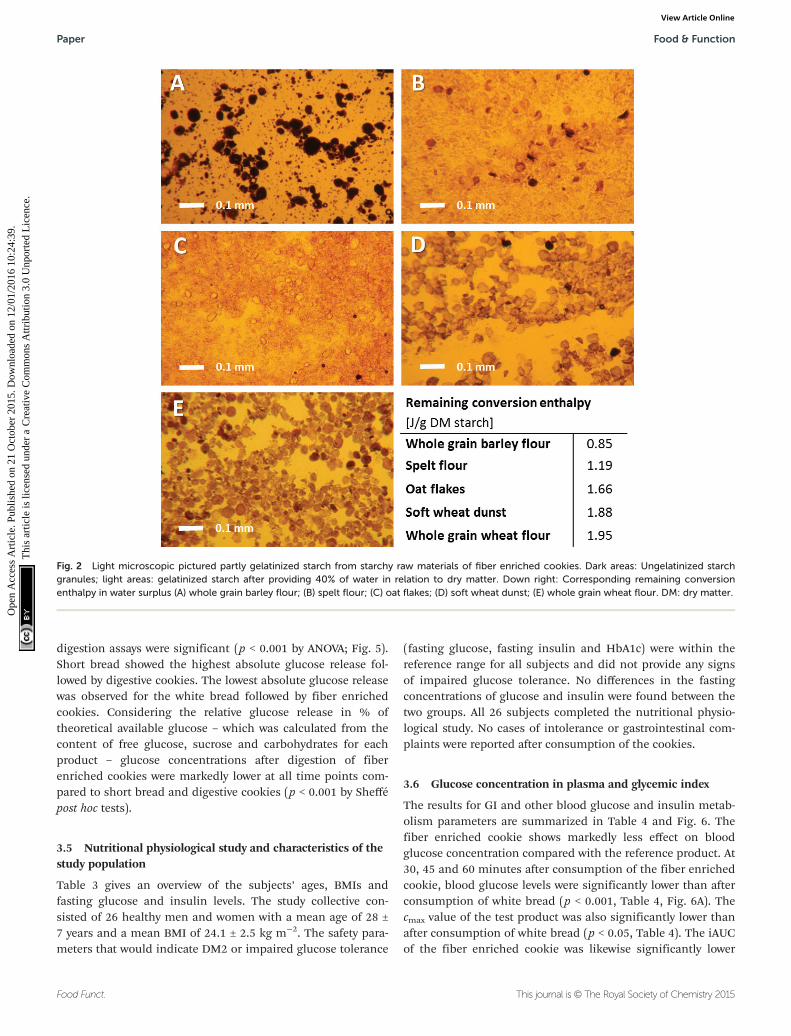
The AFM tests on the topography of the starch granule surfacearea show that starch from oat flakes displays droplet-shapeddeposits (Fig. 3B). The starch granule surface area of softwheat dunst, on the other hand, has a primarily smoothsurface (Fig. 3C). In starch from whole grain barley flour, thereare portions of the surface area that have a smooth appearanceand others that have irregular deposits (Fig. 3A). The adhesive-ness measured, and assigned to the respective topography as aspace-resolved map (in each case, images on the right inFig. 3), show a distribution of adhesiveness that correlates withthe composition of the surface areas of the individual starch-containing raw materials. Evaluations of the surface adhesive-ness in the form of histograms, in which the frequency (as apercentage) of specific adhesiveness of the starch granulesurface area of various types of starch is compared (Fig. S1†),facilitate the results of the AFM tests on topography. The
smooth appearance shown by soft wheat dunst starch in par-ticular (Fig. 3C) is reflected in a homogeneous and broad dis-tribution of adhesiveness (Fig. S1D†). The non-homogeneousadhesiveness distribution that oat starch displays (Fig. S1C†) isconsistent with the droplet-shaped deposits from Fig. 3B.
The results of quantitative analysis on the attachments toseparated starch granules indicate the following: The starchgranules separated out from whole grain barley flour have ahigh percentage of protein attachments; this is followed by oatflakes and spelt flour (Fig. 4A). Only whole grain barley flourdisplays a comparatively high level of glucan and pentosanattachment content. CLSM tests of the various types of starchwith rhodamine R dye make the compact protein attachmentsvisible (Fig. 4B–F). The three starch types from barley (Fig. 4B),spelt (Fig. 4C) and oats (Fig. 4D), have intensely red cluster typeattachments which indicate that the starch granule surfaces arecovered with protein complexes including NSPS. These complexattachments are, in contrast, less pronounced for soft wheatdunst (Fig. 4E) and whole grain wheat flour (Fig. 4F).
3.4 In vitro digestion assays
Differences between glucose concentrations of the three testedcookies and the reference product (white bread) after in vitro
Fig. 1 Gelatinisation properties of the test and reference products and their starchy raw materials. (A) Conversion enthalpy of test product (fiberenriched cookie), reference products (white bread) and short bread. (B) Gelatinisation potential of starch separated from different starchy rawmaterials used in the test product.
Table 2 Polysaccharide components in starchy raw materials
Whole grainbarley flour Spelt flour Oat flakes
Soft wheatdunst
Whole grainwheat flour
Starch [g per 100 g DM] 65.9 69.1 59.7 71.9 63.6Total glucans [g per 100 g DM] 3.91 0.25 4.35 0.24 1.61Total pentosans [g per 100 g DM] 4.06 1.25 1.82 0.49 2.38
DM: dry matter.
Food & Function Paper
This journal is © The Royal Society of Chemistry 2015 Food Funct.
Ope
n A
cces
s A
rtic
le. P
ublis
hed
on 2
1 O
ctob
er 2
015.
Dow
nloa
ded
on 1
2/01
/201
6 10
:24:
39.
Thi
s ar
ticle
is li
cens
ed u
nder
a C
reat
ive
Com
mon
s A
ttrib
utio
n 3.
0 U
npor
ted
Lic
ence
.View Article Online
digestion assays were significant (p < 0.001 by ANOVA; Fig. 5).Short bread showed the highest absolute glucose release fol-lowed by digestive cookies. The lowest absolute glucose releasewas observed for the white bread followed by fiber enrichedcookies. Considering the relative glucose release in % oftheoretical available glucose – which was calculated from thecontent of free glucose, sucrose and carbohydrates for eachproduct – glucose concentrations after digestion of fiberenriched cookies were markedly lower at all time points com-pared to short bread and digestive cookies (p < 0.001 by Sheffépost hoc tests).
3.5 Nutritional physiological study and characteristics of thestudy population
Table 3 gives an overview of the subjects’ ages, BMIs andfasting glucose and insulin levels. The study collective con-sisted of 26 healthy men and women with a mean age of 28 ±7 years and a mean BMI of 24.1 ± 2.5 kg m−2. The safety para-meters that would indicate DM2 or impaired glucose tolerance
(fasting glucose, fasting insulin and HbA1c) were within thereference range for all subjects and did not provide any signsof impaired glucose tolerance. No differences in the fastingconcentrations of glucose and insulin were found between thetwo groups. All 26 subjects completed the nutritional physio-logical study. No cases of intolerance or gastrointestinal com-plaints were reported after consumption of the cookies.
3.6 Glucose concentration in plasma and glycemic index
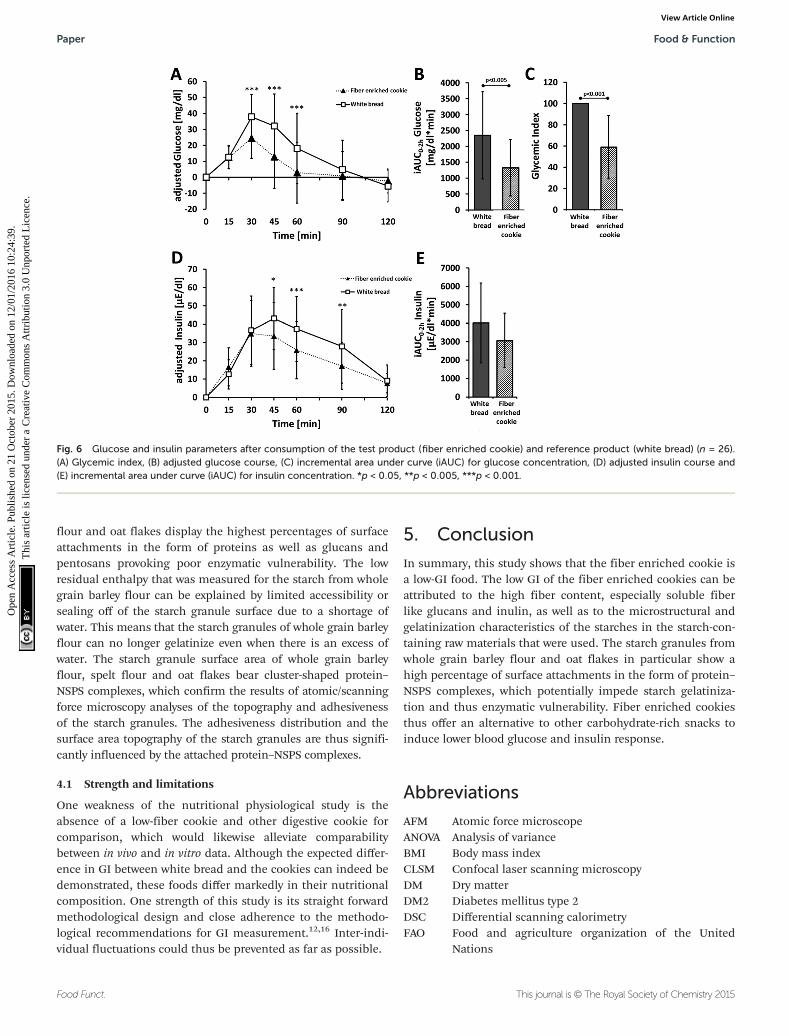
The results for GI and other blood glucose and insulin metab-olism parameters are summarized in Table 4 and Fig. 6. Thefiber enriched cookie shows markedly less effect on bloodglucose concentration compared with the reference product. At30, 45 and 60 minutes after consumption of the fiber enrichedcookie, blood glucose levels were significantly lower than afterconsumption of white bread (p < 0.001, Table 4, Fig. 6A). Thecmax value of the test product was also significantly lower thanafter consumption of white bread (p < 0.05, Table 4). The iAUCof the fiber enriched cookie was likewise significantly lower
Fig. 2 Light microscopic pictured partly gelatinized starch from starchy raw materials of fiber enriched cookies. Dark areas: Ungelatinized starchgranules; light areas: gelatinized starch after providing 40% of water in relation to dry matter. Down right: Corresponding remaining conversionenthalpy in water surplus (A) whole grain barley flour; (B) spelt flour; (C) oat flakes; (D) soft wheat dunst; (E) whole grain wheat flour. DM: dry matter.
Paper Food & Function
Food Funct. This journal is © The Royal Society of Chemistry 2015
Ope
n A
cces
s A
rtic
le. P
ublis
hed
on 2
1 O
ctob
er 2
015.
Dow
nloa
ded
on 1
2/01
/201
6 10
:24:
39.
Thi
s ar
ticle
is li
cens
ed u
nder
a C
reat
ive
Com
mon
s A
ttrib
utio
n 3.
0 U
npor
ted
Lic
ence
.View Article Online

compared with white bread (p < 0.05, Table 4, Fig. 6B). The GIof the fiber enriched cookie was, at 59, significantly lower com-pared with white bread (p < 0.001) (Table 4, Fig. 6C).
3.7 Insulin concentration in plasma
With white bread, the peak insulin concentration was reachedafter 45 minutes, while with the fiber enriched cookie, insulinlevels had already begun to fall again after 30 minutes(Table 4, Fig. 6D). At 45, 60 and 90 minutes after consumption,insulin concentrations were significantly lower after consump-tion of the cookies compared with the reference product. Thedifferences in the iAUC values for insulin between the fiber
enriched cookie and the white bread (Table 4, Fig. 6E) werenot significant, but they did display a trend (p = 0.071).
4. Discussion
With regard to GI, foods can be classified as having a low(<55), moderate (55–69) or high GI (>70). When measuring GI,glucose solution is generally used as reference.17 The GI of thefiber enriched cookie is 59 in relation to white bread as a refer-ence. Using a conversion factor of 1.4, this value can be con-verted in relation to a glucose solution as a reference.18
Accordingly, the fiber enriched cookie has a GI of 42 and
Fig. 3 Scanning electron microscopic characterization of starch granule surfaces from starchy raw materials of fiber enriched cookies. (A) Wholegrain barley flour, (B) oat flakes and (C) soft wheat dunst. Topography (left): Elevations remarkable through dark and light changes. Drop-like bodiesin A and B; smooth surface in C; partly smooth surface in A and B. Corresponding adhesion (right): high adhesive areas remarkable as light areasconfirming surficial protein–NSPS complexes in A and B. nm: nano meter, nN: nano Newton.
Food & Function Paper
This journal is © The Royal Society of Chemistry 2015 Food Funct.
Ope
n A
cces
s A
rtic
le. P
ublis
hed
on 2
1 O
ctob
er 2
015.
Dow
nloa
ded
on 1
2/01
/201
6 10
:24:
39.
Thi
s ar
ticle
is li
cens
ed u
nder
a C
reat
ive
Com
mon
s A
ttrib
utio
n 3.
0 U
npor
ted
Lic
ence
.View Article Online
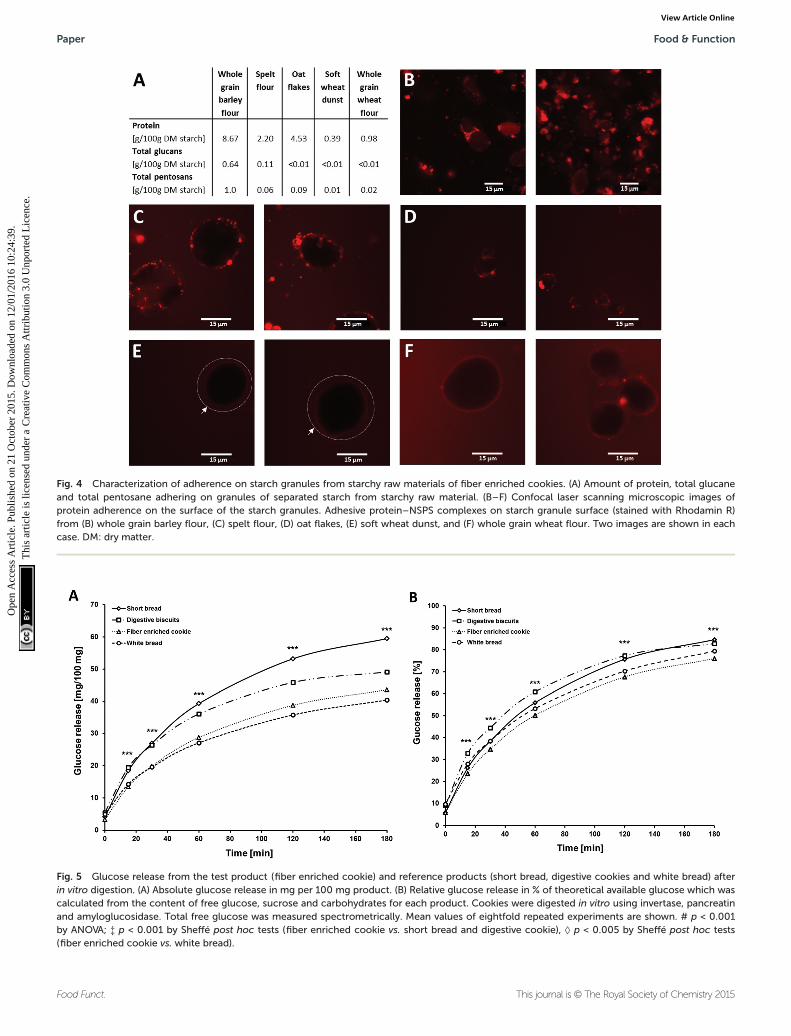
Fig. 4 Characterization of adherence on starch granules from starchy raw materials of fiber enriched cookies. (A) Amount of protein, total glucaneand total pentosane adhering on granules of separated starch from starchy raw material. (B–F) Confocal laser scanning microscopic images ofprotein adherence on the surface of the starch granules. Adhesive protein–NSPS complexes on starch granule surface (stained with Rhodamin R)from (B) whole grain barley flour, (C) spelt flour, (D) oat flakes, (E) soft wheat dunst, and (F) whole grain wheat flour. Two images are shown in eachcase. DM: dry matter.
Fig. 5 Glucose release from the test product (fiber enriched cookie) and reference products (short bread, digestive cookies and white bread) afterin vitro digestion. (A) Absolute glucose release in mg per 100 mg product. (B) Relative glucose release in % of theoretical available glucose which wascalculated from the content of free glucose, sucrose and carbohydrates for each product. Cookies were digested in vitro using invertase, pancreatinand amyloglucosidase. Total free glucose was measured spectrometrically. Mean values of eightfold repeated experiments are shown. # p < 0.001by ANOVA; ‡ p < 0.001 by Sheffé post hoc tests (fiber enriched cookie vs. short bread and digestive cookie), ◊ p < 0.005 by Sheffé post hoc tests(fiber enriched cookie vs. white bread).
Paper Food & Function
Food Funct. This journal is © The Royal Society of Chemistry 2015
Ope
n A
cces
s A
rtic
le. P
ublis
hed
on 2
1 O
ctob
er 2
015.
Dow
nloa
ded
on 1
2/01
/201
6 10
:24:
39.
Thi
s ar
ticle
is li
cens
ed u
nder
a C
reat
ive
Com
mon
s A
ttrib
utio
n 3.
0 U
npor
ted
Lic
ence
.View Article Online

would thus be classified as a low-GI food. According to tests byGarsetti and co-workers19 the mean GI of various white flourcookies was 67 ± 8. In general, the GI of cookies is 51–57 com-pared with glucose solution as a reference and is thus in thelow to moderate GI range.18,20 For cookies with comparableingredients (high amount of oat flakes and/or whole grains), amean GI of 56 ± 11 compared with glucose solution wasfound.18 The GI of the fiber enriched cookie is thus markedlylower than the GI of those cookies.
The results of the physiological study with humans demon-strated that the polysaccharide digestibility of the fiberenriched cookies is impaired resulting in a delayed andreduced glucose and insulin increase in the blood. The in vitrodata show that the glucose release is considerably lower fromfiber enriched cookies compared to short bread ordinary diges-tive cookies and white bread (reference), which may explainthe reduced blood glucose response.
The fiber content in the cookies tends to have a significantinfluence on blood glucose levels and GI. Primarily fiber-richwhole grain flours as well as oat fiber and oat flakes were usedas ingredients for the cookies. In addition, the cookies wereenriched with the water-soluble fiber NSPS inulin. The totalfiber content of the cookies was 6.4 g per 100 g. Soluble fiberlike NSPS, by means of its gel-forming characteristics, slowsstarch digestion and glucose absorption and thereby preventshigh postprandial glucose peaks.10,11,21–23 For example studies
with β-glucan-enriched foods (oat bran breakfast cereals, bars,oat drinks, muffins) have shown a decrease in GI as well aslower maximum blood glucose in comparison to non-enrichedfoods.22–26 However, effects on blood glucose response werenot observed until a total intake of ≥2.0 g of β-glucan wasreached.25 The role of inulin in foods for the blood glucoseresponse is contradictory. Various human studies have notobserved any effects of inulin on glucose metabolism.27–29 Incontrast, Marangoni & Poli (2008)30 observed a significantlylower GI of inulin enriched cookies (4.2 g inulin per 100 g and6.0 g per 100 g total fiber) compared to control cookieswithout fiber enrichment. The possible influence of insolublefiber on the digestion and absorption of carbohydrates andthus on postprandial glucose response is alsocontroversial.31–34 Studies on this topic have come to opposingresults.11,35
In addition, the microstructural and gelatinization charac-teristics of the starches from the starch-containing rawmaterials also potentially influence the carbohydrate digestionand postprandial glucose response of the fiber enrichedcookies. We showed that the transition enthalpy of the fiberenriched cookies is high suggesting that enzymatic vulner-ability of the starch is limited. One underlying cause is thehigh NSPS glucan content, which preferentially absorb waterunder conditions of water shortage, meaning starch gelatiniza-tion is prevented. As a result, accessibility of this partiallygelatinized starch is difficult for pancreatic amylases andcarbohydrate digestion and glucose absorption are thus lessefficient. Analyses of the starch-rich raw materials show thatwhole grain barley flour and oat flakes in particular have ahigh NSPS content, which also explains their limited starchgelatinization potential. The lower the gelatinization potentialunder conditions of an excess of water, the more the surface ofthe starch granules is protected against penetration by waterand thereby decrease starch gelatinization. The starch granulesof the starch phase separated out from whole grain barley
Table 3 Characteristics of the study population
Mean ± SD Range
Age [years] 28 ± 7 19–43BMI [kg m−2] 24.1 ± 2.5 20.0–29.9Fasting glucose [mg dl−1] 82.1 ± 5.8 71.0–96.0Fasting insulin [μE ml−1] 6.8 ± 5.8 2.7–12.3HbA1c [%] 4.9 ± 0.3 4.2–5.3
Table 4 Glycemic index, adjusted glucose and insulin concentration after consumption of the test product (fiber enriched cookie) and referenceproduct (white bread) (n = 26)
Parameter White breadFiber enrichedcookie
Mean ± SD Mean ± SD
Glycemic index 100 ± 0 58.9 ± 29.7***iAUC0–2 h glucose [mg dl−1 min−1] 2348 ± 1370 1332 ± 892**Glucose cmax [mg dl−1] 42.6 ± 15.2 27.8 ± 12.0***Glucose conc. 30 min [mg dl−1] 37.9 ± 13.9 24.5 ± 12.7***Glucose conc. 45 min [mg dl−1] 32.1 ± 20.0 12.7 ± 19.6***Glucose conc. 60 min [mg dl−1] 18.1 ± 22.0 2.8 ± 19.1***Glucose conc. 90 min [mg dl−1] 4.7 ± 18.6 0.8 ± 15.3iAUC0–2 h insulin [µE ml−1 min−1] 4013 ± 2172 3063 ± 1484Insulin cmax [µE ml−1] 48.9 ± 19.4 41.6 ± 16.4*Insulin conc. 30 min [µE ml−1] 36.6 ± 18.7 34.9 ± 17.9Insulin conc. 45 min [µE ml−1] 43.1 ± 17.0 33.5 ± 18.3*Insulin conc. 60 min [µE ml−1] 37.4 ± 17.7 25.8 ± 15.6***Insulin conc. 90 min [µE ml−1] 27.9 ± 20.1 17.2 ± 12.8**
*p < 0.05, **p < 0.005, ***p < 0.001 in comparison with white bread.
Food & Function Paper
This journal is © The Royal Society of Chemistry 2015 Food Funct.
Ope
n A
cces
s A
rtic
le. P
ublis
hed
on 2
1 O
ctob
er 2
015.
Dow
nloa
ded
on 1
2/01
/201
6 10
:24:
39.
Thi
s ar
ticle
is li
cens
ed u
nder
a C
reat
ive
Com
mon
s A
ttrib
utio
n 3.
0 U
npor
ted
Lic
ence
.View Article Online
flour and oat flakes display the highest percentages of surfaceattachments in the form of proteins as well as glucans andpentosans provoking poor enzymatic vulnerability. The lowresidual enthalpy that was measured for the starch from wholegrain barley flour can be explained by limited accessibility orsealing off of the starch granule surface due to a shortage ofwater. This means that the starch granules of whole grain barleyflour can no longer gelatinize even when there is an excess ofwater. The starch granule surface area of whole grain barleyflour, spelt flour and oat flakes bear cluster-shaped protein–NSPS complexes, which confirm the results of atomic/scanningforce microscopy analyses of the topography and adhesivenessof the starch granules. The adhesiveness distribution and thesurface area topography of the starch granules are thus signifi-cantly influenced by the attached protein–NSPS complexes.
4.1 Strength and limitations
One weakness of the nutritional physiological study is theabsence of a low-fiber cookie and other digestive cookie forcomparison, which would likewise alleviate comparabilitybetween in vivo and in vitro data. Although the expected differ-ence in GI between white bread and the cookies can indeed bedemonstrated, these foods differ markedly in their nutritionalcomposition. One strength of this study is its straight forwardmethodological design and close adherence to the methodo-logical recommendations for GI measurement.12,16 Inter-indi-vidual fluctuations could thus be prevented as far as possible.
5. Conclusion
In summary, this study shows that the fiber enriched cookie isa low-GI food. The low GI of the fiber enriched cookies can beattributed to the high fiber content, especially soluble fiberlike glucans and inulin, as well as to the microstructural andgelatinization characteristics of the starches in the starch-con-taining raw materials that were used. The starch granules fromwhole grain barley flour and oat flakes in particular show ahigh percentage of surface attachments in the form of protein–NSPS complexes, which potentially impede starch gelatiniza-tion and thus enzymatic vulnerability. Fiber enriched cookiesthus offer an alternative to other carbohydrate-rich snacks toinduce lower blood glucose and insulin response.
Abbreviations
AFM Atomic force microscopeANOVA Analysis of varianceBMI Body mass indexCLSM Confocal laser scanning microscopyDM Dry matterDM2 Diabetes mellitus type 2DSC Differential scanning calorimetryFAO Food and agriculture organization of the United
Nations
Fig. 6 Glucose and insulin parameters after consumption of the test product (fiber enriched cookie) and reference product (white bread) (n = 26).(A) Glycemic index, (B) adjusted glucose course, (C) incremental area under curve (iAUC) for glucose concentration, (D) adjusted insulin course and(E) incremental area under curve (iAUC) for insulin concentration. *p < 0.05, **p < 0.005, ***p < 0.001.
Paper Food & Function
Food Funct. This journal is © The Royal Society of Chemistry 2015
Ope
n A
cces
s A
rtic
le. P
ublis
hed
on 2
1 O
ctob
er 2
015.
Dow
nloa
ded
on 1
2/01
/201
6 10
:24:
39.
Thi
s ar
ticle
is li
cens
ed u
nder
a C
reat
ive
Com
mon
s A
ttrib
utio
n 3.
0 U
npor
ted
Lic
ence
.View Article Online
GCP Good clinical practiceGI Glycemic indexiAUC Incremental area under the curveNSPS Non-starch polysaccharides
Acknowledgements
The provision of the test products by Bahlsen GmbH & Co. KG(Hannover, Germany) is kindly acknowledged. The authors aresolely responsible for the design and conduct of the study, col-lection, management, analysis, and interpretation of the data,as well as preparation of the manuscript. All authors had fullaccess to the data and take responsibility for its integrity. Allauthors have read and agree with the manuscript as written.We would like to thank the participants who contributed theirtime to this project.
References
1 A. W. Barclay, P. Petocz, J. McMillan-Price, V. M. Flood,T. Prvan, P. Mitchell and J. C. Brand-Miller, Am. J. Clin.Nutr., 2008, 87, 627–637.
2 J. Salmerón, J. E. Manson, M. J. Stampfer, G. A. Colditz,A. L. Wing and W. C. Willett, Diabetes Care, 1997, 20, 545–550.
3 X.-y. Ma, J.-p. Liu and Z.-y. Song, Atherosclerosis, 2012, 223,491–496.
4 Y. Choi, E. Giovannucci and J. E. Lee, Br. J. Nutr., 2012, 108,1934–1947.
5 G. Livesey, R. Taylor, T. Hulshof and J. Howlett, Am. J. Clin.Nutr., 2008, 87, 258S–268S.
6 Anonymous, Eur. J. Clin. Nutr., 2000, 54, 353–355.7 H. Connor, F. Annan, E. Bunn, G. Frost, N. McGough,
T. Sarwar and B. Thomas, Diabetes Med., 2003, 20, 786–807.8 R. D. DiPaola, R. Asis and M. A. J. Aldao, Starch/Stärke,
2003, 55, 403–409.9 S. Tamaki, K. Teranishi, M. Hisamatsu and T. Yamada,
Starch/Stärke, 1997, 49, 387–390.10 A. L. Jenkins, D. J. Jenkins, T. M. Wolever, A. L. Rogovik,
E. Jovanovski, V. Božikov and V. Vuksan, Croat. Med. J.,2008, 49, 772–782.
11 D. J. Jenkins, T. M. Wolever, A. R. Leeds, M. A. Gassull,P. Haisman, J. Dilawari, D. V. Goff, G. L. Metz andK. G. Alberti, Br. Med. J., 1978, 1392–1394.
12 Joint FAO/WHO Expert Consultation on Carbohydrates inHuman Nutrition, Carbohydrates in human nutrition, WorldHealth Organization, Food and Agriculture Organization ofthe United Nations, Rome, 1998.
13 B. V. McCleary and R. Codd, J. Sci. Food Agric., 1991, 55,303–312.
14 A. M. Kiszonas, C. M. Courtin and C. F. Morris, CerealChem., 2012, 89, 143–150.
15 H. J. Butt, B. Cappella and M. Kappl, Surf. Sci. Rep., 2005,59.
16 F. Brouns, I. Bjorck, K. N. Frayn, A. L. Gibbs, V. Lang,G. Slama and T. M. S. Wolever, Nutr. Res. Rev., 2005, 18,145.
17 B. J. Venn and T. J. Green, Eur. J. Clin. Nutr., 2007, 61,S.122–S.131.
18 K. Foster-Powell, S. H. Holt and J. C. Brand-Miller,Am. J. Clin. Nutr., 2002, 76, 5–56.
19 M. Garsetti, S. Vinoy, V. Lang, S. Holt, S. Loyer andJ. C. Brand-Miller, J. Am. Coll. Nutr., 2005, 24, 441–447.
20 K. N. Englyst, S. Vinoy, H. N. Englyst and V. Lang,Br. J. Nutr., 2003, 89, 329.
21 J. W. Anderson, D. B. Spencer, C. C. Hamilton, S. F. Smith,J. Tietyen, C. A. Bryant and P. Oeltgen, Am. J. Clin. Nutr.,1990, 52, 495–499.
22 K. M. Behall, Diabetes Care, 2006, 29, 976–981.23 A. L. Jenkins, D. J. Jenkins, U. Zdravkovic, P. Würsch and
V. Vuksan, Eur. J. Clin. Nutr., 2002, 56, 622–628.24 H. Kim, K. S. Stote, K. M. Behall, K. Spears, B. Vinyard and
J. M. Conway, Eur. J. Nutr., 2009, 48, 170–175.25 H. Mäkeläinen, H. Anttila, J. Sihvonen, R.-M. Hietanen,
R. Tahvonen, E. Salminen, M. Mikola and T. Sontag-Strohm, Eur. J. Clin. Nutr., 2007, 61, 779–785.
26 N. Tapola, H. Karvonen, L. Niskanen, M. Mikola andE. Sarkkinen, Nutr., Metab. Cardiovasc. Dis., 2005, 15, 255–261.
27 J. Causey, J. M. Feirtag, D. D. Gallaher, B. C. Tungland andJ. L. Slavin, Nutr. Res., 2000, 20, 191–201.
28 R. Giacco, G. Clemente, D. Luongo, G. Lasorella, I. Fiume,F. Brouns, F. Bornet, L. Patti, P. Cipriano, A. A. Rivelleseand G. Riccardi, Clin. Nutr., 2004, 23, 331–340.
29 D. Letexier, F. Diraison and M. Beylot, Am. J. Clin. Nutr.,2003, 77, 559–564.
30 F. Marangoni and A. Poli, Nutr., Metab. Cardiovasc. Dis.,2008, 18, 602–605.
31 C. W. C. Kendall, A. Esfahani and D. J. Jenkins, Food Hydro-colloids, 2010, 24, 42–48.
32 J. M. Lattimer and M. D. Haub, Nutrients, 2010, 2, 1266–1289.
33 D. Mudgil and S. Barak, Int. J. Biol. Macromol., 2013, 61, 1–6.
34 K. Raninen, J. Lappi, H. Mykkänen and K. Poutanen, Nutr.Rev., 2011, 69, 9–21.
35 T. M. S. Wolever, Am. J. Clin. Nutr., 1990, 51, 72–75.
Food & Function Paper
This journal is © The Royal Society of Chemistry 2015 Food Funct.
Ope
n A
cces
s A
rtic
le. P
ublis
hed
on 2
1 O
ctob
er 2
015.
Dow
nloa
ded
on 1
2/01
/201
6 10
:24:
39.
Thi
s ar
ticle
is li
cens
ed u
nder
a C
reat
ive
Com
mon
s A
ttrib
utio
n 3.
0 U
npor
ted
Lic
ence
.View Article Online