Food for Talk - University of Toronto Desjardins_24.02... · Food for Talk February 24, 2006 ......
52
Food for Talk February 24, 2006 Realities & Lessons Learned: Making Food Policy Change from the Perspective of Public Health Ellen Desjardins, MHSc. RD Region of Waterloo Public Health Health Determinants, Planning and Evaluation Division
Transcript of Food for Talk - University of Toronto Desjardins_24.02... · Food for Talk February 24, 2006 ......
Food for TalkFebruary 24, 2006
Realities & Lessons Learned: Making Food Policy Change
from the Perspective of Public Health
Ellen Desjardins, MHSc. RD
Region of Waterloo Public HealthHealth Determinants, Planning
and Evaluation Division
An Opportunity for Food Policy Making:
The development of a comprehensive “Regional Growth Management Strategy”
in Waterloo Region
2003 - 2007
Public health project:
“Towards a Healthy Food System in Waterloo
Region”
(a) to inform public health and policy-makers about facts and issues
(b) to bring in community stakeholders
(c) to identify and prioritize policy directions

Conditions that Affect HealthHancock, T. , Labonte, R., Edwards, R., (1999). Indicators that Count!-Measuring
Population Health at the Community Level
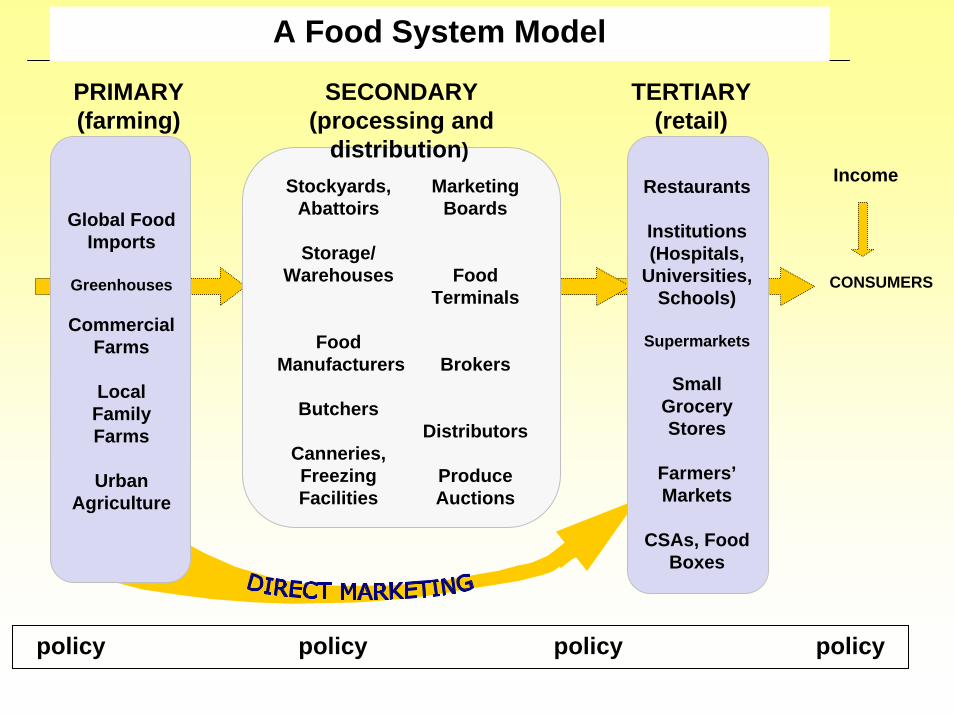
Income
CONSUMERS
Marketing Boards
Food Terminals
Brokers
Distributors
Produce Auctions
Restaurants
Institutions (Hospitals,
Universities, Schools)
Supermarkets
Small Grocery Stores
Farmers’Markets
CSAs, Food Boxes
PRIMARY (farming)
Marketing Boards
Storage
TERTIARY (retail)
Global Food Imports
Greenhouses
Commercial Farms
Local Family Farms
Urban Agriculture
SECONDARY(processing and
distribution)
Stockyards, Abattoirs
Storage/Warehouses
FoodManufacturers
Butchers
Canneries, Freezing Facilities
policy policy policy policy
A Food System Model
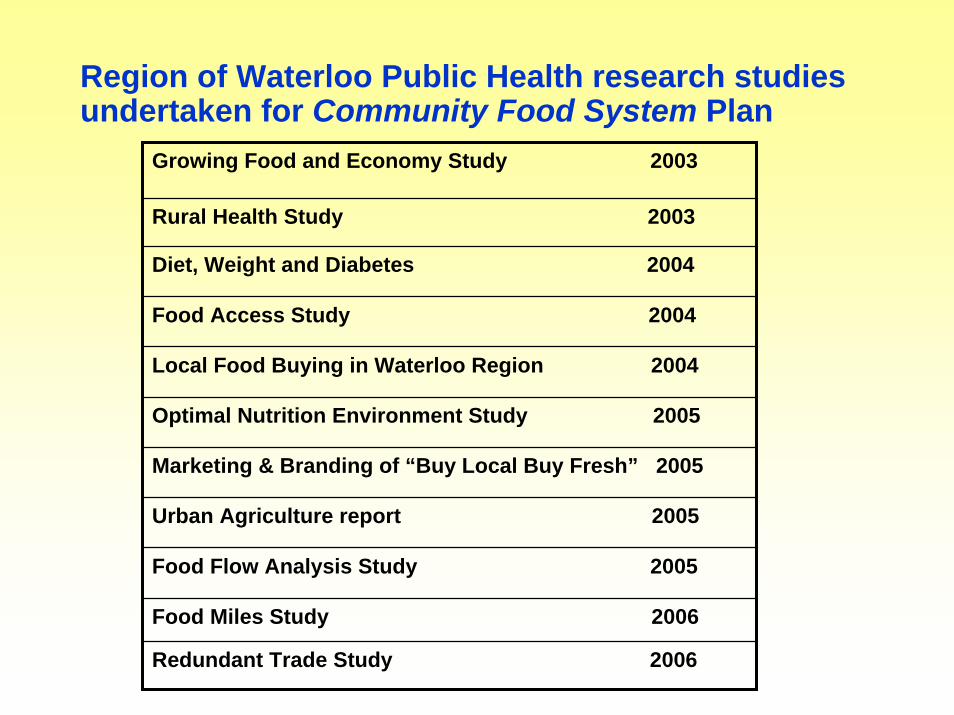
Region of Waterloo Public Health research studies undertaken for Community Food System Plan
Growing Food and Economy Study 2003
Rural Health Study 2003
Diet, Weight and Diabetes 2004
Food Access Study 2004
Local Food Buying in Waterloo Region 2004
Marketing & Branding of “Buy Local Buy Fresh” 2005
Optimal Nutrition Environment Study 2005
Urban Agriculture report 2005
Food Flow Analysis Study 2005
Food Miles Study 2006
Redundant Trade Study 2006

1. A Glance at Diet, Weight and Diabetes, Oct.2004Waterloo Region Public Health
Our population does not eat enough healthy foods,
which affects their health
58% of residents consume insufficient fruits and vegetables.
Whole grains and legumes are under-consumed
Refined carbohydrates, fats and oils and animal proteins are over-consumed
Coupled with inactivity, this has contributed to 50% of residents being either overweight or obese in 2003.

2. A Glance at Access to Food report, 2004
“Healthy food must be available, accessibleand affordable to support healthy eating choices, including people who do not owncars, have reduced mobility and/or havea low income.”
• Waterloo Region’s transit system does allow access to food
• There are areas in the Region where large grocery stores do not exist (mapping)
• Walking to grocery stores is more prevalent in the inner city
• Food at convenience stores costs more than in larger grocery stores

3. Growing Food and Economy Study, 2003
Farm Types in Ontario and Waterloo Region, 2001
0.00%5.00%
10.00%15.00%20.00%25.00%30.00%35.00%
Dairy
Beef
Hog
Poultry
Field c
rops
Fruit &
Veg
Specia
ltyCom
binati
on
Perc
enta
ge
Ontario
Waterloo

• Waterloo Region is third in the province in gross receipts per farm in 2001
• Net revenue per farm - ave $39,000 = almost twice the provincial average(but still very low)
-
Growing Food and Economy, 2003“We have a prosperous agricultural region…”
4. Redundant Trade Report, 2006
Even during the peak season, produce grown in Waterloo Region is not readilyavailable to residents
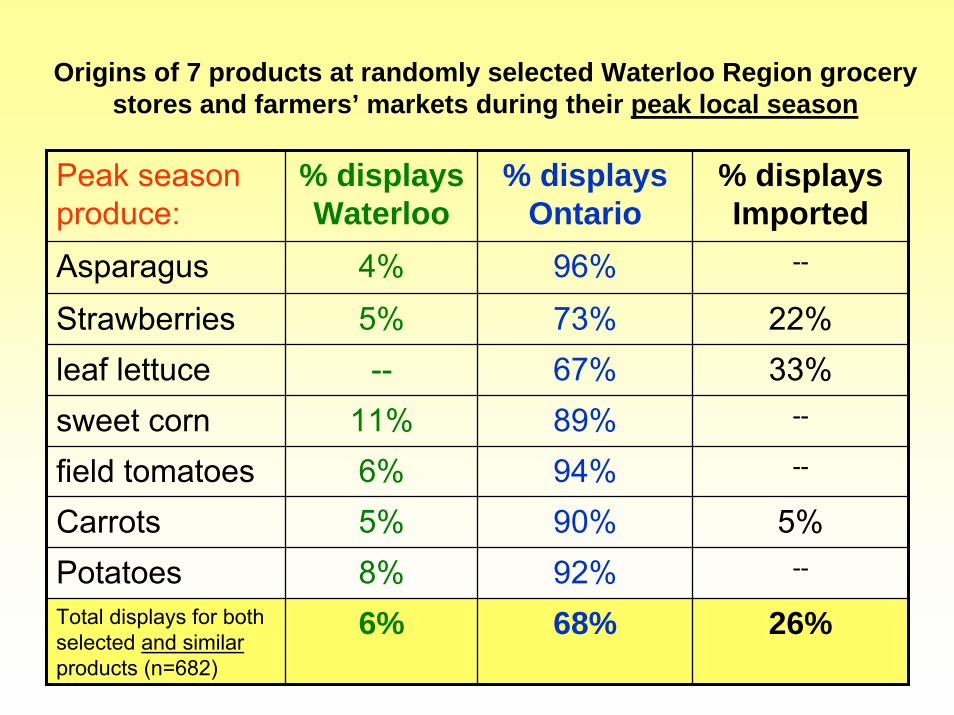
Origins of 7 products at randomly selected Waterloo Region grocery stores and farmers’ markets during their peak local season
Peak season produce:
% displays Waterloo
% displays Ontario
% displays Imported
Asparagus 4% 96% --
Strawberries 5% 73% 22%leaf lettuce -- 67% 33%sweet corn 11% 89% --
field tomatoes 6% 94% --
Carrots 5% 90% 5%Potatoes 8% 92% --
Total displays for both selected and similarproducts (n=682)
6% 68% 26%

5. Region of Waterloo Food Flow Analysis Study, Harry Cummings & Assoc. (2005)
As well… audits of supermarkets and convenience stores foundthe number of food items grown or raised in Waterloo Region to be low.
-

Waterloo RegionFood Flow Study
Store Survey & Processor Survey
September 8, 2005
Harry Cummings & Associates Inc.96 Kathleen St. Guelph. ON
www.hcaconsulting.ca(519) 823-1647

Waterloo Region Food Flow StudyResearch question…
What percentage of food that is consumed in the Region of Waterloo has been grown, raised and/or processedin the Region?

Research Approach
• Review of agricultural production in Waterloo Region
• Survey of commodity group representatives to confirm/update agri-sector profile
• Develop Waterloo Region Food Basket – identify key food items to trace from field to fork
• Survey supermarkets and convenience stores –identify availability of food basket items and the major brands on store shelves
• Survey food processors – attempt to identify which processors are sourcing agricultural products from Waterloo Region and how much is being sourced

Supermarket/Convenience Store Survey
• Methodology
– 16 supermarkets selected at random(e.g. Zehrs, Sobeys, Price Chopper, Food Basics,
Foodland, etc.)
– 25 convenience stores selected at random(e.g. Little Short Stop, Winks, Mac’s, etc.)

Processor survey
• Over 20 processors/packers identified in the store survey including:– Cargill, Better Beef, Schneider Foods, Maple Leaf
Foods, Maple Lodge Farms– Parmalat, Neilson, Pine River Cheese, Kraft– Gray Ridge Eggs, Burnbrae Eggs, OK Eggs– Canada Bread, Weston Bakeries, Dare Foods Ltd.– Quaker Oats, Kellogg’s– Martin’s Family Fruit Farm, Golden Town Apple
Products• Follow-up survey with major processors to identify the
extent to which processors use agricultural products produced in the Region of Waterloo

Degree of Ontario and Waterloo Region Sourcing of Selected Foods in Waterloo Region Retail Outlets
<10% very low 10-29% low 30-59% moderate 60-79% high >80% very high
Ontario content
Waterloo content
Ontario content
Waterloo content
Ground beef
Low - mod Very low Multi-grain bread
Very high Very low
Pork chops
Low - mod Very low Quick oatmeal
mod Very low
Chicken breasts
Mod - high low Apples Very high mod
Yoghurt Very high low Apple juice
mod Very low
Cheddar cheese
high Very low Carrots mod none
eggs high Very low Tomatoes Mod - high none

Our food system is concentrated in the hands of fewer and fewer players.
• Total number of farms declining, size increasing, though not as dramatically as in rest of province
• Five employers in the food processing and distribution sector account for over 55% of all jobs
• Four food chains operate 71% of the 35 supermarkets in the Region

Growing Food and Economy Study, 2003
Percent change from 1996 - 2001
Total number of farms
Total acres in production
Ontario - 12% -3%
Waterloo Region -9% -4%

The structure of our foodsystem has social and environmental consequences

6. The Rural Health Study, 2003Waterloo Region Public Health
Socially… the health of rural communities is declining
Rural residents have a strong sense of connection to the land and history, and a sense of community
Smaller farms are disappearing, and those left are finding it increasingly difficult to compete with larger farms and global trade
Farmers are facing a great deal of stress and financial concerns, resulting in many pursuing off-farm incomes
"Young people end up leaving –they see no future in farming.”
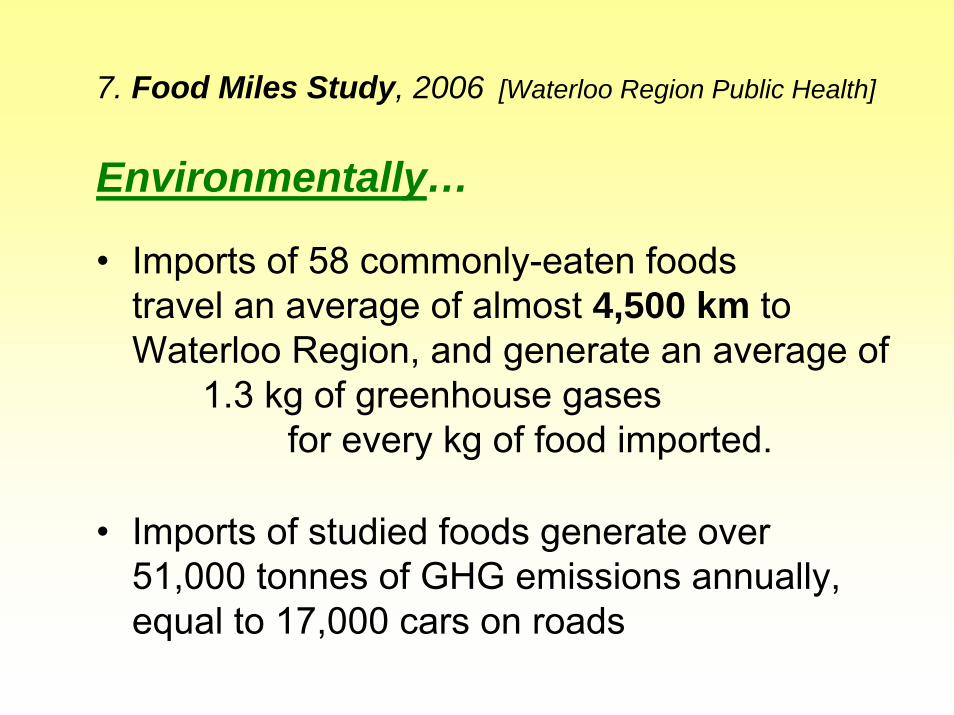
7. Food Miles Study, 2006 [Waterloo Region Public Health]
Environmentally…
• Imports of 58 commonly-eaten foods travel an average of almost 4,500 km to Waterloo Region, and generate an average of
1.3 kg of greenhouse gases for every kg of food imported.
• Imports of studied foods generate over 51,000 tonnes of GHG emissions annually, equal to 17,000 cars on roads
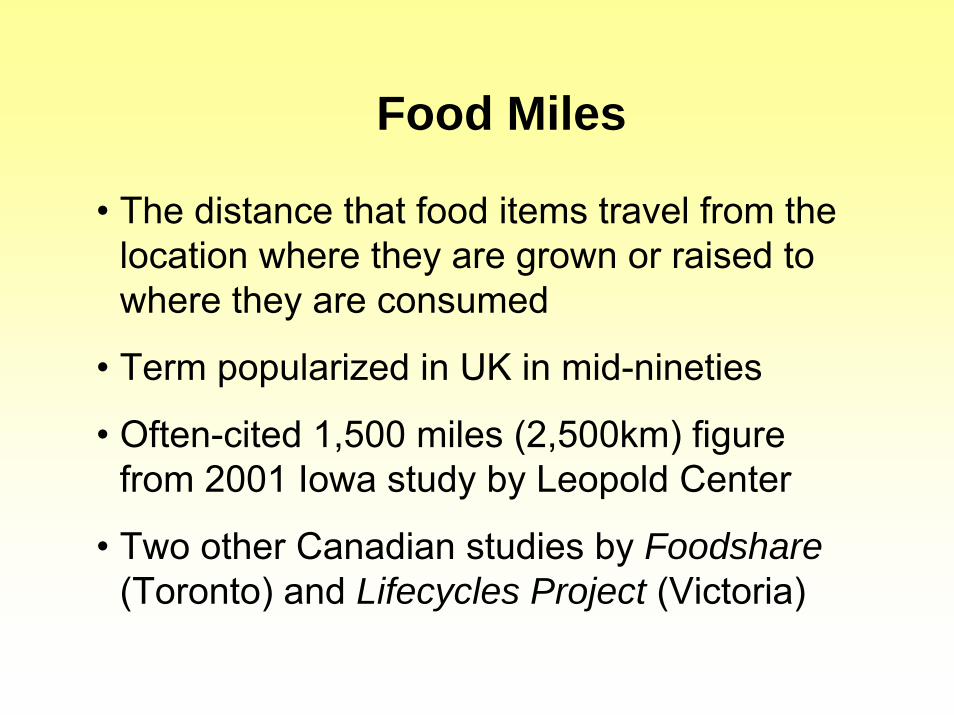
Food Miles
• The distance that food items travel from the location where they are grown or raised to where they are consumed
• Term popularized in UK in mid-nineties
• Often-cited 1,500 miles (2,500km) figure from 2001 Iowa study by Leopold Center
• Two other Canadian studies by Foodshare(Toronto) and Lifecycles Project (Victoria)

Food Miles: Methodology
Weighted Average Source Distance (WASD)
WASD = ∑(v * d)_________
∑vwhere:
∑ = sum of
v = value of imports from each location of production origin
d = distance from each location of production origin to the point of consumption
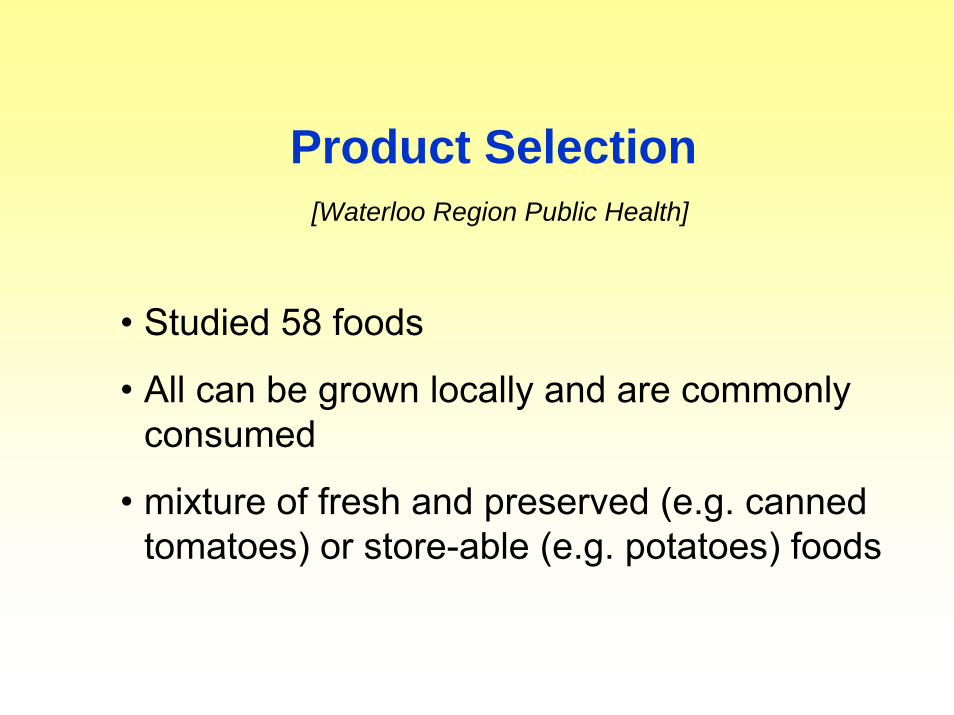
Product Selection[Waterloo Region Public Health]
• Studied 58 foods
• All can be grown locally and are commonly consumed
• mixture of fresh and preserved (e.g. canned tomatoes) or store-able (e.g. potatoes) foods

Findings [Waterloo Region Public Health]
• Average for all 58 food items: 4,497 km• Median: 3,651 km• Average GHG emissions per kg of food
items imported: 1.3 kg (1.0 kg median)• Imports of 58 food items generate 51,709
tonnes of GHGs annually in WR• This equals 16,918 cars driven on our
roads and 5.9% of all household GHG emissions

• If same food items were sourced in Waterloo Region: 30 km, and 0.008 kg of GHG emissions
per kg consumed• If same food items were sourced in SW Ontario:
250 km, and 0.067 kg of GHG emissionsper kg consumed
• Imports travel 150 (or 18) times further than locally-sourced food items, and create 161 (or 19) times more GHG emissions
Comparison to Local

Example: Beef
WASD: 5,770 km WAER: 5.403:1Overseas transport assumption: air
Imported beef travels 5,770 km on average to Waterloo Region, and its transport produces more than five times its own weight in GHG emissions.
Major Source Locations Proportion of All ImportsColorado (2,321km) 21%Kansas (1,649 km) 16%Australia (15,935 km) 15%New Zealand (14,254km) 12%Nebraska (1,545 km) 9%
Beef sourced from Waterloo Region produces 667 fewer GHG emissions than imported beef.

Example: Canned TomatoesWASD: 5,244 km WAER: 1.067:1Overseas transport assumption: marine
Imported tomatoes travel 5,244 km on average to Waterloo Region, and their transport produces slightly more than their own weight in GHG emissions.
Major Source Locations Proportion of All ImportsCalifornia (3,994 km) 58%Italy (9,445 km) 27%Ohio (600 km) 4%Indiana (781 km) 3%
Tomatoes from Leamington produce 14 times fewer GHG emissions than imported tomatoes. Tomatoes from Waterloo Region produce 132 times fewer GHG emissions.
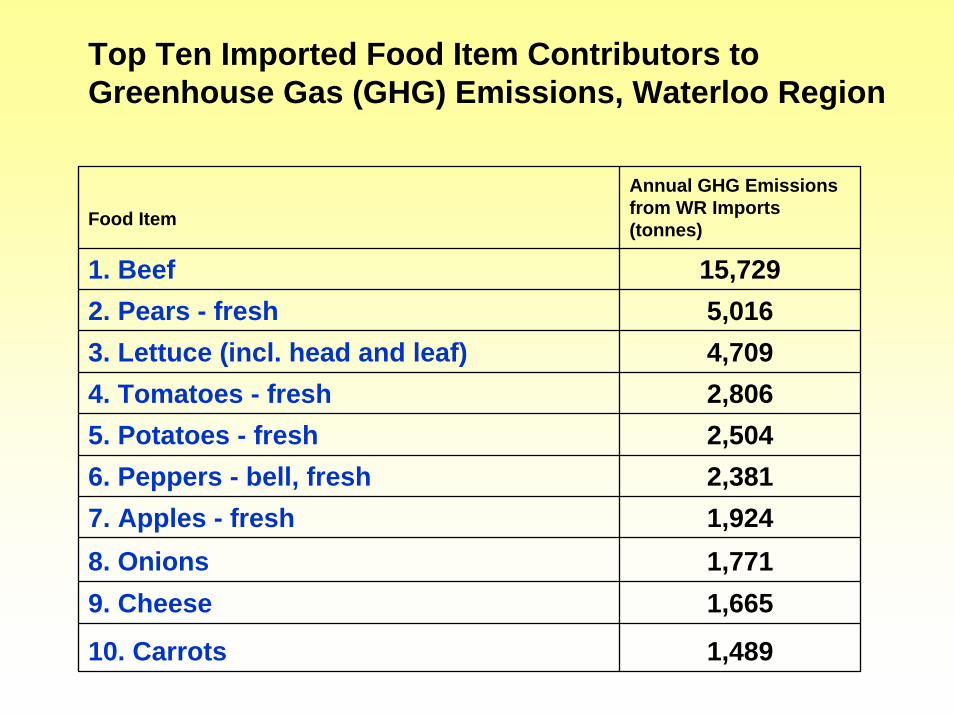
Top Ten Imported Food Item Contributors to Greenhouse Gas (GHG) Emissions, Waterloo Region
Food Item
Annual GHG Emissions from WR Imports (tonnes)
1. Beef 15,7292. Pears - fresh 5,0163. Lettuce (incl. head and leaf) 4,7094. Tomatoes - fresh 2,8065. Potatoes - fresh 2,5046. Peppers - bell, fresh 2,3817. Apples - fresh 1,9248. Onions 1,7719. Cheese 1,665
10. Carrots 1,489
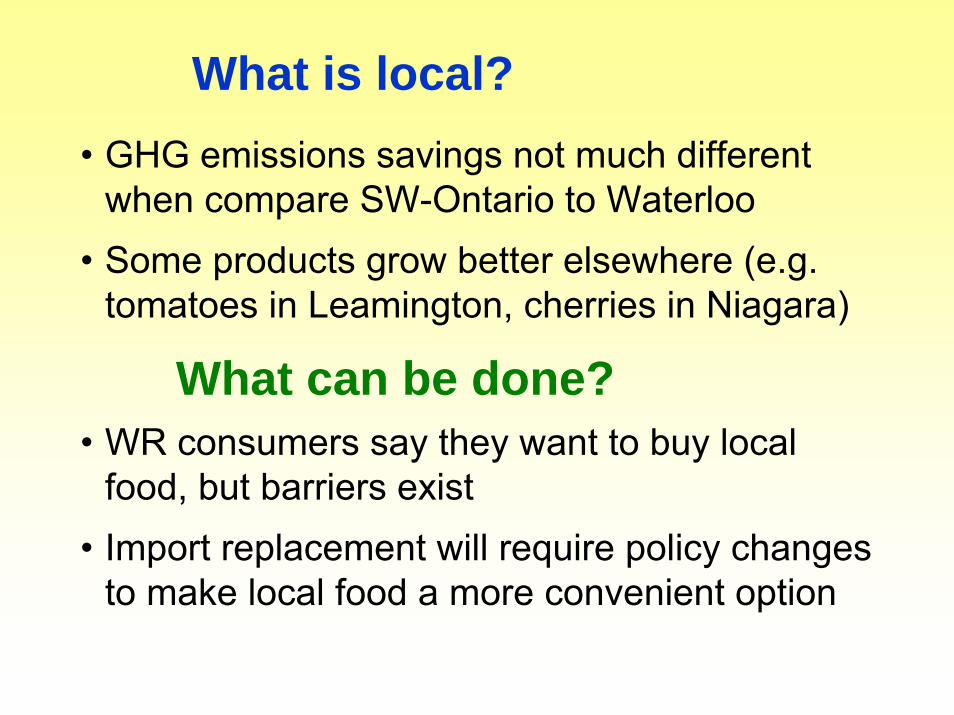
• GHG emissions savings not much different when compare SW-Ontario to Waterloo
• Some products grow better elsewhere (e.g. tomatoes in Leamington, cherries in Niagara)
What can be done?• WR consumers say they want to buy local
food, but barriers exist • Import replacement will require policy changes
to make local food a more convenient option
What is local?
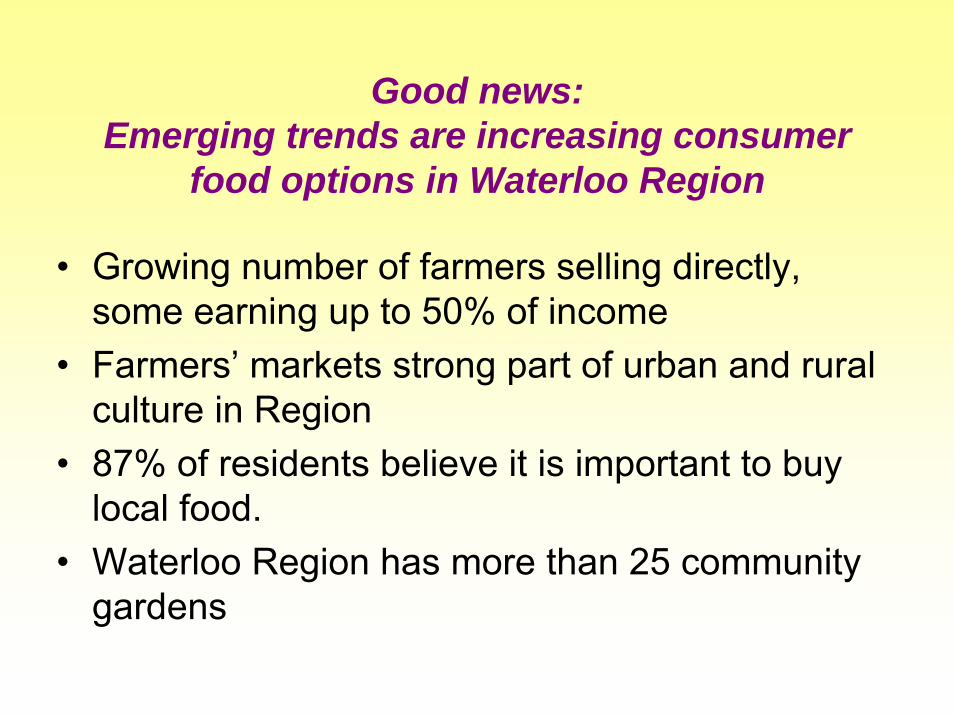
• Growing number of farmers selling directly, some earning up to 50% of income
• Farmers’ markets strong part of urban and rural culture in Region
• 87% of residents believe it is important to buy local food.
• Waterloo Region has more than 25 community gardens
Good news: Emerging trends are increasing consumer
food options in Waterloo Region
The optimal nutritional needs of Waterloo Region’s population could be met from local production, with a 10% shift in agricultural production by 2026 or a 12% shift by 2046
-
8. Optimal Nutrition Environment for Waterloo Region study, 2005
[The Future of Waterloo Region’s Food System]

How to attain an “Optimal Nutrition Environment”?
1. Increase local processing capacity:Program for start-up financial and educational support for small to medium enterprises, e.g.
-zoning laws-eco-industrial park-business incubator-food training in prep & safety
To attain an “Optimal Nutrition Environment”:
2. Build a major local market infrastructure, including food services in:– Universities, colleges– Schools– Workplaces, daycares, retirement homes– Restaurants– Co-ops, farmers markets & other retail– Other ideas?

How to attain an “Optimal Nutrition Environment”?
3. Expansion of vegetable and fruit storage facilities
4. Advocacy for agricultural extension programs (provincial)
5. Laws to protect the agricultural land base and prevent “urban sprawl”
6. On-going promotion of nutrition knowledge and value of local food

Goal for Food Policy
All residents have access to, and can afford to buy safe, nutritious, and culturally acceptable food that has been produced in an environmentally sustainable way that sustains our rural communities.

Objectives of a Healthy Food System:
1. Ensure that all residents can afford to buy the type of food they need to sustain health.
2. Preserve and protect Waterloo Region’s agricultural lands.
3. Strengthen food-related knowledge and skills among consumers.
4. Increase the availability of healthy food so that healthy choices are easier to make.
5. Increase the viability of ROW farms to preserve rural communities and culture.
6. Strengthen the local food economy.
7. Forge a partnership to implement the plan.
Objective 4: To increase the availability of healthy food, so that the healthy choices are easier to make.
Strategy 4.1 Ensure healthy food is available in every neighbourhood
e.g. More farmers markets in highly populated areas

Objective 4: To increase the availability of healthy food, so that the healthy choices are easier to make.
Strategy 4.2 Increase urban agriculture programs
e.g. Enhance opportunities for urban gardens, and provide public education
Objective 4: To increase the availability of healthy food, so that the healthy choices are easier to make.
Strategy 4.3
(a) Restrict unhealthy foods in identified neighbourhoods …e.g public schools
(b) Expand CSAs and Food Box Programs

Objective 5: To increase the viability of farms that sell food to local markets in order to preserve rural communities and culture.
Strategy 5.1 Increase farm-gate sales
Strategy 5.2 Expand local farmers’ markets
Strategy 5.4 Enable on-farm processing
Strategy 5.3 Establish farm-to-school & farm-to-university programs
Objective 6: To strengthen the local food economy.
Strategy 6.1 Encourage a local food processing/preserving industry
-freezing-canning-drying-milling
-meat processing-dairy processing

Objective 6: To strengthen the local food economy.
Strategy 6.2 Establish incubator kitchens for food retail operations
Strategy 6.3 Encourage a local food distribution sector
Strategy 6.4 Establish a local food label
Objective 7: To forge a dynamic partnership to implement the Community Food System plan.
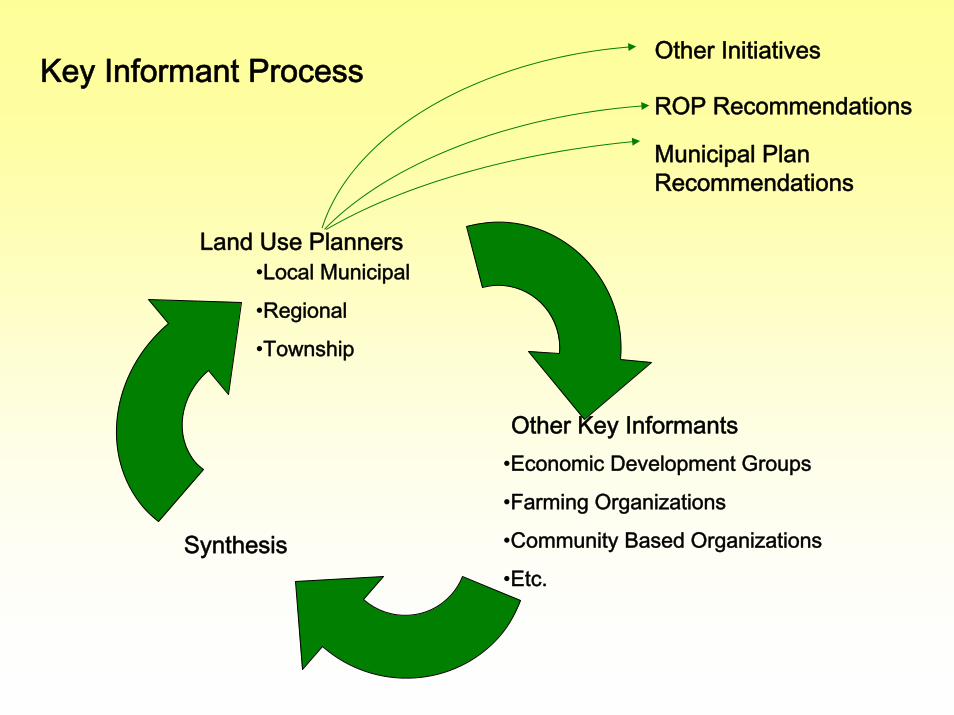
Other Initiatives
ROP Recommendations
Municipal Plan Recommendations
Land Use Planners
Synthesis
Other Key Informants•Economic Development Groups
•Farming Organizations
•Community Based Organizations
•Etc.
Key Informant Process
•Local Municipal
•Regional
•Township

Towards a Healthy Food System in Waterloo Region
Key Informant Stakeholder
FOCUS GROUPSFebruary, 2006
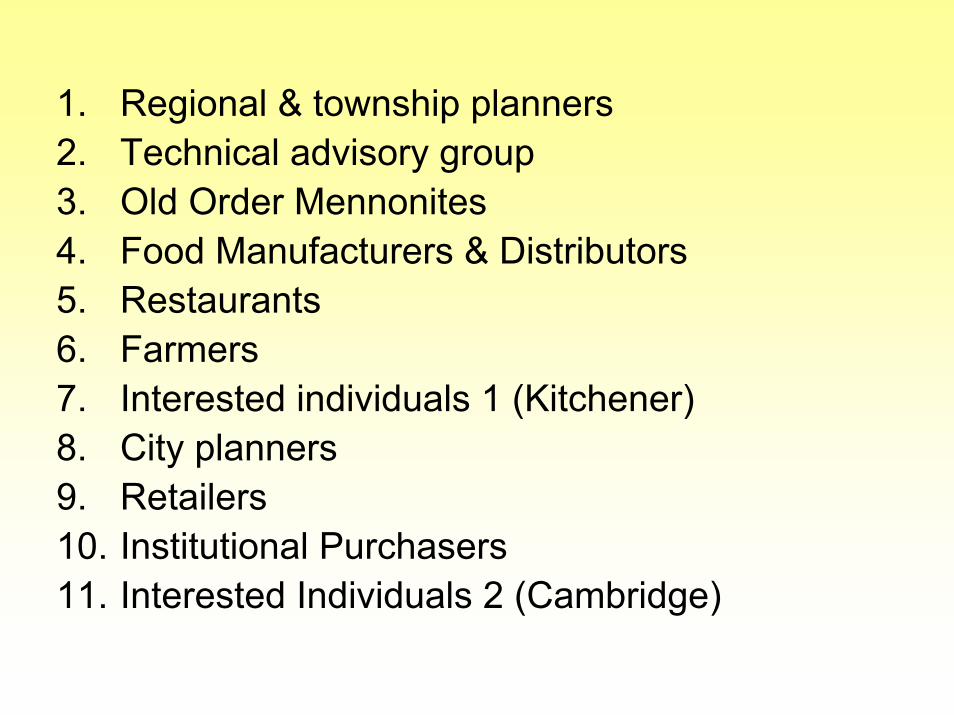
1. Regional & township planners2. Technical advisory group3. Old Order Mennonites4. Food Manufacturers & Distributors5. Restaurants6. Farmers7. Interested individuals 1 (Kitchener)8. City planners9. Retailers10. Institutional Purchasers11. Interested Individuals 2 (Cambridge)

11 Food System Stakeholder Focus Groups in Feb, 2006
Ellen Desjardins and Marc Xuereb
• Sent copies of report and invitation letters• Advertised in 7 local newspapers• Set, and achieved, maximum participation
between 10 – 12 people/ grp• Presented all 11 potential strategies• Asked participants to select a few priorities• Asked participants “how we can make it happen”

Next steps:• Prepare report on stakeholder focus group• Suggest food policy directions for Regional
Growth Management Strategy that have stakeholder support
• Discuss implications for food policies: e.g. zoning or taxation by-laws, resources, consultations, regional guidelines, etc.
• Work towards policies with political support from Regional, City and Township Councils, as well as stakeholder partnerships