cu.clarkson.educu.clarkson.edu/tcs/2016-2017 Clarkson School Handb… · Web viewcu.clarkson.edu
Prepared byINSTATE Pty Ltd
D E P A R T M E N T O F A G R I C U L T U R E , F I S H E R I E S A N D F O R E S T R Y
Food Exporters’ Guide to INDONESIA
Ha
nd
bo
ok

Prepared for the Australian Government Department ofAgriculture, Fisheries and Forestry
by INSTATE Pty Ltd
Food Exporters’Guide to INDONESIA
Ha
nd
bo
ok
© Commonwealth of Australia 2004All photographs © Peter Dawson, 2003
This work is copyright. The Copyright Act 1968 1968 permits fair dealing for study, research, newsreporting, criticism or review. Selected passages, tables or diagrams may be reproduced for suchpurposes provided acknowledgment of the source is included. Major extracts or the entire document may not be reproduced by any process without the written permission of the Executive Manager, Food and Agriculture Business, Australian Government Department of Agriculture, Fisheries and Forestry,GPO Box 858, Canberra ACT 2601.
ISBN 0 642 539197
Disclaimer
This report was prepared by INSTATE Pty Ltd for the Food Policy and Safety Branch of the AustralianGovernment Department of Agriculture, Fisheries and Forestry. It should be cited as:
Smith, L and Dawson, P, Food Exporters’ Guide to Indonesia, Australian Government Department ofAgriculture, Fisheries and Forestry, Canberra, 2004.
INSTATE Pty Ltd is an Australian advisory firm, headquartered in Sydney, which specialises in Asian marketstrategies.
The views expressed in this publication are not necessarily the views of the Commonwealth. Thispublication is made available on the understanding that the Commonwealth is not thereby engaged inrendering professional advice. Before relying on material in this publication, users should independentlyverify the accuracy, currency, completeness and relevance of the information for their purposes and obtainany appropriate professional advice. References to non-Commonwealth organisations do not constituteendorsement by the Commonwealth of those organisations or any associated product or service.
The Australian Government Department of Agriculture, Fisheries and Forestry seeks to publish its work tothe highest professional standards. However, it cannot accept responsibility for any consequences arisingfrom the use of information herein. Readers should rely on their own skill and judgement in applying anyinformation for analysis to particular issues or circumstances.
Design and formatting by Mirrabooka Marketing & Design Pty Ltd.
Acknowledgements
The authors wish to thank PJ Dawson and Associates, Thomas Darmalan (GAPMMI), staff in the FoodPolicy and Communications Section of the Australian Government Department Agriculture, Fisheries andForestry’s Food and Agriculture Business Group who managed the project and edited the handbook, andthe numerous Australian and Indonesian company representatives and government officials who gavegenerously of their time for interviews and assistance.
The authors also wish to thank Nicole Maron, Andrew Campion and Denis Gastin of INSTATE for theirresearch and editorial input.
Cover images courtesy of P J Dawson and P T Davids Distribution Indonesia.CLOCKWISE FROM TOP LEFT: Fruit stalls, Jakarta; Carrefours checkouts, Jakarta; Davids dry warehouse,Jakarta; fruit & vegetables, Alfa hypermarket; Alfa hypermarket, Surabaya.
FOO D E XPORTER S’ GUIDE TO INDONESIAii
Chapter title
FOOD AND AGRICULTURE BUSINESS GROUP
The Australian Government Department of Agriculture Fisheries and Forestry is theCommonwealth agency with portfolio responsibility for food production and processing policy.The Food and Agriculture Business Group facilitates integrated policy development, innovationand stakeholder engagement across the agriculture and food industries.
The Food Policy and Safety Branch of the Group, which includes the Food Policy andCommunications Section, develops and implements policy with the aim of facilitating a globallycompetitive, innovative and export oriented food processing and beverage industry. Thesection works cooperatively with and has regard to the mandates of the National Food IndustryCouncil (NFIC), National Food Industry Strategy Ltd (NFIS Ltd), the Primary Industry MinisterialCouncil’s food sub-committee, and industry.
The section is also responsible for disseminating information to food industry stakeholders onissues of interest and importance including sectoral profiles, international and domestictrends, emerging issues, statistics, developments in food policy and programs, and decisionsby government and food agencies.
Other portfolio publications of possible interest include:Spencer S, Price Determination in the Australian Food Industry: A Report, AustralianGovernment Department of Agriculture, Fisheries and Forestry, Canberra, 2004.
Department of Agriculture, Fisheries and Forestry, Australian Food Statistics 2003, reportprepared by ABARE, Canberra, 2003.
Food News Bulletin (published quarterly), produced by the Australian Government Departmentof Agriculture, Fisheries and Forestry, Canberra.
Department of Agriculture, Fisheries and Forestry, Exporting Australian Processed Foods,report prepared by INSTATE Pty Ltd, Milsons Point, NSW, 2000.
Department of Agriculture, Fisheries and Forestry, Chains of Success, Canberra, 1998.
Most portfolio publications can be accessed via:http://www.daff.gov.au/content/publications.cfm
Contact details
Food Policy and CommunicationsAustralian Government Department of Agriculture, Fisheries and ForestryGPO Box 858CANBERRA ACT 2601
Telephone: +61 2 6272 4161
Email: mailto:[email protected]
Internet site: http://www.daff.gov.au/foodinfo
FOO D E XPORTER S’ GUIDE TO INDONESIA iii
Chapter title
FOO D E XPORTER S’ GUIDE TO INDONESIAiv
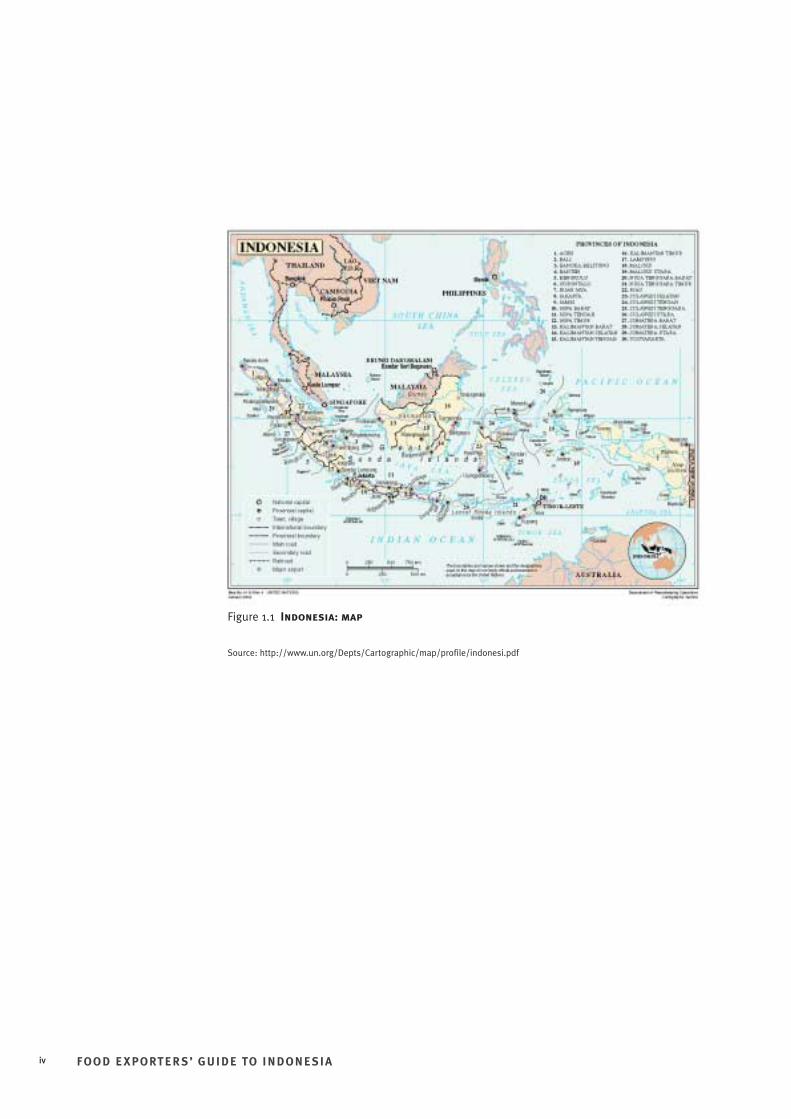
Figure 1.1 Indonesia: map
Source: http://www.un.org/Depts/Cartographic/map/profile/indonesi.pdf
Chapter title
FOO D E XPORTER S’ GUIDE TO INDONESIA v
CONTENTS
Indonesia: Map iv
Abbreviations/Acronyms ix
Indonesia: Facts in Brief xi
Chapter 1 Introduction 1
Chapter 2 Indonesian consumers 3
Chapter 3 Retail and food service 13
Chapter 4 Supply chains 27
Chapter 5 Business environment 43
Chapter 6 Australian food exports 57
Chapter 7 Political and economic environment 63
Appendixes 69
Appendix 1 Food exports by 2 digit codes 70
Appendix 2 Food exports by 8 digit codes 72
Appendix 3 Exports – by port of discharge 93
Appendix 4 Tariffs 98
Appendix 5 Useful contacts 101General sources of information on Indonesia 101Indonesian Government 102Major retailers in Indonesia 102Major Indonesian food companies 103Indonesian importer associations 103Food importers, distributors and logistics providers 104Indonesian industry associations 106Australia-Indonesia business and other links 106Australian Government 107Islamic associations in Australia 107
Appendix 6 Exchange rates 108
Appendix 7 Freight forwarding services 109
Bibliography 110
FIGURES, TABLES AND IMAGES
Figures
1.1. Indonesia: map iv
2.1. Indonesia: age distribution 3
2.2. Indonesia: population distribution 4
2.3. Monthly per capita expenditure (Rp/month) 4
2.4. Consumer spending on food: urban rural differences 5
2.5. Indonesia: religious beliefs 5
2.6. Indonesia: GDP growth, 1970–2003 6
2.7. Demographic distribution: AC Nielsen data (Rp/month) 7
3.1. Where Indonesians shop 13
3.2. Average number of people per retail outlet 14
3.3. Top five grocery chains’ market share: share of all category volume (%) 15
3.4. Indonesia: retail trade shares 16
4.1. Indonesia and Australia: composition of GDP 27
4.2. Indofood’s distribution subsidiary 37
4.3. Typical distribution network for cooking oil 41
Tables
2.1. Demographic segments 7
2.2. Indonesia: size and distribution of demographic segments (% total in city) 7
2.3. Average per capita monthly expenditure by commodity group, 2002 (Rp) 8
2.4. Average per capita monthly expenditure by commodity group, 2002 (% share of total spending on food) 9
3.1. Indonesia: estimated growth in number of retail food outlets, 1997–2003 15
3.2. Retail food sales by type of outlet Rp trillion (% share) 15
3.3. Indonesia: an overview of the modern retail sector 16
3.4. Indonesia: major supermarket chains, 2001 18
3.5. Indonesia: major warehouse / cash and carry operators, 2001 19
3.6. Indonesia: hypermarket chains, 2003 20
3.7. Indonesia: international tourism industry key projections 23
3.8. Indonesia: hotels 24
3.9. Indonesia: selected food outlet franchises, 2002 25
4.1. Indonesia: ten largest packaged food companies by market share (%) 29
4.2. Investment environment issues 31
4.3. Indonesia: self-sufficiency in key agricultural commodities, 2001 32
4.4. Indonesia: total agricultural imports 32
4.5. Indonesia: imports and exports of processed food and beverages (US$m) 33
4.6. Australia: exports by port of discharge (FOB value) 33
4.7. Indonesia: major food import items, 2002 34
4.8. Indonesia: imports of consumer-oriented food products, 1999–2001 34
FOO D E XPORTER S’ GUIDE TO INDONESIAvi
4.9. Indonesia: major suppliers of food imports 35
4.10. Origin of food products in various outlets, 2001 35
4.11. Indonesia: food distribution by retail / trade channel 38
4.12. Indonesia: food distribution by geographic region 38
4.13. Supply chain development: challenges and constraints 41
5.1. Summary of tariff rates on food imports 44
5.2. Phytosanitary requirements for imports of agricultural and food products (selected) 48
5.3. Representation options 51
5.4. Transparency International corruption perceptions index, 2003 55
6.1. Australia’s major food markets: selected years (ranking / exports in A$bn) 57
6.2. Select Australian exports to Indonesia, 1992–2002 by value ($,000 FOB) 58
6.3. Australian food exports to Indonesia: growing niche markets 60
6.4. Australian product shares of the Indonesian market, 2002 60
6.5. Austrade assessment of opportunities in the Indonesian market 61
6.6. United States assessment of opportunities in the Indonesian market 61
6.7. Canadian assessment of opportunities in the Indonesian market 61
6.8. New Zealand assessment of opportunities in the Indonesian market 62
A6.1. Exchange Rates IDR–AUD and IDR–USD, 1990–2003 108
Images
1.1. Fresh fruit street stall, Jakarta 1
1.2. Makro store, Jakarta 1
1.3. Australian fresh fruit display, Sogo Supermarket, Plaza Indonesia 1
2.1. Meat display, Hero supermarket 9
2.2. Indomilk display, Kemang 9
2.3. Fruit display, Jakarta supermarket 10
2.4. Durian fruit, Carrefour, Jakarta 10
2.5. In-store bakery, Carrefour, Jakarta 10
3.1. Wet market, Malang, East Java 14
3.2. Plaza Indonesia, Central Jakarta 15
3.3. Alfa Store, Surabaya 17
3.4. Fruit display, Hero supermarket, Kemang 18
3.5. Australian carrots, D’Best supermarket, Jakarta 19
3.6. Makro Store, Jakarta 20
3.7. Carrefour checkouts, Jakarta 21
3.8. Carrefour fruit section, Jakarta 21
3.9. Alfa minimart, Malang, East Java 22
3.10. Alfa minimart, Malang, East Java 22
3.11. Arnott’s biscuits, Hero supermarket, Kemang 23
3.12. Australian fruit display, Hero supermarket, Kemang 23
FOO D E XPORTER S’ GUIDE TO INDONESIA vii
Chapter title
3.13. Giant hypermarket under construction, Kelapa Gading, Jakarta 23
3.14. Shoppers in World Trade Centre, Mangga Dua 24
4.1. Japfa products, Jakarta hypermarket 28
4.2. Nestle cereal, Makro store, Jakarta 30
4.3. Wira Logistics, Jakarta 36
4.4. Wira Logistics, Jakarta warehouse 37
4.5. Davids Logistics Services, Jakarta 37
4.6. Davids 25 000 m2 dry warehouse, Jakarta 38
5.1. Australian cask wines, Hero supermarket, Kemang 46
5.2. Lebaran gift packs, hypermarket, Bekasi, Jakarta 53
5.3. Indonesian syrups and noodles, Ramadan stock 53
6.1. Capilano Honey, Hero supermarket, Kemang 58
6.2. Australian yoghurt, Hero supermarket, Kemang 59
6.3. Berri Juice counter, Kelapa Gading Mall 59
FOO D E XPORTER S’ GUIDE TO INDONESIAviii
Chapter title
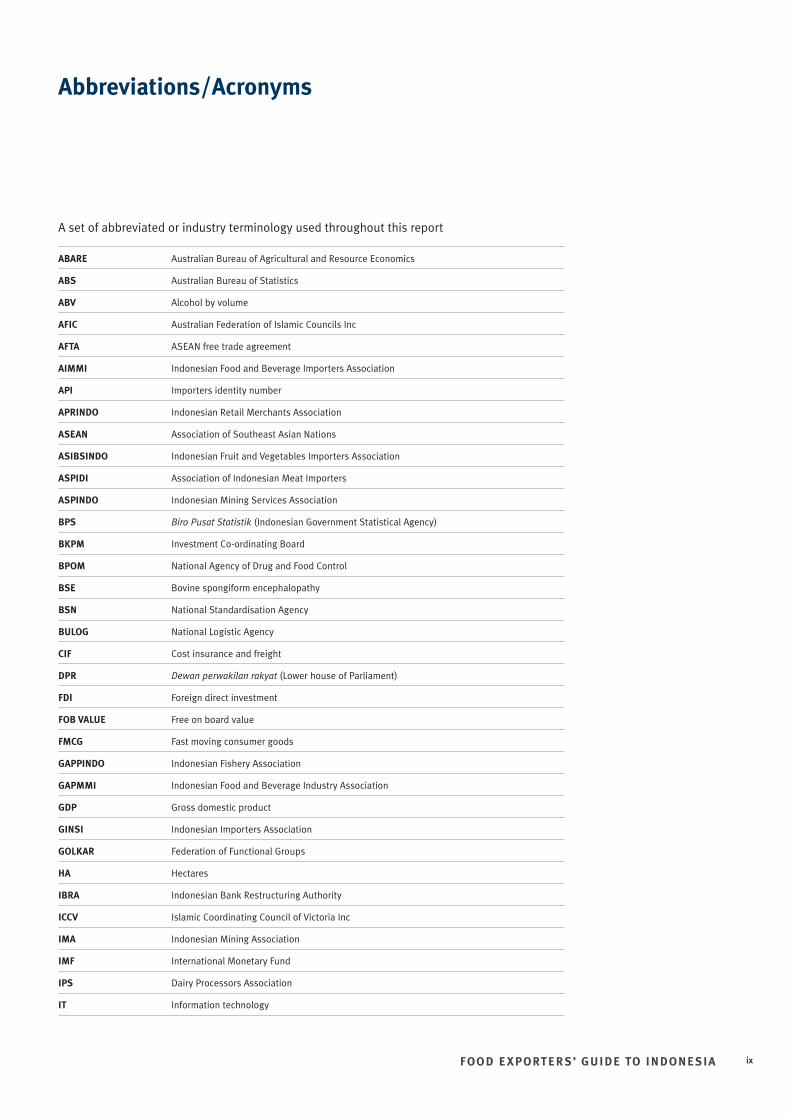
Abbreviations/Acronyms
A set of abbreviated or industry terminology used throughout this report
ABARE Australian Bureau of Agricultural and Resource Economics
ABS Australian Bureau of Statistics
ABV Alcohol by volume
AFIC Australian Federation of Islamic Councils Inc
AFTA ASEAN free trade agreement
AIMMI Indonesian Food and Beverage Importers Association
API Importers identity number
APRINDO Indonesian Retail Merchants Association
ASEAN Association of Southeast Asian Nations
ASIBSINDO Indonesian Fruit and Vegetables Importers Association
ASPIDI Association of Indonesian Meat Importers
ASPINDO Indonesian Mining Services Association
BPS Biro Pusat Statistik (Indonesian Government Statistical Agency)
BKPM Investment Co-ordinating Board
BPOM National Agency of Drug and Food Control
BSE Bovine spongiform encephalopathy
BSN National Standardisation Agency
BULOG National Logistic Agency
CIF Cost insurance and freight
DPR Dewan perwakilan rakyat (Lower house of Parliament)
FDI Foreign direct investment
FOB VALUE Free on board value
FMCG Fast moving consumer goods
GAPPINDO Indonesian Fishery Association
GAPMMI Indonesian Food and Beverage Industry Association
GDP Gross domestic product
GINSI Indonesian Importers Association
GOLKAR Federation of Functional Groups
HA Hectares
IBRA Indonesian Bank Restructuring Authority
ICCV Islamic Coordinating Council of Victoria Inc
IMA Indonesian Mining Association
IMF International Monetary Fund
IPS Dairy Processors Association
IT Information technology
FOO D E XPORTER S’ GUIDE TO INDONESIA ix
KFC Kentucky fried chicken
Km2 Square kilometres
m2 Square metres
ML (Makanan luar) Imported food licence number (must be printed on food packaging)
MPR Majelis permusyawaratan rakyat (Upper house of Parliament)
MUI Indonesian Islamic Council
NA Not available
n.e.s. Not elsewhere specified
PA Per annum
PAN National Mandate Party
PKB National Awakening Party
PKS Prosperous Justice Party
PBB Crescent Moon and Star Party
PDI–P Democratic Party for Struggle
P&D Packing and distribution
PKB People’s awakening party
PPP United Development Party (Federation of former Islamic parties)
Rp Indonesian rupiah
SICHMA Supreme Islamic Council of Halal Meat in Australia Inc
SKU Stock keeping unit
SMEs Small and medium sized enterprises
SNI Indonesian national standards
UDP United development party
VAT Value added tax
WTO World trade organisation
YOY Year on year
Bahasa Indonesia termsbakmi noodles a noodle and meat dish
halal (food) permitted to be eaten by Muslims
haram (food) not permitted to be eaten by Muslims
kaki lima lit. ‘five legs’ – a street barrow stall with 3 legs plus the operator’s 2 legs
Lebaran or Idul Fitri the Muslim celebration at the end of fasting
menggurui to give unsolicited advice / ‘preach’
perinci traditional wooden-hulled sailing ships used to service smaller ports
Ramadan a month-long Muslim fasting period, the dates for which vary
toko kelontong stalls at wet market / independent food stores
warung makan mini roadside stalls / restaurants
warung roadside stall
FOO D E XPORTER S’ GUIDE TO INDONESIAx
Chapter title
FOO D E XPORTER S’ GUIDE TO INDONESIA xi
➤ Chapter 7 discussesthe recent political andeconomic environment inIndonesia
➤ Appendix 5 providesuseful contacts andinformation sources
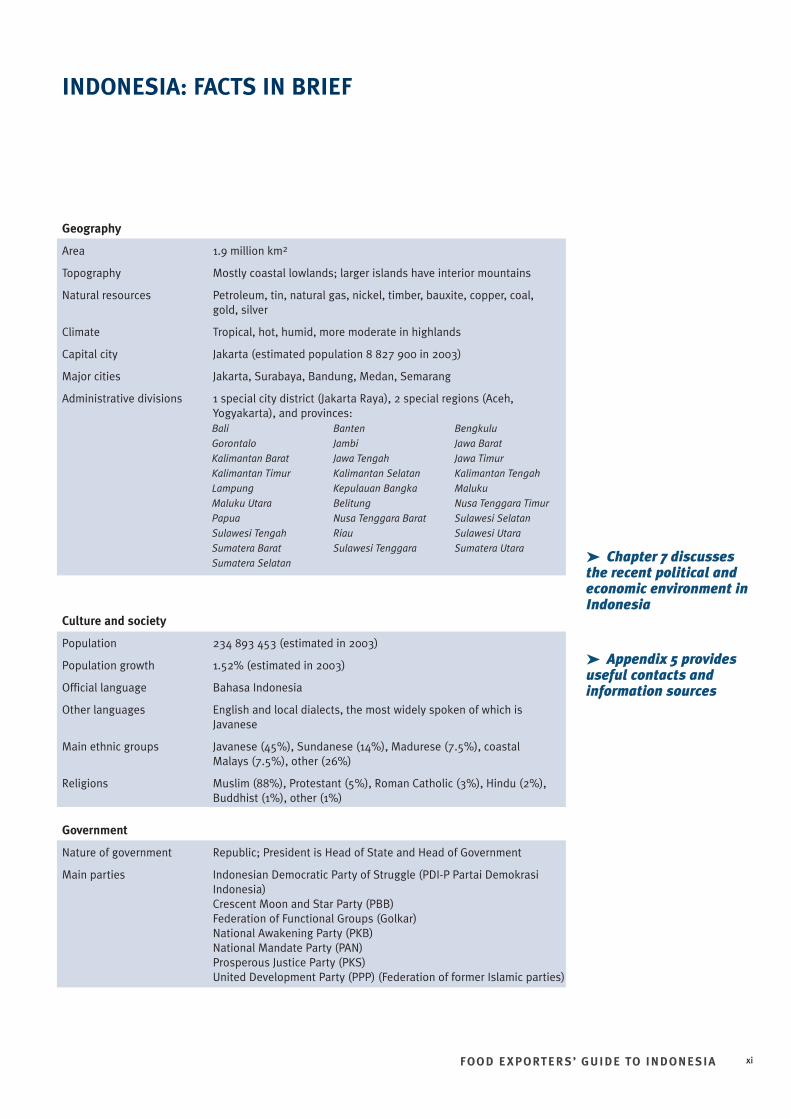
INDONESIA: FACTS IN BRIEF
Geography
Area 1.9 million km2
Topography Mostly coastal lowlands; larger islands have interior mountains
Natural resources Petroleum, tin, natural gas, nickel, timber, bauxite, copper, coal, gold, silver
Climate Tropical, hot, humid, more moderate in highlands
Capital city Jakarta (estimated population 8 827 900 in 2003)
Major cities Jakarta, Surabaya, Bandung, Medan, Semarang
Administrative divisions 1 special city district (Jakarta Raya), 2 special regions (Aceh,Yogyakarta), and provinces:
Culture and society
Population 234 893 453 (estimated in 2003)
Population growth 1.52% (estimated in 2003)
Official language Bahasa Indonesia
Other languages English and local dialects, the most widely spoken of which isJavanese
Main ethnic groups Javanese (45%), Sundanese (14%), Madurese (7.5%), coastal Malays (7.5%), other (26%)
Religions Muslim (88%), Protestant (5%), Roman Catholic (3%), Hindu (2%),Buddhist (1%), other (1%)
Government
Nature of government Republic; President is Head of State and Head of Government
Main parties Indonesian Democratic Party of Struggle (PDI-P Partai DemokrasiIndonesia) Crescent Moon and Star Party (PBB)Federation of Functional Groups (Golkar)National Awakening Party (PKB)National Mandate Party (PAN)Prosperous Justice Party (PKS)United Development Party (PPP) (Federation of former Islamic parties)
Bali GorontaloKalimantan BaratKalimantan TimurLampungMaluku UtaraPapuaSulawesi TengahSumatera BaratSumatera Selatan
BantenJambiJawa TengahKalimantan SelatanKepulauan BangkaBelitungNusa Tenggara BaratRiauSulawesi Tenggara
BengkuluJawa BaratJawa TimurKalimantan TengahMalukuNusa Tenggara TimurSulawesi SelatanSulawesi UtaraSumatera Utara
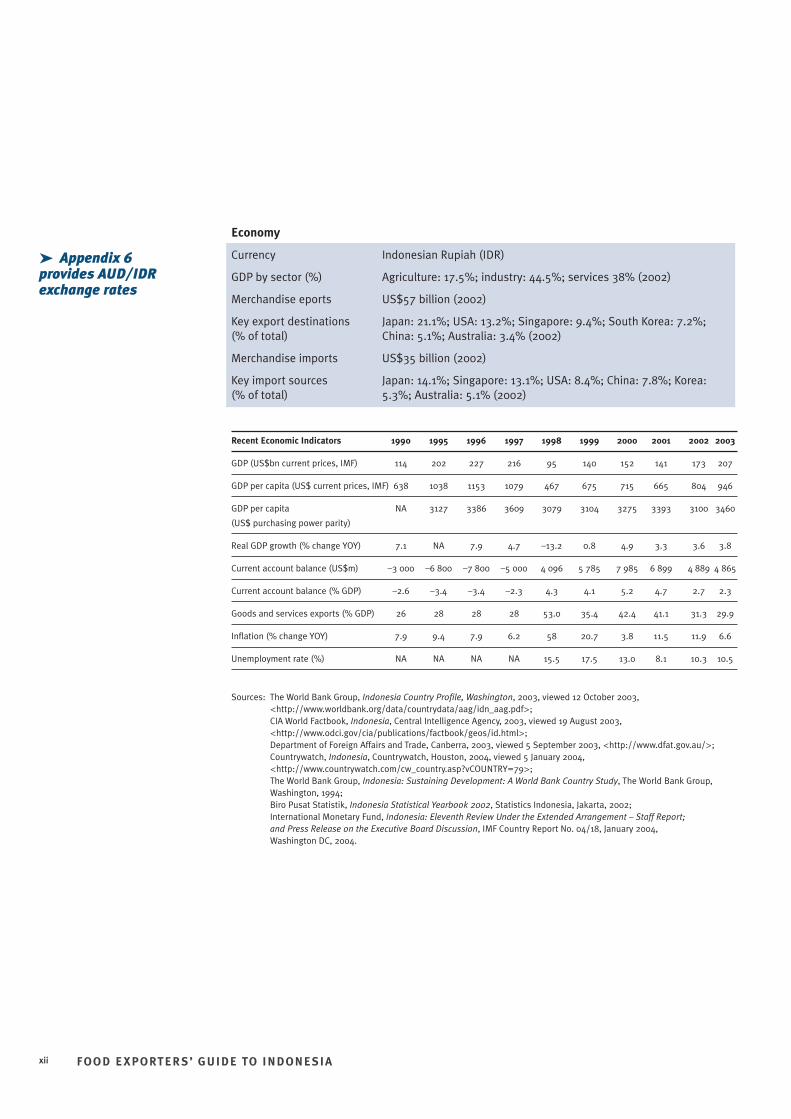
Economy
Currency Indonesian Rupiah (IDR)
GDP by sector (%) Agriculture: 17.5%; industry: 44.5%; services 38% (2002)
Merchandise eports US$57 billion (2002)
Key export destinations Japan: 21.1%; USA: 13.2%; Singapore: 9.4%; South Korea: 7.2%;(% of total) China: 5.1%; Australia: 3.4% (2002)
Merchandise imports US$35 billion (2002)
Key import sources Japan: 14.1%; Singapore: 13.1%; USA: 8.4%; China: 7.8%; Korea: (% of total) 5.3%; Australia: 5.1% (2002)
Recent Economic Indicators 1990 1995 1996 1997 1998 1999 2000 2001 2002 2003
GDP (US$bn current prices, IMF) 114 202 227 216 95 140 152 141 173 207
GDP per capita (US$ current prices, IMF) 638 1038 1153 1079 467 675 715 665 804 946
GDP per capita NA 3127 3386 3609 3079 3104 3275 3393 3100 3460
(US$ purchasing power parity)
Real GDP growth (% change YOY) 7.1 NA 7.9 4.7 –13.2 0.8 4.9 3.3 3.6 3.8
Current account balance (US$m) –3 000 –6 800 –7 800 –5 000 4 096 5 785 7 985 6 899 4 889 4 865
Current account balance (% GDP) –2.6 –3.4 –3.4 –2.3 4.3 4.1 5.2 4.7 2.7 2.3
Goods and services exports (% GDP) 26 28 28 28 53.0 35.4 42.4 41.1 31.3 29.9
Inflation (% change YOY) 7.9 9.4 7.9 6.2 58 20.7 3.8 11.5 11.9 6.6
Unemployment rate (%) NA NA NA NA 15.5 17.5 13.0 8.1 10.3 10.5
Sources: The World Bank Group, Indonesia Country Profile, Washington, 2003, viewed 12 October 2003,<http://www.worldbank.org/data/countrydata/aag/idn_aag.pdf>; CIA World Factbook, Indonesia, Central Intelligence Agency, 2003, viewed 19 August 2003,<http://www.odci.gov/cia/publications/factbook/geos/id.html>; Department of Foreign Affairs and Trade, Canberra, 2003, viewed 5 September 2003, <http://www.dfat.gov.au/>;Countrywatch, Indonesia, Countrywatch, Houston, 2004, viewed 5 January 2004,<http://www.countrywatch.com/cw_country.asp?vCOUNTRY=79>; The World Bank Group, Indonesia: Sustaining Development: A World Bank Country Study, The World Bank Group,Washington, 1994; Biro Pusat Statistik, Indonesia Statistical Yearbook 2002, Statistics Indonesia, Jakarta, 2002; International Monetary Fund, Indonesia: Eleventh Review Under the Extended Arrangement – Staff Report; and Press Release on the Executive Board Discussion, IMF Country Report No. 04/18, January 2004, Washington DC, 2004.
FOO D E XPORTER S’ GUIDE TO INDONESIAxii
➤ Appendix 6provides AUD/IDRexchange rates
Chapter title
1. INTRODUCTION
INTRODUCTION
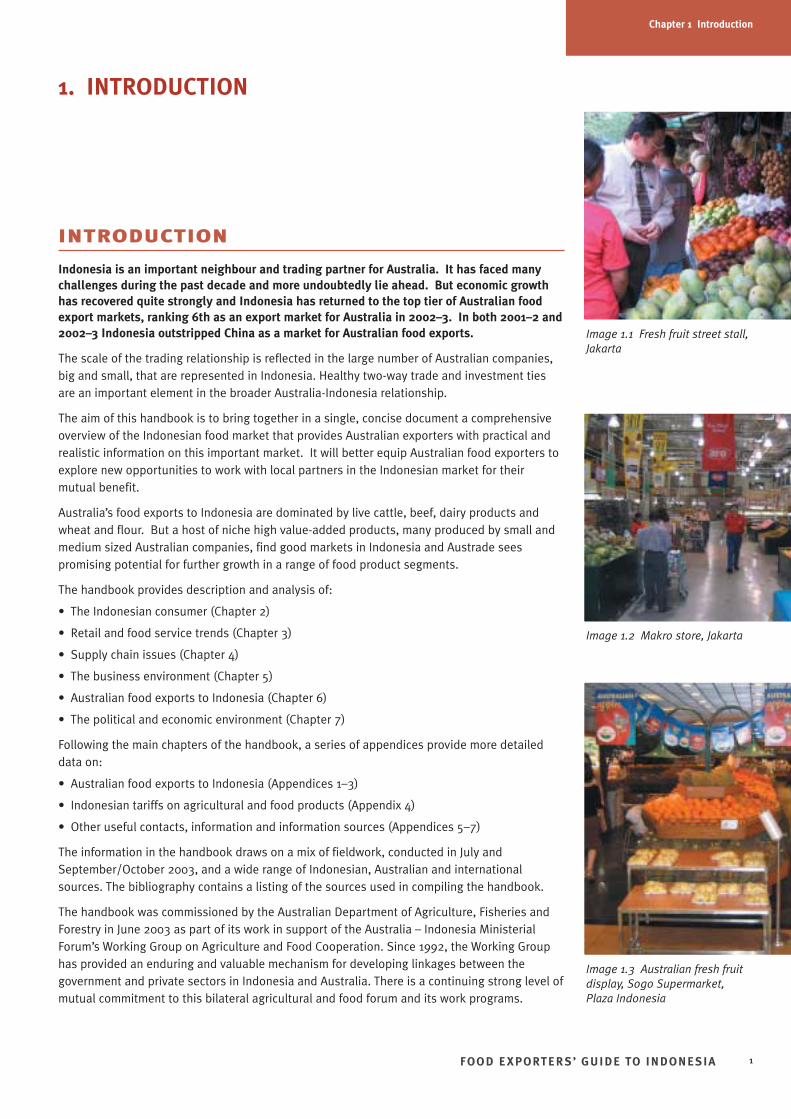
Indonesia is an important neighbour and trading partner for Australia. It has faced manychallenges during the past decade and more undoubtedly lie ahead. But economic growthhas recovered quite strongly and Indonesia has returned to the top tier of Australian foodexport markets, ranking 6th as an export market for Australia in 2002–3. In both 2001–2 and2002–3 Indonesia outstripped China as a market for Australian food exports.
The scale of the trading relationship is reflected in the large number of Australian companies,big and small, that are represented in Indonesia. Healthy two-way trade and investment tiesare an important element in the broader Australia-Indonesia relationship.
The aim of this handbook is to bring together in a single, concise document a comprehensiveoverview of the Indonesian food market that provides Australian exporters with practical andrealistic information on this important market. It will better equip Australian food exporters toexplore new opportunities to work with local partners in the Indonesian market for theirmutual benefit.
Australia’s food exports to Indonesia are dominated by live cattle, beef, dairy products andwheat and flour. But a host of niche high value-added products, many produced by small andmedium sized Australian companies, find good markets in Indonesia and Austrade seespromising potential for further growth in a range of food product segments.
The handbook provides description and analysis of:
• The Indonesian consumer (Chapter 2)
• Retail and food service trends (Chapter 3)
• Supply chain issues (Chapter 4)
• The business environment (Chapter 5)
• Australian food exports to Indonesia (Chapter 6)
• The political and economic environment (Chapter 7)
Following the main chapters of the handbook, a series of appendices provide more detaileddata on:
• Australian food exports to Indonesia (Appendices 1–3)
• Indonesian tariffs on agricultural and food products (Appendix 4)
• Other useful contacts, information and information sources (Appendices 5–7)
The information in the handbook draws on a mix of fieldwork, conducted in July andSeptember/October 2003, and a wide range of Indonesian, Australian and internationalsources. The bibliography contains a listing of the sources used in compiling the handbook.
The handbook was commissioned by the Australian Department of Agriculture, Fisheries andForestry in June 2003 as part of its work in support of the Australia – Indonesia MinisterialForum’s Working Group on Agriculture and Food Cooperation. Since 1992, the Working Grouphas provided an enduring and valuable mechanism for developing linkages between thegovernment and private sectors in Indonesia and Australia. There is a continuing strong level ofmutual commitment to this bilateral agricultural and food forum and its work programs.
FOO D E XPORTER S’ GUIDE TO INDONESIA 1
Chapter 1 Introduction
Image 1.2 Makro store, Jakarta
Image 1.1 Fresh fruit street stall,Jakarta
Image 1.3 Australian fresh fruitdisplay, Sogo Supermarket,Plaza Indonesia

FOO D E XPORTER S’ GUIDE TO INDONESIA2
Chapter 1 Introduction
2. INDONESIAN CONSUMERS
Overview• Indonesia has a young and increasing population. Half of the population is under 25 and
30% are under 14. Purchasing power has recovered in recent years as solid economicgrowth has been restored.
• The country is urbanising rapidly, which is leading to mixing and melding of many traditions.It is also exposing consumers to international tastes and trends.
• In 2003, households with average monthly spending over Rp1 250 000 (approx.A$200/month) accounted for 12% of households nationally and 26% of households inJakarta.
• At lower incomes, typical diets include rice with some modest garnishing and vegetables.Moderately higher incomes permit a more varied diet with a significantly higher share ofspending on fish, meat, eggs, dairy and fruit. Spending on prepared foods rises rapidly with income.
• Urban Indonesians have traditionally eaten out a lot. Their spending on convenience foodsis also rising strongly.
• Almost 90% of Indonesians are Muslim. Most observe Islamic dietary laws.
• Although the Indonesian economy is recovering and growing steadily, the Asian economiccrisis has left consumers with a stronger focus on value for money.
• Looking to the future, and assuming moderate economic growth, per capita consumption of temperate fruit, poultry, beef, other meat, baked products and dairy goods will grow most rapidly. Consumption of cereals will grow slowly, except for wheat (and flour-basedproducts).
• Packaged goods likely to enjoy strong growth include baby food and confectionery. Sales of frozen and chilled foods as well as ready to eat meals will also grow, although off a low base.
Basic indicatorsIndonesia is multi-ethnic with many languages and cultures, wide regional differences and fast-changing political and economic circumstances. However, modernisation is bringing thelifestyles of Indonesian urban consumers across the country closer together.
Internationalisation is also creating some similarities between consumption patterns inIndonesia and countries like Australia, although many big differences remain. Indonesia’sdiversity means that its people’s eating habits defy any neat categorisation except in suchobvious respects as the fact that Muslims generally adhere strictly to halal food rules.
While tradition exists and is important in Indonesia, its society is mobile both vertically andlaterally. People move around the country and up and down the social ladder. Jakarta, thebiggest single market, has people from every ethnic group in Indonesia. In this sense it is agood market to learn in.
Age
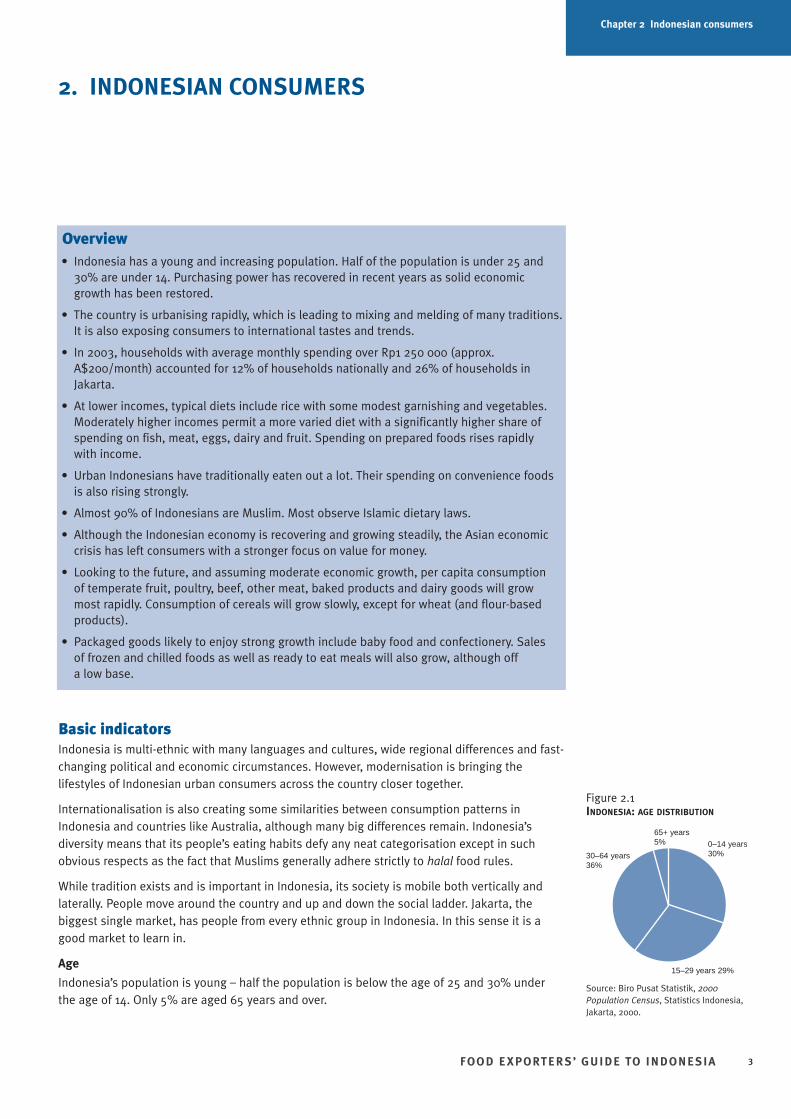
Indonesia’s population is young – half the population is below the age of 25 and 30% underthe age of 14. Only 5% are aged 65 years and over.
FOO D E XPORTER S’ GUIDE TO INDONESIA 3
Chapter 2 Indonesian consumers
Figure 2.1INDONESIA: AGE DISTRIBUTION
Source: Biro Pusat Statistik, 2000Population Census, Statistics Indonesia,Jakarta, 2000.
0–14 years30%
65+ years5%
15–29 years 29%
30–64 years36%
Chapter 2 Indonesian consumers
Distribution of population
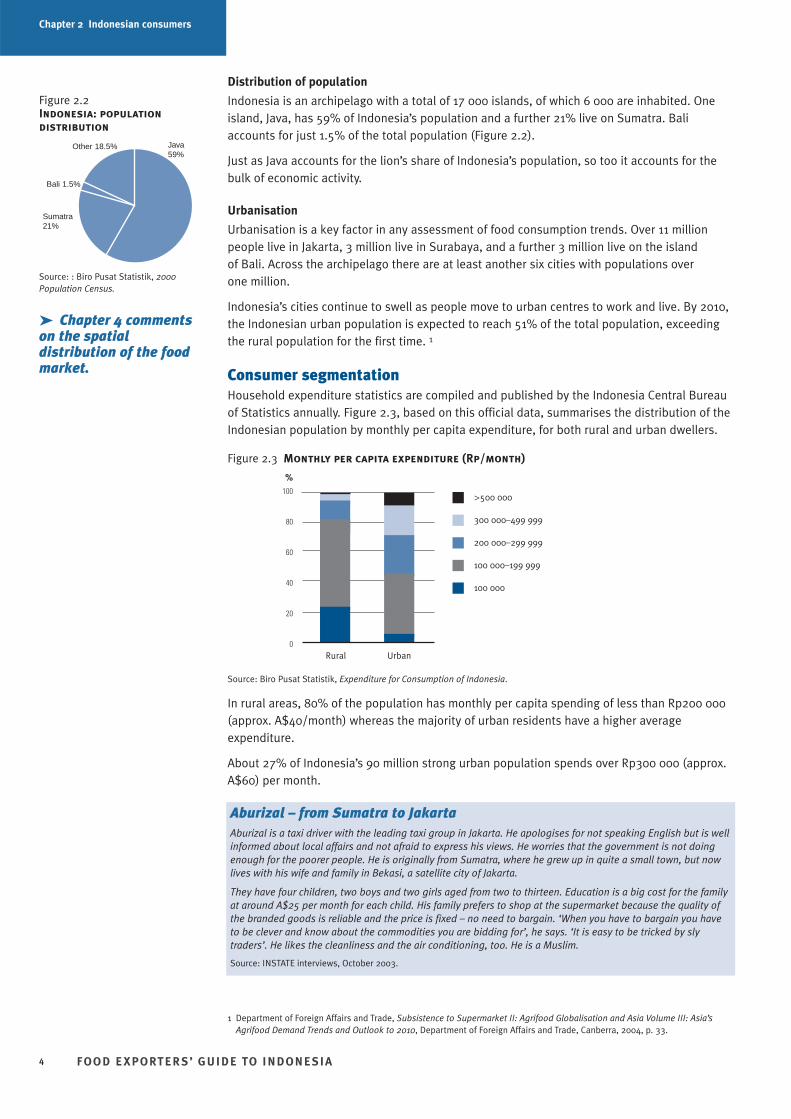
Indonesia is an archipelago with a total of 17 000 islands, of which 6 000 are inhabited. Oneisland, Java, has 59% of Indonesia’s population and a further 21% live on Sumatra. Baliaccounts for just 1.5% of the total population (Figure 2.2).
Just as Java accounts for the lion’s share of Indonesia’s population, so too it accounts for thebulk of economic activity.
Urbanisation
Urbanisation is a key factor in any assessment of food consumption trends. Over 11 millionpeople live in Jakarta, 3 million live in Surabaya, and a further 3 million live on the island of Bali. Across the archipelago there are at least another six cities with populations over one million.
Indonesia’s cities continue to swell as people move to urban centres to work and live. By 2010,the Indonesian urban population is expected to reach 51% of the total population, exceedingthe rural population for the first time. 1
Consumer segmentationHousehold expenditure statistics are compiled and published by the Indonesia Central Bureauof Statistics annually. Figure 2.3, based on this official data, summarises the distribution of theIndonesian population by monthly per capita expenditure, for both rural and urban dwellers.
Figure 2.3 Monthly per capita expenditure (Rp/month)
Source: Biro Pusat Statistik, Expenditure for Consumption of Indonesia.
In rural areas, 80% of the population has monthly per capita spending of less than Rp200 000(approx. A$40/month) whereas the majority of urban residents have a higher averageexpenditure.
About 27% of Indonesia’s 90 million strong urban population spends over Rp300 000 (approx.A$60) per month.
FOO D E XPORTER S’ GUIDE TO INDONESIA4
Aburizal – from Sumatra to JakartaAburizal is a taxi driver with the leading taxi group in Jakarta. He apologises for not speaking English but is wellinformed about local affairs and not afraid to express his views. He worries that the government is not doingenough for the poorer people. He is originally from Sumatra, where he grew up in quite a small town, but nowlives with his wife and family in Bekasi, a satellite city of Jakarta.
They have four children, two boys and two girls aged from two to thirteen. Education is a big cost for the familyat around A$25 per month for each child. His family prefers to shop at the supermarket because the quality ofthe branded goods is reliable and the price is fixed – no need to bargain. ‘When you have to bargain you haveto be clever and know about the commodities you are bidding for’, he says. ‘It is easy to be tricked by slytraders’. He likes the cleanliness and the air conditioning, too. He is a Muslim.
Source: INSTATE interviews, October 2003.
Figure 2.2Indonesia: populationdistribution
Source: : Biro Pusat Statistik, 2000Population Census.
%100
80
60
40
20
0UrbanRural
>500 000
300 000–499 999
200 000–299 999
100 000–199 999
100 000
Java59%
Other 18.5%
Sumatra21%
Bali 1.5%
1 Department of Foreign Affairs and Trade, Subsistence to Supermarket II: Agrifood Globalisation and Asia Volume III: Asia’sAgrifood Demand Trends and Outlook to 2010, Department of Foreign Affairs and Trade, Canberra, 2004, p. 33.
➤ Chapter 4 commentson the spatialdistribution of the foodmarket.
Chapter 2 Indonesian consumers
Urbanisation and the rise in income associated with this transition is leading to lifestylechanges that are influencing consumer purchases and food and entertainment choices.
Households are shrinking due to the smaller number of children per family as well as the trendaway from extended families. Today, meals in urban families are more likely to include justparents and children rather than a larger extended family. Single and married women areworking more, leaving less time for shopping and cooking. This drives convenience shoppingand eating.
Urban – rural differences
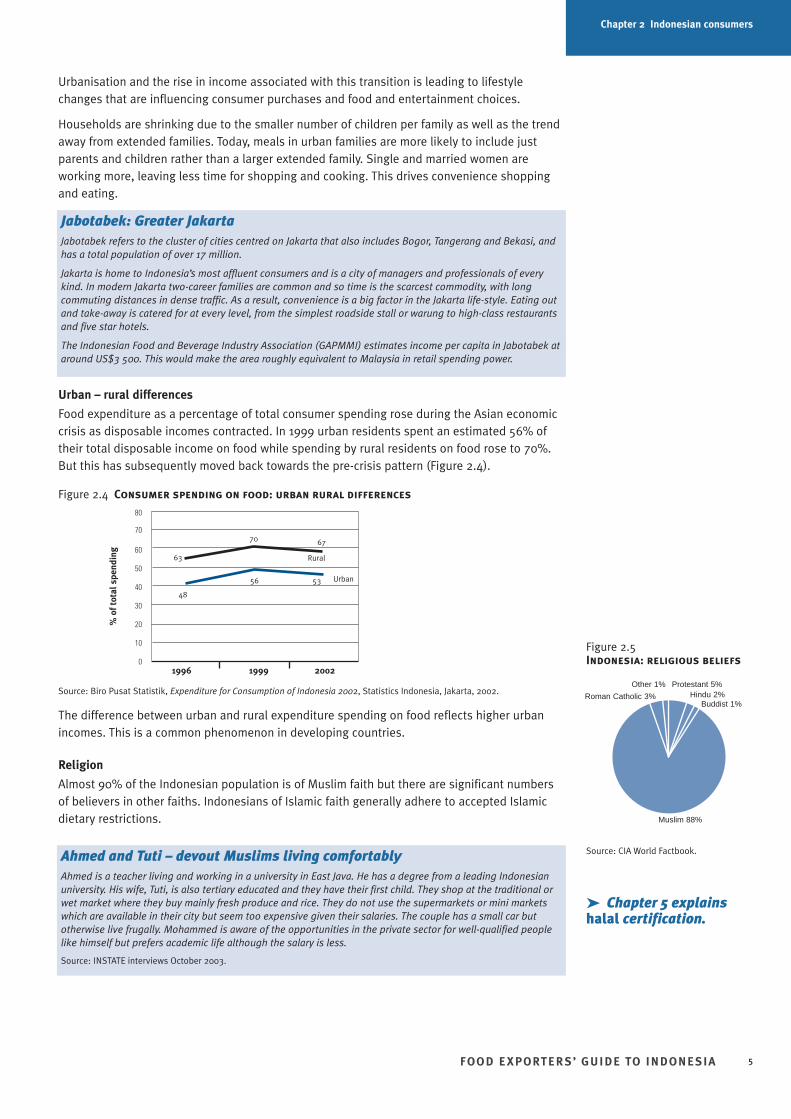
Food expenditure as a percentage of total consumer spending rose during the Asian economiccrisis as disposable incomes contracted. In 1999 urban residents spent an estimated 56% oftheir total disposable income on food while spending by rural residents on food rose to 70%.But this has subsequently moved back towards the pre-crisis pattern (Figure 2.4).
Figure 2.4 Consumer spending on food: urban rural differences
Source: Biro Pusat Statistik, Expenditure for Consumption of Indonesia 2002, Statistics Indonesia, Jakarta, 2002.
The difference between urban and rural expenditure spending on food reflects higher urbanincomes. This is a common phenomenon in developing countries.
Religion
Almost 90% of the Indonesian population is of Muslim faith but there are significant numbersof believers in other faiths. Indonesians of Islamic faith generally adhere to accepted Islamicdietary restrictions.
FOO D E XPORTER S’ GUIDE TO INDONESIA 5
Jabotabek: Greater JakartaJabotabek refers to the cluster of cities centred on Jakarta that also includes Bogor, Tangerang and Bekasi, andhas a total population of over 17 million.
Jakarta is home to Indonesia’s most affluent consumers and is a city of managers and professionals of everykind. In modern Jakarta two-career families are common and so time is the scarcest commodity, with longcommuting distances in dense traffic. As a result, convenience is a big factor in the Jakarta life-style. Eating outand take-away is catered for at every level, from the simplest roadside stall or warung to high-class restaurantsand five star hotels.
The Indonesian Food and Beverage Industry Association (GAPMMI) estimates income per capita in Jabotabek ataround US$3 500. This would make the area roughly equivalent to Malaysia in retail spending power.
➤ Chapter 5 explainshalal certification.
Figure 2.5Indonesia: religious beliefs
Source: CIA World Factbook.
Buddist 1%
Protestant 5%
Muslim 88%
Hindu 2%Other 1%
80
70
60
50
40
30
20
10
01996 1999 2002
Urban
Rural63
% o
f tot
al s
pend
ing
48
56
70 67
53
Ahmed and Tuti – devout Muslims living comfortablyAhmed is a teacher living and working in a university in East Java. He has a degree from a leading Indonesianuniversity. His wife, Tuti, is also tertiary educated and they have their first child. They shop at the traditional orwet market where they buy mainly fresh produce and rice. They do not use the supermarkets or mini marketswhich are available in their city but seem too expensive given their salaries. The couple has a small car butotherwise live frugally. Mohammed is aware of the opportunities in the private sector for well-qualified peoplelike himself but prefers academic life although the salary is less.
Source: INSTATE interviews October 2003.
Roman Catholic 3%
Indonesians of Hindu belief do not follow a central set of dietary rules, but devout Hindus arelacto-vegetarian. That is, they consume no red meat, especially not pork or beef, and onlyconsume milk-related livestock products, such as milk, curd, cheese and yoghurt. SomeIndonesian Hindus do eat poultry and fish. 2
The peak business periods for the food industry are during the religious holiday periods whenconsumer spending increases, driving up demand for basics such as flour, sugar, eggs, freshand dried fruits, poultry and meat, and luxury and snack items such as cheese, cakes, cookiesand pastries. The most important holiday periods are:
• Ramadan – the month-long Muslim fasting period in which, surprisingly, food consumptiongoes up significantly
• Lebaran (also known as Idul Fitri) – the celebration of the end of Ramadan
• Chinese New Year.
Stores also take advantage of the Christmas season and decorate and promote festive foodssuch as special fruits, sweets and pastries. Western celebrations, such as Valentine’s Day, havealso become trendy among upper-level restaurants in Indonesia. 3
GDP growth
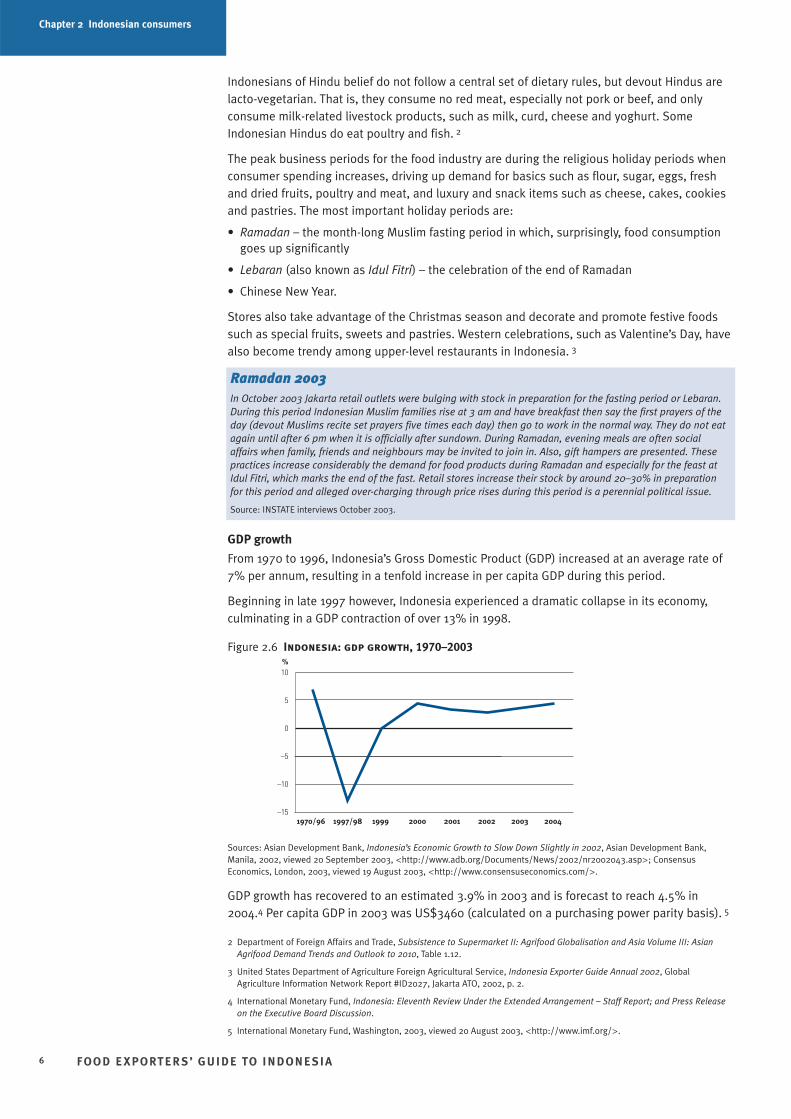
From 1970 to 1996, Indonesia’s Gross Domestic Product (GDP) increased at an average rate of7% per annum, resulting in a tenfold increase in per capita GDP during this period.
Beginning in late 1997 however, Indonesia experienced a dramatic collapse in its economy,culminating in a GDP contraction of over 13% in 1998.
Figure 2.6 Indonesia: gdp growth, 1970–2003
Sources: Asian Development Bank, Indonesia’s Economic Growth to Slow Down Slightly in 2002, Asian Development Bank,Manila, 2002, viewed 20 September 2003, <http://www.adb.org/Documents/News/2002/nr2002043.asp>; ConsensusEconomics, London, 2003, viewed 19 August 2003, <http://www.consensuseconomics.com/>.
GDP growth has recovered to an estimated 3.9% in 2003 and is forecast to reach 4.5% in2004.4 Per capita GDP in 2003 was US$3460 (calculated on a purchasing power parity basis). 5
FOO D E XPORTER S’ GUIDE TO INDONESIA6
Chapter 2 Indonesian consumers
2 Department of Foreign Affairs and Trade, Subsistence to Supermarket II: Agrifood Globalisation and Asia Volume III: AsianAgrifood Demand Trends and Outlook to 2010, Table 1.12.
3 United States Department of Agriculture Foreign Agricultural Service, Indonesia Exporter Guide Annual 2002, GlobalAgriculture Information Network Report #ID2027, Jakarta ATO, 2002, p. 2.
4 International Monetary Fund, Indonesia: Eleventh Review Under the Extended Arrangement – Staff Report; and Press Releaseon the Executive Board Discussion.
5 International Monetary Fund, Washington, 2003, viewed 20 August 2003, <http://www.imf.org/>.
Ramadan 2003In October 2003 Jakarta retail outlets were bulging with stock in preparation for the fasting period or Lebaran.During this period Indonesian Muslim families rise at 3 am and have breakfast then say the first prayers of theday (devout Muslims recite set prayers five times each day) then go to work in the normal way. They do not eatagain until after 6 pm when it is officially after sundown. During Ramadan, evening meals are often socialaffairs when family, friends and neighbours may be invited to join in. Also, gift hampers are presented. Thesepractices increase considerably the demand for food products during Ramadan and especially for the feast atIdul Fitri, which marks the end of the fast. Retail stores increase their stock by around 20–30% in preparationfor this period and alleged over-charging through price rises during this period is a perennial political issue.
Source: INSTATE interviews October 2003.
%10
5
0
–5
–10
–151970/96 1997/98 1999 2000 2001 2002 2003 2004
AC Nielsen conducts its own proprietary research on household expenditure in Indonesia’smain cities and produces figures based on the following categories, which retailers refer towhen discussing the segmentation of their customers. *
For 2003/2004 Nielsen Media Research classifies monthly household expenditure as set out inTable 2.1.
Table 2.1 Demographic segments
Segment Monthly household expenditure
A1 Rp2 250 001 above
A2 Rp1 750 001 – Rp2 250 000
B Rp1 250 001 – Rp1 750 000
C1 Rp800 001 – Rp1 250 000
C2 Rp600 001 – Rp800 000
D Rp400 001 – Rp600 000
E Rp400 000 below
Source: AC Nielsen, AC Nielsen SES Data, 2003.
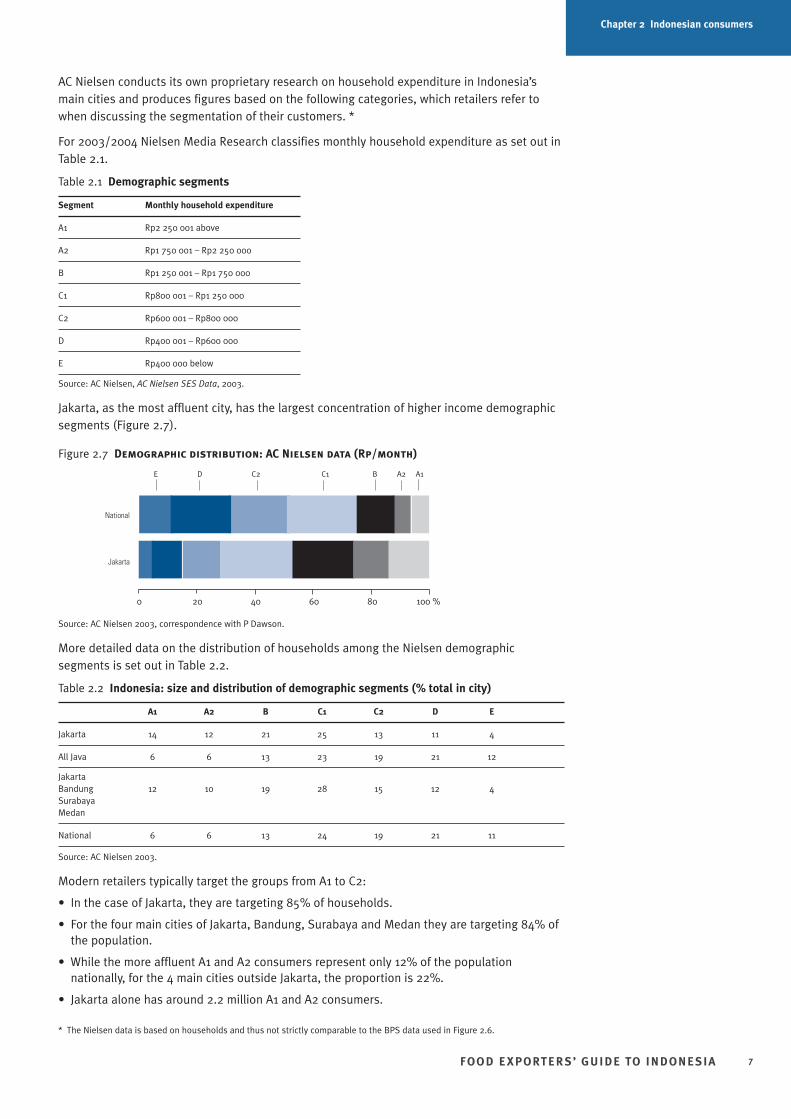
Jakarta, as the most affluent city, has the largest concentration of higher income demographicsegments (Figure 2.7).
Figure 2.7 Demographic distribution: AC Nielsen data (Rp/month)
Source: AC Nielsen 2003, correspondence with P Dawson.
More detailed data on the distribution of households among the Nielsen demographicsegments is set out in Table 2.2.
Table 2.2 Indonesia: size and distribution of demographic segments (% total in city)
A1 A2 B C1 C2 D E
Jakarta 14 12 21 25 13 11 4
All Java 6 6 13 23 19 21 12
JakartaBandung 12 10 19 28 15 12 4SurabayaMedan
National 6 6 13 24 19 21 11
Source: AC Nielsen 2003.
Modern retailers typically target the groups from A1 to C2:
• In the case of Jakarta, they are targeting 85% of households.
• For the four main cities of Jakarta, Bandung, Surabaya and Medan they are targeting 84% ofthe population.
• While the more affluent A1 and A2 consumers represent only 12% of the populationnationally, for the 4 main cities outside Jakarta, the proportion is 22%.
• Jakarta alone has around 2.2 million A1 and A2 consumers.
FOO D E XPORTER S’ GUIDE TO INDONESIA 7
Chapter 2 Indonesian consumers
E D C2 C1 B A2 A1
0 20 40 60 80 100 %
National
Jakarta
* The Nielsen data is based on households and thus not strictly comparable to the BPS data used in Figure 2.6.
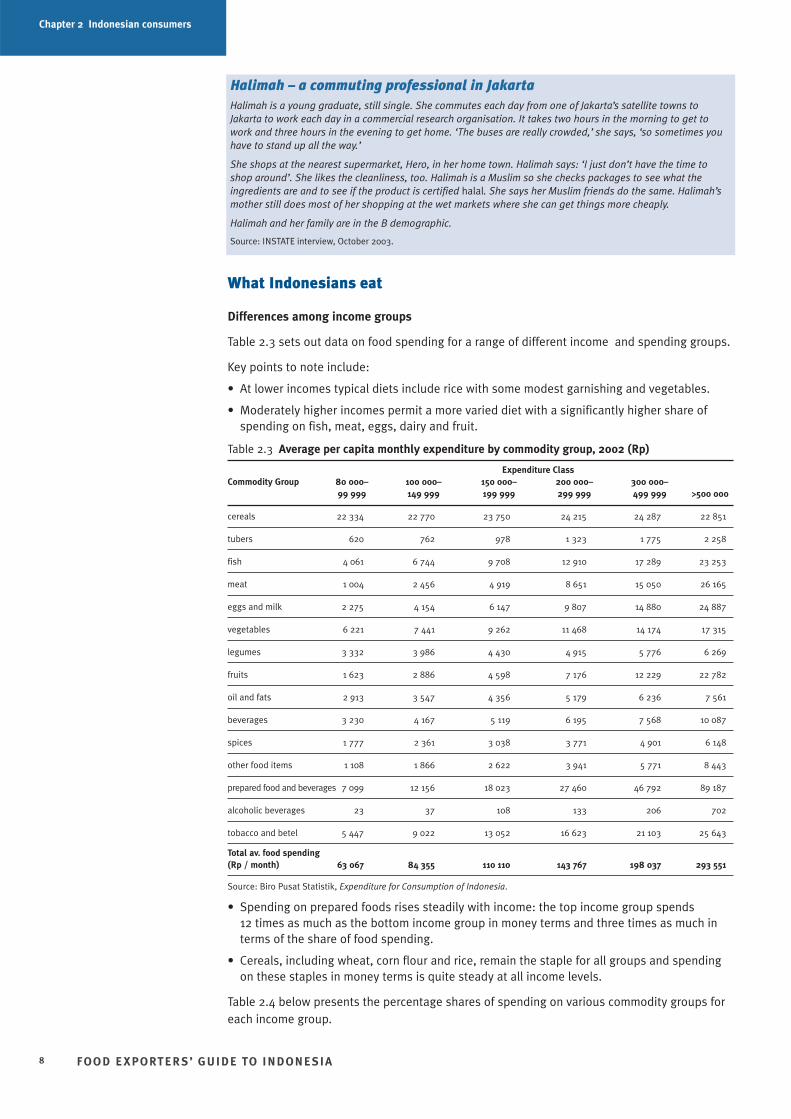
What Indonesians eat
Differences among income groups
Table 2.3 sets out data on food spending for a range of different income and spending groups.
Key points to note include:
• At lower incomes typical diets include rice with some modest garnishing and vegetables.
• Moderately higher incomes permit a more varied diet with a significantly higher share ofspending on fish, meat, eggs, dairy and fruit.
Table 2.3 Average per capita monthly expenditure by commodity group, 2002 (Rp)
Expenditure ClassCommodity Group 80 000– 100 000– 150 000– 200 000– 300 000–
99 999 149 999 199 999 299 999 499 999 >500 000
cereals 22 334 22 770 23 750 24 215 24 287 22 851
tubers 620 762 978 1 323 1 775 2 258
fish 4 061 6 744 9 708 12 910 17 289 23 253
meat 1 004 2 456 4 919 8 651 15 050 26 165
eggs and milk 2 275 4 154 6 147 9 807 14 880 24 887
vegetables 6 221 7 441 9 262 11 468 14 174 17 315
legumes 3 332 3 986 4 430 4 915 5 776 6 269
fruits 1 623 2 886 4 598 7 176 12 229 22 782
oil and fats 2 913 3 547 4 356 5 179 6 236 7 561
beverages 3 230 4 167 5 119 6 195 7 568 10 087
spices 1 777 2 361 3 038 3 771 4 901 6 148
other food items 1 108 1 866 2 622 3 941 5 771 8 443
prepared food and beverages 7 099 12 156 18 023 27 460 46 792 89 187
alcoholic beverages 23 37 108 133 206 702
tobacco and betel 5 447 9 022 13 052 16 623 21 103 25 643
Total av. food spending (Rp / month) 63 067 84 355 110 110 143 767 198 037 293 551
Source: Biro Pusat Statistik, Expenditure for Consumption of Indonesia.
• Spending on prepared foods rises steadily with income: the top income group spends 12 times as much as the bottom income group in money terms and three times as much interms of the share of food spending.
• Cereals, including wheat, corn flour and rice, remain the staple for all groups and spendingon these staples in money terms is quite steady at all income levels.
Table 2.4 below presents the percentage shares of spending on various commodity groups foreach income group.
FOO D E XPORTER S’ GUIDE TO INDONESIA8
Chapter 2 Indonesian consumers
Halimah – a commuting professional in JakartaHalimah is a young graduate, still single. She commutes each day from one of Jakarta’s satellite towns toJakarta to work each day in a commercial research organisation. It takes two hours in the morning to get towork and three hours in the evening to get home. ‘The buses are really crowded,’ she says, ‘so sometimes youhave to stand up all the way.’
She shops at the nearest supermarket, Hero, in her home town. Halimah says: ‘I just don’t have the time toshop around’. She likes the cleanliness, too. Halimah is a Muslim so she checks packages to see what theingredients are and to see if the product is certified halal. She says her Muslim friends do the same. Halimah’smother still does most of her shopping at the wet markets where she can get things more cheaply.
Halimah and her family are in the B demographic.
Source: INSTATE interview, October 2003.
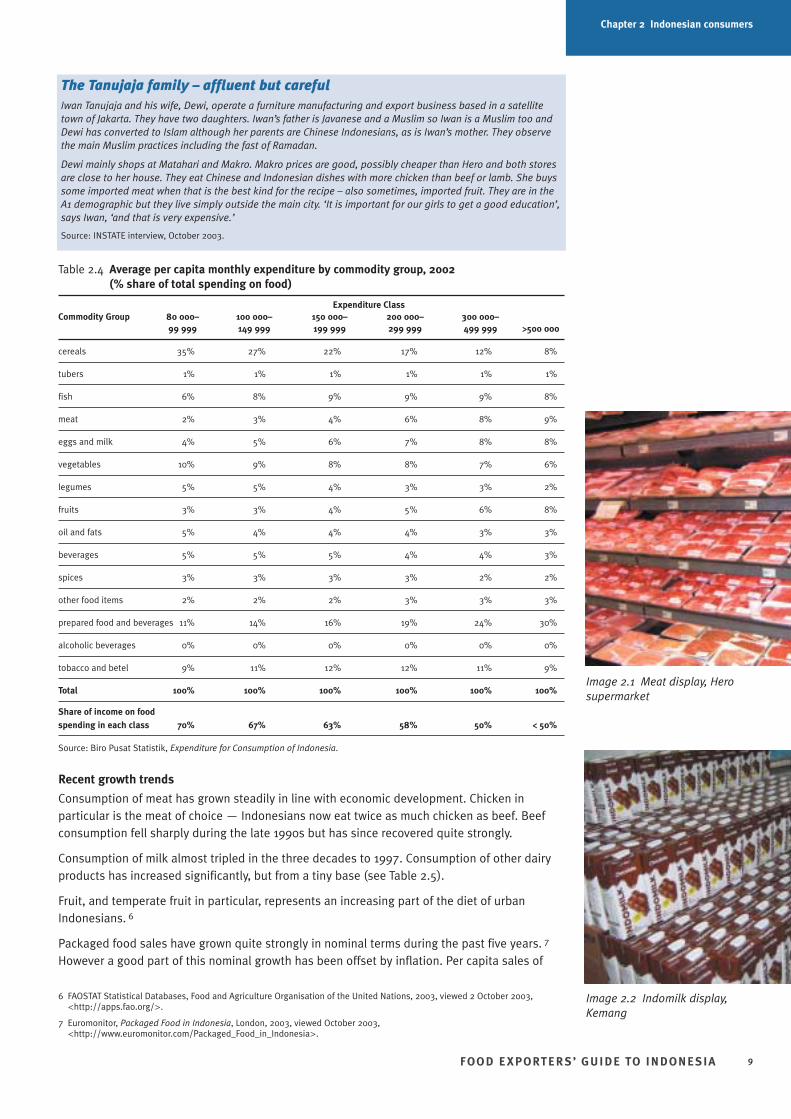
Table 2.4 Average per capita monthly expenditure by commodity group, 2002 (% share of total spending on food)
Expenditure ClassCommodity Group 80 000– 100 000– 150 000– 200 000– 300 000–
99 999 149 999 199 999 299 999 499 999 >500 000
cereals 35% 27% 22% 17% 12% 8%
tubers 1% 1% 1% 1% 1% 1%
fish 6% 8% 9% 9% 9% 8%
meat 2% 3% 4% 6% 8% 9%
eggs and milk 4% 5% 6% 7% 8% 8%
vegetables 10% 9% 8% 8% 7% 6%
legumes 5% 5% 4% 3% 3% 2%
fruits 3% 3% 4% 5% 6% 8%
oil and fats 5% 4% 4% 4% 3% 3%
beverages 5% 5% 5% 4% 4% 3%
spices 3% 3% 3% 3% 2% 2%
other food items 2% 2% 2% 3% 3% 3%
prepared food and beverages 11% 14% 16% 19% 24% 30%
alcoholic beverages 0% 0% 0% 0% 0% 0%
tobacco and betel 9% 11% 12% 12% 11% 9%
Total 100% 100% 100% 100% 100% 100%
Share of income on food spending in each class 70% 67% 63% 58% 50% < 50%
Source: Biro Pusat Statistik, Expenditure for Consumption of Indonesia.
Recent growth trends
Consumption of meat has grown steadily in line with economic development. Chicken inparticular is the meat of choice — Indonesians now eat twice as much chicken as beef. Beefconsumption fell sharply during the late 1990s but has since recovered quite strongly.
Consumption of milk almost tripled in the three decades to 1997. Consumption of other dairyproducts has increased significantly, but from a tiny base (see Table 2.5).
Fruit, and temperate fruit in particular, represents an increasing part of the diet of urbanIndonesians. 6
Packaged food sales have grown quite strongly in nominal terms during the past five years. 7
However a good part of this nominal growth has been offset by inflation. Per capita sales of
FOO D E XPORTER S’ GUIDE TO INDONESIA 9
Chapter 2 Indonesian consumers
The Tanujaja family – affluent but careful Iwan Tanujaja and his wife, Dewi, operate a furniture manufacturing and export business based in a satellitetown of Jakarta. They have two daughters. Iwan’s father is Javanese and a Muslim so Iwan is a Muslim too andDewi has converted to Islam although her parents are Chinese Indonesians, as is Iwan’s mother. They observethe main Muslim practices including the fast of Ramadan.
Dewi mainly shops at Matahari and Makro. Makro prices are good, possibly cheaper than Hero and both storesare close to her house. They eat Chinese and Indonesian dishes with more chicken than beef or lamb. She buyssome imported meat when that is the best kind for the recipe – also sometimes, imported fruit. They are in theA1 demographic but they live simply outside the main city. ‘It is important for our girls to get a good education’,says Iwan, ‘and that is very expensive.’
Source: INSTATE interview, October 2003.
Image 2.1 Meat display, Herosupermarket
Image 2.2 Indomilk display,Kemang
6 FAOSTAT Statistical Databases, Food and Agriculture Organisation of the United Nations, 2003, viewed 2 October 2003,<http://apps.fao.org/>.
7 Euromonitor, Packaged Food in Indonesia, London, 2003, viewed October 2003,<http://www.euromonitor.com/Packaged_Food_in_Indonesia>.
Chapter 2 Indonesian consumers
packaged food in 2002 were estimated at US$29, just over 10% the level of nearby Singapore.That said, packaged food sales are growing very rapidly. Between 1998 and 2002, sales ofbakery products grew by 31% in value terms (32% in volume terms). Other fast-growingcategories during that time included:
• packaged noodles: sales up 31% (39% volume growth).
• confectionery: sales up 83% (36% volume growth).
• savoury snacks: sales up 88% (42% volume growth).
• oils and fats: sales up 21% (39% volume growth).
Smaller categories that have grown strongly include:
• baby food: sales up 90% (50% volume growth).
• ice-cream: sales up 70% (22% volume growth).
• ready-to-eat meals: sales up 37% (36 volume growth).
Convenience foods
Indonesian consumers are increasingly purchasing convenience food. More urban women areentering the workforce and working after marriage and having children. With less timeavailable for shopping and cooking, they have a growing focus on convenience.
More generally, the rising pace of modern life in urban centres is driving up demand for ready-to-cook / ready-to-eat food, and Indonesians returning from study or work abroad are alsoimporting the tendency to eat on-the-run. The increase in sales of prepared foods evident inTables 2.3 and 2.4 above illustrates this fast growing trend.
The trend towards convenience foods is also consistent with the traditional Indonesian love ofsnacking. Markets and shops offer a wide range of snacks, such as fried, baked and sweetfoods, including many traditional cakes and jellies.
Eating out
The number of household appliances in Indonesia for cooking is low. For example, in thecapital city of Jakarta, only an estimated 43% of households have a refrigerator, 27% have agas stove and 10% have a microwave oven. 8 So Indonesians eat a lot away from home.
FOO D E XPORTER S’ GUIDE TO INDONESIA10
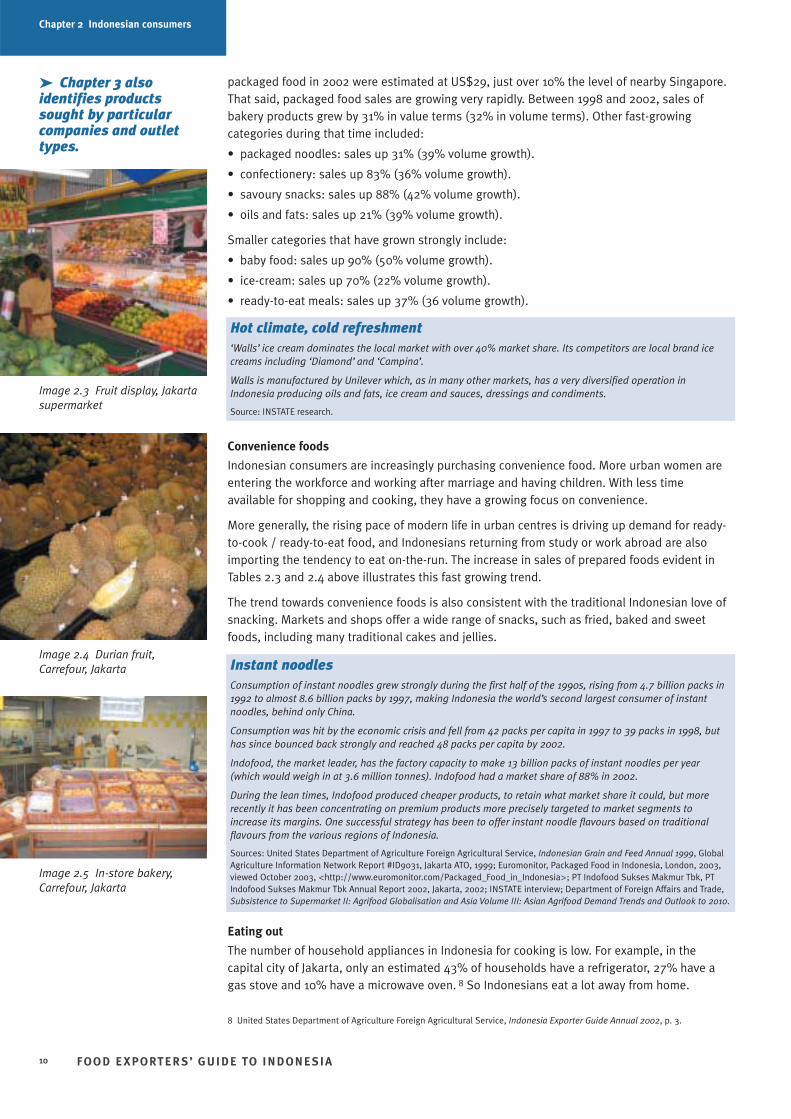
Image 2.4 Durian fruit,Carrefour, Jakarta
Image 2.3 Fruit display, Jakartasupermarket
Image 2.5 In-store bakery,Carrefour, Jakarta
Hot climate, cold refreshment‘Walls’ ice cream dominates the local market with over 40% market share. Its competitors are local brand icecreams including ‘Diamond’ and ‘Campina’.
Walls is manufactured by Unilever which, as in many other markets, has a very diversified operation inIndonesia producing oils and fats, ice cream and sauces, dressings and condiments.
Source: INSTATE research.
Instant noodlesConsumption of instant noodles grew strongly during the first half of the 1990s, rising from 4.7 billion packs in1992 to almost 8.6 billion packs by 1997, making Indonesia the world’s second largest consumer of instantnoodles, behind only China.
Consumption was hit by the economic crisis and fell from 42 packs per capita in 1997 to 39 packs in 1998, buthas since bounced back strongly and reached 48 packs per capita by 2002.
Indofood, the market leader, has the factory capacity to make 13 billion packs of instant noodles per year(which would weigh in at 3.6 million tonnes). Indofood had a market share of 88% in 2002.
During the lean times, Indofood produced cheaper products, to retain what market share it could, but morerecently it has been concentrating on premium products more precisely targeted to market segments toincrease its margins. One successful strategy has been to offer instant noodle flavours based on traditionalflavours from the various regions of Indonesia.
Sources: United States Department of Agriculture Foreign Agricultural Service, Indonesian Grain and Feed Annual 1999, GlobalAgriculture Information Network Report #ID9031, Jakarta ATO, 1999; Euromonitor, Packaged Food in Indonesia, London, 2003,viewed October 2003, <http://www.euromonitor.com/Packaged_Food_in_Indonesia>; PT Indofood Sukses Makmur Tbk, PTIndofood Sukses Makmur Tbk Annual Report 2002, Jakarta, 2002; INSTATE interview; Department of Foreign Affairs and Trade,Subsistence to Supermarket II: Agrifood Globalisation and Asia Volume III: Asian Agrifood Demand Trends and Outlook to 2010.
➤ Chapter 3 alsoidentifies productssought by particularcompanies and outlettypes.
8 United States Department of Agriculture Foreign Agricultural Service, Indonesia Exporter Guide Annual 2002, p. 3.
Chapter 2 Indonesian consumers
This is partly traditional, roadside food stalls for example, have always been common inIndonesian cities.
In Jakarta it is also a matter of the lifestyle imposed by the nature of the city. Many workers inJakarta have left families behind in Central Java, East Java, even Sumatra, and visit them only afew times each year. In the meantime they live in boarding houses or dormitory-typeaccommodation in Jakarta. Often employers provide such accommodation to their staff and, insome cases, meals are provided at a dining hall. If not, then out-of-town employees eat at foodstalls or restaurants of various kinds, depending upon income.
Many more Jakarta residents, including many middle-class professionals, live in satellite townssuch as Bogor, Tangerang or Bekasi. It is quite usual for these workers to commute two ormore hours in each direction to attend work. They are natural customers for prepared foodoutlets of various kinds, depending upon income.
Urban and higher income Indonesians are eclectic eaters who try the 30 or more differentcuisines from within the huge archipelago as well as imported tastes, including Asian andwestern flavours.
Fast food boomed in the early and mid–1990s as the population developed a taste for Westernfoods and food on-the-run. Fast food, and especially higher end food service outlets declinedfor several years following the Asian economic crisis and were again buffeted by more recentevents such as the Bali bombings.
Packaging
The Asian economic crisis caused consumers to be much more price-conscious than previouslyand they remain so. Suppliers and retailers have addressed this challenge in various ways:
• Products have been offered in smaller packs—an example is the sale of disposable nappiesin single unit packs. Packs of many other personal products including cosmetics remainsmall.
• Large ‘economy packs’ of daily essentials have become popular with lower incomeconsumers.
• New forms of cheap packaging for products traditionally bought in bulk have gainedpopularity—for example, soft pouch packs of cooking oil.
• Cheaper alternatives to foreign-made or foreign-branded products with simpler packaginghave emerged. The energy drink powder Hema, which is a substitute for canned soft drink, isenjoying increasing market share and is a good example of this phenomenon.
More generally, however, the trend in consumer preference to packaged and branded productstill has strong momentum, even for staple products that were traditionally sold in bulk at thewet markets. Branded product is perceived as carrying an assurance of quality and healthprotection.
Future trends
A recent Australian Government report, Subsistence to Supermarket II: Agrifood Globalisationand Asia Volume III: Asian Agrifood Demand Trends and Outlook to 2010, provides estimates oflikely per capita consumption growth trends to 2010.
FOO D E XPORTER S’ GUIDE TO INDONESIA 11
Shinta – A taste for styleShinta, a young Indonesian mother, settles in to study the menu at Tony Roma’s, an upscale restaurant chain,while her nursemaid attends to her baby. She has been married for only a year. Her father is a general in thearmy and they live in a big house in Menteng. There is a flat for her and her young husband and the baby. Herhusband works in the finance industry in Jakarta. Soon he joins her. The restaurant is fairly full by 8pm and themanager says it will improve after that time. This is a restaurant for the A1 demographic. This group can also befound in the stylish restaurants and coffee shops of five star hotels like the Grand Hyatt and the Regent and inthe designer label stores of Plaza Indonesia.
Source: INSTATE interview, October 2003.
Chapter 2 Indonesian consumers
Under its medium growth scenario the report forecasts that growth will be strongest in percapita consumption of:
• temperate fruit
• poultry, beef and other meat
• dairy products.
Growth is likely to be slowest in consumption of cereals, although wheat consumption isforecast to grow considerably more rapidly than rice.
According to Euromonitor,11 in the packaged goods segment, likely trends include:
• steady but not spectacular growth in staples such as grains and oils
• moderating growth in sales of noodles
• continuing growth in sales of baked products
• strong growth in sales of dairy products, baby food and confectionery
• in smaller categories, reasonable, but not spectacular growth in sales of frozen and chilledfoods as well as ready-to-eat meals.
The next chapter describes trends in retail and food service in Indonesia, while Chapter 4describes the supply chains to the Indonesian market.
FOO D E XPORTER S’ GUIDE TO INDONESIA12
➤ The food servicesector is described inmore detail in Chapter 3.
Impact of the Asian economic crisisA lot of publicly available commentary on the Indonesian food market highlights the impact of the crisis onfood consumption patterns. Some of the effects were relatively short-lived and have now faded. These include:
• compression of urban income levels (as the more affluent were hardest hit)
• a lessened focus on nutrition versus price*
• a downturn in eating out
• a slowing in modern retail development as shoppers sought cheaper products through traditional shops andmarkets
Other changes have been more long lasting. These include:
• an increased consumer focus on value for money
• the continued growth of generic brands
• a wider range of packaging options—including smaller packages
• a reduction in brand loyalty. 9
Prior to the crisis, affluent Indonesians were described as more concerned about taste, freshness andpackaging than price. 10 Whether or not that was true then, it applies to few Indonesians now. One in-marketoperator commented recently that ‘The market is very price sensitive. Although Australian beef sold insupermarkets is of better quality, wealthy shoppers will readily go to the wet market if the price climbs toohigh.’
Source: INSTATE research and interviews, October 2003.
* see for example, the assessments in United States Department of Agriculture Foreign Agricultural Service, Indonesia ExporterGuide Annual 2002, p 4.
9 United States Department of Agriculture Foreign Agricultural Service, Indonesia Exporter Guide Annual 2002, GlobalAgriculture Information Network Report #ID2027, Jakarta ATO, 2002, p 2.
10 K Easton, G Bell & F Ng, Exporting Food to Indonesia: A Guide for Australian Small to Medim Enterprises, CSIRO and RIRDC,Sydney, 1997.
11 Euromonitor, 2003.
3. RETAIL AND FOOD SERVICE
Overview• The average Indonesian shops mostly at traditional outlets—large wet markets and smaller
provision stores.
• Large local food producers—whether domestic or foreign-owned—rely on traditionalchannels to achieve mainstream market penetration.
• Modern retail continues to grow strongly, especially in Jakarta and other major cities. Thetop 5 chains account for 11% of retail sales so modern retailing is more concentrated inIndonesia than, say, China (though not Australia).
• Supermarkets were the pioneers but hypermarkets, mini marts and warehouse stores arenow sharing the growth. Within the modern sector, supermarkets are under the mostcompetitive pressure. Hero (Dairy Farm), Carrefour and Makro lead the supermarket,hypermarket and warehouse sectors respectively.
• Hotels and fast food chains dominate the modern food service sector and account for mostfood service imports. Other food service niches include airline catering and servicing ofmining communities.
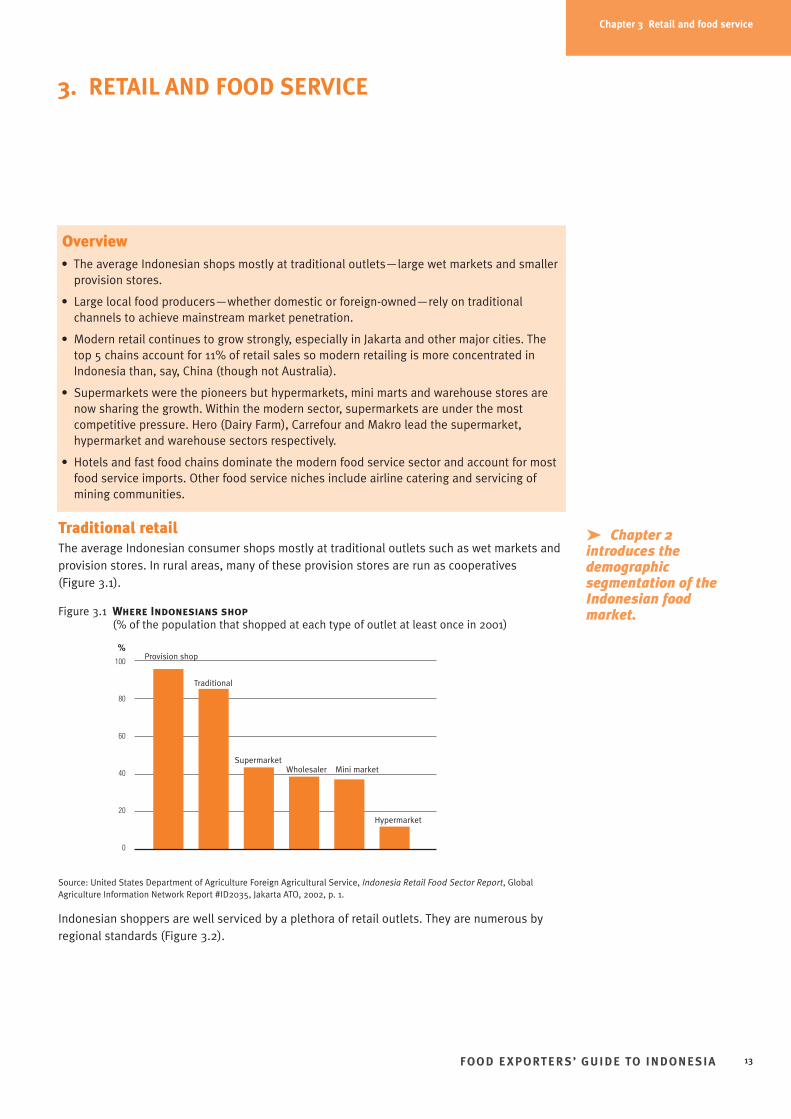
Traditional retail The average Indonesian consumer shops mostly at traditional outlets such as wet markets andprovision stores. In rural areas, many of these provision stores are run as cooperatives (Figure 3.1).
Figure 3.1 Where Indonesians shop(% of the population that shopped at each type of outlet at least once in 2001)
Source: United States Department of Agriculture Foreign Agricultural Service, Indonesia Retail Food Sector Report, GlobalAgriculture Information Network Report #ID2035, Jakarta ATO, 2002, p. 1.
Indonesian shoppers are well serviced by a plethora of retail outlets. They are numerous byregional standards (Figure 3.2).
FOO D E XPORTER S’ GUIDE TO INDONESIA 13
➤ Chapter 2introduces thedemographicsegmentation of theIndonesian foodmarket.
Chapter 3 Retail and food service
%100
80
60
40
20
0
Provision shop
Traditional
SupermarketWholesaler Mini market
Hypermarket
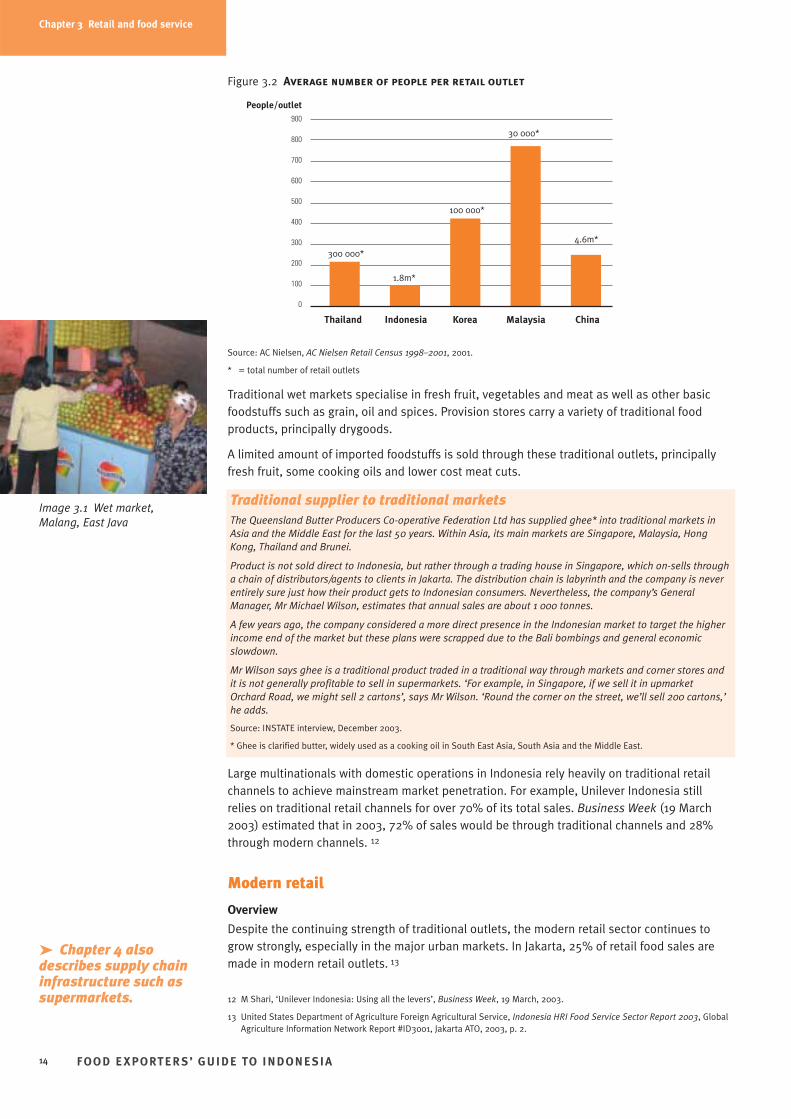
Figure 3.2 Average number of people per retail outlet
Source: AC Nielsen, AC Nielsen Retail Census 1998–2001, 2001.
* = total number of retail outlets
Traditional wet markets specialise in fresh fruit, vegetables and meat as well as other basicfoodstuffs such as grain, oil and spices. Provision stores carry a variety of traditional foodproducts, principally drygoods.
A limited amount of imported foodstuffs is sold through these traditional outlets, principallyfresh fruit, some cooking oils and lower cost meat cuts.
Large multinationals with domestic operations in Indonesia rely heavily on traditional retailchannels to achieve mainstream market penetration. For example, Unilever Indonesia stillrelies on traditional retail channels for over 70% of its total sales. Business Week (19 March2003) estimated that in 2003, 72% of sales would be through traditional channels and 28%through modern channels. 12
Modern retail
Overview
Despite the continuing strength of traditional outlets, the modern retail sector continues togrow strongly, especially in the major urban markets. In Jakarta, 25% of retail food sales aremade in modern retail outlets. 13
FOO D E XPORTER S’ GUIDE TO INDONESIA14
➤ Chapter 4 alsodescribes supply chaininfrastructure such assupermarkets.
Image 3.1 Wet market,Malang, East Java
Chapter 3 Retail and food service
People/outlet900
800
700
600
500
400
300
200
100
0
300 000*
Thailand Indonesia Korea Malaysia China
1.8m*
100 000*
30 000*
Traditional supplier to traditional marketsThe Queensland Butter Producers Co-operative Federation Ltd has supplied ghee* into traditional markets inAsia and the Middle East for the last 50 years. Within Asia, its main markets are Singapore, Malaysia, HongKong, Thailand and Brunei.
Product is not sold direct to Indonesia, but rather through a trading house in Singapore, which on-sells througha chain of distributors/agents to clients in Jakarta. The distribution chain is labyrinth and the company is neverentirely sure just how their product gets to Indonesian consumers. Nevertheless, the company’s GeneralManager, Mr Michael Wilson, estimates that annual sales are about 1 000 tonnes.
A few years ago, the company considered a more direct presence in the Indonesian market to target the higherincome end of the market but these plans were scrapped due to the Bali bombings and general economicslowdown.
Mr Wilson says ghee is a traditional product traded in a traditional way through markets and corner stores andit is not generally profitable to sell in supermarkets. ‘For example, in Singapore, if we sell it in upmarketOrchard Road, we might sell 2 cartons’, says Mr Wilson. ‘Round the corner on the street, we’ll sell 200 cartons,’he adds.
Source: INSTATE interview, December 2003.
* Ghee is clarified butter, widely used as a cooking oil in South East Asia, South Asia and the Middle East.
12 M Shari, ‘Unilever Indonesia: Using all the levers’, Business Week, 19 March, 2003.
13 United States Department of Agriculture Foreign Agricultural Service, Indonesia HRI Food Service Sector Report 2003, GlobalAgriculture Information Network Report #ID3001, Jakarta ATO, 2003, p. 2.
4.6m*
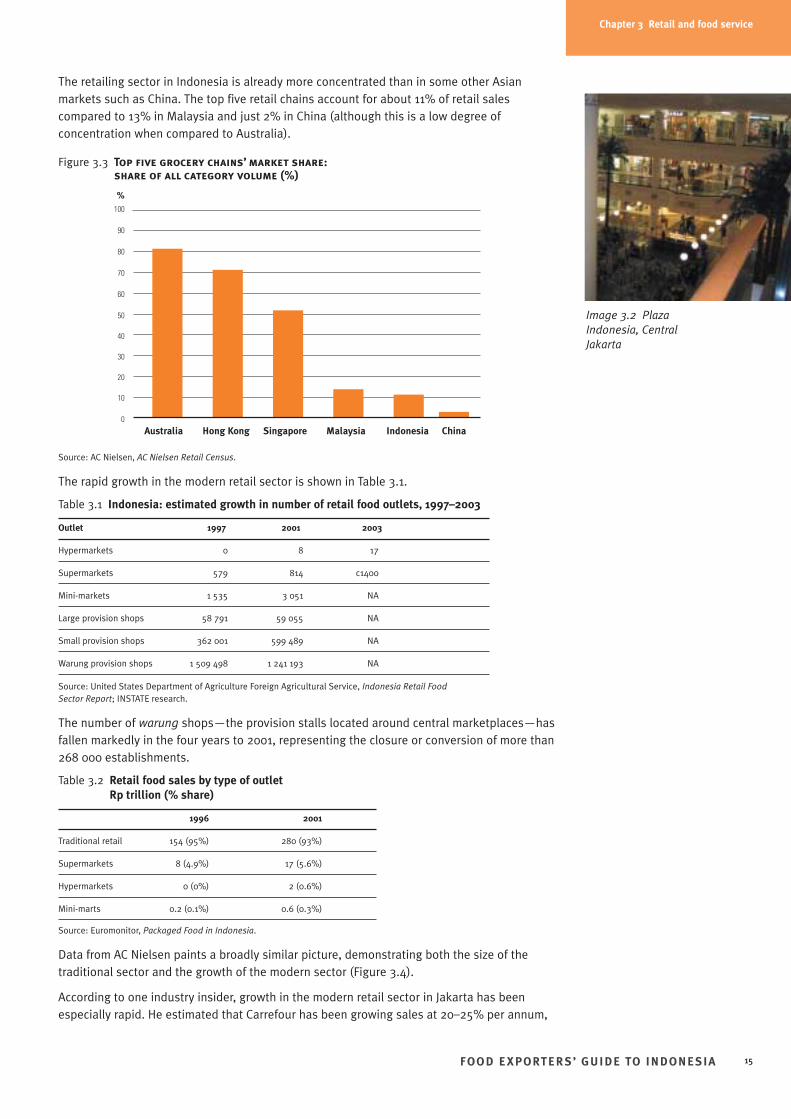
The retailing sector in Indonesia is already more concentrated than in some other Asianmarkets such as China. The top five retail chains account for about 11% of retail salescompared to 13% in Malaysia and just 2% in China (although this is a low degree ofconcentration when compared to Australia).
Figure 3.3 Top five grocery chains’ market share:share of all category volume (%)
Source: AC Nielsen, AC Nielsen Retail Census.
The rapid growth in the modern retail sector is shown in Table 3.1.
Table 3.1 Indonesia: estimated growth in number of retail food outlets, 1997–2003
Outlet 1997 2001 2003
Hypermarkets 0 8 17
Supermarkets 579 814 c1400
Mini-markets 1 535 3 051 NA
Large provision shops 58 791 59 055 NA
Small provision shops 362 001 599 489 NA
Warung provision shops 1 509 498 1 241 193 NA
Source: United States Department of Agriculture Foreign Agricultural Service, Indonesia Retail Food Sector Report; INSTATE research.
The number of warung shops—the provision stalls located around central marketplaces—hasfallen markedly in the four years to 2001, representing the closure or conversion of more than268 000 establishments.
Table 3.2 Retail food sales by type of outlet Rp trillion (% share)
1996 2001
Traditional retail 154 (95%) 280 (93%)
Supermarkets 8 (4.9%) 17 (5.6%)
Hypermarkets 0 (0%) 2 (0.6%)
Mini-marts 0.2 (0.1%) 0.6 (0.3%)
Source: Euromonitor, Packaged Food in Indonesia.
Data from AC Nielsen paints a broadly similar picture, demonstrating both the size of thetraditional sector and the growth of the modern sector (Figure 3.4).
According to one industry insider, growth in the modern retail sector in Jakarta has beenespecially rapid. He estimated that Carrefour has been growing sales at 20–25% per annum,
FOO D E XPORTER S’ GUIDE TO INDONESIA 15
Image 3.2 PlazaIndonesia, CentralJakarta
Chapter 3 Retail and food service
%100
90
80
70
60
50
40
30
20
10
0
Australia Hong Kong Singapore Malaysia Indonesia China
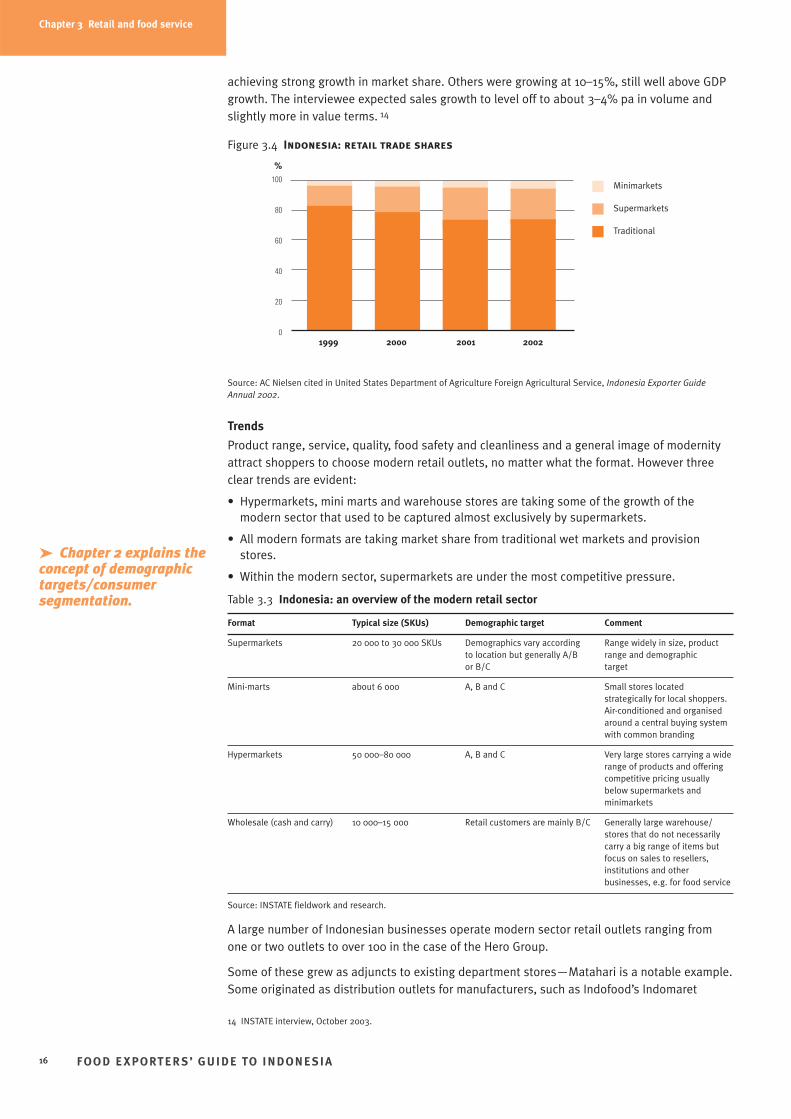
achieving strong growth in market share. Others were growing at 10–15%, still well above GDPgrowth. The interviewee expected sales growth to level off to about 3–4% pa in volume andslightly more in value terms. 14
Figure 3.4 Indonesia: retail trade shares
Source: AC Nielsen cited in United States Department of Agriculture Foreign Agricultural Service, Indonesia Exporter GuideAnnual 2002.
Trends
Product range, service, quality, food safety and cleanliness and a general image of modernityattract shoppers to choose modern retail outlets, no matter what the format. However threeclear trends are evident:
• Hypermarkets, mini marts and warehouse stores are taking some of the growth of themodern sector that used to be captured almost exclusively by supermarkets.
• All modern formats are taking market share from traditional wet markets and provisionstores.
• Within the modern sector, supermarkets are under the most competitive pressure.
Table 3.3 Indonesia: an overview of the modern retail sector
Format Typical size (SKUs) Demographic target Comment
Supermarkets 20 000 to 30 000 SKUs Demographics vary according Range widely in size, product to location but generally A/B range and demographic or B/C target
Mini-marts about 6 000 A, B and C Small stores locatedstrategically for local shoppers.Air-conditioned and organisedaround a central buying systemwith common branding
Hypermarkets 50 000–80 000 A, B and C Very large stores carrying a widerange of products and offeringcompetitive pricing usuallybelow supermarkets andminimarkets
Wholesale (cash and carry) 10 000–15 000 Retail customers are mainly B/C Generally large warehouse/stores that do not necessarilycarry a big range of items butfocus on sales to resellers,institutions and otherbusinesses, e.g. for food service
Source: INSTATE fieldwork and research.
A large number of Indonesian businesses operate modern sector retail outlets ranging fromone or two outlets to over 100 in the case of the Hero Group.
Some of these grew as adjuncts to existing department stores—Matahari is a notable example.Some originated as distribution outlets for manufacturers, such as Indofood’s Indomaret
FOO D E XPORTER S’ GUIDE TO INDONESIA16
➤ Chapter 2 explains theconcept of demographictargets/consumersegmentation.
Chapter 3 Retail and food service
%100
80
60
40
20
0
Minimarkets
Supermarkets
Traditional
1999 2000 2001 2002
14 INSTATE interview, October 2003.
minimarket chain and some as downstream diversifications by distributor groups such asWicaksana’s Club Stores.
Crossover: what format is that?
The distinctions between different retail formats are not always absolute. For example, it isdifficult to distinguish precisely between smaller supermarkets and convenience stores or minimarkets, and wholesale stores and hypermarkets:
• Although Carrefour is primarily focused on individual customers, its broad product range andattractive pricing also attracts purchases for re-sale and food service.
• Similarly, although Makro is geared to serve resellers and institutions it also has a greatnumber of retail customers who are attracted by the competitive pricing and pleasantshopping conditions.
• Alfa’s larger outlets and Wicaksana’s Club Stores are also hard to classify, some comparingthe former to hybrid supermarket/wholesale stores and the latter to hybridhypermarkets/wholesale stores.
FOO D E XPORTER S’ GUIDE TO INDONESIA 17
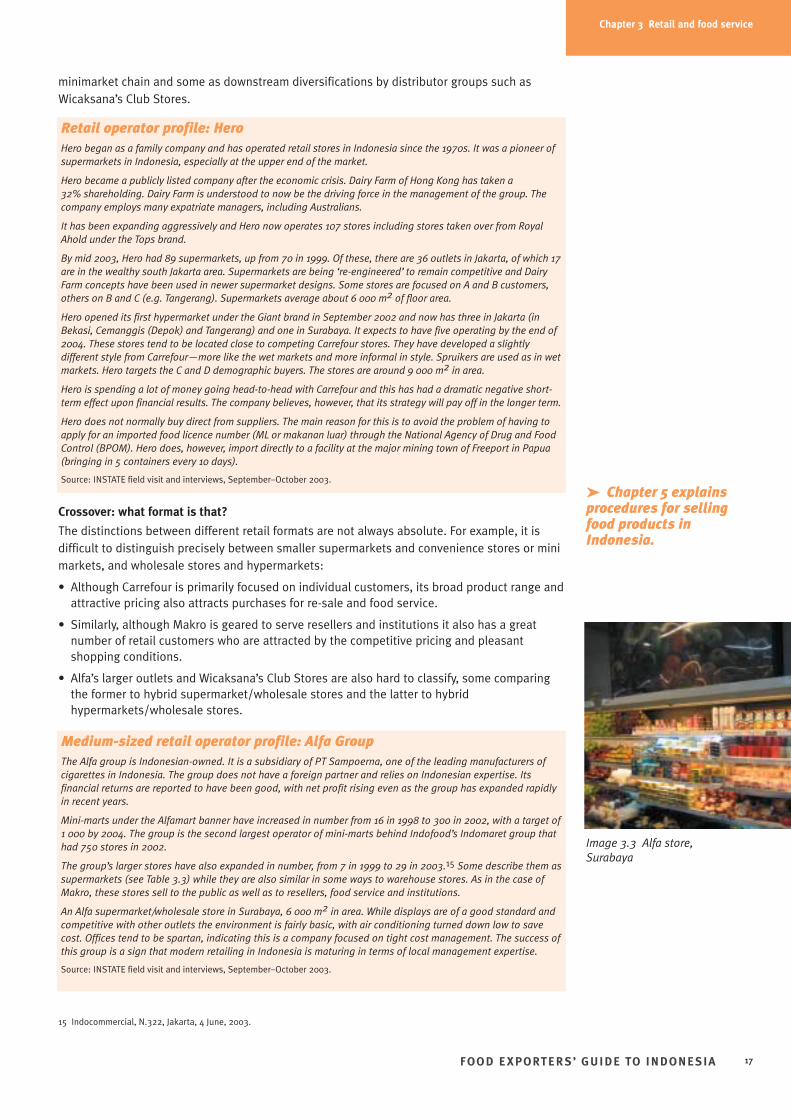
Image 3.3 Alfa store,Surabaya
Chapter 3 Retail and food service
Retail operator profile: HeroHero began as a family company and has operated retail stores in Indonesia since the 1970s. It was a pioneer ofsupermarkets in Indonesia, especially at the upper end of the market.
Hero became a publicly listed company after the economic crisis. Dairy Farm of Hong Kong has taken a 32% shareholding. Dairy Farm is understood to now be the driving force in the management of the group. Thecompany employs many expatriate managers, including Australians.
It has been expanding aggressively and Hero now operates 107 stores including stores taken over from RoyalAhold under the Tops brand.
By mid 2003, Hero had 89 supermarkets, up from 70 in 1999. Of these, there are 36 outlets in Jakarta, of which 17are in the wealthy south Jakarta area. Supermarkets are being ‘re-engineered’ to remain competitive and DairyFarm concepts have been used in newer supermarket designs. Some stores are focused on A and B customers,others on B and C (e.g. Tangerang). Supermarkets average about 6 000 m2 of floor area.
Hero opened its first hypermarket under the Giant brand in September 2002 and now has three in Jakarta (inBekasi, Cemanggis (Depok) and Tangerang) and one in Surabaya. It expects to have five operating by the end of2004. These stores tend to be located close to competing Carrefour stores. They have developed a slightlydifferent style from Carrefour—more like the wet markets and more informal in style. Spruikers are used as in wetmarkets. Hero targets the C and D demographic buyers. The stores are around 9 000 m2 in area.
Hero is spending a lot of money going head-to-head with Carrefour and this has had a dramatic negative short-term effect upon financial results. The company believes, however, that its strategy will pay off in the longer term.
Hero does not normally buy direct from suppliers. The main reason for this is to avoid the problem of having toapply for an imported food licence number (ML or makanan luar) through the National Agency of Drug and FoodControl (BPOM). Hero does, however, import directly to a facility at the major mining town of Freeport in Papua(bringing in 5 containers every 10 days).
Source: INSTATE field visit and interviews, September–October 2003.
Medium-sized retail operator profile: Alfa GroupThe Alfa group is Indonesian-owned. It is a subsidiary of PT Sampoerna, one of the leading manufacturers ofcigarettes in Indonesia. The group does not have a foreign partner and relies on Indonesian expertise. Itsfinancial returns are reported to have been good, with net profit rising even as the group has expanded rapidlyin recent years.
Mini-marts under the Alfamart banner have increased in number from 16 in 1998 to 300 in 2002, with a target of1 000 by 2004. The group is the second largest operator of mini-marts behind Indofood’s Indomaret group thathad 750 stores in 2002.
The group’s larger stores have also expanded in number, from 7 in 1999 to 29 in 2003.15 Some describe them assupermarkets (see Table 3.3) while they are also similar in some ways to warehouse stores. As in the case ofMakro, these stores sell to the public as well as to resellers, food service and institutions.
An Alfa supermarket/wholesale store in Surabaya, 6 000 m2 in area. While displays are of a good standard andcompetitive with other outlets the environment is fairly basic, with air conditioning turned down low to savecost. Offices tend to be spartan, indicating this is a company focused on tight cost management. The success ofthis group is a sign that modern retailing in Indonesia is maturing in terms of local management expertise.
Source: INSTATE field visit and interviews, September–October 2003.
➤ Chapter 5 explainsprocedures for sellingfood products inIndonesia.
15 Indocommercial, N.322, Jakarta, 4 June, 2003.
Chapter 3 Retail and food service
FOO D E XPORTER S’ GUIDE TO INDONESIA18
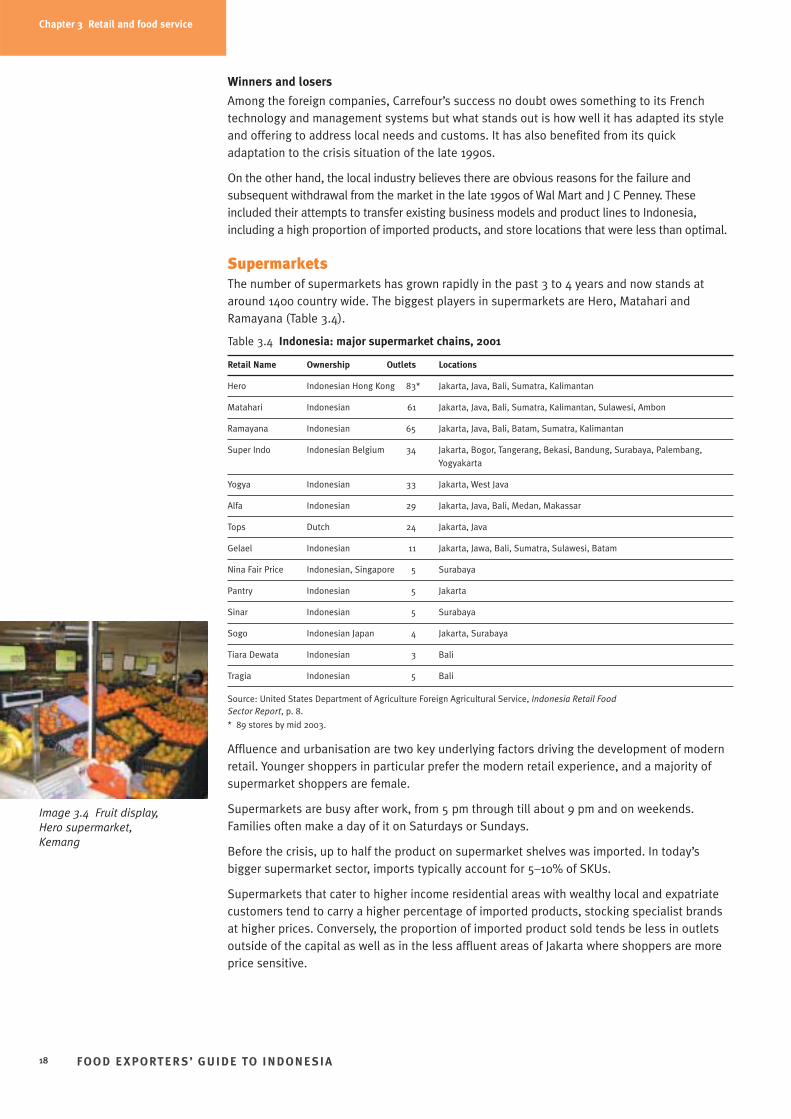
Image 3.4 Fruit display,Hero supermarket,Kemang
Winners and losers
Among the foreign companies, Carrefour’s success no doubt owes something to its Frenchtechnology and management systems but what stands out is how well it has adapted its styleand offering to address local needs and customs. It has also benefited from its quickadaptation to the crisis situation of the late 1990s.
On the other hand, the local industry believes there are obvious reasons for the failure andsubsequent withdrawal from the market in the late 1990s of Wal Mart and J C Penney. Theseincluded their attempts to transfer existing business models and product lines to Indonesia,including a high proportion of imported products, and store locations that were less than optimal.
SupermarketsThe number of supermarkets has grown rapidly in the past 3 to 4 years and now stands ataround 1400 country wide. The biggest players in supermarkets are Hero, Matahari andRamayana (Table 3.4).
Table 3.4 Indonesia: major supermarket chains, 2001
Retail Name Ownership Outlets Locations
Hero Indonesian Hong Kong 83* Jakarta, Java, Bali, Sumatra, Kalimantan
Matahari Indonesian 61 Jakarta, Java, Bali, Sumatra, Kalimantan, Sulawesi, Ambon
Ramayana Indonesian 65 Jakarta, Java, Bali, Batam, Sumatra, Kalimantan
Super Indo Indonesian Belgium 34 Jakarta, Bogor, Tangerang, Bekasi, Bandung, Surabaya, Palembang,
Yogyakarta
Yogya Indonesian 33 Jakarta, West Java
Alfa Indonesian 29 Jakarta, Java, Bali, Medan, Makassar
Tops Dutch 24 Jakarta, Java
Gelael Indonesian 11 Jakarta, Jawa, Bali, Sumatra, Sulawesi, Batam
Nina Fair Price Indonesian, Singapore 5 Surabaya
Pantry Indonesian 5 Jakarta
Sinar Indonesian 5 Surabaya
Sogo Indonesian Japan 4 Jakarta, Surabaya
Tiara Dewata Indonesian 3 Bali
Tragia Indonesian 5 Bali
Source: United States Department of Agriculture Foreign Agricultural Service, Indonesia Retail Food Sector Report, p. 8.
* 89 stores by mid 2003.
Affluence and urbanisation are two key underlying factors driving the development of modernretail. Younger shoppers in particular prefer the modern retail experience, and a majority ofsupermarket shoppers are female.
Supermarkets are busy after work, from 5 pm through till about 9 pm and on weekends.Families often make a day of it on Saturdays or Sundays.
Before the crisis, up to half the product on supermarket shelves was imported. In today’sbigger supermarket sector, imports typically account for 5–10% of SKUs.
Supermarkets that cater to higher income residential areas with wealthy local and expatriatecustomers tend to carry a higher percentage of imported products, stocking specialist brandsat higher prices. Conversely, the proportion of imported product sold tends be less in outletsoutside of the capital as well as in the less affluent areas of Jakarta where shoppers are moreprice sensitive.
Chapter 3 Retail and food service
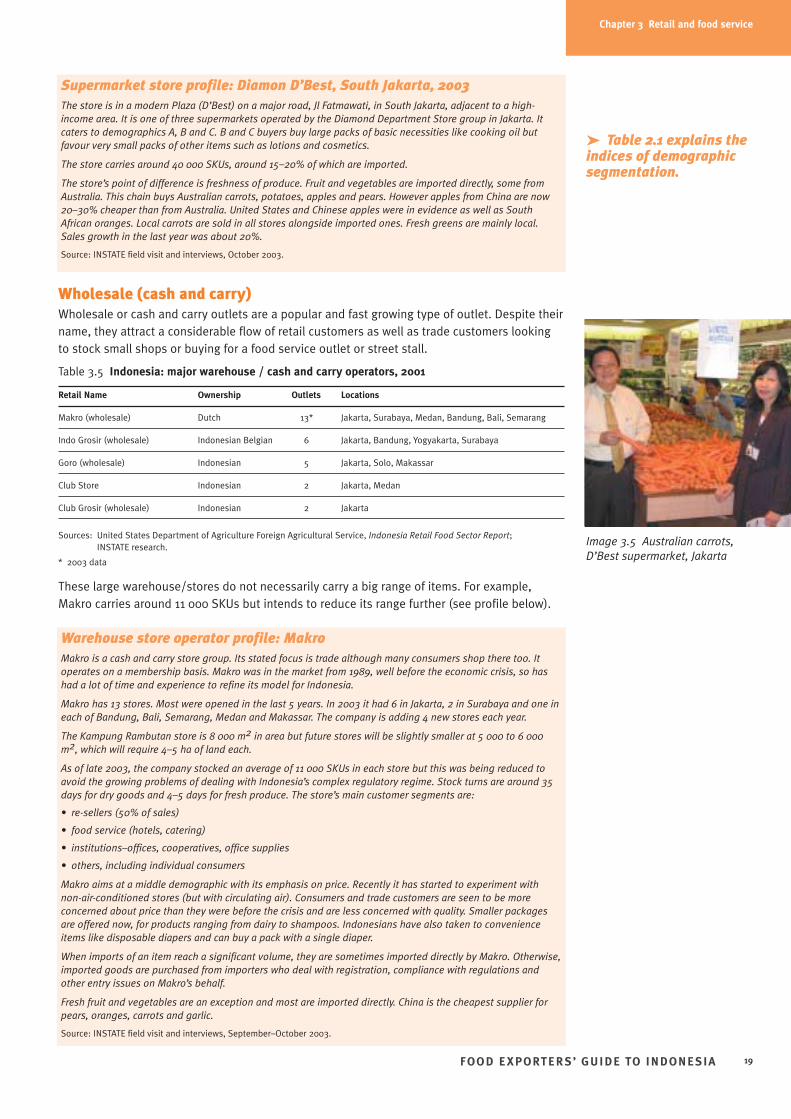
Wholesale (cash and carry)Wholesale or cash and carry outlets are a popular and fast growing type of outlet. Despite theirname, they attract a considerable flow of retail customers as well as trade customers lookingto stock small shops or buying for a food service outlet or street stall.
Table 3.5 Indonesia: major warehouse / cash and carry operators, 2001
Retail Name Ownership Outlets Locations
Makro (wholesale) Dutch 13* Jakarta, Surabaya, Medan, Bandung, Bali, Semarang
Indo Grosir (wholesale) Indonesian Belgian 6 Jakarta, Bandung, Yogyakarta, Surabaya
Goro (wholesale) Indonesian 5 Jakarta, Solo, Makassar
Club Store Indonesian 2 Jakarta, Medan
Club Grosir (wholesale) Indonesian 2 Jakarta
Sources: United States Department of Agriculture Foreign Agricultural Service, Indonesia Retail Food Sector Report; INSTATE research.
* 2003 data
These large warehouse/stores do not necessarily carry a big range of items. For example,Makro carries around 11 000 SKUs but intends to reduce its range further (see profile below).
FOO D E XPORTER S’ GUIDE TO INDONESIA 19
Supermarket store profile: Diamon D’Best, South Jakarta, 2003The store is in a modern Plaza (D’Best) on a major road, Jl Fatmawati, in South Jakarta, adjacent to a high-income area. It is one of three supermarkets operated by the Diamond Department Store group in Jakarta. Itcaters to demographics A, B and C. B and C buyers buy large packs of basic necessities like cooking oil butfavour very small packs of other items such as lotions and cosmetics.
The store carries around 40 000 SKUs, around 15–20% of which are imported.
The store’s point of difference is freshness of produce. Fruit and vegetables are imported directly, some fromAustralia. This chain buys Australian carrots, potatoes, apples and pears. However apples from China are now20–30% cheaper than from Australia. United States and Chinese apples were in evidence as well as SouthAfrican oranges. Local carrots are sold in all stores alongside imported ones. Fresh greens are mainly local.Sales growth in the last year was about 20%.
Source: INSTATE field visit and interviews, October 2003.
Warehouse store operator profile: MakroMakro is a cash and carry store group. Its stated focus is trade although many consumers shop there too. Itoperates on a membership basis. Makro was in the market from 1989, well before the economic crisis, so hashad a lot of time and experience to refine its model for Indonesia.
Makro has 13 stores. Most were opened in the last 5 years. In 2003 it had 6 in Jakarta, 2 in Surabaya and one ineach of Bandung, Bali, Semarang, Medan and Makassar. The company is adding 4 new stores each year.
The Kampung Rambutan store is 8 000 m2 in area but future stores will be slightly smaller at 5 000 to 6 000m2, which will require 4–5 ha of land each.
As of late 2003, the company stocked an average of 11 000 SKUs in each store but this was being reduced toavoid the growing problems of dealing with Indonesia’s complex regulatory regime. Stock turns are around 35days for dry goods and 4–5 days for fresh produce. The store’s main customer segments are:
• re-sellers (50% of sales)
• food service (hotels, catering)
• institutions–offices, cooperatives, office supplies
• others, including individual consumers
Makro aims at a middle demographic with its emphasis on price. Recently it has started to experiment withnon-air-conditioned stores (but with circulating air). Consumers and trade customers are seen to be moreconcerned about price than they were before the crisis and are less concerned with quality. Smaller packagesare offered now, for products ranging from dairy to shampoos. Indonesians have also taken to convenienceitems like disposable diapers and can buy a pack with a single diaper.
When imports of an item reach a significant volume, they are sometimes imported directly by Makro. Otherwise,imported goods are purchased from importers who deal with registration, compliance with regulations andother entry issues on Makro’s behalf.
Fresh fruit and vegetables are an exception and most are imported directly. China is the cheapest supplier forpears, oranges, carrots and garlic.
Source: INSTATE field visit and interviews, September–October 2003.
Image 3.5 Australian carrots,D’Best supermarket, Jakarta
➤ Table 2.1 explains theindices of demographicsegmentation.
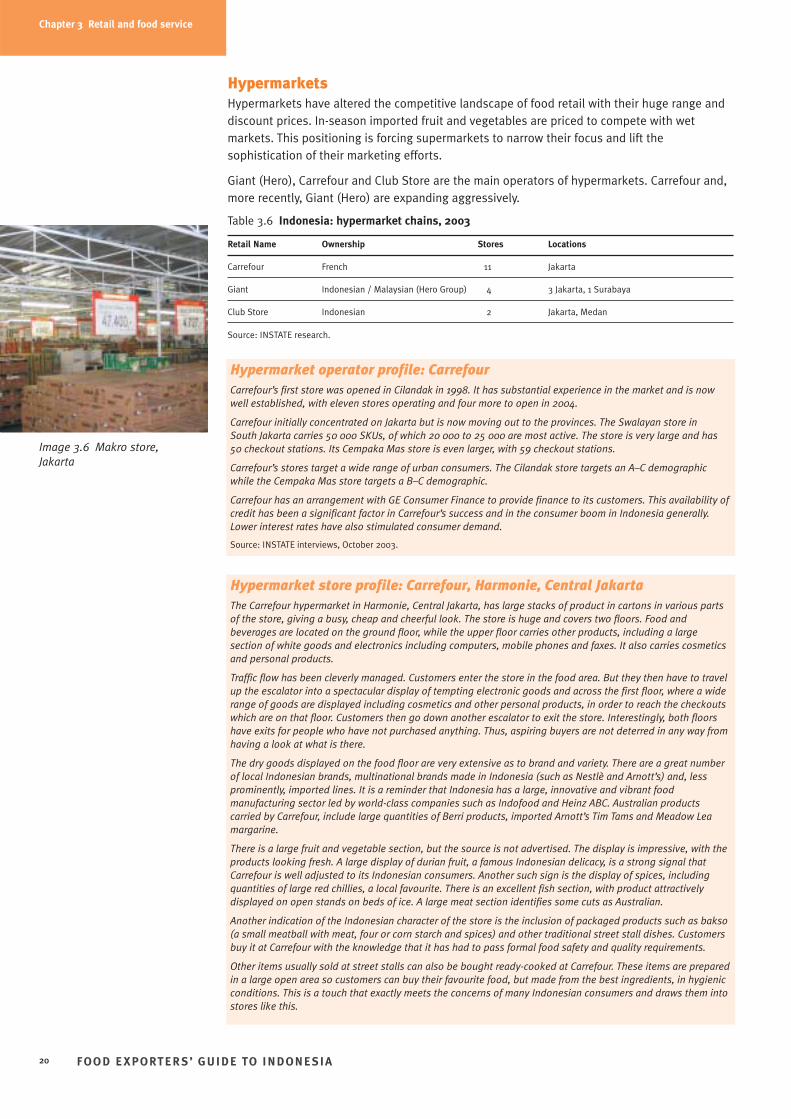
HypermarketsHypermarkets have altered the competitive landscape of food retail with their huge range anddiscount prices. In-season imported fruit and vegetables are priced to compete with wetmarkets. This positioning is forcing supermarkets to narrow their focus and lift thesophistication of their marketing efforts.
Giant (Hero), Carrefour and Club Store are the main operators of hypermarkets. Carrefour and,more recently, Giant (Hero) are expanding aggressively.
Table 3.6 Indonesia: hypermarket chains, 2003
Retail Name Ownership Stores Locations
Carrefour French 11 Jakarta
Giant Indonesian / Malaysian (Hero Group) 4 3 Jakarta, 1 Surabaya
Club Store Indonesian 2 Jakarta, Medan
Source: INSTATE research.
FOO D E XPORTER S’ GUIDE TO INDONESIA20
Chapter 3 Retail and food service
Image 3.6 Makro store,Jakarta
Hypermarket operator profile: Carrefour Carrefour’s first store was opened in Cilandak in 1998. It has substantial experience in the market and is nowwell established, with eleven stores operating and four more to open in 2004.
Carrefour initially concentrated on Jakarta but is now moving out to the provinces. The Swalayan store in South Jakarta carries 50 000 SKUs, of which 20 000 to 25 000 are most active. The store is very large and has50 checkout stations. Its Cempaka Mas store is even larger, with 59 checkout stations.
Carrefour’s stores target a wide range of urban consumers. The Cilandak store targets an A–C demographicwhile the Cempaka Mas store targets a B–C demographic.
Carrefour has an arrangement with GE Consumer Finance to provide finance to its customers. This availability ofcredit has been a significant factor in Carrefour’s success and in the consumer boom in Indonesia generally.Lower interest rates have also stimulated consumer demand.
Source: INSTATE interviews, October 2003.
Hypermarket store profile: Carrefour, Harmonie, Central JakartaThe Carrefour hypermarket in Harmonie, Central Jakarta, has large stacks of product in cartons in various partsof the store, giving a busy, cheap and cheerful look. The store is huge and covers two floors. Food andbeverages are located on the ground floor, while the upper floor carries other products, including a largesection of white goods and electronics including computers, mobile phones and faxes. It also carries cosmeticsand personal products.
Traffic flow has been cleverly managed. Customers enter the store in the food area. But they then have to travelup the escalator into a spectacular display of tempting electronic goods and across the first floor, where a widerange of goods are displayed including cosmetics and other personal products, in order to reach the checkoutswhich are on that floor. Customers then go down another escalator to exit the store. Interestingly, both floorshave exits for people who have not purchased anything. Thus, aspiring buyers are not deterred in any way fromhaving a look at what is there.
The dry goods displayed on the food floor are very extensive as to brand and variety. There are a great numberof local Indonesian brands, multinational brands made in Indonesia (such as Nestlè and Arnott’s) and, lessprominently, imported lines. It is a reminder that Indonesia has a large, innovative and vibrant foodmanufacturing sector led by world-class companies such as Indofood and Heinz ABC. Australian productscarried by Carrefour, include large quantities of Berri products, imported Arnott’s Tim Tams and Meadow Leamargarine.
There is a large fruit and vegetable section, but the source is not advertised. The display is impressive, with theproducts looking fresh. A large display of durian fruit, a famous Indonesian delicacy, is a strong signal thatCarrefour is well adjusted to its Indonesian consumers. Another such sign is the display of spices, includingquantities of large red chillies, a local favourite. There is an excellent fish section, with product attractivelydisplayed on open stands on beds of ice. A large meat section identifies some cuts as Australian.
Another indication of the Indonesian character of the store is the inclusion of packaged products such as bakso(a small meatball with meat, four or corn starch and spices) and other traditional street stall dishes. Customersbuy it at Carrefour with the knowledge that it has had to pass formal food safety and quality requirements.
Other items usually sold at street stalls can also be bought ready-cooked at Carrefour. These items are preparedin a large open area so customers can buy their favourite food, but made from the best ingredients, in hygienicconditions. This is a touch that exactly meets the concerns of many Indonesian consumers and draws them intostores like this.
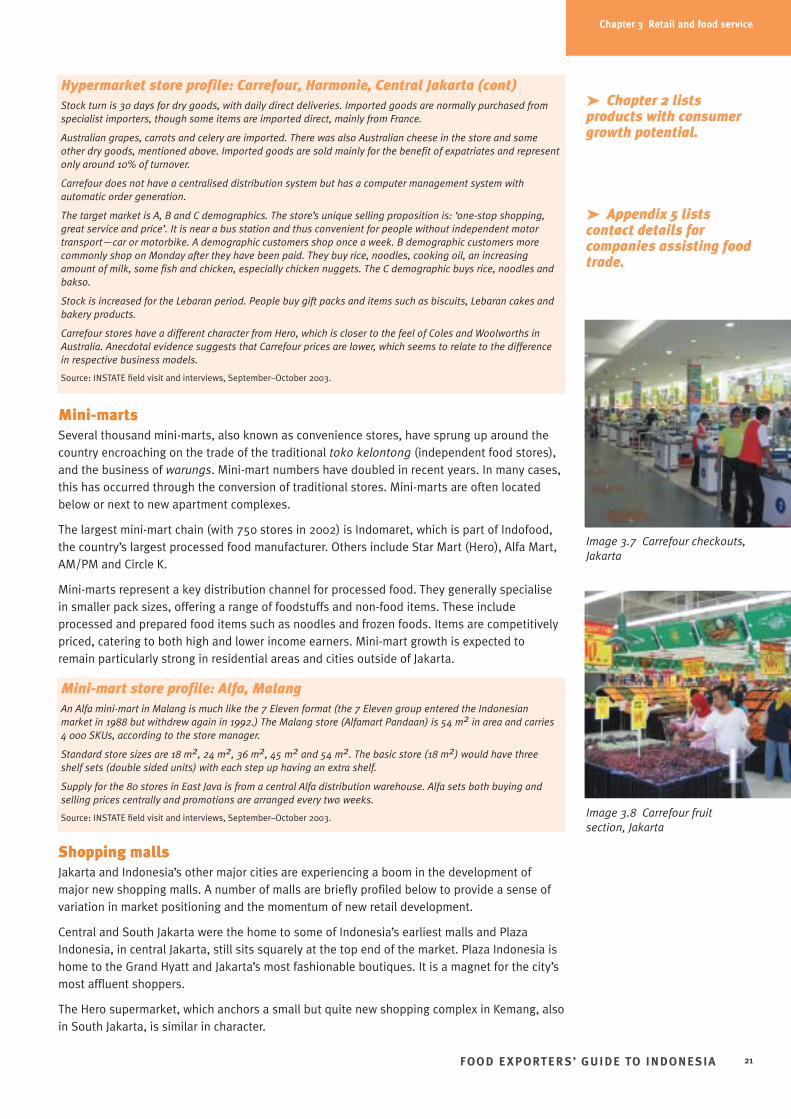
Mini-martsSeveral thousand mini-marts, also known as convenience stores, have sprung up around thecountry encroaching on the trade of the traditional toko kelontong (independent food stores),and the business of warungs. Mini-mart numbers have doubled in recent years. In many cases,this has occurred through the conversion of traditional stores. Mini-marts are often locatedbelow or next to new apartment complexes.
The largest mini-mart chain (with 750 stores in 2002) is Indomaret, which is part of Indofood,the country’s largest processed food manufacturer. Others include Star Mart (Hero), Alfa Mart,AM/PM and Circle K.
Mini-marts represent a key distribution channel for processed food. They generally specialisein smaller pack sizes, offering a range of foodstuffs and non-food items. These includeprocessed and prepared food items such as noodles and frozen foods. Items are competitivelypriced, catering to both high and lower income earners. Mini-mart growth is expected toremain particularly strong in residential areas and cities outside of Jakarta.
Shopping malls Jakarta and Indonesia’s other major cities are experiencing a boom in the development ofmajor new shopping malls. A number of malls are briefly profiled below to provide a sense ofvariation in market positioning and the momentum of new retail development.
Central and South Jakarta were the home to some of Indonesia’s earliest malls and PlazaIndonesia, in central Jakarta, still sits squarely at the top end of the market. Plaza Indonesia ishome to the Grand Hyatt and Jakarta’s most fashionable boutiques. It is a magnet for the city’smost affluent shoppers.
The Hero supermarket, which anchors a small but quite new shopping complex in Kemang, alsoin South Jakarta, is similar in character.
FOO D E XPORTER S’ GUIDE TO INDONESIA 21
Image 3.7 Carrefour checkouts,Jakarta
➤ Chapter 2 listsproducts with consumergrowth potential.
➤ Appendix 5 listscontact details forcompanies assisting foodtrade.
Chapter 3 Retail and food service
Image 3.8 Carrefour fruitsection, Jakarta
Hypermarket store profile: Carrefour, Harmonie, Central Jakarta (cont)Stock turn is 30 days for dry goods, with daily direct deliveries. Imported goods are normally purchased fromspecialist importers, though some items are imported direct, mainly from France.
Australian grapes, carrots and celery are imported. There was also Australian cheese in the store and someother dry goods, mentioned above. Imported goods are sold mainly for the benefit of expatriates and representonly around 10% of turnover.
Carrefour does not have a centralised distribution system but has a computer management system withautomatic order generation.
The target market is A, B and C demographics. The store’s unique selling proposition is: ‘one-stop shopping,great service and price’. It is near a bus station and thus convenient for people without independent motortransport—car or motorbike. A demographic customers shop once a week. B demographic customers morecommonly shop on Monday after they have been paid. They buy rice, noodles, cooking oil, an increasingamount of milk, some fish and chicken, especially chicken nuggets. The C demographic buys rice, noodles andbakso.
Stock is increased for the Lebaran period. People buy gift packs and items such as biscuits, Lebaran cakes andbakery products.
Carrefour stores have a different character from Hero, which is closer to the feel of Coles and Woolworths inAustralia. Anecdotal evidence suggests that Carrefour prices are lower, which seems to relate to the differencein respective business models.
Source: INSTATE field visit and interviews, September–October 2003.
Mini-mart store profile: Alfa, MalangAn Alfa mini-mart in Malang is much like the 7 Eleven format (the 7 Eleven group entered the Indonesianmarket in 1988 but withdrew again in 1992.) The Malang store (Alfamart Pandaan) is 54 m2 in area and carries4 000 SKUs, according to the store manager.
Standard store sizes are 18 m2, 24 m2, 36 m2, 45 m2 and 54 m2. The basic store (18 m2) would have threeshelf sets (double sided units) with each step up having an extra shelf.
Supply for the 80 stores in East Java is from a central Alfa distribution warehouse. Alfa sets both buying andselling prices centrally and promotions are arranged every two weeks.
Source: INSTATE field visit and interviews, September–October 2003.
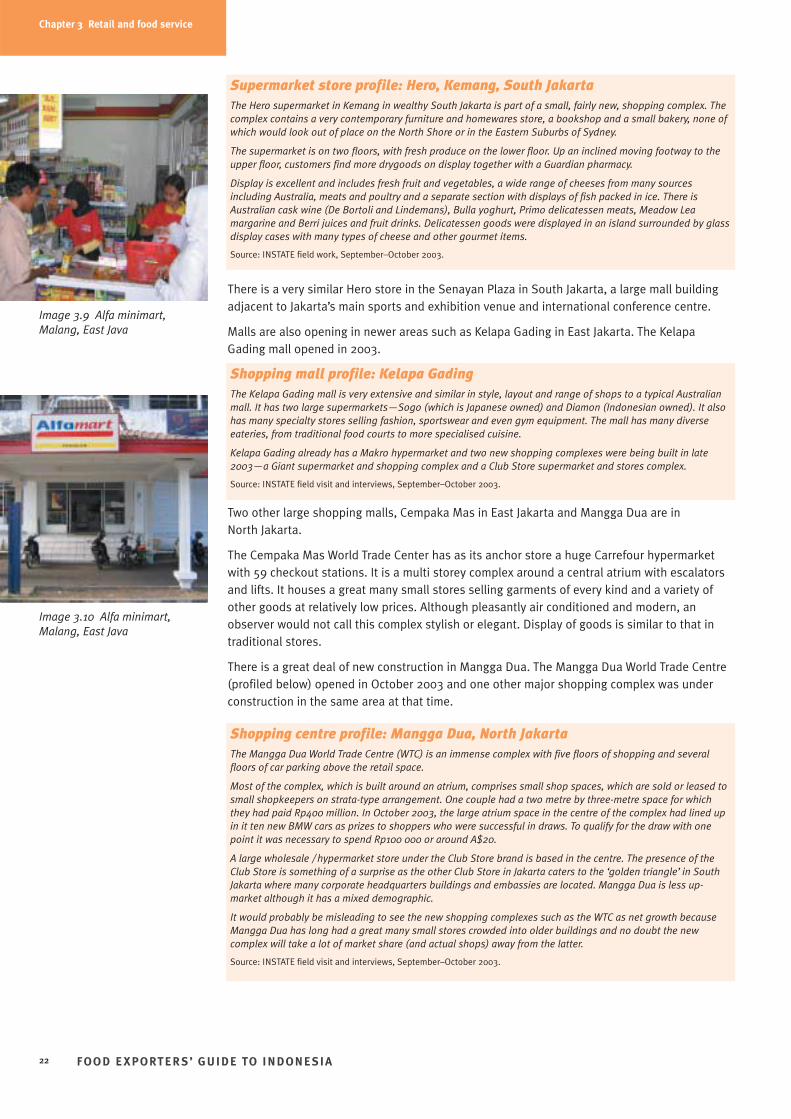
There is a very similar Hero store in the Senayan Plaza in South Jakarta, a large mall buildingadjacent to Jakarta’s main sports and exhibition venue and international conference centre.
Malls are also opening in newer areas such as Kelapa Gading in East Jakarta. The KelapaGading mall opened in 2003.
Two other large shopping malls, Cempaka Mas in East Jakarta and Mangga Dua are in North Jakarta.
The Cempaka Mas World Trade Center has as its anchor store a huge Carrefour hypermarketwith 59 checkout stations. It is a multi storey complex around a central atrium with escalatorsand lifts. It houses a great many small stores selling garments of every kind and a variety ofother goods at relatively low prices. Although pleasantly air conditioned and modern, anobserver would not call this complex stylish or elegant. Display of goods is similar to that intraditional stores.
There is a great deal of new construction in Mangga Dua. The Mangga Dua World Trade Centre(profiled below) opened in October 2003 and one other major shopping complex was underconstruction in the same area at that time.
FOO D E XPORTER S’ GUIDE TO INDONESIA22
Image 3.9 Alfa minimart,Malang, East Java
Chapter 3 Retail and food service
Image 3.10 Alfa minimart,Malang, East Java
Supermarket store profile: Hero, Kemang, South JakartaThe Hero supermarket in Kemang in wealthy South Jakarta is part of a small, fairly new, shopping complex. Thecomplex contains a very contemporary furniture and homewares store, a bookshop and a small bakery, none ofwhich would look out of place on the North Shore or in the Eastern Suburbs of Sydney.
The supermarket is on two floors, with fresh produce on the lower floor. Up an inclined moving footway to theupper floor, customers find more drygoods on display together with a Guardian pharmacy.
Display is excellent and includes fresh fruit and vegetables, a wide range of cheeses from many sourcesincluding Australia, meats and poultry and a separate section with displays of fish packed in ice. There isAustralian cask wine (De Bortoli and Lindemans), Bulla yoghurt, Primo delicatessen meats, Meadow Leamargarine and Berri juices and fruit drinks. Delicatessen goods were displayed in an island surrounded by glassdisplay cases with many types of cheese and other gourmet items.
Source: INSTATE field work, September–October 2003.
Shopping mall profile: Kelapa GadingThe Kelapa Gading mall is very extensive and similar in style, layout and range of shops to a typical Australianmall. It has two large supermarkets—Sogo (which is Japanese owned) and Diamon (Indonesian owned). It alsohas many specialty stores selling fashion, sportswear and even gym equipment. The mall has many diverseeateries, from traditional food courts to more specialised cuisine.
Kelapa Gading already has a Makro hypermarket and two new shopping complexes were being built in late2003—a Giant supermarket and shopping complex and a Club Store supermarket and stores complex.
Source: INSTATE field visit and interviews, September–October 2003.
Shopping centre profile: Mangga Dua, North JakartaThe Mangga Dua World Trade Centre (WTC) is an immense complex with five floors of shopping and severalfloors of car parking above the retail space.
Most of the complex, which is built around an atrium, comprises small shop spaces, which are sold or leased tosmall shopkeepers on strata-type arrangement. One couple had a two metre by three-metre space for whichthey had paid Rp400 million. In October 2003, the large atrium space in the centre of the complex had lined upin it ten new BMW cars as prizes to shoppers who were successful in draws. To qualify for the draw with onepoint it was necessary to spend Rp100 000 or around A$20.
A large wholesale / hypermarket store under the Club Store brand is based in the centre. The presence of theClub Store is something of a surprise as the other Club Store in Jakarta caters to the ‘golden triangle’ in SouthJakarta where many corporate headquarters buildings and embassies are located. Mangga Dua is less up-market although it has a mixed demographic.
It would probably be misleading to see the new shopping complexes such as the WTC as net growth becauseMangga Dua has long had a great many small stores crowded into older buildings and no doubt the newcomplex will take a lot of market share (and actual shops) away from the latter.
Source: INSTATE field visit and interviews, September–October 2003.
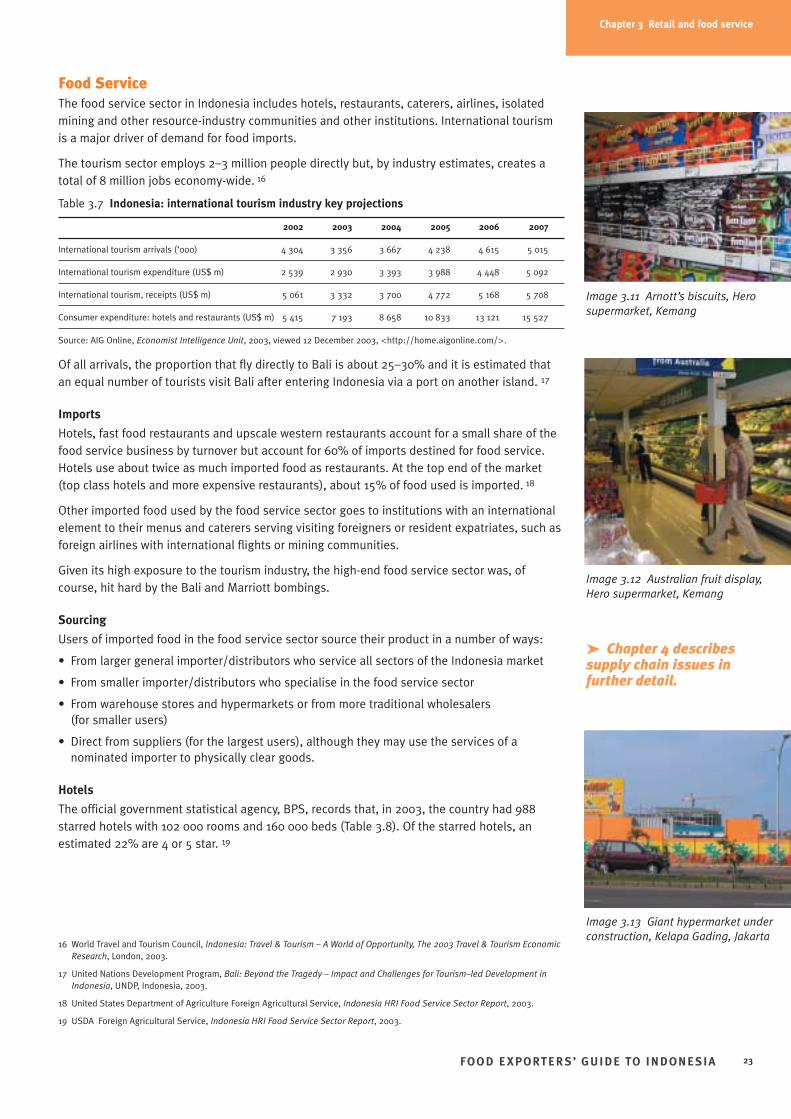
Chapter 3 Retail and food service
Food ServiceThe food service sector in Indonesia includes hotels, restaurants, caterers, airlines, isolatedmining and other resource-industry communities and other institutions. International tourismis a major driver of demand for food imports.
The tourism sector employs 2–3 million people directly but, by industry estimates, creates atotal of 8 million jobs economy-wide. 16
Table 3.7 Indonesia: international tourism industry key projections
2002 2003 2004 2005 2006 2007
International tourism arrivals (‘000) 4 304 3 356 3 667 4 238 4 615 5 015
International tourism expenditure (US$ m) 2 539 2 930 3 393 3 988 4 448 5 092
International tourism, receipts (US$ m) 5 061 3 332 3 700 4 772 5 168 5 708
Consumer expenditure: hotels and restaurants (US$ m) 5 415 7 193 8 658 10 833 13 121 15 527
Source: AIG Online, Economist Intelligence Unit, 2003, viewed 12 December 2003, <http://home.aigonline.com/>.
Of all arrivals, the proportion that fly directly to Bali is about 25–30% and it is estimated thatan equal number of tourists visit Bali after entering Indonesia via a port on another island. 17
Imports
Hotels, fast food restaurants and upscale western restaurants account for a small share of thefood service business by turnover but account for 60% of imports destined for food service.Hotels use about twice as much imported food as restaurants. At the top end of the market(top class hotels and more expensive restaurants), about 15% of food used is imported. 18
Other imported food used by the food service sector goes to institutions with an internationalelement to their menus and caterers serving visiting foreigners or resident expatriates, such asforeign airlines with international flights or mining communities.
Given its high exposure to the tourism industry, the high-end food service sector was, ofcourse, hit hard by the Bali and Marriott bombings.
Sourcing
Users of imported food in the food service sector source their product in a number of ways:
• From larger general importer/distributors who service all sectors of the Indonesia market
• From smaller importer/distributors who specialise in the food service sector
• From warehouse stores and hypermarkets or from more traditional wholesalers (for smaller users)
• Direct from suppliers (for the largest users), although they may use the services of anominated importer to physically clear goods.
Hotels
The official government statistical agency, BPS, records that, in 2003, the country had 988starred hotels with 102 000 rooms and 160 000 beds (Table 3.8). Of the starred hotels, anestimated 22% are 4 or 5 star. 19
FOO D E XPORTER S’ GUIDE TO INDONESIA 23
Image 3.12 Australian fruit display,Hero supermarket, Kemang
Image 3.13 Giant hypermarket underconstruction, Kelapa Gading, Jakarta
Image 3.11 Arnott’s biscuits, Herosupermarket, Kemang
➤ Chapter 4 describessupply chain issues infurther detail.
16 World Travel and Tourism Council, Indonesia: Travel & Tourism – A World of Opportunity, The 2003 Travel & Tourism EconomicResearch, London, 2003.
17 United Nations Development Program, Bali: Beyond the Tragedy – Impact and Challenges for Tourism–led Development inIndonesia, UNDP, Indonesia, 2003.
18 United States Department of Agriculture Foreign Agricultural Service, Indonesia HRI Food Service Sector Report, 2003.
19 USDA Foreign Agricultural Service, Indonesia HRI Food Service Sector Report, 2003.
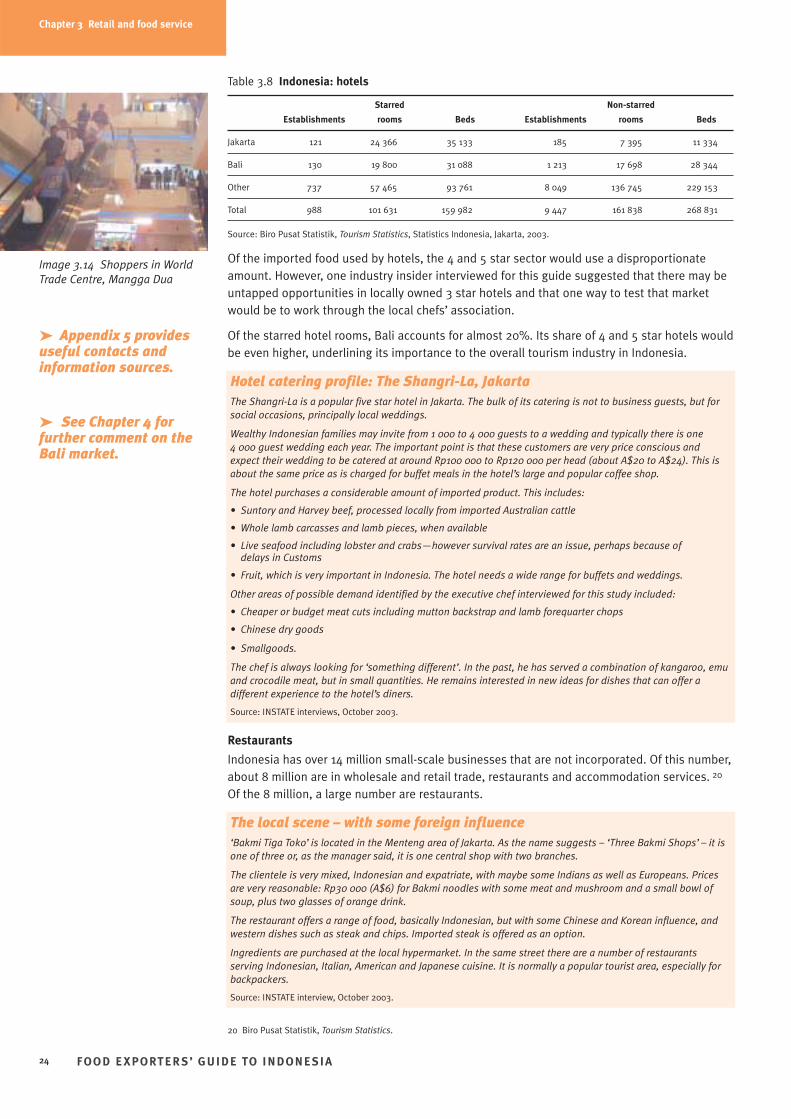
Table 3.8 Indonesia: hotels
Starred Non-starred
Establishments rooms Beds Establishments rooms Beds
Jakarta 121 24 366 35 133 185 7 395 11 334
Bali 130 19 800 31 088 1 213 17 698 28 344
Other 737 57 465 93 761 8 049 136 745 229 153
Total 988 101 631 159 982 9 447 161 838 268 831
Source: Biro Pusat Statistik, Tourism Statistics, Statistics Indonesia, Jakarta, 2003.
Of the imported food used by hotels, the 4 and 5 star sector would use a disproportionateamount. However, one industry insider interviewed for this guide suggested that there may beuntapped opportunities in locally owned 3 star hotels and that one way to test that marketwould be to work through the local chefs’ association.
Of the starred hotel rooms, Bali accounts for almost 20%. Its share of 4 and 5 star hotels wouldbe even higher, underlining its importance to the overall tourism industry in Indonesia.
Restaurants
Indonesia has over 14 million small-scale businesses that are not incorporated. Of this number,about 8 million are in wholesale and retail trade, restaurants and accommodation services. 20
Of the 8 million, a large number are restaurants.
FOO D E XPORTER S’ GUIDE TO INDONESIA24
➤ Appendix 5 providesuseful contacts andinformation sources.
➤ See Chapter 4 forfurther comment on theBali market.
Chapter 3 Retail and food service
Hotel catering profile: The Shangri-La, JakartaThe Shangri-La is a popular five star hotel in Jakarta. The bulk of its catering is not to business guests, but forsocial occasions, principally local weddings.
Wealthy Indonesian families may invite from 1 000 to 4 000 guests to a wedding and typically there is one 4 000 guest wedding each year. The important point is that these customers are very price conscious andexpect their wedding to be catered at around Rp100 000 to Rp120 000 per head (about A$20 to A$24). This isabout the same price as is charged for buffet meals in the hotel’s large and popular coffee shop.
The hotel purchases a considerable amount of imported product. This includes:
• Suntory and Harvey beef, processed locally from imported Australian cattle
• Whole lamb carcasses and lamb pieces, when available
• Live seafood including lobster and crabs—however survival rates are an issue, perhaps because of delays in Customs
• Fruit, which is very important in Indonesia. The hotel needs a wide range for buffets and weddings.
Other areas of possible demand identified by the executive chef interviewed for this study included:
• Cheaper or budget meat cuts including mutton backstrap and lamb forequarter chops
• Chinese dry goods
• Smallgoods.
The chef is always looking for ‘something different’. In the past, he has served a combination of kangaroo, emuand crocodile meat, but in small quantities. He remains interested in new ideas for dishes that can offer adifferent experience to the hotel’s diners.
Source: INSTATE interviews, October 2003.
The local scene – with some foreign influence‘Bakmi Tiga Toko’ is located in the Menteng area of Jakarta. As the name suggests – ‘Three Bakmi Shops’ – it isone of three or, as the manager said, it is one central shop with two branches.
The clientele is very mixed, Indonesian and expatriate, with maybe some Indians as well as Europeans. Pricesare very reasonable: Rp30 000 (A$6) for Bakmi noodles with some meat and mushroom and a small bowl ofsoup, plus two glasses of orange drink.
The restaurant offers a range of food, basically Indonesian, but with some Chinese and Korean influence, andwestern dishes such as steak and chips. Imported steak is offered as an option.
Ingredients are purchased at the local hypermarket. In the same street there are a number of restaurantsserving Indonesian, Italian, American and Japanese cuisine. It is normally a popular tourist area, especially forbackpackers.
Source: INSTATE interview, October 2003.
Image 3.14 Shoppers in WorldTrade Centre, Mangga Dua
20 Biro Pusat Statistik, Tourism Statistics.
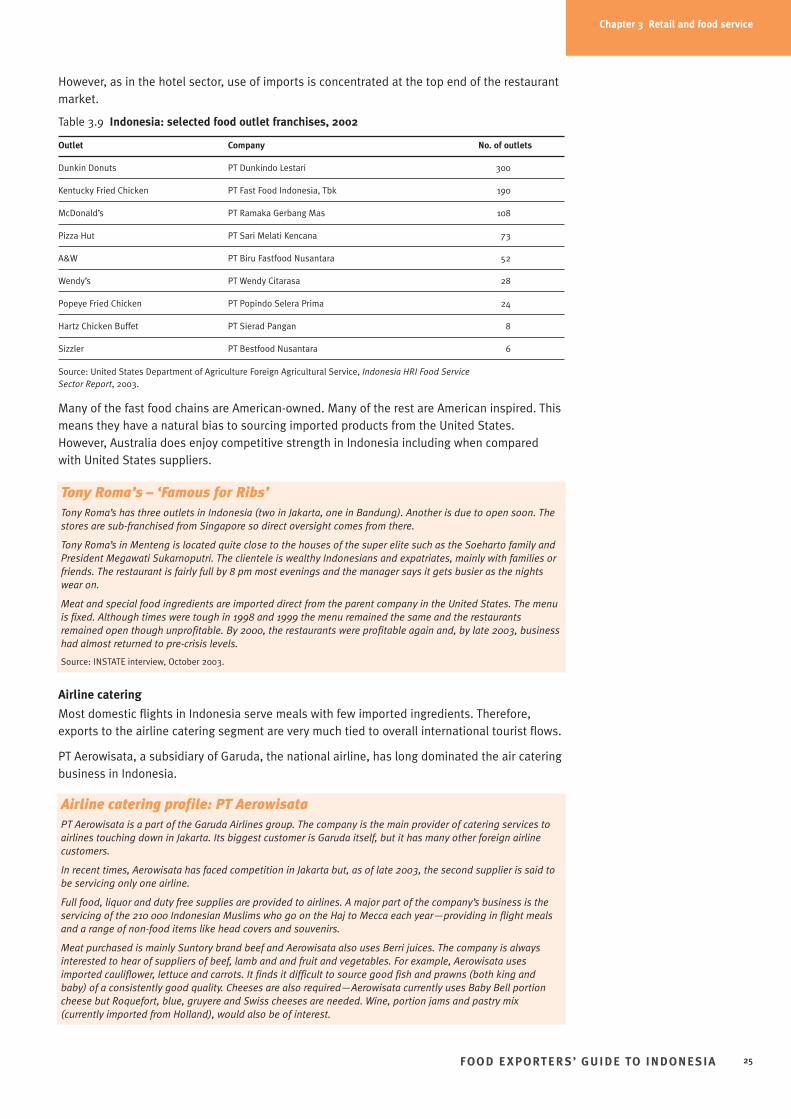
However, as in the hotel sector, use of imports is concentrated at the top end of the restaurantmarket.
Table 3.9 Indonesia: selected food outlet franchises, 2002
Outlet Company No. of outlets
Dunkin Donuts PT Dunkindo Lestari 300
Kentucky Fried Chicken PT Fast Food Indonesia, Tbk 190
McDonald’s PT Ramaka Gerbang Mas 108
Pizza Hut PT Sari Melati Kencana 73
A&W PT Biru Fastfood Nusantara 52
Wendy’s PT Wendy Citarasa 28
Popeye Fried Chicken PT Popindo Selera Prima 24
Hartz Chicken Buffet PT Sierad Pangan 8
Sizzler PT Bestfood Nusantara 6
Source: United States Department of Agriculture Foreign Agricultural Service, Indonesia HRI Food Service Sector Report, 2003.
Many of the fast food chains are American-owned. Many of the rest are American inspired. Thismeans they have a natural bias to sourcing imported products from the United States.However, Australia does enjoy competitive strength in Indonesia including when comparedwith United States suppliers.
Airline catering
Most domestic flights in Indonesia serve meals with few imported ingredients. Therefore,exports to the airline catering segment are very much tied to overall international tourist flows.
PT Aerowisata, a subsidiary of Garuda, the national airline, has long dominated the air cateringbusiness in Indonesia.
FOO D E XPORTER S’ GUIDE TO INDONESIA 25
Chapter 3 Retail and food service
Tony Roma’s – ‘Famous for Ribs’Tony Roma’s has three outlets in Indonesia (two in Jakarta, one in Bandung). Another is due to open soon. Thestores are sub-franchised from Singapore so direct oversight comes from there.
Tony Roma’s in Menteng is located quite close to the houses of the super elite such as the Soeharto family andPresident Megawati Sukarnoputri. The clientele is wealthy Indonesians and expatriates, mainly with families orfriends. The restaurant is fairly full by 8 pm most evenings and the manager says it gets busier as the nightswear on.
Meat and special food ingredients are imported direct from the parent company in the United States. The menuis fixed. Although times were tough in 1998 and 1999 the menu remained the same and the restaurantsremained open though unprofitable. By 2000, the restaurants were profitable again and, by late 2003, businesshad almost returned to pre-crisis levels.
Source: INSTATE interview, October 2003.
Airline catering profile: PT AerowisataPT Aerowisata is a part of the Garuda Airlines group. The company is the main provider of catering services toairlines touching down in Jakarta. Its biggest customer is Garuda itself, but it has many other foreign airlinecustomers.
In recent times, Aerowisata has faced competition in Jakarta but, as of late 2003, the second supplier is said tobe servicing only one airline.
Full food, liquor and duty free supplies are provided to airlines. A major part of the company’s business is theservicing of the 210 000 Indonesian Muslims who go on the Haj to Mecca each year—providing in flight mealsand a range of non-food items like head covers and souvenirs.
Meat purchased is mainly Suntory brand beef and Aerowisata also uses Berri juices. The company is alwaysinterested to hear of suppliers of beef, lamb and and fruit and vegetables. For example, Aerowisata usesimported cauliflower, lettuce and carrots. It finds it difficult to source good fish and prawns (both king andbaby) of a consistently good quality. Cheeses are also required—Aerowisata currently uses Baby Bell portioncheese but Roquefort, blue, gruyere and Swiss cheeses are needed. Wine, portion jams and pastry mix(currently imported from Holland), would also be of interest.
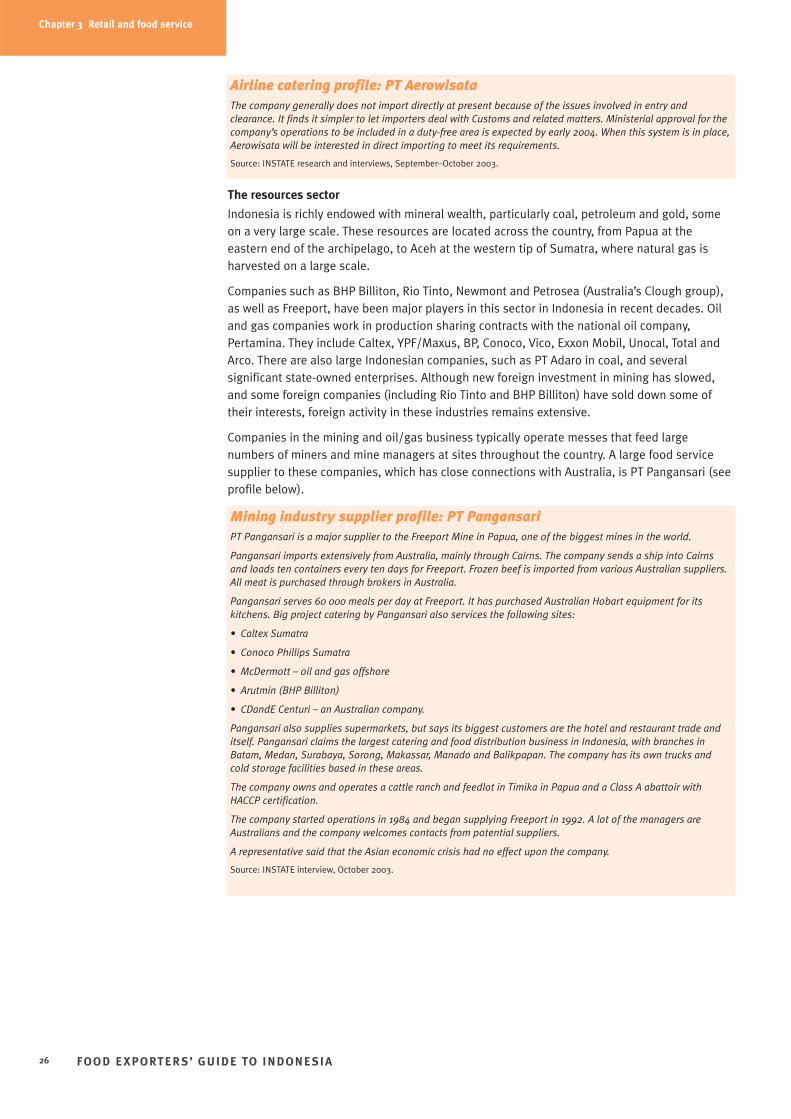
The resources sector
Indonesia is richly endowed with mineral wealth, particularly coal, petroleum and gold, someon a very large scale. These resources are located across the country, from Papua at theeastern end of the archipelago, to Aceh at the western tip of Sumatra, where natural gas isharvested on a large scale.
Companies such as BHP Billiton, Rio Tinto, Newmont and Petrosea (Australia’s Clough group),as well as Freeport, have been major players in this sector in Indonesia in recent decades. Oiland gas companies work in production sharing contracts with the national oil company,Pertamina. They include Caltex, YPF/Maxus, BP, Conoco, Vico, Exxon Mobil, Unocal, Total andArco. There are also large Indonesian companies, such as PT Adaro in coal, and severalsignificant state-owned enterprises. Although new foreign investment in mining has slowed,and some foreign companies (including Rio Tinto and BHP Billiton) have sold down some oftheir interests, foreign activity in these industries remains extensive.
Companies in the mining and oil/gas business typically operate messes that feed largenumbers of miners and mine managers at sites throughout the country. A large food servicesupplier to these companies, which has close connections with Australia, is PT Pangansari (seeprofile below).
FOO D E XPORTER S’ GUIDE TO INDONESIA26
Chapter 3 Retail and food service
Mining industry supplier profile: PT PangansariPT Pangansari is a major supplier to the Freeport Mine in Papua, one of the biggest mines in the world.
Pangansari imports extensively from Australia, mainly through Cairns. The company sends a ship into Cairnsand loads ten containers every ten days for Freeport. Frozen beef is imported from various Australian suppliers.All meat is purchased through brokers in Australia.
Pangansari serves 60 000 meals per day at Freeport. It has purchased Australian Hobart equipment for itskitchens. Big project catering by Pangansari also services the following sites:
• Caltex Sumatra
• Conoco Phillips Sumatra
• McDermott – oil and gas offshore
• Arutmin (BHP Billiton)
• CDandE Centuri – an Australian company.
Pangansari also supplies supermarkets, but says its biggest customers are the hotel and restaurant trade anditself. Pangansari claims the largest catering and food distribution business in Indonesia, with branches inBatam, Medan, Surabaya, Sorong, Makassar, Manado and Balikpapan. The company has its own trucks andcold storage facilities based in these areas.
The company owns and operates a cattle ranch and feedlot in Timika in Papua and a Class A abattoir withHACCP certification.
The company started operations in 1984 and began supplying Freeport in 1992. A lot of the managers areAustralians and the company welcomes contacts from potential suppliers.
A representative said that the Asian economic crisis had no effect upon the company.
Source: INSTATE interview, October 2003.
Airline catering profile: PT AerowisataThe company generally does not import directly at present because of the issues involved in entry andclearance. It finds it simpler to let importers deal with Customs and related matters. Ministerial approval for thecompany’s operations to be included in a duty-free area is expected by early 2004. When this system is in place,Aerowisata will be interested in direct importing to meet its requirements.
Source: INSTATE research and interviews, September–October 2003.
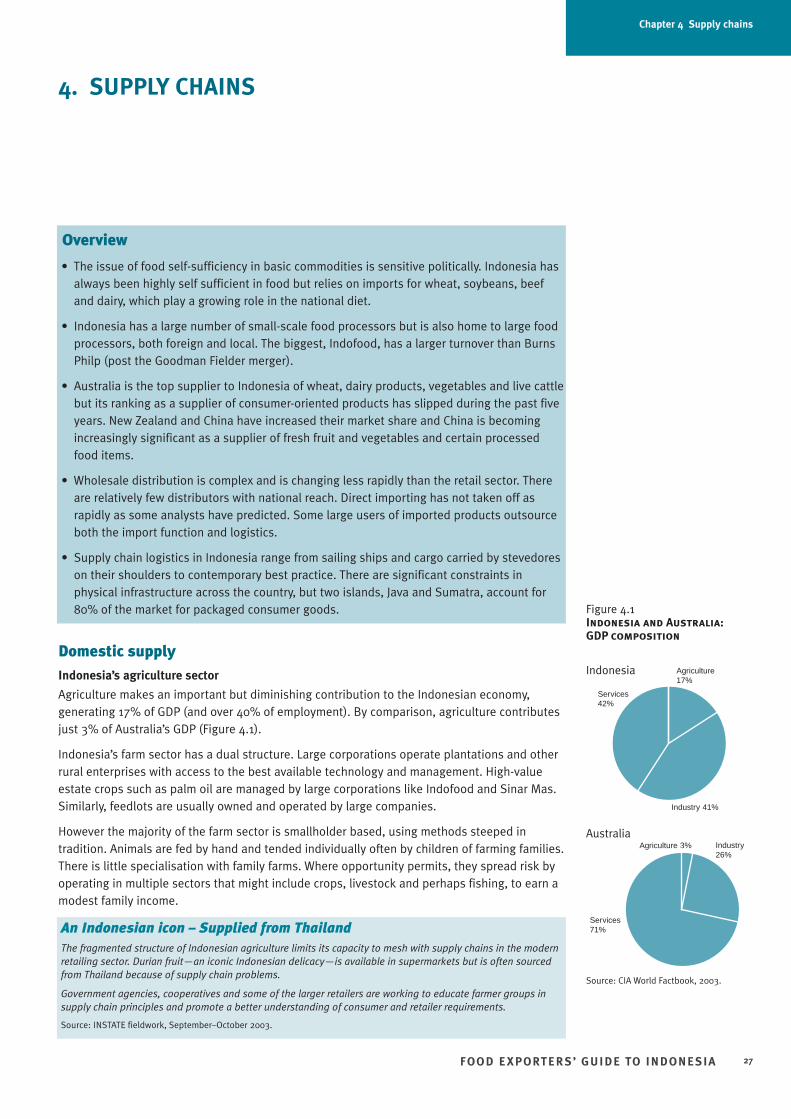
FOO D E XPORTER S’ GUIDE TO INDONESIA 27
Chapter 4 Supply chains
4. SUPPLY CHAINS
Overview
• The issue of food self-sufficiency in basic commodities is sensitive politically. Indonesia hasalways been highly self sufficient in food but relies on imports for wheat, soybeans, beefand dairy, which play a growing role in the national diet.
• Indonesia has a large number of small-scale food processors but is also home to large foodprocessors, both foreign and local. The biggest, Indofood, has a larger turnover than BurnsPhilp (post the Goodman Fielder merger).
• Australia is the top supplier to Indonesia of wheat, dairy products, vegetables and live cattlebut its ranking as a supplier of consumer-oriented products has slipped during the past fiveyears. New Zealand and China have increased their market share and China is becomingincreasingly significant as a supplier of fresh fruit and vegetables and certain processedfood items.
• Wholesale distribution is complex and is changing less rapidly than the retail sector. Thereare relatively few distributors with national reach. Direct importing has not taken off asrapidly as some analysts have predicted. Some large users of imported products outsourceboth the import function and logistics.
• Supply chain logistics in Indonesia range from sailing ships and cargo carried by stevedoreson their shoulders to contemporary best practice. There are significant constraints inphysical infrastructure across the country, but two islands, Java and Sumatra, account for80% of the market for packaged consumer goods.
Domestic supplyIndonesia’s agriculture sector
Agriculture makes an important but diminishing contribution to the Indonesian economy,generating 17% of GDP (and over 40% of employment). By comparison, agriculture contributesjust 3% of Australia’s GDP (Figure 4.1).
Indonesia’s farm sector has a dual structure. Large corporations operate plantations and otherrural enterprises with access to the best available technology and management. High-valueestate crops such as palm oil are managed by large corporations like Indofood and Sinar Mas.Similarly, feedlots are usually owned and operated by large companies.
However the majority of the farm sector is smallholder based, using methods steeped intradition. Animals are fed by hand and tended individually often by children of farming families.There is little specialisation with family farms. Where opportunity permits, they spread risk byoperating in multiple sectors that might include crops, livestock and perhaps fishing, to earn amodest family income.
Figure 4.1Indonesia and Australia: GDP composition
Indonesia
Australia
Source: CIA World Factbook, 2003.
Agriculture 17%
Industry 41%
Services 42%
Industry26%
Agriculture 3%
Services 71%An Indonesian icon – Supplied from Thailand
The fragmented structure of Indonesian agriculture limits its capacity to mesh with supply chains in the modernretailing sector. Durian fruit—an iconic Indonesian delicacy—is available in supermarkets but is often sourcedfrom Thailand because of supply chain problems.
Government agencies, cooperatives and some of the larger retailers are working to educate farmer groups insupply chain principles and promote a better understanding of consumer and retailer requirements.
Source: INSTATE fieldwork, September–October 2003.
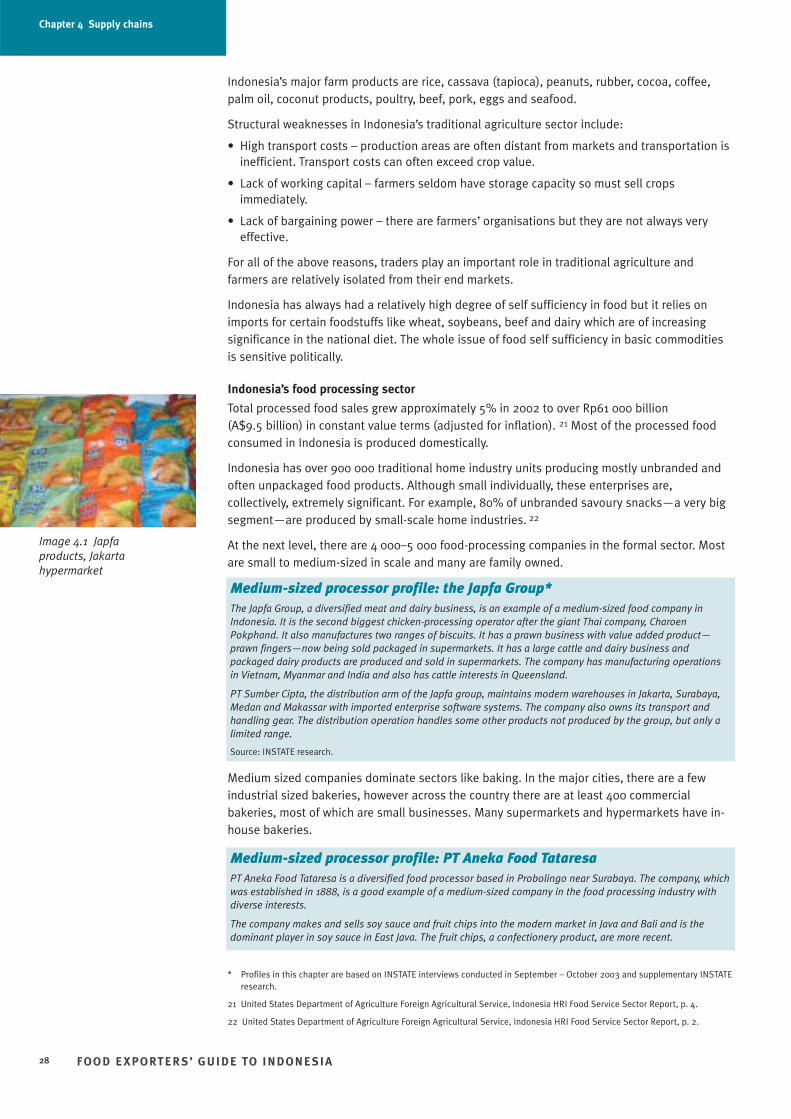
Indonesia’s major farm products are rice, cassava (tapioca), peanuts, rubber, cocoa, coffee,palm oil, coconut products, poultry, beef, pork, eggs and seafood.
Structural weaknesses in Indonesia’s traditional agriculture sector include:
• High transport costs – production areas are often distant from markets and transportation isinefficient. Transport costs can often exceed crop value.
• Lack of working capital – farmers seldom have storage capacity so must sell cropsimmediately.
• Lack of bargaining power – there are farmers’ organisations but they are not always veryeffective.
For all of the above reasons, traders play an important role in traditional agriculture andfarmers are relatively isolated from their end markets.
Indonesia has always had a relatively high degree of self sufficiency in food but it relies onimports for certain foodstuffs like wheat, soybeans, beef and dairy which are of increasingsignificance in the national diet. The whole issue of food self sufficiency in basic commoditiesis sensitive politically.
Indonesia’s food processing sector
Total processed food sales grew approximately 5% in 2002 to over Rp61 000 billion (A$9.5 billion) in constant value terms (adjusted for inflation). 21 Most of the processed foodconsumed in Indonesia is produced domestically.
Indonesia has over 900 000 traditional home industry units producing mostly unbranded andoften unpackaged food products. Although small individually, these enterprises are,collectively, extremely significant. For example, 80% of unbranded savoury snacks—a very bigsegment—are produced by small-scale home industries. 22
At the next level, there are 4 000–5 000 food-processing companies in the formal sector. Mostare small to medium-sized in scale and many are family owned.
Medium sized companies dominate sectors like baking. In the major cities, there are a fewindustrial sized bakeries, however across the country there are at least 400 commercialbakeries, most of which are small businesses. Many supermarkets and hypermarkets have in-house bakeries.
FOO D E XPORTER S’ GUIDE TO INDONESIA28
Image 4.1 Japfaproducts, Jakartahypermarket
Chapter 4 Supply chains
Medium-sized processor profile: the Japfa Group*The Japfa Group, a diversified meat and dairy business, is an example of a medium-sized food company inIndonesia. It is the second biggest chicken-processing operator after the giant Thai company, CharoenPokphand. It also manufactures two ranges of biscuits. It has a prawn business with value added product—prawn fingers—now being sold packaged in supermarkets. It has a large cattle and dairy business andpackaged dairy products are produced and sold in supermarkets. The company has manufacturing operationsin Vietnam, Myanmar and India and also has cattle interests in Queensland.
PT Sumber Cipta, the distribution arm of the Japfa group, maintains modern warehouses in Jakarta, Surabaya,Medan and Makassar with imported enterprise software systems. The company also owns its transport andhandling gear. The distribution operation handles some other products not produced by the group, but only alimited range.
Source: INSTATE research.
* Profiles in this chapter are based on INSTATE interviews conducted in September – October 2003 and supplementary INSTATEresearch.
21 United States Department of Agriculture Foreign Agricultural Service, Indonesia HRI Food Service Sector Report, p. 4.
22 United States Department of Agriculture Foreign Agricultural Service, Indonesia HRI Food Service Sector Report, p. 2.
Medium-sized processor profile: PT Aneka Food Tataresa PT Aneka Food Tataresa is a diversified food processor based in Probolingo near Surabaya. The company, whichwas established in 1888, is a good example of a medium-sized company in the food processing industry withdiverse interests.
The company makes and sells soy sauce and fruit chips into the modern market in Java and Bali and is thedominant player in soy sauce in East Java. The fruit chips, a confectionery product, are more recent.
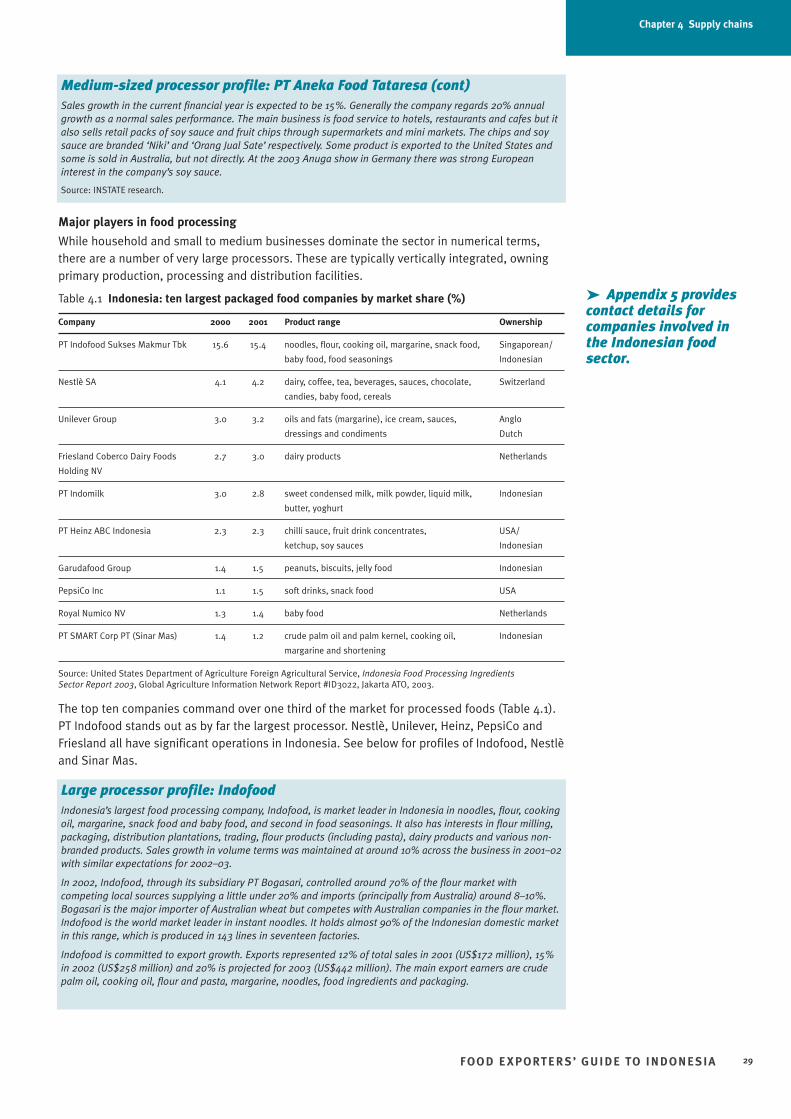
Major players in food processing
While household and small to medium businesses dominate the sector in numerical terms,there are a number of very large processors. These are typically vertically integrated, owningprimary production, processing and distribution facilities.
Table 4.1 Indonesia: ten largest packaged food companies by market share (%)
Company 2000 2001 Product range Ownership
PT Indofood Sukses Makmur Tbk 15.6 15.4 noodles, flour, cooking oil, margarine, snack food, Singaporean/
baby food, food seasonings Indonesian
Nestlè SA 4.1 4.2 dairy, coffee, tea, beverages, sauces, chocolate, Switzerland
candies, baby food, cereals
Unilever Group 3.0 3.2 oils and fats (margarine), ice cream, sauces, Anglo
dressings and condiments Dutch
Friesland Coberco Dairy Foods 2.7 3.0 dairy products Netherlands
Holding NV
PT Indomilk 3.0 2.8 sweet condensed milk, milk powder, liquid milk, Indonesian
butter, yoghurt
PT Heinz ABC Indonesia 2.3 2.3 chilli sauce, fruit drink concentrates, USA/
ketchup, soy sauces Indonesian
Garudafood Group 1.4 1.5 peanuts, biscuits, jelly food Indonesian
PepsiCo Inc 1.1 1.5 soft drinks, snack food USA
Royal Numico NV 1.3 1.4 baby food Netherlands
PT SMART Corp PT (Sinar Mas) 1.4 1.2 crude palm oil and palm kernel, cooking oil, Indonesian
margarine and shortening
Source: United States Department of Agriculture Foreign Agricultural Service, Indonesia Food Processing Ingredients Sector Report 2003, Global Agriculture Information Network Report #ID3022, Jakarta ATO, 2003.
The top ten companies command over one third of the market for processed foods (Table 4.1).PT Indofood stands out as by far the largest processor. Nestlè, Unilever, Heinz, PepsiCo andFriesland all have significant operations in Indonesia. See below for profiles of Indofood, Nestlèand Sinar Mas.
FOO D E XPORTER S’ GUIDE TO INDONESIA 29
Chapter 4 Supply chains
Medium-sized processor profile: PT Aneka Food Tataresa (cont)Sales growth in the current financial year is expected to be 15%. Generally the company regards 20% annualgrowth as a normal sales performance. The main business is food service to hotels, restaurants and cafes but italso sells retail packs of soy sauce and fruit chips through supermarkets and mini markets. The chips and soysauce are branded ‘Niki’ and ‘Orang Jual Sate’ respectively. Some product is exported to the United States andsome is sold in Australia, but not directly. At the 2003 Anuga show in Germany there was strong Europeaninterest in the company’s soy sauce.
Source: INSTATE research.
Large processor profile: IndofoodIndonesia’s largest food processing company, Indofood, is market leader in Indonesia in noodles, flour, cookingoil, margarine, snack food and baby food, and second in food seasonings. It also has interests in flour milling,packaging, distribution plantations, trading, flour products (including pasta), dairy products and various non-branded products. Sales growth in volume terms was maintained at around 10% across the business in 2001–02with similar expectations for 2002–03.
In 2002, Indofood, through its subsidiary PT Bogasari, controlled around 70% of the flour market withcompeting local sources supplying a little under 20% and imports (principally from Australia) around 8–10%.Bogasari is the major importer of Australian wheat but competes with Australian companies in the flour market.Indofood is the world market leader in instant noodles. It holds almost 90% of the Indonesian domestic marketin this range, which is produced in 143 lines in seventeen factories.
Indofood is committed to export growth. Exports represented 12% of total sales in 2001 (US$172 million), 15%in 2002 (US$258 million) and 20% is projected for 2003 (US$442 million). The main export earners are crudepalm oil, cooking oil, flour and pasta, margarine, noodles, food ingredients and packaging.
➤ Appendix 5 providescontact details forcompanies involved inthe Indonesian foodsector.
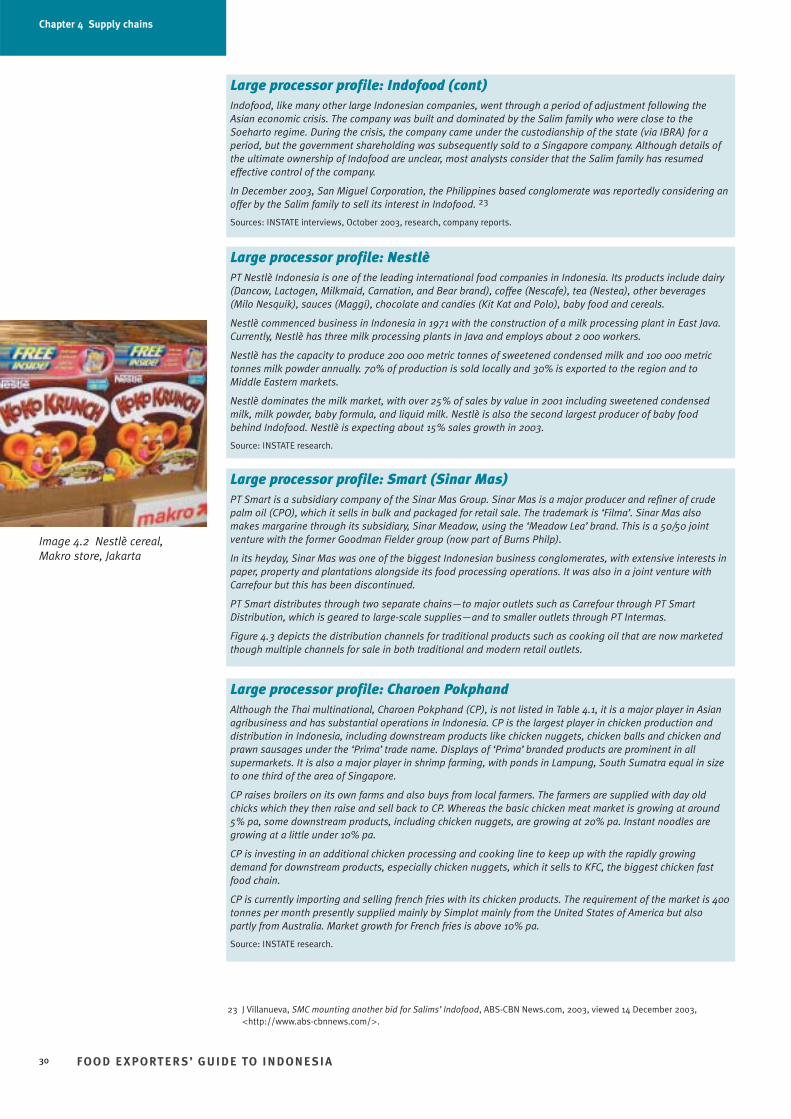
FOO D E XPORTER S’ GUIDE TO INDONESIA30
Image 4.2 Nestlè cereal,Makro store, Jakarta
Chapter 4 Supply chains
Large processor profile: Indofood (cont)Indofood, like many other large Indonesian companies, went through a period of adjustment following theAsian economic crisis. The company was built and dominated by the Salim family who were close to theSoeharto regime. During the crisis, the company came under the custodianship of the state (via IBRA) for aperiod, but the government shareholding was subsequently sold to a Singapore company. Although details ofthe ultimate ownership of Indofood are unclear, most analysts consider that the Salim family has resumedeffective control of the company.
In December 2003, San Miguel Corporation, the Philippines based conglomerate was reportedly considering anoffer by the Salim family to sell its interest in Indofood. 23
Sources: INSTATE interviews, October 2003, research, company reports.
Large processor profile: NestlèPT Nestlè Indonesia is one of the leading international food companies in Indonesia. Its products include dairy(Dancow, Lactogen, Milkmaid, Carnation, and Bear brand), coffee (Nescafe), tea (Nestea), other beverages(Milo Nesquik), sauces (Maggi), chocolate and candies (Kit Kat and Polo), baby food and cereals.
Nestlè commenced business in Indonesia in 1971 with the construction of a milk processing plant in East Java.Currently, Nestlè has three milk processing plants in Java and employs about 2 000 workers.
Nestlè has the capacity to produce 200 000 metric tonnes of sweetened condensed milk and 100 000 metrictonnes milk powder annually. 70% of production is sold locally and 30% is exported to the region and toMiddle Eastern markets.
Nestlè dominates the milk market, with over 25% of sales by value in 2001 including sweetened condensedmilk, milk powder, baby formula, and liquid milk. Nestlè is also the second largest producer of baby foodbehind Indofood. Nestlè is expecting about 15% sales growth in 2003.
Source: INSTATE research.
Large processor profile: Smart (Sinar Mas)PT Smart is a subsidiary company of the Sinar Mas Group. Sinar Mas is a major producer and refiner of crudepalm oil (CPO), which it sells in bulk and packaged for retail sale. The trademark is ‘Filma’. Sinar Mas alsomakes margarine through its subsidiary, Sinar Meadow, using the ‘Meadow Lea’ brand. This is a 50/50 jointventure with the former Goodman Fielder group (now part of Burns Philp).
In its heyday, Sinar Mas was one of the biggest Indonesian business conglomerates, with extensive interests inpaper, property and plantations alongside its food processing operations. It was also in a joint venture withCarrefour but this has been discontinued.
PT Smart distributes through two separate chains—to major outlets such as Carrefour through PT SmartDistribution, which is geared to large-scale supplies—and to smaller outlets through PT Intermas.
Figure 4.3 depicts the distribution channels for traditional products such as cooking oil that are now marketedthough multiple channels for sale in both traditional and modern retail outlets.
Large processor profile: Charoen PokphandAlthough the Thai multinational, Charoen Pokphand (CP), is not listed in Table 4.1, it is a major player in Asianagribusiness and has substantial operations in Indonesia. CP is the largest player in chicken production anddistribution in Indonesia, including downstream products like chicken nuggets, chicken balls and chicken andprawn sausages under the ‘Prima’ trade name. Displays of ‘Prima’ branded products are prominent in allsupermarkets. It is also a major player in shrimp farming, with ponds in Lampung, South Sumatra equal in sizeto one third of the area of Singapore.
CP raises broilers on its own farms and also buys from local farmers. The farmers are supplied with day oldchicks which they then raise and sell back to CP. Whereas the basic chicken meat market is growing at around5% pa, some downstream products, including chicken nuggets, are growing at 20% pa. Instant noodles aregrowing at a little under 10% pa.
CP is investing in an additional chicken processing and cooking line to keep up with the rapidly growingdemand for downstream products, especially chicken nuggets, which it sells to KFC, the biggest chicken fastfood chain.
CP is currently importing and selling french fries with its chicken products. The requirement of the market is 400tonnes per month presently supplied mainly by Simplot mainly from the United States of America but alsopartly from Australia. Market growth for French fries is above 10% pa.
Source: INSTATE research.
23 J Villanueva, SMC mounting another bid for Salims’ Indofood, ABS-CBN News.com, 2003, viewed 14 December 2003,<http://www.abs-cbnnews.com/>.
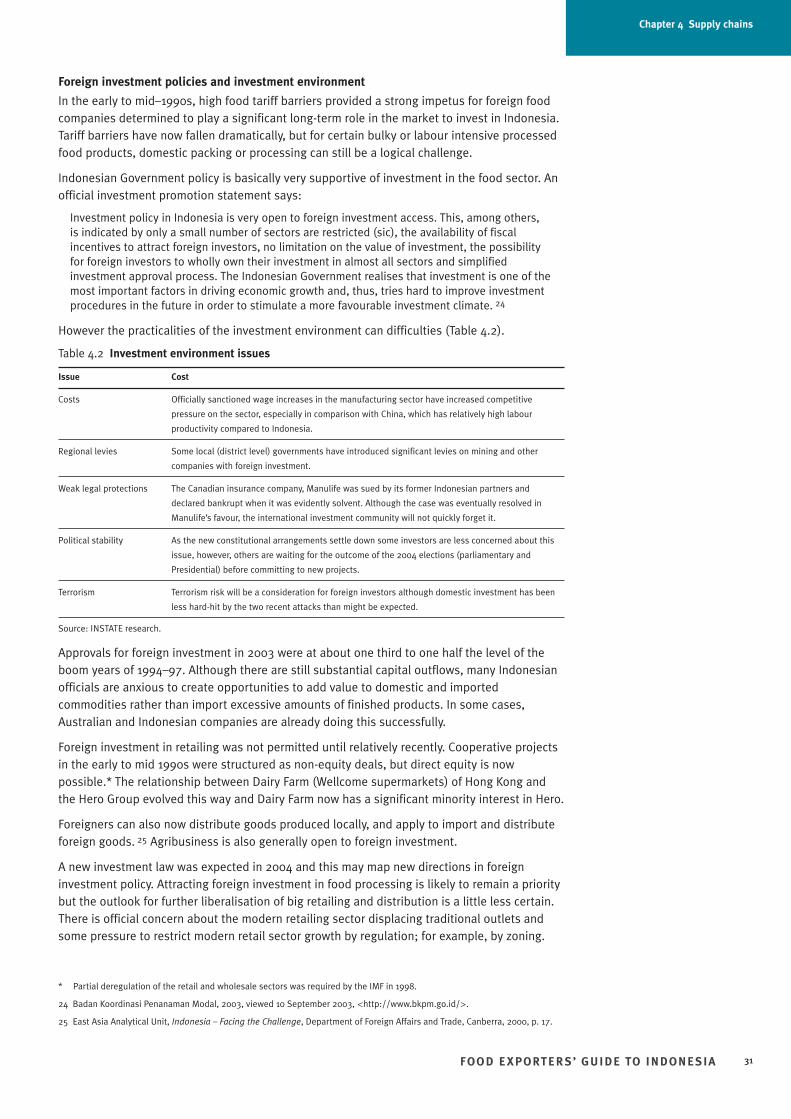
Foreign investment policies and investment environment
In the early to mid–1990s, high food tariff barriers provided a strong impetus for foreign foodcompanies determined to play a significant long-term role in the market to invest in Indonesia.Tariff barriers have now fallen dramatically, but for certain bulky or labour intensive processedfood products, domestic packing or processing can still be a logical challenge.
Indonesian Government policy is basically very supportive of investment in the food sector. Anofficial investment promotion statement says:
Investment policy in Indonesia is very open to foreign investment access. This, among others, is indicated by only a small number of sectors are restricted (sic), the availability of fiscalincentives to attract foreign investors, no limitation on the value of investment, the possibility for foreign investors to wholly own their investment in almost all sectors and simplifiedinvestment approval process. The Indonesian Government realises that investment is one of themost important factors in driving economic growth and, thus, tries hard to improve investmentprocedures in the future in order to stimulate a more favourable investment climate. 24
However the practicalities of the investment environment can difficulties (Table 4.2).
Table 4.2 Investment environment issues
Issue Cost
Costs Officially sanctioned wage increases in the manufacturing sector have increased competitive
pressure on the sector, especially in comparison with China, which has relatively high labour
productivity compared to Indonesia.
Regional levies Some local (district level) governments have introduced significant levies on mining and other
companies with foreign investment.
Weak legal protections The Canadian insurance company, Manulife was sued by its former Indonesian partners and
declared bankrupt when it was evidently solvent. Although the case was eventually resolved in
Manulife’s favour, the international investment community will not quickly forget it.
Political stability As the new constitutional arrangements settle down some investors are less concerned about this
issue, however, others are waiting for the outcome of the 2004 elections (parliamentary and
Presidential) before committing to new projects.
Terrorism Terrorism risk will be a consideration for foreign investors although domestic investment has been
less hard-hit by the two recent attacks than might be expected.
Source: INSTATE research.
Approvals for foreign investment in 2003 were at about one third to one half the level of theboom years of 1994–97. Although there are still substantial capital outflows, many Indonesianofficials are anxious to create opportunities to add value to domestic and importedcommodities rather than import excessive amounts of finished products. In some cases,Australian and Indonesian companies are already doing this successfully.
Foreign investment in retailing was not permitted until relatively recently. Cooperative projectsin the early to mid 1990s were structured as non-equity deals, but direct equity is nowpossible.* The relationship between Dairy Farm (Wellcome supermarkets) of Hong Kong andthe Hero Group evolved this way and Dairy Farm now has a significant minority interest in Hero.
Foreigners can also now distribute goods produced locally, and apply to import and distributeforeign goods. 25 Agribusiness is also generally open to foreign investment.
A new investment law was expected in 2004 and this may map new directions in foreigninvestment policy. Attracting foreign investment in food processing is likely to remain a prioritybut the outlook for further liberalisation of big retailing and distribution is a little less certain.There is official concern about the modern retailing sector displacing traditional outlets andsome pressure to restrict modern retail sector growth by regulation; for example, by zoning.
FOO D E XPORTER S’ GUIDE TO INDONESIA 31
Chapter 4 Supply chains
* Partial deregulation of the retail and wholesale sectors was required by the IMF in 1998.
24 Badan Koordinasi Penanaman Modal, 2003, viewed 10 September 2003, <http://www.bkpm.go.id/>.
25 East Asia Analytical Unit, Indonesia – Facing the Challenge, Department of Foreign Affairs and Trade, Canberra, 2000, p. 17.
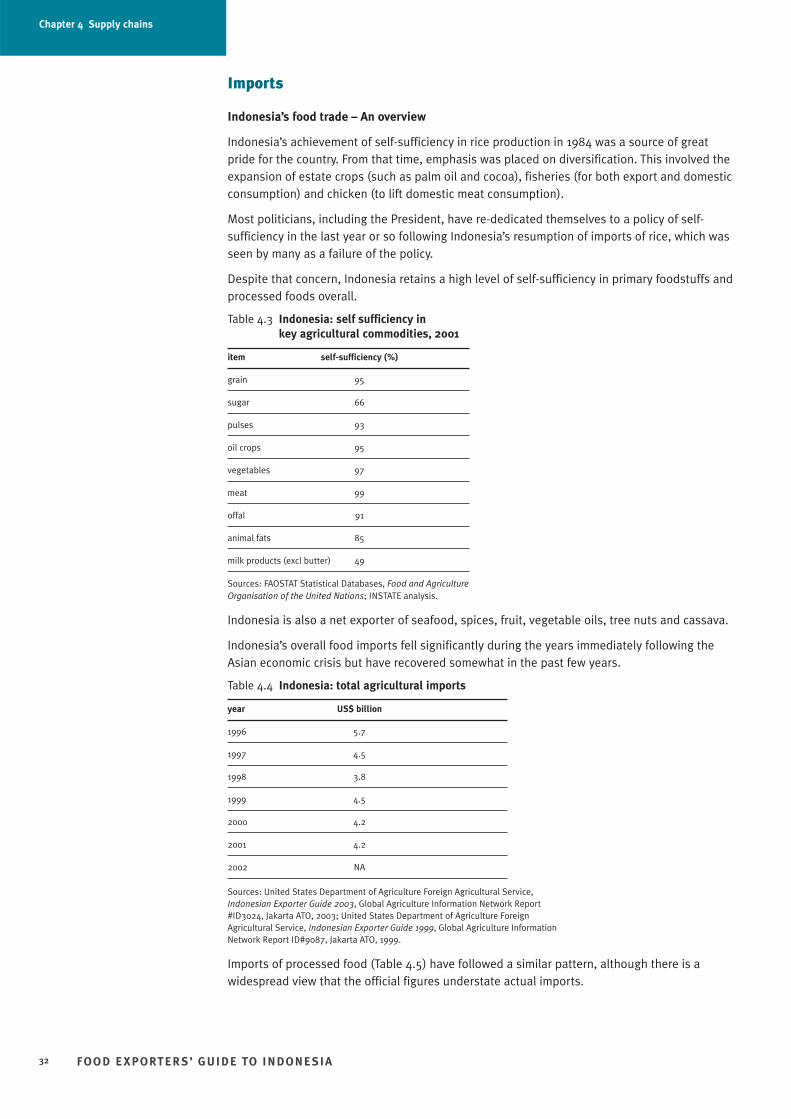
Imports
Indonesia’s food trade – An overview
Indonesia’s achievement of self-sufficiency in rice production in 1984 was a source of greatpride for the country. From that time, emphasis was placed on diversification. This involved theexpansion of estate crops (such as palm oil and cocoa), fisheries (for both export and domesticconsumption) and chicken (to lift domestic meat consumption).
Most politicians, including the President, have re-dedicated themselves to a policy of self-sufficiency in the last year or so following Indonesia’s resumption of imports of rice, which wasseen by many as a failure of the policy.
Despite that concern, Indonesia retains a high level of self-sufficiency in primary foodstuffs andprocessed foods overall.
Table 4.3 Indonesia: self sufficiency in key agricultural commodities, 2001
item self-sufficiency (%)
grain 95
sugar 66
pulses 93
oil crops 95
vegetables 97
meat 99
offal 91
animal fats 85
milk products (excl butter) 49
Sources: FAOSTAT Statistical Databases, Food and Agriculture Organisation of the United Nations; INSTATE analysis.
Indonesia is also a net exporter of seafood, spices, fruit, vegetable oils, tree nuts and cassava.
Indonesia’s overall food imports fell significantly during the years immediately following theAsian economic crisis but have recovered somewhat in the past few years.
Table 4.4 Indonesia: total agricultural imports
year US$ billion
1996 5.7
1997 4.5
1998 3.8
1999 4.5
2000 4.2
2001 4.2
2002 NA
Sources: United States Department of Agriculture Foreign Agricultural Service, Indonesian Exporter Guide 2003, Global Agriculture Information Network Report #ID3024, Jakarta ATO, 2003; United States Department of Agriculture Foreign Agricultural Service, Indonesian Exporter Guide 1999, Global Agriculture Information Network Report ID#9087, Jakarta ATO, 1999.
Imports of processed food (Table 4.5) have followed a similar pattern, although there is awidespread view that the official figures understate actual imports.
FOO D E XPORTER S’ GUIDE TO INDONESIA32
Chapter 4 Supply chains
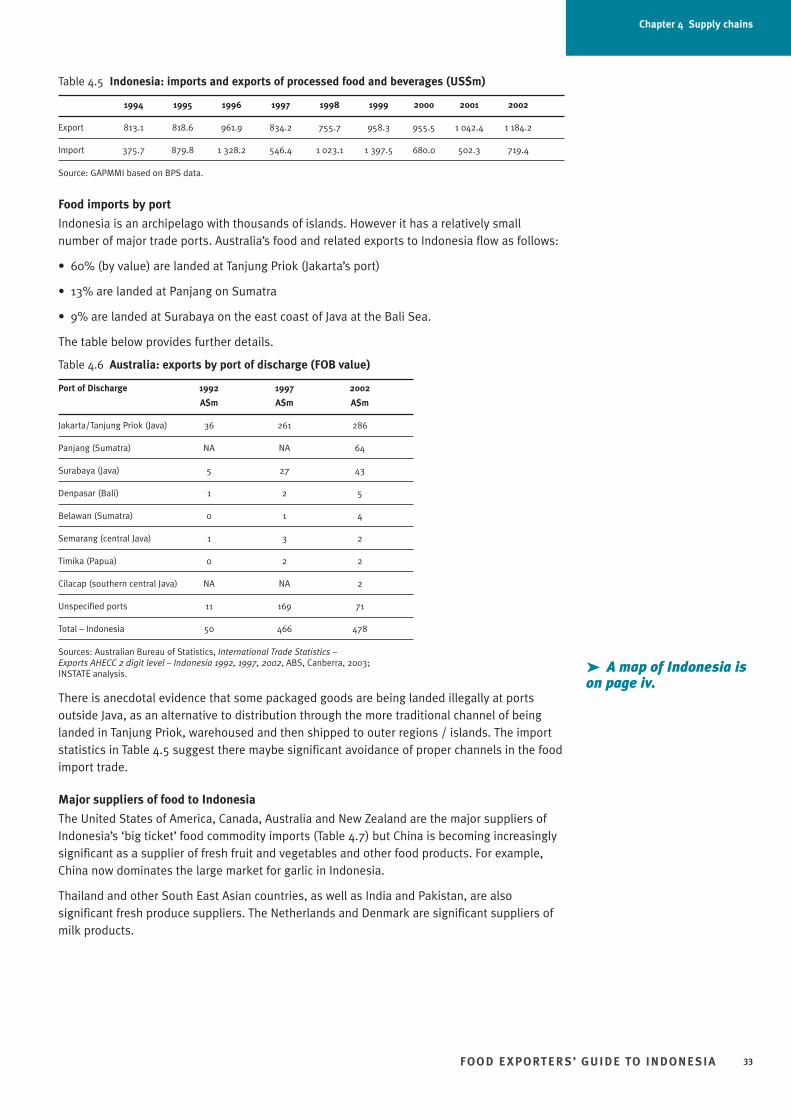
Table 4.5 Indonesia: imports and exports of processed food and beverages (US$m)
1994 1995 1996 1997 1998 1999 2000 2001 2002
Export 813.1 818.6 961.9 834.2 755.7 958.3 955.5 1 042.4 1 184.2
Import 375.7 879.8 1 328.2 546.4 1 023.1 1 397.5 680.0 502.3 719.4
Source: GAPMMI based on BPS data.
Food imports by port
Indonesia is an archipelago with thousands of islands. However it has a relatively smallnumber of major trade ports. Australia’s food and related exports to Indonesia flow as follows:
• 60% (by value) are landed at Tanjung Priok (Jakarta’s port)
• 13% are landed at Panjang on Sumatra
• 9% are landed at Surabaya on the east coast of Java at the Bali Sea.
The table below provides further details.
Table 4.6 Australia: exports by port of discharge (FOB value)
Port of Discharge 1992 1997 2002
A$m A$m A$m
Jakarta/Tanjung Priok (Java) 36 261 286
Panjang (Sumatra) NA NA 64
Surabaya (Java) 5 27 43
Denpasar (Bali) 1 2 5
Belawan (Sumatra) 0 1 4
Semarang (central Java) 1 3 2
Timika (Papua) 0 2 2
Cilacap (southern central Java) NA NA 2
Unspecified ports 11 169 71
Total – Indonesia 50 466 478
Sources: Australian Bureau of Statistics, International Trade Statistics – Exports AHECC 2 digit level – Indonesia 1992, 1997, 2002, ABS, Canberra, 2003; INSTATE analysis.
There is anecdotal evidence that some packaged goods are being landed illegally at portsoutside Java, as an alternative to distribution through the more traditional channel of beinglanded in Tanjung Priok, warehoused and then shipped to outer regions / islands. The importstatistics in Table 4.5 suggest there maybe significant avoidance of proper channels in the foodimport trade.
Major suppliers of food to Indonesia
The United States of America, Canada, Australia and New Zealand are the major suppliers ofIndonesia’s ‘big ticket’ food commodity imports (Table 4.7) but China is becoming increasinglysignificant as a supplier of fresh fruit and vegetables and other food products. For example,China now dominates the large market for garlic in Indonesia.
Thailand and other South East Asian countries, as well as India and Pakistan, are alsosignificant fresh produce suppliers. The Netherlands and Denmark are significant suppliers ofmilk products.
FOO D E XPORTER S’ GUIDE TO INDONESIA 33
➤ A map of Indonesia ison page iv.
Chapter 4 Supply chains
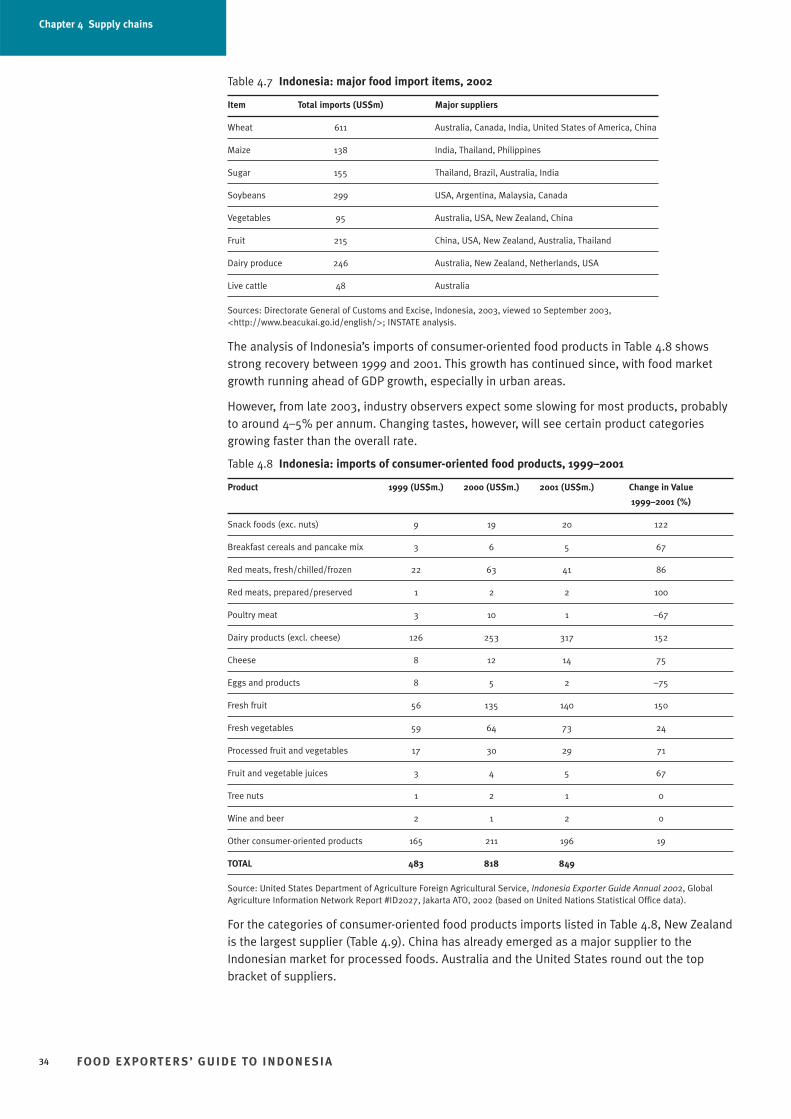
Table 4.7 Indonesia: major food import items, 2002
Item Total imports (US$m) Major suppliers
Wheat 611 Australia, Canada, India, United States of America, China
Maize 138 India, Thailand, Philippines
Sugar 155 Thailand, Brazil, Australia, India
Soybeans 299 USA, Argentina, Malaysia, Canada
Vegetables 95 Australia, USA, New Zealand, China
Fruit 215 China, USA, New Zealand, Australia, Thailand
Dairy produce 246 Australia, New Zealand, Netherlands, USA
Live cattle 48 Australia
Sources: Directorate General of Customs and Excise, Indonesia, 2003, viewed 10 September 2003,<http://www.beacukai.go.id/english/>; INSTATE analysis.
The analysis of Indonesia’s imports of consumer-oriented food products in Table 4.8 showsstrong recovery between 1999 and 2001. This growth has continued since, with food marketgrowth running ahead of GDP growth, especially in urban areas.
However, from late 2003, industry observers expect some slowing for most products, probablyto around 4–5% per annum. Changing tastes, however, will see certain product categoriesgrowing faster than the overall rate.
Table 4.8 Indonesia: imports of consumer-oriented food products, 1999–2001
Product 1999 (US$m.) 2000 (US$m.) 2001 (US$m.) Change in Value
1999–2001 (%)
Snack foods (exc. nuts) 9 19 20 122
Breakfast cereals and pancake mix 3 6 5 67
Red meats, fresh/chilled/frozen 22 63 41 86
Red meats, prepared/preserved 1 2 2 100
Poultry meat 3 10 1 –67
Dairy products (excl. cheese) 126 253 317 152
Cheese 8 12 14 75
Eggs and products 8 5 2 –75
Fresh fruit 56 135 140 150
Fresh vegetables 59 64 73 24
Processed fruit and vegetables 17 30 29 71
Fruit and vegetable juices 3 4 5 67
Tree nuts 1 2 1 0
Wine and beer 2 1 2 0
Other consumer-oriented products 165 211 196 19
TOTAL 483 818 849
Source: United States Department of Agriculture Foreign Agricultural Service, Indonesia Exporter Guide Annual 2002, GlobalAgriculture Information Network Report #ID2027, Jakarta ATO, 2002 (based on United Nations Statistical Office data).
For the categories of consumer-oriented food products imports listed in Table 4.8, New Zealandis the largest supplier (Table 4.9). China has already emerged as a major supplier to theIndonesian market for processed foods. Australia and the United States round out the topbracket of suppliers.
FOO D E XPORTER S’ GUIDE TO INDONESIA34
Chapter 4 Supply chains
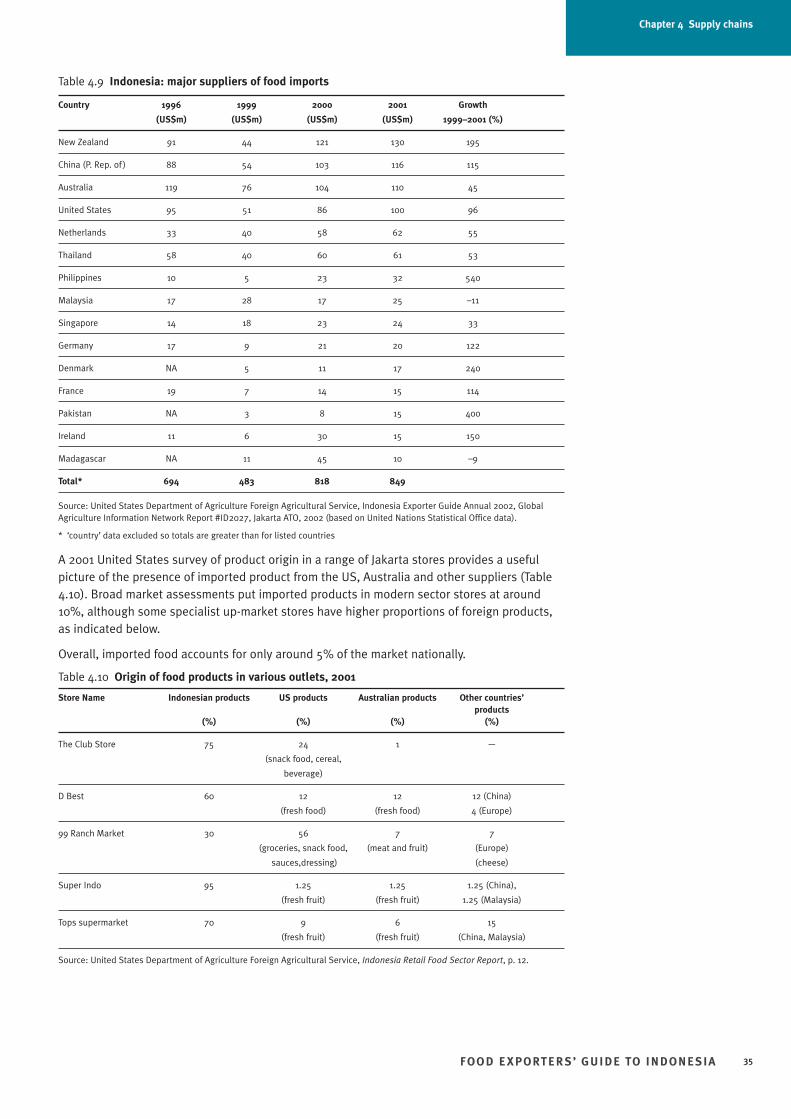
Table 4.9 Indonesia: major suppliers of food imports
Country 1996 1999 2000 2001 Growth
(US$m) (US$m) (US$m) (US$m) 1999–2001 (%)
New Zealand 91 44 121 130 195
China (P. Rep. of ) 88 54 103 116 115
Australia 119 76 104 110 45
United States 95 51 86 100 96
Netherlands 33 40 58 62 55
Thailand 58 40 60 61 53
Philippines 10 5 23 32 540
Malaysia 17 28 17 25 –11
Singapore 14 18 23 24 33
Germany 17 9 21 20 122
Denmark NA 5 11 17 240
France 19 7 14 15 114
Pakistan NA 3 8 15 400
Ireland 11 6 30 15 150
Madagascar NA 11 45 10 –9
Total* 694 483 818 849
Source: United States Department of Agriculture Foreign Agricultural Service, Indonesia Exporter Guide Annual 2002, GlobalAgriculture Information Network Report #ID2027, Jakarta ATO, 2002 (based on United Nations Statistical Office data).
* ‘country’ data excluded so totals are greater than for listed countries
A 2001 United States survey of product origin in a range of Jakarta stores provides a usefulpicture of the presence of imported product from the US, Australia and other suppliers (Table4.10). Broad market assessments put imported products in modern sector stores at around10%, although some specialist up-market stores have higher proportions of foreign products,as indicated below.
Overall, imported food accounts for only around 5% of the market nationally.
Table 4.10 Origin of food products in various outlets, 2001
Store Name Indonesian products US products Australian products Other countries’products
(%) (%) (%) (%)
The Club Store 75 24 1 —
(snack food, cereal,
beverage)
D Best 60 12 12 12 (China)
(fresh food) (fresh food) 4 (Europe)
99 Ranch Market 30 56 7 7
(groceries, snack food, (meat and fruit) (Europe)
sauces,dressing) (cheese)
Super Indo 95 1.25 1.25 1.25 (China),
(fresh fruit) (fresh fruit) 1.25 (Malaysia)
Tops supermarket 70 9 6 15
(fresh fruit) (fresh fruit) (China, Malaysia)
Source: United States Department of Agriculture Foreign Agricultural Service, Indonesia Retail Food Sector Report, p. 12.
FOO D E XPORTER S’ GUIDE TO INDONESIA 35
Chapter 4 Supply chains
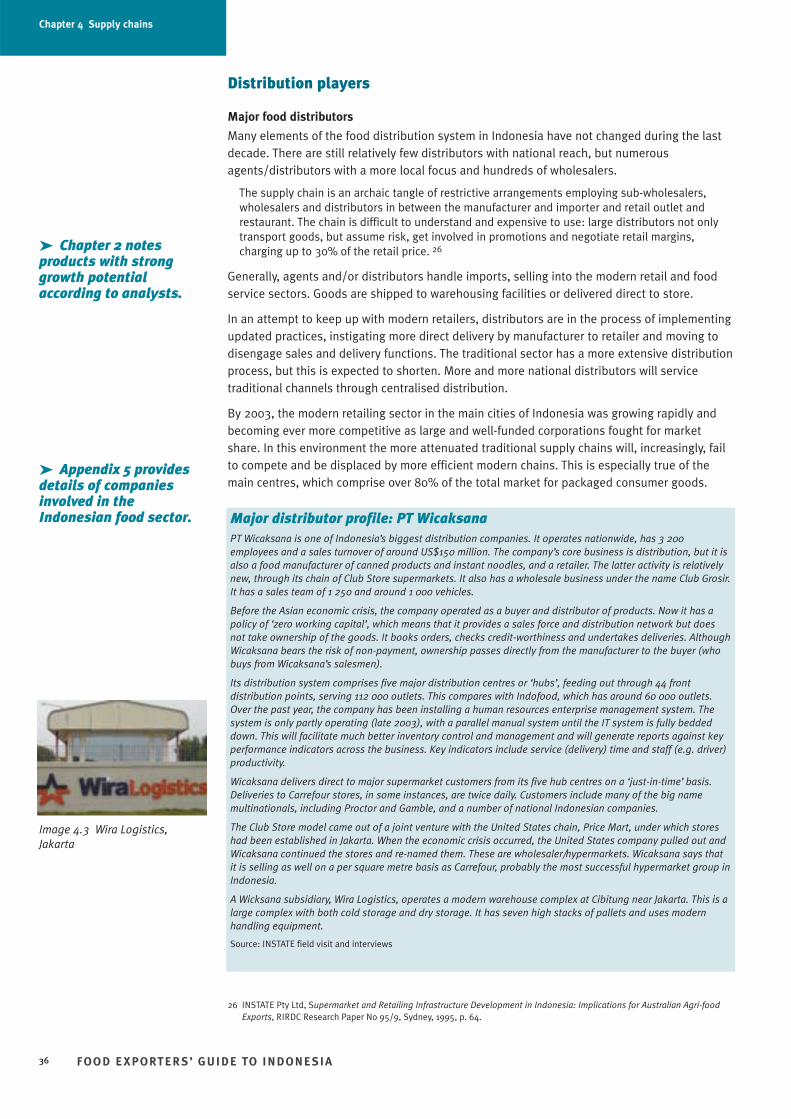
Distribution players
Major food distributors
Many elements of the food distribution system in Indonesia have not changed during the lastdecade. There are still relatively few distributors with national reach, but numerousagents/distributors with a more local focus and hundreds of wholesalers.
The supply chain is an archaic tangle of restrictive arrangements employing sub-wholesalers,wholesalers and distributors in between the manufacturer and importer and retail outlet andrestaurant. The chain is difficult to understand and expensive to use: large distributors not onlytransport goods, but assume risk, get involved in promotions and negotiate retail margins,charging up to 30% of the retail price. 26
Generally, agents and/or distributors handle imports, selling into the modern retail and foodservice sectors. Goods are shipped to warehousing facilities or delivered direct to store.
In an attempt to keep up with modern retailers, distributors are in the process of implementingupdated practices, instigating more direct delivery by manufacturer to retailer and moving todisengage sales and delivery functions. The traditional sector has a more extensive distributionprocess, but this is expected to shorten. More and more national distributors will servicetraditional channels through centralised distribution.
By 2003, the modern retailing sector in the main cities of Indonesia was growing rapidly andbecoming ever more competitive as large and well-funded corporations fought for marketshare. In this environment the more attenuated traditional supply chains will, increasingly, failto compete and be displaced by more efficient modern chains. This is especially true of themain centres, which comprise over 80% of the total market for packaged consumer goods.
FOO D E XPORTER S’ GUIDE TO INDONESIA36
➤ Appendix 5 providesdetails of companiesinvolved in theIndonesian food sector.
➤ Chapter 2 notesproducts with stronggrowth potentialaccording to analysts.
Chapter 4 Supply chains
26 INSTATE Pty Ltd, Supermarket and Retailing Infrastructure Development in Indonesia: Implications for Australian Agri-foodExports, RIRDC Research Paper No 95/9, Sydney, 1995, p. 64.
Major distributor profile: PT WicaksanaPT Wicaksana is one of Indonesia’s biggest distribution companies. It operates nationwide, has 3 200employees and a sales turnover of around US$150 million. The company’s core business is distribution, but it isalso a food manufacturer of canned products and instant noodles, and a retailer. The latter activity is relativelynew, through its chain of Club Store supermarkets. It also has a wholesale business under the name Club Grosir.It has a sales team of 1 250 and around 1 000 vehicles.
Before the Asian economic crisis, the company operated as a buyer and distributor of products. Now it has apolicy of ‘zero working capital’, which means that it provides a sales force and distribution network but doesnot take ownership of the goods. It books orders, checks credit-worthiness and undertakes deliveries. AlthoughWicaksana bears the risk of non-payment, ownership passes directly from the manufacturer to the buyer (whobuys from Wicaksana’s salesmen).
Its distribution system comprises five major distribution centres or ‘hubs’, feeding out through 44 frontdistribution points, serving 112 000 outlets. This compares with Indofood, which has around 60 000 outlets.Over the past year, the company has been installing a human resources enterprise management system. Thesystem is only partly operating (late 2003), with a parallel manual system until the IT system is fully beddeddown. This will facilitate much better inventory control and management and will generate reports against keyperformance indicators across the business. Key indicators include service (delivery) time and staff (e.g. driver)productivity.
Wicaksana delivers direct to major supermarket customers from its five hub centres on a ‘just-in-time’ basis.Deliveries to Carrefour stores, in some instances, are twice daily. Customers include many of the big namemultinationals, including Proctor and Gamble, and a number of national Indonesian companies.
The Club Store model came out of a joint venture with the United States chain, Price Mart, under which storeshad been established in Jakarta. When the economic crisis occurred, the United States company pulled out andWicaksana continued the stores and re-named them. These are wholesaler/hypermarkets. Wicaksana says thatit is selling as well on a per square metre basis as Carrefour, probably the most successful hypermarket group inIndonesia.
A Wicksana subsidiary, Wira Logistics, operates a modern warehouse complex at Cibitung near Jakarta. This is alarge complex with both cold storage and dry storage. It has seven high stacks of pallets and uses modernhandling equipment.
Source: INSTATE field visit and interviews
Image 4.3 Wira Logistics,Jakarta
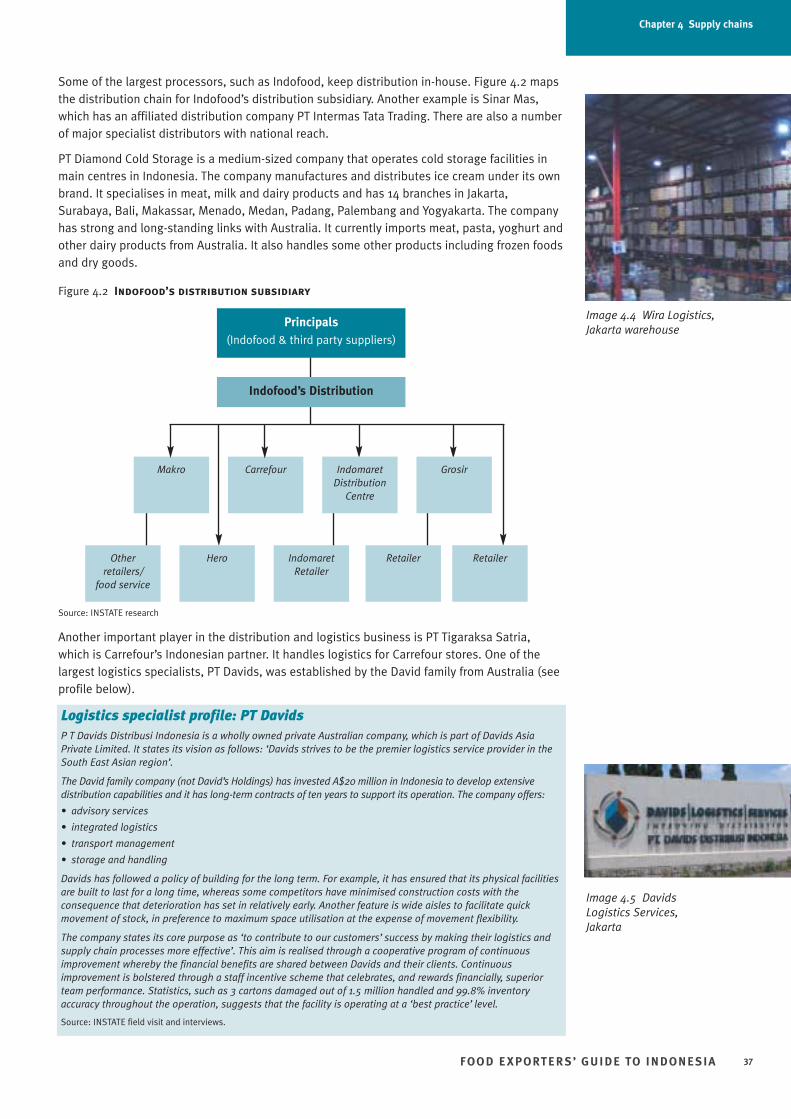
Some of the largest processors, such as Indofood, keep distribution in-house. Figure 4.2 mapsthe distribution chain for Indofood’s distribution subsidiary. Another example is Sinar Mas,which has an affiliated distribution company PT Intermas Tata Trading. There are also a numberof major specialist distributors with national reach.
PT Diamond Cold Storage is a medium-sized company that operates cold storage facilities inmain centres in Indonesia. The company manufactures and distributes ice cream under its ownbrand. It specialises in meat, milk and dairy products and has 14 branches in Jakarta,Surabaya, Bali, Makassar, Menado, Medan, Padang, Palembang and Yogyakarta. The companyhas strong and long-standing links with Australia. It currently imports meat, pasta, yoghurt andother dairy products from Australia. It also handles some other products including frozen foodsand dry goods.
Figure 4.2 Indofood’s distribution subsidiary
Source: INSTATE research
Another important player in the distribution and logistics business is PT Tigaraksa Satria,which is Carrefour’s Indonesian partner. It handles logistics for Carrefour stores. One of thelargest logistics specialists, PT Davids, was established by the David family from Australia (seeprofile below).
FOO D E XPORTER S’ GUIDE TO INDONESIA 37
Image 4.4 Wira Logistics,Jakarta warehouse
Chapter 4 Supply chains
Principals(Indofood & third party suppliers)
Indofood’s Distribution
Carrefour
Hero Retailer
Makro
Otherretailers/
food service
GrosirIndomaretDistribution
Centre
RetailerIndomaretRetailer
Image 4.5 DavidsLogistics Services,Jakarta
Logistics specialist profile: PT DavidsP T Davids Distribusi Indonesia is a wholly owned private Australian company, which is part of Davids AsiaPrivate Limited. It states its vision as follows: ‘Davids strives to be the premier logistics service provider in theSouth East Asian region’.
The David family company (not David’s Holdings) has invested A$20 million in Indonesia to develop extensivedistribution capabilities and it has long-term contracts of ten years to support its operation. The company offers:
• advisory services
• integrated logistics
• transport management
• storage and handling
Davids has followed a policy of building for the long term. For example, it has ensured that its physical facilitiesare built to last for a long time, whereas some competitors have minimised construction costs with theconsequence that deterioration has set in relatively early. Another feature is wide aisles to facilitate quickmovement of stock, in preference to maximum space utilisation at the expense of movement flexibility.
The company states its core purpose as ‘to contribute to our customers’ success by making their logistics andsupply chain processes more effective’. This aim is realised through a cooperative program of continuousimprovement whereby the financial benefits are shared between Davids and their clients. Continuousimprovement is bolstered through a staff incentive scheme that celebrates, and rewards financially, superiorteam performance. Statistics, such as 3 cartons damaged out of 1.5 million handled and 99.8% inventoryaccuracy throughout the operation, suggests that the facility is operating at a ‘best practice’ level.
Source: INSTATE field visit and interviews.
Where the food goes – by channel and by region
Davids provide a very instructive analysis of the distribution market for fast moving consumergoods (FMCG). Table 4.11 maps the breakdown of FMCG distribution by retail / trade channel.
Table 4.11 Indonesia: food distribution by retail / trade channel
Number % Business contribution
Total Outlets 2 000 000 100
Outlet/per capita 107
Modern Trade
• Hyper/supermarkets 500 25
• Mini markets 2 500
Traditional Trade
• Wholesalers + national distributors 2 000 15–40*
• Others (sub dist., sub wholesalers, P&D, wet market) 1 995 000 60–35*
Source: PT Davids Distribusi Indonesia, Improving Supply Chains, PowerPoint Presentation, Jakarta, 2003.
* depending on product type
Similarly, Table 4.12 sets out the markets for FMCG by geographic region:
• Jakarta alone represents over one third of the national market for FMCG products
• Jakarta, Surabaya and Medan represent over 50% of the national market.
While Indonesia’s physical infrastructure is a real constraint on food distribution, this analysisshould help keep its current impact in perspective.
Table 4.12 Indonesia: food distribution by geographic region
Java 60%
of which Jakarta 60%
Surabaya 20%
Bandung 10%
Semarang 10%
Sumatra 20%
of which Medan 50%
Padang 25%
Lampung, Jambi, Palembang 15%
Banda Aceh 10%
Eastern Indonesia 15%
of which Papua 30%
Bali 25%
Makassar (Ujung Padang) 25%
Lombok 10%
Maluku (Ambon) 10%
Kalimantan 5%
of which Balikpapan, Samarinda 50%
Palankaraya 30%
Pontianak 20%
100%
Source: PT Davids Distribusi Indonesia, Improving Supply Chains.
* depending upon product type
Niche distributors
For smaller Australian companies targeting a niche market, smaller specialist distributors willprovide an alternative to the very large distributors.
FOO D E XPORTER S’ GUIDE TO INDONESIA38
Image 4.6 Davids 25 000 m2 drywarehouse, Jakarta 27
Chapter 4 Supply chains
27 PT Davids Distribusi Indonesia, Improving Supply Chains.
A good example is PT Indoguna, which supplies Australian meats and cheeses to the foodservice industry. Indoguna is an importer and supplier to hotels and restaurants. It alsooperates a small retail outlet in South Jakarta co-located with its offices. Indoguna importsmeats, fish, oysters and offal. It imports regularly from Australian sources and is well regardedin the market.
At the smaller end of the spectrum, companies tend to move in and out of food distributionmore rapidly. Some work across a range of product categories while others tend to specialise.Potential Australian exporters should carefully investigate the background, skills and focus ofsmaller distributors to ensure a good match with their business and expectations.
Direct importing by retail chains and food service
A decade ago, it seemed possible that direct importing by big retailers and food servicecompanies would sweep across markets like Indonesia, continuing the trend that had begun inJapan. However this has not actually been the case.
Certainly, larger retailers and food service operators want to ‘own’ and directly managerelationships with their major suppliers. But, for practical reasons, many will still outsource toimporters the task of dealing with Indonesia’s complex entry requirements and managephysical clearance of product. In addition, the Hero/Davids relationship described above is agood example of the way that even the largest players also contract out logistics.
In the short to medium term, it is difficult to see direct importing becoming widespread in theIndonesian market.
The role of Singapore trading companies
Singapore has long been the major trade hub in South East Asia. It is the major trans-shipmentpoint for goods destined for Indonesian markets and Singapore also has a host of tradingcompanies that specialise in distribution of products into and throughout Indonesia. Singaporehas also been the major foreign investor in Indonesia since the crisis.
FOO D E XPORTER S’ GUIDE TO INDONESIA 39
➤ Appendix 5 providescontact details forcompanies involved inthe Indonesian foodsector.
Chapter 4 Supply chains
Bali: a special case?Bali is a major international tourist destination well known to many Australians.
Prior to the Bali bombings, direct arrivals of foreign visitors in Bali averaged 1.2 to 1.4 million per annum and itis estimated that a similar number travel to Bali from other parts of Indonesia. Australia has traditionally beenthe largest source of foreign tourists but, in recent years, Japan has outstripped Australia and Taiwan also rivalsAustralia in visitor numbers. Other major sources of visitors are the United Kingdom, France, Italy, Germany, theNetherlands and Russia. Domestic tourists account for about 20% of total visitors.
Bali caters both for budget package tourists and those looking for a luxury tourist experience. It has bothwestern-style hotels as well as traditional Bali accommodation, including home stay. In total, Bali has around35 000 tourist rooms, half of which are in ‘starred’ hotels.
Tourist flows to Bali have always fluctuated. Recent shocks have included September 11, SARS and the Balibombings. As of late 2003, occupancy levels remained relatively low. However as one interviewee remarked:‘Bali always bounces back’.
The major users of imported products in Bali are hotels, restaurants, the local food processing sector and theAerowisata Flight Catering Service.
According to a local player in food distribution, fresh food consumed in Bali hotels comes largely fromIndonesian sources, including Bali itself. This is supplemented by imports of, for example, temperate fruits,meats (beef, lamb, pork and smallgoods) and dairy products. Australia and New Zealand are the dominantsuppliers. Others include the United States of America, New Zealand and Europe.
Higher-value and perishable products—such as meat and fresh produce—arrive in Bali direct by airfreight. Thebalance travels to the island via Java, typically arriving at Surabaya and being routed overland by ferry to Bali orby feeder shipping service from Surabaya to Bali’s Benoa harbour.
Some importers supplying the Bali market are based locally, but many are national operators located in Jakartaor, sometimes, Surabaya. Bali also serves as a hub for distribution to expatriate communities on more easterlyislands such as Lombok and Sumbawa.
In summary, Bali has some unique characteristics as a market for imported food but retains strong linkages tonational distribution networks.
Sources: INSTATE interviews, October 2003; The World Bank Group, World Development Indicators 2002, The World BankGroup, Washington, 2002.
➤ Chapter 5 describesthe businessenvironment in Indonesiafor food exporters.
In turn, many Indonesian business people have traditionally located their holding companies inSingapore and used it as a bridge to international financial and merchandise markets.
These business ties are often built on family relationships that straddle both countries,especially with the ethnic Chinese community that plays an important role in the Indonesianeconomy.
This means that, for some Australian exporters, the road to Indonesian markets will journey viaSingapore. However the depth of economic and personal ties between the two countries doesnot, of course, mean that any Singapore company can guarantee success in Indonesia toAustralian exporters. The same common sense tests outlined in the ‘Finding the Right Partner’section in Chapter 5 should be applied, no matter where the potential partner is located.
Australian accumulators
Accumulators–the one vital element of every business community whose specific commercialrationale it is to actually create mass. These are the enterprises whose business it is tounderstand buyers’ requirements, assess supply possibilities and organise supply sources tomatch. However, the role of these accumulators and their capacity to contribute to the overallperformance of the food sector is often unrecognised, under-weighted, or evenmisunderstood–simply because they do not actually make things. 28
Accumulators, or consolidators, can play an important role in servicing markets in which exportvolumes are small and have skills not necessarily possessed by new or niche exporters.
Austrade can provide contact details for some of the major consolidators servicing theIndonesian market.
Supply chain and infrastructure issues Beyond a few major Indonesian cities, distribution is a nightmare. 30
Supply chain logistics in Indonesia range from pre-modern era practices—sailing ships andcargo carried by stevedores on their shoulders—to contemporary best practice, as in theDavids operation.
When considering infrastructure constraints, however, it should be kept in mind that Java andSumatra account for around 80% of the market for fast moving consumer goods other thanfresh and frozen food.
Java has reasonably effective distribution infrastructure and urban areas in Sumatra, Bali andSulawesi are also developing rapidly. Infrastructure and cold storage facilities outside thesecentres are generally poorly developed, making the distribution of products to outlets inremote areas problematic.
Imports to Indonesia generally need a shelf life of at least 6 months, and products requiringrefrigerated transport and storage incur high transport costs.
FOO D E XPORTER S’ GUIDE TO INDONESIA40
Chapter 4 Supply chains
28 INSTATE Pty Ltd, An Examination of the Accumulator Approach: An Export Marketing Solution for Small Business, INSTATE Pty Ltd, Sydney, 1998.
29 INSTATE interview, September 2003.
30 INSTATE interview with a senior manager at a major retail chain, Jakarta, September 2003.
Accumulator at workOne Australian accumulator sells into the market through PT Diamond, a major distributor that supplies allformats in retail—to NTUC and Australian Pavilion Stores (in Singapore) for instance—and food service,including bulk to fast food chains. PT Diamond lands and clears imports to a central distribution facility in Jakarta. From there, distribution is largely by road. The firmhas 14 branch offices through the archipelago, some of which hold stock. PT Diamond invested significantly innew warehousing and a fleet of refrigerated trucks pre-crisis.
This accumulator admits it would prefer to be selling direct to retailers, as this results in a better margin for theretailer, better prices to consumers—and so higher volumes—and improved information back from the market.Distributors have little interest in reporting back how a product is performing. 29 However, retailers generallyprefer to purchase through importers to avoid having to deal with the complexities of customs clearance.
Source: INSTATE interview, October 2003.
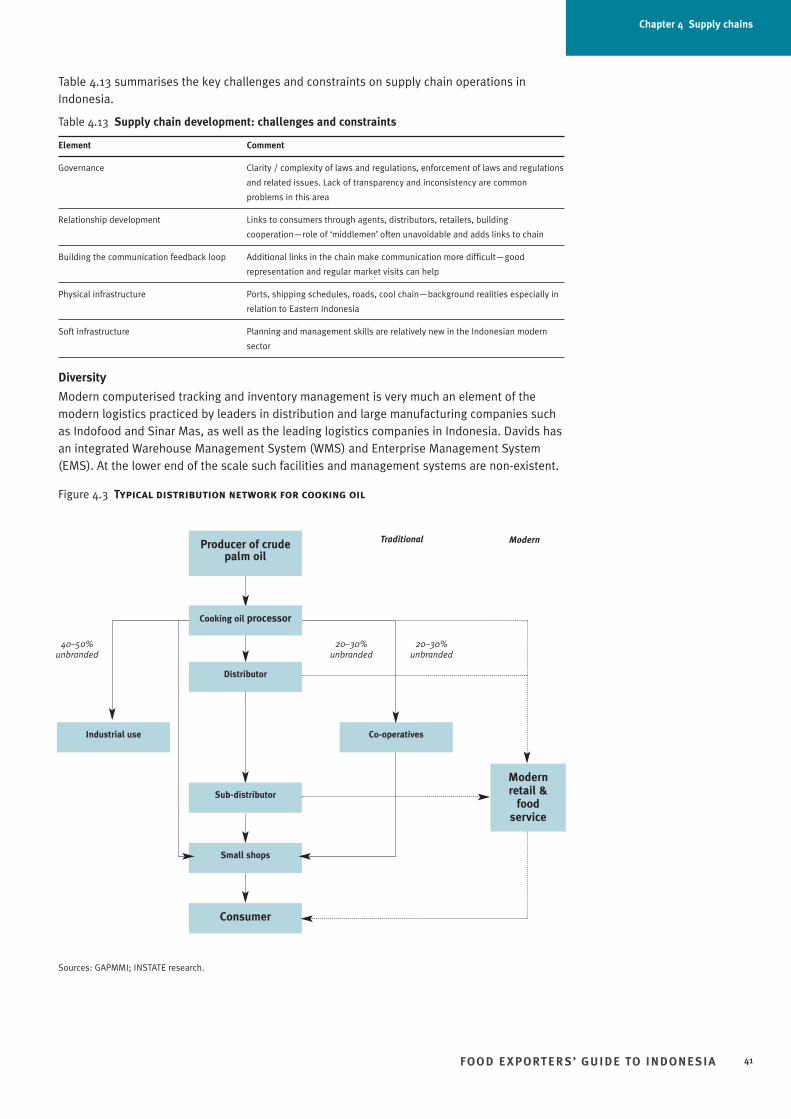
Chapter 4 Supply chains
Table 4.13 summarises the key challenges and constraints on supply chain operations inIndonesia.
Table 4.13 Supply chain development: challenges and constraints
Element Comment
Governance Clarity / complexity of laws and regulations, enforcement of laws and regulations
and related issues. Lack of transparency and inconsistency are common
problems in this area
Relationship development Links to consumers through agents, distributors, retailers, building
cooperation—role of ‘middlemen’ often unavoidable and adds links to chain
Building the communication feedback loop Additional links in the chain make communication more difficult—good
representation and regular market visits can help
Physical infrastructure Ports, shipping schedules, roads, cool chain—background realities especially in
relation to Eastern Indonesia
Soft infrastructure Planning and management skills are relatively new in the Indonesian modern
sector
Diversity
Modern computerised tracking and inventory management is very much an element of themodern logistics practiced by leaders in distribution and large manufacturing companies suchas Indofood and Sinar Mas, as well as the leading logistics companies in Indonesia. Davids hasan integrated Warehouse Management System (WMS) and Enterprise Management System(EMS). At the lower end of the scale such facilities and management systems are non-existent.
Figure 4.3 Typical distribution network for cooking oil
Sources: GAPMMI; INSTATE research.
FOO D E XPORTER S’ GUIDE TO INDONESIA 41
Traditional
Industrial use Co-operatives
Modernretail &
foodservice
Sub-distributor
Small shops
Consumer
Distributor
Producer of crudepalm oil
Cooking oil processor
Modern
20–30%unbranded
40–50%unbranded
20–30%unbranded
Use of specialist importers
Companies and institutions with a need for imported goods usually import through specialistimporters rather than directly, although good supply chain management principles wouldsuggest that costs and margins could be eliminated by direct importing. Many industry insidersexpress the view that if the ‘red tape’ issues could be resolved or simplified then they wouldexercise their preference for direct importing. On the other hand, there is a significant group ofspecialist importers who have a vested interest in the situation continuing as at present.
Decentralisation
Further along the chain, distribution is affected by the new complexities arising fromdecentralisation of government functions to the district/city level. Many local administrationshave levied various charges on business and it is not unusual for charges to be levied ontransportation of goods through regional administrative areas, thus adding to costs in thechain.
These are gradually being dealt with as the Indonesian Government refines its decentralisationmodel but will not quickly be eliminated. Large national distributors have a greater capacity tonegotiate these hurdles and their specialist knowledge can facilitate the operation of thesupply chain.
Physical infrastructure
The state of Indonesia’s physical infrastructure is, of course, a constraint on nationwidedistribution. Indonesia is an archipelago and this alone complicates transportation. Much of itmust be by sea or air. Indonesia has some well-developed container ports which can handlecargo efficiently. Examples are Jakarta (Tanjung Priok), Surabaya, Makassar and Medan.
Many other ports however, are shallow and lack container-handling facilities. These are servedby a multiplicity of small vessels, ranging from small coastal cargo ships of relatively moderndesign, to various, more traditional types of vessel, including the celebrated perincis thatproceed under sail or motor to serve smaller ports. These beautiful wooden sailing ships cancarry up to 1 500 tonnes, but loading and unloading is entirely manual—typically by stevedoresand crew balancing on a long plank from shore to ship as they carry items of cargo on theirshoulders for storage in the deep hold or on deck.
Shipping schedules are also unreliable, and an inadequate number of ships serve EasternIndonesia. Firms are forced to hold higher inventories and this imposes higher costs, especiallywhen the weather is bad. Theft and losses due to security problems are also an issue on outerislands. Indonesia is developing main road networks, including dual carriageway toll roads inJakarta, linking major centres. However, these networks are still quite limited in coverage, evenin Java and more so in other islands. A major consequence is that large trucks can only be usedon a very limited range of routes. For the remainder, only small trucks can be used. This causeslower productivity.
Shipping services to Indonesia
The majority of Indonesian trade is served by transhipment via Singapore on the various SoutheastAsian services. Some cargoes are also transhipped via services to other regional ports.
Details of services are available from all reliable freight forwarders.
At the time of writing, the only dedicated container services out of Australia serving Indonesiadirect were two Western Australian shuttle services:
• MSC-Capricorn
• Maersk/K-Line Western Australia Service. 31
In addition, there a few smaller operators that have Indonesian calls (such as Chief ContainerServices and Perkins).
FOO D E XPORTER S’ GUIDE TO INDONESIA42
➤ Chapter 7 outlines thepolitical and economicenvironment inIndonesia.
➤ Appendix 7 providescontact details forshipping and freightforwarding services.
Chapter 4 Supply chains
31 Meyrick & Associates, Liner Shipping Services to Indonesia, Wollongong, 2003.
5. BUSINESS ENVIRONMENT
Overview
• Indonesia’s tariffs on imported food products are low—5% for most products. VAT is 10%.Some products are also liable for luxury taxes.
• Registration procedures and labelling requirements for imported foodstuffs are quitedemanding. For example, each Indonesian importer of any food product needs to registerthe product, a process that can take as long as 6 months.
• Successful companies invest plenty of time in finding the right partner(agent/importer/distributor) to represent them on the ground in Indonesia.
• It is important to foster good personal relationships when doing business in Indonesia.However commonsense business principles should not be neglected for the sake of goodrelations per se and the business standing and skills of a potential partner should becarefully assessed.
• The basic ingredients of success in Indonesia, as elsewhere, are products that provide valuefor money and reliable servicing of customer requirements.
• The Indonesian business environment is not easy – payment risks, lack of transparency andsecurity concerns all need careful consideration.
TariffsIndonesia has cut its tariffs on food and other imports sharply during the last ten years.Effective from 1 February 1998, tariffs on all food items were reduced to a maximum of 5%, with just a few exceptions. A summary of current tariff rates on food products is set out inTable 5.1.
The rates summarised in Table 5.1 are so called ‘applied’ or actual tariff rates. The ‘bound’rates, which are the maximum tariffs Indonesia has committed to as part of its membership ofthe WTO, are significantly higher.* For most food products, the bound rate is between 27% and60%, but the bound rates are significantly higher for rice (160%), milk and cream (210%) andalcoholic drinks (over 100%).
A gap between the bound and applied tariffs means that, in theory, the Indonesian Governmenthas scope to raise applied tariffs at some point in the future.
Full details of bound tariffs can be found at the WTO website. 32
FOO D E XPORTER S’ GUIDE TO INDONESIA 43
➤ Appendix 4 liststariffs on food andbeverage items inIndonesia.
Chapter 5 Business environment
* to be phased in by 2004.
32 World Trade Organisation, WTO Goods Schedules – Members’ Commitments, 2003, viewed 12 October 2003,<http://www.wto.org/english/tratop_e/schedules_e/goods_schedules_e.htm>.
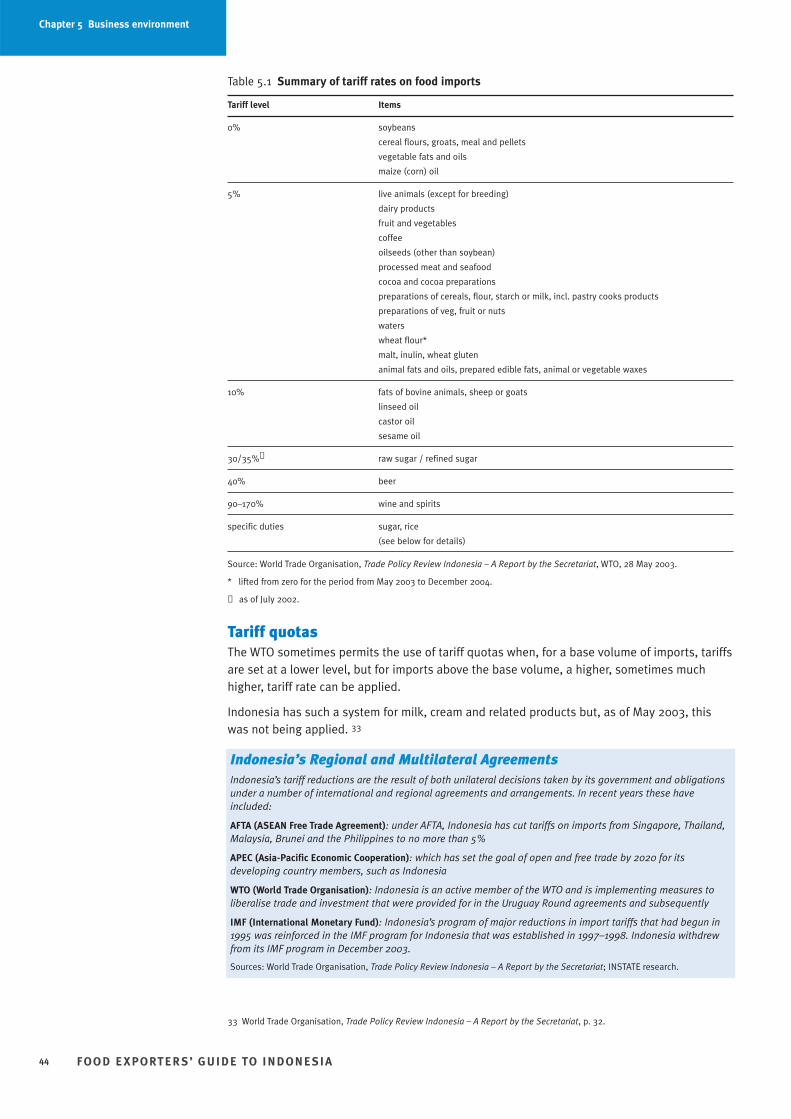
Table 5.1 Summary of tariff rates on food imports
Tariff level Items
0% soybeans
cereal flours, groats, meal and pellets
vegetable fats and oils
maize (corn) oil
5% live animals (except for breeding)
dairy products
fruit and vegetables
coffee
oilseeds (other than soybean)
processed meat and seafood
cocoa and cocoa preparations
preparations of cereals, flour, starch or milk, incl. pastry cooks products
preparations of veg, fruit or nuts
waters
wheat flour*
malt, inulin, wheat gluten
animal fats and oils, prepared edible fats, animal or vegetable waxes
10% fats of bovine animals, sheep or goats
linseed oil
castor oil
sesame oil
30/35%✝ raw sugar / refined sugar
40% beer
90–170% wine and spirits
specific duties sugar, rice
(see below for details)
Source: World Trade Organisation, Trade Policy Review Indonesia – A Report by the Secretariat, WTO, 28 May 2003.
* lifted from zero for the period from May 2003 to December 2004.
✝ as of July 2002.
Tariff quotasThe WTO sometimes permits the use of tariff quotas when, for a base volume of imports, tariffsare set at a lower level, but for imports above the base volume, a higher, sometimes muchhigher, tariff rate can be applied.
Indonesia has such a system for milk, cream and related products but, as of May 2003, thiswas not being applied. 33
FOO D E XPORTER S’ GUIDE TO INDONESIA44
Chapter 5 Business environment
Indonesia’s Regional and Multilateral AgreementsIndonesia’s tariff reductions are the result of both unilateral decisions taken by its government and obligationsunder a number of international and regional agreements and arrangements. In recent years these haveincluded:
AFTA (ASEAN Free Trade Agreement): under AFTA, Indonesia has cut tariffs on imports from Singapore, Thailand,Malaysia, Brunei and the Philippines to no more than 5%
APEC (Asia-Pacific Economic Cooperation): which has set the goal of open and free trade by 2020 for itsdeveloping country members, such as Indonesia
WTO (World Trade Organisation): Indonesia is an active member of the WTO and is implementing measures toliberalise trade and investment that were provided for in the Uruguay Round agreements and subsequently
IMF (International Monetary Fund): Indonesia’s program of major reductions in import tariffs that had begun in1995 was reinforced in the IMF program for Indonesia that was established in 1997–1998. Indonesia withdrewfrom its IMF program in December 2003.
Sources: World Trade Organisation, Trade Policy Review Indonesia – A Report by the Secretariat; INSTATE research.
33 World Trade Organisation, Trade Policy Review Indonesia – A Report by the Secretariat, p. 32.
Specific dutiesThe percentage tariff rates summarised above are called ad valorem tariffs (or duties).However, Indonesia has applied fixed or specific duties on several imported food products. Insome cases, the Indonesian Government has said this is in order to avoid under-invoicingpractices. While rare, specific duties are in place on rice and sugar:
• For rice and rice flour, the import duty rate is currently set at Rp430/kg.
• Specific duties on raw sugar and white sugar were set at Rp450 and Rp534/kg respectivelyin June 2002 and were further increased to Rp550 and Rp700/kg respectively in March 2003.
Import duty calculation and ‘check price’ systemImport duties and other domestic taxes (see below) are based on the CIF value; that is, thelanded cost in an Indonesian port, including freight and insurance.
As a result of under-declaration of import values by some importers, Indonesian Customsimplemented a ‘check price’ system in 2002 to assess duties on all food product imports. Inaddition they switched some ad valorem duties to specific duties (see above).
This system means that Indonesian officials have the discretion to assess what they consider arealistic valuation. This can be higher than the value declared by importers.
Other taxesAn income tax is levied at 2.5% of the CIF value of imports.
Value added tax (VAT or PPN) is levied on almost all goods, including imports, at a rate of 10%.VAT applies to processed food products but not to fresh foodstuffs.
A luxury tax of between 10% and 75% is levied on certain products—whether imported orproduced domestically. Food products subject to luxury tax are:
• Yoghurt, cheese and butter: 10% luxury sales tax
• Alcoholic beverages: 40–75%. 34
As of early 2004, reforms to the tax system were under consideration.
Importer registration and income tax There are two type of importers, producer importers and general importers. All importers arerequired to register with the Ministry of Finance and Customs and Ministry of Industry andTrade and obtain a Tax registration number and an importers identity number (API) from theMinistry of Trade and Industry. 35
As of late 2003, Indonesia had about 7 000 registered importers, although up to 20% werethought likely to lose their licenses as a result of their failure to report required company dataduring recent anti-smuggling checks.
Basic documentation requirements for import shipments include:
• import declaration
• pro-forma invoice
• commercial invoice
• certificate of origin
• Bill of lading legalised by the carrier
• insurance certificate
• further certification for specified products
• packing list.
FOO D E XPORTER S’ GUIDE TO INDONESIA 45
Chapter 5 Business environment
34 Austrade, Canberra, 2003, viewed 10 August 2003, <http://www.austrade.gov.au>.
35 Indonesian Ministry of Industry and Trade, Jakarta, 2003, viewed 4 November 2003, <http://www.dprin.go.id/>.
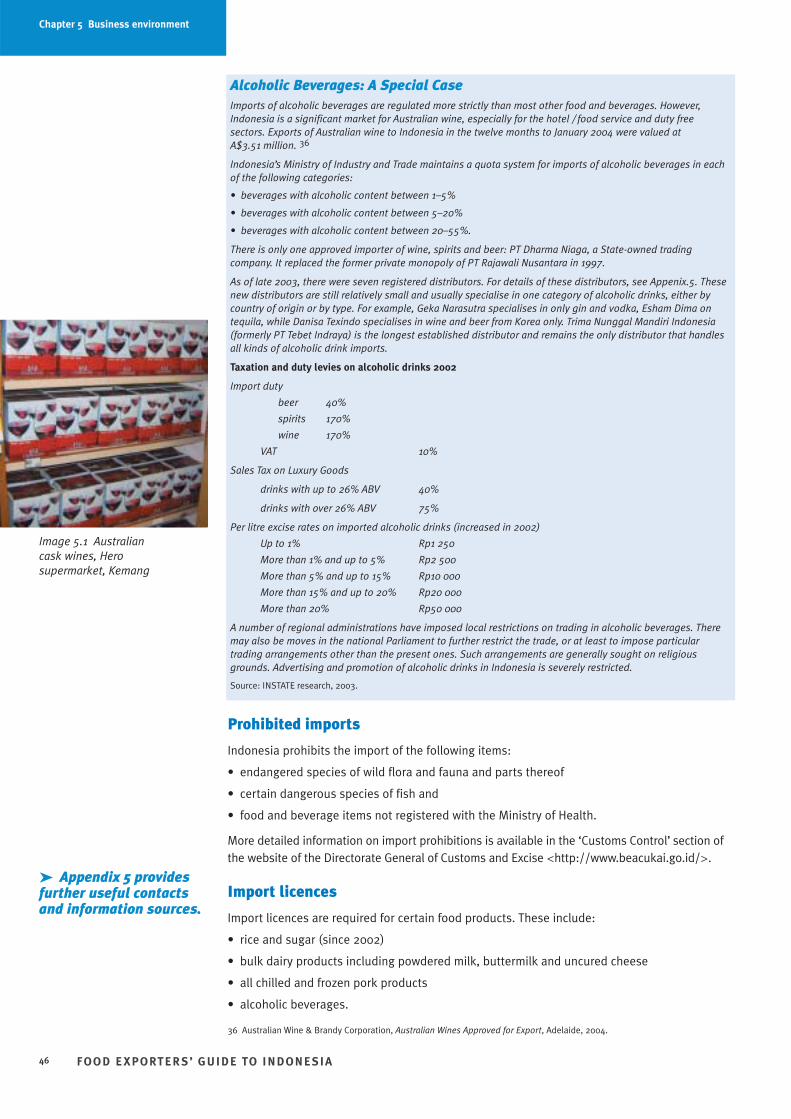
Prohibited imports
Indonesia prohibits the import of the following items:
• endangered species of wild flora and fauna and parts thereof
• certain dangerous species of fish and
• food and beverage items not registered with the Ministry of Health.
More detailed information on import prohibitions is available in the ‘Customs Control’ section ofthe website of the Directorate General of Customs and Excise <http://www.beacukai.go.id/>.
Import licences
Import licences are required for certain food products. These include:
• rice and sugar (since 2002)
• bulk dairy products including powdered milk, buttermilk and uncured cheese
• all chilled and frozen pork products
• alcoholic beverages.
FOO D E XPORTER S’ GUIDE TO INDONESIA46
Image 5.1 Australiancask wines, Herosupermarket, Kemang
➤ Appendix 5 providesfurther useful contactsand information sources.
Chapter 5 Business environment
Alcoholic Beverages: A Special CaseImports of alcoholic beverages are regulated more strictly than most other food and beverages. However,Indonesia is a significant market for Australian wine, especially for the hotel / food service and duty freesectors. Exports of Australian wine to Indonesia in the twelve months to January 2004 were valued at A$3.51 million. 36
Indonesia’s Ministry of Industry and Trade maintains a quota system for imports of alcoholic beverages in eachof the following categories:
• beverages with alcoholic content between 1–5%
• beverages with alcoholic content between 5–20%
• beverages with alcoholic content between 20–55%.
There is only one approved importer of wine, spirits and beer: PT Dharma Niaga, a State-owned tradingcompany. It replaced the former private monopoly of PT Rajawali Nusantara in 1997.
As of late 2003, there were seven registered distributors. For details of these distributors, see Appenix.5. Thesenew distributors are still relatively small and usually specialise in one category of alcoholic drinks, either bycountry of origin or by type. For example, Geka Narasutra specialises in only gin and vodka, Esham Dima ontequila, while Danisa Texindo specialises in wine and beer from Korea only. Trima Nunggal Mandiri Indonesia(formerly PT Tebet Indraya) is the longest established distributor and remains the only distributor that handlesall kinds of alcoholic drink imports.
Taxation and duty levies on alcoholic drinks 2002
Import duty
beer 40%
spirits 170%
wine 170%
VAT 10%
Sales Tax on Luxury Goods
drinks with up to 26% ABV 40%
drinks with over 26% ABV 75%
Per litre excise rates on imported alcoholic drinks (increased in 2002)
Up to 1% Rp1 250
More than 1% and up to 5% Rp2 500
More than 5% and up to 15% Rp10 000
More than 15% and up to 20% Rp20 000
More than 20% Rp50 000
A number of regional administrations have imposed local restrictions on trading in alcoholic beverages. Theremay also be moves in the national Parliament to further restrict the trade, or at least to impose particulartrading arrangements other than the present ones. Such arrangements are generally sought on religiousgrounds. Advertising and promotion of alcoholic drinks in Indonesia is severely restricted.
Source: INSTATE research, 2003.
36 Australian Wine & Brandy Corporation, Australian Wines Approved for Export, Adelaide, 2004.
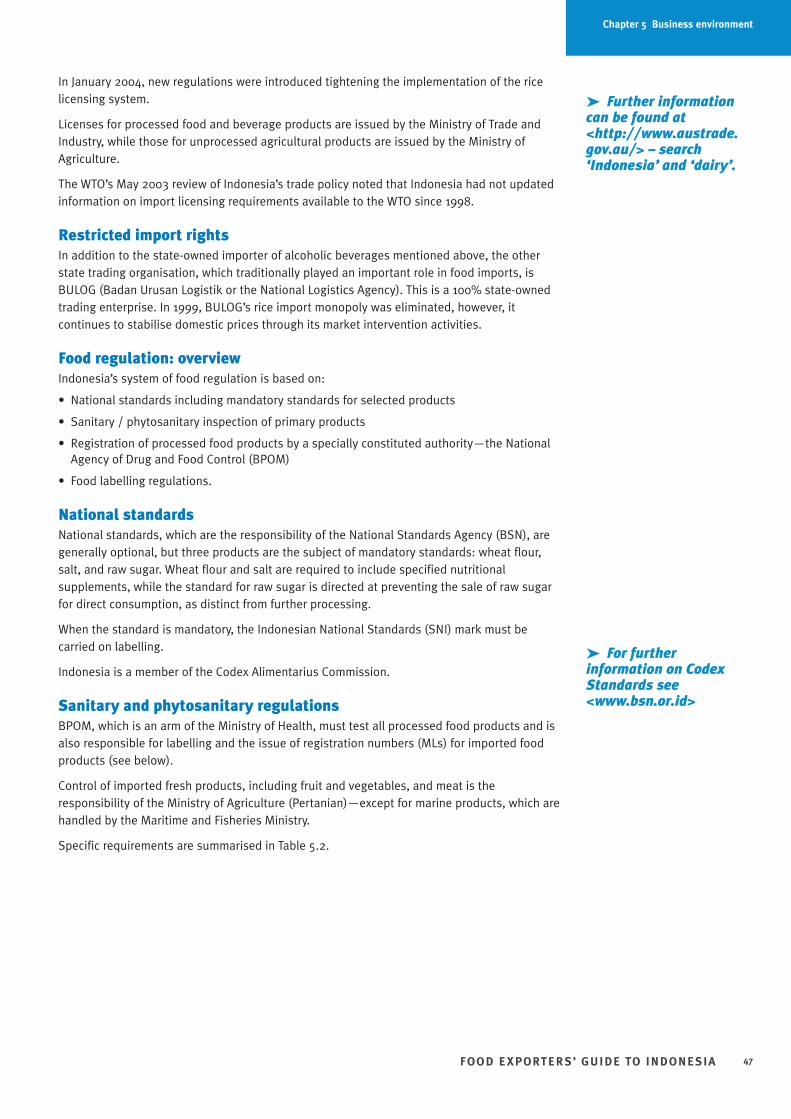
In January 2004, new regulations were introduced tightening the implementation of the ricelicensing system.
Licenses for processed food and beverage products are issued by the Ministry of Trade andIndustry, while those for unprocessed agricultural products are issued by the Ministry ofAgriculture.
The WTO’s May 2003 review of Indonesia’s trade policy noted that Indonesia had not updatedinformation on import licensing requirements available to the WTO since 1998.
Restricted import rights In addition to the state-owned importer of alcoholic beverages mentioned above, the otherstate trading organisation, which traditionally played an important role in food imports, isBULOG (Badan Urusan Logistik or the National Logistics Agency). This is a 100% state-ownedtrading enterprise. In 1999, BULOG’s rice import monopoly was eliminated, however, itcontinues to stabilise domestic prices through its market intervention activities.
Food regulation: overviewIndonesia’s system of food regulation is based on:
• National standards including mandatory standards for selected products
• Sanitary / phytosanitary inspection of primary products
• Registration of processed food products by a specially constituted authority—the NationalAgency of Drug and Food Control (BPOM)
• Food labelling regulations.
National standardsNational standards, which are the responsibility of the National Standards Agency (BSN), aregenerally optional, but three products are the subject of mandatory standards: wheat flour,salt, and raw sugar. Wheat flour and salt are required to include specified nutritionalsupplements, while the standard for raw sugar is directed at preventing the sale of raw sugarfor direct consumption, as distinct from further processing.
When the standard is mandatory, the Indonesian National Standards (SNI) mark must becarried on labelling.
Indonesia is a member of the Codex Alimentarius Commission.
Sanitary and phytosanitary regulationsBPOM, which is an arm of the Ministry of Health, must test all processed food products and isalso responsible for labelling and the issue of registration numbers (MLs) for imported foodproducts (see below).
Control of imported fresh products, including fruit and vegetables, and meat is theresponsibility of the Ministry of Agriculture (Pertanian)—except for marine products, which arehandled by the Maritime and Fisheries Ministry.
Specific requirements are summarised in Table 5.2.
FOO D E XPORTER S’ GUIDE TO INDONESIA 47
➤ Further informationcan be found at<http://www.austrade.gov.au/> – search‘Indonesia’ and ‘dairy’.
Chapter 5 Business environment
➤ For furtherinformation on CodexStandards see<www.bsn.or.id>
Table 5.2 Phytosanitary requirements for imports of agricultural and food products (selected)
Item Requirement
All fresh produce A phytosanitary certificate from the appropriate authority, such as the Australian Quarantine and
Inspection Service (AQIS) in Australia, is the main prerequisite for importing of fresh produce into
Indonesia. Upon arrival in Indonesia, such shipments are subject to quarantine inspection.
Fruit All imported fruit must have accompanying certificates stating that the fruit is free from fruit fly.
Potatoes All imported potatoes require certification that they are free from wart disease (Synchrytrium
endobioctium).
Horticultural seeds Seed importers must obtain approval from the Food Crop and Horticulture Seed Control and Certification
Body, ensuring that all imported seed is certified and labelled before entering the horticulture sector.
Chicken Certificates assuring that chicken products are dioxin-free are also required—there was a temporary ban
on certain Belgian and Dutch products in 1999 due to concerns over dioxin contamination.
Live cattle All livestock is examined upon arrival and is required to undergo a minimum ten day quarantine period.
Food supplements The production, importation and distribution of food supplements (defined as vitamins, minerals,
extracts, plant substances, amino acids, concentrates or any combination) must, inter alia, be by licensed
pharmaceutical companies or local-government-licensed food supplement companies, and be
manufactured in compliance with food manufacturing practices. Hygiene and safety requirements have
been set as well as maximum daily limits for vitamin and mineral amounts. 37
Seafood The Centre for Agricultural Quarantine requires that any importation of live fish, dead fish and fish
products must be imported only through designated points of entry, accompanied by a Fish Health
Certificate (FHC) and notified and submitted to the Fish Quarantine Inspector upon arrival of the
consignment. Importation of live fish must also be covered by an Import Permit (IP) that may contain
additional conditions for importation—these are determined on a case-by-case basis by the Director-
General of Fisheries. 38
Source: INSTATE research.
Full details of all phytosanitary restrictions notified by Indonesia to the WTO are contained at<http://docsonline.wto.org/gen_home.asp>.
AQIS provides information on import country requirements in the form of searchable databaseson its website at <http://www.aqis.gov.au>.
Before exporting any agricultural or fisheries products to Indonesia, exporters should considerand check through their importer in Indonesia whether Indonesian authorities require anygovernment certification.
The Australian Quarantine and Inspection Service (AQIS) provides inspection and, whererequired, government-to-government export certification for a number of agricultural andfisheries exports, e.g. meat (including game, poultry and rabbit), dairy products, fish (includingcrocodile meat), eggs and egg products, dried fruit, mung beans, grains, plants and plantproducts, processed fruit and vegetables, fresh fruit and vegetables and products labelled asorganic. For further information on exports of these products please contact the nearest AQISoffice or check the AQIS website.
Other products, e.g. pasta, breakfast cereals and confectionery, are generally exported withoutAQIS export certification because countries importing these products, including Indonesia, donot require any government-to-government certificates. Should an exporter be informed that agovernment certificate is required for imports into Indonesia of products not regulated byAQIS, AQIS may still be able to help. Exporters can contact the AQIS Export Facilitation Officerat the nearest AQIS office or check the AQIS website.
In late 2002, a Presidential Decree provided for the imposition of quarantine fees on import,export and inter-island movements for a range of domestic and imported agricultural products.At the time of writing, implementing regulations had not been issued by the Ministry ofAgriculture.
FOO D E XPORTER S’ GUIDE TO INDONESIA48
➤ Further informationcan be found at<http://www.austrade.gov.au/> – search‘Indonesia’ and‘horticulture’.
➤ Appendix 5 providesfurther useful contactsand information sources.
Chapter 5 Business environment
37 World Trade Organisation, Trade Policy Review Indonesia – A Report by the Secretariat, p. 55.
38 Centre for Agricultural Quarantine, Jakarta, 2003, viewed 20 October 2003, <http://www.deptan.go.id/CAQ/index.htm>.
LabellingNew food labelling requirements were introduced in 1999* and are the responsibility of theFood and Drug Control Body (Badan POM or BPOM).
Labelling requirements are designed to ensure that the consumer can be accurately informedabout the ingredients in processed food and its status as a halal or non-halal product. Postmarket control is maintained through sampling and testing food products. Where discrepanciesoccur there are powers to reprimand, order withdrawal of products from sale, or prosecutethrough the courts.
Key points of the current labelling requirements include:
• All packaged food products distributed in Indonesia must be labelled exclusively in BahasaIndonesia language, Arabic numbers and Latin letters.
• The use of any other language, number and letters is permitted only where there are nosubstitute Indonesian words or if there is a difficulty in finding Indonesian words with asimilar meaning; such approval must be obtained from the Indonesian Attorney-General.39
• The use of stickers was authorised temporarily (until new legislation was enacted).
• Specific wording regarding content is required for labels of certain food items including milkproducts, baby food, alcoholic beverages, and halal food.
• If the product is halal, it must be certified by an approved authority (see halal certificationsection below for details).
• The expiration date of perishable food items must be shown (and products must be landedin Indonesia with at least 2/3 of their stated shelf life remaining).
• Food additives must be identified.
• The name and address details of the importer must be stated.
• There are specific requirements for labelling of products with GMO content greater than 5% and also for irradiated products.
• SNI marks must be shown when relevant compulsory standards exist (these apply to sugar,salt and wheat flour).
Non-compliance with labelling regulations can result in a fine of up to A$400 000.
Overseas brand registration: the ML systemUnder the Consumer Protection Law (No. 8 of 1999), a registration system covers all processedfood products. Its key elements are:
• Details of products, including their ingredients, must be submitted to BPOM, together withsamples and evidence of testing by authorities in the country of origin
• Upon approval, a registration number is issued (for imports the ML✝ number, which must beprinted on food package labels)
• Products must be re-registered every five years
• The ML numbers are importer specific.
Strict implementation of the registration requirements since 2003 has increased exporters’costs. Previously, firms could land small quantities to test in the market and apply for
FOO D E XPORTER S’ GUIDE TO INDONESIA 49
➤ Further informationcan be found at<http://www.austrade.gov.au/> – search‘Indonesia’ and ‘foodretail’.
Chapter 5 Business environment
* Consumer Protection Law (No. 8 of 1999) andGovernment regulation No 69 / 1999 on Food Labelling and Advertisement.
✝ Abbreviation of Makanan Luar or ‘imported food’.
39 Kejaksaan Agung, Jakarta, 2003, viewed 3 November 2003, <http://www.kejaksaan.go.id/>.
Ecolabelling on the wayThe Indonesian government is planning to implement a national eco-labelling program for domestic agriculturaland manufactured food products. A coalition of government agencies, industry and consumer bodies havereached agreement on a standard to be used to certify and label environmentally friendly products.
The scheme, which will be voluntary, will reportedly be based on the ISO 14 000 standard on environmentalmanagement systems and is expected to commence some time in 2004.
Source:U Hudion, ‘Government to implement national ecolabeling plan’, The Jakarta Post, Jakarta, 27 November 2003.
registration subsequent to importation. This is no longer possible. Products must be registeredwith BPOM before clearance through Customs and carry the appropriate sticker. Importers,distributors or retailers dealing in unregistered products are in breach of the regulations andsubject to penalty.
Importers are hesitant to register every product they would like to trial in the market becauseof the cost of registration. The time it takes to register goods is also significant—up to sixmonths, although some cases can take longer.
Halal certificationThe Indonesian authorities do not require halal certification for all imported foodstuffs. Butwhile certification is not compulsory, 88% of the Indonesian population is Muslim and theIndonesian Islamic Council (MUI) prefers all food products to be halal accredited.
The following Australian Islamic Councils are approved by the MUI and may issue halalcertificates:
• The Islamic Coordinating Council of Victoria Inc (ICCV)
• The Australian Federation of Islamic Council Inc (AFIC) and
• The Supreme Islamic Council of Halal Meat in Australia Inc (SICHMA).
The Indonesian Government requires that all beef exports to Indonesia must have a halalcertificate along with a health certificate and come from halal slaughter establishments listedwith the Indonesian Ministry of Agriculture.
In late 2003, an on-line Australian halal directory was launched.
Options for representationSome Indonesian trade opportunities do come knocking on Australian suppliers’ doors. Butsustainable business usually requires effective representation on the ground. An active agent,importer and/or distributor is almost always needed to manage the physical process of
FOO D E XPORTER S’ GUIDE TO INDONESIA50
➤ For food exportersinterested to learn moreabout having theirproducts certified,further information is setout under the ‘ask us’button at<www.halalaustralia.com>.
Chapter 5 Business environment
The ML system: an Australian consolidator’s perspectiveThe CEO of one large Australian consolidator active in the Indonesian market sees the cumbersome nature ofthe ML system as the major market access issue facing Australian exporters. It is costly and time-consuming (sixmonths) to register each product: ‘I have over 500 lines, and not all of them are going to take in the market.’Some exporters will simply shift their focus to elsewhere in South East Asia. Those who persevere faceadditional cost and uncertainty.
Source: INSTATE interview, October 2003.
What is halal?Halal is an Arabic word meaning lawful or permitted. The opposite of halal is haram, which means unlawful orprohibited. Halal and haram are universal terms that apply to all facets of life. However, in Indonesia, theseterms are used only in relation to food products, meat products, cosmetics, personal care products, foodingredients, and food contact materials.
While many products are clearly halal or haram, there are some that are not clear. Where more information isneeded to categorise a product as halal or haram they are often referred to as mashbooh, which meansdoubtful or questionable.
All foods are considered halal except the following, which are haram:
• Swine/pork and its by-products
• Animals improperly slaughtered or dead before processing
• Animals killed in the name of anyone other than Allah (God)
• Alcohol and intoxicants
• Carnivorous animals, birds of prey and land animals without external ears
• Blood and blood by-products
• Foods contaminated with any of the above products
Source: The Islamic Food and Nutrition Council of America, What is Halal, Chicago, 2003, viewed 5 January 2004,<http://www.ifanca.org/halal.htm>.
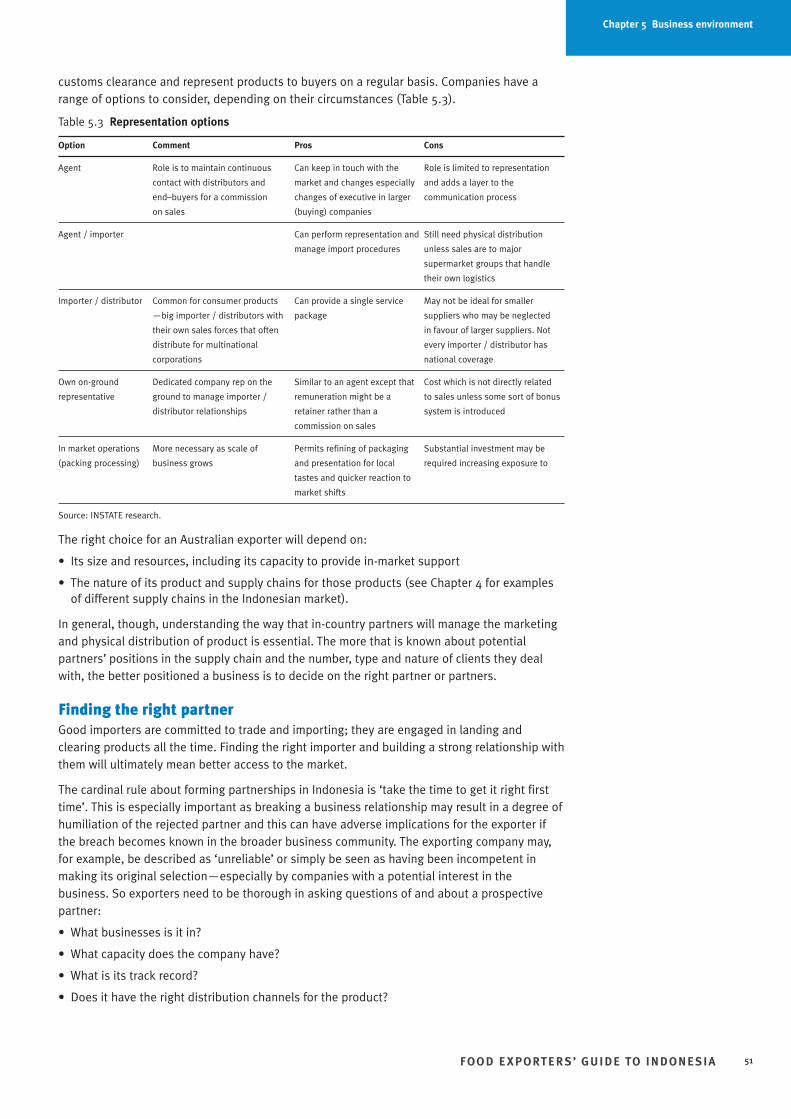
customs clearance and represent products to buyers on a regular basis. Companies have arange of options to consider, depending on their circumstances (Table 5.3).
Table 5.3 Representation options
Option Comment Pros Cons
Agent Role is to maintain continuous Can keep in touch with the Role is limited to representation
contact with distributors and market and changes especially and adds a layer to the
end–buyers for a commission changes of executive in larger communication process
on sales (buying) companies
Agent / importer Can perform representation and Still need physical distribution
manage import procedures unless sales are to major
supermarket groups that handle
their own logistics
Importer / distributor Common for consumer products Can provide a single service May not be ideal for smaller
—big importer / distributors with package suppliers who may be neglected
their own sales forces that often in favour of larger suppliers. Not
distribute for multinational every importer / distributor has
corporations national coverage
Own on-ground Dedicated company rep on the Similar to an agent except that Cost which is not directly related
representative ground to manage importer / remuneration might be a to sales unless some sort of bonus
distributor relationships retainer rather than a system is introduced
commission on sales
In market operations More necessary as scale of Permits refining of packaging Substantial investment may be
(packing processing) business grows and presentation for local required increasing exposure to
tastes and quicker reaction to
market shifts
Source: INSTATE research.
The right choice for an Australian exporter will depend on:
• Its size and resources, including its capacity to provide in-market support
• The nature of its product and supply chains for those products (see Chapter 4 for examplesof different supply chains in the Indonesian market).
In general, though, understanding the way that in-country partners will manage the marketingand physical distribution of product is essential. The more that is known about potentialpartners’ positions in the supply chain and the number, type and nature of clients they dealwith, the better positioned a business is to decide on the right partner or partners.
Finding the right partnerGood importers are committed to trade and importing; they are engaged in landing andclearing products all the time. Finding the right importer and building a strong relationship withthem will ultimately mean better access to the market.
The cardinal rule about forming partnerships in Indonesia is ‘take the time to get it right firsttime’. This is especially important as breaking a business relationship may result in a degree ofhumiliation of the rejected partner and this can have adverse implications for the exporter ifthe breach becomes known in the broader business community. The exporting company may,for example, be described as ‘unreliable’ or simply be seen as having been incompetent inmaking its original selection—especially by companies with a potential interest in thebusiness. So exporters need to be thorough in asking questions of and about a prospectivepartner:
• What businesses is it in?
• What capacity does the company have?
• What is its track record?
• Does it have the right distribution channels for the product?
FOO D E XPORTER S’ GUIDE TO INDONESIA 51
Chapter 5 Business environment
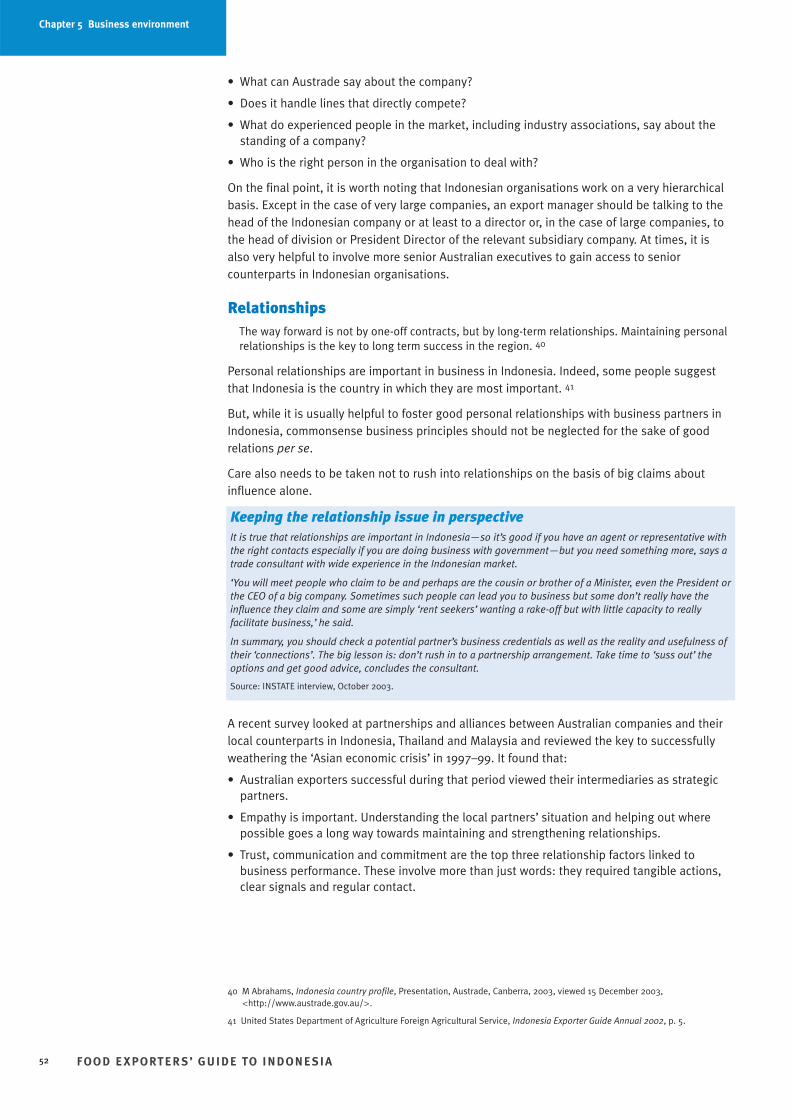
• What can Austrade say about the company?
• Does it handle lines that directly compete?
• What do experienced people in the market, including industry associations, say about thestanding of a company?
• Who is the right person in the organisation to deal with?
On the final point, it is worth noting that Indonesian organisations work on a very hierarchicalbasis. Except in the case of very large companies, an export manager should be talking to thehead of the Indonesian company or at least to a director or, in the case of large companies, tothe head of division or President Director of the relevant subsidiary company. At times, it isalso very helpful to involve more senior Australian executives to gain access to seniorcounterparts in Indonesian organisations.
RelationshipsThe way forward is not by one-off contracts, but by long-term relationships. Maintaining personalrelationships is the key to long term success in the region. 40
Personal relationships are important in business in Indonesia. Indeed, some people suggestthat Indonesia is the country in which they are most important. 41
But, while it is usually helpful to foster good personal relationships with business partners inIndonesia, commonsense business principles should not be neglected for the sake of goodrelations per se.
Care also needs to be taken not to rush into relationships on the basis of big claims aboutinfluence alone.
A recent survey looked at partnerships and alliances between Australian companies and theirlocal counterparts in Indonesia, Thailand and Malaysia and reviewed the key to successfullyweathering the ‘Asian economic crisis’ in 1997–99. It found that:
• Australian exporters successful during that period viewed their intermediaries as strategicpartners.
• Empathy is important. Understanding the local partners’ situation and helping out wherepossible goes a long way towards maintaining and strengthening relationships.
• Trust, communication and commitment are the top three relationship factors linked tobusiness performance. These involve more than just words: they required tangible actions,clear signals and regular contact.
FOO D E XPORTER S’ GUIDE TO INDONESIA52
Chapter 5 Business environment
Keeping the relationship issue in perspectiveIt is true that relationships are important in Indonesia—so it’s good if you have an agent or representative withthe right contacts especially if you are doing business with government—but you need something more, says atrade consultant with wide experience in the Indonesian market.
‘You will meet people who claim to be and perhaps are the cousin or brother of a Minister, even the President orthe CEO of a big company. Sometimes such people can lead you to business but some don’t really have theinfluence they claim and some are simply ‘rent seekers’ wanting a rake-off but with little capacity to reallyfacilitate business,’ he said.
In summary, you should check a potential partner’s business credentials as well as the reality and usefulness oftheir ‘connections’. The big lesson is: don’t rush in to a partnership arrangement. Take time to ‘suss out’ theoptions and get good advice, concludes the consultant.
Source: INSTATE interview, October 2003.
40 M Abrahams, Indonesia country profile, Presentation, Austrade, Canberra, 2003, viewed 15 December 2003,<http://www.austrade.gov.au/>.
41 United States Department of Agriculture Foreign Agricultural Service, Indonesia Exporter Guide Annual 2002, p. 5.
Other cultural issues
Religion
The majority of Indonesians are Muslim, whilst there are also Christians, Buddhists, Hindusand animists.
In Indonesia, there is an expectation that everyone has a religion. Therefore it is important tobe respectful and accommodating where religion is concerned. Some Muslims (the moredevout) pray five times a day and will interrupt other activities to do so. This is especially so atFriday midday prayers and so it is best not to organise important meetings at this time.
Very few Indonesian Muslims support or approve of violence in the name of Islam, which they(like most Muslims) regard as a religion of peace. They are nevertheless generally sympatheticabout what happens to Muslims in other places, such as the people of Afghanistan and Iraq,and may be critical of policies and actions of ‘the West’ in general and individual countries,sometimes including Australia, in particular.
Ramadan and fasting
It is very helpful for visitors to have at least a basic understanding of Muslim practices,including the annual fasting period known as Ramadan, which ends in the feast of Idul Fitri orLebaran.
This period changes each year and lasts a month. During Ramadan, most Muslims rise at 3 am,eat breakfast and say their morning prayers. They do not then eat and drink again until around6 pm, regardless of what they have to do during the day.
Language and communication
The Indonesians that most visitors meet are speaking in a language (English) that they do notuse every day. Many nuances will escape them and they may have no familiarity with theAustralian idiom. Visitors should use plain English—and should speak slowly and clearly. Theyshould repeat important points in different words. They should always listen carefully and beready to say: ‘I did not quite understand your last point, do you mean…?’ They should taketime to discuss proposed arrangements and confirm them in writing. They should ask for awritten response but should not be too concerned if it takes time to come. The situation maybe clarified on a subsequent visit. Amongst other things, Indonesians will want to know howserious their counterparts are about developing business linkages. They work in a challengingbusiness environment and are very conscious of making the best use of their time and effort.
Hospitality and gifts
It is always polite to return hospitality or at least offer to do so. The custom about gifts isvariable but, again, reciprocity is important.
When yes means …
Be aware of the fact that ‘yes’ does not always mean ‘yes I agree to sign up to yourproposition’. It may merely mean ‘yes I heard what you said’. Indonesians are polite and veryconscious of ‘face’.
FOO D E XPORTER S’ GUIDE TO INDONESIA 53
Image 5.2 Lebaran gift packs,hypermarket, Bekasi, Jakarta
➤ Chapter 2 providesfurther informationabout Indonesianconsumers.
Chapter 5 Business environment
Relationships: choose carefullySome years ago, a major Australian industry body was planning a big promotion in Indonesia. They needed alocal representative in Jakarta who could be a focal point both for organising the promotion and as the keylocal personality in the event and for the longer term. A senior executive from Australia with limited experiencein Indonesia heard of a particular person who was said to be well connected and selected him on the spot. As itturned out, this person was a very small player in Indonesia and did not have much capacity to help. Moreimportantly, he was not respected in Indonesian business circles. This had a major negative effect upon thewhole event.
Source: INSTATE interview, October 2003.
Image 5.3 Indonesian syrupsand noodles, Ramadan stock
Chapter 5 Business environment
FOO D E XPORTER S’ GUIDE TO INDONESIA54
Preaching
Indonesia sometimes gets bad press in Australia but Indonesians, no less than Australians, areproud of their country and its achievements. Critical comments by Australians about Indonesia,as well as unsolicited advice or ‘preaching’ (there is a special word for this inIndonesian–menggurui) will be seen as bad manners or worse.
Some dos and don’ts
Indonesia is a diverse country—so it is risky to generalise too much about dos and don’ts.Nevertheless, the following points are worth using as a guide when visiting Indonesia: 43
• Use the right hand in social encounters e.g. to offer or receive something from anotherperson.
• On average, Indonesian handshakes are softer than the Australian average—so it is betternot to use bone-crushing handshakes.
• Keep both feet on the floor when sitting; don’t sit with legs crossed.
• Avoid sitting on a table or desk.
• Avoid showing the sole of the foot or pointing the toe at another person.
• When pointing, use a generalised gesture of the hand (not a finger).
• Don’t touch a person’s head.
• Avoid raising the voice unnecessarily.
• Don’t express anger or frustration physically.
• When eating or drinking as the guest of others, don’t start until invited.
• Make way for more senior / older people in doorways and at formal gatherings.
• If you discuss politics or religion, do so in a respectful way.
When in doubt
Indonesia is a multi-cultural country with many different languages and customs. The general rule is to be friendly, courteous and respectful. It rarely, if ever, fails and will bereturned in kind.
Getting the basics rightAs noted elsewhere in this guide, relationships are very important in Indonesian business andthere are some special cultural issues that need attention. But there are many universalprinciples about operating in or selling to the Indonesian market that should not be forgotten:
• Offer value for money – Indonesian buyers expect the right quality, packaging and delivery,as well as a competitive price.
• Be consistent and reliable – Indonesian buyers look for suppliers who are competitive,consistent and reliable. They expect the best service, as well as the best products andprices, and will instantly recognise poor performance or presentation and judge suppliersaccordingly.
• Don’t dump – some suppliers try to pass off second-grade products to Indonesian buyers onthe basis that Indonesia is just a ‘developing country’, but its buyers shop the world marketfor the best products available at a given price. Any attempt to pass off second-rate productswill reflect badly on the supplier and be long remembered.
43 W Forrest & M Bidgood, Cultural Aspects of Business, American Indonesian Chamber of Commerce, New York, 2003, viewed 24 November2003, <http://www.aiccusa.org/cultas.htm>; INSTATE research.
Doing the basic things wellOne Australian exporter of processed food products has worked hard on the Indonesian market for the last fewyears. It has focused on selecting the right products for the market and makes the effort to get the packaging‘right’. This might seem elementary, but its major United States rivals are just sending their standard productinto the market making no effort to meet the specific market needs. As a result, the Australian company is nowthe category leader in Indonesian supermarkets.
Source: INSTATE interview, October 2003.
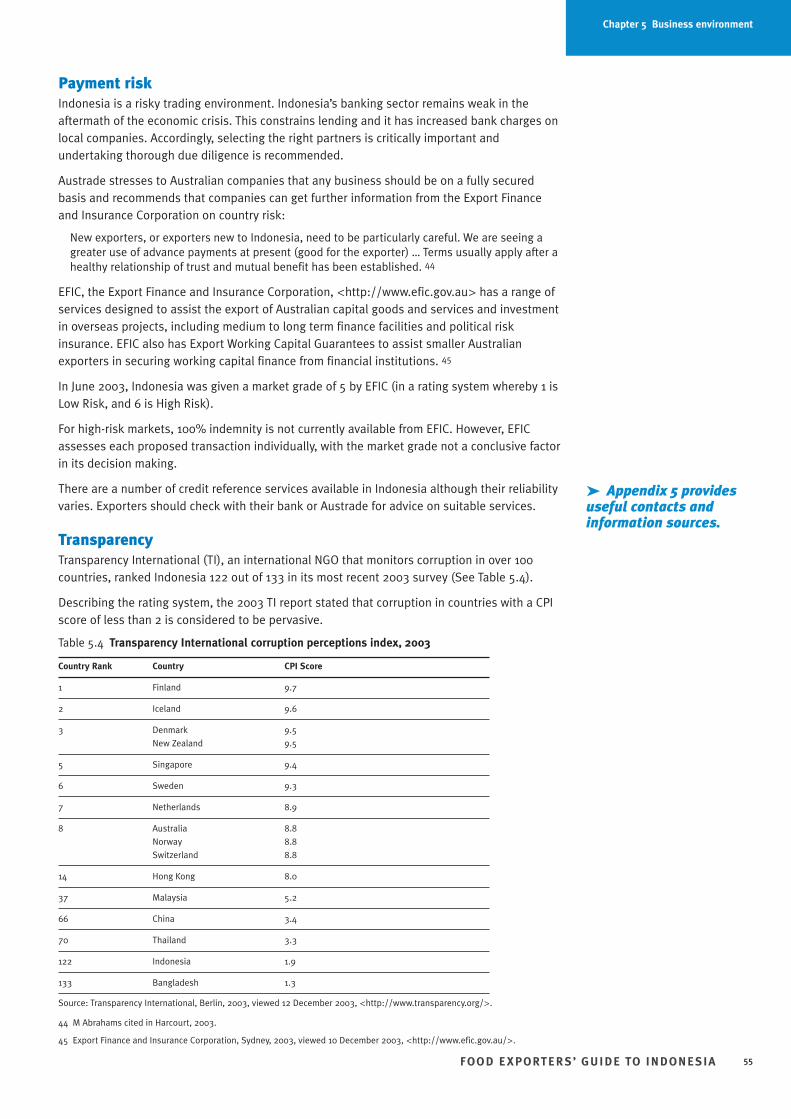
Payment riskIndonesia is a risky trading environment. Indonesia’s banking sector remains weak in theaftermath of the economic crisis. This constrains lending and it has increased bank charges onlocal companies. Accordingly, selecting the right partners is critically important andundertaking thorough due diligence is recommended.
Austrade stresses to Australian companies that any business should be on a fully securedbasis and recommends that companies can get further information from the Export Financeand Insurance Corporation on country risk:
New exporters, or exporters new to Indonesia, need to be particularly careful. We are seeing agreater use of advance payments at present (good for the exporter) … Terms usually apply after ahealthy relationship of trust and mutual benefit has been established. 44
EFIC, the Export Finance and Insurance Corporation, <http://www.efic.gov.au> has a range ofservices designed to assist the export of Australian capital goods and services and investmentin overseas projects, including medium to long term finance facilities and political riskinsurance. EFIC also has Export Working Capital Guarantees to assist smaller Australianexporters in securing working capital finance from financial institutions. 45
In June 2003, Indonesia was given a market grade of 5 by EFIC (in a rating system whereby 1 isLow Risk, and 6 is High Risk).
For high-risk markets, 100% indemnity is not currently available from EFIC. However, EFICassesses each proposed transaction individually, with the market grade not a conclusive factorin its decision making.
There are a number of credit reference services available in Indonesia although their reliabilityvaries. Exporters should check with their bank or Austrade for advice on suitable services.
TransparencyTransparency International (TI), an international NGO that monitors corruption in over 100countries, ranked Indonesia 122 out of 133 in its most recent 2003 survey (See Table 5.4).
Describing the rating system, the 2003 TI report stated that corruption in countries with a CPIscore of less than 2 is considered to be pervasive.
Table 5.4 Transparency International corruption perceptions index, 2003
Country Rank Country CPI Score
1 Finland 9.7
2 Iceland 9.6
3 Denmark 9.5
New Zealand 9.5
5 Singapore 9.4
6 Sweden 9.3
7 Netherlands 8.9
8 Australia 8.8
Norway 8.8
Switzerland 8.8
14 Hong Kong 8.0
37 Malaysia 5.2
66 China 3.4
70 Thailand 3.3
122 Indonesia 1.9
133 Bangladesh 1.3
Source: Transparency International, Berlin, 2003, viewed 12 December 2003, <http://www.transparency.org/>.
FOO D E XPORTER S’ GUIDE TO INDONESIA 55
➤ Appendix 5 providesuseful contacts andinformation sources.
Chapter 5 Business environment
44 M Abrahams cited in Harcourt, 2003.
45 Export Finance and Insurance Corporation, Sydney, 2003, viewed 10 December 2003, <http://www.efic.gov.au/>.
Exporters face problems with import regulations that are complex, often non-transparent andat times open to interpretation by officials at the wharf. An experienced, well-positionedimporter can help clear products quickly, often with less expense.
Under invoicing is also widespread in Indonesia. Its basic purpose is to reduce tax and dutypayable on the landed goods by the importer. Companies should be aware that under-invoicing, although common practice, is illegal.
SecurityAs of April 2004, travel advice from the Department of Foreign Affairs and Trade was that:
‘We continue to advise Australians to defer non-essential travel to Indonesia, including Bali. The August 2003attack at the JW Marriott Hotel in central Jakarta is a reminder that terrorist groups are active in Indonesia andthat attacks could occur at any time. We continue to receive reports that further attacks are being plannedagainst a variety of targets, including embassies, international schools, international hotels, churches, shoppingcentres, transport hubs or identifiably western interests, including businesses. Security at the AustralianEmbassy in Jakarta remains at a high level as a precautionary measure. Australians in Indonesia who areconcerned for their security should consider departing.
Australians who remain in Indonesia should continue to exercise extreme caution throughout the country,especially in commercial and public places frequented by foreigners including—but not limited to—clubs,restaurants (including international fast food outlets), bars, places of worship, hotels, schools, shops, shoppingcentres, housing compounds, outdoor recreation events and tourist areas.
This caution should be exercised in particular in Jakarta, including the central business and embassy districts, inother metropolitan and tourist centres in Java and Sumatra, and around premises and symbols associated withthe Indonesian Government.
The recommendation that Australians defer non-essential travel applies to Indonesia as a whole. We adviseAustralians to avoid all travel to Aceh, and those in Aceh are advised to depart. We further advise Australians toread carefully the sections below on travel to west Timor, Maluku and North Maluku, North, South and CentralSulawesi, and Papua. There remains a potential risk to foreigners of kidnapping in areas close to thePhilippines, such as the outlying islands of North Sulawesi, and the border regions of Kalimantan.
We also caution about ‘sweeping’ operations (raids) by militant Islamic groups against bars, nightclubs andother public places which might seek to identify Australians. Australians should take particular care to avoidpublic demonstrations.
Australians should note that new visa rules were introduced on 1 February 2004, and seek advice from thenearest Indonesian Embassy or Consulate prior to arrival. Australians in Indonesia should register with theAustralian Embassy (contact details in Appendix 5).
Security concerns have led Australian firms to rely more heavily on Austrade services. Austradeis helping companies by monitoring the situation and helping with logistics, and ‘has nowstarted focussing more resources on customer-facing activities in the market, expanding ourcustomer base and improving the quality and convertibility of realistic market opportunities.’46
FOO D E XPORTER S’ GUIDE TO INDONESIA56
➤ Further details andupdates are available onthe DFAT website at<http://www.dfat.gov.au/zw-cgi/view/Advice/Indonesia>.
Chapter 5 Business environment
46 Michael Abrahams, Senior Trade Commissioner in Jakarta, cited in Austrade 2003.
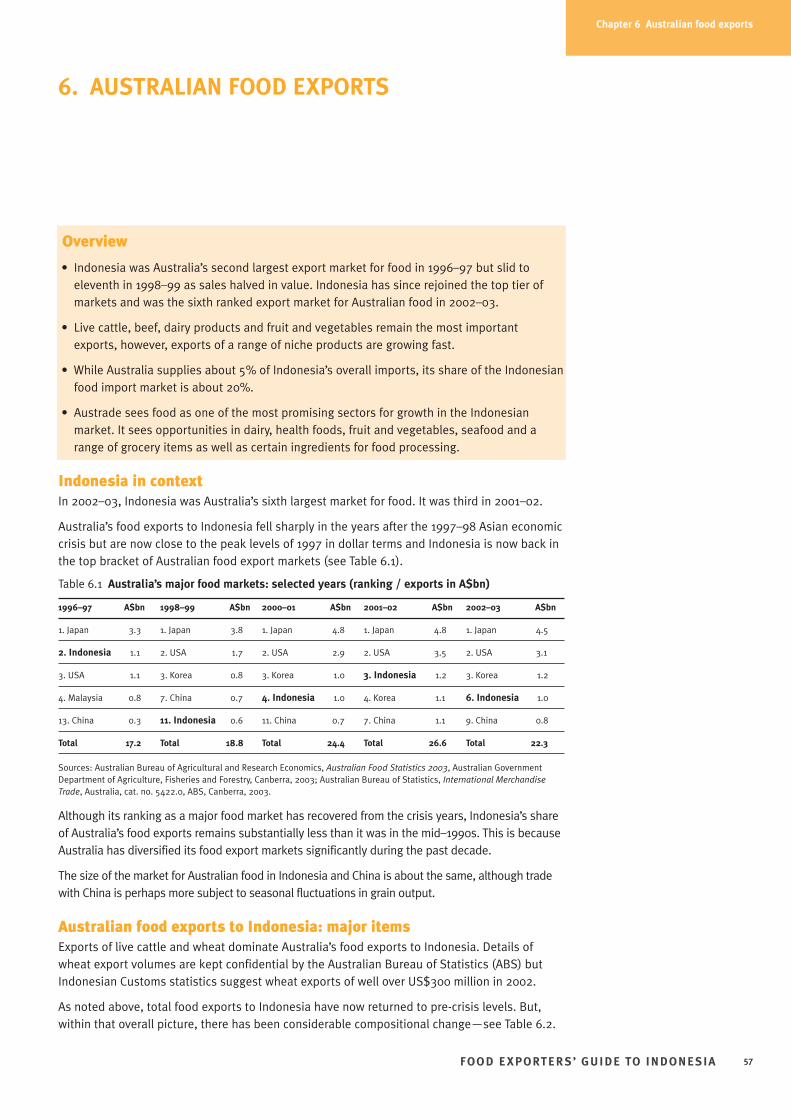
6. AUSTRALIAN FOOD EXPORTS
Overview
• Indonesia was Australia’s second largest export market for food in 1996–97 but slid toeleventh in 1998–99 as sales halved in value. Indonesia has since rejoined the top tier ofmarkets and was the sixth ranked export market for Australian food in 2002–03.
• Live cattle, beef, dairy products and fruit and vegetables remain the most importantexports, however, exports of a range of niche products are growing fast.
• While Australia supplies about 5% of Indonesia’s overall imports, its share of the Indonesianfood import market is about 20%.
• Austrade sees food as one of the most promising sectors for growth in the Indonesianmarket. It sees opportunities in dairy, health foods, fruit and vegetables, seafood and arange of grocery items as well as certain ingredients for food processing.
Indonesia in contextIn 2002–03, Indonesia was Australia’s sixth largest market for food. It was third in 2001–02.
Australia’s food exports to Indonesia fell sharply in the years after the 1997–98 Asian economiccrisis but are now close to the peak levels of 1997 in dollar terms and Indonesia is now back inthe top bracket of Australian food export markets (see Table 6.1).
Table 6.1 Australia’s major food markets: selected years (ranking / exports in A$bn)
1996–97 A$bn 1998–99 A$bn 2000–01 A$bn 2001–02 A$bn 2002–03 A$bn
1. Japan 3.3 1. Japan 3.8 1. Japan 4.8 1. Japan 4.8 1. Japan 4.5
2. Indonesia 1.1 2. USA 1.7 2. USA 2.9 2. USA 3.5 2. USA 3.1
3. USA 1.1 3. Korea 0.8 3. Korea 1.0 3. Indonesia 1.2 3. Korea 1.2
4. Malaysia 0.8 7. China 0.7 4. Indonesia 1.0 4. Korea 1.1 6. Indonesia 1.0
13. China 0.3 11. Indonesia 0.6 11. China 0.7 7. China 1.1 9. China 0.8
Total 17.2 Total 18.8 Total 24.4 Total 26.6 Total 22.3
Sources: Australian Bureau of Agricultural and Research Economics, Australian Food Statistics 2003, Australian GovernmentDepartment of Agriculture, Fisheries and Forestry, Canberra, 2003; Australian Bureau of Statistics, International MerchandiseTrade, Australia, cat. no. 5422.0, ABS, Canberra, 2003.
Although its ranking as a major food market has recovered from the crisis years, Indonesia’s shareof Australia’s food exports remains substantially less than it was in the mid–1990s. This is becauseAustralia has diversified its food export markets significantly during the past decade.
The size of the market for Australian food in Indonesia and China is about the same, although tradewith China is perhaps more subject to seasonal fluctuations in grain output.
Australian food exports to Indonesia: major itemsExports of live cattle and wheat dominate Australia’s food exports to Indonesia. Details ofwheat export volumes are kept confidential by the Australian Bureau of Statistics (ABS) butIndonesian Customs statistics suggest wheat exports of well over US$300 million in 2002.
As noted above, total food exports to Indonesia have now returned to pre-crisis levels. But,within that overall picture, there has been considerable compositional change—see Table 6.2.
FOO D E XPORTER S’ GUIDE TO INDONESIA 57
Chapter 6 Australian food exports
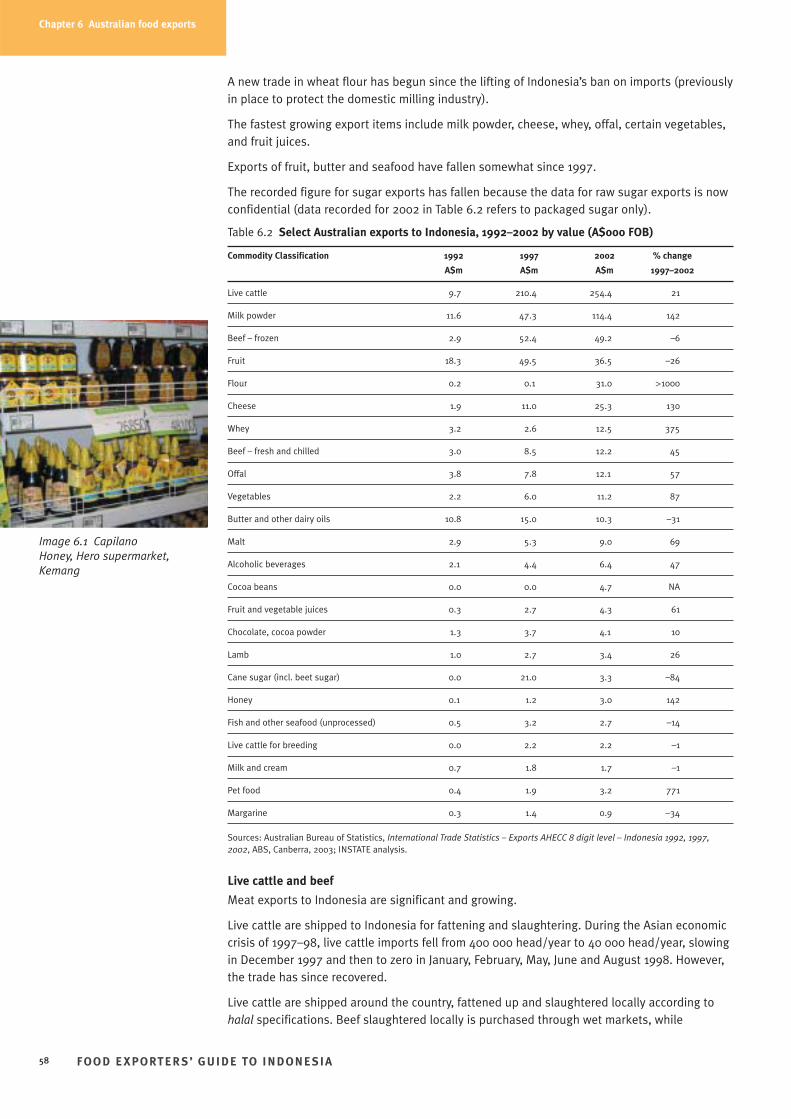
A new trade in wheat flour has begun since the lifting of Indonesia’s ban on imports (previouslyin place to protect the domestic milling industry).
The fastest growing export items include milk powder, cheese, whey, offal, certain vegetables,and fruit juices.
Exports of fruit, butter and seafood have fallen somewhat since 1997.
The recorded figure for sugar exports has fallen because the data for raw sugar exports is nowconfidential (data recorded for 2002 in Table 6.2 refers to packaged sugar only).
Table 6.2 Select Australian exports to Indonesia, 1992–2002 by value (A$000 FOB)
Commodity Classification 1992 1997 2002 % change
A$m A$m A$m 1997–2002
Live cattle 9.7 210.4 254.4 21
Milk powder 11.6 47.3 114.4 142
Beef – frozen 2.9 52.4 49.2 –6
Fruit 18.3 49.5 36.5 –26
Flour 0.2 0.1 31.0 >1000
Cheese 1.9 11.0 25.3 130
Whey 3.2 2.6 12.5 375
Beef – fresh and chilled 3.0 8.5 12.2 45
Offal 3.8 7.8 12.1 57
Vegetables 2.2 6.0 11.2 87
Butter and other dairy oils 10.8 15.0 10.3 –31
Malt 2.9 5.3 9.0 69
Alcoholic beverages 2.1 4.4 6.4 47
Cocoa beans 0.0 0.0 4.7 NA
Fruit and vegetable juices 0.3 2.7 4.3 61
Chocolate, cocoa powder 1.3 3.7 4.1 10
Lamb 1.0 2.7 3.4 26
Cane sugar (incl. beet sugar) 0.0 21.0 3.3 –84
Honey 0.1 1.2 3.0 142
Fish and other seafood (unprocessed) 0.5 3.2 2.7 –14
Live cattle for breeding 0.0 2.2 2.2 –1
Milk and cream 0.7 1.8 1.7 –1
Pet food 0.4 1.9 3.2 771
Margarine 0.3 1.4 0.9 –34
Sources: Australian Bureau of Statistics, International Trade Statistics – Exports AHECC 8 digit level – Indonesia 1992, 1997,2002, ABS, Canberra, 2003; INSTATE analysis.
Live cattle and beef
Meat exports to Indonesia are significant and growing.
Live cattle are shipped to Indonesia for fattening and slaughtering. During the Asian economiccrisis of 1997–98, live cattle imports fell from 400 000 head/year to 40 000 head/year, slowingin December 1997 and then to zero in January, February, May, June and August 1998. However,the trade has since recovered.
Live cattle are shipped around the country, fattened up and slaughtered locally according tohalal specifications. Beef slaughtered locally is purchased through wet markets, while
FOO D E XPORTER S’ GUIDE TO INDONESIA58
Image 6.1 CapilanoHoney, Hero supermarket,Kemang
Chapter 6 Australian food exports
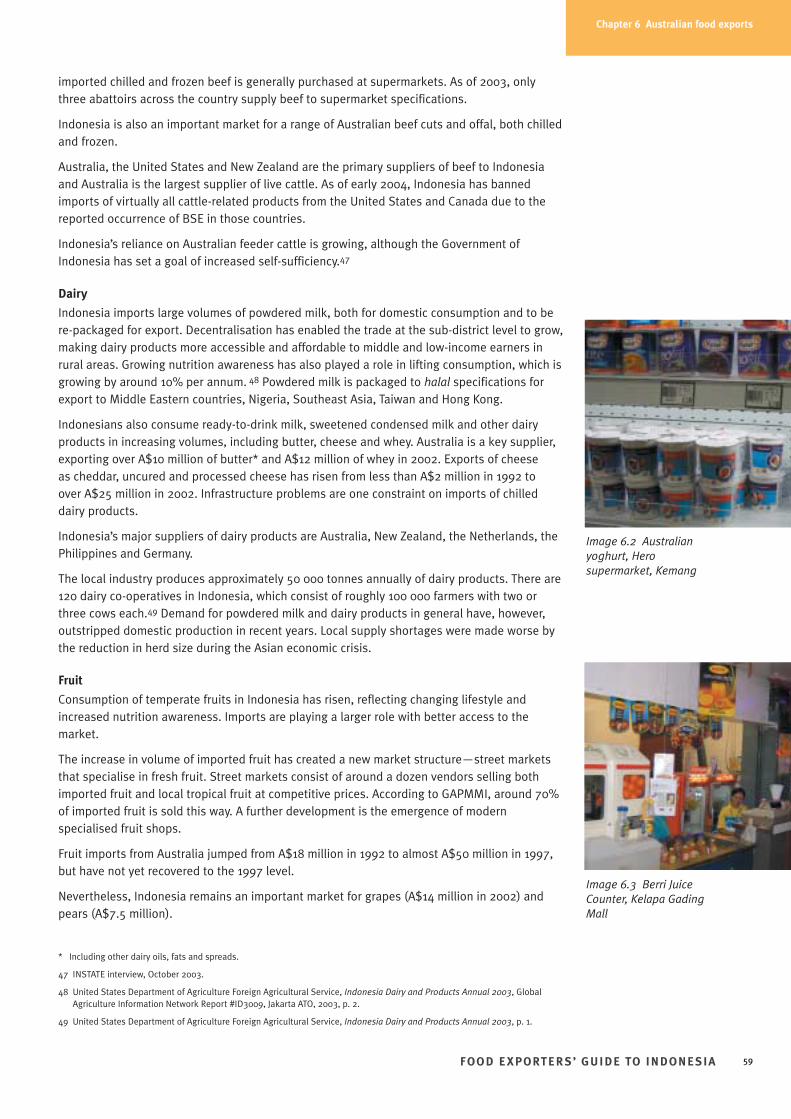
imported chilled and frozen beef is generally purchased at supermarkets. As of 2003, onlythree abattoirs across the country supply beef to supermarket specifications.
Indonesia is also an important market for a range of Australian beef cuts and offal, both chilledand frozen.
Australia, the United States and New Zealand are the primary suppliers of beef to Indonesiaand Australia is the largest supplier of live cattle. As of early 2004, Indonesia has bannedimports of virtually all cattle-related products from the United States and Canada due to thereported occurrence of BSE in those countries.
Indonesia’s reliance on Australian feeder cattle is growing, although the Government ofIndonesia has set a goal of increased self-sufficiency.47
Dairy
Indonesia imports large volumes of powdered milk, both for domestic consumption and to bere-packaged for export. Decentralisation has enabled the trade at the sub-district level to grow,making dairy products more accessible and affordable to middle and low-income earners inrural areas. Growing nutrition awareness has also played a role in lifting consumption, which isgrowing by around 10% per annum. 48 Powdered milk is packaged to halal specifications forexport to Middle Eastern countries, Nigeria, Southeast Asia, Taiwan and Hong Kong.
Indonesians also consume ready-to-drink milk, sweetened condensed milk and other dairyproducts in increasing volumes, including butter, cheese and whey. Australia is a key supplier,exporting over A$10 million of butter* and A$12 million of whey in 2002. Exports of cheese as cheddar, uncured and processed cheese has risen from less than A$2 million in 1992 to over A$25 million in 2002. Infrastructure problems are one constraint on imports of chilleddairy products.
Indonesia’s major suppliers of dairy products are Australia, New Zealand, the Netherlands, thePhilippines and Germany.
The local industry produces approximately 50 000 tonnes annually of dairy products. There are120 dairy co-operatives in Indonesia, which consist of roughly 100 000 farmers with two orthree cows each.49 Demand for powdered milk and dairy products in general have, however,outstripped domestic production in recent years. Local supply shortages were made worse bythe reduction in herd size during the Asian economic crisis.
Fruit
Consumption of temperate fruits in Indonesia has risen, reflecting changing lifestyle andincreased nutrition awareness. Imports are playing a larger role with better access to themarket.
The increase in volume of imported fruit has created a new market structure—street marketsthat specialise in fresh fruit. Street markets consist of around a dozen vendors selling bothimported fruit and local tropical fruit at competitive prices. According to GAPMMI, around 70%of imported fruit is sold this way. A further development is the emergence of modernspecialised fruit shops.
Fruit imports from Australia jumped from A$18 million in 1992 to almost A$50 million in 1997,but have not yet recovered to the 1997 level.
Nevertheless, Indonesia remains an important market for grapes (A$14 million in 2002) andpears (A$7.5 million).
FOO D E XPORTER S’ GUIDE TO INDONESIA 59
Image 6.2 Australianyoghurt, Herosupermarket, Kemang
Chapter 6 Australian food exports
* Including other dairy oils, fats and spreads.
47 INSTATE interview, October 2003.
48 United States Department of Agriculture Foreign Agricultural Service, Indonesia Dairy and Products Annual 2003, GlobalAgriculture Information Network Report #ID3009, Jakarta ATO, 2003, p. 2.
49 United States Department of Agriculture Foreign Agricultural Service, Indonesia Dairy and Products Annual 2003, p. 1.
Image 6.3 Berri JuiceCounter, Kelapa GadingMall
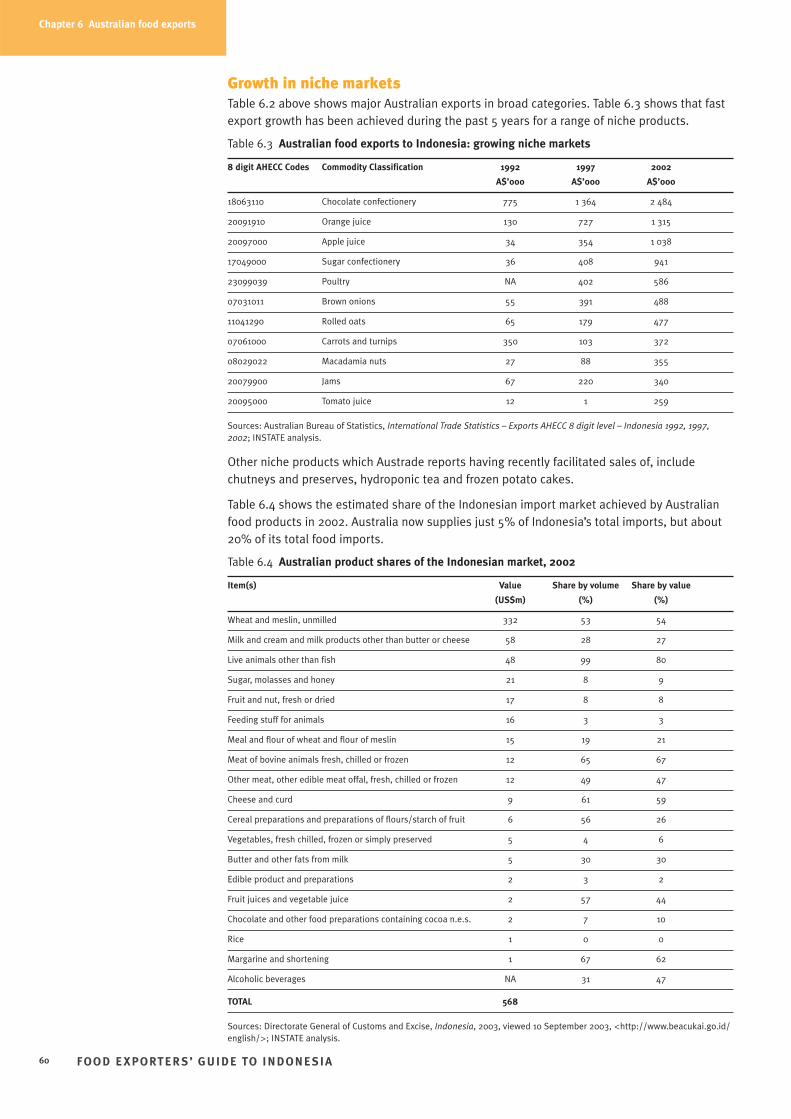
Growth in niche marketsTable 6.2 above shows major Australian exports in broad categories. Table 6.3 shows that fastexport growth has been achieved during the past 5 years for a range of niche products.
Table 6.3 Australian food exports to Indonesia: growing niche markets
8 digit AHECC Codes Commodity Classification 1992 1997 2002
A$’000 A$’000 A$’000
18063110 Chocolate confectionery 775 1 364 2 484
20091910 Orange juice 130 727 1 315
20097000 Apple juice 34 354 1 038
17049000 Sugar confectionery 36 408 941
23099039 Poultry NA 402 586
07031011 Brown onions 55 391 488
11041290 Rolled oats 65 179 477
07061000 Carrots and turnips 350 103 372
08029022 Macadamia nuts 27 88 355
20079900 Jams 67 220 340
20095000 Tomato juice 12 1 259
Sources: Australian Bureau of Statistics, International Trade Statistics – Exports AHECC 8 digit level – Indonesia 1992, 1997,2002; INSTATE analysis.
Other niche products which Austrade reports having recently facilitated sales of, includechutneys and preserves, hydroponic tea and frozen potato cakes.
Table 6.4 shows the estimated share of the Indonesian import market achieved by Australianfood products in 2002. Australia now supplies just 5% of Indonesia’s total imports, but about20% of its total food imports.
Table 6.4 Australian product shares of the Indonesian market, 2002
Item(s) Value Share by volume Share by value
(US$m) (%) (%)
Wheat and meslin, unmilled 332 53 54
Milk and cream and milk products other than butter or cheese 58 28 27
Live animals other than fish 48 99 80
Sugar, molasses and honey 21 8 9
Fruit and nut, fresh or dried 17 8 8
Feeding stuff for animals 16 3 3
Meal and flour of wheat and flour of meslin 15 19 21
Meat of bovine animals fresh, chilled or frozen 12 65 67
Other meat, other edible meat offal, fresh, chilled or frozen 12 49 47
Cheese and curd 9 61 59
Cereal preparations and preparations of flours/starch of fruit 6 56 26
Vegetables, fresh chilled, frozen or simply preserved 5 4 6
Butter and other fats from milk 5 30 30
Edible product and preparations 2 3 2
Fruit juices and vegetable juice 2 57 44
Chocolate and other food preparations containing cocoa n.e.s. 2 7 10
Rice 1 0 0
Margarine and shortening 1 67 62
Alcoholic beverages NA 31 47
TOTAL 568
Sources: Directorate General of Customs and Excise, Indonesia, 2003, viewed 10 September 2003, <http://www.beacukai.go.id/english/>; INSTATE analysis.
FOO D E XPORTER S’ GUIDE TO INDONESIA60
Chapter 6 Australian food exports
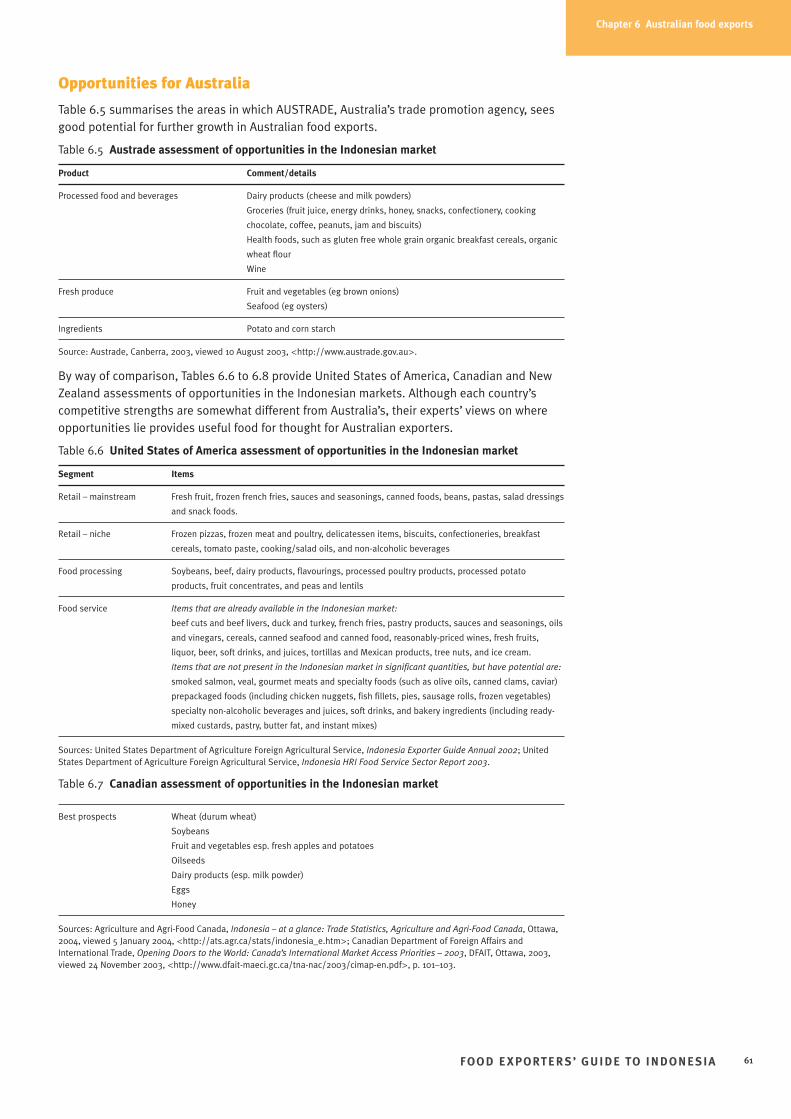
Opportunities for Australia
Table 6.5 summarises the areas in which AUSTRADE, Australia’s trade promotion agency, seesgood potential for further growth in Australian food exports.
Table 6.5 Austrade assessment of opportunities in the Indonesian market
Product Comment/details
Processed food and beverages Dairy products (cheese and milk powders)
Groceries (fruit juice, energy drinks, honey, snacks, confectionery, cooking
chocolate, coffee, peanuts, jam and biscuits)
Health foods, such as gluten free whole grain organic breakfast cereals, organic
wheat flour
Wine
Fresh produce Fruit and vegetables (eg brown onions)
Seafood (eg oysters)
Ingredients Potato and corn starch
Source: Austrade, Canberra, 2003, viewed 10 August 2003, <http://www.austrade.gov.au>.
By way of comparison, Tables 6.6 to 6.8 provide United States of America, Canadian and NewZealand assessments of opportunities in the Indonesian markets. Although each country’scompetitive strengths are somewhat different from Australia’s, their experts’ views on whereopportunities lie provides useful food for thought for Australian exporters.
Table 6.6 United States of America assessment of opportunities in the Indonesian market
Segment Items
Retail – mainstream Fresh fruit, frozen french fries, sauces and seasonings, canned foods, beans, pastas, salad dressings
and snack foods.
Retail – niche Frozen pizzas, frozen meat and poultry, delicatessen items, biscuits, confectioneries, breakfast
cereals, tomato paste, cooking/salad oils, and non-alcoholic beverages
Food processing Soybeans, beef, dairy products, flavourings, processed poultry products, processed potato
products, fruit concentrates, and peas and lentils
Food service Items that are already available in the Indonesian market:
beef cuts and beef livers, duck and turkey, french fries, pastry products, sauces and seasonings, oils
and vinegars, cereals, canned seafood and canned food, reasonably-priced wines, fresh fruits,
liquor, beer, soft drinks, and juices, tortillas and Mexican products, tree nuts, and ice cream.
Items that are not present in the Indonesian market in significant quantities, but have potential are:
smoked salmon, veal, gourmet meats and specialty foods (such as olive oils, canned clams, caviar)
prepackaged foods (including chicken nuggets, fish fillets, pies, sausage rolls, frozen vegetables)
specialty non-alcoholic beverages and juices, soft drinks, and bakery ingredients (including ready-
mixed custards, pastry, butter fat, and instant mixes)
Sources: United States Department of Agriculture Foreign Agricultural Service, Indonesia Exporter Guide Annual 2002; UnitedStates Department of Agriculture Foreign Agricultural Service, Indonesia HRI Food Service Sector Report 2003.
Table 6.7 Canadian assessment of opportunities in the Indonesian market
Best prospects Wheat (durum wheat)
Soybeans
Fruit and vegetables esp. fresh apples and potatoes
Oilseeds
Dairy products (esp. milk powder)
Eggs
Honey
Sources: Agriculture and Agri-Food Canada, Indonesia – at a glance: Trade Statistics, Agriculture and Agri-Food Canada, Ottawa,2004, viewed 5 January 2004, <http://ats.agr.ca/stats/indonesia_e.htm>; Canadian Department of Foreign Affairs andInternational Trade, Opening Doors to the World: Canada’s International Market Access Priorities – 2003, DFAIT, Ottawa, 2003,viewed 24 November 2003, <http://www.dfait-maeci.gc.ca/tna-nac/2003/cimap-en.pdf>, p. 101–103.
FOO D E XPORTER S’ GUIDE TO INDONESIA 61
Chapter 6 Australian food exports
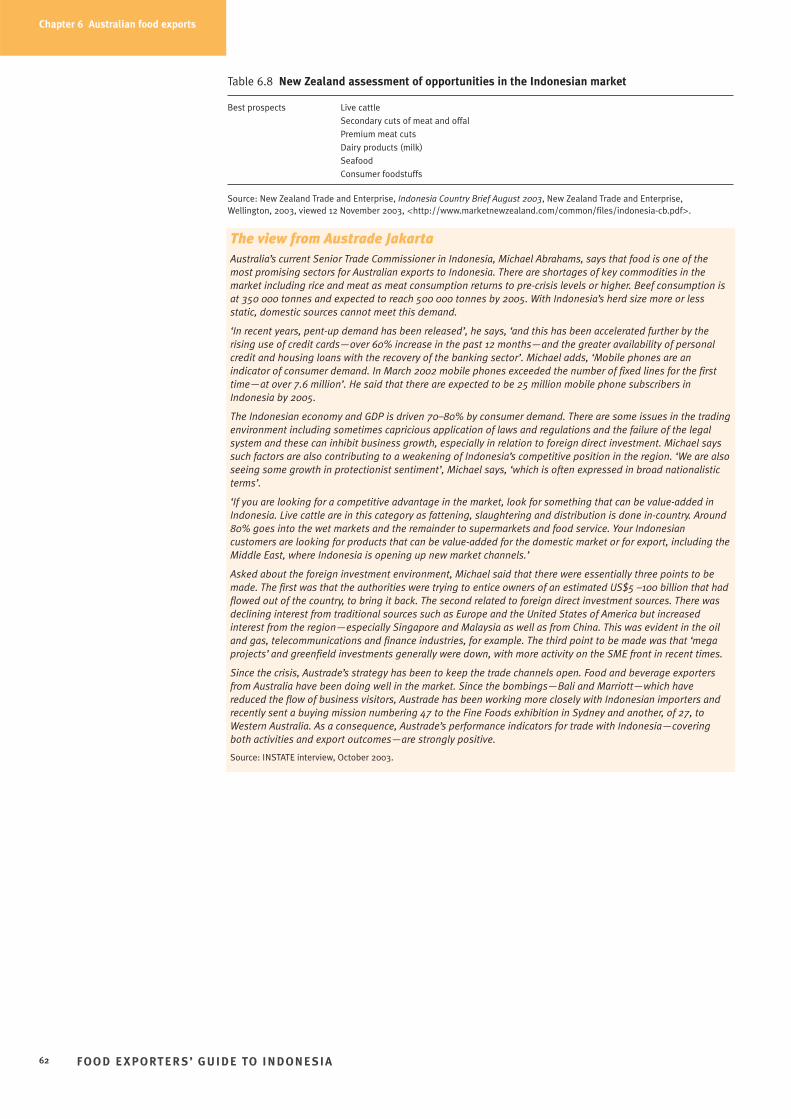
Table 6.8 New Zealand assessment of opportunities in the Indonesian market
Best prospects Live cattle
Secondary cuts of meat and offal
Premium meat cuts
Dairy products (milk)
Seafood
Consumer foodstuffs
Source: New Zealand Trade and Enterprise, Indonesia Country Brief August 2003, New Zealand Trade and Enterprise, Wellington, 2003, viewed 12 November 2003, <http://www.marketnewzealand.com/common/files/indonesia-cb.pdf>.
FOO D E XPORTER S’ GUIDE TO INDONESIA62
Chapter 6 Australian food exports
The view from Austrade JakartaAustralia’s current Senior Trade Commissioner in Indonesia, Michael Abrahams, says that food is one of themost promising sectors for Australian exports to Indonesia. There are shortages of key commodities in themarket including rice and meat as meat consumption returns to pre-crisis levels or higher. Beef consumption isat 350 000 tonnes and expected to reach 500 000 tonnes by 2005. With Indonesia’s herd size more or lessstatic, domestic sources cannot meet this demand.
‘In recent years, pent-up demand has been released’, he says, ‘and this has been accelerated further by therising use of credit cards—over 60% increase in the past 12 months—and the greater availability of personalcredit and housing loans with the recovery of the banking sector’. Michael adds, ‘Mobile phones are anindicator of consumer demand. In March 2002 mobile phones exceeded the number of fixed lines for the firsttime—at over 7.6 million’. He said that there are expected to be 25 million mobile phone subscribers inIndonesia by 2005.
The Indonesian economy and GDP is driven 70–80% by consumer demand. There are some issues in the tradingenvironment including sometimes capricious application of laws and regulations and the failure of the legalsystem and these can inhibit business growth, especially in relation to foreign direct investment. Michael sayssuch factors are also contributing to a weakening of Indonesia’s competitive position in the region. ‘We are alsoseeing some growth in protectionist sentiment’, Michael says, ‘which is often expressed in broad nationalisticterms’.
‘If you are looking for a competitive advantage in the market, look for something that can be value-added inIndonesia. Live cattle are in this category as fattening, slaughtering and distribution is done in-country. Around80% goes into the wet markets and the remainder to supermarkets and food service. Your Indonesiancustomers are looking for products that can be value-added for the domestic market or for export, including theMiddle East, where Indonesia is opening up new market channels.’
Asked about the foreign investment environment, Michael said that there were essentially three points to bemade. The first was that the authorities were trying to entice owners of an estimated US$5 –100 billion that hadflowed out of the country, to bring it back. The second related to foreign direct investment sources. There wasdeclining interest from traditional sources such as Europe and the United States of America but increasedinterest from the region—especially Singapore and Malaysia as well as from China. This was evident in the oiland gas, telecommunications and finance industries, for example. The third point to be made was that ‘megaprojects’ and greenfield investments generally were down, with more activity on the SME front in recent times.
Since the crisis, Austrade’s strategy has been to keep the trade channels open. Food and beverage exportersfrom Australia have been doing well in the market. Since the bombings—Bali and Marriott—which havereduced the flow of business visitors, Austrade has been working more closely with Indonesian importers andrecently sent a buying mission numbering 47 to the Fine Foods exhibition in Sydney and another, of 27, toWestern Australia. As a consequence, Austrade’s performance indicators for trade with Indonesia—coveringboth activities and export outcomes—are strongly positive.
Source: INSTATE interview, October 2003.
7. POLITICAL AND ECONOMIC ENVIRONMENT
Overview
• Over the last five years Indonesia has undertaken major changes to its structure ofgovernance—moving from a highly autocratic model under President Soeharto to ademocratic and decentralised system under President Megawati Sukarnoputri. Whilesupport for personalities and parties will continue to fluctuate, analysts consider thefundamental contours of the national political landscape unlikely to change dramaticallyover the next five years.
• Indonesia’s macroeconomic indicators are positive, with growth forecast at 4.5% for 2004,rising foreign exchange reserves and inflation coming under control. The banking sector isfunctioning and the corporate sector is well into recovery mode.
• In the medium-term, growth of around 6% will be necessary to employ the availableworkforce and underpin economic and political stability. The Indonesian Government andWorld Bank believe this is achievable. Some other commentators believe the Governmenthas more to do to secure the stronger foreign investment flows needed to achieve thisgrowth objective.
• Although serious for the immediate participants and localities, regional disturbances havehad limited impact upon the nation and its economy as a whole. The Bali and Marriott Hotelbombings were the work of extremists with very little support from ordinary Indonesians—most are proud the terrorists have been captured and brought to justice quickly.
• There are on-going concerns about Indonesia’s weak judicial system, certain aspects ofdecentralisation—especially regional levies which increase business costs—some labourmilitancy and low levels of productivity compared to important competitors such as China.
• In all, however, Indonesia has made an impressive transition during the past 5 years. Whileit still faces many challenges, it is a neighbour Australia should respect and build strong tieswith, an economy that should not be underestimated, and a food market that seriousexporters should not ignore.
The Indonesian market in contextDevelopments in Indonesia during the Asian economic crisis of 1997–98 impacted heavily onthe market for Australia, and for food exports in particular. Whilst the Indonesian economy andthe political situation since then have improved, they will continue to influence the ‘comfortlevel’ of Australians doing business in Indonesia. Accordingly, the background to Indonesia’semergence from its political and economic crises, including a brief historical overview isdiscussed below.
The Soeharto era During over 30 years of strong but increasingly authoritarian rule by President Soeharto,Indonesia achieved rapid economic development, with average GDP growth of over 6.5% perannum, and economic wellbeing at all levels of society improved.
On the other hand, this period also saw the increasing centralisation of power in Jakarta in theperson of the President and through the military.
FOO D E XPORTER S’ GUIDE TO INDONESIA 63
Chapter 7 Political and economicenvironment
In the Soeharto era, the Dewan Perwakilan Rakyat (DPR, lower house) comprised 425 electedmembers and 75 appointed by the military. The Majelis Permusyawaratan Rakyat (MPR, upperhouse) comprised the members of the DPR and a number of appointed persons representingregions and certain social groups. The MPR normally met every five years to elect the Presidentand the Vice President and to set broad policy guidelines for the government. The Presidentwas not accountable to the DPR.
Political parties were regulated. The President endorsed the dominant political party, Golkar,which all civil servants were required to join.
The power of the central government in Jakarta was transmitted effectively through five levelsof administration (national, provincial, district, sub-district and village) so that programs—suchas, for example, education and health care—could be implemented across the archipelago in arelatively uniform way.
While there were many good results from such programs, this autocratic system stifled localinitiative. Village heads looked to higher levels of government for direction rather than to thepeople of their communities. Provincial governors were appointed by the President. TheDwifungsi (Dual Role) policy placed a representative of the military in every village, enablingdirect army influence on local affairs. President Soeharto made key military and provincialgovernor appointments.
Pressures for changeCentralised control of governmental decision-making, combined with patronage of certaincommercial interests, resulted in domination of industries, regional enterprises and majorprojects by the Jakarta elites. Large corporate conglomerates—such as Indofood—emerged,many under Presidential patronage.
Some industries—notably timber and cloves—had licensing arrangements that deliveredcontrol and benefits to interests associated with the Soeharto family. This fed resentment anddemands for regional autonomy.
More generally, a highly educated and articulate middle class was emerging. It sought moreparticipatory government and had concerns about issues such as human rights and theenvironment. The Government’s discouragement of political activism was successful withPresident Soeharto’s own generation, but the next was increasingly sceptical, particularlythose that did not benefit from patronage.
While Indonesia had prospered over thirty years, there were serious weaknesses in keyinstitutions of government and poor corporate governance. Weak national institutions did notdeal effectively with the burgeoning private banking sector (with 240 private banks at onepoint), some of which were owned or controlled by entrepreneurs linked to the Soehartofamily. Large publicly owned banks were also weak and subject to political direction in regardto loans to favoured parties—which were often not repaid.
A further element in this volatile mix in the late 1990s was the rapid growth in short-term debt,in many cases, with scant due diligence. Indonesian entrepreneurs eagerly accepted the cashand many became highly geared.
The Asian economic crisis and the fall of Soeharto (1997–98)In 1997, economic crisis unfolded across East Asia and Indonesia was particularly badly hit.The rupiah plummeted and business confidence collapsed, with foreign debts virtuallyunrepayable at the lower exchange rates. Indonesia sought and received internationalassistance, principally through the IMF in the form of US$43 billion in standby loans.
President Soeharto and his advisors struggled with these issues and came into conflict withthe IMF’s recommendations for structural adjustment. Although he had been re-electedunopposed by the MPR early in 1998, there was considerable, but largely unarticulatedopposition to his continued tenure. The economic crisis caused the collapse of his legitimacy,
FOO D E XPORTER S’ GUIDE TO INDONESIA64
Chapter 7 Political and economicenvironment
which had been built upon delivering growth. After extensive student demonstrations and riotsin Jakarta he agreed to step down in favour of his Vice-President, BJ Habibie.
The Habibie Presidency: Transition and decentralisation (1998–99)President Habibie, an aeronautical engineer, had served as Minister for Technology underSoeharto and, in his final term, as Vice President. He led the development of the commuteraircraft manufacturing industry in Indonesia. He was an energetic President but was notpopular. President Habibie held office until elections were held under new rules in June 1999.As President, Habibie introduced a number of reforms including liberalisation of the press andderegulation of political parties.
As part of a program agreed with the IMF, many market distorting regulations and monopolieswere abolished. More significantly, he oversaw legislation to devolve substantial powers fromthe central government to the regions. His government also agreed to a plebiscite in East Timorthat led to independence for that territory. Civil unrest in various forms continued however, andthere was a damaging financial scandal.
Of particular significance for business, regional autonomy laws introduced by Habibie providedfor all government functions to become the responsibility of district/city governments from2001, other than defence, foreign affairs, the judiciary, religious affairs and trade. Thesereforms by-passed provincial governments, which retained a coordinating role but with muchless authority than previously.
New financial arrangements were introduced to move a significant part of the national budgetto the regions and enable the sharing of the resource rents (e.g. from oil and gas, forestry, coaland other minerals) that previously went to the central government.
There have been two major criticisms of these reforms. The first is that they were broadlydrafted and are subject to interpretation, including by subsequent decrees and/or regulations.The second is that their introduction was rushed and implementation has proved messy andcomplicated.
In late 2003, the Government began considering measures to re-centralise some powers andstrengthen the provincial level of government. Most analysts believe that these adjustmentsmay help foster a more predictable and stable business environment, but that a wholesalereversal of decentralisation would be unhelpful.
The Wahid Presidency (1999–2001)In 1999, Abdurrahman Wahid was elected President, a noted Islamic scholar and former leaderof a 40 million-strong rural based Islamic body and leader of the People’s Awakening Party(PKB). Megawati Soekarnoputri, leader of the Democratic Party for Struggle (PDI–P) anddaughter of Indonesia’s first president, became his deputy. President Wahid was a professeddemocrat and pluralist of long standing, committed to secular government. During hispresidency he lifted restrictions on the public use of the Chinese language and religious andcultural practices. President Wahid personally took part in Chinese New Year celebrations.
But President Wahid’s presidency was brief and widely regarded as chaotic. During this period,security problems arose in four provinces (Maluku, Kalimantan, Aceh and Papua). Some ofthese troubles were widely believed to have been orchestrated by anti-reform elements inJakarta. Others were probably the natural outcome of the weakening of state authority andconsequent release of latent inter-communal tensions. Still others were the work of criminalelements.
President Wahid had appointed new commanders to the armed services who were committedto reform and democratic principles, but he was unable to effectively deal with inter-communalconflict, particularly in Maluku. The IMF curtailed assistance because of Indonesia’s failure tocomply with its loan conditions and relations between the President and the parliamentdeteriorated.
FOO D E XPORTER S’ GUIDE TO INDONESIA 65
Chapter 7 Political and economicenvironment
Eventually the parliament exercised its prerogative of impeachment and President Wahid wasremoved from office to be replaced by Vice President Megawati Sukarnoputri. Hamzah Haz, theleader of the small Muslim-based United Development Party (PPP), was elected Vice President.
President Megawati stabilises reforms (2001–04)While President Megawati has not overseen radical change, her tenure has brought a newmeasure of stability. She is supported by some well-qualified and competent ministers andadvisers.
One of the most important achievements of this transitional period, and of PresidentMegawati’s presidency, has been the drafting and enactment of constitutional changes toentrench the democracy reforms and make government more workable. The President andVice-President are now to be popularly elected. There will be, from 2004, two chambers of theparliament, a representative chamber elected by popular vote and a chamber comprisingrepresentatives of democratically elected regional parliaments.
At the regional government levels, more participatory and democratic governance structuresare in place and appear to be operating tolerably well despite fuzzy boundaries between thefunctions of the different levels of government. One major issue is that regional governments,especially at the district level, have implemented a plethora of regulations, some of whichincrease costs and may make investment in those areas less attractive.
Ongoing political unrest at the regional level, particularly in Papua and Aceh where there aresignificant movements opposing the Indonesian Government and seeking secession, remains aconcern. Troubles in other areas including Maluku have been inter-communal in nature, notsecessionist, and have largely settled down. However, such troubles have less impact upon thecountry as a whole than might be imagined, as they are at relatively remote ends of asprawling archipelago of 17 000 islands populated by more than two hundred million people.
Similarly, the existence of radical Islamic movements—principally Jemaah Islamiyah—has beendramatised by the Bali and Marriott bombings. But they only represent a small minority ofIndonesian Muslims. The great majority of Indonesian Muslims are moderate and do notsupport an Islamic State or the introduction of Sharia (traditional Islamic) law. The quick andeffective action by police to arrest the Bali bombers and bring them to justice has been asource of pride to most Indonesians.
No one would dare to predict that terrorism is at an end in Indonesia but it can be said that ithas not noticeably affected the reform process and its impact on the macro economy has so farbeen manageable.
Economic recovery – how much is enough?Economic recovery, which started in 1999, was initially weak and the limited availability ofcredit from the finance sector impeded activity. Nevertheless non-oil export volumes did beginto grow strongly on the back of a low rupiah exchange rate.
GDP growth reached 4.8% in calendar 2000. It then dipped and rose again to 3.5% in 2002 andan estimated 3.8% in 2003.
Overall, the economy has performed reasonably well in recent times, despite the furthersetbacks of two serious terrorist attacks, SARS and slow world growth. One particularlypositive development has been the emergence of a strong small and medium-sized enterprise(SME) sector alongside the large and longer-established business conglomerates, many ofwhich are still working off the effects of the crisis. Well managed SMEs are leading the recoveryto a significant extent, particularly in the food processing sector.
A renewed sense of political stability is reflected in strong consumer demand: consumptionspending has risen to 20% above pre-crisis levels, although growth is now slowing. It is alsoreflected in a strengthening currency and a rising stock market. These trends are amplyapparent in the new residential complexes, shopping malls and other modern retail and foodservice outlets that are multiplying in various parts of Jakarta and other major cities.
FOO D E XPORTER S’ GUIDE TO INDONESIA66
Chapter 7 Political and economicenvironment
On the other hand, investment has been much slower to recover. Gross inflows of ForeignDirect Investment (FDI) and portfolio investment in 2003 were US$1.6 billion and US$1.4 billionrespectively, but were outweighed by private sector outflows of US$8.4 billion.50 A rise of 35%in the total value of new FDI projects approved in 2003, to US$13.2 billion, was a more positivesign.51 This should be a leading indicator for stronger FDI flows in future years although asignificant part of this growth is apparently accounted for by a change of status of somecompanies from domestic to foreign. 52
An important factor in the slow recovery of FDI in Indonesia is China’s pre-eminence as acompetitor destination for inward investment, which should encourage Indonesia to adoptmeasures to improve the investment environment. In particular, investors are looking for moreconsistency and fairness in the regulatory and legal systems. One structural challenge isIndonesia’s slipping competitiveness in labour-intensive export industries—garments, textiles,footwear and toys. These accounted for 43% of exports in 1995 but only 34% by 2002. Again,China is a formidable competitor for these industries.
The rupiah has been appreciating and inflation has dropped from over 10% in 2002 to 6–7% forcalendar 2003.53 Foreign exchange reserves, at around US$36.6 billion, are healthy andIndonesia is paying off debts incurred through the crisis. Public sector debt is high, at 72% ofGDP at the end of 2002, but the World Bank has calculated that this ratio can be reduced tobelow 50% by 2008 and pre-crisis levels by 2016. By comparison, Thailand’s debt ratio rose toaround 60% in 2002 and the Philippines debt is estimated to be around the same level.
Despite the resumption of economic growth, Indonesia will need to do more to adequatelyemploy its growing workforce:
Among policy makers and local commentators, the general rule of thumb is that Indonesia needsapproximately 6% growth to accommodate the expanding workforce, and to make headway in re-integrating displaced workers within the formal economy. According to Bank Indonesia, growth of3.5% in 2002 was only sufficient to absorb 1.2 million workers out of the 2.5 million expansion ofthe workforce.54
The Indonesian Government believes that growth can be accelerated and has estimated thatgrowth in 2005 and 2006 may reach as high as 6%. The World Bank has commented that its‘best picture’ medium growth target is also 6%. McIntyre and Resosudarmo comment:
There is a rough consensus on many of the policy ingredients that would be needed to re-igniterapid economic growth: continued macroeconomic stability, accelerated reform of the financialsector and specific measures to improve the investment climate, especially in the labour-intensive
FOO D E XPORTER S’ GUIDE TO INDONESIA 67
Chapter 7 Political and economicenvironment
50 International Monetary Fund, 2004.
51 Badan Koordinasi Penanaman Modal, Investment Board Casts Doubt About Prospect in 2004, 2004, viewed 12 February 2004,<http://www.bkpm.go.id/en/board.php?mode=baca&message_id=210>.
52 DJ Ray, ‘Survey of Recent Developments’, Bulletin of Indonesian Economic Studies, no. 3, Australian National University,Canberra, December 2003.
53 Ray, 2003.
54 A McIntyre and B Resosudarmo 2003, ‘Survey of Recent Developments’, Bulletin of Indonesian Economic Studies, August2003, Australian National University, Canberra.
Refloating businessWhilst much remains to be done in the banking sector it is performing much better in recent years. Non-performing loans are now closer to acceptable parameters and credit is flowing again. An important ingredientof the present consumer spending boom is availability of consumer credit both from Indonesian andinternational sources.
Agencies were set up from 1999 (principally the Bank Restructuring Agency or IBRA) by the IndonesianGovernment to deal with, respectively, rescue by recapitalisation or closure of insolvent banks and managementof corporate indebtedness. A new bankruptcy law was enacted to help deal with the latter as many technicallybankrupt companies continued to trade. Also, a system of negotiated settlement, known as the JakartaInitiative, was established. These mechanisms have had some success.
However, relatively few companies have been brought before the Bankruptcy Court and of those, few have beenclosed down. In the celebrated case of Canadian-owned Manulife Insurance, the Court attempted to prosecute aperfectly viable international company that was in dispute with its former Indonesian partners. This drewinternational attention to weaknesses in Indonesia’s legal system although the case was eventually resolved.
Source: INSTATE research.
export sector. The problem, of course, is forging agreement within and between the executive andlegislative branches of government on enacting such reforms.55
2004 and beyondMuch will depend upon the style and quality of leadership following the parliamentaryelections held in April 2004. The presidential election will have its first round in July 2004 and,if necessary, the second round will be in September 2004 with inauguration in October 2004.
As noted above, analysts believe further policy adjustment and reform is needed to addressoutstanding economic and structural issues, but there is much evidence of vigour in the privatesector amongst the better managed big companies and many SMEs. The overall impression isone of stability and progress, albeit patchy and uneven in pace.
In all, Indonesia has made an impressive transition during the past 5 years. While it still facesmany challenges, it is a neighbour Australia should respect and build strong ties with, aneconomy that should not be underestimated, and a market that serious exporters should notignore.
FOO D E XPORTER S’ GUIDE TO INDONESIA68
Chapter title
55 A McIntyre and B Resosudarmo, ‘Survey of Recent Developments’.

Appendixes
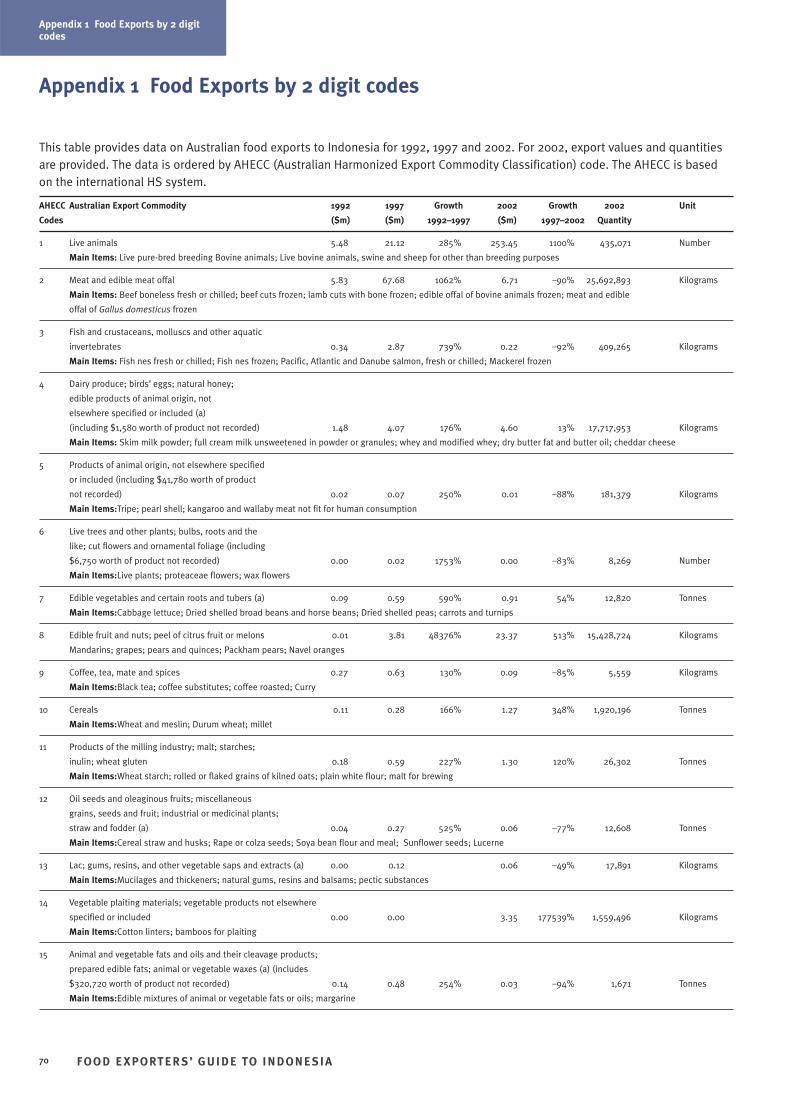
Appendix 1 Food Exports by 2 digitcodes
FOO D E XPORTER S’ GUIDE TO INDONESIA70
Appendix 1 Food Exports by two digit codes
Appendix 1 Food Exports by 2 digit codes
This table provides data on Australian food exports to Indonesia for 1992, 1997 and 2002. For 2002, export values and quantitiesare provided. The data is ordered by AHECC (Australian Harmonized Export Commodity Classification) code. The AHECC is basedon the international HS system.
AHECC Australian Export Commodity 1992 1997 Growth 2002 Growth 2002 Unit
Codes ($m) ($m) 1992–1997 ($m) 1997–2002 Quantity
1 Live animals 5.48 21.12 285% 253.45 1100% 435,071 Number
Main Items: Live pure-bred breeding Bovine animals; Live bovine animals, swine and sheep for other than breeding purposes
2 Meat and edible meat offal 5.83 67.68 1062% 6.71 –90% 25,692,893 Kilograms
Main Items: Beef boneless fresh or chilled; beef cuts frozen; lamb cuts with bone frozen; edible offal of bovine animals frozen; meat and edible
offal of Gallus domesticus frozen
3 Fish and crustaceans, molluscs and other aquatic
invertebrates 0.34 2.87 739% 0.22 –92% 409,265 Kilograms
Main Items: Fish nes fresh or chilled; Fish nes frozen; Pacific, Atlantic and Danube salmon, fresh or chilled; Mackerel frozen
4 Dairy produce; birds’ eggs; natural honey;
edible products of animal origin, not
elsewhere specified or included (a)
(including $1,580 worth of product not recorded) 1.48 4.07 176% 4.60 13% 17,717,953 Kilograms
Main Items: Skim milk powder; full cream milk unsweetened in powder or granules; whey and modified whey; dry butter fat and butter oil; cheddar cheese
5 Products of animal origin, not elsewhere specified
or included (including $41,780 worth of product
not recorded) 0.02 0.07 250% 0.01 –88% 181,379 Kilograms
Main Items:Tripe; pearl shell; kangaroo and wallaby meat not fit for human consumption
6 Live trees and other plants; bulbs, roots and the
like; cut flowers and ornamental foliage (including
$6,750 worth of product not recorded) 0.00 0.02 1753% 0.00 –83% 8,269 Number
Main Items:Live plants; proteaceae flowers; wax flowers
7 Edible vegetables and certain roots and tubers (a) 0.09 0.59 590% 0.91 54% 12,820 Tonnes
Main Items:Cabbage lettuce; Dried shelled broad beans and horse beans; Dried shelled peas; carrots and turnips
8 Edible fruit and nuts; peel of citrus fruit or melons 0.01 3.81 48376% 23.37 513% 15,428,724 Kilograms
Mandarins; grapes; pears and quinces; Packham pears; Navel oranges
9 Coffee, tea, mate and spices 0.27 0.63 130% 0.09 –85% 5,559 Kilograms
Main Items:Black tea; coffee substitutes; coffee roasted; Curry
10 Cereals 0.11 0.28 166% 1.27 348% 1,920,196 Tonnes
Main Items:Wheat and meslin; Durum wheat; millet
11 Products of the milling industry; malt; starches;
inulin; wheat gluten 0.18 0.59 227% 1.30 120% 26,302 Tonnes
Main Items:Wheat starch; rolled or flaked grains of kilned oats; plain white flour; malt for brewing
12 Oil seeds and oleaginous fruits; miscellaneous
grains, seeds and fruit; industrial or medicinal plants;
straw and fodder (a) 0.04 0.27 525% 0.06 –77% 12,608 Tonnes
Main Items:Cereal straw and husks; Rape or colza seeds; Soya bean flour and meal; Sunflower seeds; Lucerne
13 Lac; gums, resins, and other vegetable saps and extracts (a) 0.00 0.12 0.06 –49% 17,891 Kilograms
Main Items:Mucilages and thickeners; natural gums, resins and balsams; pectic substances
14 Vegetable plaiting materials; vegetable products not elsewhere
specified or included 0.00 0.00 3.35 177539% 1,559,496 Kilograms
Main Items:Cotton linters; bamboos for plaiting
15 Animal and vegetable fats and oils and their cleavage products;
prepared edible fats; animal or vegetable waxes (a) (includes
$320,720 worth of product not recorded) 0.14 0.48 254% 0.03 –94% 1,671 Tonnes
Main Items:Edible mixtures of animal or vegetable fats or oils; margarine
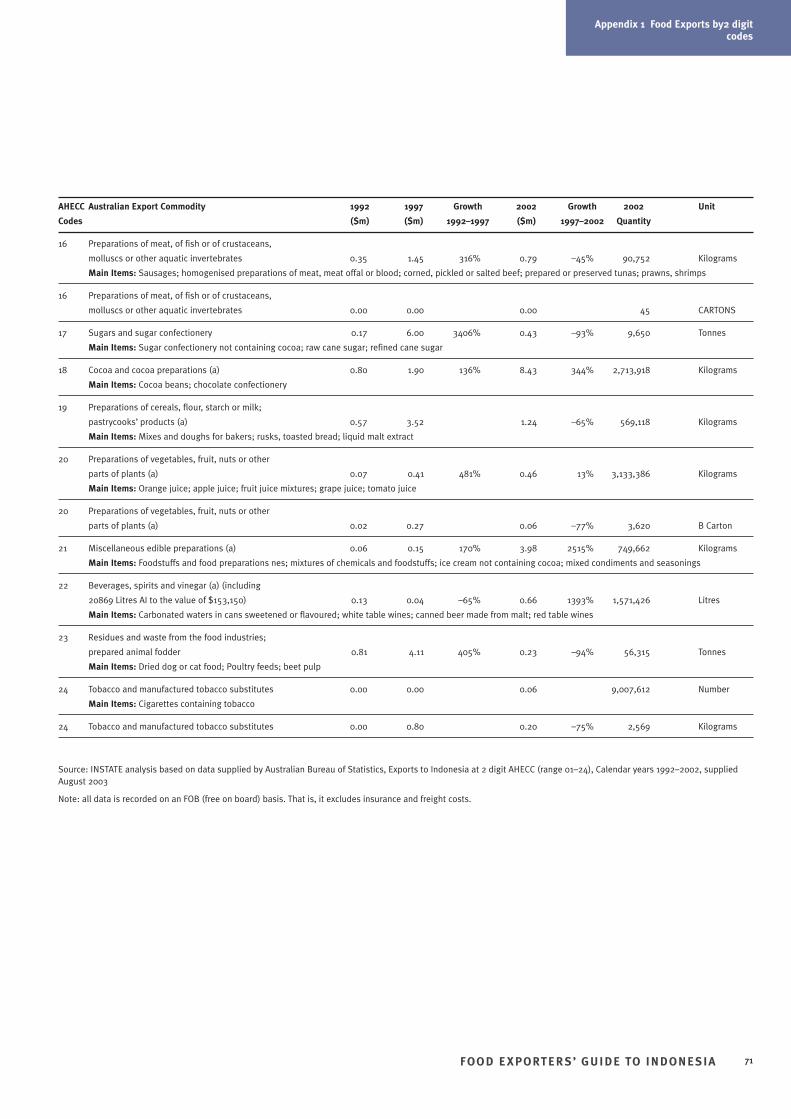
Appendix 1 Food Exports by2 digitcodes
FOO D E XPORTER S’ GUIDE TO INDONESIA 71
Appendix 1 Food Exports by two digit codes
AHECC Australian Export Commodity 1992 1997 Growth 2002 Growth 2002 Unit
Codes ($m) ($m) 1992–1997 ($m) 1997–2002 Quantity
16 Preparations of meat, of fish or of crustaceans,
molluscs or other aquatic invertebrates 0.35 1.45 316% 0.79 –45% 90,752 Kilograms
Main Items: Sausages; homogenised preparations of meat, meat offal or blood; corned, pickled or salted beef; prepared or preserved tunas; prawns, shrimps
16 Preparations of meat, of fish or of crustaceans,
molluscs or other aquatic invertebrates 0.00 0.00 0.00 45 CARTONS
17 Sugars and sugar confectionery 0.17 6.00 3406% 0.43 –93% 9,650 Tonnes
Main Items: Sugar confectionery not containing cocoa; raw cane sugar; refined cane sugar
18 Cocoa and cocoa preparations (a) 0.80 1.90 136% 8.43 344% 2,713,918 Kilograms
Main Items: Cocoa beans; chocolate confectionery
19 Preparations of cereals, flour, starch or milk;
pastrycooks’ products (a) 0.57 3.52 1.24 –65% 569,118 Kilograms
Main Items: Mixes and doughs for bakers; rusks, toasted bread; liquid malt extract
20 Preparations of vegetables, fruit, nuts or other
parts of plants (a) 0.07 0.41 481% 0.46 13% 3,133,386 Kilograms
Main Items: Orange juice; apple juice; fruit juice mixtures; grape juice; tomato juice
20 Preparations of vegetables, fruit, nuts or other
parts of plants (a) 0.02 0.27 0.06 –77% 3,620 B Carton
21 Miscellaneous edible preparations (a) 0.06 0.15 170% 3.98 2515% 749,662 Kilograms
Main Items: Foodstuffs and food preparations nes; mixtures of chemicals and foodstuffs; ice cream not containing cocoa; mixed condiments and seasonings
22 Beverages, spirits and vinegar (a) (including
20869 Litres AI to the value of $153,150) 0.13 0.04 –65% 0.66 1393% 1,571,426 Litres
Main Items: Carbonated waters in cans sweetened or flavoured; white table wines; canned beer made from malt; red table wines
23 Residues and waste from the food industries;
prepared animal fodder 0.81 4.11 405% 0.23 –94% 56,315 Tonnes
Main Items: Dried dog or cat food; Poultry feeds; beet pulp
24 Tobacco and manufactured tobacco substitutes 0.00 0.00 0.06 9,007,612 Number
Main Items: Cigarettes containing tobacco
24 Tobacco and manufactured tobacco substitutes 0.00 0.80 0.20 –75% 2,569 Kilograms
Source: INSTATE analysis based on data supplied by Australian Bureau of Statistics, Exports to Indonesia at 2 digit AHECC (range 01–24), Calendar years 1992–2002, suppliedAugust 2003
Note: all data is recorded on an FOB (free on board) basis. That is, it excludes insurance and freight costs.
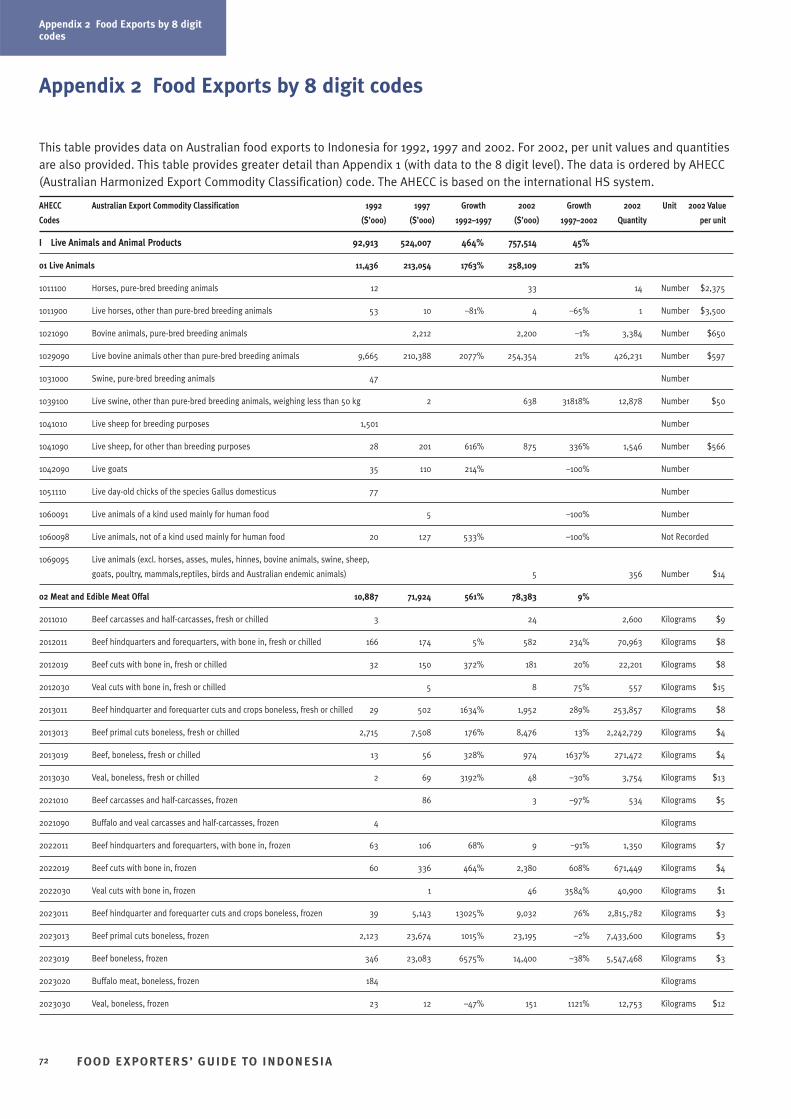
Appendix 2 Food Exports by 8 digitcodes
FOO D E XPORTER S’ GUIDE TO INDONESIA72
Appendix 2 Food Exports by 8 digit codes
This table provides data on Australian food exports to Indonesia for 1992, 1997 and 2002. For 2002, per unit values and quantitiesare also provided. This table provides greater detail than Appendix 1 (with data to the 8 digit level). The data is ordered by AHECC(Australian Harmonized Export Commodity Classification) code. The AHECC is based on the international HS system.
AHECC Australian Export Commodity Classification 1992 1997 Growth 2002 Growth 2002 Unit 2002 Value
Codes ($’000) ($’000) 1992–1997 ($’000) 1997–2002 Quantity per unit
I Live Animals and Animal Products 92,913 524,007 464% 757,514 45%
01 Live Animals 11,436 213,054 1763% 258,109 21%
1011100 Horses, pure-bred breeding animals 12 33 14 Number $2,375
1011900 Live horses, other than pure-bred breeding animals 53 10 –81% 4 –65% 1 Number $3,500
1021090 Bovine animals, pure-bred breeding animals 2,212 2,200 –1% 3,384 Number $650
1029090 Live bovine animals other than pure-bred breeding animals 9,665 210,388 2077% 254,354 21% 426,231 Number $597
1031000 Swine, pure-bred breeding animals 47 Number
1039100 Live swine, other than pure-bred breeding animals, weighing less than 50 kg 2 638 31818% 12,878 Number $50
1041010 Live sheep for breeding purposes 1,501 Number
1041090 Live sheep, for other than breeding purposes 28 201 616% 875 336% 1,546 Number $566
1042090 Live goats 35 110 214% –100% Number
1051110 Live day-old chicks of the species Gallus domesticus 77 Number
1060091 Live animals of a kind used mainly for human food 5 –100% Number
1060098 Live animals, not of a kind used mainly for human food 20 127 533% –100% Not Recorded
1069095 Live animals (excl. horses, asses, mules, hinnes, bovine animals, swine, sheep,
goats, poultry, mammals,reptiles, birds and Australian endemic animals) 5 356 Number $14
02 Meat and Edible Meat Offal 10,887 71,924 561% 78,383 9%
2011010 Beef carcasses and half-carcasses, fresh or chilled 3 24 2,600 Kilograms $9
2012011 Beef hindquarters and forequarters, with bone in, fresh or chilled 166 174 5% 582 234% 70,963 Kilograms $8
2012019 Beef cuts with bone in, fresh or chilled 32 150 372% 181 20% 22,201 Kilograms $8
2012030 Veal cuts with bone in, fresh or chilled 5 8 75% 557 Kilograms $15
2013011 Beef hindquarter and forequarter cuts and crops boneless, fresh or chilled 29 502 1634% 1,952 289% 253,857 Kilograms $8
2013013 Beef primal cuts boneless, fresh or chilled 2,715 7,508 176% 8,476 13% 2,242,729 Kilograms $4
2013019 Beef, boneless, fresh or chilled 13 56 328% 974 1637% 271,472 Kilograms $4
2013030 Veal, boneless, fresh or chilled 2 69 3192% 48 –30% 3,754 Kilograms $13
2021010 Beef carcasses and half-carcasses, frozen 86 3 –97% 534 Kilograms $5
2021090 Buffalo and veal carcasses and half-carcasses, frozen 4 Kilograms
2022011 Beef hindquarters and forequarters, with bone in, frozen 63 106 68% 9 –91% 1,350 Kilograms $7
2022019 Beef cuts with bone in, frozen 60 336 464% 2,380 608% 671,449 Kilograms $4
2022030 Veal cuts with bone in, frozen 1 46 3584% 40,900 Kilograms $1
2023011 Beef hindquarter and forequarter cuts and crops boneless, frozen 39 5,143 13025% 9,032 76% 2,815,782 Kilograms $3
2023013 Beef primal cuts boneless, frozen 2,123 23,674 1015% 23,195 –2% 7,433,600 Kilograms $3
2023019 Beef boneless, frozen 346 23,083 6575% 14,400 –38% 5,547,468 Kilograms $3
2023020 Buffalo meat, boneless, frozen 184 Kilograms
2023030 Veal, boneless, frozen 23 12 –47% 151 1121% 12,753 Kilograms $12
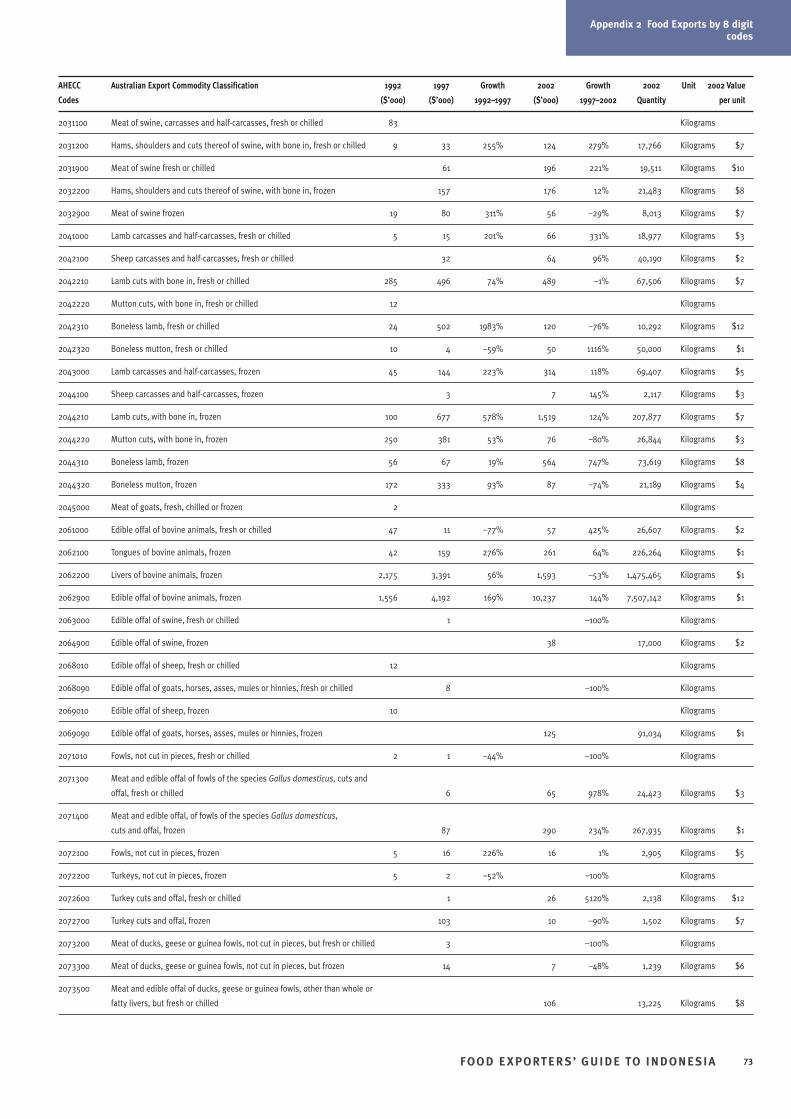
Appendix 2 Food Exports by 8 digitcodes
FOO D E XPORTER S’ GUIDE TO INDONESIA 73
AHECC Australian Export Commodity Classification 1992 1997 Growth 2002 Growth 2002 Unit 2002 Value
Codes ($’000) ($’000) 1992–1997 ($’000) 1997–2002 Quantity per unit
2031100 Meat of swine, carcasses and half-carcasses, fresh or chilled 83 Kilograms
2031200 Hams, shoulders and cuts thereof of swine, with bone in, fresh or chilled 9 33 255% 124 279% 17,766 Kilograms $7
2031900 Meat of swine fresh or chilled 61 196 221% 19,511 Kilograms $10
2032200 Hams, shoulders and cuts thereof of swine, with bone in, frozen 157 176 12% 21,483 Kilograms $8
2032900 Meat of swine frozen 19 80 311% 56 –29% 8,013 Kilograms $7
2041000 Lamb carcasses and half-carcasses, fresh or chilled 5 15 201% 66 331% 18,977 Kilograms $3
2042100 Sheep carcasses and half-carcasses, fresh or chilled 32 64 96% 40,190 Kilograms $2
2042210 Lamb cuts with bone in, fresh or chilled 285 496 74% 489 –1% 67,506 Kilograms $7
2042220 Mutton cuts, with bone in, fresh or chilled 12 Kilograms
2042310 Boneless lamb, fresh or chilled 24 502 1983% 120 –76% 10,292 Kilograms $12
2042320 Boneless mutton, fresh or chilled 10 4 –59% 50 1116% 50,000 Kilograms $1
2043000 Lamb carcasses and half-carcasses, frozen 45 144 223% 314 118% 69,407 Kilograms $5
2044100 Sheep carcasses and half-carcasses, frozen 3 7 145% 2,117 Kilograms $3
2044210 Lamb cuts, with bone in, frozen 100 677 578% 1,519 124% 207,877 Kilograms $7
2044220 Mutton cuts, with bone in, frozen 250 381 53% 76 –80% 26,844 Kilograms $3
2044310 Boneless lamb, frozen 56 67 19% 564 747% 73,619 Kilograms $8
2044320 Boneless mutton, frozen 172 333 93% 87 –74% 21,189 Kilograms $4
2045000 Meat of goats, fresh, chilled or frozen 2 Kilograms
2061000 Edible offal of bovine animals, fresh or chilled 47 11 –77% 57 425% 26,607 Kilograms $2
2062100 Tongues of bovine animals, frozen 42 159 276% 261 64% 226,264 Kilograms $1
2062200 Livers of bovine animals, frozen 2,175 3,391 56% 1,593 –53% 1,475,465 Kilograms $1
2062900 Edible offal of bovine animals, frozen 1,556 4,192 169% 10,237 144% 7,507,142 Kilograms $1
2063000 Edible offal of swine, fresh or chilled 1 –100% Kilograms
2064900 Edible offal of swine, frozen 38 17,000 Kilograms $2
2068010 Edible offal of sheep, fresh or chilled 12 Kilograms
2068090 Edible offal of goats, horses, asses, mules or hinnies, fresh or chilled 8 –100% Kilograms
2069010 Edible offal of sheep, frozen 10 Kilograms
2069090 Edible offal of goats, horses, asses, mules or hinnies, frozen 125 91,034 Kilograms $1
2071010 Fowls, not cut in pieces, fresh or chilled 2 1 –44% –100% Kilograms
2071300 Meat and edible offal of fowls of the species Gallus domesticus, cuts and
offal, fresh or chilled 6 65 978% 24,423 Kilograms $3
2071400 Meat and edible offal, of fowls of the species Gallus domesticus,
cuts and offal, frozen 87 290 234% 267,935 Kilograms $1
2072100 Fowls, not cut in pieces, frozen 5 16 226% 16 1% 2,905 Kilograms $5
2072200 Turkeys, not cut in pieces, frozen 5 2 –52% –100% Kilograms
2072600 Turkey cuts and offal, fresh or chilled 1 26 5120% 2,138 Kilograms $12
2072700 Turkey cuts and offal, frozen 103 10 –90% 1,502 Kilograms $7
2073200 Meat of ducks, geese or guinea fowls, not cut in pieces, but fresh or chilled 3 –100% Kilograms
2073300 Meat of ducks, geese or guinea fowls, not cut in pieces, but frozen 14 7 –48% 1,239 Kilograms $6
2073500 Meat and edible offal of ducks, geese or guinea fowls, other than whole or
fatty livers, but fresh or chilled 106 13,225 Kilograms $8
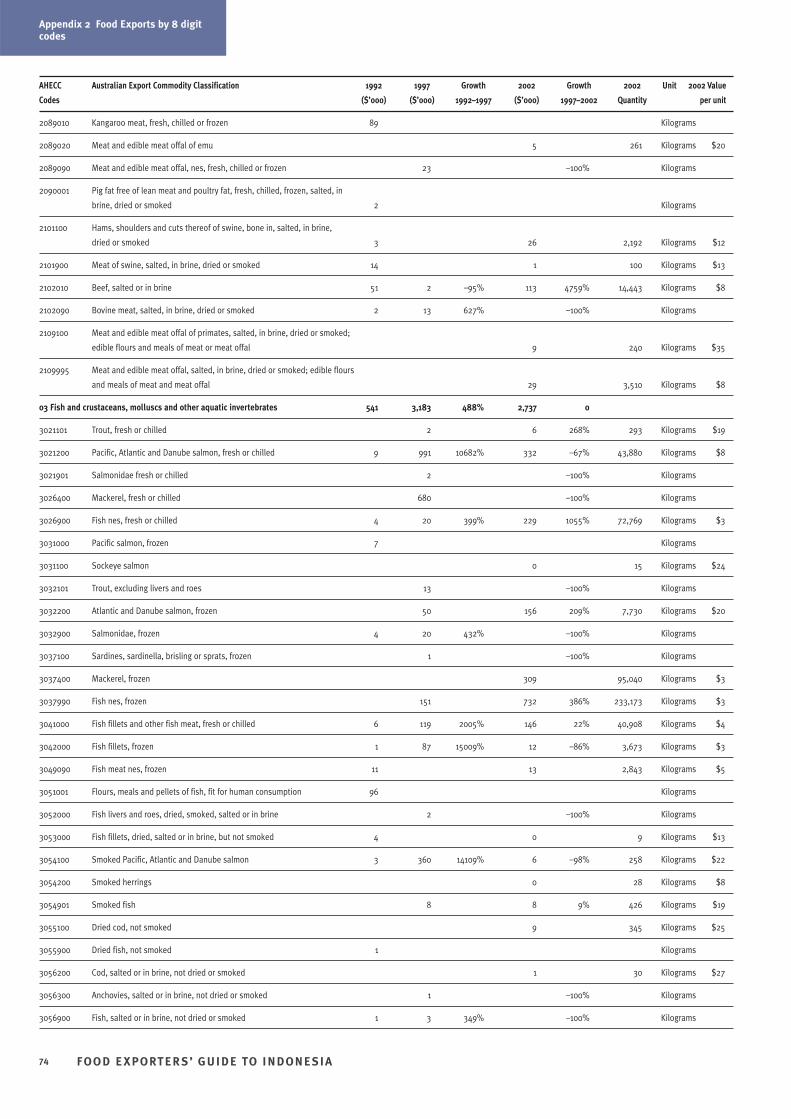
Appendix 2 Food Exports by 8 digitcodes
FOO D E XPORTER S’ GUIDE TO INDONESIA74
AHECC Australian Export Commodity Classification 1992 1997 Growth 2002 Growth 2002 Unit 2002 Value
Codes ($’000) ($’000) 1992–1997 ($’000) 1997–2002 Quantity per unit
2089010 Kangaroo meat, fresh, chilled or frozen 89 Kilograms
2089020 Meat and edible meat offal of emu 5 261 Kilograms $20
2089090 Meat and edible meat offal, nes, fresh, chilled or frozen 23 –100% Kilograms
2090001 Pig fat free of lean meat and poultry fat, fresh, chilled, frozen, salted, in
brine, dried or smoked 2 Kilograms
2101100 Hams, shoulders and cuts thereof of swine, bone in, salted, in brine,
dried or smoked 3 26 2,192 Kilograms $12
2101900 Meat of swine, salted, in brine, dried or smoked 14 1 100 Kilograms $13
2102010 Beef, salted or in brine 51 2 –95% 113 4759% 14,443 Kilograms $8
2102090 Bovine meat, salted, in brine, dried or smoked 2 13 627% –100% Kilograms
2109100 Meat and edible meat offal of primates, salted, in brine, dried or smoked;
edible flours and meals of meat or meat offal 9 240 Kilograms $35
2109995 Meat and edible meat offal, salted, in brine, dried or smoked; edible flours
and meals of meat and meat offal 29 3,510 Kilograms $8
03 Fish and crustaceans, molluscs and other aquatic invertebrates 541 3,183 488% 2,737 0
3021101 Trout, fresh or chilled 2 6 268% 293 Kilograms $19
3021200 Pacific, Atlantic and Danube salmon, fresh or chilled 9 991 10682% 332 –67% 43,880 Kilograms $8
3021901 Salmonidae fresh or chilled 2 –100% Kilograms
3026400 Mackerel, fresh or chilled 680 –100% Kilograms
3026900 Fish nes, fresh or chilled 4 20 399% 229 1055% 72,769 Kilograms $3
3031000 Pacific salmon, frozen 7 Kilograms
3031100 Sockeye salmon 0 15 Kilograms $24
3032101 Trout, excluding livers and roes 13 –100% Kilograms
3032200 Atlantic and Danube salmon, frozen 50 156 209% 7,730 Kilograms $20
3032900 Salmonidae, frozen 4 20 432% –100% Kilograms
3037100 Sardines, sardinella, brisling or sprats, frozen 1 –100% Kilograms
3037400 Mackerel, frozen 309 95,040 Kilograms $3
3037990 Fish nes, frozen 151 732 386% 233,173 Kilograms $3
3041000 Fish fillets and other fish meat, fresh or chilled 6 119 2005% 146 22% 40,908 Kilograms $4
3042000 Fish fillets, frozen 1 87 15009% 12 –86% 3,673 Kilograms $3
3049090 Fish meat nes, frozen 11 13 2,843 Kilograms $5
3051001 Flours, meals and pellets of fish, fit for human consumption 96 Kilograms
3052000 Fish livers and roes, dried, smoked, salted or in brine 2 –100% Kilograms
3053000 Fish fillets, dried, salted or in brine, but not smoked 4 0 9 Kilograms $13
3054100 Smoked Pacific, Atlantic and Danube salmon 3 360 14109% 6 –98% 258 Kilograms $22
3054200 Smoked herrings 0 28 Kilograms $8
3054901 Smoked fish 8 8 9% 426 Kilograms $19
3055100 Dried cod, not smoked 9 345 Kilograms $25
3055900 Dried fish, not smoked 1 Kilograms
3056200 Cod, salted or in brine, not dried or smoked 1 30 Kilograms $27
3056300 Anchovies, salted or in brine, not dried or smoked 1 –100% Kilograms
3056900 Fish, salted or in brine, not dried or smoked 1 3 349% –100% Kilograms
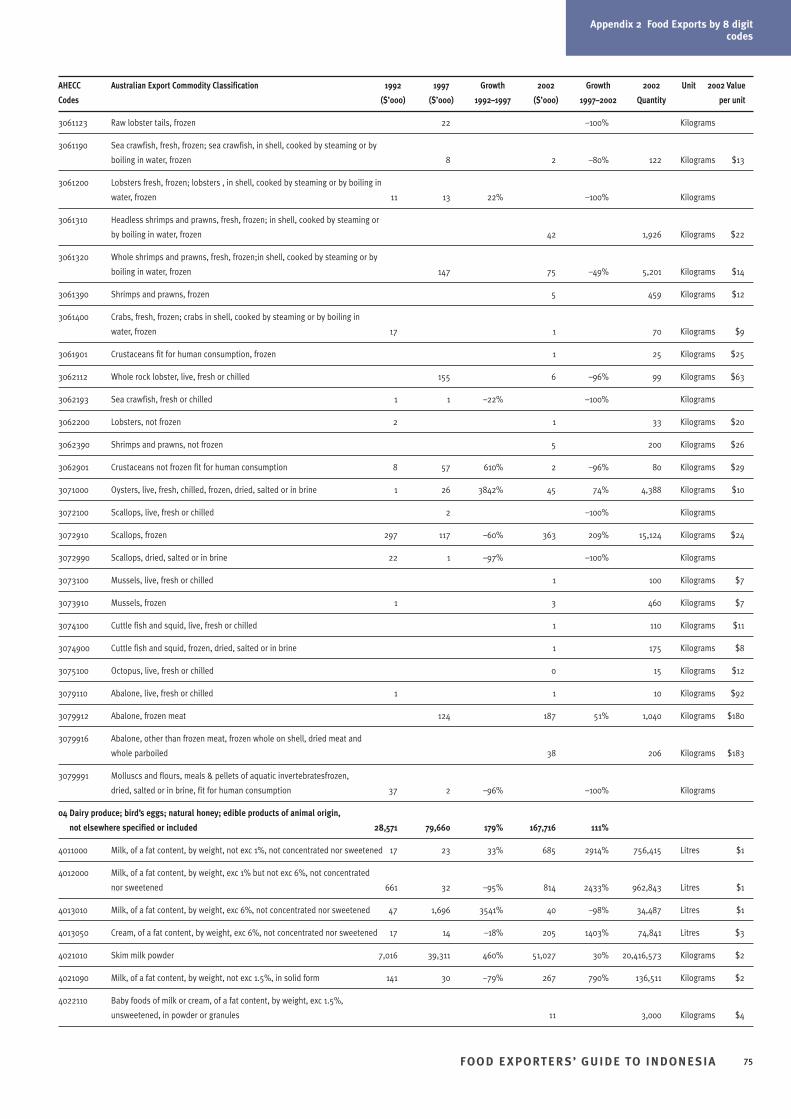
Appendix 2 Food Exports by 8 digitcodes
FOO D E XPORTER S’ GUIDE TO INDONESIA 75
AHECC Australian Export Commodity Classification 1992 1997 Growth 2002 Growth 2002 Unit 2002 Value
Codes ($’000) ($’000) 1992–1997 ($’000) 1997–2002 Quantity per unit
3061123 Raw lobster tails, frozen 22 –100% Kilograms
3061190 Sea crawfish, fresh, frozen; sea crawfish, in shell, cooked by steaming or by
boiling in water, frozen 8 2 –80% 122 Kilograms $13
3061200 Lobsters fresh, frozen; lobsters , in shell, cooked by steaming or by boiling in
water, frozen 11 13 22% –100% Kilograms
3061310 Headless shrimps and prawns, fresh, frozen; in shell, cooked by steaming or
by boiling in water, frozen 42 1,926 Kilograms $22
3061320 Whole shrimps and prawns, fresh, frozen;in shell, cooked by steaming or by
boiling in water, frozen 147 75 –49% 5,201 Kilograms $14
3061390 Shrimps and prawns, frozen 5 459 Kilograms $12
3061400 Crabs, fresh, frozen; crabs in shell, cooked by steaming or by boiling in
water, frozen 17 1 70 Kilograms $9
3061901 Crustaceans fit for human consumption, frozen 1 25 Kilograms $25
3062112 Whole rock lobster, live, fresh or chilled 155 6 –96% 99 Kilograms $63
3062193 Sea crawfish, fresh or chilled 1 1 –22% –100% Kilograms
3062200 Lobsters, not frozen 2 1 33 Kilograms $20
3062390 Shrimps and prawns, not frozen 5 200 Kilograms $26
3062901 Crustaceans not frozen fit for human consumption 8 57 610% 2 –96% 80 Kilograms $29
3071000 Oysters, live, fresh, chilled, frozen, dried, salted or in brine 1 26 3842% 45 74% 4,388 Kilograms $10
3072100 Scallops, live, fresh or chilled 2 –100% Kilograms
3072910 Scallops, frozen 297 117 –60% 363 209% 15,124 Kilograms $24
3072990 Scallops, dried, salted or in brine 22 1 –97% –100% Kilograms
3073100 Mussels, live, fresh or chilled 1 100 Kilograms $7
3073910 Mussels, frozen 1 3 460 Kilograms $7
3074100 Cuttle fish and squid, live, fresh or chilled 1 110 Kilograms $11
3074900 Cuttle fish and squid, frozen, dried, salted or in brine 1 175 Kilograms $8
3075100 Octopus, live, fresh or chilled 0 15 Kilograms $12
3079110 Abalone, live, fresh or chilled 1 1 10 Kilograms $92
3079912 Abalone, frozen meat 124 187 51% 1,040 Kilograms $180
3079916 Abalone, other than frozen meat, frozen whole on shell, dried meat and
whole parboiled 38 206 Kilograms $183
3079991 Molluscs and flours, meals & pellets of aquatic invertebratesfrozen,
dried, salted or in brine, fit for human consumption 37 2 –96% –100% Kilograms
04 Dairy produce; bird’s eggs; natural honey; edible products of animal origin,
not elsewhere specified or included 28,571 79,660 179% 167,716 111%
4011000 Milk, of a fat content, by weight, not exc 1%, not concentrated nor sweetened 17 23 33% 685 2914% 756,415 Litres $1
4012000 Milk, of a fat content, by weight, exc 1% but not exc 6%, not concentrated
nor sweetened 661 32 –95% 814 2433% 962,843 Litres $1
4013010 Milk, of a fat content, by weight, exc 6%, not concentrated nor sweetened 47 1,696 3541% 40 –98% 34,487 Litres $1
4013050 Cream, of a fat content, by weight, exc 6%, not concentrated nor sweetened 17 14 –18% 205 1403% 74,841 Litres $3
4021010 Skim milk powder 7,016 39,311 460% 51,027 30% 20,416,573 Kilograms $2
4021090 Milk, of a fat content, by weight, not exc 1.5%, in solid form 141 30 –79% 267 790% 136,511 Kilograms $2
4022110 Baby foods of milk or cream, of a fat content, by weight, exc 1.5%,
unsweetened, in powder or granules 11 3,000 Kilograms $4
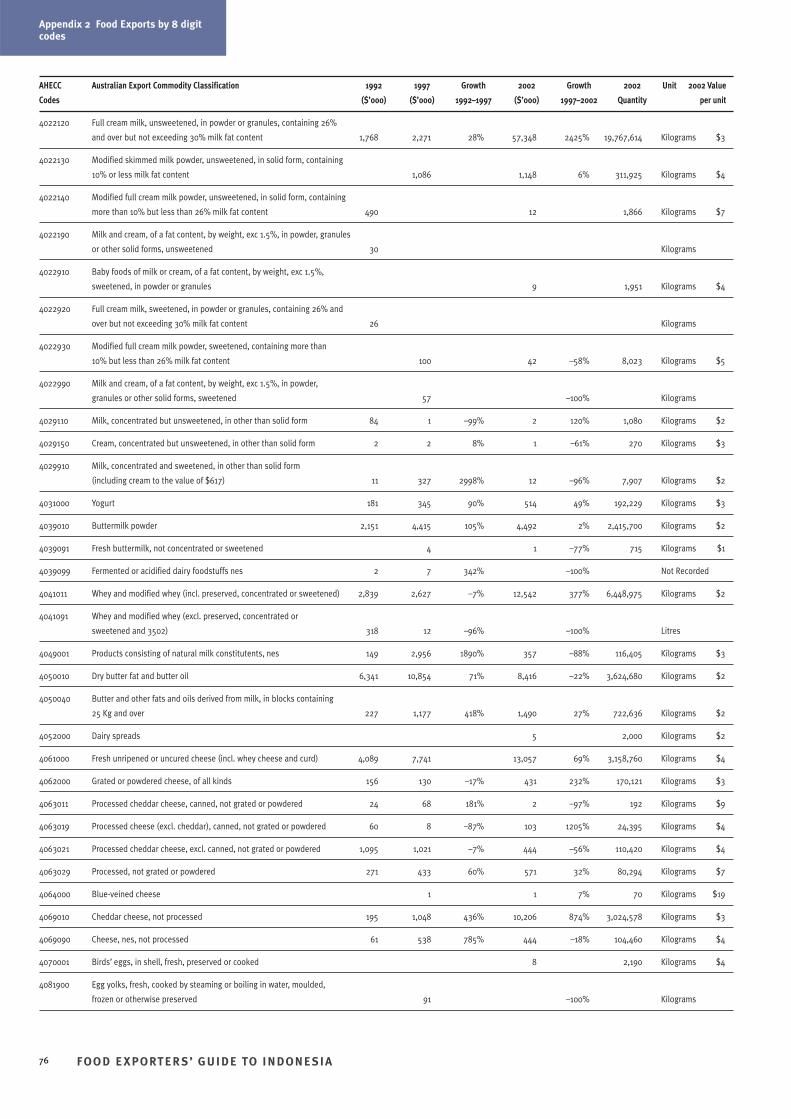
Appendix 2 Food Exports by 8 digitcodes
FOO D E XPORTER S’ GUIDE TO INDONESIA76
AHECC Australian Export Commodity Classification 1992 1997 Growth 2002 Growth 2002 Unit 2002 Value
Codes ($’000) ($’000) 1992–1997 ($’000) 1997–2002 Quantity per unit
4022120 Full cream milk, unsweetened, in powder or granules, containing 26%
and over but not exceeding 30% milk fat content 1,768 2,271 28% 57,348 2425% 19,767,614 Kilograms $3
4022130 Modified skimmed milk powder, unsweetened, in solid form, containing
10% or less milk fat content 1,086 1,148 6% 311,925 Kilograms $4
4022140 Modified full cream milk powder, unsweetened, in solid form, containing
more than 10% but less than 26% milk fat content 490 12 1,866 Kilograms $7
4022190 Milk and cream, of a fat content, by weight, exc 1.5%, in powder, granules
or other solid forms, unsweetened 30 Kilograms
4022910 Baby foods of milk or cream, of a fat content, by weight, exc 1.5%,
sweetened, in powder or granules 9 1,951 Kilograms $4
4022920 Full cream milk, sweetened, in powder or granules, containing 26% and
over but not exceeding 30% milk fat content 26 Kilograms
4022930 Modified full cream milk powder, sweetened, containing more than
10% but less than 26% milk fat content 100 42 –58% 8,023 Kilograms $5
4022990 Milk and cream, of a fat content, by weight, exc 1.5%, in powder,
granules or other solid forms, sweetened 57 –100% Kilograms
4029110 Milk, concentrated but unsweetened, in other than solid form 84 1 –99% 2 120% 1,080 Kilograms $2
4029150 Cream, concentrated but unsweetened, in other than solid form 2 2 8% 1 –61% 270 Kilograms $3
4029910 Milk, concentrated and sweetened, in other than solid form
(including cream to the value of $617) 11 327 2998% 12 –96% 7,907 Kilograms $2
4031000 Yogurt 181 345 90% 514 49% 192,229 Kilograms $3
4039010 Buttermilk powder 2,151 4,415 105% 4,492 2% 2,415,700 Kilograms $2
4039091 Fresh buttermilk, not concentrated or sweetened 4 1 –77% 715 Kilograms $1
4039099 Fermented or acidified dairy foodstuffs nes 2 7 342% –100% Not Recorded
4041011 Whey and modified whey (incl. preserved, concentrated or sweetened) 2,839 2,627 –7% 12,542 377% 6,448,975 Kilograms $2
4041091 Whey and modified whey (excl. preserved, concentrated or
sweetened and 3502) 318 12 –96% –100% Litres
4049001 Products consisting of natural milk constitutents, nes 149 2,956 1890% 357 –88% 116,405 Kilograms $3
4050010 Dry butter fat and butter oil 6,341 10,854 71% 8,416 –22% 3,624,680 Kilograms $2
4050040 Butter and other fats and oils derived from milk, in blocks containing
25 Kg and over 227 1,177 418% 1,490 27% 722,636 Kilograms $2
4052000 Dairy spreads 5 2,000 Kilograms $2
4061000 Fresh unripened or uncured cheese (incl. whey cheese and curd) 4,089 7,741 13,057 69% 3,158,760 Kilograms $4
4062000 Grated or powdered cheese, of all kinds 156 130 –17% 431 232% 170,121 Kilograms $3
4063011 Processed cheddar cheese, canned, not grated or powdered 24 68 181% 2 –97% 192 Kilograms $9
4063019 Processed cheese (excl. cheddar), canned, not grated or powdered 60 8 –87% 103 1205% 24,395 Kilograms $4
4063021 Processed cheddar cheese, excl. canned, not grated or powdered 1,095 1,021 –7% 444 –56% 110,420 Kilograms $4
4063029 Processed, not grated or powdered 271 433 60% 571 32% 80,294 Kilograms $7
4064000 Blue-veined cheese 1 1 7% 70 Kilograms $19
4069010 Cheddar cheese, not processed 195 1,048 436% 10,206 874% 3,024,578 Kilograms $3
4069090 Cheese, nes, not processed 61 538 785% 444 –18% 104,460 Kilograms $4
4070001 Birds’ eggs, in shell, fresh, preserved or cooked 8 2,190 Kilograms $4
4081900 Egg yolks, fresh, cooked by steaming or boiling in water, moulded,
frozen or otherwise preserved 91 –100% Kilograms
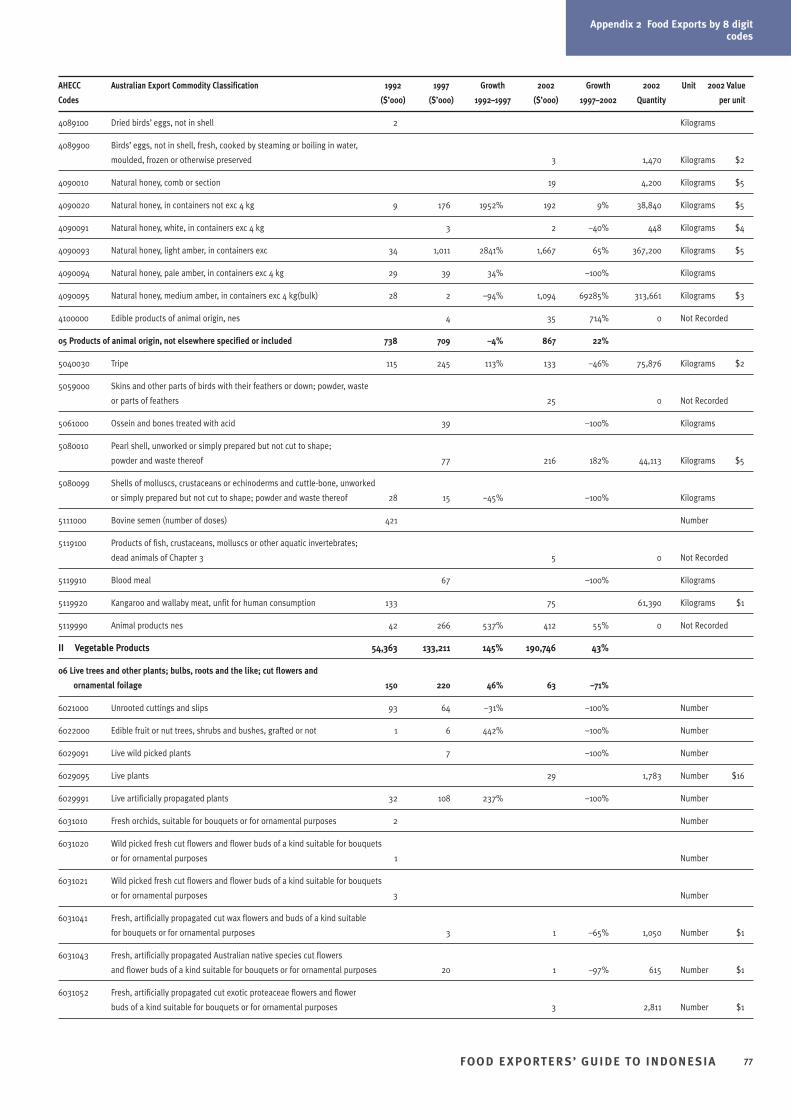
Appendix 2 Food Exports by 8 digitcodes
FOO D E XPORTER S’ GUIDE TO INDONESIA 77
AHECC Australian Export Commodity Classification 1992 1997 Growth 2002 Growth 2002 Unit 2002 Value
Codes ($’000) ($’000) 1992–1997 ($’000) 1997–2002 Quantity per unit
4089100 Dried birds’ eggs, not in shell 2 Kilograms
4089900 Birds’ eggs, not in shell, fresh, cooked by steaming or boiling in water,
moulded, frozen or otherwise preserved 3 1,470 Kilograms $2
4090010 Natural honey, comb or section 19 4,200 Kilograms $5
4090020 Natural honey, in containers not exc 4 kg 9 176 1952% 192 9% 38,840 Kilograms $5
4090091 Natural honey, white, in containers exc 4 kg 3 2 –40% 448 Kilograms $4
4090093 Natural honey, light amber, in containers exc 34 1,011 2841% 1,667 65% 367,200 Kilograms $5
4090094 Natural honey, pale amber, in containers exc 4 kg 29 39 34% –100% Kilograms
4090095 Natural honey, medium amber, in containers exc 4 kg(bulk) 28 2 –94% 1,094 69285% 313,661 Kilograms $3
4100000 Edible products of animal origin, nes 4 35 714% 0 Not Recorded
05 Products of animal origin, not elsewhere specified or included 738 709 –4% 867 22%
5040030 Tripe 115 245 113% 133 –46% 75,876 Kilograms $2
5059000 Skins and other parts of birds with their feathers or down; powder, waste
or parts of feathers 25 0 Not Recorded
5061000 Ossein and bones treated with acid 39 –100% Kilograms
5080010 Pearl shell, unworked or simply prepared but not cut to shape;
powder and waste thereof 77 216 182% 44,113 Kilograms $5
5080099 Shells of molluscs, crustaceans or echinoderms and cuttle-bone, unworked
or simply prepared but not cut to shape; powder and waste thereof 28 15 –45% –100% Kilograms
5111000 Bovine semen (number of doses) 421 Number
5119100 Products of fish, crustaceans, molluscs or other aquatic invertebrates;
dead animals of Chapter 3 5 0 Not Recorded
5119910 Blood meal 67 –100% Kilograms
5119920 Kangaroo and wallaby meat, unfit for human consumption 133 75 61,390 Kilograms $1
5119990 Animal products nes 42 266 537% 412 55% 0 Not Recorded
II Vegetable Products 54,363 133,211 145% 190,746 43%
06 Live trees and other plants; bulbs, roots and the like; cut flowers and
ornamental foilage 150 220 46% 63 –71%
6021000 Unrooted cuttings and slips 93 64 –31% –100% Number
6022000 Edible fruit or nut trees, shrubs and bushes, grafted or not 1 6 442% –100% Number
6029091 Live wild picked plants 7 –100% Number
6029095 Live plants 29 1,783 Number $16
6029991 Live artificially propagated plants 32 108 237% –100% Number
6031010 Fresh orchids, suitable for bouquets or for ornamental purposes 2 Number
6031020 Wild picked fresh cut flowers and flower buds of a kind suitable for bouquets
or for ornamental purposes 1 Number
6031021 Wild picked fresh cut flowers and flower buds of a kind suitable for bouquets
or for ornamental purposes 3 Number
6031041 Fresh, artificially propagated cut wax flowers and buds of a kind suitable
for bouquets or for ornamental purposes 3 1 –65% 1,050 Number $1
6031043 Fresh, artificially propagated Australian native species cut flowers
and flower buds of a kind suitable for bouquets or for ornamental purposes 20 1 –97% 615 Number $1
6031052 Fresh, artificially propagated cut exotic proteaceae flowers and flower
buds of a kind suitable for bouquets or for ornamental purposes 3 2,811 Number $1
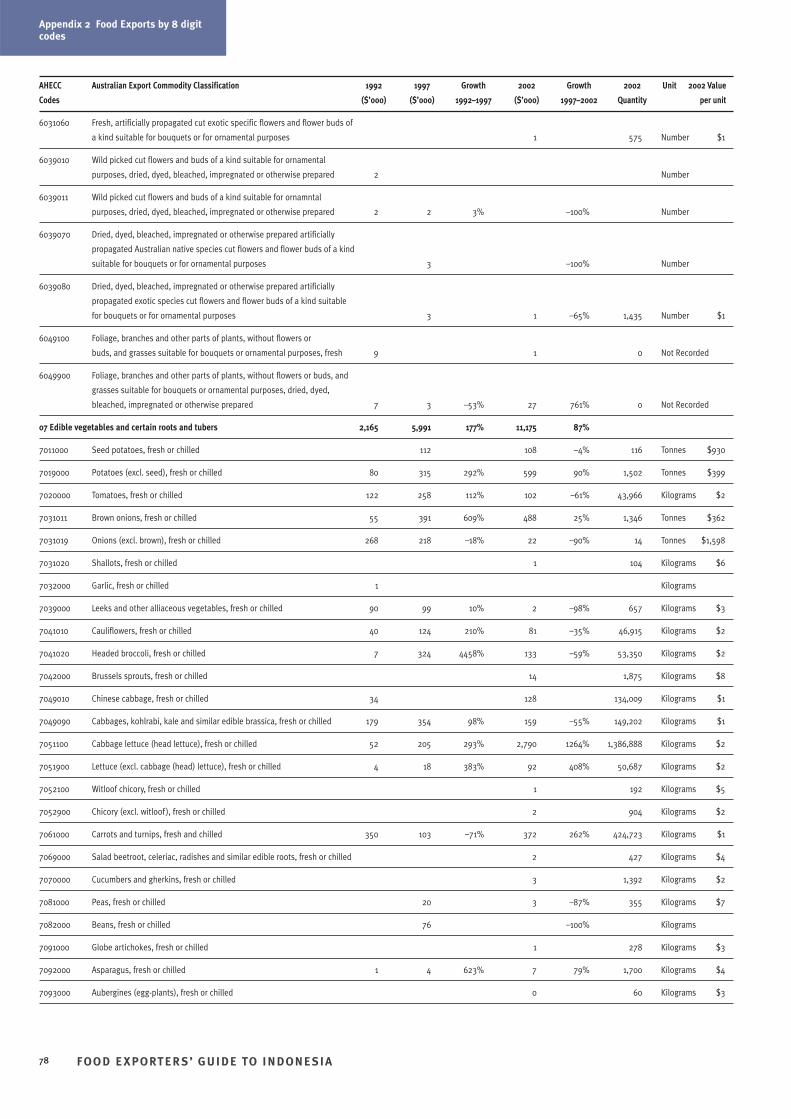
Appendix 2 Food Exports by 8 digitcodes
FOO D E XPORTER S’ GUIDE TO INDONESIA78
AHECC Australian Export Commodity Classification 1992 1997 Growth 2002 Growth 2002 Unit 2002 Value
Codes ($’000) ($’000) 1992–1997 ($’000) 1997–2002 Quantity per unit
6031060 Fresh, artificially propagated cut exotic specific flowers and flower buds of
a kind suitable for bouquets or for ornamental purposes 1 575 Number $1
6039010 Wild picked cut flowers and buds of a kind suitable for ornamental
purposes, dried, dyed, bleached, impregnated or otherwise prepared 2 Number
6039011 Wild picked cut flowers and buds of a kind suitable for ornamntal
purposes, dried, dyed, bleached, impregnated or otherwise prepared 2 2 3% –100% Number
6039070 Dried, dyed, bleached, impregnated or otherwise prepared artificially
propagated Australian native species cut flowers and flower buds of a kind
suitable for bouquets or for ornamental purposes 3 –100% Number
6039080 Dried, dyed, bleached, impregnated or otherwise prepared artificially
propagated exotic species cut flowers and flower buds of a kind suitable
for bouquets or for ornamental purposes 3 1 –65% 1,435 Number $1
6049100 Foliage, branches and other parts of plants, without flowers or
buds, and grasses suitable for bouquets or ornamental purposes, fresh 9 1 0 Not Recorded
6049900 Foliage, branches and other parts of plants, without flowers or buds, and
grasses suitable for bouquets or ornamental purposes, dried, dyed,
bleached, impregnated or otherwise prepared 7 3 –53% 27 761% 0 Not Recorded
07 Edible vegetables and certain roots and tubers 2,165 5,991 177% 11,175 87%
7011000 Seed potatoes, fresh or chilled 112 108 –4% 116 Tonnes $930
7019000 Potatoes (excl. seed), fresh or chilled 80 315 292% 599 90% 1,502 Tonnes $399
7020000 Tomatoes, fresh or chilled 122 258 112% 102 –61% 43,966 Kilograms $2
7031011 Brown onions, fresh or chilled 55 391 609% 488 25% 1,346 Tonnes $362
7031019 Onions (excl. brown), fresh or chilled 268 218 –18% 22 –90% 14 Tonnes $1,598
7031020 Shallots, fresh or chilled 1 104 Kilograms $6
7032000 Garlic, fresh or chilled 1 Kilograms
7039000 Leeks and other alliaceous vegetables, fresh or chilled 90 99 10% 2 –98% 657 Kilograms $3
7041010 Cauliflowers, fresh or chilled 40 124 210% 81 –35% 46,915 Kilograms $2
7041020 Headed broccoli, fresh or chilled 7 324 4458% 133 –59% 53,350 Kilograms $2
7042000 Brussels sprouts, fresh or chilled 14 1,875 Kilograms $8
7049010 Chinese cabbage, fresh or chilled 34 128 134,009 Kilograms $1
7049090 Cabbages, kohlrabi, kale and similar edible brassica, fresh or chilled 179 354 98% 159 –55% 149,202 Kilograms $1
7051100 Cabbage lettuce (head lettuce), fresh or chilled 52 205 293% 2,790 1264% 1,386,888 Kilograms $2
7051900 Lettuce (excl. cabbage (head) lettuce), fresh or chilled 4 18 383% 92 408% 50,687 Kilograms $2
7052100 Witloof chicory, fresh or chilled 1 192 Kilograms $5
7052900 Chicory (excl. witloof ), fresh or chilled 2 904 Kilograms $2
7061000 Carrots and turnips, fresh and chilled 350 103 –71% 372 262% 424,723 Kilograms $1
7069000 Salad beetroot, celeriac, radishes and similar edible roots, fresh or chilled 2 427 Kilograms $4
7070000 Cucumbers and gherkins, fresh or chilled 3 1,392 Kilograms $2
7081000 Peas, fresh or chilled 20 3 –87% 355 Kilograms $7
7082000 Beans, fresh or chilled 76 –100% Kilograms
7091000 Globe artichokes, fresh or chilled 1 278 Kilograms $3
7092000 Asparagus, fresh or chilled 1 4 623% 7 79% 1,700 Kilograms $4
7093000 Aubergines (egg-plants), fresh or chilled 0 60 Kilograms $3
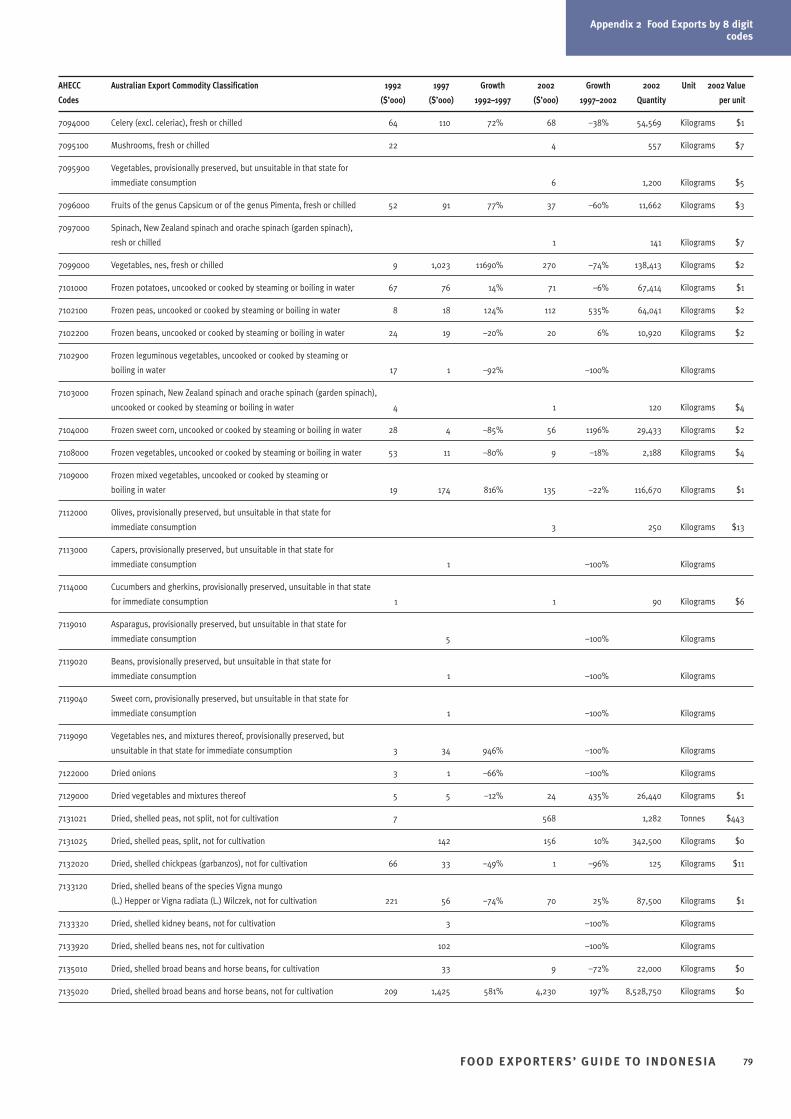
Appendix 2 Food Exports by 8 digitcodes
FOO D E XPORTER S’ GUIDE TO INDONESIA 79
AHECC Australian Export Commodity Classification 1992 1997 Growth 2002 Growth 2002 Unit 2002 Value
Codes ($’000) ($’000) 1992–1997 ($’000) 1997–2002 Quantity per unit
7094000 Celery (excl. celeriac), fresh or chilled 64 110 72% 68 –38% 54,569 Kilograms $1
7095100 Mushrooms, fresh or chilled 22 4 557 Kilograms $7
7095900 Vegetables, provisionally preserved, but unsuitable in that state for
immediate consumption 6 1,200 Kilograms $5
7096000 Fruits of the genus Capsicum or of the genus Pimenta, fresh or chilled 52 91 77% 37 –60% 11,662 Kilograms $3
7097000 Spinach, New Zealand spinach and orache spinach (garden spinach),
resh or chilled 1 141 Kilograms $7
7099000 Vegetables, nes, fresh or chilled 9 1,023 11690% 270 –74% 138,413 Kilograms $2
7101000 Frozen potatoes, uncooked or cooked by steaming or boiling in water 67 76 14% 71 –6% 67,414 Kilograms $1
7102100 Frozen peas, uncooked or cooked by steaming or boiling in water 8 18 124% 112 535% 64,041 Kilograms $2
7102200 Frozen beans, uncooked or cooked by steaming or boiling in water 24 19 –20% 20 6% 10,920 Kilograms $2
7102900 Frozen leguminous vegetables, uncooked or cooked by steaming or
boiling in water 17 1 –92% –100% Kilograms
7103000 Frozen spinach, New Zealand spinach and orache spinach (garden spinach),
uncooked or cooked by steaming or boiling in water 4 1 120 Kilograms $4
7104000 Frozen sweet corn, uncooked or cooked by steaming or boiling in water 28 4 –85% 56 1196% 29,433 Kilograms $2
7108000 Frozen vegetables, uncooked or cooked by steaming or boiling in water 53 11 –80% 9 –18% 2,188 Kilograms $4
7109000 Frozen mixed vegetables, uncooked or cooked by steaming or
boiling in water 19 174 816% 135 –22% 116,670 Kilograms $1
7112000 Olives, provisionally preserved, but unsuitable in that state for
immediate consumption 3 250 Kilograms $13
7113000 Capers, provisionally preserved, but unsuitable in that state for
immediate consumption 1 –100% Kilograms
7114000 Cucumbers and gherkins, provisionally preserved, unsuitable in that state
for immediate consumption 1 1 90 Kilograms $6
7119010 Asparagus, provisionally preserved, but unsuitable in that state for
immediate consumption 5 –100% Kilograms
7119020 Beans, provisionally preserved, but unsuitable in that state for
immediate consumption 1 –100% Kilograms
7119040 Sweet corn, provisionally preserved, but unsuitable in that state for
immediate consumption 1 –100% Kilograms
7119090 Vegetables nes, and mixtures thereof, provisionally preserved, but
unsuitable in that state for immediate consumption 3 34 946% –100% Kilograms
7122000 Dried onions 3 1 –66% –100% Kilograms
7129000 Dried vegetables and mixtures thereof 5 5 –12% 24 435% 26,440 Kilograms $1
7131021 Dried, shelled peas, not split, not for cultivation 7 568 1,282 Tonnes $443
7131025 Dried, shelled peas, split, not for cultivation 142 156 10% 342,500 Kilograms $0
7132020 Dried, shelled chickpeas (garbanzos), not for cultivation 66 33 –49% 1 –96% 125 Kilograms $11
7133120 Dried, shelled beans of the species Vigna mungo
(L.) Hepper or Vigna radiata (L.) Wilczek, not for cultivation 221 56 –74% 70 25% 87,500 Kilograms $1
7133320 Dried, shelled kidney beans, not for cultivation 3 –100% Kilograms
7133920 Dried, shelled beans nes, not for cultivation 102 –100% Kilograms
7135010 Dried, shelled broad beans and horse beans, for cultivation 33 9 –72% 22,000 Kilograms $0
7135020 Dried, shelled broad beans and horse beans, not for cultivation 209 1,425 581% 4,230 197% 8,528,750 Kilograms $0
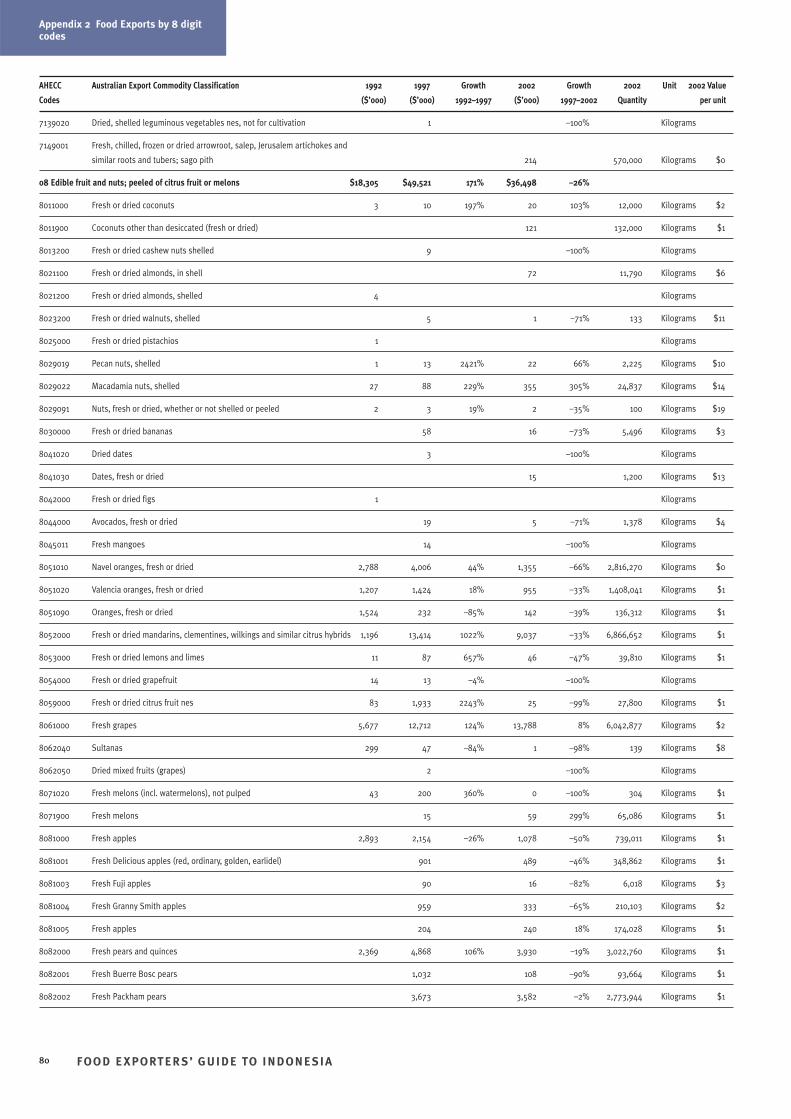
Appendix 2 Food Exports by 8 digitcodes
FOO D E XPORTER S’ GUIDE TO INDONESIA80
AHECC Australian Export Commodity Classification 1992 1997 Growth 2002 Growth 2002 Unit 2002 Value
Codes ($’000) ($’000) 1992–1997 ($’000) 1997–2002 Quantity per unit
7139020 Dried, shelled leguminous vegetables nes, not for cultivation 1 –100% Kilograms
7149001 Fresh, chilled, frozen or dried arrowroot, salep, Jerusalem artichokes and
similar roots and tubers; sago pith 214 570,000 Kilograms $0
08 Edible fruit and nuts; peeled of citrus fruit or melons $18,305 $49,521 171% $36,498 –26%
8011000 Fresh or dried coconuts 3 10 197% 20 103% 12,000 Kilograms $2
8011900 Coconuts other than desiccated (fresh or dried) 121 132,000 Kilograms $1
8013200 Fresh or dried cashew nuts shelled 9 –100% Kilograms
8021100 Fresh or dried almonds, in shell 72 11,790 Kilograms $6
8021200 Fresh or dried almonds, shelled 4 Kilograms
8023200 Fresh or dried walnuts, shelled 5 1 –71% 133 Kilograms $11
8025000 Fresh or dried pistachios 1 Kilograms
8029019 Pecan nuts, shelled 1 13 2421% 22 66% 2,225 Kilograms $10
8029022 Macadamia nuts, shelled 27 88 229% 355 305% 24,837 Kilograms $14
8029091 Nuts, fresh or dried, whether or not shelled or peeled 2 3 19% 2 –35% 100 Kilograms $19
8030000 Fresh or dried bananas 58 16 –73% 5,496 Kilograms $3
8041020 Dried dates 3 –100% Kilograms
8041030 Dates, fresh or dried 15 1,200 Kilograms $13
8042000 Fresh or dried figs 1 Kilograms
8044000 Avocados, fresh or dried 19 5 –71% 1,378 Kilograms $4
8045011 Fresh mangoes 14 –100% Kilograms
8051010 Navel oranges, fresh or dried 2,788 4,006 44% 1,355 –66% 2,816,270 Kilograms $0
8051020 Valencia oranges, fresh or dried 1,207 1,424 18% 955 –33% 1,408,041 Kilograms $1
8051090 Oranges, fresh or dried 1,524 232 –85% 142 –39% 136,312 Kilograms $1
8052000 Fresh or dried mandarins, clementines, wilkings and similar citrus hybrids 1,196 13,414 1022% 9,037 –33% 6,866,652 Kilograms $1
8053000 Fresh or dried lemons and limes 11 87 657% 46 –47% 39,810 Kilograms $1
8054000 Fresh or dried grapefruit 14 13 –4% –100% Kilograms
8059000 Fresh or dried citrus fruit nes 83 1,933 2243% 25 –99% 27,800 Kilograms $1
8061000 Fresh grapes 5,677 12,712 124% 13,788 8% 6,042,877 Kilograms $2
8062040 Sultanas 299 47 –84% 1 –98% 139 Kilograms $8
8062050 Dried mixed fruits (grapes) 2 –100% Kilograms
8071020 Fresh melons (incl. watermelons), not pulped 43 200 360% 0 –100% 304 Kilograms $1
8071900 Fresh melons 15 59 299% 65,086 Kilograms $1
8081000 Fresh apples 2,893 2,154 –26% 1,078 –50% 739,011 Kilograms $1
8081001 Fresh Delicious apples (red, ordinary, golden, earlidel) 901 489 –46% 348,862 Kilograms $1
8081003 Fresh Fuji apples 90 16 –82% 6,018 Kilograms $3
8081004 Fresh Granny Smith apples 959 333 –65% 210,103 Kilograms $2
8081005 Fresh apples 204 240 18% 174,028 Kilograms $1
8082000 Fresh pears and quinces 2,369 4,868 106% 3,930 –19% 3,022,760 Kilograms $1
8082001 Fresh Buerre Bosc pears 1,032 108 –90% 93,664 Kilograms $1
8082002 Fresh Packham pears 3,673 3,582 –2% 2,773,944 Kilograms $1
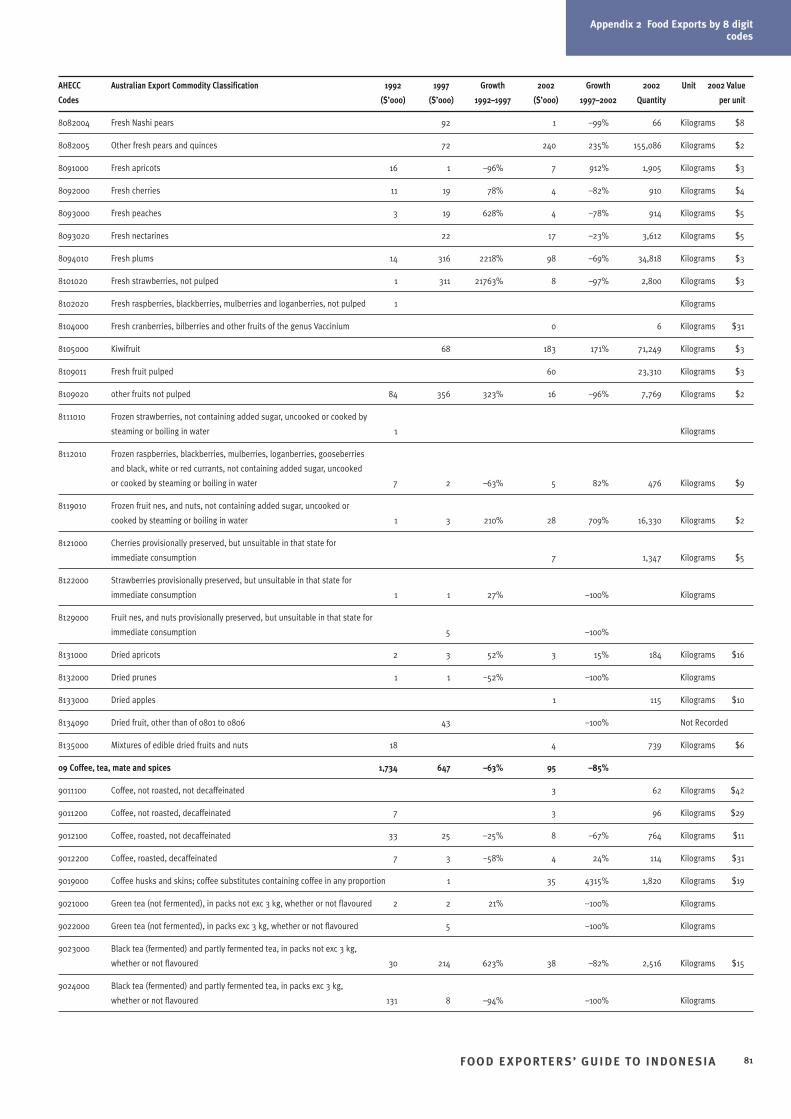
Appendix 2 Food Exports by 8 digitcodes
FOO D E XPORTER S’ GUIDE TO INDONESIA 81
AHECC Australian Export Commodity Classification 1992 1997 Growth 2002 Growth 2002 Unit 2002 Value
Codes ($’000) ($’000) 1992–1997 ($’000) 1997–2002 Quantity per unit
8082004 Fresh Nashi pears 92 1 –99% 66 Kilograms $8
8082005 Other fresh pears and quinces 72 240 235% 155,086 Kilograms $2
8091000 Fresh apricots 16 1 –96% 7 912% 1,905 Kilograms $3
8092000 Fresh cherries 11 19 78% 4 –82% 910 Kilograms $4
8093000 Fresh peaches 3 19 628% 4 –78% 914 Kilograms $5
8093020 Fresh nectarines 22 17 –23% 3,612 Kilograms $5
8094010 Fresh plums 14 316 2218% 98 –69% 34,818 Kilograms $3
8101020 Fresh strawberries, not pulped 1 311 21763% 8 –97% 2,800 Kilograms $3
8102020 Fresh raspberries, blackberries, mulberries and loganberries, not pulped 1 Kilograms
8104000 Fresh cranberries, bilberries and other fruits of the genus Vaccinium 0 6 Kilograms $31
8105000 Kiwifruit 68 183 171% 71,249 Kilograms $3
8109011 Fresh fruit pulped 60 23,310 Kilograms $3
8109020 other fruits not pulped 84 356 323% 16 –96% 7,769 Kilograms $2
8111010 Frozen strawberries, not containing added sugar, uncooked or cooked by
steaming or boiling in water 1 Kilograms
8112010 Frozen raspberries, blackberries, mulberries, loganberries, gooseberries
and black, white or red currants, not containing added sugar, uncooked
or cooked by steaming or boiling in water 7 2 –63% 5 82% 476 Kilograms $9
8119010 Frozen fruit nes, and nuts, not containing added sugar, uncooked or
cooked by steaming or boiling in water 1 3 210% 28 709% 16,330 Kilograms $2
8121000 Cherries provisionally preserved, but unsuitable in that state for
immediate consumption 7 1,347 Kilograms $5
8122000 Strawberries provisionally preserved, but unsuitable in that state for
immediate consumption 1 1 27% –100% Kilograms
8129000 Fruit nes, and nuts provisionally preserved, but unsuitable in that state for
immediate consumption 5 –100%
8131000 Dried apricots 2 3 52% 3 15% 184 Kilograms $16
8132000 Dried prunes 1 1 –52% –100% Kilograms
8133000 Dried apples 1 115 Kilograms $10
8134090 Dried fruit, other than of 0801 to 0806 43 –100% Not Recorded
8135000 Mixtures of edible dried fruits and nuts 18 4 739 Kilograms $6
09 Coffee, tea, mate and spices 1,734 647 –63% 95 –85%
9011100 Coffee, not roasted, not decaffeinated 3 62 Kilograms $42
9011200 Coffee, not roasted, decaffeinated 7 3 96 Kilograms $29
9012100 Coffee, roasted, not decaffeinated 33 25 –25% 8 –67% 764 Kilograms $11
9012200 Coffee, roasted, decaffeinated 7 3 –58% 4 24% 114 Kilograms $31
9019000 Coffee husks and skins; coffee substitutes containing coffee in any proportion 1 35 4315% 1,820 Kilograms $19
9021000 Green tea (not fermented), in packs not exc 3 kg, whether or not flavoured 2 2 21% –100% Kilograms
9022000 Green tea (not fermented), in packs exc 3 kg, whether or not flavoured 5 –100% Kilograms
9023000 Black tea (fermented) and partly fermented tea, in packs not exc 3 kg,
whether or not flavoured 30 214 623% 38 –82% 2,516 Kilograms $15
9024000 Black tea (fermented) and partly fermented tea, in packs exc 3 kg,
whether or not flavoured 131 8 –94% –100% Kilograms
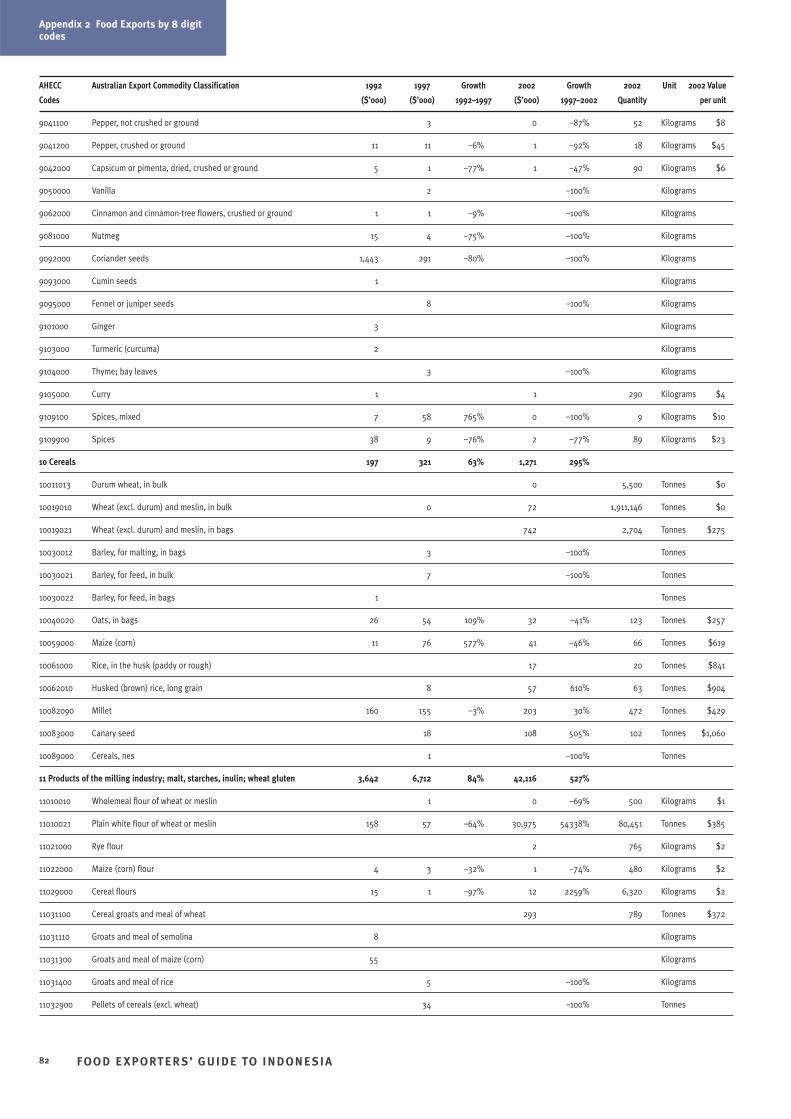
Appendix 2 Food Exports by 8 digitcodes
FOO D E XPORTER S’ GUIDE TO INDONESIA82
AHECC Australian Export Commodity Classification 1992 1997 Growth 2002 Growth 2002 Unit 2002 Value
Codes ($’000) ($’000) 1992–1997 ($’000) 1997–2002 Quantity per unit
9041100 Pepper, not crushed or ground 3 0 –87% 52 Kilograms $8
9041200 Pepper, crushed or ground 11 11 –6% 1 –92% 18 Kilograms $45
9042000 Capsicum or pimenta, dried, crushed or ground 5 1 –77% 1 –47% 90 Kilograms $6
9050000 Vanilla 2 –100% Kilograms
9062000 Cinnamon and cinnamon-tree flowers, crushed or ground 1 1 –9% –100% Kilograms
9081000 Nutmeg 15 4 –75% –100% Kilograms
9092000 Coriander seeds 1,443 291 –80% –100% Kilograms
9093000 Cumin seeds 1 Kilograms
9095000 Fennel or juniper seeds 8 –100% Kilograms
9101000 Ginger 3 Kilograms
9103000 Turmeric (curcuma) 2 Kilograms
9104000 Thyme; bay leaves 3 –100% Kilograms
9105000 Curry 1 1 290 Kilograms $4
9109100 Spices, mixed 7 58 765% 0 –100% 9 Kilograms $10
9109900 Spices 38 9 –76% 2 –77% 89 Kilograms $23
10 Cereals 197 321 63% 1,271 295%
10011013 Durum wheat, in bulk 0 5,500 Tonnes $0
10019010 Wheat (excl. durum) and meslin, in bulk 0 72 1,911,146 Tonnes $0
10019021 Wheat (excl. durum) and meslin, in bags 742 2,704 Tonnes $275
10030012 Barley, for malting, in bags 3 –100% Tonnes
10030021 Barley, for feed, in bulk 7 –100% Tonnes
10030022 Barley, for feed, in bags 1 Tonnes
10040020 Oats, in bags 26 54 109% 32 –41% 123 Tonnes $257
10059000 Maize (corn) 11 76 577% 41 –46% 66 Tonnes $619
10061000 Rice, in the husk (paddy or rough) 17 20 Tonnes $841
10062010 Husked (brown) rice, long grain 8 57 610% 63 Tonnes $904
10082090 Millet 160 155 –3% 203 30% 472 Tonnes $429
10083000 Canary seed 18 108 505% 102 Tonnes $1,060
10089000 Cereals, nes 1 –100% Tonnes
11 Products of the milling industry; malt, starches, inulin; wheat gluten 3,642 6,712 84% 42,116 527%
11010010 Wholemeal flour of wheat or meslin 1 0 –69% 500 Kilograms $1
11010021 Plain white flour of wheat or meslin 158 57 –64% 30,975 54338% 80,451 Tonnes $385
11021000 Rye flour 2 765 Kilograms $2
11022000 Maize (corn) flour 4 3 –32% 1 –74% 480 Kilograms $2
11029000 Cereal flours 15 1 –97% 12 2259% 6,320 Kilograms $2
11031100 Cereal groats and meal of wheat 293 789 Tonnes $372
11031110 Groats and meal of semolina 8 Kilograms
11031300 Groats and meal of maize (corn) 55 Kilograms
11031400 Groats and meal of rice 5 –100% Kilograms
11032900 Pellets of cereals (excl. wheat) 34 –100% Tonnes
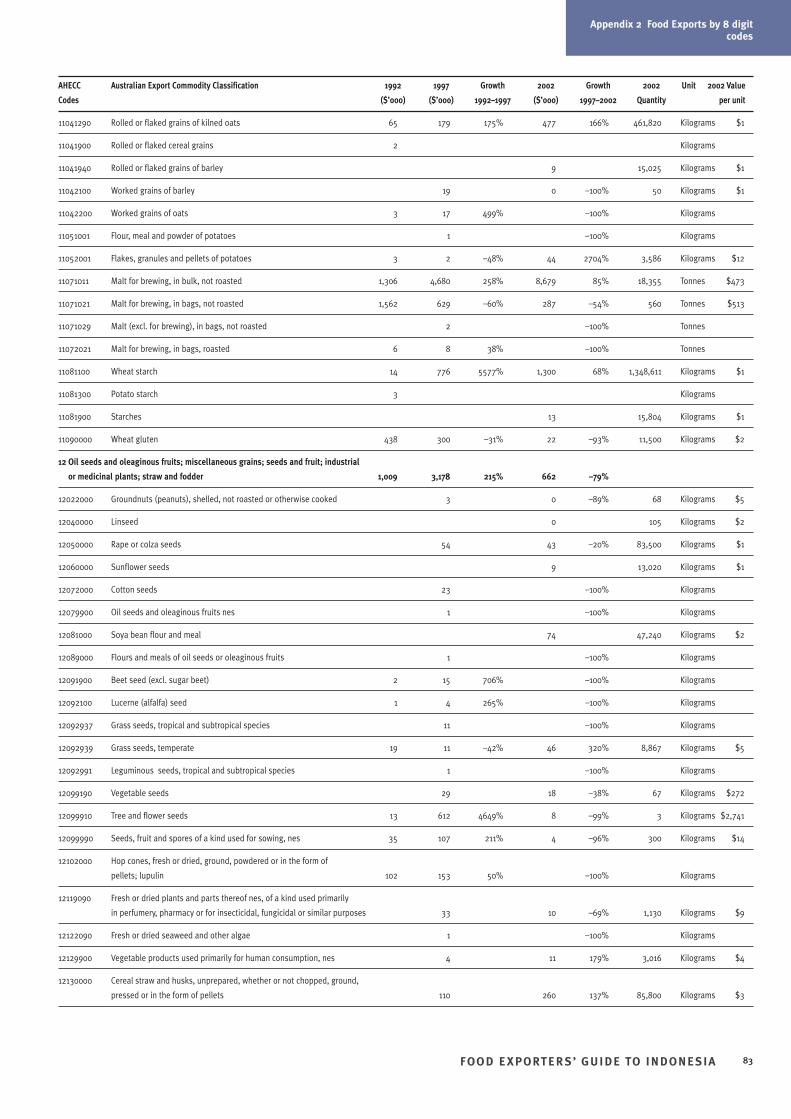
Appendix 2 Food Exports by 8 digitcodes
FOO D E XPORTER S’ GUIDE TO INDONESIA 83
AHECC Australian Export Commodity Classification 1992 1997 Growth 2002 Growth 2002 Unit 2002 Value
Codes ($’000) ($’000) 1992–1997 ($’000) 1997–2002 Quantity per unit
11041290 Rolled or flaked grains of kilned oats 65 179 175% 477 166% 461,820 Kilograms $1
11041900 Rolled or flaked cereal grains 2 Kilograms
11041940 Rolled or flaked grains of barley 9 15,025 Kilograms $1
11042100 Worked grains of barley 19 0 –100% 50 Kilograms $1
11042200 Worked grains of oats 3 17 499% –100% Kilograms
11051001 Flour, meal and powder of potatoes 1 –100% Kilograms
11052001 Flakes, granules and pellets of potatoes 3 2 –48% 44 2704% 3,586 Kilograms $12
11071011 Malt for brewing, in bulk, not roasted 1,306 4,680 258% 8,679 85% 18,355 Tonnes $473
11071021 Malt for brewing, in bags, not roasted 1,562 629 –60% 287 –54% 560 Tonnes $513
11071029 Malt (excl. for brewing), in bags, not roasted 2 –100% Tonnes
11072021 Malt for brewing, in bags, roasted 6 8 38% –100% Tonnes
11081100 Wheat starch 14 776 5577% 1,300 68% 1,348,611 Kilograms $1
11081300 Potato starch 3 Kilograms
11081900 Starches 13 15,804 Kilograms $1
11090000 Wheat gluten 438 300 –31% 22 –93% 11,500 Kilograms $2
12 Oil seeds and oleaginous fruits; miscellaneous grains; seeds and fruit; industrial
or medicinal plants; straw and fodder 1,009 3,178 215% 662 –79%
12022000 Groundnuts (peanuts), shelled, not roasted or otherwise cooked 3 0 –89% 68 Kilograms $5
12040000 Linseed 0 105 Kilograms $2
12050000 Rape or colza seeds 54 43 –20% 83,500 Kilograms $1
12060000 Sunflower seeds 9 13,020 Kilograms $1
12072000 Cotton seeds 23 –100% Kilograms
12079900 Oil seeds and oleaginous fruits nes 1 –100% Kilograms
12081000 Soya bean flour and meal 74 47,240 Kilograms $2
12089000 Flours and meals of oil seeds or oleaginous fruits 1 –100% Kilograms
12091900 Beet seed (excl. sugar beet) 2 15 706% –100% Kilograms
12092100 Lucerne (alfalfa) seed 1 4 265% –100% Kilograms
12092937 Grass seeds, tropical and subtropical species 11 –100% Kilograms
12092939 Grass seeds, temperate 19 11 –42% 46 320% 8,867 Kilograms $5
12092991 Leguminous seeds, tropical and subtropical species 1 –100% Kilograms
12099190 Vegetable seeds 29 18 –38% 67 Kilograms $272
12099910 Tree and flower seeds 13 612 4649% 8 –99% 3 Kilograms $2,741
12099990 Seeds, fruit and spores of a kind used for sowing, nes 35 107 211% 4 –96% 300 Kilograms $14
12102000 Hop cones, fresh or dried, ground, powdered or in the form of
pellets; lupulin 102 153 50% –100% Kilograms
12119090 Fresh or dried plants and parts thereof nes, of a kind used primarily
in perfumery, pharmacy or for insecticidal, fungicidal or similar purposes 33 10 –69% 1,130 Kilograms $9
12122090 Fresh or dried seaweed and other algae 1 –100% Kilograms
12129900 Vegetable products used primarily for human consumption, nes 4 11 179% 3,016 Kilograms $4
12130000 Cereal straw and husks, unprepared, whether or not chopped, ground,
pressed or in the form of pellets 110 260 137% 85,800 Kilograms $3
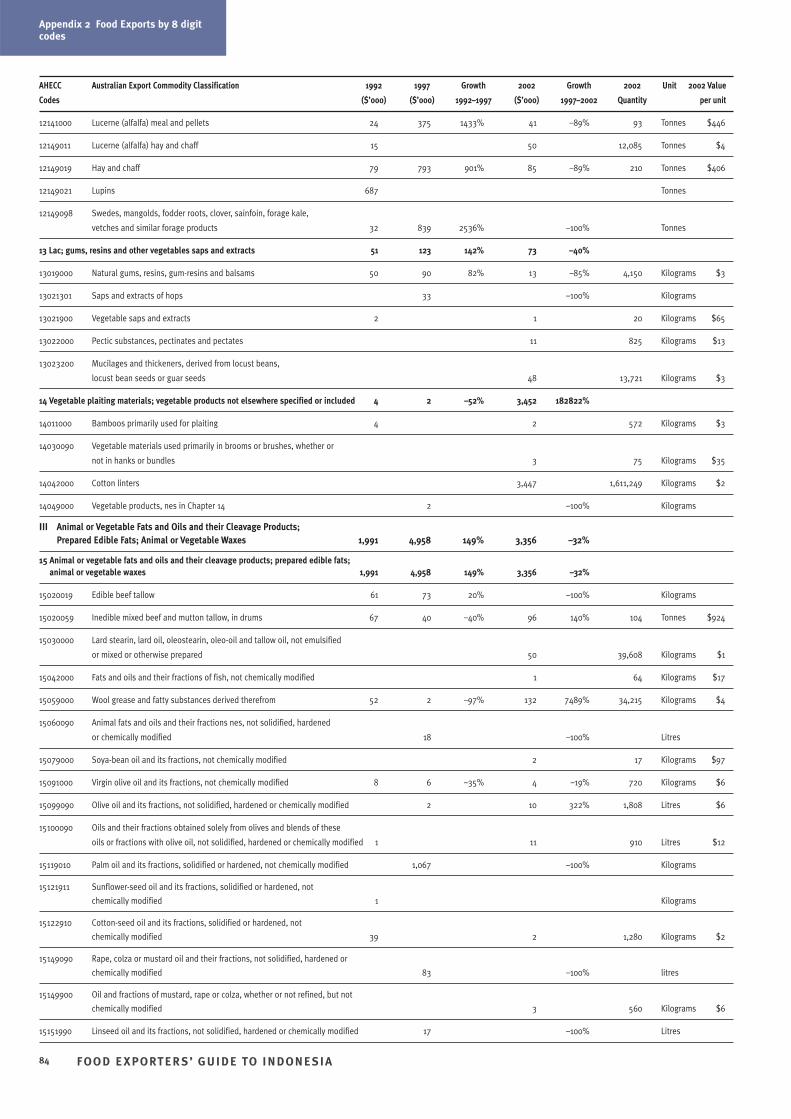
Appendix 2 Food Exports by 8 digitcodes
AHECC Australian Export Commodity Classification 1992 1997 Growth 2002 Growth 2002 Unit 2002 Value
Codes ($’000) ($’000) 1992–1997 ($’000) 1997–2002 Quantity per unit
12141000 Lucerne (alfalfa) meal and pellets 24 375 1433% 41 –89% 93 Tonnes $446
12149011 Lucerne (alfalfa) hay and chaff 15 50 12,085 Tonnes $4
12149019 Hay and chaff 79 793 901% 85 –89% 210 Tonnes $406
12149021 Lupins 687 Tonnes
12149098 Swedes, mangolds, fodder roots, clover, sainfoin, forage kale,
vetches and similar forage products 32 839 2536% –100% Tonnes
13 Lac; gums, resins and other vegetables saps and extracts 51 123 142% 73 –40%
13019000 Natural gums, resins, gum-resins and balsams 50 90 82% 13 –85% 4,150 Kilograms $3
13021301 Saps and extracts of hops 33 –100% Kilograms
13021900 Vegetable saps and extracts 2 1 20 Kilograms $65
13022000 Pectic substances, pectinates and pectates 11 825 Kilograms $13
13023200 Mucilages and thickeners, derived from locust beans,
locust bean seeds or guar seeds 48 13,721 Kilograms $3
14 Vegetable plaiting materials; vegetable products not elsewhere specified or included 4 2 –52% 3,452 182822%
14011000 Bamboos primarily used for plaiting 4 2 572 Kilograms $3
14030090 Vegetable materials used primarily in brooms or brushes, whether or
not in hanks or bundles 3 75 Kilograms $35
14042000 Cotton linters 3,447 1,611,249 Kilograms $2
14049000 Vegetable products, nes in Chapter 14 2 –100% Kilograms
III Animal or Vegetable Fats and Oils and their Cleavage Products; Prepared Edible Fats; Animal or Vegetable Waxes 1,991 4,958 149% 3,356 –32%
15 Animal or vegetable fats and oils and their cleavage products; prepared edible fats; animal or vegetable waxes 1,991 4,958 149% 3,356 –32%
15020019 Edible beef tallow 61 73 20% –100% Kilograms
15020059 Inedible mixed beef and mutton tallow, in drums 67 40 –40% 96 140% 104 Tonnes $924
15030000 Lard stearin, lard oil, oleostearin, oleo-oil and tallow oil, not emulsified
or mixed or otherwise prepared 50 39,608 Kilograms $1
15042000 Fats and oils and their fractions of fish, not chemically modified 1 64 Kilograms $17
15059000 Wool grease and fatty substances derived therefrom 52 2 –97% 132 7489% 34,215 Kilograms $4
15060090 Animal fats and oils and their fractions nes, not solidified, hardened
or chemically modified 18 –100% Litres
15079000 Soya-bean oil and its fractions, not chemically modified 2 17 Kilograms $97
15091000 Virgin olive oil and its fractions, not chemically modified 8 6 –35% 4 –19% 720 Kilograms $6
15099090 Olive oil and its fractions, not solidified, hardened or chemically modified 2 10 322% 1,808 Litres $6
15100090 Oils and their fractions obtained solely from olives and blends of these
oils or fractions with olive oil, not solidified, hardened or chemically modified 1 11 910 Litres $12
15119010 Palm oil and its fractions, solidified or hardened, not chemically modified 1,067 –100% Kilograms
15121911 Sunflower-seed oil and its fractions, solidified or hardened, not
chemically modified 1 Kilograms
15122910 Cotton-seed oil and its fractions, solidified or hardened, not
chemically modified 39 2 1,280 Kilograms $2
15149090 Rape, colza or mustard oil and their fractions, not solidified, hardened or
chemically modified 83 –100% litres
15149900 Oil and fractions of mustard, rape or colza, whether or not refined, but not
chemically modified 3 560 Kilograms $6
15151990 Linseed oil and its fractions, not solidified, hardened or chemically modified 17 –100% Litres
FOO D E XPORTER S’ GUIDE TO INDONESIA84
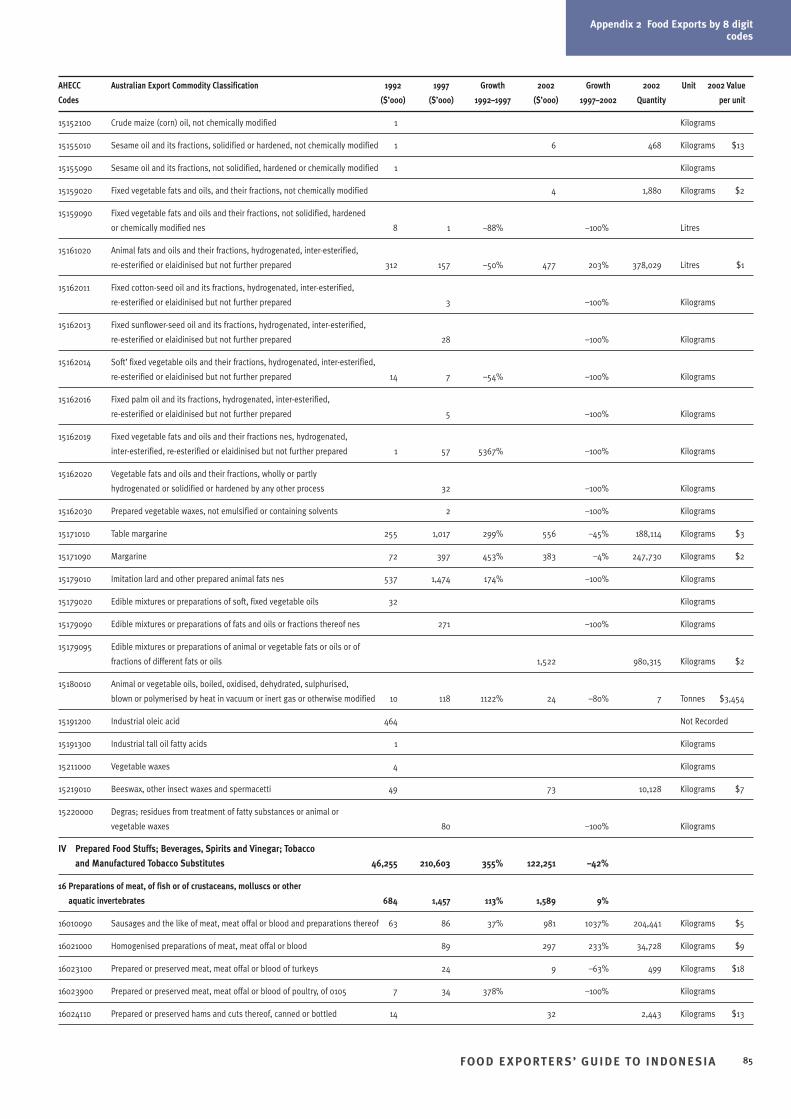
Appendix 2 Food Exports by 8 digitcodes
FOO D E XPORTER S’ GUIDE TO INDONESIA 85
AHECC Australian Export Commodity Classification 1992 1997 Growth 2002 Growth 2002 Unit 2002 Value
Codes ($’000) ($’000) 1992–1997 ($’000) 1997–2002 Quantity per unit
15152100 Crude maize (corn) oil, not chemically modified 1 Kilograms
15155010 Sesame oil and its fractions, solidified or hardened, not chemically modified 1 6 468 Kilograms $13
15155090 Sesame oil and its fractions, not solidified, hardened or chemically modified 1 Kilograms
15159020 Fixed vegetable fats and oils, and their fractions, not chemically modified 4 1,880 Kilograms $2
15159090 Fixed vegetable fats and oils and their fractions, not solidified, hardened
or chemically modified nes 8 1 –88% –100% Litres
15161020 Animal fats and oils and their fractions, hydrogenated, inter-esterified,
re-esterified or elaidinised but not further prepared 312 157 –50% 477 203% 378,029 Litres $1
15162011 Fixed cotton-seed oil and its fractions, hydrogenated, inter-esterified,
re-esterified or elaidinised but not further prepared 3 –100% Kilograms
15162013 Fixed sunflower-seed oil and its fractions, hydrogenated, inter-esterified,
re-esterified or elaidinised but not further prepared 28 –100% Kilograms
15162014 Soft’ fixed vegetable oils and their fractions, hydrogenated, inter-esterified,
re-esterified or elaidinised but not further prepared 14 7 –54% –100% Kilograms
15162016 Fixed palm oil and its fractions, hydrogenated, inter-esterified,
re-esterified or elaidinised but not further prepared 5 –100% Kilograms
15162019 Fixed vegetable fats and oils and their fractions nes, hydrogenated,
inter-esterified, re-esterified or elaidinised but not further prepared 1 57 5367% –100% Kilograms
15162020 Vegetable fats and oils and their fractions, wholly or partly
hydrogenated or solidified or hardened by any other process 32 –100% Kilograms
15162030 Prepared vegetable waxes, not emulsified or containing solvents 2 –100% Kilograms
15171010 Table margarine 255 1,017 299% 556 –45% 188,114 Kilograms $3
15171090 Margarine 72 397 453% 383 –4% 247,730 Kilograms $2
15179010 Imitation lard and other prepared animal fats nes 537 1,474 174% –100% Kilograms
15179020 Edible mixtures or preparations of soft, fixed vegetable oils 32 Kilograms
15179090 Edible mixtures or preparations of fats and oils or fractions thereof nes 271 –100% Kilograms
15179095 Edible mixtures or preparations of animal or vegetable fats or oils or of
fractions of different fats or oils 1,522 980,315 Kilograms $2
15180010 Animal or vegetable oils, boiled, oxidised, dehydrated, sulphurised,
blown or polymerised by heat in vacuum or inert gas or otherwise modified 10 118 1122% 24 –80% 7 Tonnes $3,454
15191200 Industrial oleic acid 464 Not Recorded
15191300 Industrial tall oil fatty acids 1 Kilograms
15211000 Vegetable waxes 4 Kilograms
15219010 Beeswax, other insect waxes and spermacetti 49 73 10,128 Kilograms $7
15220000 Degras; residues from treatment of fatty substances or animal or
vegetable waxes 80 –100% Kilograms
IV Prepared Food Stuffs; Beverages, Spirits and Vinegar; Tobacco
and Manufactured Tobacco Substitutes 46,255 210,603 355% 122,251 –42%
16 Preparations of meat, of fish or of crustaceans, molluscs or other
aquatic invertebrates 684 1,457 113% 1,589 9%
16010090 Sausages and the like of meat, meat offal or blood and preparations thereof 63 86 37% 981 1037% 204,441 Kilograms $5
16021000 Homogenised preparations of meat, meat offal or blood 89 297 233% 34,728 Kilograms $9
16023100 Prepared or preserved meat, meat offal or blood of turkeys 24 9 –63% 499 Kilograms $18
16023900 Prepared or preserved meat, meat offal or blood of poultry, of 0105 7 34 378% –100% Kilograms
16024110 Prepared or preserved hams and cuts thereof, canned or bottled 14 32 2,443 Kilograms $13
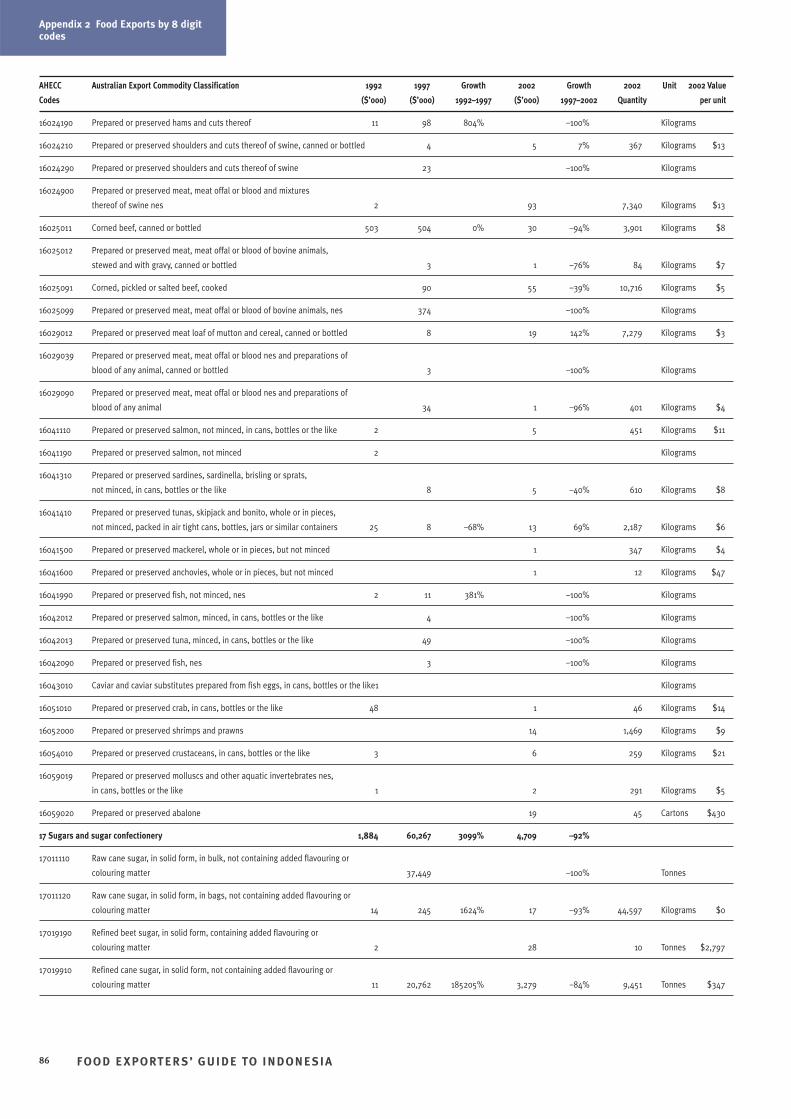
Appendix 2 Food Exports by 8 digitcodes
FOO D E XPORTER S’ GUIDE TO INDONESIA86
AHECC Australian Export Commodity Classification 1992 1997 Growth 2002 Growth 2002 Unit 2002 Value
Codes ($’000) ($’000) 1992–1997 ($’000) 1997–2002 Quantity per unit
16024190 Prepared or preserved hams and cuts thereof 11 98 804% –100% Kilograms
16024210 Prepared or preserved shoulders and cuts thereof of swine, canned or bottled 4 5 7% 367 Kilograms $13
16024290 Prepared or preserved shoulders and cuts thereof of swine 23 –100% Kilograms
16024900 Prepared or preserved meat, meat offal or blood and mixtures
thereof of swine nes 2 93 7,340 Kilograms $13
16025011 Corned beef, canned or bottled 503 504 0% 30 –94% 3,901 Kilograms $8
16025012 Prepared or preserved meat, meat offal or blood of bovine animals,
stewed and with gravy, canned or bottled 3 1 –76% 84 Kilograms $7
16025091 Corned, pickled or salted beef, cooked 90 55 –39% 10,716 Kilograms $5
16025099 Prepared or preserved meat, meat offal or blood of bovine animals, nes 374 –100% Kilograms
16029012 Prepared or preserved meat loaf of mutton and cereal, canned or bottled 8 19 142% 7,279 Kilograms $3
16029039 Prepared or preserved meat, meat offal or blood nes and preparations of
blood of any animal, canned or bottled 3 –100% Kilograms
16029090 Prepared or preserved meat, meat offal or blood nes and preparations of
blood of any animal 34 1 –96% 401 Kilograms $4
16041110 Prepared or preserved salmon, not minced, in cans, bottles or the like 2 5 451 Kilograms $11
16041190 Prepared or preserved salmon, not minced 2 Kilograms
16041310 Prepared or preserved sardines, sardinella, brisling or sprats,
not minced, in cans, bottles or the like 8 5 –40% 610 Kilograms $8
16041410 Prepared or preserved tunas, skipjack and bonito, whole or in pieces,
not minced, packed in air tight cans, bottles, jars or similar containers 25 8 –68% 13 69% 2,187 Kilograms $6
16041500 Prepared or preserved mackerel, whole or in pieces, but not minced 1 347 Kilograms $4
16041600 Prepared or preserved anchovies, whole or in pieces, but not minced 1 12 Kilograms $47
16041990 Prepared or preserved fish, not minced, nes 2 11 381% –100% Kilograms
16042012 Prepared or preserved salmon, minced, in cans, bottles or the like 4 –100% Kilograms
16042013 Prepared or preserved tuna, minced, in cans, bottles or the like 49 –100% Kilograms
16042090 Prepared or preserved fish, nes 3 –100% Kilograms
16043010 Caviar and caviar substitutes prepared from fish eggs, in cans, bottles or the like1 Kilograms
16051010 Prepared or preserved crab, in cans, bottles or the like 48 1 46 Kilograms $14
16052000 Prepared or preserved shrimps and prawns 14 1,469 Kilograms $9
16054010 Prepared or preserved crustaceans, in cans, bottles or the like 3 6 259 Kilograms $21
16059019 Prepared or preserved molluscs and other aquatic invertebrates nes,
in cans, bottles or the like 1 2 291 Kilograms $5
16059020 Prepared or preserved abalone 19 45 Cartons $430
17 Sugars and sugar confectionery 1,884 60,267 3099% 4,709 –92%
17011110 Raw cane sugar, in solid form, in bulk, not containing added flavouring or
colouring matter 37,449 –100% Tonnes
17011120 Raw cane sugar, in solid form, in bags, not containing added flavouring or
colouring matter 14 245 1624% 17 –93% 44,597 Kilograms $0
17019190 Refined beet sugar, in solid form, containing added flavouring or
colouring matter 2 28 10 Tonnes $2,797
17019910 Refined cane sugar, in solid form, not containing added flavouring or
colouring matter 11 20,762 185205% 3,279 –84% 9,451 Tonnes $347
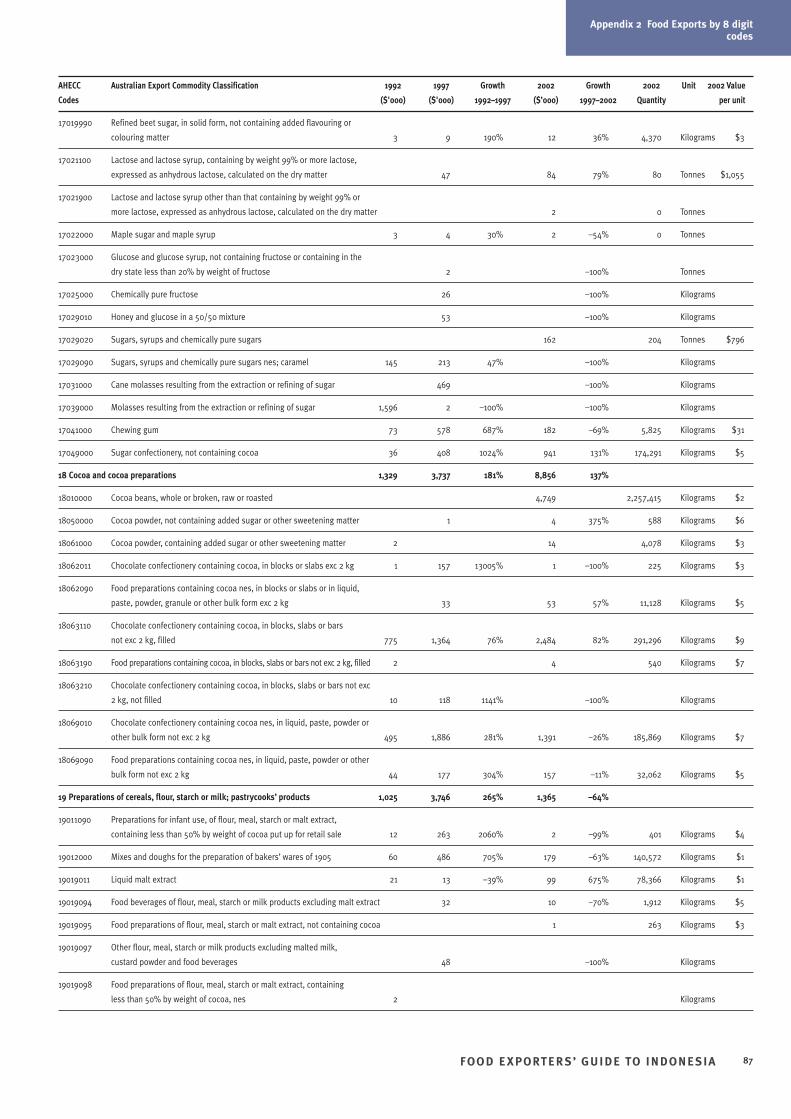
Appendix 2 Food Exports by 8 digitcodes
FOO D E XPORTER S’ GUIDE TO INDONESIA 87
AHECC Australian Export Commodity Classification 1992 1997 Growth 2002 Growth 2002 Unit 2002 Value
Codes ($'000) ($'000) 1992–1997 ($’000) 1997–2002 Quantity per unit
17019990 Refined beet sugar, in solid form, not containing added flavouring or
colouring matter 3 9 190% 12 36% 4,370 Kilograms $3
17021100 Lactose and lactose syrup, containing by weight 99% or more lactose,
expressed as anhydrous lactose, calculated on the dry matter 47 84 79% 80 Tonnes $1,055
17021900 Lactose and lactose syrup other than that containing by weight 99% or
more lactose, expressed as anhydrous lactose, calculated on the dry matter 2 0 Tonnes
17022000 Maple sugar and maple syrup 3 4 30% 2 –54% 0 Tonnes
17023000 Glucose and glucose syrup, not containing fructose or containing in the
dry state less than 20% by weight of fructose 2 –100% Tonnes
17025000 Chemically pure fructose 26 –100% Kilograms
17029010 Honey and glucose in a 50/50 mixture 53 –100% Kilograms
17029020 Sugars, syrups and chemically pure sugars 162 204 Tonnes $796
17029090 Sugars, syrups and chemically pure sugars nes; caramel 145 213 47% –100% Kilograms
17031000 Cane molasses resulting from the extraction or refining of sugar 469 –100% Kilograms
17039000 Molasses resulting from the extraction or refining of sugar 1,596 2 –100% –100% Kilograms
17041000 Chewing gum 73 578 687% 182 –69% 5,825 Kilograms $31
17049000 Sugar confectionery, not containing cocoa 36 408 1024% 941 131% 174,291 Kilograms $5
18 Cocoa and cocoa preparations 1,329 3,737 181% 8,856 137%
18010000 Cocoa beans, whole or broken, raw or roasted 4,749 2,257,415 Kilograms $2
18050000 Cocoa powder, not containing added sugar or other sweetening matter 1 4 375% 588 Kilograms $6
18061000 Cocoa powder, containing added sugar or other sweetening matter 2 14 4,078 Kilograms $3
18062011 Chocolate confectionery containing cocoa, in blocks or slabs exc 2 kg 1 157 13005% 1 –100% 225 Kilograms $3
18062090 Food preparations containing cocoa nes, in blocks or slabs or in liquid,
paste, powder, granule or other bulk form exc 2 kg 33 53 57% 11,128 Kilograms $5
18063110 Chocolate confectionery containing cocoa, in blocks, slabs or bars
not exc 2 kg, filled 775 1,364 76% 2,484 82% 291,296 Kilograms $9
18063190 Food preparations containing cocoa, in blocks, slabs or bars not exc 2 kg, filled 2 4 540 Kilograms $7
18063210 Chocolate confectionery containing cocoa, in blocks, slabs or bars not exc
2 kg, not filled 10 118 1141% –100% Kilograms
18069010 Chocolate confectionery containing cocoa nes, in liquid, paste, powder or
other bulk form not exc 2 kg 495 1,886 281% 1,391 –26% 185,869 Kilograms $7
18069090 Food preparations containing cocoa nes, in liquid, paste, powder or other
bulk form not exc 2 kg 44 177 304% 157 –11% 32,062 Kilograms $5
19 Preparations of cereals, flour, starch or milk; pastrycooks’ products 1,025 3,746 265% 1,365 –64%
19011090 Preparations for infant use, of flour, meal, starch or malt extract,
containing less than 50% by weight of cocoa put up for retail sale 12 263 2060% 2 –99% 401 Kilograms $4
19012000 Mixes and doughs for the preparation of bakers’ wares of 1905 60 486 705% 179 –63% 140,572 Kilograms $1
19019011 Liquid malt extract 21 13 –39% 99 675% 78,366 Kilograms $1
19019094 Food beverages of flour, meal, starch or milk products excluding malt extract 32 10 –70% 1,912 Kilograms $5
19019095 Food preparations of flour, meal, starch or malt extract, not containing cocoa 1 263 Kilograms $3
19019097 Other flour, meal, starch or milk products excluding malted milk,
custard powder and food beverages 48 –100% Kilograms
19019098 Food preparations of flour, meal, starch or malt extract, containing
less than 50% by weight of cocoa, nes 2 Kilograms
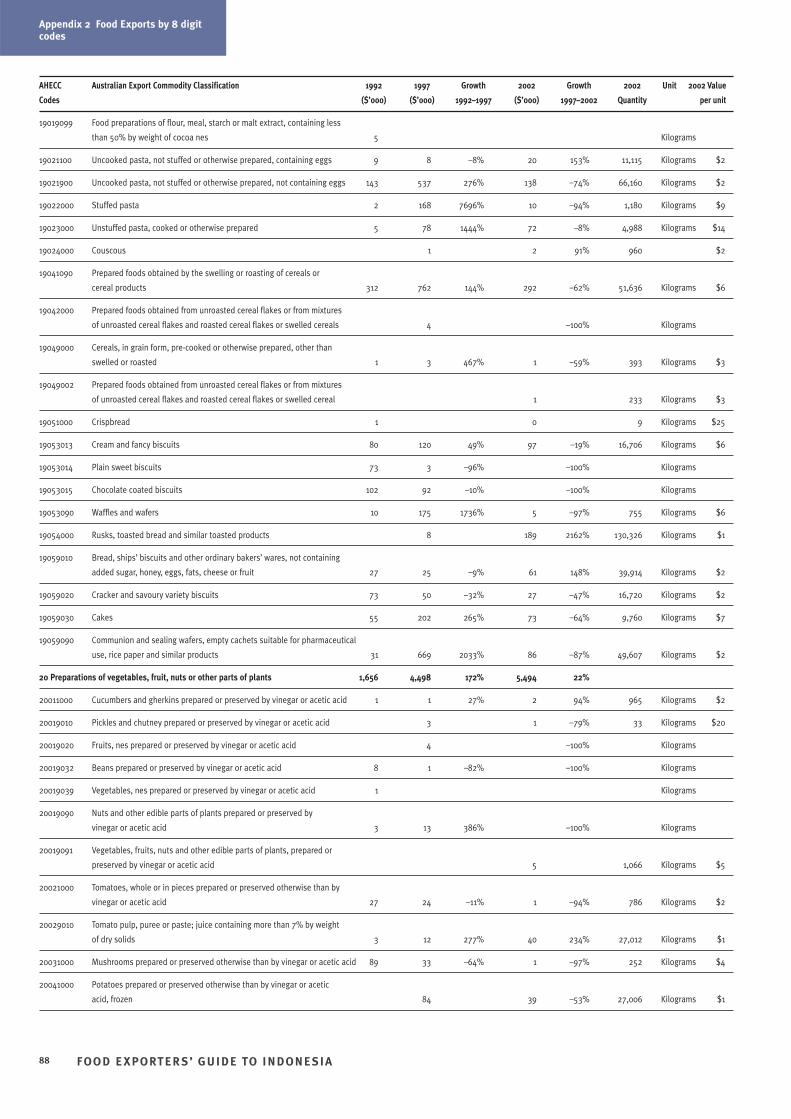
Appendix 2 Food Exports by 8 digitcodes
FOO D E XPORTER S’ GUIDE TO INDONESIA88
AHECC Australian Export Commodity Classification 1992 1997 Growth 2002 Growth 2002 Unit 2002 Value
Codes ($’000) ($’000) 1992–1997 ($’000) 1997–2002 Quantity per unit
19019099 Food preparations of flour, meal, starch or malt extract, containing less
than 50% by weight of cocoa nes 5 Kilograms
19021100 Uncooked pasta, not stuffed or otherwise prepared, containing eggs 9 8 –8% 20 153% 11,115 Kilograms $2
19021900 Uncooked pasta, not stuffed or otherwise prepared, not containing eggs 143 537 276% 138 –74% 66,160 Kilograms $2
19022000 Stuffed pasta 2 168 7696% 10 –94% 1,180 Kilograms $9
19023000 Unstuffed pasta, cooked or otherwise prepared 5 78 1444% 72 –8% 4,988 Kilograms $14
19024000 Couscous 1 2 91% 960 $2
19041090 Prepared foods obtained by the swelling or roasting of cereals or
cereal products 312 762 144% 292 –62% 51,636 Kilograms $6
19042000 Prepared foods obtained from unroasted cereal flakes or from mixtures
of unroasted cereal flakes and roasted cereal flakes or swelled cereals 4 –100% Kilograms
19049000 Cereals, in grain form, pre-cooked or otherwise prepared, other than
swelled or roasted 1 3 467% 1 –59% 393 Kilograms $3
19049002 Prepared foods obtained from unroasted cereal flakes or from mixtures
of unroasted cereal flakes and roasted cereal flakes or swelled cereal 1 233 Kilograms $3
19051000 Crispbread 1 0 9 Kilograms $25
19053013 Cream and fancy biscuits 80 120 49% 97 –19% 16,706 Kilograms $6
19053014 Plain sweet biscuits 73 3 –96% –100% Kilograms
19053015 Chocolate coated biscuits 102 92 –10% –100% Kilograms
19053090 Waffles and wafers 10 175 1736% 5 –97% 755 Kilograms $6
19054000 Rusks, toasted bread and similar toasted products 8 189 2162% 130,326 Kilograms $1
19059010 Bread, ships’ biscuits and other ordinary bakers’ wares, not containing
added sugar, honey, eggs, fats, cheese or fruit 27 25 –9% 61 148% 39,914 Kilograms $2
19059020 Cracker and savoury variety biscuits 73 50 –32% 27 –47% 16,720 Kilograms $2
19059030 Cakes 55 202 265% 73 –64% 9,760 Kilograms $7
19059090 Communion and sealing wafers, empty cachets suitable for pharmaceutical
use, rice paper and similar products 31 669 2033% 86 –87% 49,607 Kilograms $2
20 Preparations of vegetables, fruit, nuts or other parts of plants 1,656 4,498 172% 5,494 22%
20011000 Cucumbers and gherkins prepared or preserved by vinegar or acetic acid 1 1 27% 2 94% 965 Kilograms $2
20019010 Pickles and chutney prepared or preserved by vinegar or acetic acid 3 1 –79% 33 Kilograms $20
20019020 Fruits, nes prepared or preserved by vinegar or acetic acid 4 –100% Kilograms
20019032 Beans prepared or preserved by vinegar or acetic acid 8 1 –82% –100% Kilograms
20019039 Vegetables, nes prepared or preserved by vinegar or acetic acid 1 Kilograms
20019090 Nuts and other edible parts of plants prepared or preserved by
vinegar or acetic acid 3 13 386% –100% Kilograms
20019091 Vegetables, fruits, nuts and other edible parts of plants, prepared or
preserved by vinegar or acetic acid 5 1,066 Kilograms $5
20021000 Tomatoes, whole or in pieces prepared or preserved otherwise than by
vinegar or acetic acid 27 24 –11% 1 –94% 786 Kilograms $2
20029010 Tomato pulp, puree or paste; juice containing more than 7% by weight
of dry solids 3 12 277% 40 234% 27,012 Kilograms $1
20031000 Mushrooms prepared or preserved otherwise than by vinegar or acetic acid 89 33 –64% 1 –97% 252 Kilograms $4
20041000 Potatoes prepared or preserved otherwise than by vinegar or acetic
acid, frozen 84 39 –53% 27,006 Kilograms $1
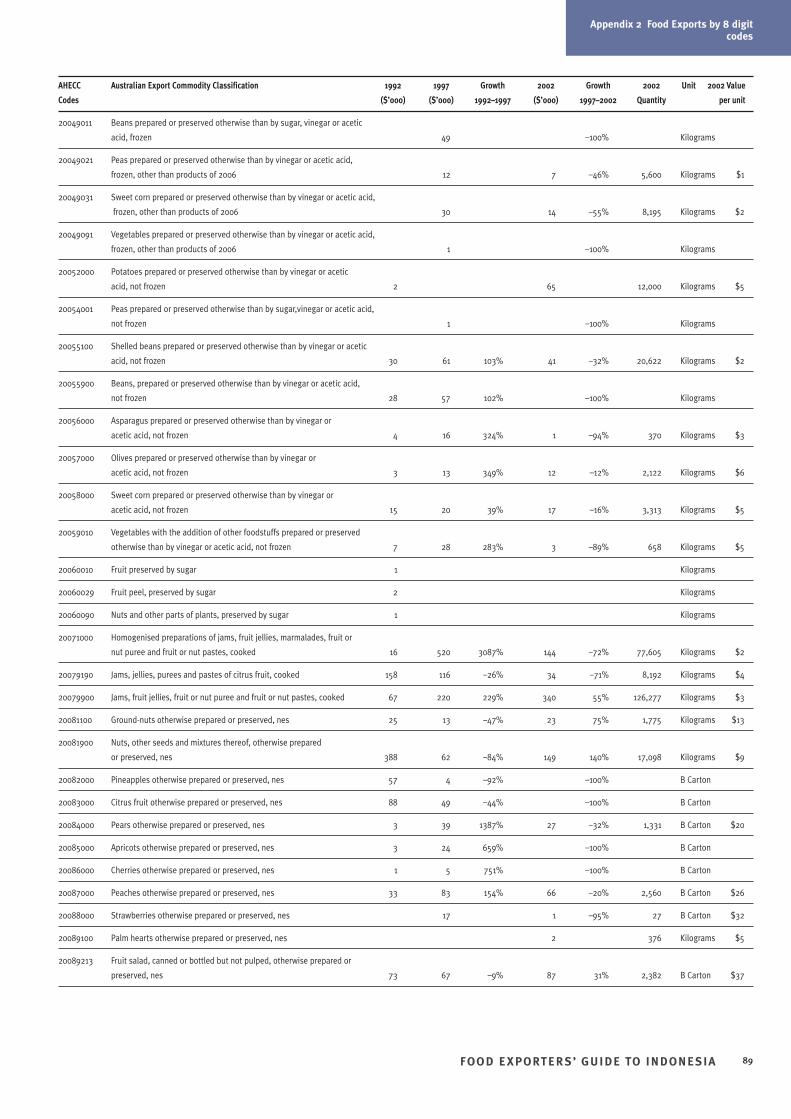
Appendix 2 Food Exports by 8 digitcodes
FOO D E XPORTER S’ GUIDE TO INDONESIA 89
AHECC Australian Export Commodity Classification 1992 1997 Growth 2002 Growth 2002 Unit 2002 Value
Codes ($’000) ($’000) 1992–1997 ($’000) 1997–2002 Quantity per unit
20049011 Beans prepared or preserved otherwise than by sugar, vinegar or acetic
acid, frozen 49 –100% Kilograms
20049021 Peas prepared or preserved otherwise than by vinegar or acetic acid,
frozen, other than products of 2006 12 7 –46% 5,600 Kilograms $1
20049031 Sweet corn prepared or preserved otherwise than by vinegar or acetic acid,
frozen, other than products of 2006 30 14 –55% 8,195 Kilograms $2
20049091 Vegetables prepared or preserved otherwise than by vinegar or acetic acid,
frozen, other than products of 2006 1 –100% Kilograms
20052000 Potatoes prepared or preserved otherwise than by vinegar or acetic
acid, not frozen 2 65 12,000 Kilograms $5
20054001 Peas prepared or preserved otherwise than by sugar,vinegar or acetic acid,
not frozen 1 –100% Kilograms
20055100 Shelled beans prepared or preserved otherwise than by vinegar or acetic
acid, not frozen 30 61 103% 41 –32% 20,622 Kilograms $2
20055900 Beans, prepared or preserved otherwise than by vinegar or acetic acid,
not frozen 28 57 102% –100% Kilograms
20056000 Asparagus prepared or preserved otherwise than by vinegar or
acetic acid, not frozen 4 16 324% 1 –94% 370 Kilograms $3
20057000 Olives prepared or preserved otherwise than by vinegar or
acetic acid, not frozen 3 13 349% 12 –12% 2,122 Kilograms $6
20058000 Sweet corn prepared or preserved otherwise than by vinegar or
acetic acid, not frozen 15 20 39% 17 –16% 3,313 Kilograms $5
20059010 Vegetables with the addition of other foodstuffs prepared or preserved
otherwise than by vinegar or acetic acid, not frozen 7 28 283% 3 –89% 658 Kilograms $5
20060010 Fruit preserved by sugar 1 Kilograms
20060029 Fruit peel, preserved by sugar 2 Kilograms
20060090 Nuts and other parts of plants, preserved by sugar 1 Kilograms
20071000 Homogenised preparations of jams, fruit jellies, marmalades, fruit or
nut puree and fruit or nut pastes, cooked 16 520 3087% 144 –72% 77,605 Kilograms $2
20079190 Jams, jellies, purees and pastes of citrus fruit, cooked 158 116 –26% 34 –71% 8,192 Kilograms $4
20079900 Jams, fruit jellies, fruit or nut puree and fruit or nut pastes, cooked 67 220 229% 340 55% 126,277 Kilograms $3
20081100 Ground-nuts otherwise prepared or preserved, nes 25 13 –47% 23 75% 1,775 Kilograms $13
20081900 Nuts, other seeds and mixtures thereof, otherwise prepared
or preserved, nes 388 62 –84% 149 140% 17,098 Kilograms $9
20082000 Pineapples otherwise prepared or preserved, nes 57 4 –92% –100% B Carton
20083000 Citrus fruit otherwise prepared or preserved, nes 88 49 –44% –100% B Carton
20084000 Pears otherwise prepared or preserved, nes 3 39 1387% 27 –32% 1,331 B Carton $20
20085000 Apricots otherwise prepared or preserved, nes 3 24 659% –100% B Carton
20086000 Cherries otherwise prepared or preserved, nes 1 5 751% –100% B Carton
20087000 Peaches otherwise prepared or preserved, nes 33 83 154% 66 –20% 2,560 B Carton $26
20088000 Strawberries otherwise prepared or preserved, nes 17 1 –95% 27 B Carton $32
20089100 Palm hearts otherwise prepared or preserved, nes 2 376 Kilograms $5
20089213 Fruit salad, canned or bottled but not pulped, otherwise prepared or
preserved, nes 73 67 –9% 87 31% 2,382 B Carton $37
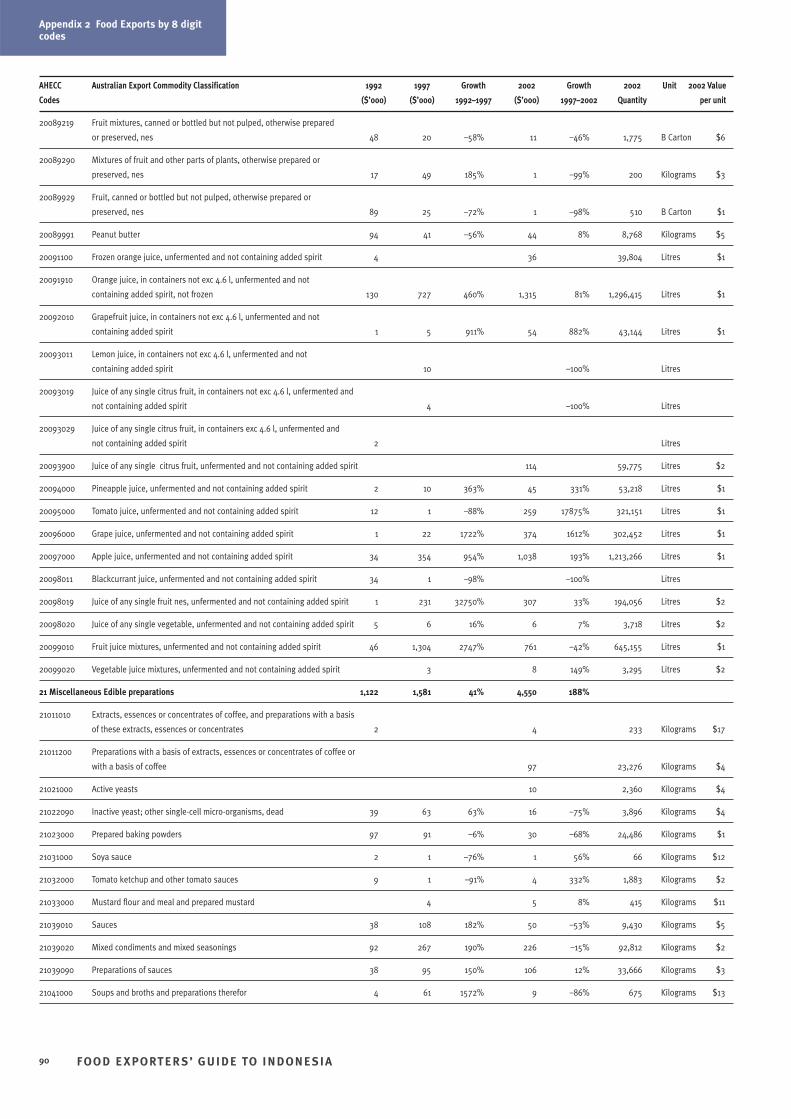
Appendix 2 Food Exports by 8 digitcodes
FOO D E XPORTER S’ GUIDE TO INDONESIA90
AHECC Australian Export Commodity Classification 1992 1997 Growth 2002 Growth 2002 Unit 2002 Value
Codes ($’000) ($’000) 1992–1997 ($’000) 1997–2002 Quantity per unit
20089219 Fruit mixtures, canned or bottled but not pulped, otherwise prepared
or preserved, nes 48 20 –58% 11 –46% 1,775 B Carton $6
20089290 Mixtures of fruit and other parts of plants, otherwise prepared or
preserved, nes 17 49 185% 1 –99% 200 Kilograms $3
20089929 Fruit, canned or bottled but not pulped, otherwise prepared or
preserved, nes 89 25 –72% 1 –98% 510 B Carton $1
20089991 Peanut butter 94 41 –56% 44 8% 8,768 Kilograms $5
20091100 Frozen orange juice, unfermented and not containing added spirit 4 36 39,804 Litres $1
20091910 Orange juice, in containers not exc 4.6 l, unfermented and not
containing added spirit, not frozen 130 727 460% 1,315 81% 1,296,415 Litres $1
20092010 Grapefruit juice, in containers not exc 4.6 l, unfermented and not
containing added spirit 1 5 911% 54 882% 43,144 Litres $1
20093011 Lemon juice, in containers not exc 4.6 l, unfermented and not
containing added spirit 10 –100% Litres
20093019 Juice of any single citrus fruit, in containers not exc 4.6 l, unfermented and
not containing added spirit 4 –100% Litres
20093029 Juice of any single citrus fruit, in containers exc 4.6 l, unfermented and
not containing added spirit 2 Litres
20093900 Juice of any single citrus fruit, unfermented and not containing added spirit 114 59,775 Litres $2
20094000 Pineapple juice, unfermented and not containing added spirit 2 10 363% 45 331% 53,218 Litres $1
20095000 Tomato juice, unfermented and not containing added spirit 12 1 –88% 259 17875% 321,151 Litres $1
20096000 Grape juice, unfermented and not containing added spirit 1 22 1722% 374 1612% 302,452 Litres $1
20097000 Apple juice, unfermented and not containing added spirit 34 354 954% 1,038 193% 1,213,266 Litres $1
20098011 Blackcurrant juice, unfermented and not containing added spirit 34 1 –98% –100% Litres
20098019 Juice of any single fruit nes, unfermented and not containing added spirit 1 231 32750% 307 33% 194,056 Litres $2
20098020 Juice of any single vegetable, unfermented and not containing added spirit 5 6 16% 6 7% 3,718 Litres $2
20099010 Fruit juice mixtures, unfermented and not containing added spirit 46 1,304 2747% 761 –42% 645,155 Litres $1
20099020 Vegetable juice mixtures, unfermented and not containing added spirit 3 8 149% 3,295 Litres $2
21 Miscellaneous Edible preparations 1,122 1,581 41% 4,550 188%
21011010 Extracts, essences or concentrates of coffee, and preparations with a basis
of these extracts, essences or concentrates 2 4 233 Kilograms $17
21011200 Preparations with a basis of extracts, essences or concentrates of coffee or
with a basis of coffee 97 23,276 Kilograms $4
21021000 Active yeasts 10 2,360 Kilograms $4
21022090 Inactive yeast; other single-cell micro-organisms, dead 39 63 63% 16 –75% 3,896 Kilograms $4
21023000 Prepared baking powders 97 91 –6% 30 –68% 24,486 Kilograms $1
21031000 Soya sauce 2 1 –76% 1 56% 66 Kilograms $12
21032000 Tomato ketchup and other tomato sauces 9 1 –91% 4 332% 1,883 Kilograms $2
21033000 Mustard flour and meal and prepared mustard 4 5 8% 415 Kilograms $11
21039010 Sauces 38 108 182% 50 –53% 9,430 Kilograms $5
21039020 Mixed condiments and mixed seasonings 92 267 190% 226 –15% 92,812 Kilograms $2
21039090 Preparations of sauces 38 95 150% 106 12% 33,666 Kilograms $3
21041000 Soups and broths and preparations therefor 4 61 1572% 9 –86% 675 Kilograms $13
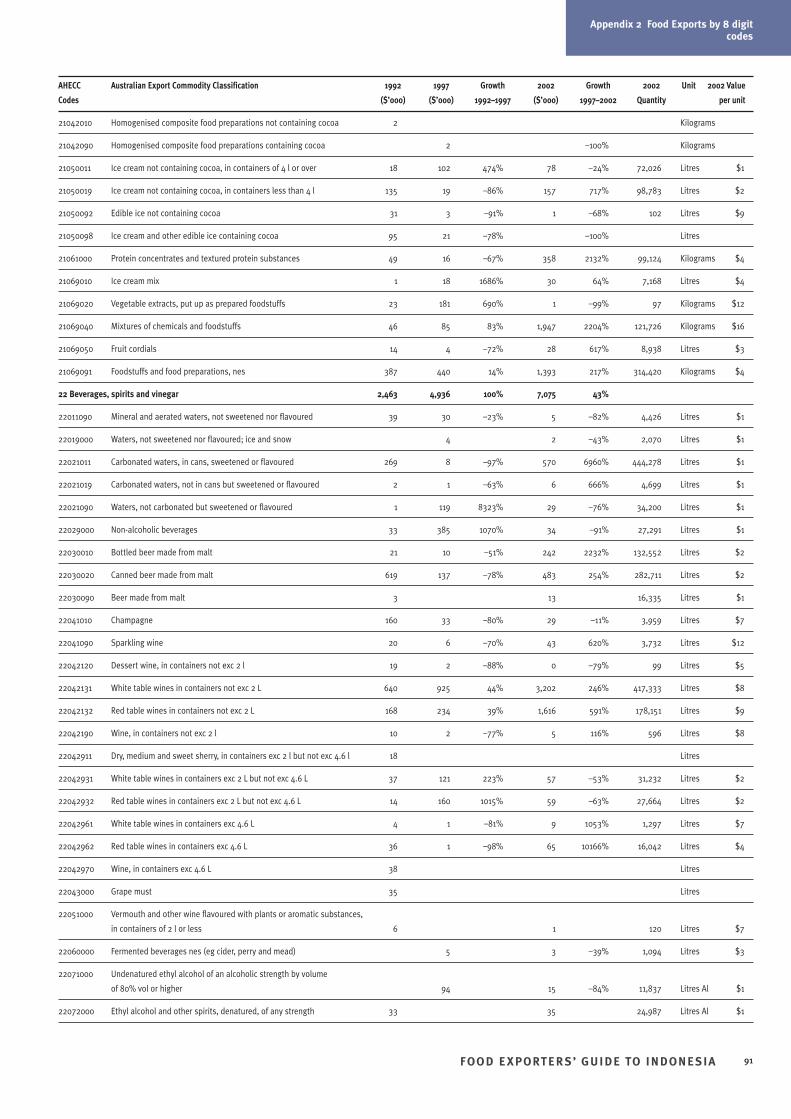
Appendix 2 Food Exports by 8 digitcodes
FOO D E XPORTER S’ GUIDE TO INDONESIA 91
AHECC Australian Export Commodity Classification 1992 1997 Growth 2002 Growth 2002 Unit 2002 Value
Codes ($’000) ($’000) 1992–1997 ($’000) 1997–2002 Quantity per unit
21042010 Homogenised composite food preparations not containing cocoa 2 Kilograms
21042090 Homogenised composite food preparations containing cocoa 2 –100% Kilograms
21050011 Ice cream not containing cocoa, in containers of 4 l or over 18 102 474% 78 –24% 72,026 Litres $1
21050019 Ice cream not containing cocoa, in containers less than 4 l 135 19 –86% 157 717% 98,783 Litres $2
21050092 Edible ice not containing cocoa 31 3 –91% 1 –68% 102 Litres $9
21050098 Ice cream and other edible ice containing cocoa 95 21 –78% –100% Litres
21061000 Protein concentrates and textured protein substances 49 16 –67% 358 2132% 99,124 Kilograms $4
21069010 Ice cream mix 1 18 1686% 30 64% 7,168 Litres $4
21069020 Vegetable extracts, put up as prepared foodstuffs 23 181 690% 1 –99% 97 Kilograms $12
21069040 Mixtures of chemicals and foodstuffs 46 85 83% 1,947 2204% 121,726 Kilograms $16
21069050 Fruit cordials 14 4 –72% 28 617% 8,938 Litres $3
21069091 Foodstuffs and food preparations, nes 387 440 14% 1,393 217% 314,420 Kilograms $4
22 Beverages, spirits and vinegar 2,463 4,936 100% 7,075 43%
22011090 Mineral and aerated waters, not sweetened nor flavoured 39 30 –23% 5 –82% 4,426 Litres $1
22019000 Waters, not sweetened nor flavoured; ice and snow 4 2 –43% 2,070 Litres $1
22021011 Carbonated waters, in cans, sweetened or flavoured 269 8 –97% 570 6960% 444,278 Litres $1
22021019 Carbonated waters, not in cans but sweetened or flavoured 2 1 –63% 6 666% 4,699 Litres $1
22021090 Waters, not carbonated but sweetened or flavoured 1 119 8323% 29 –76% 34,200 Litres $1
22029000 Non-alcoholic beverages 33 385 1070% 34 –91% 27,291 Litres $1
22030010 Bottled beer made from malt 21 10 –51% 242 2232% 132,552 Litres $2
22030020 Canned beer made from malt 619 137 –78% 483 254% 282,711 Litres $2
22030090 Beer made from malt 3 13 16,335 Litres $1
22041010 Champagne 160 33 –80% 29 –11% 3,959 Litres $7
22041090 Sparkling wine 20 6 –70% 43 620% 3,732 Litres $12
22042120 Dessert wine, in containers not exc 2 l 19 2 –88% 0 –79% 99 Litres $5
22042131 White table wines in containers not exc 2 L 640 925 44% 3,202 246% 417,333 Litres $8
22042132 Red table wines in containers not exc 2 L 168 234 39% 1,616 591% 178,151 Litres $9
22042190 Wine, in containers not exc 2 l 10 2 –77% 5 116% 596 Litres $8
22042911 Dry, medium and sweet sherry, in containers exc 2 l but not exc 4.6 l 18 Litres
22042931 White table wines in containers exc 2 L but not exc 4.6 L 37 121 223% 57 –53% 31,232 Litres $2
22042932 Red table wines in containers exc 2 L but not exc 4.6 L 14 160 1015% 59 –63% 27,664 Litres $2
22042961 White table wines in containers exc 4.6 L 4 1 –81% 9 1053% 1,297 Litres $7
22042962 Red table wines in containers exc 4.6 L 36 1 –98% 65 10166% 16,042 Litres $4
22042970 Wine, in containers exc 4.6 L 38 Litres
22043000 Grape must 35 Litres
22051000 Vermouth and other wine flavoured with plants or aromatic substances,
in containers of 2 l or less 6 1 120 Litres $7
22060000 Fermented beverages nes (eg cider, perry and mead) 5 3 –39% 1,094 Litres $3
22071000 Undenatured ethyl alcohol of an alcoholic strength by volume
of 80% vol or higher 94 15 –84% 11,837 Litres Al $1
22072000 Ethyl alcohol and other spirits, denatured, of any strength 33 35 24,987 Litres Al $1
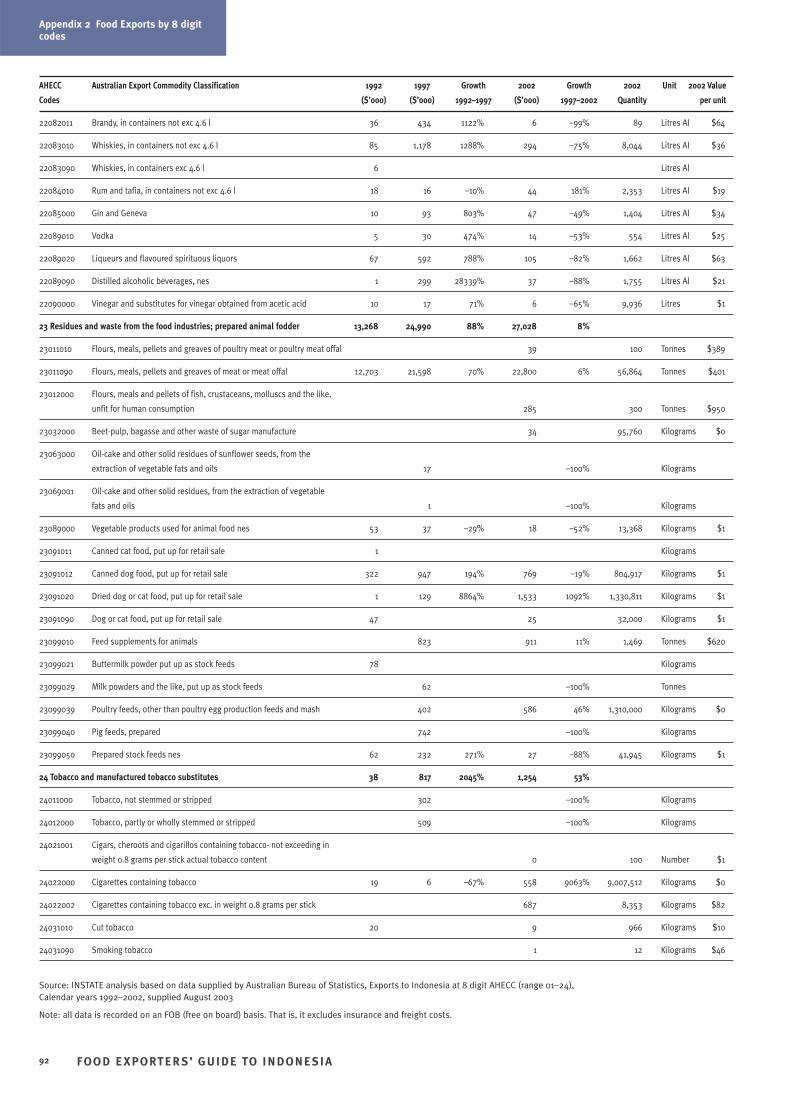
Appendix 2 Food Exports by 8 digitcodes
FOO D E XPORTER S’ GUIDE TO INDONESIA92
AHECC Australian Export Commodity Classification 1992 1997 Growth 2002 Growth 2002 Unit 2002 Value
Codes ($’000) ($’000) 1992–1997 ($’000) 1997–2002 Quantity per unit
22082011 Brandy, in containers not exc 4.6 l 36 434 1122% 6 –99% 89 Litres Al $64
22083010 Whiskies, in containers not exc 4.6 l 85 1,178 1288% 294 –75% 8,044 Litres Al $36
22083090 Whiskies, in containers exc 4.6 l 6 Litres Al
22084010 Rum and tafia, in containers not exc 4.6 l 18 16 –10% 44 181% 2,353 Litres Al $19
22085000 Gin and Geneva 10 93 803% 47 –49% 1,404 Litres Al $34
22089010 Vodka 5 30 474% 14 –53% 554 Litres Al $25
22089020 Liqueurs and flavoured spirituous liquors 67 592 788% 105 –82% 1,662 Litres Al $63
22089090 Distilled alcoholic beverages, nes 1 299 28339% 37 –88% 1,755 Litres Al $21
22090000 Vinegar and substitutes for vinegar obtained from acetic acid 10 17 71% 6 –65% 9,936 Litres $1
23 Residues and waste from the food industries; prepared animal fodder 13,268 24,990 88% 27,028 8%
23011010 Flours, meals, pellets and greaves of poultry meat or poultry meat offal 39 100 Tonnes $389
23011090 Flours, meals, pellets and greaves of meat or meat offal 12,703 21,598 70% 22,800 6% 56,864 Tonnes $401
23012000 Flours, meals and pellets of fish, crustaceans, molluscs and the like,
unfit for human consumption 285 300 Tonnes $950
23032000 Beet-pulp, bagasse and other waste of sugar manufacture 34 95,760 Kilograms $0
23063000 Oil-cake and other solid residues of sunflower seeds, from the
extraction of vegetable fats and oils 17 –100% Kilograms
23069001 Oil-cake and other solid residues, from the extraction of vegetable
fats and oils 1 –100% Kilograms
23089000 Vegetable products used for animal food nes 53 37 –29% 18 –52% 13,368 Kilograms $1
23091011 Canned cat food, put up for retail sale 1 Kilograms
23091012 Canned dog food, put up for retail sale 322 947 194% 769 –19% 804,917 Kilograms $1
23091020 Dried dog or cat food, put up for retail sale 1 129 8864% 1,533 1092% 1,330,811 Kilograms $1
23091090 Dog or cat food, put up for retail sale 47 25 32,000 Kilograms $1
23099010 Feed supplements for animals 823 911 11% 1,469 Tonnes $620
23099021 Buttermilk powder put up as stock feeds 78 Kilograms
23099029 Milk powders and the like, put up as stock feeds 62 –100% Tonnes
23099039 Poultry feeds, other than poultry egg production feeds and mash 402 586 46% 1,310,000 Kilograms $0
23099040 Pig feeds, prepared 742 –100% Kilograms
23099050 Prepared stock feeds nes 62 232 271% 27 –88% 41,945 Kilograms $1
24 Tobacco and manufactured tobacco substitutes 38 817 2045% 1,254 53%
24011000 Tobacco, not stemmed or stripped 302 –100% Kilograms
24012000 Tobacco, partly or wholly stemmed or stripped 509 –100% Kilograms
24021001 Cigars, cheroots and cigarillos containing tobacco- not exceeding in
weight 0.8 grams per stick actual tobacco content 0 100 Number $1
24022000 Cigarettes containing tobacco 19 6 –67% 558 9063% 9,007,512 Kilograms $0
24022002 Cigarettes containing tobacco exc. in weight 0.8 grams per stick 687 8,353 Kilograms $82
24031010 Cut tobacco 20 9 966 Kilograms $10
24031090 Smoking tobacco 1 12 Kilograms $46
Source: INSTATE analysis based on data supplied by Australian Bureau of Statistics, Exports to Indonesia at 8 digit AHECC (range 01–24), Calendar years 1992–2002, supplied August 2003
Note: all data is recorded on an FOB (free on board) basis. That is, it excludes insurance and freight costs.
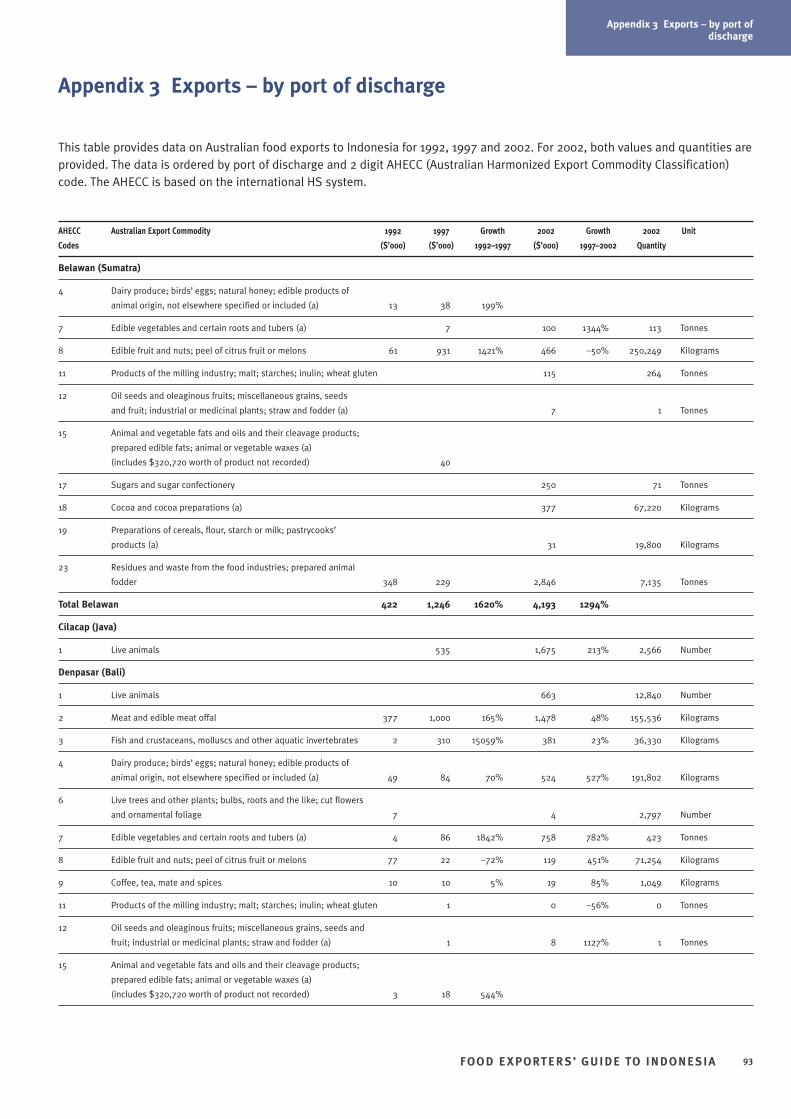
Appendix 3 Exports – by port ofdischarge
FOO D E XPORTER S’ GUIDE TO INDONESIA 93
Appendix 3 Exports – by port of discharge
This table provides data on Australian food exports to Indonesia for 1992, 1997 and 2002. For 2002, both values and quantities areprovided. The data is ordered by port of discharge and 2 digit AHECC (Australian Harmonized Export Commodity Classification)code. The AHECC is based on the international HS system.
AHECC Australian Export Commodity 1992 1997 Growth 2002 Growth 2002 Unit
Codes ($’000) ($’000) 1992–1997 ($’000) 1997–2002 Quantity
Belawan (Sumatra)
4 Dairy produce; birds’ eggs; natural honey; edible products of
animal origin, not elsewhere specified or included (a) 13 38 199%
7 Edible vegetables and certain roots and tubers (a) 7 100 1344% 113 Tonnes
8 Edible fruit and nuts; peel of citrus fruit or melons 61 931 1421% 466 –50% 250,249 Kilograms
11 Products of the milling industry; malt; starches; inulin; wheat gluten 115 264 Tonnes
12 Oil seeds and oleaginous fruits; miscellaneous grains, seeds
and fruit; industrial or medicinal plants; straw and fodder (a) 7 1 Tonnes
15 Animal and vegetable fats and oils and their cleavage products;
prepared edible fats; animal or vegetable waxes (a)
(includes $320,720 worth of product not recorded) 40
17 Sugars and sugar confectionery 250 71 Tonnes
18 Cocoa and cocoa preparations (a) 377 67,220 Kilograms
19 Preparations of cereals, flour, starch or milk; pastrycooks’
products (a) 31 19,800 Kilograms
23 Residues and waste from the food industries; prepared animal
fodder 348 229 2,846 7,135 Tonnes
Total Belawan 422 1,246 1620% 4,193 1294%
Cilacap (Java)
1 Live animals 535 1,675 213% 2,566 Number
Denpasar (Bali)
1 Live animals 663 12,840 Number
2 Meat and edible meat offal 377 1,000 165% 1,478 48% 155,536 Kilograms
3 Fish and crustaceans, molluscs and other aquatic invertebrates 2 310 15059% 381 23% 36,330 Kilograms
4 Dairy produce; birds’ eggs; natural honey; edible products of
animal origin, not elsewhere specified or included (a) 49 84 70% 524 527% 191,802 Kilograms
6 Live trees and other plants; bulbs, roots and the like; cut flowers
and ornamental foliage 7 4 2,797 Number
7 Edible vegetables and certain roots and tubers (a) 4 86 1842% 758 782% 423 Tonnes
8 Edible fruit and nuts; peel of citrus fruit or melons 77 22 –72% 119 451% 71,254 Kilograms
9 Coffee, tea, mate and spices 10 10 5% 19 85% 1,049 Kilograms
11 Products of the milling industry; malt; starches; inulin; wheat gluten 1 0 –56% 0 Tonnes
12 Oil seeds and oleaginous fruits; miscellaneous grains, seeds and
fruit; industrial or medicinal plants; straw and fodder (a) 1 8 1127% 1 Tonnes
15 Animal and vegetable fats and oils and their cleavage products;
prepared edible fats; animal or vegetable waxes (a)
(includes $320,720 worth of product not recorded) 3 18 544%
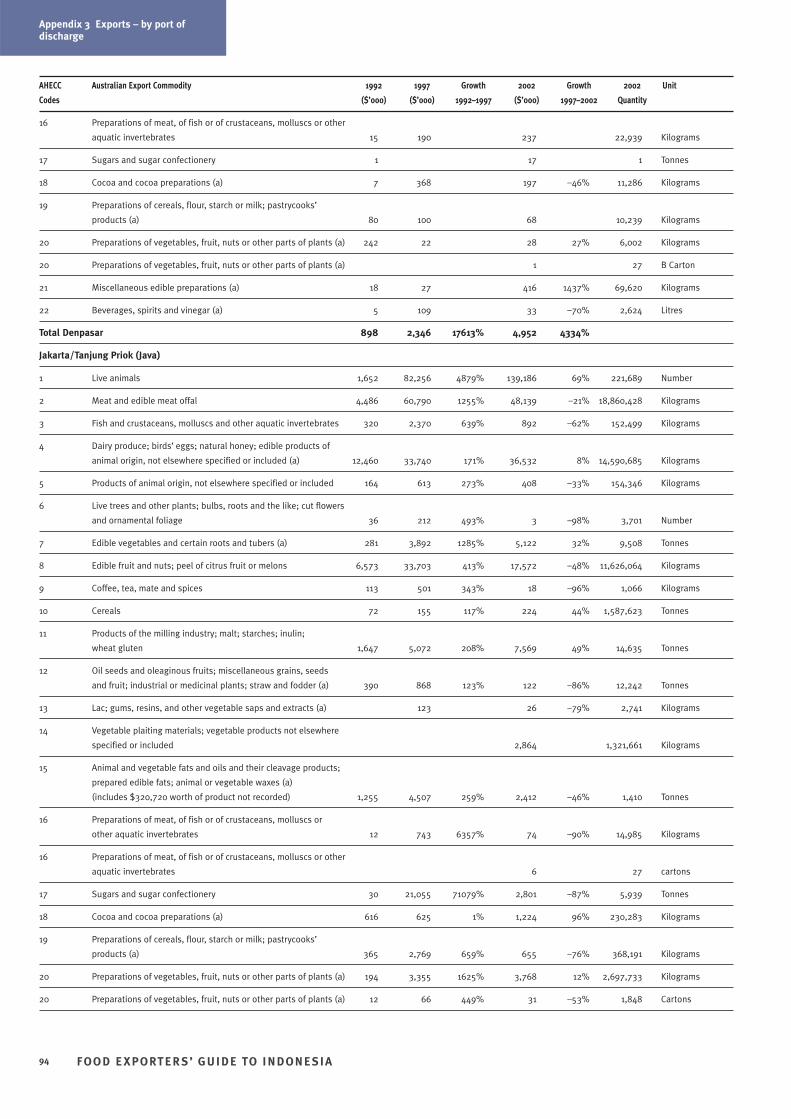
Appendix 3 Exports – by port ofdischarge
FOO D E XPORTER S’ GUIDE TO INDONESIA94
Appendix 3 Exports – by port ofdischarge
AHECC Australian Export Commodity 1992 1997 Growth 2002 Growth 2002 Unit
Codes ($’000) ($’000) 1992–1997 ($’000) 1997–2002 Quantity
16 Preparations of meat, of fish or of crustaceans, molluscs or other
aquatic invertebrates 15 190 237 22,939 Kilograms
17 Sugars and sugar confectionery 1 17 1 Tonnes
18 Cocoa and cocoa preparations (a) 7 368 197 –46% 11,286 Kilograms
19 Preparations of cereals, flour, starch or milk; pastrycooks’
products (a) 80 100 68 10,239 Kilograms
20 Preparations of vegetables, fruit, nuts or other parts of plants (a) 242 22 28 27% 6,002 Kilograms
20 Preparations of vegetables, fruit, nuts or other parts of plants (a) 1 27 B Carton
21 Miscellaneous edible preparations (a) 18 27 416 1437% 69,620 Kilograms
22 Beverages, spirits and vinegar (a) 5 109 33 –70% 2,624 Litres
Total Denpasar 898 2,346 17613% 4,952 4334%
Jakarta/Tanjung Priok (Java)
1 Live animals 1,652 82,256 4879% 139,186 69% 221,689 Number
2 Meat and edible meat offal 4,486 60,790 1255% 48,139 –21% 18,860,428 Kilograms
3 Fish and crustaceans, molluscs and other aquatic invertebrates 320 2,370 639% 892 –62% 152,499 Kilograms
4 Dairy produce; birds’ eggs; natural honey; edible products of
animal origin, not elsewhere specified or included (a) 12,460 33,740 171% 36,532 8% 14,590,685 Kilograms
5 Products of animal origin, not elsewhere specified or included 164 613 273% 408 –33% 154,346 Kilograms
6 Live trees and other plants; bulbs, roots and the like; cut flowers
and ornamental foliage 36 212 493% 3 –98% 3,701 Number
7 Edible vegetables and certain roots and tubers (a) 281 3,892 1285% 5,122 32% 9,508 Tonnes
8 Edible fruit and nuts; peel of citrus fruit or melons 6,573 33,703 413% 17,572 –48% 11,626,064 Kilograms
9 Coffee, tea, mate and spices 113 501 343% 18 –96% 1,066 Kilograms
10 Cereals 72 155 117% 224 44% 1,587,623 Tonnes
11 Products of the milling industry; malt; starches; inulin;
wheat gluten 1,647 5,072 208% 7,569 49% 14,635 Tonnes
12 Oil seeds and oleaginous fruits; miscellaneous grains, seeds
and fruit; industrial or medicinal plants; straw and fodder (a) 390 868 123% 122 –86% 12,242 Tonnes
13 Lac; gums, resins, and other vegetable saps and extracts (a) 123 26 –79% 2,741 Kilograms
14 Vegetable plaiting materials; vegetable products not elsewhere
specified or included 2,864 1,321,661 Kilograms
15 Animal and vegetable fats and oils and their cleavage products;
prepared edible fats; animal or vegetable waxes (a)
(includes $320,720 worth of product not recorded) 1,255 4,507 259% 2,412 –46% 1,410 Tonnes
16 Preparations of meat, of fish or of crustaceans, molluscs or
other aquatic invertebrates 12 743 6357% 74 –90% 14,985 Kilograms
16 Preparations of meat, of fish or of crustaceans, molluscs or other
aquatic invertebrates 6 27 cartons
17 Sugars and sugar confectionery 30 21,055 71079% 2,801 –87% 5,939 Tonnes
18 Cocoa and cocoa preparations (a) 616 625 1% 1,224 96% 230,283 Kilograms
19 Preparations of cereals, flour, starch or milk; pastrycooks’
products (a) 365 2,769 659% 655 –76% 368,191 Kilograms
20 Preparations of vegetables, fruit, nuts or other parts of plants (a) 194 3,355 1625% 3,768 12% 2,697,733 Kilograms
20 Preparations of vegetables, fruit, nuts or other parts of plants (a) 12 66 449% 31 –53% 1,848 Cartons
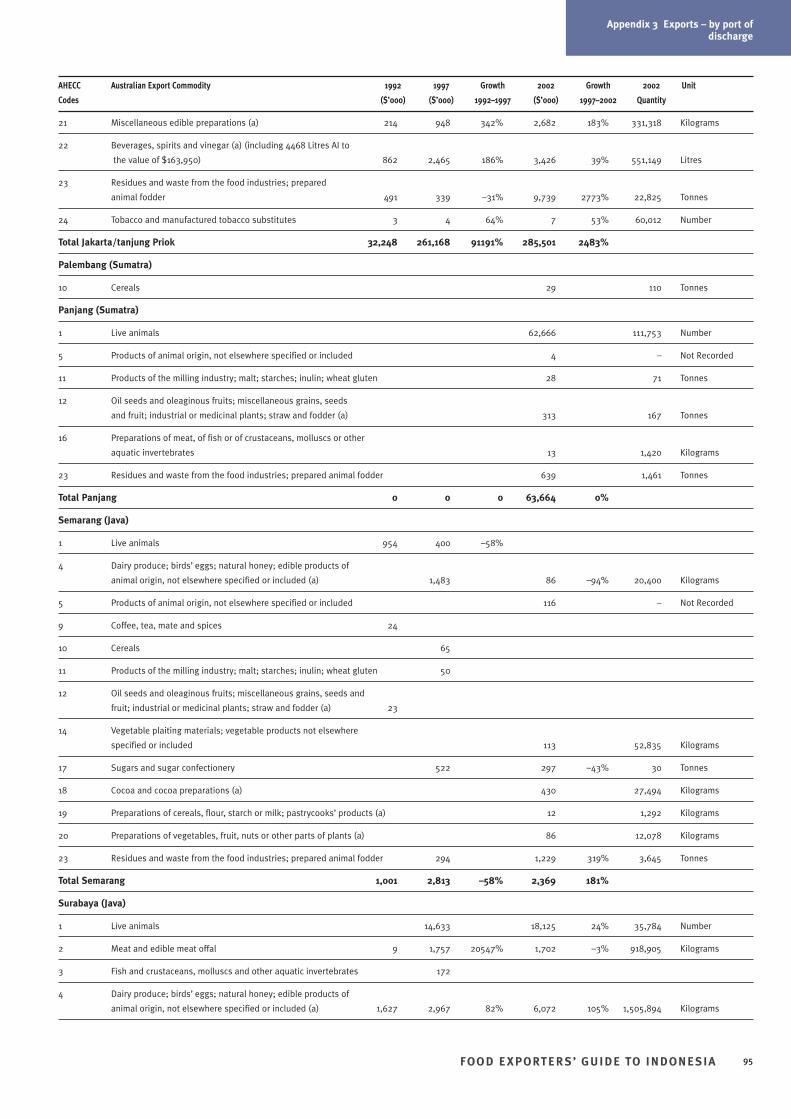
Appendix 3 Exports – by port ofdischarge
FOO D E XPORTER S’ GUIDE TO INDONESIA 95
Appendix 3 Exports – by port ofdischarge
AHECC Australian Export Commodity 1992 1997 Growth 2002 Growth 2002 Unit
Codes ($’000) ($’000) 1992–1997 ($’000) 1997–2002 Quantity
21 Miscellaneous edible preparations (a) 214 948 342% 2,682 183% 331,318 Kilograms
22 Beverages, spirits and vinegar (a) (including 4468 Litres AI to
the value of $163,950) 862 2,465 186% 3,426 39% 551,149 Litres
23 Residues and waste from the food industries; prepared
animal fodder 491 339 –31% 9,739 2773% 22,825 Tonnes
24 Tobacco and manufactured tobacco substitutes 3 4 64% 7 53% 60,012 Number
Total Jakarta/tanjung Priok 32,248 261,168 91191% 285,501 2483%
Palembang (Sumatra)
10 Cereals 29 110 Tonnes
Panjang (Sumatra)
1 Live animals 62,666 111,753 Number
5 Products of animal origin, not elsewhere specified or included 4 – Not Recorded
11 Products of the milling industry; malt; starches; inulin; wheat gluten 28 71 Tonnes
12 Oil seeds and oleaginous fruits; miscellaneous grains, seeds
and fruit; industrial or medicinal plants; straw and fodder (a) 313 167 Tonnes
16 Preparations of meat, of fish or of crustaceans, molluscs or other
aquatic invertebrates 13 1,420 Kilograms
23 Residues and waste from the food industries; prepared animal fodder 639 1,461 Tonnes
Total Panjang 0 0 0 63,664 0%
Semarang (Java)
1 Live animals 954 400 –58%
4 Dairy produce; birds’ eggs; natural honey; edible products of
animal origin, not elsewhere specified or included (a) 1,483 86 –94% 20,400 Kilograms
5 Products of animal origin, not elsewhere specified or included 116 – Not Recorded
9 Coffee, tea, mate and spices 24
10 Cereals 65
11 Products of the milling industry; malt; starches; inulin; wheat gluten 50
12 Oil seeds and oleaginous fruits; miscellaneous grains, seeds and
fruit; industrial or medicinal plants; straw and fodder (a) 23
14 Vegetable plaiting materials; vegetable products not elsewhere
specified or included 113 52,835 Kilograms
17 Sugars and sugar confectionery 522 297 –43% 30 Tonnes
18 Cocoa and cocoa preparations (a) 430 27,494 Kilograms
19 Preparations of cereals, flour, starch or milk; pastrycooks’ products (a) 12 1,292 Kilograms
20 Preparations of vegetables, fruit, nuts or other parts of plants (a) 86 12,078 Kilograms
23 Residues and waste from the food industries; prepared animal fodder 294 1,229 319% 3,645 Tonnes
Total Semarang 1,001 2,813 –58% 2,369 181%
Surabaya (Java)
1 Live animals 14,633 18,125 24% 35,784 Number
2 Meat and edible meat offal 9 1,757 20547% 1,702 –3% 918,905 Kilograms
3 Fish and crustaceans, molluscs and other aquatic invertebrates 172
4 Dairy produce; birds’ eggs; natural honey; edible products of
animal origin, not elsewhere specified or included (a) 1,627 2,967 82% 6,072 105% 1,505,894 Kilograms
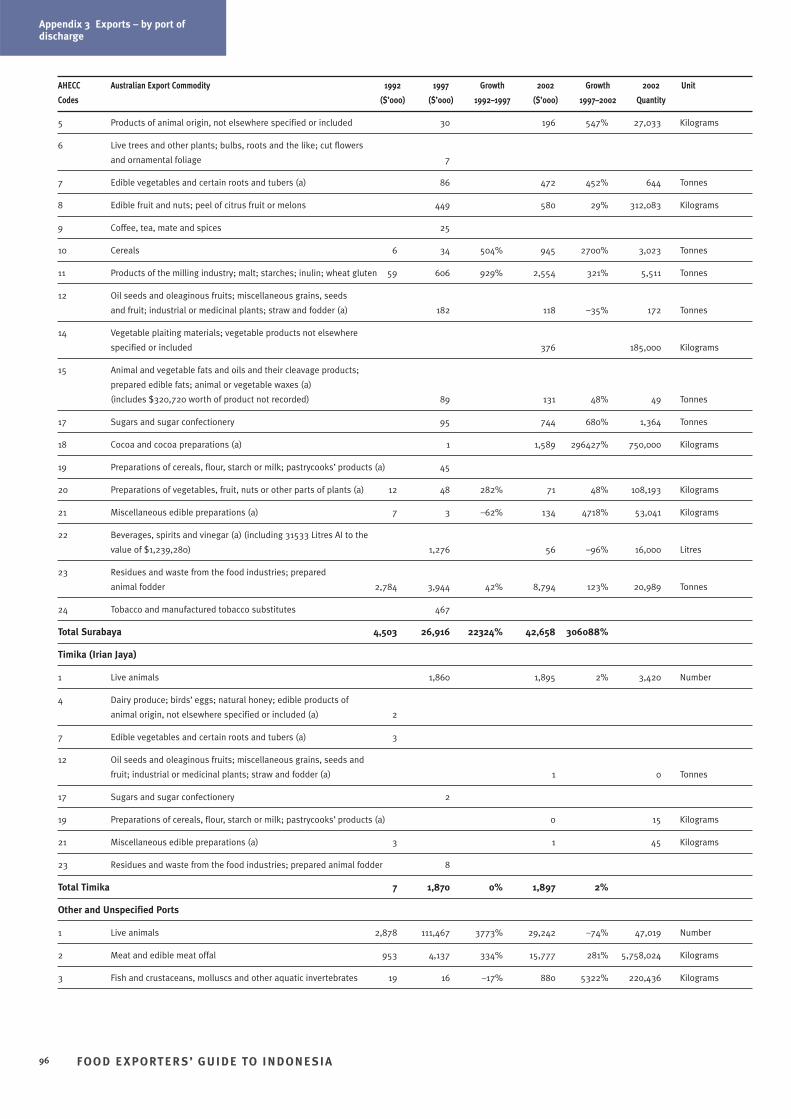
Appendix 3 Exports – by port ofdischarge
FOO D E XPORTER S’ GUIDE TO INDONESIA96
Appendix 3 Exports – by port ofdischarge
AHECC Australian Export Commodity 1992 1997 Growth 2002 Growth 2002 Unit
Codes ($’000) ($’000) 1992–1997 ($’000) 1997–2002 Quantity
5 Products of animal origin, not elsewhere specified or included 30 196 547% 27,033 Kilograms
6 Live trees and other plants; bulbs, roots and the like; cut flowers
and ornamental foliage 7
7 Edible vegetables and certain roots and tubers (a) 86 472 452% 644 Tonnes
8 Edible fruit and nuts; peel of citrus fruit or melons 449 580 29% 312,083 Kilograms
9 Coffee, tea, mate and spices 25
10 Cereals 6 34 504% 945 2700% 3,023 Tonnes
11 Products of the milling industry; malt; starches; inulin; wheat gluten 59 606 929% 2,554 321% 5,511 Tonnes
12 Oil seeds and oleaginous fruits; miscellaneous grains, seeds
and fruit; industrial or medicinal plants; straw and fodder (a) 182 118 –35% 172 Tonnes
14 Vegetable plaiting materials; vegetable products not elsewhere
specified or included 376 185,000 Kilograms
15 Animal and vegetable fats and oils and their cleavage products;
prepared edible fats; animal or vegetable waxes (a)
(includes $320,720 worth of product not recorded) 89 131 48% 49 Tonnes
17 Sugars and sugar confectionery 95 744 680% 1,364 Tonnes
18 Cocoa and cocoa preparations (a) 1 1,589 296427% 750,000 Kilograms
19 Preparations of cereals, flour, starch or milk; pastrycooks’ products (a) 45
20 Preparations of vegetables, fruit, nuts or other parts of plants (a) 12 48 282% 71 48% 108,193 Kilograms
21 Miscellaneous edible preparations (a) 7 3 –62% 134 4718% 53,041 Kilograms
22 Beverages, spirits and vinegar (a) (including 31533 Litres AI to the
value of $1,239,280) 1,276 56 –96% 16,000 Litres
23 Residues and waste from the food industries; prepared
animal fodder 2,784 3,944 42% 8,794 123% 20,989 Tonnes
24 Tobacco and manufactured tobacco substitutes 467
Total Surabaya 4,503 26,916 22324% 42,658 306088%
Timika (Irian Jaya)
1 Live animals 1,860 1,895 2% 3,420 Number
4 Dairy produce; birds’ eggs; natural honey; edible products of
animal origin, not elsewhere specified or included (a) 2
7 Edible vegetables and certain roots and tubers (a) 3
12 Oil seeds and oleaginous fruits; miscellaneous grains, seeds and
fruit; industrial or medicinal plants; straw and fodder (a) 1 0 Tonnes
17 Sugars and sugar confectionery 2
19 Preparations of cereals, flour, starch or milk; pastrycooks’ products (a) 0 15 Kilograms
21 Miscellaneous edible preparations (a) 3 1 45 Kilograms
23 Residues and waste from the food industries; prepared animal fodder 8
Total Timika 7 1,870 0% 1,897 2%
Other and Unspecified Ports
1 Live animals 2,878 111,467 3773% 29,242 –74% 47,019 Number
2 Meat and edible meat offal 953 4,137 334% 15,777 281% 5,758,024 Kilograms
3 Fish and crustaceans, molluscs and other aquatic invertebrates 19 16 –17% 880 5322% 220,436 Kilograms
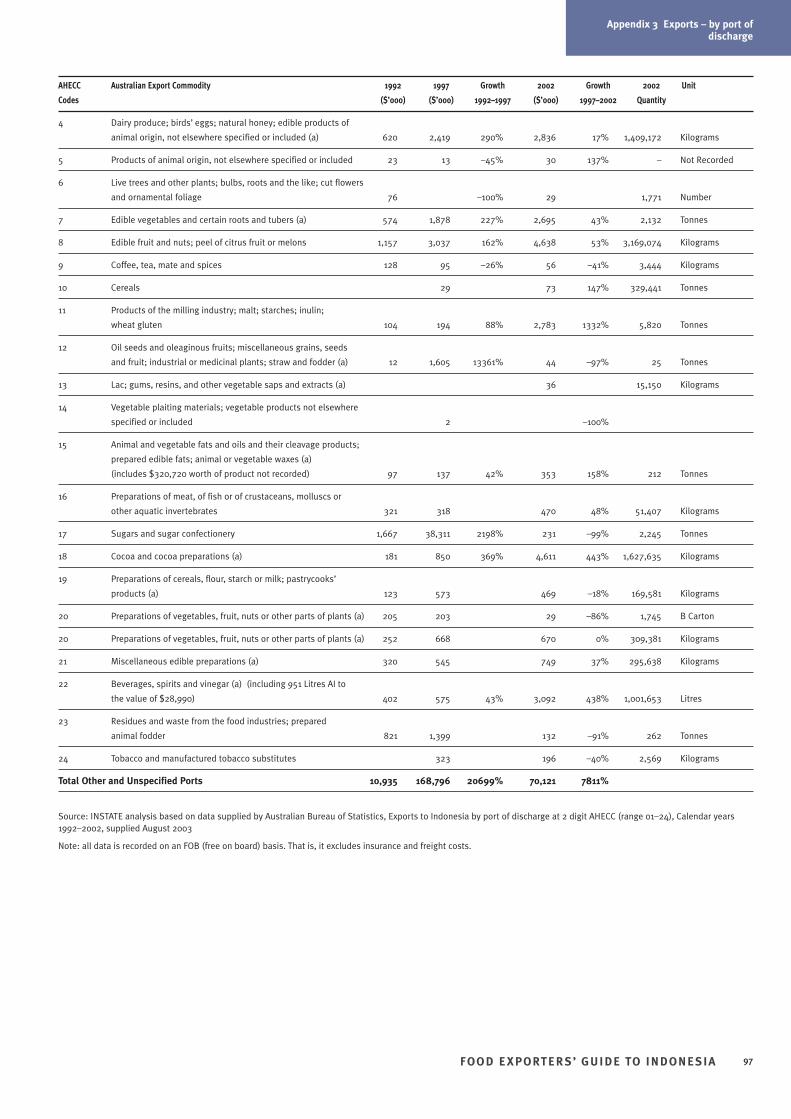
Appendix 3 Exports – by port ofdischarge
FOO D E XPORTER S’ GUIDE TO INDONESIA 97
Appendix 3 Exports – by port ofdischarge
AHECC Australian Export Commodity 1992 1997 Growth 2002 Growth 2002 Unit
Codes ($’000) ($’000) 1992–1997 ($’000) 1997–2002 Quantity
4 Dairy produce; birds’ eggs; natural honey; edible products of
animal origin, not elsewhere specified or included (a) 620 2,419 290% 2,836 17% 1,409,172 Kilograms
5 Products of animal origin, not elsewhere specified or included 23 13 –45% 30 137% – Not Recorded
6 Live trees and other plants; bulbs, roots and the like; cut flowers
and ornamental foliage 76 –100% 29 1,771 Number
7 Edible vegetables and certain roots and tubers (a) 574 1,878 227% 2,695 43% 2,132 Tonnes
8 Edible fruit and nuts; peel of citrus fruit or melons 1,157 3,037 162% 4,638 53% 3,169,074 Kilograms
9 Coffee, tea, mate and spices 128 95 –26% 56 –41% 3,444 Kilograms
10 Cereals 29 73 147% 329,441 Tonnes
11 Products of the milling industry; malt; starches; inulin;
wheat gluten 104 194 88% 2,783 1332% 5,820 Tonnes
12 Oil seeds and oleaginous fruits; miscellaneous grains, seeds
and fruit; industrial or medicinal plants; straw and fodder (a) 12 1,605 13361% 44 –97% 25 Tonnes
13 Lac; gums, resins, and other vegetable saps and extracts (a) 36 15,150 Kilograms
14 Vegetable plaiting materials; vegetable products not elsewhere
specified or included 2 –100%
15 Animal and vegetable fats and oils and their cleavage products;
prepared edible fats; animal or vegetable waxes (a)
(includes $320,720 worth of product not recorded) 97 137 42% 353 158% 212 Tonnes
16 Preparations of meat, of fish or of crustaceans, molluscs or
other aquatic invertebrates 321 318 470 48% 51,407 Kilograms
17 Sugars and sugar confectionery 1,667 38,311 2198% 231 –99% 2,245 Tonnes
18 Cocoa and cocoa preparations (a) 181 850 369% 4,611 443% 1,627,635 Kilograms
19 Preparations of cereals, flour, starch or milk; pastrycooks’
products (a) 123 573 469 –18% 169,581 Kilograms
20 Preparations of vegetables, fruit, nuts or other parts of plants (a) 205 203 29 –86% 1,745 B Carton
20 Preparations of vegetables, fruit, nuts or other parts of plants (a) 252 668 670 0% 309,381 Kilograms
21 Miscellaneous edible preparations (a) 320 545 749 37% 295,638 Kilograms
22 Beverages, spirits and vinegar (a) (including 951 Litres AI to
the value of $28,990) 402 575 43% 3,092 438% 1,001,653 Litres
23 Residues and waste from the food industries; prepared
animal fodder 821 1,399 132 –91% 262 Tonnes
24 Tobacco and manufactured tobacco substitutes 323 196 –40% 2,569 Kilograms
Total Other and Unspecified Ports 10,935 168,796 20699% 70,121 7811%
Source: INSTATE analysis based on data supplied by Australian Bureau of Statistics, Exports to Indonesia by port of discharge at 2 digit AHECC (range 01–24), Calendar years1992–2002, supplied August 2003
Note: all data is recorded on an FOB (free on board) basis. That is, it excludes insurance and freight costs.
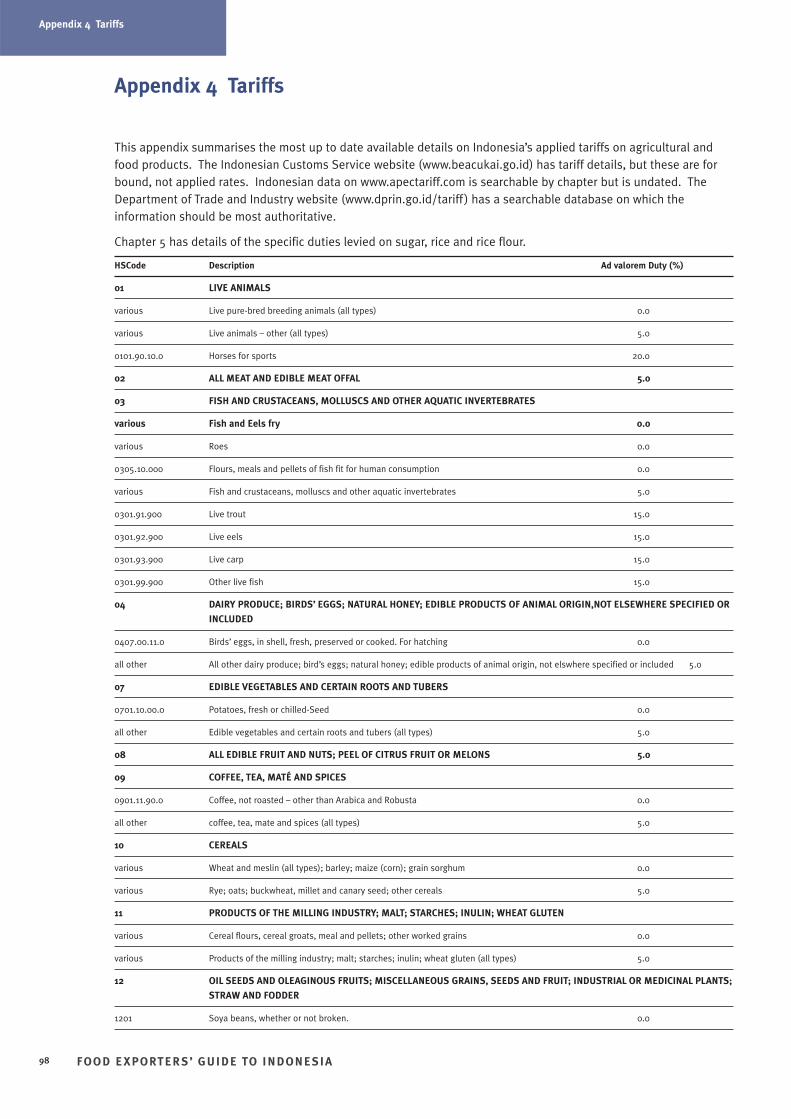
Appendix 4 Tariffs
FOO D E XPORTER S’ GUIDE TO INDONESIA98
Appendix 4 Tariffs
Appendix 4 Tariffs
This appendix summarises the most up to date available details on Indonesia’s applied tariffs on agricultural andfood products. The Indonesian Customs Service website (www.beacukai.go.id) has tariff details, but these are forbound, not applied rates. Indonesian data on www.apectariff.com is searchable by chapter but is undated. TheDepartment of Trade and Industry website (www.dprin.go.id/tariff ) has a searchable database on which theinformation should be most authoritative.
Chapter 5 has details of the specific duties levied on sugar, rice and rice flour.
HSCode Description Ad valorem Duty (%)
01 LIVE ANIMALS
various Live pure-bred breeding animals (all types) 0.0
various Live animals – other (all types) 5.0
0101.90.10.0 Horses for sports 20.0
02 ALL MEAT AND EDIBLE MEAT OFFAL 5.0
03 FISH AND CRUSTACEANS, MOLLUSCS AND OTHER AQUATIC INVERTEBRATES
various Fish and Eels fry 0.0
various Roes 0.0
0305.10.000 Flours, meals and pellets of fish fit for human consumption 0.0
various Fish and crustaceans, molluscs and other aquatic invertebrates 5.0
0301.91.900 Live trout 15.0
0301.92.900 Live eels 15.0
0301.93.900 Live carp 15.0
0301.99.900 Other live fish 15.0
04 DAIRY PRODUCE; BIRDS’ EGGS; NATURAL HONEY; EDIBLE PRODUCTS OF ANIMAL ORIGIN,NOT ELSEWHERE SPECIFIED OR
INCLUDED
0407.00.11.0 Birds’ eggs, in shell, fresh, preserved or cooked. For hatching 0.0
all other All other dairy produce; bird’s eggs; natural honey; edible products of animal origin, not elswhere specified or included 5.0
07 EDIBLE VEGETABLES AND CERTAIN ROOTS AND TUBERS
0701.10.00.0 Potatoes, fresh or chilled-Seed 0.0
all other Edible vegetables and certain roots and tubers (all types) 5.0
08 ALL EDIBLE FRUIT AND NUTS; PEEL OF CITRUS FRUIT OR MELONS 5.0
09 COFFEE, TEA, MATÉ AND SPICES
0901.11.90.0 Coffee, not roasted – other than Arabica and Robusta 0.0
all other coffee, tea, mate and spices (all types) 5.0
10 CEREALS
various Wheat and meslin (all types); barley; maize (corn); grain sorghum 0.0
various Rye; oats; buckwheat, millet and canary seed; other cereals 5.0
11 PRODUCTS OF THE MILLING INDUSTRY; MALT; STARCHES; INULIN; WHEAT GLUTEN
various Cereal flours, cereal groats, meal and pellets; other worked grains 0.0
various Products of the milling industry; malt; starches; inulin; wheat gluten (all types) 5.0
12 OIL SEEDS AND OLEAGINOUS FRUITS; MISCELLANEOUS GRAINS, SEEDS AND FRUIT; INDUSTRIAL OR MEDICINAL PLANTS;
STRAW AND FODDER
1201 Soya beans, whether or not broken. 0.0
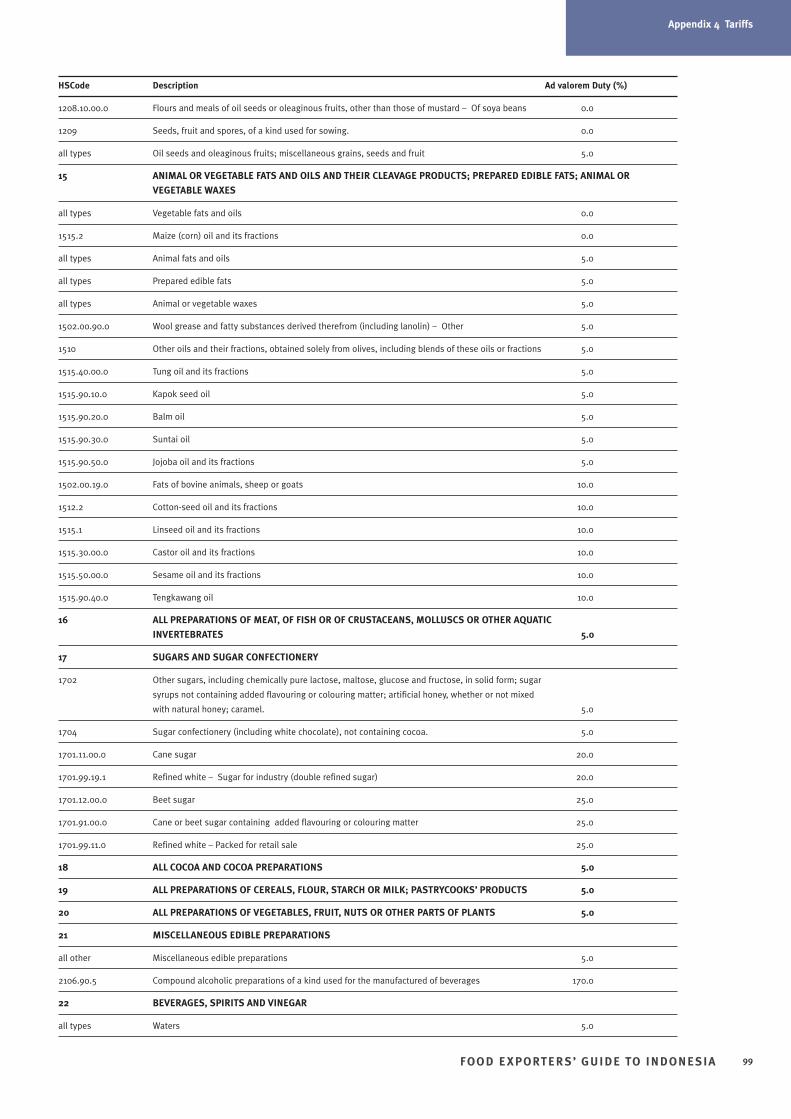
Appendix 4 Tariffs
99
Appendix 4 Tariffs
HSCode Description Ad valorem Duty (%)
1208.10.00.0 Flours and meals of oil seeds or oleaginous fruits, other than those of mustard – Of soya beans 0.0
1209 Seeds, fruit and spores, of a kind used for sowing. 0.0
all types Oil seeds and oleaginous fruits; miscellaneous grains, seeds and fruit 5.0
15 ANIMAL OR VEGETABLE FATS AND OILS AND THEIR CLEAVAGE PRODUCTS; PREPARED EDIBLE FATS; ANIMAL OR
VEGETABLE WAXES
all types Vegetable fats and oils 0.0
1515.2 Maize (corn) oil and its fractions 0.0
all types Animal fats and oils 5.0
all types Prepared edible fats 5.0
all types Animal or vegetable waxes 5.0
1502.00.90.0 Wool grease and fatty substances derived therefrom (including lanolin) – Other 5.0
1510 Other oils and their fractions, obtained solely from olives, including blends of these oils or fractions 5.0
1515.40.00.0 Tung oil and its fractions 5.0
1515.90.10.0 Kapok seed oil 5.0
1515.90.20.0 Balm oil 5.0
1515.90.30.0 Suntai oil 5.0
1515.90.50.0 Jojoba oil and its fractions 5.0
1502.00.19.0 Fats of bovine animals, sheep or goats 10.0
1512.2 Cotton-seed oil and its fractions 10.0
1515.1 Linseed oil and its fractions 10.0
1515.30.00.0 Castor oil and its fractions 10.0
1515.50.00.0 Sesame oil and its fractions 10.0
1515.90.40.0 Tengkawang oil 10.0
16 ALL PREPARATIONS OF MEAT, OF FISH OR OF CRUSTACEANS, MOLLUSCS OR OTHER AQUATIC
INVERTEBRATES 5.0
17 SUGARS AND SUGAR CONFECTIONERY
1702 Other sugars, including chemically pure lactose, maltose, glucose and fructose, in solid form; sugar
syrups not containing added flavouring or colouring matter; artificial honey, whether or not mixed
with natural honey; caramel. 5.0
1704 Sugar confectionery (including white chocolate), not containing cocoa. 5.0
1701.11.00.0 Cane sugar 20.0
1701.99.19.1 Refined white – Sugar for industry (double refined sugar) 20.0
1701.12.00.0 Beet sugar 25.0
1701.91.00.0 Cane or beet sugar containing added flavouring or colouring matter 25.0
1701.99.11.0 Refined white – Packed for retail sale 25.0
18 ALL COCOA AND COCOA PREPARATIONS 5.0
19 ALL PREPARATIONS OF CEREALS, FLOUR, STARCH OR MILK; PASTRYCOOKS’ PRODUCTS 5.0
20 ALL PREPARATIONS OF VEGETABLES, FRUIT, NUTS OR OTHER PARTS OF PLANTS 5.0
21 MISCELLANEOUS EDIBLE PREPARATIONS
all other Miscellaneous edible preparations 5.0
2106.90.5 Compound alcoholic preparations of a kind used for the manufactured of beverages 170.0
22 BEVERAGES, SPIRITS AND VINEGAR
all types Waters 5.0
FOO D E XPORTER S’ GUIDE TO INDONESIA
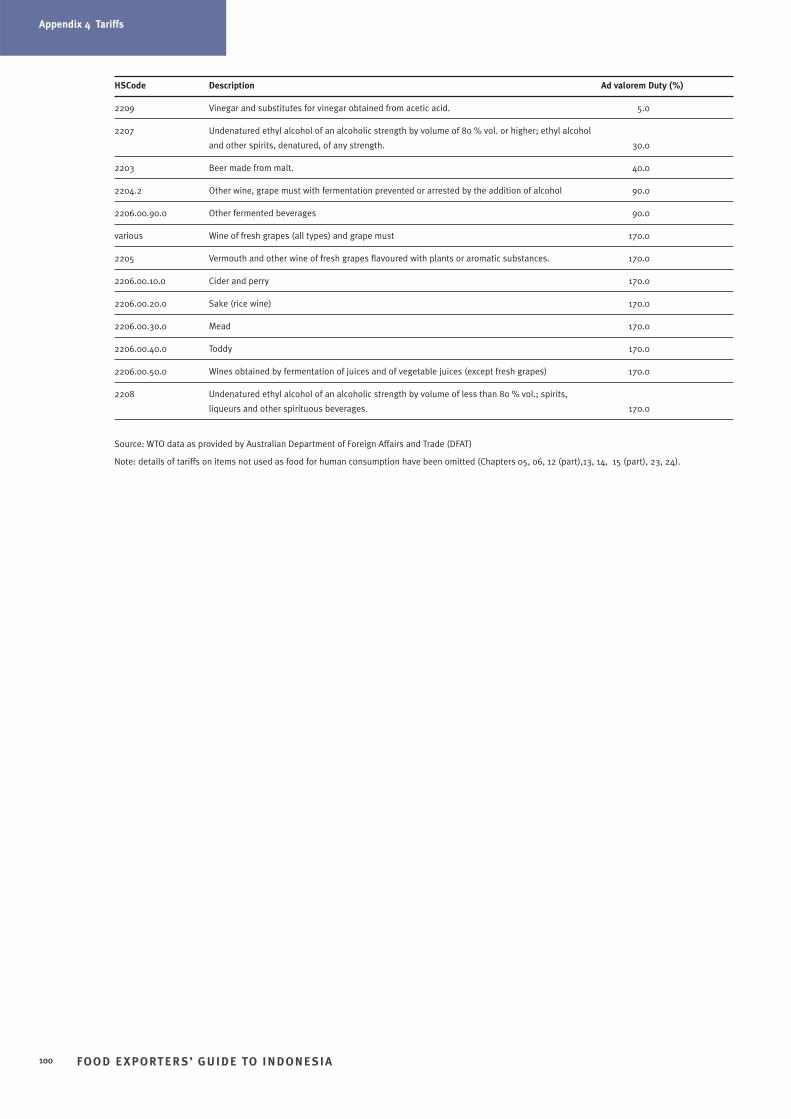
Appendix 4 Tariffs
FOO D E XPORTER S’ GUIDE TO INDONESIA100
Appendix 4 Tariffs
HSCode Description Ad valorem Duty (%)
2209 Vinegar and substitutes for vinegar obtained from acetic acid. 5.0
2207 Undenatured ethyl alcohol of an alcoholic strength by volume of 80 % vol. or higher; ethyl alcohol
and other spirits, denatured, of any strength. 30.0
2203 Beer made from malt. 40.0
2204.2 Other wine, grape must with fermentation prevented or arrested by the addition of alcohol 90.0
2206.00.90.0 Other fermented beverages 90.0
various Wine of fresh grapes (all types) and grape must 170.0
2205 Vermouth and other wine of fresh grapes flavoured with plants or aromatic substances. 170.0
2206.00.10.0 Cider and perry 170.0
2206.00.20.0 Sake (rice wine) 170.0
2206.00.30.0 Mead 170.0
2206.00.40.0 Toddy 170.0
2206.00.50.0 Wines obtained by fermentation of juices and of vegetable juices (except fresh grapes) 170.0
2208 Undenatured ethyl alcohol of an alcoholic strength by volume of less than 80 % vol.; spirits,
liqueurs and other spirituous beverages. 170.0
Source: WTO data as provided by Australian Department of Foreign Affairs and Trade (DFAT)
Note: details of tariffs on items not used as food for human consumption have been omitted (Chapters 05, 06, 12 (part),13, 14, 15 (part), 23, 24).
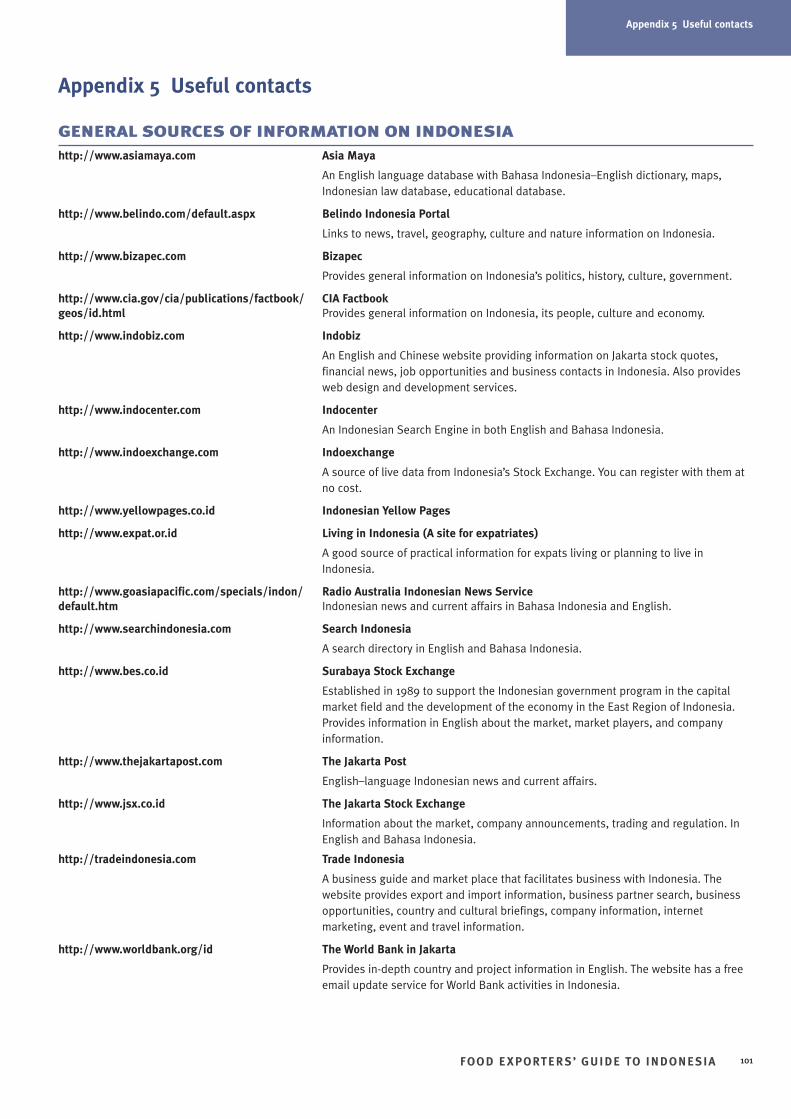
Appendix 5 Useful contacts
FOO D E XPORTER S’ GUIDE TO INDONESIA 101
Appendix 5 Useful contacts
Appendix 5 Useful contacts
GENERAL SOURCES OF INFORMATION ON INDONESIAhttp://www.asiamaya.com Asia Maya
An English language database with Bahasa Indonesia–English dictionary, maps,Indonesian law database, educational database.
http://www.belindo.com/default.aspx Belindo Indonesia Portal
Links to news, travel, geography, culture and nature information on Indonesia.
http://www.bizapec.com Bizapec
Provides general information on Indonesia’s politics, history, culture, government.
http://www.cia.gov/cia/publications/factbook/ CIA Factbookgeos/id.html Provides general information on Indonesia, its people, culture and economy.
http://www.indobiz.com Indobiz
An English and Chinese website providing information on Jakarta stock quotes,financial news, job opportunities and business contacts in Indonesia. Also providesweb design and development services.
http://www.indocenter.com Indocenter
An Indonesian Search Engine in both English and Bahasa Indonesia.
http://www.indoexchange.com Indoexchange
A source of live data from Indonesia’s Stock Exchange. You can register with them atno cost.
http://www.yellowpages.co.id Indonesian Yellow Pages
http://www.expat.or.id Living in Indonesia (A site for expatriates)
A good source of practical information for expats living or planning to live inIndonesia.
http://www.goasiapacific.com/specials/indon/ Radio Australia Indonesian News Servicedefault.htm Indonesian news and current affairs in Bahasa Indonesia and English.
http://www.searchindonesia.com Search Indonesia
A search directory in English and Bahasa Indonesia.
http://www.bes.co.id Surabaya Stock Exchange
Established in 1989 to support the Indonesian government program in the capitalmarket field and the development of the economy in the East Region of Indonesia.Provides information in English about the market, market players, and companyinformation.
http://www.thejakartapost.com The Jakarta Post
English–language Indonesian news and current affairs.
http://www.jsx.co.id The Jakarta Stock Exchange
Information about the market, company announcements, trading and regulation. InEnglish and Bahasa Indonesia.
http://tradeindonesia.com Trade Indonesia
A business guide and market place that facilitates business with Indonesia. Thewebsite provides export and import information, business partner search, businessopportunities, country and cultural briefings, company information, internetmarketing, event and travel information.
http://www.worldbank.org/id The World Bank in Jakarta
Provides in-depth country and project information in English. The website has a freeemail update service for World Bank activities in Indonesia.
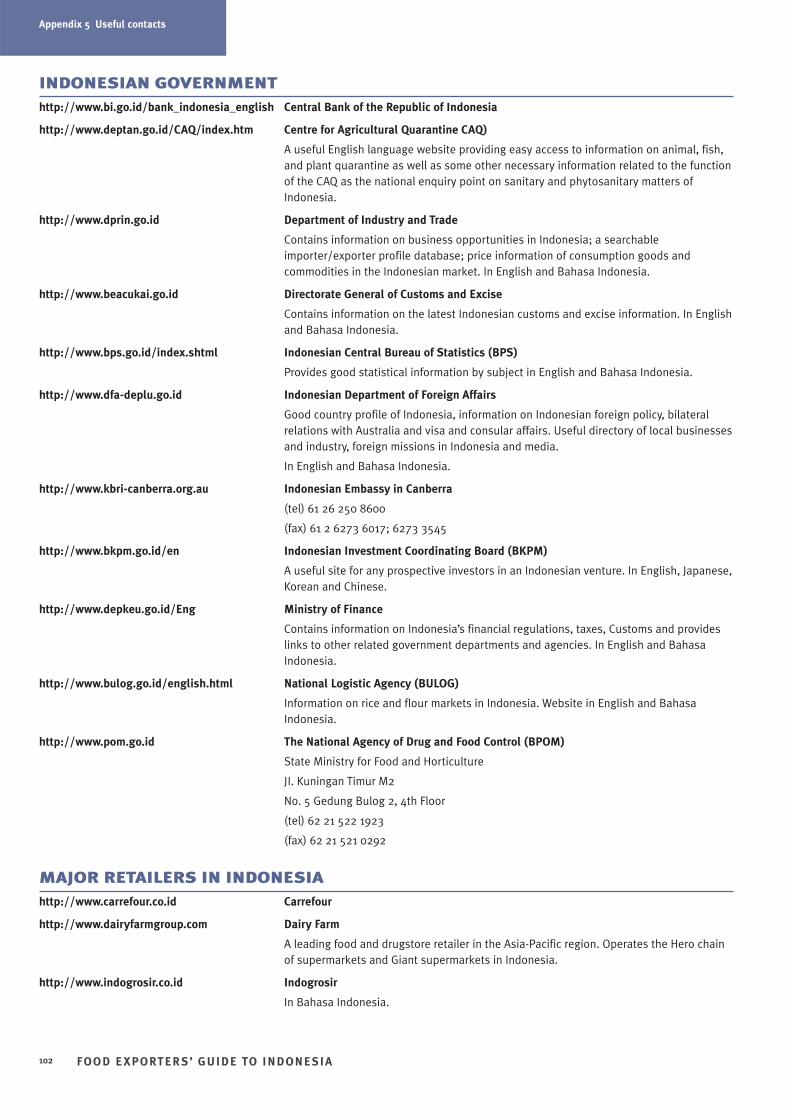
Appendix 5 Useful contacts
FOO D E XPORTER S’ GUIDE TO INDONESIA102
Appendix 5 Useful contacts
INDONESIAN GOVERNMENThttp://www.bi.go.id/bank_indonesia_english Central Bank of the Republic of Indonesia
http://www.deptan.go.id/CAQ/index.htm Centre for Agricultural Quarantine CAQ)
A useful English language website providing easy access to information on animal, fish,and plant quarantine as well as some other necessary information related to the functionof the CAQ as the national enquiry point on sanitary and phytosanitary matters ofIndonesia.
http://www.dprin.go.id Department of Industry and Trade
Contains information on business opportunities in Indonesia; a searchableimporter/exporter profile database; price information of consumption goods andcommodities in the Indonesian market. In English and Bahasa Indonesia.
http://www.beacukai.go.id Directorate General of Customs and Excise
Contains information on the latest Indonesian customs and excise information. In Englishand Bahasa Indonesia.
http://www.bps.go.id/index.shtml Indonesian Central Bureau of Statistics (BPS)
Provides good statistical information by subject in English and Bahasa Indonesia.
http://www.dfa-deplu.go.id Indonesian Department of Foreign Affairs
Good country profile of Indonesia, information on Indonesian foreign policy, bilateralrelations with Australia and visa and consular affairs. Useful directory of local businessesand industry, foreign missions in Indonesia and media.
In English and Bahasa Indonesia.
http://www.kbri-canberra.org.au Indonesian Embassy in Canberra
(tel) 61 26 250 8600
(fax) 61 2 6273 6017; 6273 3545
http://www.bkpm.go.id/en Indonesian Investment Coordinating Board (BKPM)
A useful site for any prospective investors in an Indonesian venture. In English, Japanese,Korean and Chinese.
http://www.depkeu.go.id/Eng Ministry of Finance
Contains information on Indonesia’s financial regulations, taxes, Customs and provideslinks to other related government departments and agencies. In English and BahasaIndonesia.
http://www.bulog.go.id/english.html National Logistic Agency (BULOG)
Information on rice and flour markets in Indonesia. Website in English and BahasaIndonesia.
http://www.pom.go.id The National Agency of Drug and Food Control (BPOM)
State Ministry for Food and Horticulture
JI. Kuningan Timur M2
No. 5 Gedung Bulog 2, 4th Floor
(tel) 62 21 522 1923
(fax) 62 21 521 0292
MAJOR RETAILERS IN INDONESIAhttp://www.carrefour.co.id Carrefour
http://www.dairyfarmgroup.com Dairy Farm
A leading food and drugstore retailer in the Asia-Pacific region. Operates the Hero chainof supermarkets and Giant supermarkets in Indonesia.
http://www.indogrosir.co.id Indogrosir
In Bahasa Indonesia.
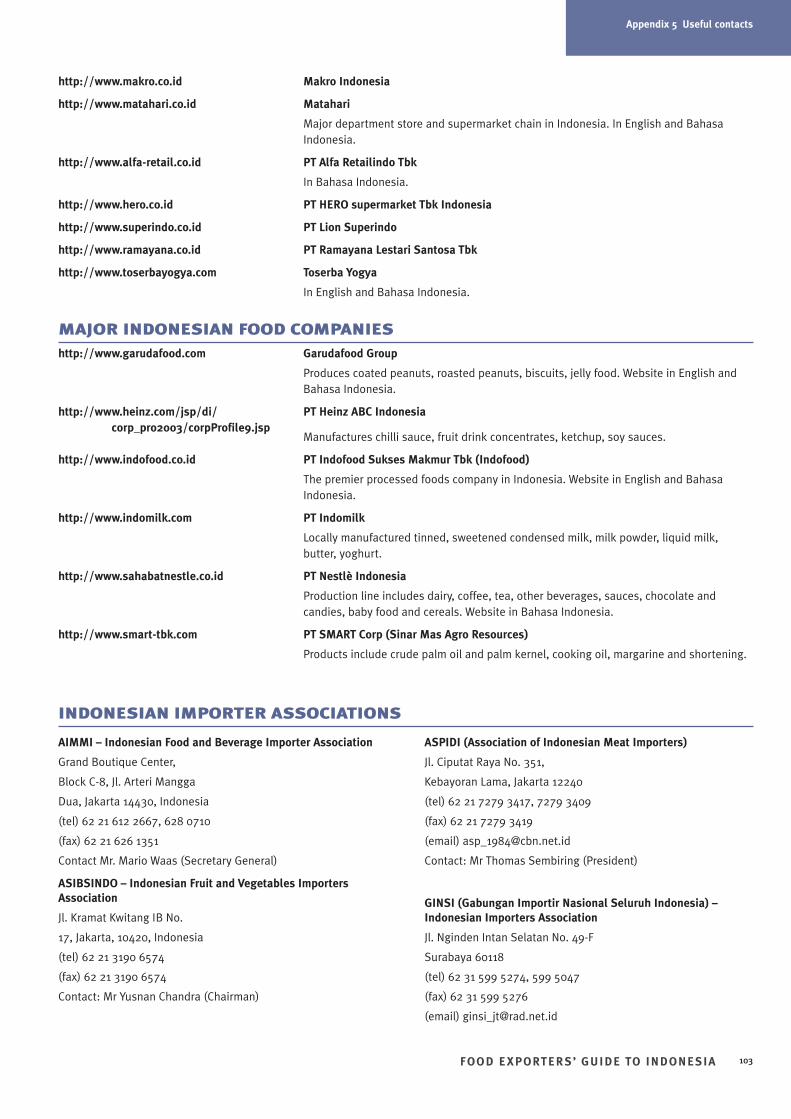
Appendix 5 Useful contacts
FOO D E XPORTER S’ GUIDE TO INDONESIA 103
Appendix 5 Useful contacts
http://www.makro.co.id Makro Indonesia
http://www.matahari.co.id Matahari
Major department store and supermarket chain in Indonesia. In English and BahasaIndonesia.
http://www.alfa-retail.co.id PT Alfa Retailindo Tbk
In Bahasa Indonesia.
http://www.hero.co.id PT HERO supermarket Tbk Indonesia
http://www.superindo.co.id PT Lion Superindo
http://www.ramayana.co.id PT Ramayana Lestari Santosa Tbk
http://www.toserbayogya.com Toserba Yogya
In English and Bahasa Indonesia.
MAJOR INDONESIAN FOOD COMPANIES http://www.garudafood.com Garudafood Group
Produces coated peanuts, roasted peanuts, biscuits, jelly food. Website in English andBahasa Indonesia.
http://www.heinz.com/jsp/di/ PT Heinz ABC Indonesiacorp_pro2003/corpProfile9.jsp
Manufactures chilli sauce, fruit drink concentrates, ketchup, soy sauces.
http://www.indofood.co.id PT Indofood Sukses Makmur Tbk (Indofood)
The premier processed foods company in Indonesia. Website in English and BahasaIndonesia.
http://www.indomilk.com PT Indomilk
Locally manufactured tinned, sweetened condensed milk, milk powder, liquid milk,butter, yoghurt.
http://www.sahabatnestle.co.id PT Nestlè Indonesia
Production line includes dairy, coffee, tea, other beverages, sauces, chocolate andcandies, baby food and cereals. Website in Bahasa Indonesia.
http://www.smart-tbk.com PT SMART Corp (Sinar Mas Agro Resources)
Products include crude palm oil and palm kernel, cooking oil, margarine and shortening.
INDONESIAN IMPORTER ASSOCIATIONS
AIMMI – Indonesian Food and Beverage Importer Association
Grand Boutique Center,
Block C-8, Jl. Arteri Mangga
Dua, Jakarta 14430, Indonesia
(tel) 62 21 612 2667, 628 0710
(fax) 62 21 626 1351
Contact Mr. Mario Waas (Secretary General)
ASIBSINDO – Indonesian Fruit and Vegetables ImportersAssociation
Jl. Kramat Kwitang IB No.
17, Jakarta, 10420, Indonesia
(tel) 62 21 3190 6574
(fax) 62 21 3190 6574
Contact: Mr Yusnan Chandra (Chairman)
ASPIDI (Association of Indonesian Meat Importers)
Jl. Ciputat Raya No. 351,
Kebayoran Lama, Jakarta 12240
(tel) 62 21 7279 3417, 7279 3409
(fax) 62 21 7279 3419
(email) [email protected]
Contact: Mr Thomas Sembiring (President)
GINSI (Gabungan Importir Nasional Seluruh Indonesia) –Indonesian Importers Association
Jl. Nginden Intan Selatan No. 49-F
Surabaya 60118
(tel) 62 31 599 5274, 599 5047
(fax) 62 31 599 5276
(email) [email protected]
Appendix 5 Useful contacts
FOO D E XPORTER S’ GUIDE TO INDONESIA104
Appendix 5 Useful contacts
FOOD IMPORTERS, DISTRIBUTORS AND LOGISTICS PROVIDERS 56
GeneralPT Davids Distribusi Indonesia
J1. Kalimalang, Km 2 Cibitung,
Bekasi 17520 Jawa Barat
(tel) 62 21 883 0810
(fax) 62 21 883 0811
(URL) http://www.davidslogistics.com
Logistics specialists.
PT Diamond Cold Storage
Jl. Pasir putih raya Kav. 1,
Ancol Timur Jakarta 14430
(tel) 62 640 5678 ext. 708, 640 2861
(fax) 62 645 1818, 640 2861A medium sized company that operates cold storage facilities in main centresin Indonesia.
Specialises in meat, milk and dairy products
14 branches in Jakarta, Surabaya, Bali, Makassar, Menado, Medan, Padang,Palembang and Jogyakarta.
Currently imports meat, pasta, yoghurt and other dairy products fromAustralia and also handles some other products including frozen foods anddry goods.
PT Dunia Daging Food Industries
JI. Kenrici IX No. 38, Kebayoran baru,
Jakarta selatan 12120
(tel) 62 21 7279 1980, 739 5202
(fax) 62 21 722 1393
Contact Mr Muharam Santoso ([email protected]) or
Mr Sammy Liunardhy ([email protected])Specialises in boneless beef, beef offal
200 Staff based in Jakarta
Distribution network throughout Indonesia.
PT Indoguna Utama
JI. Taruna No. 8
Pondok Bambu
Jakarta Timur 13430
(tel) 62 21 861 0550
(fax) 62 21 861 0542
Contact Mrs Elizabeth LimanSpecialises in meat, poultry, dairy products, small goods/ fine food products
180 staff in Jakarta
Distribution to hotels, restaurants, supermarkets, meat distributors, retailers.
PT Intermas Tata Trading
JI. Rawa Girang No 3
Kawasan Industri Pulogadung, Jakarta 13260
(tel) 62 21 4602050
(fax) 62 21 4602403 04
Contact Mr Djoko Tata Ibrahim (President Director)Specialises in food products and consumer items
It is part of PT Smart (Sinar Mas Group).
PT Masuya Graha Trikencana
JI. Agung Karya IV Blok B No 22,
Sunter Agung Podomoro Jakarta 14340
(tel) 62 21 650 9130
(fax) 62 21 650 9129, 650 9131
Contact Pinnywati Chandra (Director – [email protected]) orNany Suryadi (Purchasing Manager – [email protected])Diverse range of dry goods, dairy, seafood, meat, beverages
409 staff in offices and warehouses located throughout the major cities of thearchipelago
Distribution to middle-upper food service and retail sectors
Warehouse facilities, refrigerated and dry trucks available.
PT MitIndo Usaha Sejati
Komplek Mangga Dua Plaza,
Block H No.25, JL. Mangga Dua Raya
Jakarta 10730
(tel) 62 21 612 0882
(fax) 62 21 612 1907
Contact Yanuar R. Arief ([email protected])Specialises in halal frozen beef and halal mechanically separated chicken
10 staff in Jakarta
Distribution throughout the meat processing industry.
PT Pangansari Utama
JL. Menteng Raya No. 72
Jakarta Pusat
(tel) 62 21 390 9090
(fax) 62 21 390 9191
Contact Rudy Noezwar (President Director)Specialises in frozen beef
Largest catering and food distribution business in Indonesia with branches inBatam, Medan, Surabaya, Sorong, Makassar, Manado and Balikpapan. Hasown trucks and cold storage facilities.
Big project catering covering many mine sites in Indonesia. Also suppliessupermarkets, hotels and restaurant chains.
56 A number of major food producers do their own distribution. These include a range of large and medium sized processors, such as Heinz ABC, Ultrjaya, Garuda Food, KapalApi Group and Orang Tua Group.
Appendix 5 Useful contacts
FOO D E XPORTER S’ GUIDE TO INDONESIA 105
Appendix 5 Useful contacts
PT Tempo (The Tempo Group)
Bina Mulia II Building 5th Floor
Jl HR.Rasuna Said Kav 11,
Jakarta 12950
(tel) 62 21 520 1858
(fax) 62 21 520 1857
(URL) http://www.thetempogroup.net/pt_tempo.aspSpecialises in the trade and distribution of food and beverages.
PT Tigaraksa Satria
Tira Building 2nd floor
Jl. HR Rasuna Said Kav. B-3 Jakarta 12920
(tel) 62 21 525 6388, 525 4208
(fax) 62 21 522 2414
(email) [email protected]
(URL) http://www.tigaraksa.co.idSpecialises in formulated milk for babies, canned foods
15 branches, 82 sub distributors, 76 000+ outlet coverage
Distribution to supermarkets, hypermarkets, other modern outlets.
PT Wicaksana
Jl Ancol Barat VII Blok A 5D No 2
Jakarta 14430
(tel) 62 21 692 7293
(fax) 62 21 692 7766
(URL) http://www.wicaksana.co.idSpecialises in snack foods, beverages, milk powder, instant noodle andcooking oil
3 900 employees throughout Indonesia
65 distribution centres spread across all major cities in Indonesia .
Approved importer of alcoholic drinks
PT Dharma Niaga
WISMA DHARMA NIAGA
Lt.2 Jln. Abdul Muis No. 6-8-10
Jakarta Pusat – 10160 P.O. BOX 2028
(tel) 62 21 386 3250
(fax) 62 21 386 3249, 386 3214
(URL) http://www.dharma-niaga.com
Registered distributors of alcoholic drinks
PT Bimasena Chemindotama
Jl Buncit Raya 7
JAKARTA 12740
DKI JAKARTA
(tel) 62 21 79192891
(fax) 62 21 7942895
PT Geka Narasutra (Indowines)
Wisma Aldrion Dirgantara
JL. Gatot Subroto
Kav. 72 Suite # 046
Jakarta 12780
(tel) 62 21 799 5660
(fax) 62 21 799 0043
(email) [email protected]
Jl. Tangkuban Perahu
No. 66 KEROBOKAN – BALI
(tel) 62 361 730 088
(fax) 62 361 732 332
(email) [email protected]
PT Esham Dima
Jl Pluit Mas I Bl A/1 A
JAKARTA 14450
DKI JAKARTA
(tel) 62 21 669 3113, 662 7787, 662 7789
(fax) 62 21 669 5803
PT Primera Internusa
Ruko Royal Sunter Bl B/8
JAKARTA 14350
DKI JAKARTA
(tel) 62 21 6519421
PT Trima Nunggal Mandiri Indonesia
(formerly PT Tebet Indraya)
Jl Letjen Haryono MT 9
JAKARTA 12810
DKI JAKARTA
(tel) 62 21 830 3991
(fax) 62 21 830 1357
Appendix 5 Useful contacts
FOO D E XPORTER S’ GUIDE TO INDONESIA106
Appendix 5 Useful contacts
AUSTRALIA-INDONESIA BUSINESS AND OTHER LINKShttp://www.aidabusinessdirectory.com AIDA (Australia-Indonesia Development Area) Business Directory
A joint Australian-Indonesian government initiative to develop closer business links betweenAustralia and Indonesia. The website provides a searchable business directory, has a usefullist of contacts, and a guide to doing business in Indonesia. In English and Bahasa Indonesia.
http://aibc.net.au Australia Indonesia Business Council
The leading bilateral business organisation dealing with Indonesia in Australia. AIBC hasover 600 members. AIBC has a close relationship with both governments and is active inpromoting the business and trade contacts. The site is updated regularly and includesarticles of topical interest to business and all those involved with Indonesia.
APRINDO – Indonesian Retail Merchants Association
E-Trade Building, 3 rd Floor,
Jl. Wahid Hasyim No.55.
Jakarta 10350
(tel) 62 21 315 4241, 392 8545
(fax) 62 21 323 267
Contact: Mr Handaka Santosa (Secretary General)
ASPINDO (Indonesian Mining Services Association)
(tel) 62 21 460 2015
(fax) 62 21 460 1916
GAPPINDO (Gabungan Pengusaha Perikanan Indonesia) –Association of Indonesian Fishing Companies
Wisma Sakura Lantai 2
Jl. Hati Suci No. 4 Taman Kebon Sirih,
Jakarta Pusat
(tel) 62 21 391 0481
(fax) 62 21 391 0481
Indonesian Fish Cannery Association
Jl. Cipinang Indah Raya No. 1
Jakarta 13420
(tel) 62 21 819 6910
(fax) 62 21 850 8587
Contact: Hendri Sutandinata (MBA, Chairman)
Indonesian Food and Beverages Association (GAPMMI)
Duta Mas Fatmawati Blok DI / No. 30
JI. RS Fatmawati Jakarta 12150
(tel) 62 21 723 0091, 723 0391
(fax) 62 21 723 0091
Indonesian Sugar Association (Asosiasi Gula Indonesia)
JI. Teuku Cik Ditiro No. 4
Jakarta 10350
(tel) 62 21 310 1912, 390 4528
(fax) 62 21 390 4528
Indonesian Hotel and Restaurant Association (Perhimpunan Hotel dan Restoran Indonesia)
Wisma Nugra Santana, 4th Floor
JI. Jend. Sudirman Lav. 8
Jakarta 10220
(tel) 62 21 570 5110
(fax) 62 21 570 6888
IMA (Indonesian Mining Association)
(tel) 62 21 830 9963, 8370 5657
(fax) 62 21 830 9963
(URL) www.ima-api.com
IPS – Dairy Processor Association
Wisma Nestle. Arcadia
Office Park, Jl. Letjen T.B.
Simatupang Kav 88, Jakarta 12520
(tel) 62 21 7883 6000
(fax) 62 21 7883 6001
Contact: Mr Sabana (Director), Ms Debora Rukmawati (Secretary)
Milk Entrepreneur Union
C/O PT Nestlè Indonesia
JI. T.B. Simatupang No. 88
Jakarta 12520
(tel) 62 21 7883 6000
(fax) 62 21 7883 6001
The Jakarta Wine and Spirits Circle
Kemang Duty-Free
JI. Bangka Raya 8 A-B
Jakarta Selatan
(tel) 62 21 719 4309, 799 8641, 799 8642
(fax) 62 21 799 8638, 719 4324
Union of Indonesian Dairy Co-Operatives (GKSI)
JI. Prof. DR. Supomo SH. No. 178
Jakarta 12870
(tel) 62 21 830 5849
(fax) 62 21 829 0851
INDONESIAN INDUSTRY ASSOCIATIONS
Appendix 5 Useful contacts
FOO D E XPORTER S’ GUIDE TO INDONESIA 107
Appendix 5 Useful contacts
Australian and New Zealand Association (ANZA)
(tel/fax) 62 21 751 3509
http://www.iabc.nlc.net.id Indonesia Australia Business Council
National Office Jakarta
(tel) 62 21 521 1540
(fax) 62 21 521 1541
http://www.iabc.or.id/links.html Indonesia-Australia Business Council – links
Useful Links to Australian and Indonesian sources of information on Indonesia.
http://www.halalaustralia.com Halal Australia
A ‘one-stop shop’ through which Australian and overseas food buyers can contact Australiancompanies producing halal-certified food.
http://www.ikama.or.id IKAMA (Alumni of Australian Universities)
(tel) 62 21 521 3317
(fax) 62 21 521 3318
AUSTRALIAN GOVERNMENThttp://www.dfat.gov.au/bali Australian Consulate in Bali
(tel) 62 361 235 093, 235 092 (fax) 62 631 231 990
http://www.austembjak.or.id Australian Embassy in Jakarta
(tel) 62 21 2550 5555 (fax) 62 21 522 7103
http://www.daff.gov.au Australian Government Department of Agriculture, Fisheries and Forestry
(tel) 61 2 6272 3933
http://www.efic.gov.au Australian Government Export Finance and Insurance Corporation
(tel) 61 2 9201 2111 (fax) 61 2 9251 3851
http://www.dfat.gov.au Australian Government Department of Foreign Affairs and Trade
(tel) 61 2 6261 1111 (fax) 61 2 6261 3111
http://www.austrade.gov.au Austrade Office in Jakarta
(tel) 62 21 2550 5344 (fax) 62 21 522 7103
http://www.austrade.gov.au Austrade Office in Medan
(tel) 62 61 416 7810, 455 4504 (fax) 62 61 415 6820
http://www.austrade.gov.au Austrade Office in Surabaya
(tel) 62 31 531 9191, 547 1754 (fax) 62 31 531 9288
http://www.aqis.gov.au Australian Quarantine and Inspection Service
(tel) 61 2 6272 3933
http://www.tradewatch.dfat.gov.au Tradewatch – provides detailed country business information.
ISLAMIC ASSOCIATIONS IN AUSTRALIAThe Australian Federation of Islamic Councils Inc. (AFIC)
932 Bourke Street, Zetland NSW 2017
(tel) 61 2 9698 8891 (fax) 61 2 9319 0159
The Islamic Coordinating Council of Victoria Inc. (ICCV)
155 Lygon Street, East Brunswick VIC 3057
(tel) 61 3 9380 5467 (fax) 61 3 9380 6143
Supreme Islamic Council of Halal Meat in Australia (SICHMA)
149 Auburn Road, Auburn NSW 2144
(tel) 61 2 9646 1222 (fax) 61 2 9646 1011
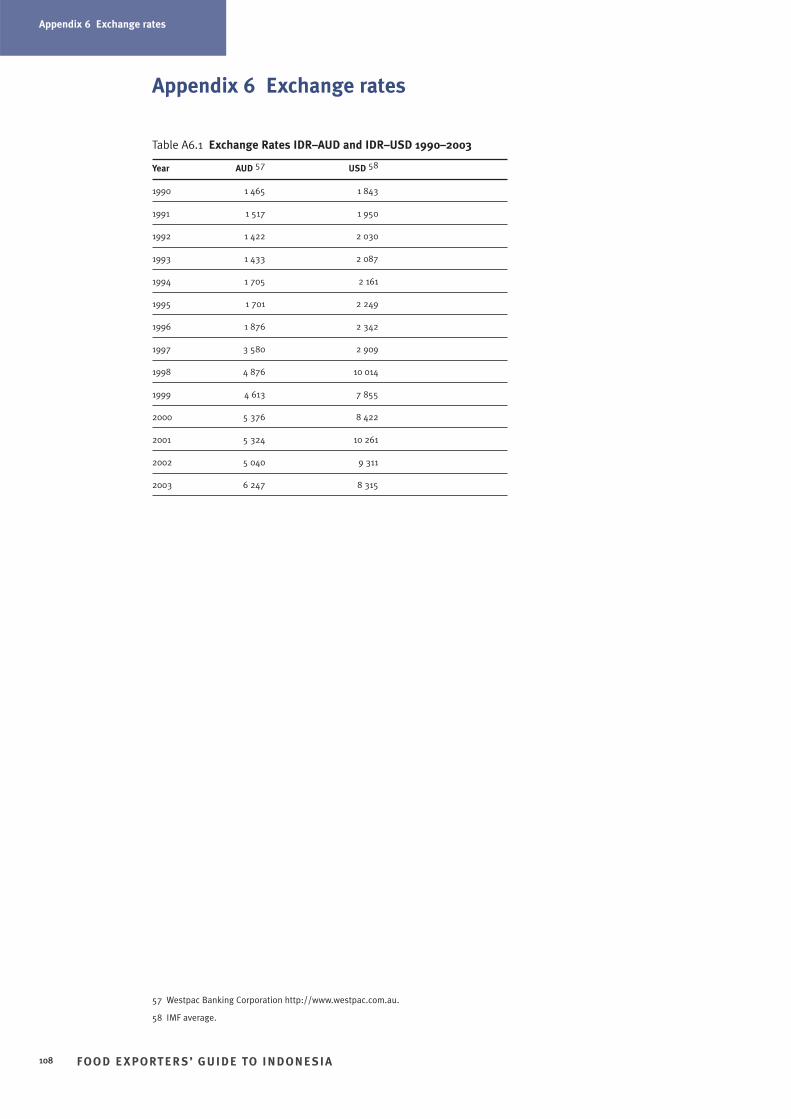
Appendix 6 Exchange rates
FOO D E XPORTER S’ GUIDE TO INDONESIA108
Appendix 6 Exchange rates
Table A6.1 Exchange Rates IDR–AUD and IDR–USD 1990–2003
Year AUD 57 USD 58
1990 1 465 1 843
1991 1 517 1 950
1992 1 422 2 030
1993 1 433 2 087
1994 1 705 2 161
1995 1 701 2 249
1996 1 876 2 342
1997 3 580 2 909
1998 4 876 10 014
1999 4 613 7 855
2000 5 376 8 422
2001 5 324 10 261
2002 5 040 9 311
2003 6 247 8 315
57 Westpac Banking Corporation http://www.westpac.com.au.
58 IMF average.
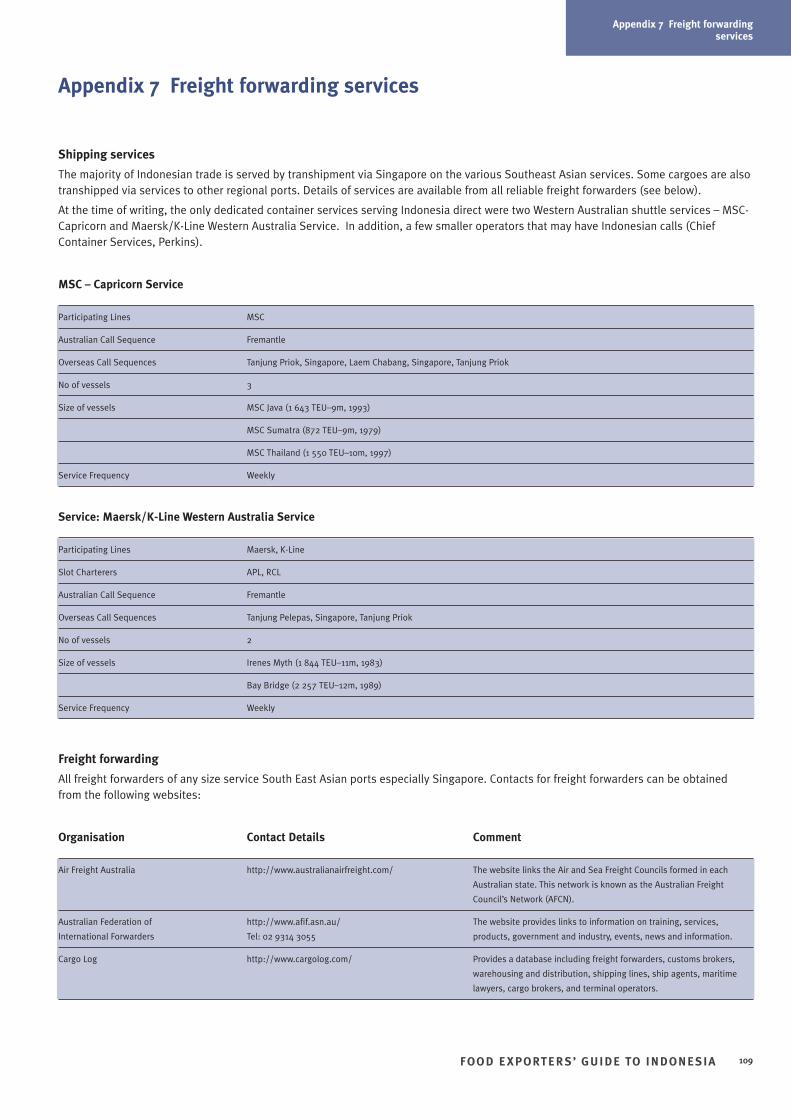
Appendix 7 Freight forwardingservices
FOO D E XPORTER S’ GUIDE TO INDONESIA 109
Appendix 7 Freight forwarding services
Shipping services
The majority of Indonesian trade is served by transhipment via Singapore on the various Southeast Asian services. Some cargoes are alsotranshipped via services to other regional ports. Details of services are available from all reliable freight forwarders (see below).
At the time of writing, the only dedicated container services serving Indonesia direct were two Western Australian shuttle services – MSC-Capricorn and Maersk/K-Line Western Australia Service. In addition, a few smaller operators that may have Indonesian calls (ChiefContainer Services, Perkins).
MSC – Capricorn Service
Participating Lines MSC
Australian Call Sequence Fremantle
Overseas Call Sequences Tanjung Priok, Singapore, Laem Chabang, Singapore, Tanjung Priok
No of vessels 3
Size of vessels MSC Java (1 643 TEU–9m, 1993)
MSC Sumatra (872 TEU–9m, 1979)
MSC Thailand (1 550 TEU–10m, 1997)
Service Frequency Weekly
Service: Maersk/K-Line Western Australia Service
Participating Lines Maersk, K-Line
Slot Charterers APL, RCL
Australian Call Sequence Fremantle
Overseas Call Sequences Tanjung Pelepas, Singapore, Tanjung Priok
No of vessels 2
Size of vessels Irenes Myth (1 844 TEU–11m, 1983)
Bay Bridge (2 257 TEU–12m, 1989)
Service Frequency Weekly
Freight forwarding
All freight forwarders of any size service South East Asian ports especially Singapore. Contacts for freight forwarders can be obtainedfrom the following websites:
Organisation Contact Details Comment
Air Freight Australia http://www.australianairfreight.com/ The website links the Air and Sea Freight Councils formed in each
Australian state. This network is known as the Australian Freight
Council’s Network (AFCN).
Australian Federation of http://www.afif.asn.au/ The website provides links to information on training, services,
International Forwarders Tel: 02 9314 3055 products, government and industry, events, news and information.
Cargo Log http://www.cargolog.com/ Provides a database including freight forwarders, customs brokers,
warehousing and distribution, shipping lines, ship agents, maritime
lawyers, cargo brokers, and terminal operators.
Bibliography
FOO D E XPORTER S’ GUIDE TO INDONESIA110
Bibliography
Bibliography
Abrahams M, Indonesia country profile, Presentation, Austrade, Canberra, 2003, viewed 15 December 2003,<http://www.austrade.gov.au>.
AC Nielsen, AC Nielsen Retail Census 1998–2001, 2001.
AC Nielsen, AC Nielsen SES Data, 2003.
Agriculture and Agri-Food Canada, Indonesia – at a glance: Trade Statistics, Agriculture and Agri-Food Canada,Ottawa, 2004, viewed 5 January 2004, <http://ats.agr.ca/stats/indonesia_e.htm>.
AIG Online, Economist Intelligence Unit, 2003, viewed 12 December 2003, <http://home.aigonline.com/>.
Asian Development Bank, Indonesia’s Economic Growth to Slow Down Slightly in 2002, Asian Development Bank,Manila, 2002, viewed 20 September 2003, <http://www.adb.org/Documents/News/2002/nr2002043.asp>.
Austrade, Canberra, 2003, viewed 10 August 2003, <http://www.austrade.gov.au>.
Austrade, Export Update, Austrade, Canberra, 2003.
Australian Bureau of Agricultural and Research Economics, Australian Food Statistics 2003, Australian GovernmentDepartment of Agriculture, Fisheries and Forestry, Canberra, 2003.
Australian Bureau of Statistics, International Merchandise Trade, Australia, cat. no. 5422.0, ABS, Canberra, 2003.
Australian Bureau of Statistics, International Trade Statistics – Exports AHECC 2 digit level – Indonesia 1992, 1997,2002, ABS, Canberra, 2003.
Australian Bureau of Statistics, International Trade Statistics – Exports AHECC 8 digit level – Indonesia 1992, 1997,2002, ABS, Canberra, 2003.
Australian Wine and Brandy Corporation, Australian Wines Approved for Export, Adelaide, 2004.
Badan Koordinasi Penanaman Modal, 2003, viewed 10 September 2003, <http://www.bkpm.go.id/>.
Badan Koordinasi Penanaman Modal, Investment Board Casts Doubt About Prospect in 2004, 2004, viewed 12February 2004, <http://www.bkpm.go.id/en/board.php?mode=baca&message_id=210>.
Biro Pusat Statistik, 2000 Population Census, Statistics Indonesia, Jakarta, 2000.
Biro Pusat Statistik, Expenditure for Consumption of Indonesia 2002, Statistics Indonesia, Jakarta, 2002.
Biro Pusat Statistik, Indonesia Statistical Yearbook 1993, Indonesian Bureau of Statistics, Jakarta, 1993.
Biro Pusat Statistik, Indonesia Statistical Yearbook 2002, Statistics Indonesia, Jakarta, 2002.
Biro Pusat Statistik, Tourism Statistics, Statistics Indonesia, Jakarta, 2003.
Canadian Department of Foreign Affairs and International Trade, Opening Doors to the World: Canada’sInternational Market Access Priorities – 2003, DFAIT, Ottawa, 2003, viewed 24 November 2003, <http://www.dfait-maeci.gc.ca/tna-nac/2003/cimap-en.pdf>.
Centre for Agricultural Quarantine, Jakarta, 2003, viewed 20 October 2003,<http://www.deptan.go.id/CAQ/index.htm>.
CIA World Factbook, Indonesia, Central Intelligence Agency, 2003, viewed 19 August 2003,<http://www.odci.gov/cia/publications/factbook/geos/id.html>.
Consensus Economics, London, 2003, viewed 19 August 2003, <http://www.consensuseconomics.com/>.
Countrywatch, Indonesia, Countrywatch, Houston, 2004, viewed 5 January 2004,<http://www.countrywatch.com/cw_country.asp?vCOUNTRY=79>.
Department of Foreign Affairs and Trade, Canberra, 2003, viewed 5 September 2003, <http://www.dfat.gov.au/>.
Department of Foreign Affairs and Trade, Subsistence to Supermarket II: Agrifood Globalisation and Asia Volume III:Asian Agrifood Demand Trends and Outlook 2001–2010, Department of Foreign Affairs and Trade, Canberra, 2004.
Directorate General of Customs and Excise, Indonesia, 2003, viewed 10 September 2003,<http://www.beacukai.go.id/english/>.
East Asia Analytical Unit, Indonesia – Facing the Challenge, Department of Foreign Affairs and Trade, Canberra,2000.
Bibliography
FOO D E XPORTER S’ GUIDE TO INDONESIA 111
Bibliography
Easton K, Bell G and Ng F, Exporting Food to Indonesia: A Guide for Australian Small to Medim Enterprises, CSIROand RIRDC, Sydney, 1997.
Euromonitor, Packaged Food in Indonesia, London, 2003, viewed October 2003,<http://www.euromonitor.com/Packaged_Food_in_Indonesia>.
Export Finance and Insurance Corporation, Sydney, 2003, viewed 10 December 2003, <http://www.efic.gov.au/>.
FAOSTAT Statistical Databases, Food and Agriculture Organisation of the United Nations, 2003, viewed 2 October2003, <http://apps.fao.org/>.
Forrest W and Bidgood M, Cultural Aspects of Business, American Indonesian Chamber of Commerce, New York,2003, viewed 24 November 2003, <http://www.aiccusa.org/cultas.htm>.
GAPMMI, Indonesian Food and Beverage Industry Association, 2003.
Harcourt T, Let’s stick together: Australia’s trade ties with Indonesia, Austrade, Canberra, 2003, viewed 25 August2003, <http://www.austrade.gov.au/>.
Hudion U, ‘Government to implement national ecolabeling plan’, The Jakarta Post, Jakarta, 27 November 2003.
Indocommercial, N.322, Jakarta, 4 June, 2003.
Indonesian Ministry of Industry and Trade, Jakarta, 2003, viewed 4 November 2003, <http://www.dprin.go.id/>.
INSTATE Pty Ltd, An Examination of the Accumulator Approach: An Export Marketing Solution for Small Business,INSTATE Pty Ltd, Sydney, 1998.
INSTATE Pty Ltd, Supermarket and Retailing Infrastructure Development in Indonesia: Implications for AustralianAgri-food Exports, RIRDC Research Paper No 95/9, Sydney, 1995.
International Monetary Fund, Indonesia: Eleventh Review Under the Extended Arrangement – Staff Report; andPress Release on the Executive Board Discussion, IMF Country Report No. 04/18, January 2004, Washington DC,2004.
International Monetary Fund, Washington, 2003, viewed 20 August 2003, <http://www.imf.org/>.
Kejaksaan Agung, Jakarta, 2003, viewed 3 November 2003, <http://www.kejaksaan.go.id/>.
Laksamana.Net, Steer Points at Possible 6% Growth, Laksamana.Net, Jakarta, 2003, viewed 19 December 2003,<http://www.laksamana.net/>.
McIntyre A and Resosudarmo B, ‘Survey of Recent Developments’, Bulletin of Indonesian Economic Studies,Australian National University, Canberra, August, 2003.
Meyrick and Associates, Liner Shipping Services to Indonesia, Wollongong, 2003.
Montana Department of Agriculture, Indonesian Food and Beverage Market, Montana Department of Agriculture,Montana, 1999, viewed 10 October 2003, <http://agr.state.mt.us/business/tradePDF/INDOlong.pdf>.
National Standardisation Agency, Jakarta, 2003, viewed 12 December 2003, <http://www.bsn.or.id/>.
New Zealand Trade and Enterprise, Indonesia Country Brief August 2003, New Zealand Trade and Enterprise,Wellington, 2003, viewed 12 November 2003, <http://www.marketnewzealand.com/common/files/indonesia-cb.pdf>.
PT Davids Distribusi Indonesia, Improving Supply Chains, Powerpoint Presentation, Jakarta, 2003.
PT Indofood Sukses Makmur Tbk, PT Indofood Sukses Makmur Tbk Annual Report 2002, Jakarta, 2002.
Ray DJ, ‘Survey of Recent Developments’, Bulletin of Indonesian Economic Studies, no. 3, Australian NationalUniversity, Canberra, December 2003.
Shari M, ‘Unilever Indonesia: Using all the levers’, Business Week, 19 March, 2003.
The Islamic Food and Nutrition Council of America, What is Halal, Chicago, 2003, viewed 5 January 2004,<http://www.ifanca.org/halal.htm>.
United Nations Development Program, Bali: Beyond the Tragedy – Impact and Challenges for Tourism-ledDevelopment in Indonesia, UNDP, Indonesia, 2003.
United States Department of Agriculture Foreign Agricultural Service, Indonesia Dairy and Products Annual 2003,Global Agriculture Information Network Report #ID3009, Jakarta ATO, 2003.
Bibliography
FOO D E XPORTER S’ GUIDE TO INDONESIA112
Bibliography
United States Department of Agriculture Foreign Agricultural Service, Indonesia Exporter Guide Annual 2002,Global Agriculture Information Network Report #ID2027, Jakarta ATO, 2002.
United States Department of Agriculture Foreign Agricultural Service, Indonesia Food Processing Ingredients SectorReport 2003, Global Agriculture Information Network Report #ID3022, Jakarta ATO, 2003.
United States Department of Agriculture Foreign Agricultural Service, Indonesia HRI Food Service Sector Report2003, Global Agriculture Information Network Report #ID3001, Jakarta ATO, 2003.
United States Department of Agriculture Foreign Agricultural Service, Indonesia Retail Food Sector Report, GlobalAgriculture Information Network Report #ID2035, Jakarta ATO, 2002.
United States Department of Agriculture Foreign Agricultural Service, Indonesian Exporter Guide 1999, GlobalAgriculture Information Network Report ID#9087, Jakarta ATO, 1999.
United States Department of Agriculture Foreign Agricultural Service, Indonesian Exporter Guide 2003, GlobalAgriculture Information Network Report #ID3024, Jakarta ATO, 2003.
United States Department of Agriculture Foreign Agricultural Service, Indonesian Grain and Feed Annual 1999,Global Agriculture Information Network Report #ID9031, Jakarta ATO, 1999.
Villanueva J, SMC mounting another bid for Salims’ Indofood, ABS–CBN News.com, 2003, viewed 14 December2003, <http://www.abs-cbnnews.com>.
World Bank Group, Indonesia Country Profile, Washington, 2003, viewed 12 October 2003,<http://www.worldbank.org/data/countrydata/aag/idn_aag.pdf>.
World Bank Group, Indonesia: Sustaining Development: A World Bank Country Study, The World Bank Group,Washington, 1994.
World Bank Group, World Development Indicators 2002, The World Bank Group, Washington, 2002.
Transparency International, Berlin, 2003, viewed 12 December 2003, <http://www.transparency.org>.World TradeOrganisation, Trade Policy Review Indonesia – A Report by the Secretariat, WTO, 28 May 2003.
World Trade Organisation, WTO Goods Schedules – Members’ Commitments, 2003, viewed 12 October 2003,<http://www.wto.org/english/tratop_e/schedules_e/goods_schedules_e.htm>.
World Travel and Tourism Council, Indonesia: Travel and Tourism – A World of Opportunity, The 2003 Travel andTourism Economic Research, London, 2003.
D E P A R T M E N T O F A G R I C U L T U R E , F I S H E R I E S A N D F O R E S T R Y
Food Exporters’ Guideto Indonesia
A Handbook
This handbook provides an overview of the Indonesian foodmarket. It provides exporters with detailed practicalinformation about this important market, drawing on
fieldwork and a wide range of Indonesian, Australian andinternational sources. It provides information about
consumer trends, the retail and food service sector, supplychains to market, the business and broader political andeconomic environment, trade data and useful sources of
further information.
Instate Pty Ltd prepared the report for the Australian Government
Department of Agriculture, Fisheries and Forestry.
Enclosed in this handbook is a CD to assist companies with marketing their
products, which was funded by the Australian Government’s New Industries
Development Program.
An on-line copy of the handbook can be accessed via
www.daff.gov.au/foodinfo
The Australian Government Department of Agriculture, Fisheries and
Forestry has portfolio responsibility for increasing the profitability,
competitiveness and sustainability of the Australian food industry.
For further information or to provide feedback please contact:
Food Policy and Communications SectionAustralian Government Department of Agriculture,
Fisheries and ForestryEmail: [email protected]
Phone: 02 6272 4161 Fax: 02 6272 4367