FOOD & ENERGY Dawood Hercules is a partner in Pakistan’s growth and prosperity, and this ethos...
238
Transcript of FOOD & ENERGY Dawood Hercules is a partner in Pakistan’s growth and prosperity, and this ethos...


Dawood Hercules is a partner in Pakistan’s growth and prosperity, and this ethos serves as the foundation of our business operations. Energy, agriculture and food sectors are the strongest drivers of Pakistan’s economic growth, and are therefore the core areas of investment for our group. We are a holding company founded on family values. This allows us to deploy capital and invest in people and partnerships over a long period of time to solve two of the most pressing issues the world is facing today: making food and energy available, affordable and sustainable.
FOOD & ENERGY
MAKING
AVAILABLE, AFFORDABLE, SUSTAINABLE

42 Notice of annual general meeting56 Directors’ Report56 Economic scenario57 Business overview58 Financial performance58 Earnings per share58 Auditors58 Shares traded59 Pattern of shareholding59 Market capitalization & book value59 Appropriation59 Entity rating59 Contribution to the national exchequer and economy59 Provident & gratuity funds 59 Board of Directors 59 Board meetings 60 Statement of directors’ responsibility
60 Directors training programme 60 Related party transactions 60 Future outlook 61 Acknowledgment 66 Review report on statement of compliance 67 Statement of compliance 72 Financial Statements 73 Auditor’s report to the members 74 Financial statements 79 Notes to the financial statements 109 Consolidated financial statements111 Auditor’s report 112 Consolidated financial statements 119 Notes to the consolidated financial statements 217 Pattern of shareholding 221 Form of proxy233 Directors' Report (Urdu)
CONTENTS03 Vision 03 Purpose08 Business ethics and core values12 Performance highlights16 Company information20 Board of Directors27 Committees30 Operating Highlights30 Six years at a glance32 Horizontal analysis (Balance sheet)34 Vertical analysis (Balance sheet)36 Horizontal analysis (Profit & loss)36 Vertical analysis (Profit & loss)38 Statement of value addition
ronaldinayat
Typewritten Text
ronaldinayat
Typewritten Text
ronaldinayat
Typewritten Text
All Rights Reserved. No part of this publication may be reproduced without the prior written permission of the publisher. © 2017, Dawood Hercules Corporation Limited

FOOD & ENERGY
MAKING
AVAILABLE, AFFORDABLE, SUSTAINABLE
2 Dawood Hercules Corporation Limited

PURPOSEFood and Energy security is inextricably linked to economic empowerment
Population and GDP growth is putting more pressure on the existing supply of food and energy. Thus we believe that achieving our vision will require supply side innovation to improve productivity
We have a long track record of improving efficiencies and productivity in both these sectors
We believe in deep collaboration between group companies that will allow us to innovate in ways others can’t, and we will only participate in markets where we can make a significant contribution. We are not going to settle for anything less than excellence in every aspect of our work
VISIONTo make food and energy available, affordable and sustainable for the developing world via pairing capital with capability and with ideas that will have the biggest impact.
Annual Report 2016 3

OUR BUSINESSES
Engro Powergen
Laraib Energy (Hubco)
Engro Fertilizers
Sindh Engro Coal Mining Company
Engro Elengy Terminal
4 Dawood Hercules Corporation Limited

Engro Polymer & Chemicals
Engro Vopak TerminalHub Power Plant, Hub
Engro Foods
Hubco Narowal Plant
Tenaga Generasi Limited
Reon Energy Limited (200.07 kW solar project
at Unilever Foods)
Annual Report 2016 5

FOOD & ENERGY
MAKING
AVAILABLE, AFFORDABLE, SUSTAINABLE
6 Dawood Hercules Corporation Limited

PROBLEM WORTH SOLVINGThere is over 7,000 MW power deficit at current level of demand
OUR CURRENT INPUTWe supply over 1,800 MW of electricity today, and have a combined investment plan to augment 2,700MW in new power
Annual Report 2016 7

BUSINESS ETHICS & CORE VALUES
This statement of Business Ethics and Core Values constitutes the basis on which Dawood Hercules Corporation Limited conducts its business. The Board of Directors and the employees of Dawood Hercules Corporation Limited are the custodians of the excellent reputation for conducting our business according to the highest principles of business ethics.
Our reputation not only affects whether or not someone will do business with us, it also determines whether we are proud to be associated with this Company.
We are committed to conducting our business activities in honest and sincere alignment with our Core Values and in full compliance with all the applicable laws and regulations. We also believe in treating our employees with the same principles in order to build mutual respect, confidence and trust based upon integrity, honesty, openness and competence.
In order to maintain and enhance our reputation for integrity in our business, it is important for all of us individually and collectively to adhere to the highest moral, ethical and legal standards.
8 Dawood Hercules Corporation Limited

CORE VALUES
At Dawood Hercules Corporation Limited, all our actions are based on and guided by the following values:
AccountabilityWe will be accountable as individuals and as employees for our ethical conduct and for compliance with applicable laws
and policies and directives of the management.
DiversityWe respect the dignity, rights and views of others and will provide unrestricted opportunity for personal advancement to employees irrespective of gender,
ethnicity, beliefs, cultures and religions.
TeamworkWe are committed to work as a team
to achieve common goals whilst fairly recognising and rewarding individual contributions on merit.
Commitment to Excellence
We will drive and achieve results while pursuing the highest standards and maximizing the use of resources.
IntegrityWe will conduct ourselves with
uncompromising ethics and honesty at all times, in all situations, both professionally and personally.
Annual Report 2016 9

FOOD & ENERGY
MAKING
AVAILABLE, AFFORDABLE, SUSTAINABLE
10 Dawood Hercules Corporation Limited

PROBLEM WORTH SOLVINGPakistan is facing a shortfall of 2,000 million cubic feet of natural gas per day (mmcfd)
OUR CURRENT INPUTOur state-of-the-art LNG terminal has injected 600 mmcfd in the system, bridging the country’s gas shortfall by 30%, reviving 500+ industrial units, reviving 600 CNG stations, paving the way for 1,200 mmcfd more
Annual Report 2016 11
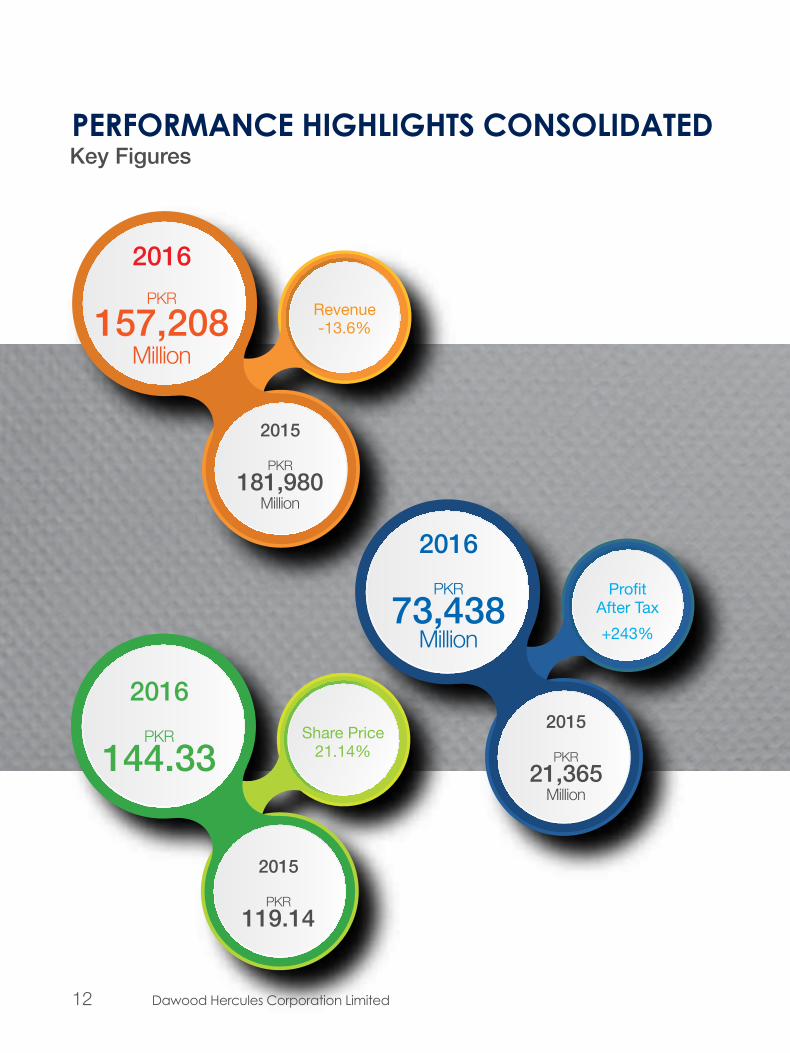
Key Figures
Revenue -13.6%
Profit After Tax +243%
Share Price 21.14%
2015
Million
PKR 181,980
2015
Million
PKR 21,365
2015
PKR 119.14
Million
PKR
157,208
2016
Million
PKR
73,438
2016
PKR
144.33
2016
PERFORMANCE HIGHLIGHTS CONSOLIDATED
12 Dawood Hercules Corporation Limited

Shareholders Equity
86.25%
PACRA Rating
(Long Term)
Distribution
2015
Million
PKR 92,867
2015
AA-
2015
PKR 16
Million
PKR
172,962
2016
AA-2016
PKR
15.5
2016
Per Share
Per Share
Annual Report 2016 13

17.02.2016 - Dominic Barton, Global Managing Director, McKinsey & Co. as Eminent Speaker at Karachi School of Business & Leadership
08.09.2016 – Wang Binghua, Chairman, State Power Investment Company and JV partners from China Power Hub Power Generation Company
14 Dawood Hercules Corporation Limited
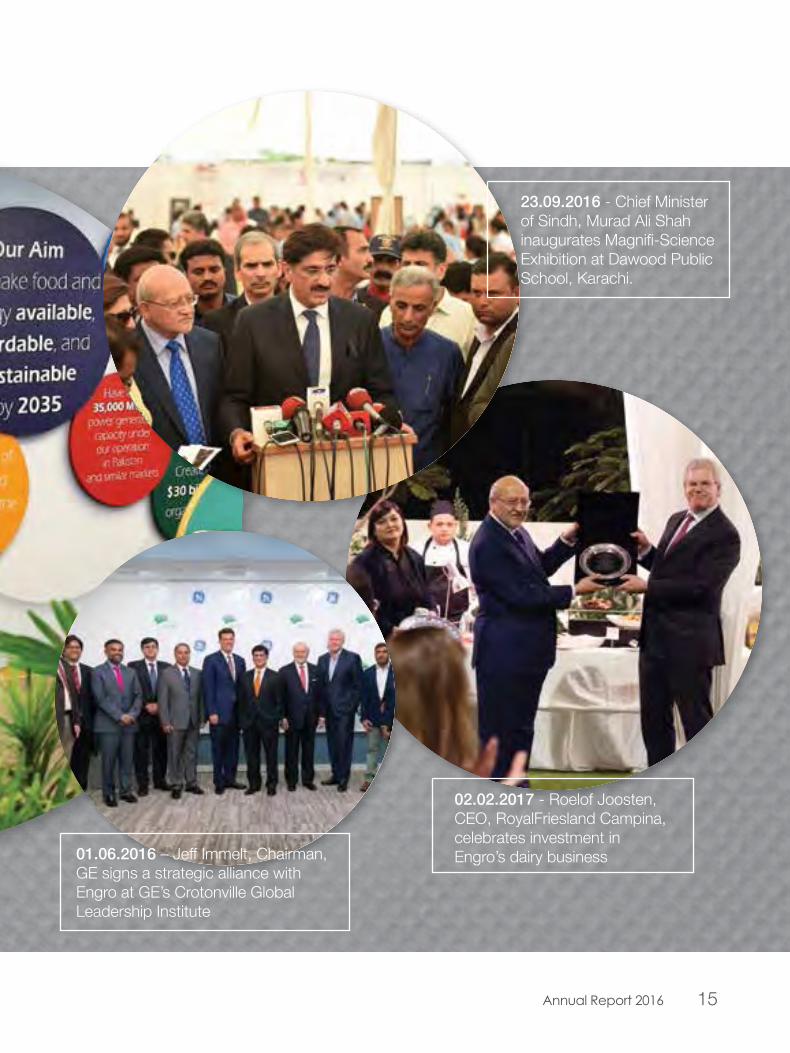
01.06.2016 – Jeff Immelt, Chairman, GE signs a strategic alliance with Engro at GE’s Crotonville Global Leadership Institute
02.02.2017 - Roelof Joosten, CEO, RoyalFriesland Campina, celebrates investment in Engro’s dairy business
23.09.2016 - Chief Minister of Sindh, Murad Ali Shah inaugurates Magnifi-Science Exhibition at Dawood Public School, Karachi.
Annual Report 2016 15

COMPANY INFORMATION
Board of DirectorsMr. Hussain Dawood - ChairmanMr. Inam ur Rahman - Chief Executive OfficerMr. M. Abdul Aleem - DirectorMr. Shahzada Dawood - DirectorMr. Samad Dawood - DirectorMs. Sabrina Dawood - DirectorMr. Parvez Ghias - DirectorMr. Shabbir Hussain Hashmi - DirectorMr. Frank Murray Jones - DirectorMr. Hasan Reza Ur Rahim - DirectorMr. Saad Raja - Director
Board Audit CommitteeMr. M. Abdul Aleem - ChairmanMr. Parvez Ghias - MemberMr. Hasan Reza Ur Rahim - Member
Board Compensation CommitteeMr. Hussain Dawood - ChairmanMr. M. Abdul Aleem - MemberMr. Parvez Ghias - Member
Chief Financial Officer & Company SecretaryMr. Shafiq Ahmed
Registered OfficeDawood Centre, M.T. Khan Road Karachi-75530Tel: +92 (21) 35686001Fax: +92 (21) 35633972Email: [email protected]: www.dawoodhercules.com
Bankers Bank Al-Habib LimitedHabib Bank LimitedAllied Bank LimitedUnited Bank LimitedHabib Metropolitan Bank LimitedMCB Islamic Bank Limited
16 Dawood Hercules Corporation Limited

AuditorsA.F. Ferguson & Co. Chartered AccountantsState Life Building No 1-C I.I. Chundrigar RoadP.O. Box 4716, Karachi- 74000Tel: +92 (21) 32426682-6Fax: +92 (21) 32415007, 32427938
Shares RegistrarFAMCO Associates (Private) Limited8-F, Next to Hotel Faran, Nursery, Block 6P.E.C.H.S, Shahrah-e-Faisal, KarachiTel: +92 (21) 34380101-2, Fax: +92 (21) 34380106
Tax ConsultantsA.F. Ferguson & Co.Chartered AccountantsState Life Building No 1-C I.I. Chundrigar RoadP.O. Box 4716, Karachi- 74000Tel: +92 (21) 32426682-6Fax: +92 (21) 32415007, 32427938
Legal AdvisorsHaidermotaBNR & Co.(Barristers at law)D-79, Block – 5, Clifton KDA Scheme No.5Karachi- 75600Tel: +92 (21) 111520000, 35879097Fax: +92 (21) 35862329, 35871054
Annual Report 2016 17

FOOD & ENERGY
MAKING
AVAILABLE, AFFORDABLE, SUSTAINABLE
18 Dawood Hercules Corporation Limited
PROBLEM WORTH SOLVING220 million citizens are waiting for electricity to be affordably generated from locally available source of fuel to light up their homes, roads, and the industries
OUR CURRENT INPUTWe have achieved financial close of our mining operations in interior Sindh, creating over 1,000 jobs, with improved quality of life for the community towards a better, brighter Thar
Annual Report 2016 19
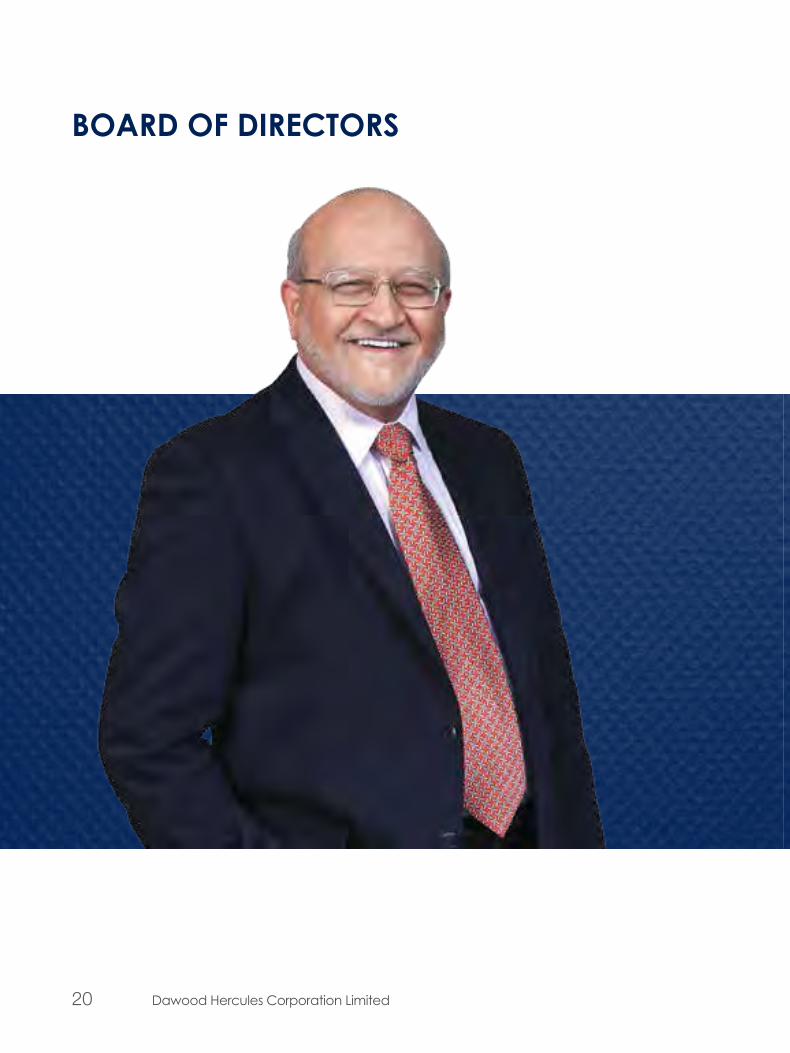
BOARD OF DIRECTORS
20 Dawood Hercules Corporation Limited

A Pakistani industrialist and ardent philanthropist, Hussain Dawood currently chairs the boards of Dawood Hercules Corporation, the group’s holding company; Engro Corporation, a diversified conglomerate; Hub Power Company, an independent power producer; Karachi Education Initiative, which funds the graduate management school Karachi School of Business & Leadership, and The Dawood Foundation, with its legacy of establishing various education institutions across the country.
His social responsibilities include Memberships of the World Economic Forum and its Global Agenda Councils of Anti-Corruption and Education. He was conferred the award “Ufficiale Ordine Al merito della Repubblica Italiana” by the Republic of Italy. Hussain Dawood holds an MBA from the Kellogg School of Management, Northwestern University, USA, and is a graduate in Metallurgy from Sheffield University, UK.
Hussain DawoodChairman
Annual Report 2016 21

Inam ur Rahman, CEO
Inam ur Rahman is currently the Chief Executive Officer at Dawood Hercules Corporation. In the recent past, he has led the renewable businesses of the Dawood Group as CEO of Reon Energy Ltd. and Tenaga Generasi Ltd. With more than 25 years of professional experience Mr Rahman showcases his diverse business expertise dominating a wide spectrum of industries which include renewable energy, food sciences & production, textiles, fashion & apparel, lifestyle, and business consultancy. His portfolio of directorships includes Engro Corporation Ltd., Hub Power Company Ltd., Sui Northern Gas Pipelines Ltd., Dawood Hercules Chemicals Ltd., Dawood Lawrencepur Limited, Sind Engro Coal Mining Company, Laraib Energy Ltd., SACH International Ltd., and Pebbles Private Ltd. He holds a Bachelors of Electronic Engineering from University of Engineering & Technology from Lahore sealed with Masters of Business Administration from Lahore University of Management Sciences (LUMS). Inam ur Rahman was also adjunct faculty at LUMS, teaching Strategy, Management and Marketing. He is an environmentalist at heart and his passion is to make all energy renewable and free.
M. Abdul AleemM. Abdul Aleem is a Fellow Chartered Accountant (FCA) and a Fellow Cost and Management Accountant (FCMA). Mr. Aleem has worked for 16 years in senior positions with Engro Corporation Limited and Esso Singapore. Thereafter, he has worked for another 14 years with British American Tobacco Group UK (BAT) in Pakistan and overseas. For over ten years Mr. Aleem served as Chief Executive Officer of BAT operations in Cambodia, Mauritius and Indian Ocean.
Since 2004, Mr. Aleem has served in senior positions with large Government owned corporations in Pakistan. His last assignment was as the Managing Director, Pakistan State Oil Company Limited. Currently, he is the Chief Executive and Secretary General of Overseas Investors Chamber of Commerce and Industry. Mr. Aleem is also serving on the Board of Directors of Engro Corporation Limited and Meezan Bank Limited.”
BOARD OF DIRECTORS
22 Dawood Hercules Corporation Limited

Samad DawoodSamad Dawood is a graduate in Economics from University College London, UK and a Certified Director of Corporate Governance from the Pakistan Institute of Corporate Governance. He is Chairman of Engro Foods Limited and Director on the Boards of Dawood Hercules Corporation Limited, Dawood Lawrencepur Limited, The Hub Power Company Limited, Engro Corporation Limited and Engro Fertilizers Limited. Samad is a member of Young Presidents’ Organization, Pakistan Chapter.
Shahzada DawoodShahzada Dawood serves as a Director on the Boards of Engro Corporation Ltd, Engro Vopak Terminal, Engro Polymer & Chemicals, The Hub Power Company, the largest independent power producer in Pakistan, Tenaga Generasi, a wind power generation firm, Inbox Business Technologies, an enterprise digital services firm, Cyan Limited, a capital markets investment firm, and other family-business concerns. He is a Trustee of The Dawood Foundation, supporting education initiatives.
Shahzada Dawood is a World Economic Forum Young Global Leaders alumnus. He is an M.Sc. in Global Textile Marketing from Philadelphia University, USA, and an LLB from Buckingham University, UK. He is a Certified Director of Corporate Governance from the Pakistan Institute of Corporate Governance.
Annual Report 2016 23

Sabrina DawoodSabrina Dawood is currently the CEO of The Dawood Foundation and Director of Engro Foods Limited, prior to which she has been working in various companies of the Dawood Hercules Group, such as Dawood Hercules Corporation Limited and Dawood Lawrencepur Limited in marketing, corporate communications, administration and CSR. She is also a member of Board of Governors of National Management Foundation (NMF) of Lahore University of Management Sciences (LUMS) and sits on the boards of Karachi School of Business and Leadership (KSBL). She holds an MSc in Medical Anthropology from University College London and a BA from London School of Economics in Anthropology & Law.
Parvez Ghias
Parvez Ghias is the Chief Executive Officer at Habib University Foundation effective Januray 2017.
Prior to undertaking the current assignment he was CEO at Indus Motor Co. Ltd., for nearly eleven and half years. Indus Motor is a joint venture between House of Habib of Pakistan and Toyota Motor Corporation and Toyota Tsusho Corporation of Japan and is engaged in manufacture and marketing of Toyota brand vehicles.
Before joining IMC in August 2005, Parvez Ghias was Vice President, CFO and Director at Engro Corporation.
He currently serves as on the boards of Indus Motor Company, Standard Chartered Bank Pakistan and Dawood Hercules Corporation.
Parvez Ghias is a fellow of the Institute of Chartered Accountants from England & Wales and member of several faculties of the Institute and holds a Bachelors Degree in Economics and Statistics. Parvez Ghias takes keen interest in sports and plays golf.
BOARD OF DIRECTORS
24 Dawood Hercules Corporation Limited

Frank Murray JonesFrank Murray Jones is a researcher working on producing algorithms for use in different regional world economies. He has an Honors degree in Physics from University of Sheffield. Mr. Jones started his career in 1972 at Guest, Keen and Nettlefolds Steel Division in Birmingham and London. He has extensive experience of working in Client Services, Marketing and Econometrics in a diversified portfolio of companies (and countries) including Corn Products Corp, Cadbury Schweppes (UK), Anglo American Corp, South African Breweries, Eternit and the Govts of Hungary and Burundi.
Mr. Jones has also worked as a consultant for economic development for the World Bank; the Common Wealth Secretariat and the Govts of the Sultanate of Oman, Yemen and Sri Lanka; National Development Company, UAE; Central Bank of Oman; and the National Institute of Cultural Organizations, Abu Dhabi.
In 2009, Mr. Jones, along with co-workers at the University of Cambridge researched factors that affect the success & failure of startup enterprises. The formal results were published by the Royal Society of Arts and Manufacturers. He continues to fund and participate in formal research at the University of London on self-referencing perception systems and language structures.
Shabbir Hussain HashmiShabbir Hashmi has more than 30 years of project finance and private equity experience. At Actis Capital, one of the largest private equity investors in the emerging market, he had led the Pakistan operations. Prior to Actis, he was responsible for a large regional portfolio of CDC Group PLC for Pakistan and Bangladesh.
He also had a long stint with USAID and later briefly with the World Bank in Pakistan, specializing in planning and development of energy sector of the country. In the past, he has held more than 24 board directorships as a nominee of CDC/Actis and 11 directorships as an independent. Currently, he is serving as an independent director on the on the boards of Dawood Lawrencepur Limited, UBL Fund Managers, Engro Powergen Qadirpur and LMKR Holdings Mauritius and Pakistan. He is also on the board of governors of The Help Care Society which is operating K-12 schools in Lahore for underprivileged children. He is an engineer from Dawood College of Engineering & Technology, Pakistan and holds an MBA from J.F. Kennedy University, USA.
Annual Report 2016 25

BOARD OF DIRECTORS
Hasan Reza Ur RahimMr. Rahim is an accomplished professional who has over 30 years of international experience in the Banking and Financial Services industry. Most recently he served as the Executive Director, in-charge of the Chairman’s Office of the Dawood Hercules Group. He currently serves on the Boards of Cyan Limited, Dawood Hercules Corporation Limited and Dawood Lawrencepur Limited.
He has also held several senior roles in international banks and has been instrumental in implementing new business initiatives and establishing novel client coverage platforms. At JPMorgan he set up and headed the Global Corporate Bank in Bahrain, Qatar and Saudi Arabia, prior to which he also was the Senior Country Officer in Pakistan and was a part of the Regional Corporate Finance team based in Singapore. He has originated, led and executed large complex M&A transactions and Privatizations totaling USD5.0 billion, Sovereign Debt and Bond issues of over USD2.0 billion in the Telecom, Airlines, O&G and Petrochemical industries.
Previously, Mr. Rahim has worked with MashreqBank psc, ANZ Grindlays Bank plc, and Exxon Chemical Pakistan Limited. He was also posted to Zurich, Singapore, Bahrain and Dubai and received his degree from the University of Delaware in USA.
Saad RajaSaad Raja is an engineer from UET, Lahore with an MBA from the London Business School. He joined DFJ ePlant ventures in 2002, prior to which he had worked at senior management levels in the international asset management and investment sector. His diverse experiences have included tenures with Diachi Life Mizuho Asset Management and Industrial Bank of Japan asset management international. He joined the DH Corp Board in 2012.
BOARD OF DIRECTORS
26 Dawood Hercules Corporation Limited

COMMITTEES
Board Audit Committee:
The Board has set up an audit committee comprising of three Directors. Presently, two of whom are independent and one is non-executive. The Chairman of the Committee is an independent director.
Mr. M. Abdul Aleem ChairmanMr. Parvez Ghias MemberMr. Hasan Reza Ur Rahim Member
The Committee meets at least once in a quarter or as often as it considers necessary, to review and discuss all matters specified in the Code of Corporate Governance. The Committee also meets with the external auditors at least once a year.
The Head of Internal Audit acts as Secretary of the Committee.
Board Compensation Committee
The Board Compensation Committee consists of one non-executive Director and two independent Directors, as follows:
Mr. Hussain Dawood ChairmanMr. M. Abdul Aleem MemberMr. Parvez Ghias Member
The Chief Executive Officer attends the meetings by invitation.
Board Compensation Committee is responsible for reviewing and approving the company’s executive compensation, overall compensation strategy, human resources management policies, performance evaluation and succession plans including career planning for employees with high potential.
Manager HR acts as secretary of the committee.
Board Investment Committee:
The Board Investment Committee consists of two members, as follows:
Mr. Hussain Dawood ChairmanMr. Hasan Reza ur Rahim Member
The Board Investment Committee is responsible for reviewing the Company’s strategic investments in accordance with the mandate of the Board.
Annual Report 2016 27

FOOD & ENERGY
MAKING
AVAILABLE, AFFORDABLE, SUSTAINABLE
28 Dawood Hercules Corporation Limited

PROBLEM WORTH SOLVINGOver 40% children are undernourished mainly due to lack of protein
OUR CURRENT INPUTWe provide over 12 million consumers with good quality dairy products everyday
Annual Report 2016 29

OPERATING HIGHLIGHTSSIX YEARS AT A GLANCE
Sr.# PARTICULARS UNIT 2011 2012 2013 2014 2015 2016
A) INCOME STATEMENT1 Sales Value Rs. in Million 6,310 4,602 4,840 179,628 181,980 157,208 2 Gross Profit Rs. in Million 2,266 786 789 36,490 45,221 35,843 3 Operating Profit Rs. in Million 1,462 746 294 22,234 36,696 85,939 4 EBITDA Rs. in Million 4,636 2,231 4,950 33,243 48,953 98,280 5 Profit Before Taxation Rs. in Million 3,632 1,107 3,893 10,868 30,385 82,543 6 Profit After Taxation Rs. in Million 2,893 984 3,452 7,455 21,365 73,438 B) DIVIDEND1 Cash Dividend % 10 10 10 10 160 1552 Stock Dividend % - - - - - -C) BALANCE SHEET1 Fixed assets Rs. in Million 2,247 2,229 140,002 142,105 134,336 136,2572 Long term investments Rs. in Million 24,702 30,814 7,616 8,610 9,598 40,6883 Current Assets Rs. in Million 4,579 1,065 72,481 77,829 59,639 113,9444 Current Liabilities Rs. in Million 680 582 68,872 89,775 65,840 55,4365 Paid Up Capital Rs. in Million 4,813 4,813 4,813 4,813 4,813 4,8136 Reserves Rs. in Million 20,293 20,892 18,972 22,903 28,152 48,8727 Non Controlling Interest Rs. in Million - - 37,606 46,743 59,901 119,2788 No. of Ordinary Shares Million 481.29 481.29 481.29 481.29 481.29 481.29D) RATIO ANALYSIS1 Gross Profit % 35.91 17.08 16.31 20.31 24.85 22.80 2 Net Profit to Sales % 45.85 21.38 71.32 4.15 11.74 46.71 3 Operating Profit Margin % 23.17 16.20 6.08 12.38 20.16 54.67 4 EBITDA margin % 73.48 48.48 102.27 18.51 26.90 62.52 5 Earnings Per Share Rs. 6.01 2.04 7.17 4.70 19.17 53.12 6 Inventory Turnover Time 22.01 37.53 0.39 8.84 10.64 9.79 7 Age of Inventory Days 16.58 9.72 938.17 41.31 34.32 37.28 8 Debtors Turnover Time 2,619.73 3,053.01 3.15 46.73 32.07 15.36 9 Average Collection Period Days 0.14 0.12 115.88 7.81 11.38 23.76 10 Operating Cycle Days 16.72 9.84 1,054.05 49.12 45.70 61.04 11 Total Assets Turnover Time 0.20 0.13 0.02 0.79 0.89 0.54 12 Fixed Assets Turnover Time 2.81 2.06 0.03 1.26 1.35 1.15 13 Break-up Value of Share Rs. 52.16 53.41 49.42 57.59 68.49 111.54 14 Dividend Yield % 2.36 3.07 1.78 1.18 13.43 10.74 15 Dividend Payout Ratio % 16.64 48.92 13.94 6.46 36.04 10.16 16 Return on Equity % 11.52 3.83 14.51 26.90 64.81 136.79 17 Debt Equity Ratio Time 0.19 0.27 1.90 1.32 0.93 0.52 18 Current Ratio Time 6.74 1.83 1.05 0.87 0.91 2.06 19 Quick Ratio Time 6.52 1.74 0.75 0.74 0.69 1.86 20 Total Debt Ratio Time 0.20 0.25 0.72 0.68 0.55 0.43 21 Interest Cover Ratio Time 5.48 2.21 5.58 1.82 4.41 13.84 22 Dividend Cover Ratio Time 6.01 2.04 7.17 15.49 2.77 9.84 23 Return on capital employed % 11.52 3.83 14.51 26.90 64.81 136.79 24 Market Value per Share Rs. 42.39 32.54 56.12 84.51 119.14 144.33 25 Market Capitalization Rs. in Million 20,402 15,661 27,010 40,674 57,341 69,464 26 Price Earning Ratio Times 7.05 15.95 7.83 17.98 6.21 2.72 E) PRODUCTION1 Urea Metric Tons 200 58 1,622,345 1,860,867 1,964,034 1,881,016 2 NPK Metric Tons - - 92,839 117,193 126,074 94,610 3 PVC - Resin Metric Tons - - 146,000 153,000 162,000 172,000 4 EDC Metric Tons - - 117,000 118,000 100,000 106,000 5 Caustic Soda Metric Tons - - 115,000 114,000 98,000 103,000 6 VCM Metric Tons - - 170,000 168,000 162,000 174,000 7 Power Mega watts - - 1,333,664 1,721,959 1,424,015 1,264,667 8 Dairy and bevrages Thousand Litres - - 422,818 472,735 552,532 - 9 Milling/Drying unit of rice processing plant Metric Tons - - 196,478 166,801 45,982 28,474 10 Ice Cream Thousand Litres - - 14,500 16,726 19,364 - F) OTHERS 1 Employees Nos. 572 473 465 4,113 3,975 2,037 2 Capital Expenditure Rs. in Million 91.64 217.21 6.82 9,579.81 8,917 23,721
30 Dawood Hercules Corporation Limited

Sr.# PARTICULARS UNIT 2011 2012 2013 2014 2015 2016
A) INCOME STATEMENT1 Sales Value Rs. in Million 6,310 4,602 4,840 179,628 181,980 157,208 2 Gross Profit Rs. in Million 2,266 786 789 36,490 45,221 35,843 3 Operating Profit Rs. in Million 1,462 746 294 22,234 36,696 85,939 4 EBITDA Rs. in Million 4,636 2,231 4,950 33,243 48,953 98,280 5 Profit Before Taxation Rs. in Million 3,632 1,107 3,893 10,868 30,385 82,543 6 Profit After Taxation Rs. in Million 2,893 984 3,452 7,455 21,365 73,438 B) DIVIDEND1 Cash Dividend % 10 10 10 10 160 1552 Stock Dividend % - - - - - -C) BALANCE SHEET1 Fixed assets Rs. in Million 2,247 2,229 140,002 142,105 134,336 136,2572 Long term investments Rs. in Million 24,702 30,814 7,616 8,610 9,598 40,6883 Current Assets Rs. in Million 4,579 1,065 72,481 77,829 59,639 113,9444 Current Liabilities Rs. in Million 680 582 68,872 89,775 65,840 55,4365 Paid Up Capital Rs. in Million 4,813 4,813 4,813 4,813 4,813 4,8136 Reserves Rs. in Million 20,293 20,892 18,972 22,903 28,152 48,8727 Non Controlling Interest Rs. in Million - - 37,606 46,743 59,901 119,2788 No. of Ordinary Shares Million 481.29 481.29 481.29 481.29 481.29 481.29D) RATIO ANALYSIS1 Gross Profit % 35.91 17.08 16.31 20.31 24.85 22.80 2 Net Profit to Sales % 45.85 21.38 71.32 4.15 11.74 46.71 3 Operating Profit Margin % 23.17 16.20 6.08 12.38 20.16 54.67 4 EBITDA margin % 73.48 48.48 102.27 18.51 26.90 62.52 5 Earnings Per Share Rs. 6.01 2.04 7.17 4.70 19.17 53.12 6 Inventory Turnover Time 22.01 37.53 0.39 8.84 10.64 9.79 7 Age of Inventory Days 16.58 9.72 938.17 41.31 34.32 37.28 8 Debtors Turnover Time 2,619.73 3,053.01 3.15 46.73 32.07 15.36 9 Average Collection Period Days 0.14 0.12 115.88 7.81 11.38 23.76 10 Operating Cycle Days 16.72 9.84 1,054.05 49.12 45.70 61.04 11 Total Assets Turnover Time 0.20 0.13 0.02 0.79 0.89 0.54 12 Fixed Assets Turnover Time 2.81 2.06 0.03 1.26 1.35 1.15 13 Break-up Value of Share Rs. 52.16 53.41 49.42 57.59 68.49 111.54 14 Dividend Yield % 2.36 3.07 1.78 1.18 13.43 10.74 15 Dividend Payout Ratio % 16.64 48.92 13.94 6.46 36.04 10.16 16 Return on Equity % 11.52 3.83 14.51 26.90 64.81 136.79 17 Debt Equity Ratio Time 0.19 0.27 1.90 1.32 0.93 0.52 18 Current Ratio Time 6.74 1.83 1.05 0.87 0.91 2.06 19 Quick Ratio Time 6.52 1.74 0.75 0.74 0.69 1.86 20 Total Debt Ratio Time 0.20 0.25 0.72 0.68 0.55 0.43 21 Interest Cover Ratio Time 5.48 2.21 5.58 1.82 4.41 13.84 22 Dividend Cover Ratio Time 6.01 2.04 7.17 15.49 2.77 9.84 23 Return on capital employed % 11.52 3.83 14.51 26.90 64.81 136.79 24 Market Value per Share Rs. 42.39 32.54 56.12 84.51 119.14 144.33 25 Market Capitalization Rs. in Million 20,402 15,661 27,010 40,674 57,341 69,464 26 Price Earning Ratio Times 7.05 15.95 7.83 17.98 6.21 2.72 E) PRODUCTION1 Urea Metric Tons 200 58 1,622,345 1,860,867 1,964,034 1,881,016 2 NPK Metric Tons - - 92,839 117,193 126,074 94,610 3 PVC - Resin Metric Tons - - 146,000 153,000 162,000 172,000 4 EDC Metric Tons - - 117,000 118,000 100,000 106,000 5 Caustic Soda Metric Tons - - 115,000 114,000 98,000 103,000 6 VCM Metric Tons - - 170,000 168,000 162,000 174,000 7 Power Mega watts - - 1,333,664 1,721,959 1,424,015 1,264,667 8 Dairy and bevrages Thousand Litres - - 422,818 472,735 552,532 - 9 Milling/Drying unit of rice processing plant Metric Tons - - 196,478 166,801 45,982 28,474 10 Ice Cream Thousand Litres - - 14,500 16,726 19,364 - F) OTHERS 1 Employees Nos. 572 473 465 4,113 3,975 2,037 2 Capital Expenditure Rs. in Million 91.64 217.21 6.82 9,579.81 8,917 23,721
Annual Report 2016 31

----------------------------- Rs in million ----------------------------- ----------------------------------------------------- Percentage change -----------------------------------------------------
Particulars 2011 2012 2013 2014 2015 2016 11 Over 10 12 Over 11 13 Over 12 14 Over 13 15 Over 14 16 Over 15
Share Capital and ReservesIssued, subscribed and paid up capital 4,813 4,813 4,813 4,813 4,813 4,813 300% - - - - -Capital reserve - - - - - - - - - - - -Revenue reserves 20,293 20,890 18,972 22,903 28,152 48,872 -3% 3% -9% 21% 23% 74%Fair value reserve - 1 - - - - -100% 100% -100% - - -Non-Controlling interest - - 37,606 46,743 59,901 119,278 - - 100% 24% 28% 99%Share holder's equity with FVR 25,106 25,704 61,391 74,459 92,866 172,963 12% 2% 139% 21% 25% 86%Non Current Liabilities 5,744 7,822 91,815 66,710 49,758 72,918 1% 36% 1,074% -27% -25% 47%Sub Total 30,850 33,526 153,206 141,169 142,624 245,881 10% 9% 357% -8% 1% 72%
Current LiabilitiesCurrent portion - long term loan - 216 16,797 19,316 22,791 13,374 -100% 100% 7,680% 15% 18% -41%Short term financing - secured - 32 7,285 12,201 6,608 8,405 -100% 100% 22,455% 67% -46% 27%Trade and other payables 642 302 41,097 54,669 34,619 32,107 -8% -53% 13,510% 33% -37% -7%Markup payable on secured loans 9 32 2,306 2,124 1,428 1,238 -96% 275% 7,043% -8% -33% -13%Provision for taxation 29 - - - - 62 -96% -100% - - - 100%Others - - 1,387 1,465 394 250 - - 100% 6% -73% -37%Sub Total 680 582 68,872 89,775 65,840 55,436 -71% -14% 11,725% 30% -27% -16%Total 31,530 34,109 222,078 230,944 208,464 301,317 4% 8% 551% 4% -10% 45%
----------------------------- Rs in million ----------------------------- ----------------------------------------------------- Percentage change -----------------------------------------------------
Particulars 2011 2012 2013 2014 2015 2016 11 Over 10 12 Over 11 13 Over 12 14 Over 13 15 Over 14 16 Over 15
AssetsProperty, plant and equipment (Including intangibles and biological asset) 2,247 2,229 140,002 142,105 134,336 136,257 - -1% 6,181% 2% -5% 1%Long term investments 24,702 30,814 7,616 8,610 9,598 40,688 10% 25% -75% 13% 11% 324%Long term loans and advances 2 1 307 1,184 3,758 9,851 31% -37% 22,098% - 217% 162%Others - - 1,672 1,216 1,133 577 - - - -27% -7% -49%Sub Total 26,951 33,044 149,597 153,115 148,825 187,373 9% 23% 353% 2% -3% 26%Current AssetsStores, spares and loose tools 678 676 7,806 8,276 7,679 7,148 -37% - 1,054% 6% -7% -7%Stock in trade 151 52 20,772 11,628 14,089 10,704 -30% -66% 39,769% -44% 21% -24%Trade debts 3 - 3,073 4,615 6,734 13,734 26% -88% 933,943% 50% 46% 104%Loans, advances, deposit, prepayments and other receivables including accrued income 66 298 6,519 7,082 9,599 11,445 -91% 354% 2089% 9% 36% 19%Others - - 4,569 4,693 2,368 - - - - 3% -50% -100%Short term investments 2,951 3 22,700 29,163 14,050 64,726 21% -100% 867,969% 28% -52% 361%Cash and bank balances 731 36 7,042 12,372 5,120 6,187 -42% -95% 19,719% 76% -59% 21%Sub Total 4,579 1,065 72,481 77,829 59,639 113,944 -20% -77% 6,708% 7% -23% 91%Total Assets Employed 31,530 34,109 222,078 230,944 208,464 301,317 4% 8% 551% 4% -10% 45%
HORIZONTAL ANALYSISBALANCE SHEET
32 Dawood Hercules Corporation Limited

----------------------------- Rs in million ----------------------------- ----------------------------------------------------- Percentage change -----------------------------------------------------
Particulars 2011 2012 2013 2014 2015 2016 11 Over 10 12 Over 11 13 Over 12 14 Over 13 15 Over 14 16 Over 15
Share Capital and ReservesIssued, subscribed and paid up capital 4,813 4,813 4,813 4,813 4,813 4,813 300% - - - - -Capital reserve - - - - - - - - - - - -Revenue reserves 20,293 20,890 18,972 22,903 28,152 48,872 -3% 3% -9% 21% 23% 74%Fair value reserve - 1 - - - - -100% 100% -100% - - -Non-Controlling interest - - 37,606 46,743 59,901 119,278 - - 100% 24% 28% 99%Share holder's equity with FVR 25,106 25,704 61,391 74,459 92,866 172,963 12% 2% 139% 21% 25% 86%Non Current Liabilities 5,744 7,822 91,815 66,710 49,758 72,918 1% 36% 1,074% -27% -25% 47%Sub Total 30,850 33,526 153,206 141,169 142,624 245,881 10% 9% 357% -8% 1% 72%
Current LiabilitiesCurrent portion - long term loan - 216 16,797 19,316 22,791 13,374 -100% 100% 7,680% 15% 18% -41%Short term financing - secured - 32 7,285 12,201 6,608 8,405 -100% 100% 22,455% 67% -46% 27%Trade and other payables 642 302 41,097 54,669 34,619 32,107 -8% -53% 13,510% 33% -37% -7%Markup payable on secured loans 9 32 2,306 2,124 1,428 1,238 -96% 275% 7,043% -8% -33% -13%Provision for taxation 29 - - - - 62 -96% -100% - - - 100%Others - - 1,387 1,465 394 250 - - 100% 6% -73% -37%Sub Total 680 582 68,872 89,775 65,840 55,436 -71% -14% 11,725% 30% -27% -16%Total 31,530 34,109 222,078 230,944 208,464 301,317 4% 8% 551% 4% -10% 45%
----------------------------- Rs in million ----------------------------- ----------------------------------------------------- Percentage change -----------------------------------------------------
Particulars 2011 2012 2013 2014 2015 2016 11 Over 10 12 Over 11 13 Over 12 14 Over 13 15 Over 14 16 Over 15
AssetsProperty, plant and equipment (Including intangibles and biological asset) 2,247 2,229 140,002 142,105 134,336 136,257 - -1% 6,181% 2% -5% 1%Long term investments 24,702 30,814 7,616 8,610 9,598 40,688 10% 25% -75% 13% 11% 324%Long term loans and advances 2 1 307 1,184 3,758 9,851 31% -37% 22,098% - 217% 162%Others - - 1,672 1,216 1,133 577 - - - -27% -7% -49%Sub Total 26,951 33,044 149,597 153,115 148,825 187,373 9% 23% 353% 2% -3% 26%Current AssetsStores, spares and loose tools 678 676 7,806 8,276 7,679 7,148 -37% - 1,054% 6% -7% -7%Stock in trade 151 52 20,772 11,628 14,089 10,704 -30% -66% 39,769% -44% 21% -24%Trade debts 3 - 3,073 4,615 6,734 13,734 26% -88% 933,943% 50% 46% 104%Loans, advances, deposit, prepayments and other receivables including accrued income 66 298 6,519 7,082 9,599 11,445 -91% 354% 2089% 9% 36% 19%Others - - 4,569 4,693 2,368 - - - - 3% -50% -100%Short term investments 2,951 3 22,700 29,163 14,050 64,726 21% -100% 867,969% 28% -52% 361%Cash and bank balances 731 36 7,042 12,372 5,120 6,187 -42% -95% 19,719% 76% -59% 21%Sub Total 4,579 1,065 72,481 77,829 59,639 113,944 -20% -77% 6,708% 7% -23% 91%Total Assets Employed 31,530 34,109 222,078 230,944 208,464 301,317 4% 8% 551% 4% -10% 45%
Annual Report 2016 33

VERTICAL ANALYSISBALANCE SHEET
----------------------------- Rs in million ----------------------------- -------------------------------------------------------------- Percentage --------------------------------------------------------------
Particulars 2011 2012 2013 2014 2015 2016 2011 2012 2013 2014 2015 2016
Share Capital and ReservesIssued, subscribed and paid up capital 4,813 4,813 4,813 4,813 4,813 4,813 15% 14% 2% 2% 2% 2%Revenue reserves 20,293 20,890 18,972 22,903 28,152 48,872 64% 61% 9% 10% 14% 16%Fair value reserve - 1 - - - - - - - - - -Non-Controlling interest - - 37,606 46,743 59,901 119,278 - - - 20% 29% 40%Share holder’s Equity with FVR 25,106 25,704 61,391 74,459 92,866 172,963 80% 75% 28% 32% 45% 57%Non Current Liabilities 5,744 7,822 91,815 66,710 49,758 72,918 18% 23% 41% 29% 24% 24%Sub Total 30,850 33,526 153,206 141,169 142,624 245,881 98% 98% 69% 61% 68% 82%Current LiabilitiesCurrent portion - long term loan - 216 16,797 19,316 22,791 13,374 - 1% 8% 8% 11% 4%Short term financing - secured - 32 7,285 12,201 6,608 8,405 - - 3% 5% 3% 3%Trade and other payables 642 302 41,097 54,669 34,619 32,107 2% 1% 19% 24% 17% 11%Markup payable on secured loans 9 32 2,306 2,124 1,428 1,238 - - 1% 1% 1% -Provision for taxation 29 - - - - 62 - - - - - -Others - - 1,387 1,465 394 250 - - 1% 1% - -Sub Total 680 582 68,872 89,775 65,840 55,436 2% 2% 31% 39% 32% 18%Total 31,530 34,109 222,078 230,944 208,464 301,317 100% 100% 100% 100% 100% 100%
----------------------------- Rs in million ----------------------------- -------------------------------------------------------------- Percentage --------------------------------------------------------------
Particulars 2011 2012 2013 2014 2015 2016 2011 2012 2013 2014 2015 2016
AssetsProperty, plant and equipment (Including intangibles and biological asset) 2,247 2,229 140,002 142,105 134,336 136,257 7% 7% 63% 62% 64% 45%Long term investments 24,702 30,814 7,616 8,610 9,598 40,688 78% 90% 3% 4% 5% 14%Long term loans and advances 2 1 307 1,184 3,758 9,851 - - - 1% 2% 3%Others - - 1,672 1,216 1,133 577 - - - 1% 1% -Sub Total 26,951 33,044 149,597 153,115 148,825 187,373 85% 97% 67% 66% 71% 62%Current AssetsStores, spares and loose tools 678 676 7,806 8,276 7,679 7,148 2% 2% 4% 4% 4% 2%Stock in trade 151 52 20,772 11,628 14,089 10,704 - - 9% 5% 7% 4%Trade debts 3 - 3,073 4,615 6,734 13,734 - - 1% 2% 3% 5%Loans, advances, deposit, prepayments and other receivables including accrued income 66 298 6,519 7,082 9,599 11,445 - 1% 3% 3% 5% 4%Others - - 4,569 4,693 2,368 - - - - 2% 1% -Short term investments 2,951 3 22,700 29,163 14,050 64,726 9% - 10% 13% 7% 21%Cash and bank balances 731 36 7,042 12,372 5,120 6,187 2% - 3% 5% 2% 2%Sub Total 4,579 1,065 72,481 77,829 59,639 113,944 15% 3% 33% 34% 29% 38%Total Assets Employed 31,530 34,109 222,078 230,944 208,464 301,317 100% 100% 100% 100% 100% 100%
34 Dawood Hercules Corporation Limited

----------------------------- Rs in million ----------------------------- -------------------------------------------------------------- Percentage --------------------------------------------------------------
Particulars 2011 2012 2013 2014 2015 2016 2011 2012 2013 2014 2015 2016
Share Capital and ReservesIssued, subscribed and paid up capital 4,813 4,813 4,813 4,813 4,813 4,813 15% 14% 2% 2% 2% 2%Revenue reserves 20,293 20,890 18,972 22,903 28,152 48,872 64% 61% 9% 10% 14% 16%Fair value reserve - 1 - - - - - - - - - -Non-Controlling interest - - 37,606 46,743 59,901 119,278 - - - 20% 29% 40%Share holder’s Equity with FVR 25,106 25,704 61,391 74,459 92,866 172,963 80% 75% 28% 32% 45% 57%Non Current Liabilities 5,744 7,822 91,815 66,710 49,758 72,918 18% 23% 41% 29% 24% 24%Sub Total 30,850 33,526 153,206 141,169 142,624 245,881 98% 98% 69% 61% 68% 82%Current LiabilitiesCurrent portion - long term loan - 216 16,797 19,316 22,791 13,374 - 1% 8% 8% 11% 4%Short term financing - secured - 32 7,285 12,201 6,608 8,405 - - 3% 5% 3% 3%Trade and other payables 642 302 41,097 54,669 34,619 32,107 2% 1% 19% 24% 17% 11%Markup payable on secured loans 9 32 2,306 2,124 1,428 1,238 - - 1% 1% 1% -Provision for taxation 29 - - - - 62 - - - - - -Others - - 1,387 1,465 394 250 - - 1% 1% - -Sub Total 680 582 68,872 89,775 65,840 55,436 2% 2% 31% 39% 32% 18%Total 31,530 34,109 222,078 230,944 208,464 301,317 100% 100% 100% 100% 100% 100%
----------------------------- Rs in million ----------------------------- -------------------------------------------------------------- Percentage --------------------------------------------------------------
Particulars 2011 2012 2013 2014 2015 2016 2011 2012 2013 2014 2015 2016
AssetsProperty, plant and equipment (Including intangibles and biological asset) 2,247 2,229 140,002 142,105 134,336 136,257 7% 7% 63% 62% 64% 45%Long term investments 24,702 30,814 7,616 8,610 9,598 40,688 78% 90% 3% 4% 5% 14%Long term loans and advances 2 1 307 1,184 3,758 9,851 - - - 1% 2% 3%Others - - 1,672 1,216 1,133 577 - - - 1% 1% -Sub Total 26,951 33,044 149,597 153,115 148,825 187,373 85% 97% 67% 66% 71% 62%Current AssetsStores, spares and loose tools 678 676 7,806 8,276 7,679 7,148 2% 2% 4% 4% 4% 2%Stock in trade 151 52 20,772 11,628 14,089 10,704 - - 9% 5% 7% 4%Trade debts 3 - 3,073 4,615 6,734 13,734 - - 1% 2% 3% 5%Loans, advances, deposit, prepayments and other receivables including accrued income 66 298 6,519 7,082 9,599 11,445 - 1% 3% 3% 5% 4%Others - - 4,569 4,693 2,368 - - - - 2% 1% -Short term investments 2,951 3 22,700 29,163 14,050 64,726 9% - 10% 13% 7% 21%Cash and bank balances 731 36 7,042 12,372 5,120 6,187 2% - 3% 5% 2% 2%Sub Total 4,579 1,065 72,481 77,829 59,639 113,944 15% 3% 33% 34% 29% 38%Total Assets Employed 31,530 34,109 222,078 230,944 208,464 301,317 100% 100% 100% 100% 100% 100%
Annual Report 2016 35
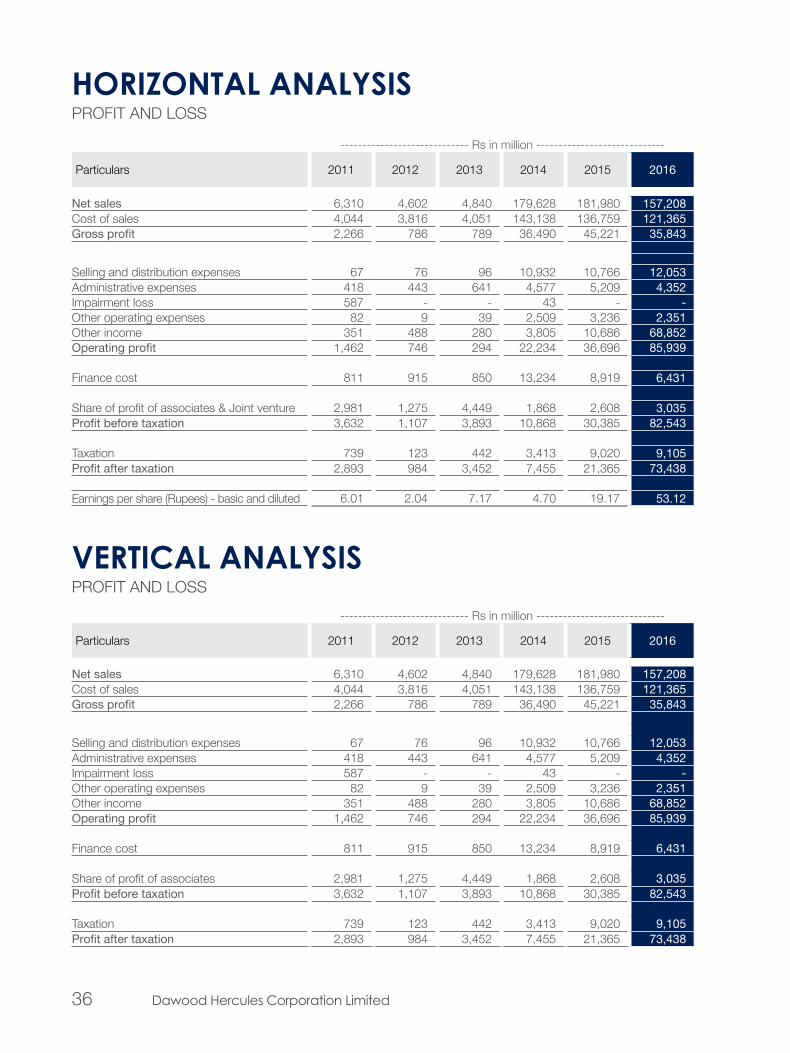
HORIZONTAL ANALYSISPROFIT AND LOSS
VERTICAL ANALYSISPROFIT AND LOSS
----------------------------- Rs in million ----------------------------- ----------------------------------------------------- Percentage change -----------------------------------------------------
Particulars 2011 2012 2013 2014 2015 2016 11 Over 10 12 Over 11 13 Over 12 14 Over 13 15 Over 14 16 Over 15
Net sales 6,310 4,602 4,840 179,628 181,980 157,208 -28% -27% 5% 3,611% 1% -14%Cost of sales 4,044 3,816 4,051 143,138 136,759 121,365 -22% -6% 6% 3,434% -4% -11%Gross profit 2,266 786 789 36,490 45,221 35,843 -35% -65% - 4,523% 24% -21%
Selling and distribution expenses 67 76 96 10,932 10,766 12,053 -75% 13% 26% 11,341% -2% 12%Administrative expenses 418 443 641 4,577 5,209 4,352 -3% 6% 45% 614% 14% -16%Impairment loss 587 - - 43 - - 24,449% -100% - 100% -100% - Other operating expenses 82 9 39 2,509 3,236 2,351 -29% -89% 319% 6,341% 29% -27%Other income 351 488 280 3,805 10,686 68,852 -24% 39% -43% 1,259% 181% 544%Operating profit 1,462 746 294 22,234 36,696 85,939 -54% -49% -61% 7,458% 65% 134%
Finance cost 811 915 850 13,234 8,919 6,431 -11% 13% -7% 1,457% -33% -28%
Share of profit of associates & Joint venture 2,981 1,275 4,449 1,868 2,608 3,035 52% -57% 249% -58% 40% 16%Profit before taxation 3,632 1,107 3,893 10,868 30,385 82,543 -13% -70% 252% 179% 180% 172%
Taxation 739 123 442 3,413 9,020 9,105 -22% -83% 260% 673% 164% 1%Profit after taxation 2,893 984 3,452 7,455 21,365 73,438 -11% -66% 251% 116% 187% 244%
Earnings per share (Rupees) - basic and diluted 6.01 2.04 7.17 4.70 19.17 53.12 -11% -66% 251% -34% 308% 177%
----------------------------- Rs in million ----------------------------- ----------------------------------------------------- Percentage -----------------------------------------------------
Particulars 2011 2012 2013 2014 2015 2016 2011 2012 2013 2014 2015 2016
Net sales 6,310 4,602 4,840 179,628 181,980 157,208 100% 100% 100% 100% 100% 100%Cost of sales 4,044 3,816 4,051 143,138 136,759 121,365 64% 83% 84% 80% 75% 77%Gross profit 2,266 786 789 36,490 45,221 35,843 36% 17% 16% 20% 25% 23%
Selling and distribution expenses 67 76 96 10,932 10,766 12,053 1% 2% 2% 6% 6% 8%Administrative expenses 418 443 641 4,577 5,209 4,352 7% 10% 13% 3% 3% 3%Impairment loss 587 - - 43 - - 9% - - - - - Other operating expenses 82 9 39 2,509 3,236 2,351 1% - 1% 1% 2% 1%Other income 351 488 280 3,805 10,686 68,852 6% 11% 6% 2% 6% 44%Operating profit 1,462 746 294 22,234 36,696 85,939 24% 16% 6% 12% 20% 55%
Finance cost 811 915 850 13,234 8,919 6,431 13% 20% 18% 7% 5% 4%
Share of profit of associates 2,981 1,275 4,449 1,868 2,608 3,035 47% 28% 92% 1% 1% 2%Profit before taxation 3,632 1,107 3,893 10,868 30,385 82,543 58% 24% 80% 6% 17% 53%
Taxation 739 123 442 3,413 9,020 9,105 12% 3% 9% 2% 5% 6%Profit after taxation 2,893 984 3,452 7,455 21,365 73,438 46% 21% 71% 4% 12% 47%
36 Dawood Hercules Corporation Limited

----------------------------- Rs in million ----------------------------- ----------------------------------------------------- Percentage change -----------------------------------------------------
Particulars 2011 2012 2013 2014 2015 2016 11 Over 10 12 Over 11 13 Over 12 14 Over 13 15 Over 14 16 Over 15
Net sales 6,310 4,602 4,840 179,628 181,980 157,208 -28% -27% 5% 3,611% 1% -14%Cost of sales 4,044 3,816 4,051 143,138 136,759 121,365 -22% -6% 6% 3,434% -4% -11%Gross profit 2,266 786 789 36,490 45,221 35,843 -35% -65% - 4,523% 24% -21%
Selling and distribution expenses 67 76 96 10,932 10,766 12,053 -75% 13% 26% 11,341% -2% 12%Administrative expenses 418 443 641 4,577 5,209 4,352 -3% 6% 45% 614% 14% -16%Impairment loss 587 - - 43 - - 24,449% -100% - 100% -100% - Other operating expenses 82 9 39 2,509 3,236 2,351 -29% -89% 319% 6,341% 29% -27%Other income 351 488 280 3,805 10,686 68,852 -24% 39% -43% 1,259% 181% 544%Operating profit 1,462 746 294 22,234 36,696 85,939 -54% -49% -61% 7,458% 65% 134%
Finance cost 811 915 850 13,234 8,919 6,431 -11% 13% -7% 1,457% -33% -28%
Share of profit of associates & Joint venture 2,981 1,275 4,449 1,868 2,608 3,035 52% -57% 249% -58% 40% 16%Profit before taxation 3,632 1,107 3,893 10,868 30,385 82,543 -13% -70% 252% 179% 180% 172%
Taxation 739 123 442 3,413 9,020 9,105 -22% -83% 260% 673% 164% 1%Profit after taxation 2,893 984 3,452 7,455 21,365 73,438 -11% -66% 251% 116% 187% 244%
Earnings per share (Rupees) - basic and diluted 6.01 2.04 7.17 4.70 19.17 53.12 -11% -66% 251% -34% 308% 177%
----------------------------- Rs in million ----------------------------- ----------------------------------------------------- Percentage -----------------------------------------------------
Particulars 2011 2012 2013 2014 2015 2016 2011 2012 2013 2014 2015 2016
Net sales 6,310 4,602 4,840 179,628 181,980 157,208 100% 100% 100% 100% 100% 100%Cost of sales 4,044 3,816 4,051 143,138 136,759 121,365 64% 83% 84% 80% 75% 77%Gross profit 2,266 786 789 36,490 45,221 35,843 36% 17% 16% 20% 25% 23%
Selling and distribution expenses 67 76 96 10,932 10,766 12,053 1% 2% 2% 6% 6% 8%Administrative expenses 418 443 641 4,577 5,209 4,352 7% 10% 13% 3% 3% 3%Impairment loss 587 - - 43 - - 9% - - - - - Other operating expenses 82 9 39 2,509 3,236 2,351 1% - 1% 1% 2% 1%Other income 351 488 280 3,805 10,686 68,852 6% 11% 6% 2% 6% 44%Operating profit 1,462 746 294 22,234 36,696 85,939 24% 16% 6% 12% 20% 55%
Finance cost 811 915 850 13,234 8,919 6,431 13% 20% 18% 7% 5% 4%
Share of profit of associates 2,981 1,275 4,449 1,868 2,608 3,035 47% 28% 92% 1% 1% 2%Profit before taxation 3,632 1,107 3,893 10,868 30,385 82,543 58% 24% 80% 6% 17% 53%
Taxation 739 123 442 3,413 9,020 9,105 12% 3% 9% 2% 5% 6%Profit after taxation 2,893 984 3,452 7,455 21,365 73,438 46% 21% 71% 4% 12% 47%
Annual Report 2016 37

2016 2015
PKR ‘million’ %age PKR ‘million’ %age
Wealth generated
Total gross revenue & other income 242,656 216,346
Brought in materials and services (106,240) (119,253)
Total value addition 136,416 97,093
Wealth distribution
To employees (Salaries, wages & benefits) 9,056 7% 9,399 9%
To government (Income Tax, sales tax & wwf) 42,150 31% 41,540 43%
To Society
Donation toward eductaion,health, environment and natural disaster 125 0% 149 0%
To providers of capital:
Dividend to Shareholders 20,846 15% 12,791 13%
Markup/interest expenses on borrowed money 6,430 5% 8,918 9%
Retained for investment and future growth, 57,809 42% 24,296 25% depreciation and retained profits
Total value distribution 136,416 97,093
STATEMENT OFVALUE ADDITIONCONSOLIDATED
38 Dawood Hercules Corporation Limited
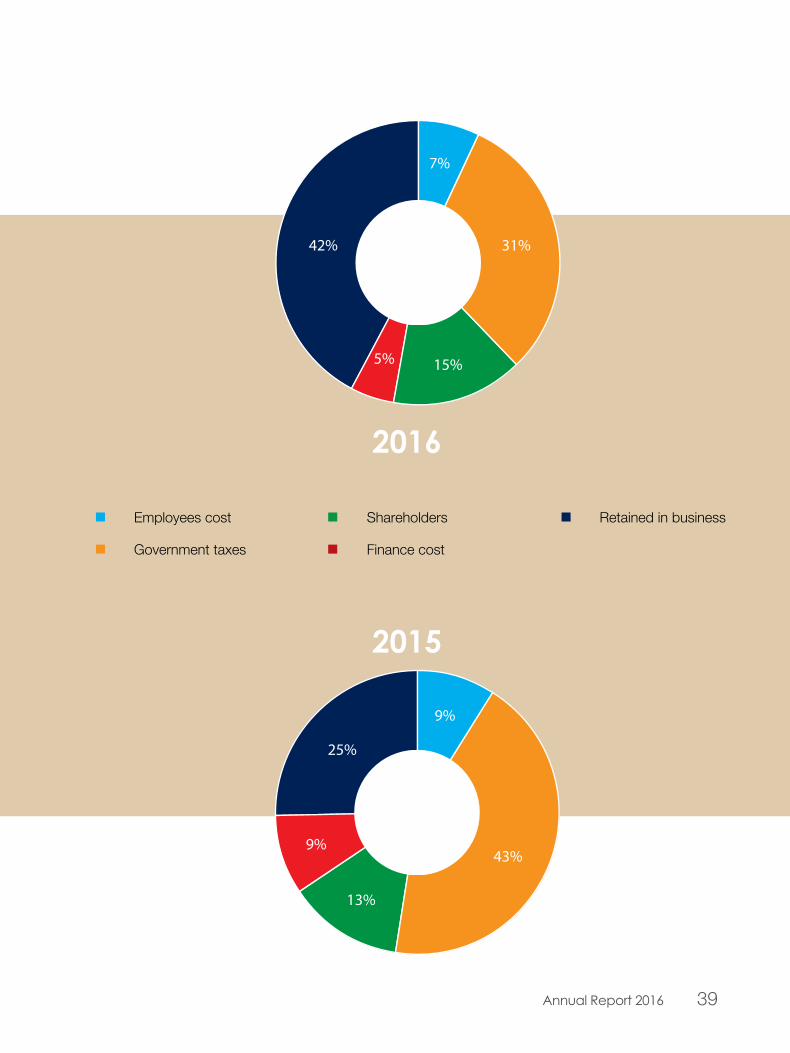
2016
2015
Employees cost
Government taxes
Shareholders
Finance cost
Retained in business
7%
31%
15%5%
42%
9%
43%
13%
9%
25%
7%
31%
15%5%
42%
9%
43%
13%
9%
25%
Annual Report 2016 39
FOOD & ENERGY
MAKING
AVAILABLE, AFFORDABLE, SUSTAINABLE
40 Dawood Hercules Corporation Limited

PROBLEM WORTH SOLVINGMore than 97% of smallholder farmers are unable to sell their milk
OUR CURRENT INPUTWe work with over 250,000 dairy farmers across rural Pakistan, having distributed Rs. 50+ billion in direct income to them since inception, whilst simultaneously increasing milk yields by approximately 20%
Annual Report 2016 41

Notice is hereby given to all the shareholders of Dawood Hercules Corporation Limited (the “Company”) that the 49th Annual General Meeting of the Company will be held on 28th April 2017 at 10:00 a.m. at Ground Floor, Dawood Centre M.T. Khan Road, Karachi to transact the following business:
ORDINARY BUSINESS:
1. To confirm the minutes of the 48th Annual General Meeting held on 23rd April 2016.
2. To receive, consider and adopt the Audited Financial Statements of the Company for the year ended 31st December 2016 together with the Auditors' and Directors’ Reports thereon.
3. To approve the payment of final cash dividend at the rate of Rs. 2 per share i.e. (20%) as recommended by the Board of Directors. This is in addition to the interim cash dividend at the rate of Rs. 13.50 per share i.e. (135%) already paid to the shareholders, thus making a total cash dividend of Rs. 15.5 per share i.e (155%) for the year ended 31st December 2016.
4. To appoint Auditors for the year ending 31st December 2017 and to fix their remuneration.
5. To elect nine (9) directors of the Company as fixed by the Board of Directors in accordance with Section 178(1) of the Companies Ordinance, 1984 for a period of three (3) years commencing from 29th April 2017. Names of the retiring directors are given below:
1. Mr. Hussain Dawood2. Mr. Samad Dawood3. Mr. M. Abdul Aleem4. Mr. Shahzada Dawood5. Ms. Sabrina Dawood6. Mr. Parvez Ghias7. Mr. Shabbir Hussain Hashmi8. Mr. Frank Murray Jones9. Mr. Hasan Reza Ur Rahim10. Mr. Saad Raja
SPECIAL BUSINESS:
6. To approve transmission of annual audited financial statements, auditors' report and directors’ report etc. (“annual audited accounts”) to members through CD/DVD/USB at their registered address as allowed by the Securities and Exchange Commission of Pakistan.
“RESOLVED THAT approval of the members of Dawood Hercules Corporation Limited be and is hereby accorded for transmission of Annual Reports including the Annual Accounts, Notice of the General Meetings and other information contained therein either through CD/DVD or USB, instead of transmitting the same in hard copies.”
Statement under section 160(1)(b) of the Companies Ordinance, 1984, setting forth all material facts pertaining to the Special Business to be transacted at the said Annual General Meeting is attached.
7. To transact any other business of the Company with the permission of the Chair.
By Order of the Board
Karachi Shafiq AhmedFebruary 28, 2017 Company Secretary
Notes:
1. Closure of Share Transfer Books:
The Share Transfer Books of the Company will remain closed from 21st April 2017 to 28th April 2017 (both days inclusive). Transfers received in order at the office of the Company’s Share Registrar, Messrs. FAMCO Associates (Private) Limited, 8-F, Next to Hotel Faran, Block-6, P.E.C.H.S, Shahra-e-Faisal, Karachi, by close of business (5:00 p.m.) on Thursday, 20th April 2017, will be treated as being in time for the purposes of payment of final cash dividend to the transferees and to attend and vote at the meeting.
NOTICE OF 49TH ANNUAL GENERAL MEETING
42 Dawood Hercules Corporation Limited

2. Participation in the Annual General Meeting:
All Members, entitled to attend and vote at the meeting, are entitled to appoint another person in writing as their proxy to attend and vote on their behalf. A proxy need not be a member of the Company. A corporate entity, being member, may appoint any person, regardless whether they are a member or not, as its proxy. In case of corporate entities, a resolution of the Board of Directors / Power of Attorney with specimen signature of the person nominated to represent and vote on behalf of the corporate entity shall be submitted to the Company along with a completed proxy form. The proxy holders are required to produce their original CNICs or original passports at the time of the meeting.
In order to be effective, duly completed and signed proxy forms must be received at the Company’s Registered Office at least 48 hours before the time of the meeting.
3. For Election of Directors
The term of office of the present Directors of the Company will expire on 28th April 2017. In terms of Section 178 (1) of the Companies Ordinance, 1984, the directors have fixed the number of elected directors at nine (9) to be elected in the annual general meeting for the next term of three years.
The present Directors are interested to the extent that they are eligible for re-election as Directors of the Company.
Any person who seeks to contest the election of directors shall, whether he/she is a retiring director or otherwise, file with the Company the following documents and information at its registered office not later than fourteen days before the day of the above said meeting;
a) His/her Folio No./CDC Investors Account No./CDC Participant No./Sub-Account No.
b) Notice of his/her intention to offer himself/herself for the election of directors in terms of Section 178(3) of the Companies Ordinance, 1984;
c) Consent to act as director on Form 28 under section 184 of the Companies Ordinance, 1984.
d) A detailed profile along with his/her office address as required under SECP’s SRO 634(1)2015 dated July 10, 2014.
e) An attested copy of Computerized National Identity Card (CNIC);
f) A declaration that:
• He/she is not ineligible to become a director of the Company under any applicable laws and regulations (including listing regulations of Stock Exchange).
• He/she is not serving as a director of more than seven listed companies. Provided that this limit shall not include the directorship in the listed subsidiaries of a listed holding company.
• Neither he/she nor his/her spouse is engaged in the business of brokerage or is a sponsor director or officer of a corporate brokerage house.
• He/she is aware of his/her duties and powers under the relevant laws, Memorandum & Articles.
4. CDC account holders will further have to follow the under mentioned guidelines as laid down by the Securities and Exchange Commission of Pakistan.
A. For Attending the Meeting
a. In case of Individuals, the account holders or sub-account holders whose registration details are uploaded as per the Regulations shall authenticate his/her original valid Computerized National Identity Card (CNIC) or the original Passport at the time of attending the meeting.
b. In case of corporate entity, the Board of Directors’ Resolution / power of attorney with specimen signature of the nominee
Annual Report 2016 43

shall be produced (unless it has been provided earlier) at the time of the meeting.
B. For Appointing Proxies
a. In case of individuals, the account holders or sub-account holders whose registration details are uploaded as per the Regulations shall submit the proxy form as per above requirements.
b. Attested copies of valid CNIC or the passport of the beneficial owners and the proxy shall be furnished with the proxy form.
c. The proxy shall produce original valid CNIC or original passport at the time of the meeting.
d. In case of corporate entity, the Board of Directors’ resolution / power of attorney with specimen signature shall be submitted (unless it has been provided earlier) along with proxy form to the Company.
e. Proxy form will be witnessed by two persons whose names, addresses and valid CNIC numbers shall be mentioned on the form.
5. Submission of copies of CNIC (Mandatory)
Pursuant of the directives of the Securities & Exchange Commission of Pakistan (SECP) Dividend Warrants shall mandatorily bear the Computerized National Identity Card (CNIC) numbers of shareholders. Shareholders are therefore requested to fulfill the statutory requirements and submit a copy of their valid CNIC (if not already provided) to the Company’s Share Registrar, FAMCO Associates (Private) Limited without any delay.
In case of non-availability of a valid copy of Shareholders’ CNIC in the records of the Company, the Company shall withhold the Dividend Warrants in terms of Section 251 (2) (a) of the Companies Ordinance 1984, which will be released by the Company only upon submission of a valid copy of the CNIC in compliance with the aforesaid SECP directives.
6. Consent for Video Conference Facility
Members can also avail video conference facility at Lahore and Islamabad. In this regard, please fill the following form and submit to registered address of the Company 10 days before holding of the Annual General Meeting.
If the Company receives consent from members holding in aggregate 10% or more shareholding residing at a geographical location, to participate in the meeting through video conference at least 10 days prior to date of meeting, the Company will arrange video conference facility in that city subject to availability of such facility in that city.
The Company will intimate Members regarding venue of video conference facility at least 5 days before the date of the Annual General Meeting along with complete information necessary to enable them to access such facility.
I/We,_________________ of __________, being a member of Dawood Hercules Corporation Limited, holder of ________________ ordinary share (s) as per Register Folio/CDC Account No_____________ hereby opt for video conference facility at ____________________.
__________________
Signature of Members
7. Withholding Tax on Dividend
The Government of Pakistan through Finance Act, 2016 has made certain amendments in Section 150 of the Income Tax Ordinance, 2001 whereby different rates are prescribed for deduction withholding tax on the amount of dividend paid by the Companies. These tax rates are as under:
(a) For filers of income tax returns : 12.5%
(b) For non-filers of income tax returns : 20.0%
Shareholders who are filers are advised to make sure that their names are entered into latest Active Tax Payers List (ATL) provided on the
44 Dawood Hercules Corporation Limited

website of FBR by the first day of book closure, otherwise they shall be treated as non-filers and tax on their cash dividend will be deducted at the rate of 20% instead of 12.5%.
Withholding tax on Dividend in case of Joint Account Holders
In order to enable the Company to follow the directives of the regulators to determine shareholding ratio of the Joint Account Holder(s) (where shareholding has not been determined by the Principal Shareholder) for deduction of withholding tax on dividend of the Company, Shareholders are requested to please furnish the shareholding ratio detail of themselves as Principal Shareholder and their Joint Holders, to the Company’s Share Registrar, enabling the Company to compute withholding tax of each shareholder accordingly. The required information must reach to Company’s Share Registrar before book closure otherwise it will be assumed that the shares are equally held by Principal Shareholder and Joint Holders(s).
Requirement of valid tax exemption certificate for claiming exemption from withholding tax:
As per FBR Circulars C. No. 1 (29) WHT/2006 dated 30 June 2010 and C. No. 1 (43) DG (WHT) /2008- Vol. II -66417-R dated 12 May 2015, the valid exemption certificate is mandatory to claim exemption of withholding tax U/S 150 of the Income Tax Ordinance 2001 (tax on dividend amount) where the statutory exemption under clause 47B of part – IV of Second Schedule is available. The shareholders who fall in the category mentioned in above clause and want to avail exemption U/S 150 of the Ordinance, must provide valid Tax Exemption Certificate to our Share Registrar before book closure otherwise tax will be deducted on dividend as per applicable rates
8. Payment of Cash Dividend Electronically (Optional)
The SECP has initiated e-dividend mechanism through its Notification 8(4) SM/CDC 2008 of April 5, 2013. In order to avail benefits of e-dividend shareholders are hereby advised to provide details of their bank mandate specifying: (i) title of account, (ii) IBAN / account number, (iii) bank name, (iv) branch name, code and address to Company Share Registrar. Shareholders who hold shares with CDC or Participants/ Stock Brokers, are advised to provide the mandate to CDC or their Participants/ Stock Brokers.
Shareholders can use the standardized “Dividend Mandate Form” available on our Share registrar’s website www.famco.com.pk
9. Audited Financial Statements Through E-Mail:
SECP through its Notification SRO 787(I)/2014 dated September 8, 2014, has allowed the circulation of Audited Financial Statements along with the Notice of Annual General Meeting to the Members of the Company through email. Therefore, all Members who wish to receive the soft copy of Annual Report are requested to send their email addresses. The consent form for electronic transmission can be downloaded from the Company’s website www.dawoodhercules.com.
The Company shall, however, provide hard copy of the Audited Financial Statements to its shareholders, on request, free of cost, within seven days of receipt of such request. The Company shall place the financial statements and reports on the Company’s website, at least twenty-one (21) days prior to the date of the Annual General Meeting in terms of SRO 634(1)/2014 dated July 10, 2014 issued by the SECP.
Annual Report 2016 45

STATEMENT UNDER SECTION 160 (1) (B) OF THE COMPANIES ORDINANCE, 1984
This Statement is annexed to the Notice of the 49th Annual General Meeting of Dawood Hercules Corporation Limited to be held on Friday, 28th April 2017 at which Special Business is to be transacted. This statement set forth the material facts concerning such Special Business.
Agenda Item (6) Transmission of Annual Audited Financial statements through CD/DVD/ USB
Securities and Exchange Commission of Pakistan vide its S.R.O. 470(I)2016 dated 31st May 2016 allowed Companies to transmit their Annual Reports including the Annual Accounts, Notice of the General Meeting and other information contained therein, to its members either through CD/DVD or USB, at their registered addresses. However, shareholders will have option available with them to request for a hard copy free of cost subject to submission of duly filled request form (available on Company’s website).
Those shareholders who wish to receive hard copies for all future Annual Reports shall submit their preference in writing. Kindly also note that in pursuance of SRO 787(I) 2014 dated 8th September 2014, the Company will continue to provide Annual Audited Accounts through email to those shareholders who will give their consent in this regard. A standard request form has been made available at our website – http://www.dawoodhercules.com either to opt to receive future Annual Reports through email or in hard copies or otherwise request for hard copy of the accounts if and when needed. The scanned copy of the duly filled & signed form may be emailed at [email protected] or the same can be submitted through post/courier to Company’s Share Registrar M/s. FAMCO Associates (Private) Limited, 8-F, Next to Hotel Faran, Block-6, P.E.C.H.S, Shahrah-e- Faisal, Karachi.
None of the Directors of the Company have any direct or indirect interest in the above said special business.
46 Dawood Hercules Corporation Limited

Dawood Hercules won the PSX Top 25 Companies Award 2015 (received in 2016)
Annual Report 2016 47

FOOD & ENERGY
MAKING
AVAILABLE, AFFORDABLE, SUSTAINABLE
48 Dawood Hercules Corporation Limited

THE DAWOOD FOUNDATION (TDF)The Dawood Foundation (TDF), since its inception, is committed to support and promote educational initiatives at every strata of society. The Foundation strongly believes that education plays an integral role in inspiring positive social change in a nation. In the year 2016, TDF increased its focus on promoting the concept of informal learning spaces that are inclusive and accessible to all. TDF focused on investing in initiatives that helped individuals to realize their respective responsibility towards making society a better place to live.
TDF Nature SeriesTDF carried forward the dissemination drive for TDF Nature Series to raise awareness amongst students, local communities and the public about the importance of preserving Pakistan’s natural heritage, recognizing successes and challenges for nature conservation.
Partnership with Pakistan Association of Mental Health (PAMH) TDF partnered with PAMH to launch a campaign on educating people and creating awareness regarding mental illness in our society.
Annual Report 2016 49

50 Dawood Hercules Corporation Limited

Annual Report 2016 51

FOOD & ENERGY
MAKING
AVAILABLE, AFFORDABLE, SUSTAINABLE
52 Dawood Hercules Corporation Limited
TDF MAGNIFI-SCIENCE EXHIBITIONKeeping the objective in focus to encourage science and critical thinking in society and providing an informal learning space for all, TDF also launched its new initiative – TDF Magnifi-Science Exhibition; a Science exhibition held from 23rd to 25th September in Karachi. The exhibition featured a variety of interactive experiments, exhibits, workshops, lectures and documentaries where visitors performed experiments and had a firsthand experience of Science. TDF Magnifi-Science became a great platform to gather science clubs and enthusiasts from across the country to interact. The exhibition attracted over 40,000 visitors during three days including students from government and private institutions, government and business dignitaries and people at large.
Collaboration with World Food Programme (WFP)WFP Pakistan in collaboration with TDF initiated an awareness campaign to promote best nutrition practices in the communities of district Tharparkar.
Annual Report 2016 53

E x h i b i t i o n
The Dawood Foundation’s
54 Dawood Hercules Corporation Limited

Annual Report 2016 55

The Directors of Dawood Hercules Corporation Limited (the Company) are pleased to present the Annual Report and the Audited Financial Statements for the year ended 31 December 2016.
A. Business Report
I. Economic scenario
Global Economy:
The global economy accelerated in the final quarter of 2016 due to a combination of improved conditions in emerging market countries and stronger growth in developed economies. It expanded 2.7% year-on-year in Q4, above the 2.5% rise in Q3 and the strongest point in the full year. Q4’s strong reading brought total growth for 2016 to 2.6%, a notch above the 2.5% previously forecast but well below 2015’s 3.0%. Despite the deceleration in 2016, the global economy managed to navigate its way through troubled waters and perform at a still decent rate. Challenging weather conditions, led by a severe El Niño weather effect, seriously damaged the agricultural sector in some countries, particularly in emerging markets.
Economic dynamics among developing economies are improving gradually following some quarters of sluggish growth. The increase in commodity prices that started in the final quarter of 2016 is good news for the majority of emerging market nations.
Nevertheless, the biggest risk to the global outlook is a rise in protectionism, which could put an end to the era of multinational trade agreements that has defined global economics in recent decades. In this regard, on 23 January 2017, President Trump decided to pull the United States out of the Trans-Pacific Partnership (TPP), a massive trade deal that included around 40% of the world’s GDP and was a pivotal element of the US strategy to provide a counterweight to China’s rising role. All eyes are now on the measures he could announce against China, which enjoys a healthy trade surplus with the U.S. Any significant trade barrier against China could lead to a trade war between the world’s two largest economies, which could have a potential of massively straining the world economy.
Local Economy:Economic growth is showing signs of sustained recovery aided by falling commodity and fuel prices, increased energy availability and improved security conditions. Preliminary data for FY2016 shows industrial growth accelerating on the back of higher activity in large-scale manufacturing and construction, the latter being driven primarily by initiation of China Pakistan Economic Corridor (CPEC) infrastructure and energy projects.
The improved industrial performance is expected to compensate, to some extent, the weather setbacks observed in the agriculture sector. Moreover, services sector is expected to also grow led by the financial sector, substantial automobile retail sales, increased port activity, and higher telecom profits.
Despite some gains, Pakistan’s low human development indicators undermine its labor force productivity and economic growth. Access to education remains low and completion rate for primary education is among the lowest in the world.
Pakistan’s economy during FY2016 recorded a growth of 4.71 percent which is the highest growth achieved since 2008-09. This fell short of the targeted growth rate of 5.5 percent due to lower growth of agriculture sector (0.19) percent mainly due to decrease in production of cotton, rice and maize. However, Industrial sector recorded growth of 6.80 percent and Services sector accelerated at the rate of 5.71 percent.
Despite global recession in equity market owing to outflow of foreign equity investment, PSX has witnessed a significant overall steady rise in the stock market indices resulting in PSX 100 index reaching 47,806 level on 30 December 2016 registering a gain of 45.7% percent compared to only 2% in 2015. This impressive performance was due to (i) upgrade of Pakistani stock market from Frontier to Emerging Market, (ii) high local liquidity, (iii) growing economy, (iv) progress on CPEC projects and (v) S&P upgrading Pakistan’s rating to “B” giving it a “Stable” outlook. PSX remained the top performing stock market amongst both MSCI Frontier and MSCI Emerging peers. Even continuous foreign selling
DIRECTORS’ REPORT
56 Dawood Hercules Corporation Limited

worth USD 339 million during the year could not dampen market enthusiasm.
II. Business Overview The Company continued with its key portfolio investments in Engro Corporation and HUBCO. Fertilizers, Food, Chemicals, and Energy were the key areas of business interest for the year.
Fertilizers: During the period, urea prices remained subdued due to a slump in the global commodity market, however in August 2016 prices increased by 34% against same period last year to US$ 240/- per ton, raising the price of urea to PKR 1,560/- per bag.
ECC has approved the allocation of 26 MMSCFD of gas to Engro Fertilizer (EFert), which is sufficient for its two plant operation. During the year, the EFert plant had its planned turnaround and hence produced 1,881 KT of urea as compared to 1,968 KT in 2015. Sales volume was 12% lower over the last year due to oversupply in the market of product carried over from 2015. Engro Fertilizer lost market share by 4% over last year to end at 30%.
Engro Fertilizer posted a consolidated revenue of PKR 77,415 million which was 12% lower than previous year. Accordingly, the profit after tax (PAT) of PKR 9,283 million registered a 37% decline over last year. This decline was attributable mainly to low off take and multiple price cuts, which was partly offset by lower renegotiated finance rates on long term and short term finances.
For the financial year 2016, EFert recommended a cash dividend of PKR 2.5/- per share in addition to interim cash dividend of Rs. 4.5 per share already paid for the approval of its shareholders at the forthcoming Annual General Meeting.
Foods As a part of its portfolio diversification and capital allocation strategy, Engro Corp took a number of initiatives to rebalance its investments across its defined growth pillars. One such initiative was to divest its majority investment in Engro
Foods(EFoods). In December 2016, ECorp sold 361 million shares of Engro Foods to Friesland Campina Pakistan Holding B.V., a wholly owned subsidiary of Royal Friesland Campina M.V. (RFC), at a price of PKR 120.15 per share. Engro Corp is now the second largest shareholder of Engro Foods, with a significant ownership of 40%. This deal was also the single largest contributor to the foreign exchange reserves of the country in 2016.
EFoods had a very challenging year amidst intense competition and new entrants resulting in temporary shifts in consumer preferences. The Government opted to tax the dairy sector further by imposing regulatory duty on imported dairy powder and re-categorizing dairy products.
Resultantly, EFoods posted consolidated revenues of PKR 44,300 million - a decline of 11% over last year. Engro Foods reported a net profit of PKR 2,387 million as compared to PKR 3,162 million, a decline of 24.5%.
For the financial year 2016, Engro Foods recommended a cash dividend of PKR 10/- per share for the approval of its shareholders at the forthcoming Annual General Meeting.
Energy and Energy Infrastructure:Engro Powergen Qadirpur Limited (EPQL) demonstrated a billable availability factor of 100.3% as compared to 99.7% for the similar period last year. However, an auto power transformer failure at the power purchaser end meant a lower dispatch of 1,265 GWh at a load factor of 67.2% as compared to 76.7% last year. EPQL posted a revenue of PKR 11,452 million registering a decrease of 14.2% over last year, with net profit at PKR 1,788 million - marginally lower by PKR 10 million.
The wind power plant Tenaga Generasi Limited (TGL) was commissioned on 11th October 2016 and dispatched total energy of 18 GWh till the end of
Annual Report 2016 57

the year. Total revenue for the period was reported at PKR 292.31 million.
Sindh Engro Coal Mining Project (SECMC) completed all condition precedents under the financing agreements and achieved financial close on 4 April, 2016. EPC contractors have mobilized on site and overburden removal started in May 2016. Drilling of 27 wells has been completed which enabled SECMC to commence dewatering of aquifers in the first quarter 2017. Gorano reservoir is substantially complete and is ready to receive water.
The HUB Power Company Limited (HUBCO) has established a wholly-owned subsidiary, Thar Energy Limited (TEL) as an SPV for a 1x330 megawatt (MW) Thar Lignite Coal-based mine mouth Power Plant in the Energy Park associated with Block II, Thar coalfields in Sindh. TEL tariff application was approved by NEPRA in October and PPIB issued Letter of Support (LOS) in December. TEL has also signed the Engineering, Procurement and Construction (EPC) contract in December. Subsequent to the period end, the IA and PPA of TEL have been initialled on January 25, 2017.
HUBCO has completed demerger of its Narowal Plant and said plant along with its all assets and liabilities are in the process of being vested in Narowal Energy Limited (NEL). NEL is a wholly owned subsidiary company of HUBCO.
HUBCO for the half year ended 31 December 2016 dispatched consolidated energy worth PKR 48,227 million as compared to PKR 50,281 million for the similar period last year. The decrease mainly relates to the major overhaul of one unit at Hub plant and maintenance of five engines of Narowal Plant. Consolidated net profit was PKR 5,069 million as against PKR 5,308 million in 2015. Consolidated EPS was PKR 4.38 as against 4.59 for the similar period last year.
Polymer and ChemicalsDuring 2016, Engro Polymers and Chemicals Limited (EPCL) demonstrated improved performance and increased productivity whereby PVC production 172 KT, VCM at 174KT and caustic soda at 103 KT which was the highest ever production for EPQL. EPQL posted a PAT of PKR 660 million as compared to a loss of PKR 644 million over last year.
B. Financial ReportI. Financial performanceThe consolidated topline of the Group was PKR 157 billion as compared to PKR 182 billion for the similar period last year. The consolidated gross profit of the Group for 2016 at PKR 35.84 billion was lower by PKR 9.38 billion mainly due to subdued performance by EFert and EFoods. During the year the group disposed of 51% shares of EFoods to Friesland Campina and a one off capital gain of PKR 34 billion was recognized. Further a gain of PKR 24 billion was also recognized on re-measurement of investments in EFoods. The share of profit from associated companies and joint ventures at PKR 3 billion was 16% higher over 2015. After accounting for tax charge of PKR 9 billion, the profit after tax of PKR 73 billion was higher by PKR 52.07 billion over 2015.
On standalone basis, revenue of the Company was PKR 7,422 million as against PKR 21,932 million for the similar period last year i.e. lower by PKR 14,510 million mainly on account of one-time dividend from ex-subsidiary company (DH Fertilizers Limited). After accounting for all the expenditures the net profit after tax was PKR 5,470 million as against PKR 20,194 million for 2015.
II. Earnings per shareThe unconsolidated earnings per share for the year 2016 was PKR 11.37 per share as compared to PKR 41.96 per share for the year 2015. Consolidated earnings per share for the year were PKR 53.12 (2015: PKR 19.17) per share.
III. AuditorsThe present auditors, Messrs. A.F. Ferguson & Co., Chartered Accountants are retiring at the conclusion of the forthcoming annual general meeting and offer themselves for reappointment. The Audit Committee has recommended the re-appointment of A.F. Ferguson & Co., Chartered Accountants as auditors of the Company for the year ending 31 December 2017 and the Board has endorsed this recommendation.
IV. Shares traded, average prices and PSXDuring the year 74.6 million shares of the Company were traded on the Pakistan Stock Exchange. The average price of the Company’s share based on
58 Dawood Hercules Corporation Limited

the daily closing rate was PKR 132.82 while the 52 week low-high during 2016 was PKR 100.42 - PKR 165.00 per share respectively.
V. Pattern of shareholdingThe pattern of shareholding of the Company as at 31 December 2016, together with other necessary information, is available at the end of this report along with the proxy form.
VI. Market capitalization and book valueAt the close of the year, the market capitalization of the Company was Rs. 69,464 million (2015: 57,341 million) with a market value of Rs. 144.33 per share (2015: Rs. 119.14) and the breakup value of Rs. 64.08 per share (2015: Rs. 70.22 per share).
VII. AppropriationThe Board is pleased to propose a final cash dividend of Rs. 2 per share (20%) for approval by the shareholders in the 49th Annual General Meeting. The total dividend attributable to the year is PKR 15.5 per share (155%) including the interim dividend of PKR 13.5 per share (135%) during the year.
VIII. Entity ratingDuring the year, PACRA has maintained the long term credit rating at AA-. The short term rating was also maintained at A1+ with a stable outlook.
IX. Contribution to the national exchequer and economyDuring the year, in aggregate, a sum of PKR 42,150 million (2015: PKR 41,540 million) was paid as taxes and levies.
X. Provident and Gratuity FundsThe funded retirement benefits of the employees of the Company are audited once a year and are adequately covered by appropriate investments. The value of the investments of the provident fund as per the unaudited accounts aggregated to PKR 58.74 million (2015: PKR 58.24 million)
Fair value of the assets of the funded defined benefit gratuity plan was PKR 16.88 million as at 31 December 2016 (2015: PKR 20.41 million).
Name of the Director Meetings attendedBoard Meetings Board Audit Committee Board Compensation
CommitteeMr. Hussain Dawood 5/6 - 2/3Mr. Samad Dawood 6/6 - -Mr. Muhammad Abdul Aleem 6/6 4/4 3/3Mr. Shahzada Dawood 4/6 - -Ms. Sabrina Dawood 5/6 - -Mr. Parvez Ghias 5/6 4/4 3/3Mr. Hasan Reza ur Rahim 3/6 3/4 -Mr. Saad Raja 3/6 - -Mr. Frank Murray Jones 0/6 - -Mr. Shabbir Hussain Hashmi 6/6 - -Mr. Inam ur Rahman* 2/2 - -
*Appointed as Chief Executive and a Deemed Director 1 December 2016
XI. Board of Directors
The Board comprises of eleven directors. The composition of the board members is as follows:Independent Directors 5Non-Executive Directors 4Executive Directors 2 (Including one deemed director)
XII. Board meetingsSix meetings of the Board were held during the year 2016, which were all presided over by the Chairman. The Company Secretary and Chief Financial Officer also attended the meetings as required by the Code of Corporate Governance. Attendance by each Director was as follows:
Annual Report 2016 59

XIII. Statement of Directors responsibility The Directors confirm compliance with
Corporate and Financial Reporting Framework as per the Listing Regulations of the Stock Exchange in Pakistan as follows:
a. The financial statements prepared by the management of the Company, present its state of affairs fairly, the result of its operations, cash flows and change in equity.
b. Proper books of accounts of the Company have been maintained.
c. Appropriate accounting policies have been consistently applied in preparation of the financial statements. Accounting estimates are based on reasonable prudent judgment.
d. International Financial Reporting Standards, as applicable in Pakistan, have been followed in preparation of the financial statements and any departures therefrom have been adequately disclosed.
e. The system of internal controls is sound in design and has been effectively implemented and monitored.
f. There are no significant doubts upon the Company’s ability to continue as a going concern.
g. There is no material departure from the best practices of corporate governance, as detailed in the Listing Regulations.
h. Key operating and financial data for the last six years in summarized form are annexed to the report.
XIV. Directors training program
During the year one more director has completed the Corporate Governance Leadership Skills Program - Director Education Program as required by Securities & Exchange Commission of Pakistan.
XV. Related party transactionsIn accordance with the requirements of Code of Corporate Governance, the Company presented
all related party transactions before the Audit Committee and the Board for their review and approval, respectively.
XVI. Future outlookGeneralThe investments of the group in the energy sector make it the largest partner for the Chinese under the CPEC program with interests in both coal mining and energy. In line with our ambition to solve problems of national importance, the next two years will be the time when most of these energy assets come online, propelling Pakistan towards energy sufficiency. We will continue to look at emerging energy technologies, especially in the renewable sector, where emphasis on fossil fuels can be reduced in the coming years. We expect impact of CPEC in other areas of the economy and foresee other foreign investments following suit.
Our partnership with Royal Friesland Campina is expected to usher in a new wave of products and technologies to drive the dairy and food sector. This is in line with our vision to contribute strongly to the nutrition sector.
The fertilizer business has a key role going forward as Engro Fertilizer looks to promote practices and techniques that enhance productivity and farm yield. It is believed that technology has a key role to play in the area of farm efficiencies that will benefit the average citizen and also improve farmer economics.
Regulatory EnvironmentThe regulatory environment is becoming increasingly complex within the country as Pakistan tries to bring in more corporate transparency. However, we see most of the focus on large corporate players and are concerned that this is impacting growth. Tax on intercorporate dividends, as an example, reduces the incentive for organizations to structure themselves for large scale expansion. Onerous reporting requirements can also discourage international players from investing in Pakistan.
The ever increasing number of young people joining the workforce everyday requires a strong and vibrant corporate sector to absorb them and convert them into contributing citizens. The Government nor the unorganized sector will be able to provide sufficient employment opportunities to millions of aspirants.
60 Dawood Hercules Corporation Limited
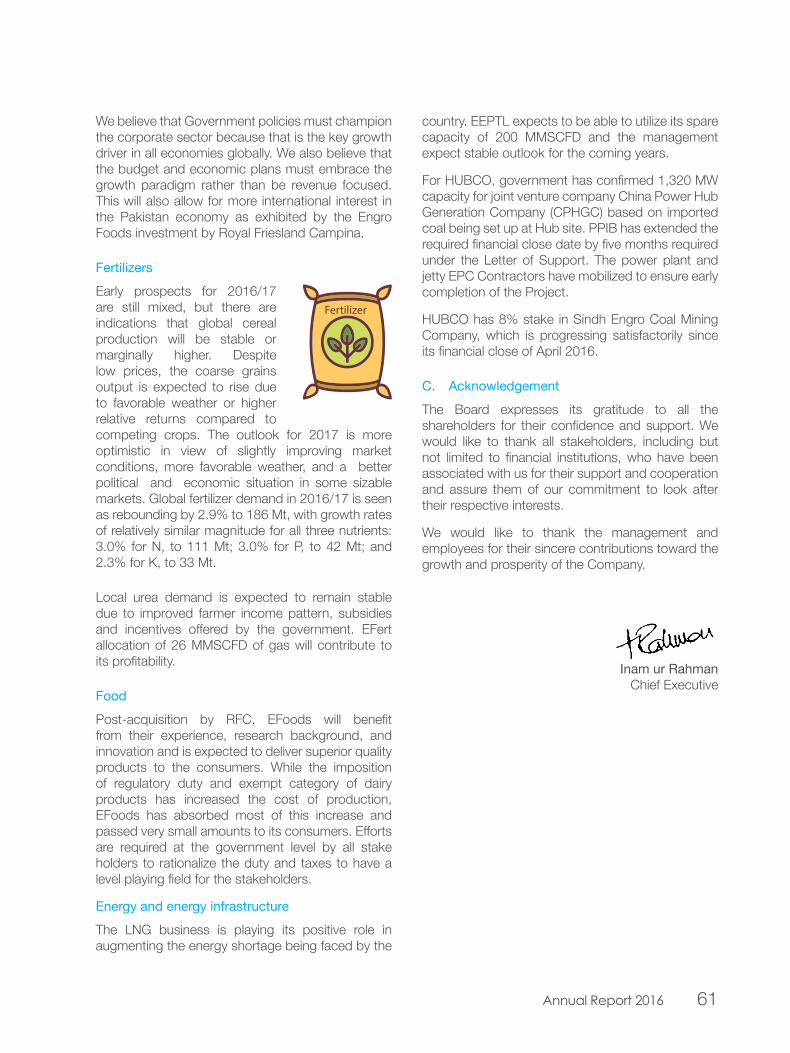
We believe that Government policies must champion the corporate sector because that is the key growth driver in all economies globally. We also believe that the budget and economic plans must embrace the growth paradigm rather than be revenue focused. This will also allow for more international interest in the Pakistan economy as exhibited by the Engro Foods investment by Royal Friesland Campina.
FertilizersEarly prospects for 2016/17 are still mixed, but there are indications that global cereal production will be stable or marginally higher. Despite low prices, the coarse grains output is expected to rise due to favorable weather or higher relative returns compared to competing crops. The outlook for 2017 is more optimistic in view of slightly improving market conditions, more favorable weather, and a better political and economic situation in some sizable markets. Global fertilizer demand in 2016/17 is seen as rebounding by 2.9% to 186 Mt, with growth rates of relatively similar magnitude for all three nutrients: 3.0% for N, to 111 Mt; 3.0% for P, to 42 Mt; and 2.3% for K, to 33 Mt.
Local urea demand is expected to remain stable due to improved farmer income pattern, subsidies and incentives offered by the government. EFert allocation of 26 MMSCFD of gas will contribute to its profitability.
FoodPost-acquisition by RFC, EFoods will benefit from their experience, research background, and innovation and is expected to deliver superior quality products to the consumers. While the imposition of regulatory duty and exempt category of dairy products has increased the cost of production, EFoods has absorbed most of this increase and passed very small amounts to its consumers. Efforts are required at the government level by all stake holders to rationalize the duty and taxes to have a level playing field for the stakeholders.
Energy and energy infrastructureThe LNG business is playing its positive role in augmenting the energy shortage being faced by the
country. EEPTL expects to be able to utilize its spare capacity of 200 MMSCFD and the management expect stable outlook for the coming years.
For HUBCO, government has confirmed 1,320 MW capacity for joint venture company China Power Hub Generation Company (CPHGC) based on imported coal being set up at Hub site. PPIB has extended the required financial close date by five months required under the Letter of Support. The power plant and jetty EPC Contractors have mobilized to ensure early completion of the Project.
HUBCO has 8% stake in Sindh Engro Coal Mining Company, which is progressing satisfactorily since its financial close of April 2016.
C. AcknowledgementThe Board expresses its gratitude to all the shareholders for their confidence and support. We would like to thank all stakeholders, including but not limited to financial institutions, who have been associated with us for their support and cooperation and assure them of our commitment to look after their respective interests.
We would like to thank the management and employees for their sincere contributions toward the growth and prosperity of the Company.
Inam ur Rahman Chief Executive
Annual Report 2016 61

FOOD & ENERGY
MAKING
AVAILABLE, AFFORDABLE, SUSTAINABLE
62 Dawood Hercules Corporation Limited

SEaDS NET(STRENGTHENING ENTREPRENEURS AND DAIRY STAKEHOLDERS NETWORK)
KFW-DEG co-funded this innovative project in dairy value chain where 50 women entrepreneurs, trained earlier by Engro and currently providing essential services of animal health care and milk aggregation to smallholder farmers, are being trained to enhance the impact of their micro-enterprises by use of technology, adding more services and increasing their geographical coverage. The project is training 7,000 smallholder farmers in better livestock management practices through a series of trainings and establishing farmer groups.
Impact Achieved:
• 5,041 beneficiaries trained till August 2016 • PKR 9,188 – Average income in August 2016• 243% increase in average vs August 2015 • 144 successful trainings completed till August 2016• Feasibility of Silage Social Enterprise completed
Annual Report 2016 63

FOOD & ENERGY
MAKING
AVAILABLE, AFFORDABLE, SUSTAINABLE
64 Dawood Hercules Corporation Limited

HUBCO CSRHubco’s CSR program focuses on healthcare, education, infrastructure development and livelihood of the less privileged in the society. Realizing the frequent load shedding/outages of Electricity at Jam Ghulam Qadir Hospital in Hub, company decided to provide the hospital with a Solar Power generation system of 15 KW capacity. While Hubco runs a fully funded solar-powered school in Hub, another primary School is under construction since March 2016 in the existing school site which is being managed by The Citizens Foundation (TCF). A solar power R.O. plant of 1800 gallons/day capacity has also been installed at the same site.
Hubco has signed an MoU with HUNAR Foundation for providing vocational training to 40-students where company will bear all the expenses incurred during the course. Further supporting the livelihood of the local community, Hubco sponsored an NGO M/s CARD to provide training to about 100 fishermen on preservation of fish. Hubco also launched an initiative to supply clean drinking water to neighbouring villages in 2016.
Annual Report 2016 65
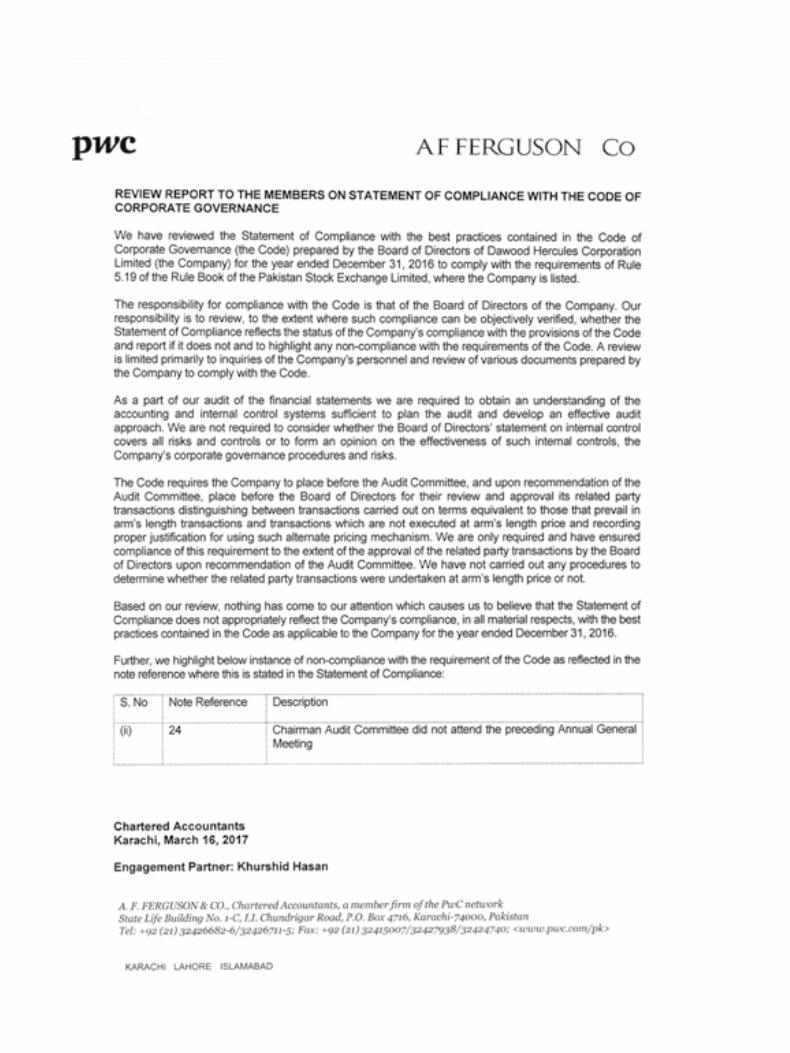

This statement is being presented to comply with the Code of Corporate Governance (the Code) contained in the Regulation No. 5.19 of listing regulations of Pakistan Stock Exchange for the purpose of establishing a framework of good governance, whereby a listed company is managed in compliance with the best practices of corporate governance.
The Company has applied the principles contained in the Code in the following manner:
1. The Company encourages representation of independent non-executive Directors and Directors representing minority interests on its Board of Directors (the Board). At present the Board includes:
Category Names
Independent Directors Mr. M. Abdul AleemMr. Pervez GhiasMr. Shabbir Hussain HashmiMr. Frank Murray JonesMr. Saad Raja
Executive Directors Mr. Samad DawoodMr. Inam ur Rahman
Non-Executive Directors Mr. Hussain DawoodMr. Shahzada DawoodMs. Sabrina DawoodMr. Hasan Reza Ur Rahim
The independent Directors meet the criteria of independence under clause 5.19.1 (b) of the Code.
2. The Directors have confirmed that none of them is serving as a Director on more than seven listed Companies, including this Company (excluding the listed subsidiaries of listed holding companies where applicable).
3. All the resident Directors of the Company are registered as taxpayers and none of them has defaulted in payment of any loan to a banking company, a DFI or an NBFI or, being a Broker of a Stock Exchange, has been declared as a defaulter by that Stock Exchange.
4. No casual vacancy occurred on the Board during the year.
5. The Company has prepared a “Code of Conduct”, and has ensured that appropriate steps have been taken to disseminate it throughout the Company along with its supporting policies and procedures.
6. The Board has developed a vision/mission statement, overall corporate strategy and significant policies of the Company. A complete record of particulars of significant policies along with the dates on which they were approved or amended has been maintained.
7. All the powers of the Board have been duly exercised and decisions on material transactions, including appointment and determination of remuneration and terms and conditions of employment of the Chief Executive Officer (CEO), other executive and non-executive directors, have been taken by the Board.
8. The meetings of the Board were presided over by the Chairman and in his absence, by a Director elected by the Board for this purpose and the Board met at least once in every quarter. Written notices of the
STATEMENT OF COMPLIANCE WITH THE CODE OF CORPORATE GOVERNANCE
Annual Report 2016 67

Board meetings, along with agenda and working papers were circulated at least seven days before the meetings. The minutes of the meetings were appropriately recorded and circulated.
9. During the year one Director has attended the director’s training program.
10. The Board has approved the appointment of Chief Financial Officer (CFO) and Company Secretary and Head of Internal Audit, including their remuneration and terms and conditions of employment.
11. The Directors’ report for this year has been prepared in compliance with the requirements of the Code and fully describes the salient matters required to be disclosed.
12. The financial statements of the Company were duly endorsed by the CEO and the CFO before approval of the Board.
13. The Directors, CEO and executives do not hold any interest in the shares of the Company other than those disclosed in the pattern of shareholding.
14. The Company has complied with all the corporate and financial reporting requirements of the Code.
15. The Board has formed an Audit Committee (the Committee). It comprises of three members, of whom two are independent directors and one is a non-executive director. The Chairman of the Committee is an independent director.
16. The meetings of the Audit Committee were held at least once every quarter prior to the approval of interim and final results of the Company and as required by the Code. The terms of reference of the Committee have been formed and advised to the Committee for compliance.
17. The Board has formed a Human Resource and Remuneration Committee called as Board Compensation Committee. It comprises of three members, of whom two are independent directors and one is a non-executive director. The Chairman of the Committee is a non-executive director.
18. The Board has outsourced the internal audit function of the Company to a firm of Chartered Accountants who are considered suitably qualified and experienced for the purpose and are conversant with the policies and procedures of the Company. The Board has appointed the Head of Internal Audit to act as a coordinator between the firm of Chartered Accountants and the Board.
19. The statutory auditors of the Company have confirmed that they have been given a satisfactory rating under the quality control review program of the Institute of Chartered Accountants of Pakistan (ICAP), that they or any of the partners of the firm, their spouses and minor children do not hold shares of the Company and that the firm and all its partners are in compliance with the International Federation of Accountants (IFAC) guidelines on code of ethics as adopted by the ICAP.
20. The statutory auditors or the persons associated with them have not been appointed to provide other services except in accordance with the Listing Regulations and the auditors have confirmed that they have observed IFAC guidelines in this regard.
21. The ‘closed period’, prior to the announcement of interim/final results and business decisions, which
68 Dawood Hercules Corporation Limited
may materially affect the market price of the Company’s securities, was determined and intimated to Directors, employees and Stock Exchange.
22. Material/price sensitive information has been disseminated among all market participants at once through Stock Exchange.
23. The company has complied with the requirements relating to maintenance of register of persons having access to inside information by designated senior management officer in a timely manner and maintained proper record including basis for inclusion or exclusion of names of persons from the said list.
24. As per the Code, Chairman, Audit Committee shall be present at the Annual General Meeting for any feedback required by the shareholders. The Chairman, Audit Committee was ex-Pakistan and hence has not attended the Annual General Meeting. However, the other member of the Audit Committee was present for any feedback required by the shareholders.
25. We confirm that all other material principles enshrined in the Code have been complied with.
Inam ur Rahman Chief Executive
Annual Report 2016 69

FOOD & ENERGY
MAKING
AVAILABLE, AFFORDABLE, SUSTAINABLE
70 Dawood Hercules Corporation Limited

FARMER CONNECT PROJECTFarmer Connect Project which is externally known as Rahbar, is the biggest CSR initiative in the history of Engro Fertilizers. Around 500,000 small to medium farmers in the wheat-rice growing areas will benefit from the project.
The farmers in these areas face numerous challenges of which the biggest are: lack of knowledge on input applications, out dated farming techniques and little access to new technology. This project aims to address these issues through knowledge based interventions at every crop stage by the use of ICT based knowledge dissemination, soil testing for optimum input applications, farmer field schools, and community mobilization.
The project also places a special emphasis on capacity building of women, who are directly involved in farm activities such as grain handling, seed cleaning and grazing.
Annual Report 2016 71

STATEMENTSFINANCIAL


As at December 31, 2016
KarachiFebruary 28, 2017
Inam ur RahmanChief Executive
M. Abdul AleemDirector
Balance Sheet
Note 2016 2015---------- (Rupees in ‘000) ----------
ASSETSNON CURRENT ASSETSProperty, plant and equipment 4 125,761 130,733 Intangible assets 5 - 1 Long term investments 6 37,478,025 37,573,738 Defined benefit asset 7 - 2,593
37,603,786 37,707,065 CURRENT ASSETSAdvances, deposits and prepayments 8 44,604 41,899 Other receivables 9 15,735 114,532 Cash and bank balances 10 286,288 1,008,059
346,627 1,164,490
TOTAL ASSETS 37,950,413 38,871,555
EQUITY AND LIABILITIESSHARE CAPITAL AND RESERVESAuthorised share capital 11 10,000,000 10,000,000
Issued, subscribed and paid up share capital 11 4,812,871 4,812,871 Revenue reserves 12 26,025,985 28,982,384
30,838,856 33,795,255 NON CURRENT LIABILITIESLong term financing 13 3,125,000 3,889,143 Defined benefit liability 7 2,049 587
3,127,049 3,889,730 CURRENT LIABILITIESCurrent portion of long term financing 13 764,143 103,442 Short term running finance 14 2,868,932 431,808 Trade and other payables 15 245,988 446,982 Accrued mark-up 99,640 99,642 Taxation - net 5,805 104,696
3,984,508 1,186,570
TOTAL EQUITY AND LIABILITIES 37,950,413 38,871,555
CONTINGENCIES AND COMMITMENTS 16
The annexed notes 1 to 33 form an integral part of these financial statements.
74 Dawood Hercules Corporation Limited

For the year ended December 31, 2016
KarachiFebruary 28, 2017
Inam ur RahmanChief Executive
M. Abdul AleemDirector
Profit and loSS account
Note 2016 2015---------- (Rupees in ‘000) ----------
Dividend income 17 7,421,534 21,931,652 Administrative expenses 18 (746,348) (1,290,068) 6,675,186 20,641,584 Other operating expenses 19 (2,241) (7,160)Other income 20 13,898 291,137 Operating profit 6,686,843 20,925,561
Finance cost 21 (392,679) (218,603)Profit before taxation 6,294,164 20,706,958
Taxation 22 (823,923) (512,582)
Profit after taxation 5,470,241 20,194,376
Earnings per share (Rupees) – basic and diluted 23 11.37 41.96
The annexed notes 1 to 33 form an integral part of these financial statements.
Annual Report 2016 75

For the year ended December 31, 2016Statement of total comPrehenSive income
2016 2015---------- (Rupees in ‘000) ----------
Profit after taxation 5,470,241 20,194,376
Other comprehensive income for the year
Item that will not be reclassified to profit and loss accountRemeasurement of staff - retirement benefit obligation (4,116) (206)
Total comprehensive income for the year 5,466,125 20,194,170
The annexed notes 1 to 33 form an integral part of these financial statements.
KarachiFebruary 28, 2017
Inam ur RahmanChief Executive
M. Abdul AleemDirector
76 Dawood Hercules Corporation Limited

For the year ended December 31, 2016Statement of changeS in equity
--------------- Revenue reserves ---------------Issued,
subscribedand paid up share capital
General reserve
Unappropriated profit Sub-total Total
--------------------------------- (Rupees in ‘000) ---------------------------------
Balance as at January 1, 2015 4,812,871 700,000 14,344,945 15,044,945 19,857,816
Total comprehensive income
Profit for the year - - 20,194,376 20,194,376 20,194,376 Other comprehensive income - - (206) (206) (206)
- - 20,194,170 20,194,170 20,194,170
Transactions with owners
Final cash dividend @10% for the yearended December 31, 2014 - - (481,287) (481,287) (481,287)
Interim cash dividend @120% for theyear ended December 31, 2015 - - (5,775,444) (5,775,444) (5,775,444)
Balance as at December 31, 2015 4,812,871 700,000 28,282,384 28,982,384 33,795,255
Total comprehensive income
Profit for the year - - 5,470,241 5,470,241 5,470,241 Other comprehensive income - - (4,116) (4,116) (4,116)
- - 5,466,125 5,466,125 5,466,125
Transactions with owners
Final cash dividend @40% for the yearended December 31, 2015 - - (1,925,148) (1,925,148) (1,925,148)
Interim cash dividend @135% for theyear ended December 31, 2016 - - (6,497,376) (6,497,376) (6,497,376)
Balance as at December 31, 2016 4,812,871 700,000 25,325,985 26,025,985 30,838,856
The annexed notes 1 to 33 form an integral part of these financial statements.
KarachiFebruary 28, 2017
Inam ur RahmanChief Executive
M. Abdul AleemDirector
Annual Report 2016 77

For the year ended December 31, 2016caSh flow Statement
Note 2016 2015---------- (Rupees in ‘000) ----------
CASH FLOW FROM OPERATING ACTIVITIES
Cash utilised in operations 26 (771,033) (1,164,785)Finance cost paid (392,681) (153,109)Taxes paid (922,814) (409,897)Staff retirement and other service benefits paid (6,705) (9,503)Net cash utilised in operating activities (2,093,233) (1,737,294)
CASH FLOW FROM INVESTING ACTIVITIES
Payment for property, plant and equipment (21,766) (74,650)Sale proceeds from disposal of property, plant and equipment 3,342 5,626 Sale proceeds from disposal of subsidiaries - 2,019,343 Sale proceeds from disposal of investments - 2,000 Interest received on bank deposits and investments 9,663 11,137 Long term investments made in subsidiaries - (5,883,678)Long term investments made in associate - (12,877,421)Dividends received 7,421,534 21,931,652 Net cash generated from investing activities 7,412,773 5,134,009
CASH FLOW FROM FINANCING ACTIVITIES
Long term financing obtained - 3,750,000 Long term financing repaid (103,442) (87,880)Dividends paid (8,374,993) (6,231,826)Net cash utilised in financing activities (8,478,435) (2,569,706)
Net (decrease) / increase in cash and cash equivalents (3,158,895) 827,009
Cash and cash equivalents at the beginning of the year 576,251 (250,758)
Cash and cash equivalents at the end of the year 27 (2,582,644) 576,251
The annexed notes 1 to 33 form an integral part of these financial statements.
KarachiFebruary 28, 2017
Inam ur RahmanChief Executive
M. Abdul AleemDirector
78 Dawood Hercules Corporation Limited

For the year ended December 31, 2016
noteS to and forming Part of the financial StatementS
1. GENERAL INFORMATION
1.1 Dawood Hercules Corporation Limited (the Company) was incorporated in Pakistan on April 17, 1968 as a public limited company under the Companies Act 1913 (now Companies Ordinance, 1984) (the Ordinance) and its shares are quoted on Pakistan Stock Exchange Limited. The principal activity of the Company is to manage investments in its subsidiary and associated companies. The registered office of the Company is situated at Dawood Center, M.T. Khan Road, Karachi.
1.2 During the year ended December 31, 2015, the Company entered into re-negotiation with Pakarab Fertilizers Limited (PAFL) for the disposal of entire shareholding in its wholly owned subsidiary DH Fertilizers Limited (DHFL) and Bubber Sher (Private) Limited (BSPL) and signed a Share Purchase Agreement (SPA) with PAFL. Accordingly, the shares of DHFL and BSPL were transferred in the name of Fatima Fertilizer Company Limited (assignee of PAFL as per the terms of the SPA).
1.3 During the year ended December 31, 2015, the Company had reassessed the control conclusion of its investment in Engro Corporation Limited (ECL) as a result of adoption of International Financial Reporting Standards (IFRS) - 10 ‘Consolidated Financial Statements’, by Securities and Exchange Commission of Pakistan (SECP), that although, the Company has less than 50% voting rights in ECL, however, based on the absolute size of the Company’s shareholdings, the relative size of other shareholdings and the number of representation on ECL’s Board, the Company has the ability to exercise control over ECL as per the terms of IFRS 10. Henceforth, the Company is deemed to be Holding Company of ECL.
2. SUMMARY OF SIGNIFICANT ACCOUNTING POLICIES
The significant accounting policies applied in the preparation of these financial statements are set out below. These policies have been consistently applied to all the periods presented, unless otherwise stated.
2.1 Basis of preparation and statement of compliance
2.1.1 These financial statements have been prepared under the historical cost convention, as modified by remeasurement of certain staff retirement and other service benefits at present value.
2.1.2 These financial statements have been prepared in accordance with the requirements of the Companies Ordinance, 1984 (the Ordinance), directives issued by the Securities and Exchange Commission of Pakistan (SECP) and approved financial reporting standards as applicable in Pakistan. Approved financial reporting standards comprise of such International Financial Reporting Standards (IFRS) issued by the International Accounting Standards Board (IASB) as are notified under the provisions of the Ordinance. Wherever the requirements of the Ordinance or directives issued by the SECP differ with the requirements of these standards, the requirements of the Ordinance and the said directives have been followed.
2.2 New standards, amendments to approved accounting standards and interpretations
2.2.1 Initial application of standards, amendments or an interpretation to existing standards
a) Standards, interpretations and amendments to published approved accounting standards that are effective in 2016
Following standards, interpretations and amendments to published approved standards have been published and are mandatory for accounting periods beginning on or after January 1, 2016 and are considered to be relevant to the Company’s operations.
Annual Report 2016 79

For the year ended December 31, 2016
noteS to and forming Part of the financial StatementS
IAS 34 ’Interim financial reporting’.
This amendment clarifies what is meant by the reference in the standard to ‘information disclosed elsewhere in the interim financial report’. The amendment also amends IAS 34 to require a cross-reference from the interim financial statements to the location of that information. The amendment is retrospective. This amendment will have any significant impact on the Company’s financial statements.
IAS 1, ‘Presentation of Financial Statements’
These amendments clarify guidance in IAS 1 on materiality and aggregation, the presentation of subtotals, the structure of financial statements and disclosures of accounting policies. The amendments form a part of the IASB’s Disclosure Initiative, which explores how financial statement disclosures can be improved. The amendment only affects disclosures in the Company’s financial statements.
IAS 19, ‘Employee benefits’
The amendment clarifies that, when determining the discount rate for post-employment benefit obligations, it is the currency that the liabilities are denominated in that is important, not the country where they arise. The assessment of whether there is a deep market in high-quality corporate bonds is based on corporate bonds in that currency, not corporate bonds in a particular country. Similarly, where there is no deep market in high-quality corporate bonds in that currency, government bonds in the relevant currency should be used. The amendment is retrospective but limited to the beginning of the earliest period presented. The Company’s accounting treatment is already in line with this amendment.
IAS 27, ‘Separate financial statements’
This amendment restores the option to use the equity method to account for investments in subsidiaries, joint ventures and associates in an entity’s separate financial statements.
An entity can account for investments in subsidiaries, joint ventures and associates in its separate financial statements:
- at cost; or - in accordance with IFRS 9; or - using the equity method as described in IAS 28.
The other new standards, interpretations and amendments to published approved accounting standards that are mandatory for the financial year beginning on January 1, 2016 are considered not to be relevant or to have any significant effect on the Company’s financial reporting and operations.
b) Standards, interpretations and amendments to published approved accounting standards that are not yet effective and have not been early adopted by the Company
There are certain new standards, amendments to published standards and interpretations that are mandatory for the financial year beginning on January 1, 2017 are considered to be relevant.
IAS 7 ’Cash flow statements’.
This amendment requires disclosure to explain changes in liabilities for which cash flows have been, or will be classified as financing activities in the statement of cash flows. The amendment only covers balance sheet items for which cash flows are classified as financing activities. In case other items are included within the reconciliation, the changes in liabilities arising from financing activities will beidentified separately. A reconciliation of the opening to closing balance is not specifically required
80 Dawood Hercules Corporation Limited

For the year ended December 31, 2016
noteS to and forming Part of the financial StatementS
but instead the information can be provided in other ways. In the first year of adoption, comparative information need not be provided. It is unlikely that this standard will have any significant impact on the Company’s financial statements.
There are certain other new amendments to published approved accounting standards which will be effective for the Company for accounting period beginning after January 1, 2017 but are considered not to be relevant or to have any significant effect on the Company’s operations and are, not disclosed into these financial statements.
2.3 Property, plant and equipment
These are stated at historical cost less accumulated depreciation and impairment losses, if any, except land which is stated at cost. Historical cost includes expenditure that is directly attributable to the acquisition of the items including borrowing costs.
Assets having cost exceeding the minimum threshold as determined by the management are capitalised. All other costs are charged to profit and loss account in the year in which they are incurred.
Subsequent costs are included in the asset’s carrying amount or recognised as a separate asset, as appropriate, only when it is probable that future economic benefits associated with the item will flow to the Company and the cost of the item can be measured reliably. The carrying amount of the replaced part is derecognised. All other repairs and maintenance are charged to the profit and loss account during the financial period in which they are incurred. Major renewals and improvements, if any, are capitalised in accordance with IAS 16 “Property, Plant and Equipment” and depreciated in a manner that best represents the consumption pattern and useful lives.
Disposal of asset is recognised when significant risk and rewards incidental to ownership have been transferred to buyers. Gains and losses on disposals are determined by comparing the proceeds with the carrying amount and are recognised in ‘Other income / (loss)’ in the profit and loss account.
Depreciation is charged to profit and loss account applying the straight line method so as to write off the historical cost of the assets over their estimated useful lives at the rates stated in note 4 to the financial statements. Depreciation on additions is charged from the following month in which the asset is available for use and on disposals up to the month the asset is no longer in use. Assets’ residual values and useful lives are annually reviewed, and adjusted, if material.
The company reviews appropriateness of the rate of depreciation, useful life and residual value used in the calculation of depreciation.
2.4 Intangible assets
Intangible assets are recognised when it is probable that the expected future economic benefits will flow to the Company and the cost of the assets can be measured reliably. Cost of the intangible assets includes purchase cost and directly attributable expenses incidental to make the asset available for use in the manner as intended by management.
Intangible assets are stated at cost less accumulated amortisation and accumulated impairment losses, if any. Amortisation is charged over the estimated useful life of the asset on a systematic basis by applying the straight line method.
Costs associated with maintaining computer software are recognised as an expense as and when incurred.
Annual Report 2016 81

Useful life of intangible assets is reviewed, at each reporting date and adjusted if the impact of amortisation is significant.
2.5 Impairment of non financial assets
Assets that are subject to depreciation / amortisation are reviewed at each reporting date to identify circumstances indicating occurrence of impairment loss or reversal of previous impairment losses. An impairment loss is recognised for the amount by which the asset’s carrying amount exceeds its recoverable amount. The recoverable amount is the higher of an asset’s fair value less cost to sell and value in use. Reversal of impairment loss is restricted to the original cost of the asset.
2.6 Investments in subsidiaries
Subsidiaries are all entities over which the Company has the power to govern the financial and operating policies generally accompanying a shareholding of more than one half of the voting rights. The existence and effect of potential voting rights that are currently exercisable or convertible are considered when assessing whether the Company controls another entity. Further, the Company also considers whether:
- it has power over the investee entity;- it has exposure, rights, to variable returns from its involvement with the investee entity; and- it has ability to use its power over the investee entity to affect the amount of the Company’s
returns.
Investments in subsidiary companies are stated at cost less impairment, if any.
2.7 Investments in associates
Associates are all entities over which the Company has significant influence but not control. Investments in associates are carried at cost. The Company determines at each reporting date whether there is any objective evidence that the investment in associates is impaired. If this is the case, the Company calculates the impairment loss as the difference between the recoverable amount of associates and its carrying value and recognises it in the profit and loss account.
2.8 Other investments
Other investments are carried at cost. At subsequent reporting dates, the recoverable amounts are estimated to determine the extent of impairment losses, if any, and carrying amounts are adjusted accordingly.
2.9 Financial instruments
2.9.1 Financial assets
The Company classifies its financial assets in the following categories: at fair value through profit or loss, held to maturity, loans and receivables, and available-for-sale. The classification depends on the purpose for which the financial assets were acquired. Management determines the classification of its financial assets at initial recognition.
a) At fair value through profit or loss
Financial assets at fair value through profit or loss are financial assets held for trading and financial assets designated upon initial recognition as ‘at fair value through profit or loss’. A financial asset is classified as ‘held for trading’ if acquired principally for the purpose of selling in the short term. Assets in this category are classified as current assets. Dividend income from financial assets at fair value through profit or loss is recognized in the profit and loss account as part of other income when the Company’s right to receive payments is established.
For the year ended December 31, 2016
noteS to and forming Part of the financial StatementS
82 Dawood Hercules Corporation Limited

b) Loans and receivables
Loans and receivables are non-derivative financial assets with fixed or determinable payments that are not quoted in an active market. They are included in current assets, except those having maturities of more than twelve months after the reporting date which are classified as non-current assets. Loans and receivables with maturity period of less than twelve months after the reporting date are classified as advances, deposits and prepayments and other receivables in the balance sheet.
c) Available for sale financial assets
Available for sale financial assets are non-derivatives that are either designated in this category or not classified in any of the other categories. They are included in non-current assets unless management intends to dispose of the investments within twelve months from the reporting date. Available for sale financial assets are classified as short term investments in the balance sheet. Changes in fair value of securities classified as available for sale are recognised in equity. When securities classified as available for sale are sold or impaired, the accumulated fair value adjustments recognised directly in equity are included in the profit and loss account in the period in which the disposal takes place. Dividends on available for sale equity investments are recognised in the profit and loss account when the Company’s right to receive payments is established.
d) Held to maturity
Held to maturity financial assets are non-derivative financial assets with fixed or determinable payments and fixed maturity with a positive intention and ability to hold to maturity.
Recognition
All financial assets are recognised at the time when the Company becomes a party to the contractual provisions of the instrument. Regular purchase and sale of investments (if any) are recognised at trade date i.e. the date on which the Company commits to purchase or sell the asset.
Measurement
Financial assets are initially recognised at fair value plus transaction costs for all financial assets not carried at fair value through profit and loss. Financial assets carried at fair value through profit or loss are initially recognised at fair value and transaction costs are expensed in the profit and loss account in the year of acquisition.Available for sale financial assets and financial assets at fair value through profit or loss are subsequently carried at fair value. Loans and receivables and held to maturity investments are carried at amortised cost using the effective interest rate method.
Derecognition
Financial assets are derecognised when the rights to receive cash flows from the assets have expired or have been transferred and the Company has transferred substantially all the risks and rewards of ownership.
Impairment
The Company assesses at each reporting date whether there is objective evidence that a financial asset or group of financial assets is impaired. If any such evidence exists for ‘available for sale’ financial assets, the cumulative loss is removed from equity and recognised in the profit and loss account.
For the year ended December 31, 2016
noteS to and forming Part of the financial StatementS
Annual Report 2016 83
Impairment losses recognised in the profit and loss account on equity instruments are not reversed through the profit and loss account. In case of loans and receivables, the amount of the loss is measured as the difference between the asset’s carrying amount and the present value of estimated future cash flows discounted at the financial asset’s original effective interest rate.
2.9.2 Financial liabilities
Financial liabilities are recognised at the time when the Company becomes a party to the contractual provisions of the instrument. All financial liabilities are recognised initially at fair value less directly attributable transactions costs, if any, and subsequently measured at amortised cost using effective interest rate method.A financial liability is derecognised when the obligation under the liability is discharged or cancelled or expired. Where an existing financial liability is replaced by another from the same lender on substantially different terms, or the terms of an existing liability are substantially modified, such an exchange and modification is treated as a derecognition of the original liability and the recognition of a new liability, and the difference in respective carrying amounts is recognised in the profit and loss account.
2.9.3 Off-setting of financial assets and financial liabilities
A financial asset and a financial liability is off set and the net amount is reported in the balance sheet if the Company has a legally enforceable right to set-off the recognised amounts and intends either to settle on a net basis or to realise the asset and settle the liability simultaneously. The legally enforceable right must not be contingent on future events and must be enforceable in the normal course of business and in the event of default, insolvency or bankruptcy of the Company or the counter party.
2.10 Cash and cash equivalents
Cash and cash equivalents are carried in the balance sheet at cost. Cash and cash equivalents in the statement of cash flows includes cash in hand and in transit, cheques in hand, balances with banks on current, deposit and saving account, other short-term highly liquid investments with original maturities of three months or less. Running finance and short term finance facilities availed by the Company, which are payable on demand and form an integral part of the Company’s cash management are included as part of cash and cash equivalents for the purpose of statement of cash flows.
2.11 Staff retirement and other benefits
2.11.1 Defined benefit plan
The Company operates a defined benefit plan i.e. an approved funded gratuity scheme for all its permanent employees who have completed minimum service of prescribed period. Actuarial valuation is carried out using the projected unit credit method. The latest actuarial valuation of the scheme was carried out as at June 30, 2016. Remeasurements (actuarial gains / losses) in respect of defined benefit plan are recognized directly in equity through other comprehensive income.Unfunded gratuity scheme has been established by the Company for all of the eligible contract employees who have completed minimum service of prescribed period. Provision is recognised for the obligation at each reporting date and the adjustments are recognised in the profit and loss account in the period in which they arise.
2.11.2 Defined contribution plan
The Company operates a recognised provident fund for all its permanent employees who have completed prescribed qualifying period of service. Equal monthly contributions are made, both by the Company and its employees, to the fund at the rate of 15% of the basic salaries of employees.
For the year ended December 31, 2016
noteS to and forming Part of the financial StatementS
84 Dawood Hercules Corporation Limited

2.11.3 Employee compensated absences
The Company provides for compensated absences for all eligible employees in accordance with the rules of the Company. Accordingly, the provision for compensated absences has been made at actual amounts.
2.12 Trade and other payables
Trade and other payables are recognized initially at fair value and subsequently measured at amortized cost using the effective interest method.
These are classified as current liabilities if payment is due within one year or less (or in the normal operating cycle of the business if longer). If not, they are presented as non-current liability.
Exchange gains and losses arising in respect of liabilities in foreign currency are added to the carrying amount of the respective liabilities.
2.13 Provisions
Provisions are recognised when the Company has a legal or constructive obligation as a result of past events and it is probable that an outflow of resources embodying economic benefits will be required to settle the obligation and a reliable estimate of the amount can be made. Provisions are reviewed at each reporting date and adjusted to reflect current best estimate.
2.14 Dividend
Dividend distribution to the Company’s shareholders is recognised as a liability in the period in which dividend is approved by the shareholders in case of final dividend, and in case of interim dividend on the date of commencement of the book closure period.
2.15 Income tax
The tax expense for the year comprises current and deferred tax. Tax is recognised in the profit and loss account, except to the extent that it relates to items recognised in other comprehensive income or directly in equity. In which case, the tax is also recognised in other comprehensive income or directly in equity.
Current
Provision for current taxation is based on the taxable income for the year calculated on the basis of the tax laws enacted or substantively enacted at the reporting date, and any adjustment to tax payable in respect of previous years.
Deferred
Deferred tax is recognized using the balance sheet method, providing for all temporary differences between the carrying amounts of assets and liabilities for financial reporting purposes and the amounts used for taxation purposes. Deferred tax is measured at the tax rates that are expected to be applied to the temporary differences when they reverse, based on the laws that have been enacted or substantively enacted by the reporting date.A deferred tax asset is recognized to the extent that it is probable that future taxable profits will be available against which temporary difference can be utilized. Deferred tax assets are reviewed at each reporting date and are reduced to the extent that it is no longer probable that the related tax benefit will be realized.
For the year ended December 31, 2016
noteS to and forming Part of the financial StatementS
Annual Report 2016 85
2.16 Contingent liabilities
Contingent liabilities are disclosed when:
- there is a possible obligation that arises from past events and whose existence will be confirmed only by the occurrence or non occurrence of one or more uncertain future events not wholly within the control of the Company; or
- there is a present obligation that arises from past events but it is not probable that an outflow of resources embodying economic benefits will be required to settle the obligation or the amount of the obligation cannot be measured reliably.
2.17 Revenue recognition
- Dividend income is recognised when the Company’s right to receive dividend is established i.e. on the date of book closure of the investee company declaring the dividend.
- Returns on bank deposits are accrued on a time proportion basis by reference to the principal outstanding amounts and the applicable rates of return.
- Gains / (losses) arising on disposal of investments are included in income in the year in which they are disposed off.
- Unrealised gains / (losses) arising on revaluation of securities classified as ‘available for sale’ and ‘fair value through profit or loss’ are included in other comprehensive income and in profit and loss account in the period in which they arise respectively. When securities classified as available for sale are sold or impaired, the accumulated fair value adjustments recognised in the equity through other comprehensive income, are included in the profit and loss account in the period in which disposal takes place.
2.18 Foreign currency transactions
Foreign currency transactions are recognised or accounted for into Pakistan Rupees using the exchange rate prevailing on the date of the transaction. Monetary assets and liabilities in foreign currencies are translated into Pakistan Rupees at the rates of exchange prevailing on the balance sheet date. Exchange gains / losses on foreign currency translations are included in income / equity.
2.19 Functional and presentation currency
Items included in the financial statements are measured using the currency of the primary economic environment in which the Company operates. The financial statements are presented in Pakistan Rupees, which is the Company’s functional and presentation currency.
3. SIGNIFICANT ACCOUNTING ESTIMATES AND JUDGEMENTS
The preparation of financial statements in conformity with approved accounting standards requires the use of certain significant accounting estimates. It also requires management to exercise its judgment in the process of applying the Company’s accounting policies. Estimates and judgments are continually evaluated and are based on historic experience and other factors, including expectation of future events that are believed to be reasonable under the circumstances. In the process of applying the Company’s accounting policies, the management has made the following estimates and judgments which are significant to the financial statements:
For the year ended December 31, 2016
noteS to and forming Part of the financial StatementS
86 Dawood Hercules Corporation Limited

3.1 Current and deferred income taxes
In making the estimates for income taxes payable by the Company, management considers current income tax law and the decisions of appellate authorities on certain cases issued in the past. Where the final tax outcome is different from the amounts that were initially recorded, such differences will impact the income tax provision in the period in which such final outcome is determined. Deferred taxes are measured at the tax rates that are expected to apply to the period when the asset is realised or the liability is settled, based on the tax rates (and tax laws) that have been enacted or substantively enacted at the reporting date.
3.2 Provisions
Provisions are based on management’s best estimates. Any change in the estimates in future years might effect the carrying amounts of the provisions with a corresponding affect on the profit and loss account of the Company.
3.3 Property, plant and equipment
Estimates with respect to residual values and useful lives are based on the assessment of the management of the Company considering the estimated usage and the industry practices. Further, the Company reviews the internal and external indicators for possible impairment of assets on an annual basis. Any change in the estimates of residual values and useful lives that might affect the carrying amounts of the respective items of property, plant and equipment (note 4) will have a corresponding effect on the depreciation charge and impairment loss incurred during the year. Estimates and judgments are continually evaluated and are based on historical experience and other factors, including expectation of future events that are believed to be reasonable under the circumstances.
3.4 Consolidation of entities in which the Company holds less than half of the voting rights
Management considers that the Company has control over ECL even though it has less than 50% of the voting rights. The pattern of shareholding of ECL shows that the Company is the single largest shareholder having shareholding of 37.22% with remaining widely dispersed shareholding pattern, which enables the Company to exercise control over ECL.
3.5 Impairment of investments in subsidiaries, associates and other entities
In making an estimate of impairment, investments are considered to be impaired if there is a significant or prolonged decline in the recoverable amount and carrying value of investments.
For the year ended December 31, 2016
noteS to and forming Part of the financial StatementS
Note 2016 2015---------- (Rupees in ‘000) ----------
4. PROPERTY, PLANT AND EQUIPMENT
Operating fixed assets 4.1 96,461 117,733 Capital work in progress - advance to supplier 29,300 13,000
125,761 130,733
Annual Report 2016 87

4.1 The following is a statement of property, plant and equipment:
Land BuildingLeasehold improve-
ments
Furniture, fittings and equipment
Data processing equipment
Vehicles Total
------------------------------------ (Rupees in ‘000) -------------------------------------------At January 1, 2015Cost 22,716 7,500 10,406 17,803 15,750 53,212 127,387 Accumulated depreciation - (6,563) (88) (8,387) (10,369) (24,054) (49,461)Net book value 22,716 937 10,318 9,416 5,381 29,158 77,926
Year ended December 31, 2015
Additions - - 11,298 4,098 10,307 35,947 61,650
Disposals
Cost - - - - (113) (10,986) (11,099)Accumulated depreciation - - - - 38 8,480 8,518 Net book value - - - - (75) (2,506) (2,581)
Depreciation charge for the year - (375) (1,135) (1,465) (4,395) (11,892) (19,262)
Net book value as at December 31, 2015 22,716 562 20,481 12,049 11,218 50,707 117,733
Year ended December 31, 2016
Additions - - 274 2,142 3,050 - 5,466
Disposals (Note 4.1.2)
Cost - - - - (1,154) (4,583) (5,737)Accumulated depreciation - - - - 591 2,349 2,940 Net book value - - - - (563) (2,234) (2,797)
Depreciation charge for the year - (375) (2,195) (2,021) (6,024) (13,326) (23,941)
Net book value as at December 31, 2016 22,716 187 18,560 12,170 7,681 35,147 96,461
At December 31, 2015Cost 22,716 7,500 21,704 21,901 25,944 78,173 177,938 Accumulated depreciation - (6,938) (1,223) (9,852) (14,726) (27,466) (60,205)Net book value 22,716 562 20,481 12,049 11,218 50,707 117,733
At December 31, 2016Cost 22,716 7,500 21,978 24,043 27,840 73,590 177,667 Accumulated depreciation - (7,313) (3,418) (11,873) (20,159) (38,443) (81,206)Net book value 22,716 187 18,560 12,170 7,681 35,147 96,461
Annual rate of depreciation (%) - 5 10 10 to 12.5 33.33 to 50 20
4.1.1 Cost of property, plant and equipment that are fully depreciated amounts to Rs 24.70 million (2015: Rs 24.21 million).
For the year ended December 31, 2016
noteS to and forming Part of the financial StatementS
88 Dawood Hercules Corporation Limited

For the year ended December 31, 2016
noteS to and forming Part of the financial StatementS
Note 2016 2015-------- (Rupees in ‘000) --------
5. INTANGIBLE ASSETS
Computer Software
Net book value as at January 1 1 134 Amortisation for the year (1) (133)Net book value as at December 31 - 1
At December 31
Cost 5.1 400 400 Accumulated amortisation (400) (399)Net book value - 1
The intangible asset is amortised at the rate of 33.33%.
5.1 This represents cost of computer software “SYSMAN Solutions”. This software was being amortised over the useful life of three years and was fully amortised during the current year, however, it is still in active use.
Note 2016 2015-------- (Rupees in ‘000) --------
6. LONG TERM INVESTMENTS
Investment in subsidiary 6.1 23,308,927 23,308,927 Investment in associate 6.2 14,169,098 14,169,098 Others, at cost - e2e Business Enterprises (Private) Limited- unquoted 6.3 - 95,713
37,478,025 37,573,738
4.1.2 Details of property, plant and equipment disposed off:
Particulars Mode of disposal CostAccumulated depreciation
Net book value
Sale proceeds
Gain / (loss)
Particulars of purchasers ----------------------- (Rupees in ‘000) -----------------------
Items having net book value of greater than Rs 50,000 eachVehicles
Company policy 2,011 1,877 134 603 469 Muhammad Anis DayalaOn transfer of employee 2,572 472 2,100 2,143 43 Reon Energy Limited
4,583 2,349 2,234 2,746 512 Data processing equipment
Insurance claim 172 79 93 80 (13) Adamjee Insurance Company Limited--do-- 257 107 150 176 26 Adamjee Insurance Company Limited
Company policy 99 46 53 54 1 Faraz SalimReturn back to supplier 88 11 77 85 8 Samsung
Company policy 103 43 60 60 - Ghias uddin Khan 719 286 433 455 22
OthersItems having net book value of less than Rs 50,000 each Various 435 305 130 141 11 Various 2016 5,737 2,940 2,797 3,342 545
2015 11,099 8,518 2,581 5,626 3,045
Annual Report 2016 89

2016 2015-------- (Rupees in ‘000) --------
6.1 Investment in subsidiary
Engro Corporation Limited (ECL) - quoted 23,308,927 23,308,927
6.1.1 Engro Corporation Limited - quoted
194,972,555 (2015: 175,012,555) ordinary shares of Rs 10 each 23,308,927 17,425,249
Add: Nil (2015: 19,960,000) ordinary shares purchased from DHFL - 5,883,678
194,972,555 (2015: 194,972,555) ordinary shares of Rs 10 each 23,308,927 23,308,927
Percentage of holding 37.22% (2015: 37.22%)
6.1.2 The market value of investment in ECL as at December 31, 2016 was Rs 61,629 million (2015: Rs 54,473 million).
6.1.3 The details of shares pledged as security are as follows:
As at December 31, 2016 As at December 31, 2015
BankNumber
of shares pledged
Face value of pledged
shares
Market value of pledged shares
Number of shares pledged
Face value of pledged
shares
Market value of pledged
shares
(in ‘000) -----(Rupees in ‘000) ----- (in ‘000) -----(Rupees in ‘000) -----
Pledged in favor of Fatima Fertilizer Company Limited against potential liabilities of DHFL
Meezan Bank Limited - as agent - (note 16.1) 15,131 151,308 4,782,695 15,131 151,308 4,227,394
2016 2015-------- (Rupees in ‘000) --------
6.2 Investment in associate
The Hub Power Company Limited - quoted 14,169,098 14,169,098
6.2.1 The Hub Power Company Limited - quoted
172,582,000 (2015: 39,707,000) ordinary shares of Rs 10 each 14,169,098 1,291,677
Add: Nil (2015: 7,735,000 ) ordinary shares purchased from Patek (Private) Limited - 731,698
Add: Nil (2015: 125,140,000 ) ordinary shares purchased from DHFL - 12,145,723
172,582,000 (2015: 172,582,000) ordinary shares of Rs 10 each 14,169,098 14,169,098 Percentage of holding 14.91% (2015: 14.91%)
For the year ended December 31, 2016
noteS to and forming Part of the financial StatementS
90 Dawood Hercules Corporation Limited

For the year ended December 31, 2016
noteS to and forming Part of the financial StatementS
6.2.2 The Company has 14.91% (2015: 14.91%) of the voting power in the Hub Power Company Limited (HUBCO) by virtue of its shareholding. Due to the representation of the Company’s nominees on the Board of Directors of HUBCO, the Company has significant influence over HUBCO.
6.2.3 The market value of investment in HUBCO as at December 31, 2016 was Rs 21,310 million (2015: Rs 17,707 million).
6.2.4 The details of shares pledged as security against various facilities are as follows:
As at December 31, 2016 As at December 31, 2015
BankNumber
of shares pledged
Face value of pledged
shares
Market value of pledged shares
Number of shares pledged
Face value of pledged
shares
Market value of pledged
shares
(in ‘000) -----(Rupees in ‘000) ----- (in ‘000) -----(Rupees in ‘000) -----Pledged against financing facilities
availed by the Company
Long term:Allied Bank Limited 82,570 825,700 10,195,744 82,570 825,700 8,471,682
Short term:Bank AL Habib Limited 20,256 202,560 2,501,211 31,256 312,560 3,206,866 Habib Metropolitan Bank Limited 25,850 258,500 3,191,958 - - - MCB Islamic Bank Limited 4,762 47,620 588,012 - - - United Bank Limited 16,182 161,815 1,998,092 15,656 156,560 1,606,306
Note 2016 2015-------- (Rupees in ‘000) --------
6.3 Other investment
e2e Business Enterprises (Private) Limited e2eBE - unquoted
11,664,633 (2015: 23,770,701) ordinary shares of Rs 10 each 95,713 237,707
Less: Nil (2015: 12,106,068) ordinary shares disposed of during the year - (121,061)
Less: Provision for impairment 6.3.1 (95,713) (20,933)
11,664,633 (2015: 11,664,633) ordinary shares of Rs 10 each - 95,713 Percentage of holding 19.14% (2015: 19.14%)
6.3.1 The Company had made an investment in e2eBE which was set up for the production, sale and marketing of Rice Bran Oil (RBO) and was planned to start commercial operations in 2014. However, due to certain technical issues it has not been able to start the commercial operations of the project till date. Further, due to serious financial and liquidity crises, it has not been able to service its outstanding loans and working capital requirements.
The Company has assessed the carrying amount of its investment in e2eBE in accordance with the requirements of IAS 36 ‘Impairment of Assets’ and recorded an impairment loss of Rs 95.713 million (2015: 20.933 million) representing the full amount of its investment as the possibility of turnaround of e2eBE operations is remote.
Annual Report 2016 91

Note 2016 2015 -------- (Rupees in ‘000) --------7. DEFINED BENEFIT LIABILITY / (ASSET)
These comprise of:Defined benefit plan - funded gratuity 7.4 518 (2,593) - unfunded gratuity 1,531 587
7.1 As stated in note 2.11.1, the Company operates a defined benefit plan i.e. an approved funded gratuity scheme for all of its permanent employees subject to attainment of minimum service of prescribed period. Actuarial valuation of the scheme is carried out every year. However, the latest actuarial valuation was carried out as at June 30, 2016. Nevertheless, the results have been updated for material transactions and material changes in circumstances upto the end of the reporting period.
7.2 The actuarial valuation of gratuity plan was carried out as at June 30, 2016. The projected unit credit method using the following significant assumptions was used for this valuation:
June 30, 2016 June 30, 2015 ------% per annum------
- Discount rate used for profit and loss account charge 9.75% 10.5%- Discount rate used for year end obligation 9.00% 9.75%- Expected rate of increase in salary levels - per annum 8.00% 8.75%
7.3 Mortality rate
The rates assumed were based on the SLIC 2001 - 2005 with 1 year setback mortality table.
Note 2016 2015-------- (Rupees in ‘000) --------
7.4 Balance sheet reconciliation
Present value of defined benefit obligation 7.5 17,398 17,818 Fair value of plan assets 7.6 (16,880) (20,411)Liability as at December 31 518 (2,593)
7.5 Movement in present value of defined benefit obligation
Obligation as at January 1 17,818 13,689 Current service cost 6,715 3,426 Interest cost 907 1,556 Benefits paid (11,988) (371)Remeasurment on obligation 3,946 (482)Obligation as at December 31 17,398 17,818
For the year ended December 31, 2016
noteS to and forming Part of the financial StatementS
92 Dawood Hercules Corporation Limited

For the year ended December 31, 2016
noteS to and forming Part of the financial StatementS
Note 2016 2015-------- (Rupees in ‘000) --------
7.6 Movement in fair value of plan assets
Fair value as at January 1 20,411 13,953 Interest income 1,964 1,839 Contributions made 6,663 5,678 Benefits paid (11,988) (371)Remeasurement on plan assets (170) (688)Fair value as at December 31 16,880 20,411
7.7 Movement in net liability / (asset) in the balance sheet
Opening balance of net (asset) (2,593) (264)Charge for the year 7.8 5,658 3,143 Contributions made by the company (6,663) (5,678)Net remeasurement for the year 7.9 4,116 206 Closing balance of net liability / (asset) 518 (2,593)
7.8 Amounts recognised in the profit and loss account
Current service cost 6,715 3,426 Net interest income (1,057) (283)
5,658 3,143
7.9 Remeasurement recognised in other comprehensive income
Remeasurement loss / (gain) on defined benefit liability - Experience adjustments 3,946 (482)Remeasurement loss on plan assets 170 688 Net remeasurement loss 4,116 206
7.10 Actual return on plan assets
Expected return on plan assets 1,964 1,839 Remeasurement loss on plan assets (170) (688)Actual return on plan assets 1,794 1,151
2016 2015(Rs in ‘000) Percentage (Rs in ‘000) Percentage
7.11 Major categories / composition of plan assets
Cash and cash equivalents (net) 2,697 16% 4,744 23%Mutual funds 14,183 84% 15,667 77%
16,880 100% 20,411 100%
Annual Report 2016 93

7.13 Expected contribution to post employment benefit plan for the year ending December 31, 2017 is Rs 5.908 million (2016: Rs 4.003 million).
7.14 The weighted average duration of the defined benefit obligation is 11 years.
7.15 The sensitivity of the defined benefit obligation to changes in the weighted principal assumptions is set forth below:
Impact on defined benefit obligationChange in Increase Decrease
assumptions-------------------- (Rupees in ‘000) --------------------
Discount rate 1% (5,085) (2,091)Salary growth rate 1% (2,116) (5,085)
7.16 The above sensitivity analysis is based on a change in an assumption while holding all other assumptions constant. In practice, this is unlikely to occur, and changes in some of the assumptions may be correlated. When calculating the sensitivity of the defined benefit obligation to significant actuarial assumptions the same method (present value of the defined benefit obligation calculated with the projected unit credit method at the end of the reporting period) has been applied as when calculating the defined benefit liability recognised within the balance sheet.
Note 2016 2015-------- (Rupees in ‘000) --------
8. ADVANCES, DEPOSITS AND PREPAYMENTS
Considered good - unsecured
Advances to:- Employees and executives 8.1 147 3,798 - Suppliers 279 3,275
8.2 426 7,073 Deposits and prepayments:- to associates 234 1,012 - to others 43,944 33,814
8.3 44,178 34,826
Considered doubtful - others - 892 Less: Provision for doubtful deposits 8.4 - (892)
- - 44,604 41,899
7.12 Amounts for the current year and previous four annual years of the fair value of plan assets, present value of defined benefit obligation and deficit arising thereon are as follows:
2016 2015 2014 2013 2012----------------------------- (Rupees in ‘000) -----------------------------
As at December 31Fair value of plan assets 16,880 20,411 13,953 19,481 6,070 Present value of defined benefit obligation (17,398) (17,818) (13,689) (19,883) (15,096)(Deficit) / Surplus (518) 2,593 264 (402) (9,026)Experience adjustments:(Loss) / gain on plan assets (170) (688) 574 186 (18)(Loss) / gain on obligations (3,946) 482 (438) 90 (580)
For the year ended December 31, 2016
noteS to and forming Part of the financial StatementS
94 Dawood Hercules Corporation Limited

For the year ended December 31, 2016
noteS to and forming Part of the financial StatementS
8.1 Advances include Nil (2015: Rs 3.553 million) due from key management personnel of the Company. The maximum amounts due at the end of any month during the year from the directors and executives were Rs 0.110 million (2015: Rs 0.110 million) and Rs 3.151 million (2015: Rs 3.583 million) respectively.
8.2 The advances provided to suppliers, employees and executive are interest free.
8.3 These deposits and prepayments do not carry any mark up arrangement.
2016 2015-------- (Rupees in ‘000) --------
8.4 Provision for doubtful deposits
Opening Balance 892 - Add: Provision made during the year - 892 Less: Doubtful deposits written off during the year (892) - Closing balance - 892
9. OTHER RECEIVABLES 15,735 114,532
These includes receivable from the associates of the Company aggregating to Rs 15.142 million (2015: 114.258 million).
Note 2016 2015-------- (Rupees in ‘000) --------
10. CASH AND BANK BALANCES
Cash in hand 530 512 Cheques in hand - 853,005
With banks in:- Current accounts 279,249 151,134 - Savings accounts 10.1 6,509 3,408
285,758 154,542
286,288 1,008,059
10.1 These carry markup at the rates ranging from 3.43% to 4% (2015: 4% to 5%) per annum.
11. SHARE CAPITAL
11.1 Authorised share capital
2016 2015 2016 2015(Number of shares) -------- (Rupees in ‘000) --------
1,000,000,000 1,000,000,000 Ordinary shares of Rs 10 each 10,000,000 10,000,000
Annual Report 2016 95

11.2 Issued, subscribed and paid up share capital
2016 2015 2016 2015(Number of shares) -------- (Rupees in ‘000) --------
Ordinary shares of Rs 10 13,900,000 13,900,000 each fully paid in cash 139,000 139,000
Ordinary shares of Rs 10each issued as fully paid
467,387,116 467,387,116 bonus shares 4,673,871 4,673,871 481,287,116 481,287,116 4,812,871 4,812,871
2016 2015(Number of shares)
11.3 Shares held by related parties
Dawood Lawrencepur Limited 77,931,896 77,931,896 Percentage of holding 16.19% (2015: 16.19%)
The Dawood Foundation 18,991,988 18,991,988 Percentage of holding 3.95% (2015: 3.95%)
Cyan Limited 794,380 794,380 Percentage of holding 0.165% (2015: 0.165%)
Sach International (Private) Limited 6,996 6,996 Percentage of holding 0.001% (2015: 0.001%)
Note 2016 2015-------- (Rupees in ‘000) --------
12. REVENUE RESERVES
General reserve 700,000 700,000 Unappropriated profit 25,325,985 28,282,384
26,025,985 28,982,384
13. LONG TERM FINANCING
Long term finance under mark up arrangement 13.2 139,143 242,585 Syndicate term finance arrangement 13.3 3,750,000 3,750,000
3,889,143 3,992,585 Current portion (764,143) (103,442)
3,125,000 3,889,143
13.1 Balance as at January 1 3,992,585 330,465 Availed during the year - 3,750,000 Repayments during the year (103,442) (87,880)Balance as at December 31 3,889,143 3,992,585
For the year ended December 31, 2016
noteS to and forming Part of the financial StatementS
96 Dawood Hercules Corporation Limited

For the year ended December 31, 2016
noteS to and forming Part of the financial StatementS
13.2 This represents utilised portion of long term finance facility under mark-up arrangement from Allied Bank Limited (ABL) aggregating Rs 380 million (2015: Rs 380 million). The finance facility is secured by way of hypothecation charge over all assets of the Company with 25% margin and pledge of HUBCO shares as more fully explained in note 6.2.4. The facility carries mark-up at the rate of six months KIBOR plus 200 basis points per annum. The facility is for the period of 5 years and is payable semi annually in arrears with the first principal repayment made on July 5, 2013. The facility will be repaid in full by July 2017.
13.3 This represents utilised portion of syndicated term finance facility sanctioned by a syndicate of banks led by Allied Bank Limited aggregating to Rs. 4,000 million (2015: 4,000 million). The facility is secured against HUBCO shares as more fully explained note 6.2.4. The facility carries mark-up at the rate of six months KIBOR plus 200 basis points per annum. The facility is for a period of 5 years and is payable semi annually with the first principal repayment to be made after the expiry of 2 years grace period commencing from May 2017.
Note 2016 2015-------- (Rupees in ‘000) --------
14. SHORT TERM RUNNING FINANCE
Running finance under mark-up arrangement 14.1 -14.4 2,868,932 431,808
14.1 This includes utilised portion of short-term running finance facility aggregating to Rs 1,500 million (2015: Rs 2,000 million) obtained under mark-up arrangements from Bank Al-Habib Limited. The amount which remained unutilised as at December 31, 2016 was Rs 1,500 million (2015: Rs 2,000 million). The facility is secured by way of pledge of HUBCO shares as more fully explained in note 6.2.4. Rate of mark-up applicable to the facility is three months KIBOR plus 65 basis points (2015: three months KIBOR plus 95 basis points) per annum. The facility will expire on April 30, 2017.
14.2 This also includes utilised portion of short-term running finance facility aggregating to Rs 2,000 million (2015: Rs 1,000 million) obtained under mark-up arrangements from United Bank Limited. The amount which remained unutilised as at December 31, 2016 was Rs 1000.867 million (2015: Rs 568.192 million). The facility is secured by way of pledge of HUBCO shares as more fully explained in note 6.2.4. Rate of mark-up applicable to the facility is one month KIBOR plus 70 basis points (2015: one month KIBOR plus 90 basis points) per annum. The facility will expire on April 30, 2017.
14.3 During the year ended December 31, 2016, the Company has obtained short-term running finance facility aggregating to Rs 800 million (2015: Rs Nil) under Shariah approved arrangement (Running Musharakah Arrangement) from MCB Islamic Bank Limited. The amount which remained unutilised as at December 31, 2016 was Rs 800 million (2015: Nil). The facility is secured by way of pledge of HUBCO shares as more fully explained in note 6.2.4. Rate of profit applicable to the facility is three month KIBOR plus 75 basis points (2015: Nil) per annum. The facility will expire on April 30, 2017.
14.4 During the year ended December 31, 2016, the Company has obtained short-term running finance facility aggregating to Rs 2,000 million (2015: Nil) under mark-up arrangements from Habib Metropolitan Bank Limited. The amount which remained unutilised as at December 31, 2016 was Rs 130.20 million (2015: Nil). The facility is secured by way of pledge of HUBCO shares (2015: HUBCO shares) as more fully explained in note 6.2.4. Rate of mark-up applicable to the facility is three month KIBOR plus 75 basis points (2015: Nil) per annum. The facility will expire on January 31, 2017.
Annual Report 2016 97

2016 2015-------- (Rupees in ‘000) --------
15. TRADE AND OTHER PAYABLES
Creditors 161 354,052 Accrued expenses 149,856 44,371 Unclaimed dividend 95,902 48,371 Others 69 188
245,988 446,982
16. CONTINGENCIES AND COMMITMENTS
16.1 Contingent liabilities
The Company has pledged 15.131 million shares of ECL with Meezan Bank Limited (as Agent) in favour of Fatima Fertilizer Company Limited (FFCL) and a corporate guarantee in favour of DHFL and FFCL against potential tax liabilities of DHFL in respect period ending on or prior to June 30, 2015. The pledged shares will be released upon completion of two years from the filing date of Income Tax Return for the year ended December 31, 2015 i.e. September 30, 2016. The corporate guarantee will remain in full force and effect for five years and will be released on the later of September 30, 2021 or the date on which subject tax liabilities are finally settled / disposed off or withdrawn.
16.2 Commitment in respect of operating lease arrangements
The amount of future payments in operating lease arrangements relating to office premises and vehicle, and the period in which these payments will become due are as follows:
2016 2015-------- (Rupees in ‘000) --------
Not later than one year 10,766 7,885
The amount of Rs 10 million represents commitments in respect of office premises. The Company has signed lease agreements for premises on rent from Dawood Foundation, a related party, for Karachi office which is due to expire in September 2017. The same is revocable by either party through prior notice of at least 3 months. The remaining amount of Rs 0.76 million represents lease rental commitment of a car provided to an executive.
2016 2015-------- (Rupees in ‘000) --------
17. DIVIDEND INCOME
Subsidiary - Engro Corporation Limited 5,264,259 2,804,828 Former subsidiary - DH Fertilizers Limited - 18,018,795 Associate - The Hub Power Company Limited 2,157,275 1,108,029
7,421,534 21,931,652
For the year ended December 31, 2016
noteS to and forming Part of the financial StatementS
98 Dawood Hercules Corporation Limited

For the year ended December 31, 2016
noteS to and forming Part of the financial StatementS
Note 2016 2015-------- (Rupees in ‘000) --------
18. ADMINISTRATIVE EXPENSES
Salaries, wages and other benefits 18.1 453,670 297,256 Rent, rates and taxes 31,666 24,222 Insurance 4,155 3,251 Repairs and maintenance 4,860 5,755 Communication, stationery and office supplies 20,458 17,295 Subscription and periodicals 22,983 26,637 Travelling and conveyance 20,971 231,719 Depreciation 4.1 23,941 19,262 Amortisation 5 1 133 Impairment charge 95,713 20,933 Legal and professional charges 44,342 612,484 Donations 18.2 500 - Other expenses 23,088 31,121
746,348 1,290,068
18.1 Salaries, wages and other benefits include Rs 6.644 million (2015: Rs 4.333 million) charge for the year in respect of staff gratuity fund and Rs 11.998 million (2015: Rs 10.322 million) in respect of staff provident fund.
18.2 During the year, donation was given for the promotion of education to The Citizen Foundation where none of the director of the Company was interested.
2016 2015-------- (Rupees in ‘000) --------
19. OTHER OPERATING EXPENSES
Auditor’s remuneration:Audit fee 304 288 Half year and other certification fees 162 147 Out of pocket expenses 95 96 Other services 1,680 6,629
2,241 7,160
2016 2015Note -------- (Rupees in ‘000) --------
20. OTHER INCOME
Income from financial instruments 20.1 9,677 286,827 Income from non-financial instruments 20.2 4,221 4,310
13,898 291,137
Note 2016 2015-------- (Rupees in ‘000) --------
20.1 Income from financial instruments
Profit on savings accounts and term deposit receipts 9,663 10,222 Net gain on sale of investments - 285,163 Exchange gain / (loss) 14 (8,558)
9,677 286,827
Annual Report 2016 99

Note 2016 2015-------- (Rupees in ‘000) --------
20.2 Income from non-financial instruments
Profit on disposal of property, plant and equipment 545 3,045 Other income 3,676 1,265
4,221 4,310
21. FINANCE COST
Mark-up on:- Long term financing 328,095 138,272 - Short term running finance 63,217 38,147 Bank charges 1,367 42,184
392,679 218,603
22. TAXATION
Current - for the year 821,983 474,271 - for prior years 1,940 38,311
22.1 823,923 512,582
2016 2015 % %
22.1 Relationship between tax expense and accounting profit
Applicable tax rate 31.0 32.0 Tax effect of amounts that are not taxable / deductible
for tax purposes (0.0) (0.0)Tax effect of amounts exempt from tax (0.0) (25.9)Tax effect of amounts taxed at lower rate (17.9) (3.8)Tax effect of prior year charges 0.0 0.2
13.1 2.5
2016 2015-------- (Rupees in ‘000) --------
23. EARNINGS PER SHARE
Profit after taxation 5,470,241 20,194,376
(Number of shares)
Weighted average number of ordinary shares 481,287,116 481,287,116
-------- (Rupees) --------
Earnings per share – basic and diluted 11.37 41.96
23.1 There were no convertible dilutive potential ordinary shares outstanding as at December 31, 2016 and 2015.
For the year ended December 31, 2016
noteS to and forming Part of the financial StatementS
100 Dawood Hercules Corporation Limited

For the year ended December 31, 2016
noteS to and forming Part of the financial StatementS
24. REMUNERATION OF CHIEF EXECUTIVE, DIRECTORS AND EXECUTIVES
The aggregate amount charged in the financial statements for the year is as follows:
---------------------2016------------------ ----------------------2015-------------------Chief
ExecutiveDirectors Executives Chief
Executive Directors Executives
---------------------------------------(Rupees in ‘000)---------------------------------------
Managerial remuneration 160,057 51,485 93,465 19,355 62,696 91,949 Retirement benefits including ex-gratia 4,410 - 13,373 4,515 1,588 9,333 Rent and utilities 10,629 21,818 62,764 10,885 28,719 39,489 Compensated absences - - 2,530 - 1,313 2,285 Medical 2,018 2,253 6,558 1,613 2,439 2,878
177,114 75,556 178,690 36,368 96,755 145,934
Number of persons including those who worked part of the year 2 2 42 1 3 38
24.1 On resignation of Mr Samad Dawood as Chief Executive Officer (CEO) of the Company, Mr Inam ur Rahman was appointed as CEO with effect from December 1, 2016. Hence, above remuneration includes remuneration of Mr Samad Dawood and Mr Inam ur Rahman for their period of service.
24.2 In addition, CEO, certain directors and executives are provided with Company owned and maintained cars.
24.3 Meeting fees aggregating Rs 7.950 million (2015: Rs 4.550 million) were paid to 7 directors (2015: 9 directors).
Annual Report 2016 101

25. RELATED PARTY TRANSACTIONS
The related parties comprise Company, local associated companies, related group companies, directors of the Company, companies in which directors are interested, staff retirement benefits, key management personnel and close members of the family of directors. The Company in the normal course of business carries out transactions with various related parties. Details of transactions with related parties, other than those which have been specifically disclosed elsewhere in these financial statements are as follows:
Note 2016 2015-------- (Rupees in ‘000) --------
Subsidiary companiesReimbursement of expenses made to the Company 3,130 105,326 Reimbursement of expenses made by the Company - 1,287 Dividend income 5,264,259 20,823,623 Purchase of goods and services - 12 Sale of goods and services - 159
AssociatesSale of goods and services 7,827 5,308 Purchase of goods and services 24,821 29,253 Reimbursement of expenses from associates 11,724 4,820 Reimbursement of expenses to associates 6,370 2,530 Dividend income 2,157,275 1,108,029 Commitment in respect of operating lease arrangements 16.2 10,008 7,885 Membership fee and other subscriptions - 121
Other related partiesExpense in relation to staff retirement gratuity fund 5,658 3,143 Membership fee and other subscriptions 125 - Expense in relation to staff provident fund 11,998 10,322
Key management personnelSale of property, plant and equipment 858 567 Salaries and other short term employee benefits 278,695 198,678 Commitment in respect of operating lease arrangements 16.2 758 - Post retirement benefit plans 24 17,783 15,436
The Company enters into transactions with related parties on the basis of mutually agreed terms.
The amounts payable to and receivable from the related parties have been disclosed in the relevant notes to these financial statements.
For the year ended December 31, 2016
noteS to and forming Part of the financial StatementS
102 Dawood Hercules Corporation Limited

For the year ended December 31, 2016
noteS to and forming Part of the financial StatementS
Note 2016 2015-------- (Rupees in ‘000) --------
26. CASH UTILISED IN OPERATIONS
Profit before taxation 6,294,164 20,706,958
Adjustment for non cash expenses and other items:
Depreciation 23,941 19,262 Amortisation 1 133 Impairment charge 95,713 20,933 Finance cost 392,679 218,603 Profit on disposal of property, plant and equipment (545) (3,045)Profit on sale of investments - (285,163)Dividend income (7,421,534) (21,931,652)Provision for staff retirement and other service benefits 6,644 6,868 Profit on bank deposits (9,663) (10,222)Exchange (gain) / loss (14) 8,558 Working capital changes 26.1 (152,419) 83,982
(7,065,197) (21,871,743)Cash utilised in operations (771,033) (1,164,785)
26.1 Working capital changes
Decrease / (increase) in current assets:
Advances, deposits and prepayments (2,705) (29,172)Other receivables 98,797 (103,073)
96,092 (132,245)(Decrease) / increase in trade and other payables (248,511) 216,227
(152,419) 83,982
27. CASH AND CASH EQUIVALENTS
Cash and bank balances 10 286,288 1,008,059 Short term running finance 14 (2,868,932) (431,808)
(2,582,644) 576,251
28. FINANCIAL INSTRUMENTS BY CATEGORY
FINANCIAL ASSETS
Loans and receivables at amortised cost
Advances, deposits and prepayments 44,604 41,899 Other receivables 15,735 114,532 Cash and bank balances 286,288 1,008,059
346,627 1,164,490 Available for sale investments
Others, at cost - e2e Business Enterprises (Private) Limited- unquoted - 95,713
346,627 1,260,203
Annual Report 2016 103
2016 2015-------- (Rupees in ‘000) --------
FINANCIAL LIABILITIES
Financial liabilities at amortised cost
Long term financing 3,889,143 3,992,585 Trade and other payables 245,988 446,982 Accrued mark-up 99,640 99,642 Short term running finance 2,868,932 431,808
7,103,703 4,971,017
29. FINANCIAL RISK MANAGEMENT
29.1 The Company’s activities expose it to a variety of financial risks: market risk (including interest rate risk, currency risk and price risk), credit risk and liquidity risk. The Company’s overall risk management focuses on the unpredictability of financial markets and seeks to minimise potential adverse effects on the Company’s financial performance.
The Board of Directors (the Board) has overall responsibility for the establishment and oversight of Company’s risk management framework. The Board is also responsible for developing and monitoring the Company’s risk management policies.
The Company’s risk management policies are established to identify and analyse the risks faced by the Company, to set appropriate risk limits and controls, and to monitor adherence to limits. Risk management policies and systems are reviewed regularly to react to change in market conditions and the Company’s activities.
Risks managed and measured by the Company are explained below:
29.2 Market risk
Market risk is the risk that the value of financial instruments may fluctuate as a result of changes in market interest rates or the market prices of instruments due to change in credit rating of the issuers or the instruments, changes in market sentiments, speculative activities, supply and demand of instruments and liquidity in the market. The Company manages the market risk by monitoring exposure on financial instruments and by following internal risk management policies.
Market risk comprises of three types of risks: interest rate risk, currency risk and other price risk.
29.2.1 Interest rate risk
Interest rate risk is the risk that the fair value or future cash flows from a financial instrument will fluctuate due to changes in market interest rates.
- Fair value risk - Presently, fair value risk to the Company arises from ‘balances with banks’ which are based on fixed interest rates. As at December 31, 2016, the impact of increase / decrease in fixed interest rates by 100 basis points will not have a material impact on the profit after tax of the Company.
For the year ended December 31, 2016
noteS to and forming Part of the financial StatementS
104 Dawood Hercules Corporation Limited

For the year ended December 31, 2016
noteS to and forming Part of the financial StatementS
- Future cash flow risk - Presently, future cash flow risk to the Company arises from short term running finance and long term financing which are based on floating interest rates (i.e. KIBOR based). As at December 31, 2016, had there been increase / decrease of 100 basis points in KIBOR, with all other variables held constant, profit before taxation for the year then ended would have been lower / higher by Rs 24.548 million (2015: 26.035 million) mainly as a result of finance cost.
29.2.2 Currency risk
Currency risk arises mainly where receivables and payables exist due to transactions entered into foreign currencies. The Company does not have any significant foreign currency exposures.
29.2.3 Price risk
Price risk is the risk that the fair value of or future cash flows from a financial instrument will fluctuate due to changes in market prices (other than those arising from interest rate risk or currency risk), whether those changes are caused by factors specific to the individual financial instrument or its issuer, or factors affecting all similar financial instruments traded in the market. During the year, the Company has disposed off all its financial instruments that were valued at market prices, as a result there was no exposure to price risk as at end of the year.
29.3 Credit risk and its concentration
Credit risk represents the accounting loss that would be recognized at the reporting date if counter parties fail completely to perform as contracted.
The Company’s exposure to credit risk is influenced mainly by the individual characteristics of each of the parties. To manage exposure to credit risk, management reviews credit ratings, total deposits worthiness, and maturities of the investments made, past experience and other factors.
Concentration of credit risk arises when a number of counter parties are engaged in similar business activities or have similar economic features that would cause their abilities to meet contractual obligations to be similarly affected by the changes in economic, political or other conditions.
The credit quality of the Company’s liquidity can be assessed with reference to external credit ratings as follows:
Bank Rating agency RatingShort term Long term
Bank AL Habib Limited PACRA A1+ AA+Habib Bank Limited JCR-VIS A-1+ AAAUnited Bank Limited JCR-VIS A-1+ AAAAllied Bank Limited PACRA A-1+ AA+MCB Islamic Bank Limited PACRA A-1 AHabib Metropolitan Bank Limited PACRA A-1+ AA+
Annual Report 2016 105

The maximum exposure to credit risk at the reporting date is set forth below:
2016 2015-------- (Rupees in ‘000) --------
Advances, deposits and prepayments 44,604 41,899 Other receivables 15,735 114,532 Bank balances 285,758 1,007,547
346,097 1,163,978
The Company believes that it is not exposed to major concentration of credit risk.
29.4 Liquidity risk
Liquidity risk is the risk that an entity will encounter difficulties in meeting obligations associated with financial liabilities. The Company’s approach to manage liquidity risk is to ensure, as far as possible, that it will always have sufficient liquidity to meet its financial liabilities when due. Accordingly, the Company maintains sufficient cash and also makes availability of funding through credit facilities.
The analysis below summarizes the Company’s financial liabilities (based on contractual undiscounted cash flows) into relevant maturity groups on the remaining period as at the balance sheet date:
Carrying Amount
Six months or less
Six to twelve months
One to two years
Two to five years
----------------------------- (Rupees in ‘000) -----------------------------2016Financial liabilitiesShort term financing 2,868,932 2,868,932 - - - Long term financing 3,889,143 52,179 711,964 1,250,000 1,875,000 Trade and other payables 245,988 245,988 - - - Accrued mark-up 99,640 99,640 - - -
7,103,703 3,266,739 711,964 1,250,000 1,875,000
2015Financial liabilitiesShort term financing 431,808 431,808 - - - Long term financing 3,992,585 51,263 52,179 139,143 3,750,000 Trade and other payables 446,982 446,982 - - - Accrued mark-up 99,642 99,642 - - -
4,971,017 1,029,695 52,179 139,143 3,750,000
29.5 Capital risk management
The Company’s objectives when managing capital are to safeguard the Company’s ability to continue as a going concern in order to provide returns for shareholders and benefits for other stakeholders and to maintain an optimal capital structure to reduce the cost of capital.
In order to maintain or adjust the capital structure, the Company may adjust the amount of dividends paid to shareholders, issue new shares or obtain / repay long term financing from / to financial institutions.
For the year ended December 31, 2016
noteS to and forming Part of the financial StatementS
106 Dawood Hercules Corporation Limited

For the year ended December 31, 2016
noteS to and forming Part of the financial StatementS
Consistent with others in the industry, the Company monitors capital on the basis of the gearing ratio. This ratio is calculated as net debt divided by total capital. Net debt is calculated as long term borrowings less cash and cash equivalent. Total capital is calculated as ‘equity’ as shown in the balance sheet plus net debt.
The gearing ratio as at December 31, 2016 and 2015 were as follows:
Note 2016 2015-------- (Rupees in ‘000) --------
Total debt 13 3,889,143 3,992,585 Less: Cash and cash equivalent 27 (2,582,644) 576,251 Net debt 6,471,787 3,416,334 Total capital 37,310,643 37,211,589 Gearing Ratio 17.35% 9.18%
29.6 Fair value of financial instruments
Fair value is an amount for which an asset could be exchanged, or a liability settled, between knowledgeable willing parties in an arm’s length transaction. Consequently, differences may arise between the carrying value and the fair value estimates.
The Company classifies fair value measurements using a fair value hierarchy that reflects the significance of the inputs used in making the measurements. The fair value hierarchy is as follows:
Level 1: Quoted market price (unadjusted) in an active market for an identical instrument.
Level 2: Valuation techniques based on observation inputs, either directly (i.e. as prices) or indirectly (i.e. derived from prices)
Level 3: Valuation techniques using significant un-observable inputs.
The estimated fair value of all financial instruments is considered not significantly different from book value.
30. PROVIDENT FUND RELATED DISCLOSURES
The following information is based on un-audited financial statements of the Provident Fund (the Fund) as at December 31:
Note 2016 2015-------- (Rupees in ‘000) --------
Size of the fund - total assets 60,228 59,919
Cost of investments made 54,086 56,656
Percentage of investments made 98% 97%
Fair value of investments 30.1 58,741 58,240
Annual Report 2016 107

30.1 The break up of fair value of investments is:
--------------2016-------------- --------------2015--------------(Rs in ‘000) %age (Rs in ‘000) %age
Bank balances 13,382 22.8% 43,386 74.5%Government securities 26,261 44.7% - - Mutual funds 19,098 32.5% 14,854 25.5%
58,741 100% 58,240 100%
30.2 The investments of the Funds have been made in accordance with the provision of Section 227 of the Companies Ordinance, 1984 and the rules formulated for the purpose.
31. NUMBER OF EMPLOYEES
The total and average number of employees during the years ended December 31 respectively are as follows:
2016 2015
Average number of employees during the year 42 33
Number of employees as at the end of the financial year 41 41
32. GENERAL
32.1 All financial information except as otherwise stated has been rounded to the nearest thousand rupees.
33. DATE OF AUTHORISATION FOR ISSUE
33.1 The Board of Directors in its meeting held on February 28, 2017 has proposed a cash dividend of Rs. 2 per share (2015: Rs 4 per share) for the year ended December 31, 2016 subject to approval of members at the annual general meeting to be held on April 28, 2017. This is in addition to the interim cash dividend of Rs 13.5 (2015: Rs 12) per share resulting in a total dividend for the year of Rs 15.5 (2015: Rs 16) per share. These financial statements do not recognise the proposed dividend as deduction from unappropriated profit as it has been proposed subsequent to balance sheet date.
33.2 These financial statements have been authorised for issue on February 28, 2017 by the Board of Directors of the Company.
KarachiFebruary 28, 2017
Inam ur RahmanChief Executive
M. Abdul AleemDirector
For the year ended December 31, 2016
noteS to and forming Part of the financial StatementS
108 Dawood Hercules Corporation Limited

STATEMENTSFINANCIALCONSOLIDATED
Annual Report 2016 109

110 Dawood Hercules Corporation Limited


As at December 31, 2016Consolidated BalanCe sheet
Note 2016 2015-------------- (Rupees) --------------
ASSETS Non - Current Assets Property, plant and equipment 5 131,534,255 128,534,524 Biological assets 6 - 1,024,251 Intangible assets 7 4,722,835 4,777,248 Long term investments 8 40,687,857 9,598,639
Deferred taxation 9 577,471 982,699 Defined benefit asset - funded gratuity - 2,593 Long term loans, advances and other receivables 10 9,850,501 3,758,094 Deferred employee compensation expense - 147,456
187,372,919 148,825,504
Current Assets
Stores, spares and loose tools 11 7,148,040 7,679,172
Stock-in-trade 12 10,704,311 14,088,701 Trade debts 13 13,733,482 6,733,613 Deferred employee compensation expense - 92,986 Derivative financial instruments 14 - 29,207 Loans, advances, deposits and prepayments 15 1,435,101 1,549,898 Other receivables 16 9,584,214 8,004,101 Accrued income 426,268 45,101 Taxes recoverable - 2,245,086 Short term investments 17 64,725,527 14,050,112
Cash and bank balances 18 6,186,667 5,120,357 113,943,610 59,638,334
TOTAL ASSETS 301,316,529 208,463,838
(Amounts in thousand)
112 Dawood Hercules Corporation Limited

KarachiFebruary 28, 2017
Inam ur RahmanChief Executive
M. Abdul AleemDirector
Note 2016 2015-------------- (Rupees) --------------
EQUITY & LIABILITIES
Equity
Share capital 20 4,812,871 4,812,871
Employee share option compensation reserve - 225,217 Revaluation reserve on business combination 16,857 20,655 Maintenance reserve 21 60,117 60,117 Exchange revaluation reserve 6,192 11,412 Hedging reserve 22 (32,730) (34,459)General reserves 700,000 700,000 Unappropriated profit 48,142,424 27,221,478 Share of income of associates (3,435) (3,269)Remeasurement of post-employment benefits (17,874) (48,665)
48,871,551 28,152,486 53,684,422 32,965,357
Non-Controlling Interest 119,277,999 59,901,520
Total Equity 172,962,421 92,866,877 Liabilities
Non-Current Liabilities Borrowings 23 63,734,743 40,882,279 Derivative financial instruments 14 2,107 17,382 Deferred taxation 9 8,982,706 8,696,201 Deferred liabilities 24 198,720 161,829
72,918,276 49,757,691 Current Liabilities Trade and other payables 25 32,107,059 34,618,973 Accrued interest / mark-up 26 1,238,061 1,427,789 Current portion of- borrowings 23 13,272,722 22,692,902 - deferred liabilities 24 101,790 98,083 Taxes payable 62,028 - Short term borrowings 27 8,404,519 6,608,453 Derivative financial instruments 14 249,653 393,070
55,435,832 65,839,270 Total Liabilities 128,354,108 115,596,961 Contingencies and Commitments 28
TOTAL EQUITY & LIABILITIES 301,316,529 208,463,838
The annexed notes from 1 to 58 form an integral part of these consolidated financial statements.
(Amounts in thousand)
Annual Report 2016 113

KarachiFebruary 28, 2017
Inam ur RahmanChief Executive
M. Abdul AleemDirector
For the year ended December 31, 2016Consolidated Profit and loss aCCount
(Amounts in thousand except for earnings per share)
Note 2016 2015--------------- (Rupees) ---------------
Revenue 29 157,207,668 181,979,686 Cost of revenue 30 (121,364,855) (136,758,846)
Gross profit 35,842,813 45,220,840
Selling and distribution expenses 31 (12,052,758) (10,765,816)Administrative expenses 32 (4,352,160) (5,209,571)
19,437,895 29,245,453
Other income 33 68,852,080 10,686,492 Other operating expenses 34 (2,350,804) (3,236,090)
Operating profit 85,939,171 36,695,855
Finance cost 35 (6,430,590) (8,918,663)Share of income from joint venture and associates 36 3,035,349 2,608,219
Profit before taxation 82,543,930 30,385,411
Taxation 37 (9,105,585) (9,020,674)
Profit after taxation 73,438,345 21,364,737
Profit / (Loss) attributable to:- Discontinued operations 19 60,686,313 7,782,005 - Continuing operations 12,752,032 13,582,732
73,438,345 21,364,737
Profit attributable to:- Owners of the Holding Company 25,564,552 9,226,901 - Non Controlling Interest 47,873,793 12,137,836
73,438,345 21,364,737
Basic earnings per share from: 38 --------------- (Rupees) ---------------
- Discontinued operations 46.69 11.73 - Continuing operations 6.43 7.44
53.12 19.17
Diluted earnings per share from: 38- Discontinued operations 46.69 11.73 - Continuing operations 6.40 7.44
53.09 19.17
The annexed notes from 1 to 58 form an integral part of these consolidated financial statements.
114 Dawood Hercules Corporation Limited

For the year ended December 31, 2016
Consolidated statement of total ComPrehensive inCome
KarachiFebruary 28, 2017
Inam ur RahmanChief Executive
M. Abdul AleemDirector
(Amounts in thousand)
2016 2015--------------- (Rupees) ---------------
Profit after taxation 73,438,345 21,364,737
Other comprehensive income:
Items that may be reclassified subsequently to profit or loss
Hedging reserve - cash flow hedges
Loss arising during the year (234,618) (136,023)
Less:- Reclassification adjustments for loss included in profit and loss account 246,772 207,729
- Adjustments for amounts transferred to initial carrying amount of hedged items (capital work in progress / stock-in-trade) 2,604 37,383
14,758 109,089
Share of other comprehensive income of associate (180) (1,435)
Revaluation reserve on business combination (21,004) (21,318)
Exchange differences on translation of foreign operations (15,042) 30,564
(21,468) 116,900 Income tax relating to:
Hedging reserve - cash flow hedges (8,600) (38,705)Revaluation reserve on business combination 6,721 7,035 Share of other comprehensive income of associate 14 108
(1,865) (31,562)Items that will not be reclassified to profit or loss
Remeasurement of post employment benefits obligation - Actuarial gain / (loss) 32,844 (125,632)
Income tax relating to remeasurement of post employment benefits obligation (11,157) 40,647
21,687 (84,985)Deferred tax charge relating to revaluation of equity related items - (4,946)
Other comprehensive income for the year, net of tax (1,646) (4,593)
Total comprehensive income for the year 73,436,699 21,360,144
Total comprehensive income attributable to equity shareholders from:
- Discontinued operations 60,698,481 7,782,005 - Continuing operations 12,738,218 13,578,139
73,436,699 21,360,144 Total comprehensive income attributable to:
- Owners of the Holding Company 25,559,977 9,224,261 - Non Controlling Interest 47,876,722 12,135,883
73,436,699 21,360,144
The annexed notes from 1 to 58 form an integral part of these consolidated financial statements.
Annual Report 2016 115

For t
he y
ear e
nded
Dec
embe
r 31,
201
6C
on
soli
date
d st
atem
ent
of
Ch
ang
es in
eq
uit
y ---
------
------
------
------
------
------
------
------
------
------
------
------
------
- ATT
RIBUT
ABLE
TO OW
NERS
OF TH
E HOL
DING C
OMPA
NY ---
------
------
------
------
------
------
------
------
------
------
------
------
------
-----
------
------
------
------
------
------
------
------
------
------
------
RESE
RVES
------
------
------
------
------
------
------
------
------
------
------
------
------
------
------
------
- CAP
ITAL R
ESER
VES -
------
------
------
------
------
------
------
------
------
-REV
ENUE
RESE
RVES
------
------
------
------
----
Share
ca
pital
Emplo
yee
share
optio
n co
mpen
sation
re
serve
Reval
uatio
n res
erve o
n bu
siness
co
mbina
tion
Main
tenan
ce
reser
ve
Exch
ange
re
valua
tion
reser
ve
Hedg
ing
reser
ve Ge
neral
reser
ve
Unap
pro-
priate
d Pr
ofit
Share
of ot
her
comp
rehen
sive
incom
e of
assoc
iates
Reme
asurem
ent
of post
emplo
ymen
t be
nefits
- Ac
tuarial
(los
s) / inc
ome
Sub
total
Non-
Contr
olling
Int
erest
Total
------
------
------
------
------
------
------
------
------
------
------
------
------
------
------
------
------
------
------
---- R
upee
s ----
------
------
------
------
------
------
------
------
------
------
------
------
------
------
------
------
------
------
------
Balan
ce as
at Ja
nuary
1, 20
15 4,
812,8
71
152,4
88
24,45
3 68
,475
1,91
9 (5
5,041
) 70
0,000
22
,034,0
14
(1,94
2) (2
1,075
) 27
,716,1
62
46,74
3,143
74
,459,3
05
Total
comp
rehen
sive i
ncom
e for
the y
ear e
nded
Dece
mber
31, 2
015
Pro
fit for
the ye
ar -
- -
- -
- -
9,22
6,901
-
- 9,
226,9
01
12,13
7,836
21
,364,7
37
Othe
r com
prehe
nsive
incom
e -
- (3
,798)
- 9,
493
20,58
2 -
- (1
,327)
(27,5
90)
(2,64
0) (1
,953)
(4,59
3) -
- (3
,798)
- 9,
493
20,58
2 -
9,22
6,901
(1
,327)
(27,5
90)
9,22
4,261
12
,135,8
83
21,36
0,144
Tra
nsac
tions
with
owne
rsTra
nsfer
of ma
intena
nce r
eserve
to No
n-Con
trollin
g Inte
rest
- -
- (8
,358)
- -
- -
- -
(8,35
8) 8,
358
- Em
ployee
s Sha
re Op
tion S
chem
e o
f subs
idiary
comp
any
- 72
,729
- -
- -
- -
- -
72,72
9 12
2,674
19
5,403
Ga
in on d
ispos
al of sh
ares o
f s
ubsid
iary co
mpan
y -
- -
- -
- -
1,95
7,280
-
- 1,
957,2
80
5,91
6,037
7,
873,3
17
Effec
t of c
onver
sion o
f IFC l
oan in
to o
rdina
ry sha
res by
subs
idiary
comp
any
- -
- -
- -
- 26
4,036
-
- 26
4,036
73
3,267
99
7,303
Div
idend
by su
bsidia
ries all
ocab
le to
Non
-Con
trollin
g Inte
rest
- -
- -
- -
- -
- -
- (1
,666,9
25)
(1,66
6,925
)Sh
are ca
pital i
ssued
to N
on-C
ontro
lling I
nteres
t -
- -
- -
- -
- -
- -
168,0
00
168,0
00
Advan
ce ag
ainst
issue
of sh
ares
- -
- -
- -
- -
- -
- 67
5,048
67
5,048
Sh
are iss
uanc
e cos
t -
- -
- -
- -
(558
) -
- (5
58)
(1,78
2) (2
,340)
Final c
ash di
viden
d for
the ye
ar en
ded
Dece
mber
31, 2
014 @
Rs 4.
00 pe
r sha
re -
- -
- -
- -
- -
- -
(1,31
5,031
) (1
,315,0
31)
1st In
terim
cash
divide
nd fo
r the y
ear e
nded
Dec
embe
r 31,
2015
@ Rs
2.00
per s
hare
- -
- -
- -
- -
- -
- (6
57,66
3) (6
57,66
3)2n
d Inte
rim ca
sh div
idend
for th
e yea
r e
nded
Dece
mber
31, 2
015 @
Rs 4.
00 pe
r sha
re -
- -
- -
- -
- -
- -
(1,31
5,328
) (1
,315,3
28)
3rd In
terim
cash
divide
nd fo
r the y
ear e
nded
Dec
embe
r 31,
2015
@ Rs
5.00
per s
hare
- -
- -
- -
- -
- -
- (1
,644,1
61)
(1,64
4,161
)Fin
al cash
divid
end @
10%
for th
e ye
ar en
ded D
ecem
ber 3
1, 20
14 -
- -
- -
- -
(481
,287)
- -
(481
,287)
- (4
81,28
7)Int
erim ca
sh div
idend
@ 12
0% fo
r the h
alf ye
ar en
ded J
une 3
0, 20
15 -
- -
- -
- -
(5,77
5,444
) -
- (5
,775,4
44)
- (5
,775,4
44)
Transa
ction c
ost re
versal
- -
- -
- -
- (3
,464)
- -
(3,46
4) -
(3,46
4)
- 72
,729
- (8
,358)
- -
- (4
,039,4
37)
- -
(3,97
5,066
) 1,
022,4
94
(2,95
2,572
)Ba
lance
as at
Dece
mber
31, 2
015
4,81
2,871
22
5,217
20
,655
60,11
7 11
,412
(34,4
59)
700,0
00
27,22
1,478
(3
,269)
(48,6
65)
32,96
5,357
59
,901,5
20
92,86
6,877
(Amou
nts in
thousa
nds)
116 Dawood Hercules Corporation Limited

For t
he y
ear e
nded
Dec
embe
r 31,
201
6C
on
soli
date
d st
atem
ent
of
Ch
ang
es in
eq
uit
y
Kar
achi
Febr
uary
28,
201
7In
am u
r R
ahm
anC
hief
Exe
cutiv
eM
. Abd
ul A
leem
Dire
ctor
------
------
------
------
------
------
------
------
------
------
------
------
------
-- ATT
RIBUT
ABLE
TO OW
NERS
OF TH
E HOL
DING C
OMPA
NY ---
------
------
------
------
------
------
------
------
------
------
------
------
-----
------
------
------
------
------
------
------
------
------
------
------
RESE
RVES
------
------
------
------
------
------
------
------
------
------
------
------
------
------
------
--- CA
PITAL
RESE
RVES
------
------
------
------
------
------
------
------
------
-REV
ENUE
RESE
RVES
------
------
------
------
----
Share
ca
pital
Emplo
yee
share
optio
n co
mpen
sation
re
serve
Reval
uatio
n res
erve o
n bu
siness
co
mbina
tion
Main
tenan
ce
reser
ve
Exch
ange
re
valua
tion
reser
ve
Hedg
ing
reser
ve Ge
neral
reser
ve
Unap
pro-
priate
d Pr
ofit
Share
of ot
her
comp
rehen
sive
incom
e of
assoc
iates
Reme
asure
ment
of po
st em
ploym
ent
bene
fits -
Actua
rial
(loss)
/inco
me
Sub
total
Non-
Contr
olling
Int
erest
Total
------
------
------
------
------
------
------
------
------
------
------
------
------
------
------
------
------
------
------
------
------
------
------
-Rup
ees--
------
------
------
------
------
------
------
------
------
------
------
------
------
------
------
------
------
------
------
------
------
--To
tal co
mpreh
ensiv
e inc
ome f
or th
e yea
r end
ed De
cemb
er 31
, 201
6
Profit f
or the
year
- -
- -
- -
- 25
,564,5
52
- -
25,56
4,552
47
,873,7
93
73,43
8,345
Ot
her c
ompre
hensi
ve inc
ome
- -
(3,79
8) -
(5,22
0) 1,
155
- -
(166
) 3,
454
(4,57
5) 2,
929
(1,64
6) -
- (3
,798)
- (5
,220)
1,15
5 -
25,56
4,552
(1
66)
3,45
4 25
,559,9
77
47,87
6,722
73
,436,6
99
Trans
actio
ns w
ith ow
ners
Dispo
sal of
subs
idiary
comp
any
- (2
25,21
7) -
- -
574
- -
- 27
,337
(197
,306)
(2,32
0,312
) (2
,517,6
18)
Share
s issue
d to I
FC by
subs
idiary
comp
any
- -
- -
- -
- -
- -
- 1,
468,6
78
1,46
8,678
Divide
nd by
subs
idiaries
alloc
able t
o N
on-C
ontro
lling in
terest
- -
- -
- -
- -
- -
- (1
2,585
,373)
(12,5
85,37
3)
Effec
t of p
artial
dispo
sal of
share
s held
in a
sub
sidiary
comp
any b
y prin
cipal s
ubsid
iary co
mpan
y -
- -
- -
- -
3,62
9,365
-
- 3,
629,3
65
15,34
7,284
18
,976,6
49
Share
s issue
d duri
ng th
e yea
r and
share
is
suanc
e cos
t acc
ounte
d for
as de
ductio
n fro
m eq
uity -
ordina
ry sha
res iss
ued d
uring
the p
eriod
- -
- -
- -
- (1
4,936
) -
- (1
4,936
) 4,
741,7
63
4,72
6,827
-
prefer
ence
share
s issue
d duri
ng th
e perio
d -
- -
- -
- -
- -
- -
5,01
2,206
5,
012,2
06
Decre
ase in
NCI d
ue to
disp
osal o
f share
holdin
g -
- -
- -
- -
164,4
89
- -
164,4
89
(164
,489)
-
Final c
ash di
viden
d @ 40
% for
the
year
ende
d Dec
embe
r 31,
2015
- -
- -
- -
- (1
,925,1
48)
- -
(1,92
5,148
) -
(1,92
5,148
)
Interim
cash
divide
nd @
135%
for th
e ye
ar en
ded D
ecem
ber 3
1, 20
16 -
- -
- -
- -
(6,49
7,376
) -
- (6
,497,3
76)
- (6
,497,3
76)
- (2
25,21
7) -
- -
574
- (4
,643,6
06)
- 27
,337
(4,84
0,912
) 11
,499,7
57
6,65
8,845
Ba
lance
as a
t Dec
embe
r 31,
2016
4,81
2,871
-
16,85
7 60
,117
6,19
2 (3
2,730
) 70
0,000
48
,142,4
24
(3,43
5) (1
7,874
) 53
,684,4
22
119,2
77,99
9 17
2,962
,421
The a
nnex
ed no
tes fro
m 1 t
o 58 f
orm an
integ
ral pa
rt of th
ese c
onso
lidate
d fina
ncial
state
ments
.
(Amou
nts in
thousa
nds)
Annual Report 2016 117

For the year ended December 31, 2016Consolidated statement of Cash flows
Note 2016 2015-------------- (Rupees) --------------
Cash flows from operating activities
Cash generated from operations 41 18,152,961 11,934,137 Retirement and other service benefits paid (198,117) (204,121)Finance cost paid (6,111,063) (7,258,167)Taxes paid (5,407,859) (3,772,437)Payments against provision for contractual commitments (23,604) (72,541)Long term loans and advances - net (9,556,863) (1,602,363)Discontinued operations 5,121,505 4,516,967 Net cash generated from operating activities 1,976,960 3,541,475
Cash flows from investing activities
Purchases of property, plant & equipment,intangible assets and biological assets (23,721,138) (8,917,191)Sale proceeds on disposal of property, plant & equipment and biological assets 50,045 145,610 Investment in subsidiary / associated company (49,785) (886,019)Short term investments made - (175,000)Short term investments redeemed - 175,890 Investment made during the year - net (35,570,970) 24,499,917 Income on deposits / other financial assets 833,745 1,591,699 Proceeds against disposal of investment in subsidiary companies 41,583,561 10,424,984 Dividends received 3,192,275 2,396,089 Discontinued operations (1,188,097) (790,020)
Net cash (utilised in) /generated from investing activities (14,870,364) 28,465,959
Cash flows from financing activities
Proceeds / repayments of borrowings - net 21,227,625 (16,016,550)Long term financing obtained - 6,180,491 Proceeds from issuance of shares 11,247,837 168,000 Share issuance cost (79,377) (2,340)Proceeds against disposal of investmnet in subsidiary company 18,959,128 - Advance received against issuance of right shares to Non-controlling interest - 675,048 Advance for insurance policy against foreign finances - (1,021,652)Proceeds from short term finance 724,700 1,150,000 Repayments of short term finance (1,080,000) (5,150,000)Dividends paid (20,846,102) (12,791,318)Discontinued operations (3,175,878) (1,721,870)
Net cash generated from / (utilised in) financing activities 26,977,933 (28,530,191)
Net increase / (decrease) in cash and cash equivalents 14,084,529 3,477,243
Cash and cash equivalents at the beginning of the year 11,832,739 8,355,496
Effects of exchange rate changes on cash and cash equivalents (20,372) -
Cash and cash equivalents at the end of the year 42 25,896,896 11,832,739
The annexed notes from 1 to 58 form an integral part of these consolidated financial statements.
KarachiFebruary 28, 2017
Inam ur RahmanChief Executive
M. Abdul AleemDirector
(Amounts in thousand)
118 Dawood Hercules Corporation Limited

1. legal status and oPerations
1.1 Dawood Hercules Corporation Limited (the Holding Company) was incorporated in Pakistan on April 17, 1968 as a public limited company under the Companies Act 1913 (now Companies Ordinance, 1984) (the Ordinance) and its shares are quoted on Pakistan Stock Exchange Limited. The principal activity of the Holding Company is to manage investments in its subsidiary and associated companies. The registered office of the Holding Company is situated at Dawood Center, M.T. Khan Road, Karachi.
1.2 During the year ended December 31, 2015, the Holding Company entered into re-negotiation with Pakarab Fertilizers Limited (PAFL) for the disposal of entire shareholding in its wholly owned subsidiary DH Fertilizers Limited (DHFL) and Bubber Sher (Private) Limited (BSPL) and signed a Share Purchase Agreement (SPA) with PAFL. Accordingly, the shares of DHFL and BSPL were transferred in the name of Fatima Fertilizer Company Limited (assignee of PAFL as per the terms of the SPA).
1.3 During the year ended December 31, 2015, the Holding Company had reassessed the control conclusion of its investment in Engro Corporation Limited (ECL) as a result of adoption of International Financial Reporting Standards (IFRS) - 10 ‘Consolidated Financial Statements’, by Securities and Exchange Commission of Pakistan (SECP), that although, the Holding Company has less than 50% voting rights in ECL, however, based on the absolute size of the Holding Company’s shareholdings, the relative size of other shareholdings and the number of representation on ECL’s Board, the Holding Company has the ability to exercise control over ECL as per the terms of IFRS 10.
Accordingly, these financial statements have been prepared to reflect consolidated financial information
of the Holding Company and ECL (the Group) including summary of significant accounting policies.
2. grouP struCture
the “group” consists of:
holding Company: Dawood Hercules Corporation Limited;
Principal subsidiary Company: Company in which the Holding Company owns over 50% of voting rights, or companies directly controlled by the Holding Company:
%age of direct holding2016 2015
Engro Corporation Limited (note 2.1) 37.22 37.22
Associate Company:Company in which the Holding Company owns over 20% of voting rights but less than 50%, or companies on which the Holding Company has significant influence:
%age of direct holding2016 2015
The Hub Power Company Limited (note 2.2) 14.91 14.91
For the year ended December 31, 2016
notes to the ConsolidatedfinanCial statements(Amounts in thousand)
Annual Report 2016 119

2.1 “Principal subsidiary Company - engro Corporation limited
Engro Corporation Limited (ECL), is a public listed company incorporated in Pakistan under the Ordinance and its shares are quoted on Pakistan Stock Exchange Limited. The principal activity of ECL is to manage investments in subsidiary companies, associated companies and joint venture, engaged in fertilizers, PVC resin manufacturing and marketing, food, energy, LNG and chemical terminal and storage businesses.
other subsidiary Companies: Companies in which ECL owns over 50% of voting rights, or companies directly controlled by the ECL:
%age of direct holding2016 2015
- Engro Powergen Limited (note 2.1.1) 100 100- Elengy Terminal Pakistan Limited (note 2.1.2) 80 100- Engro Eximp Agriproducts (Private) Limited (note 2.1.3) 100 100- Engro Foods Limited (note 2.1.4 and 36) - 87.06- Engro Fertilizers Limited (note 2.1.5) 56.45 78.78- Engro Polymer and Chemicals Limited (note 2.1.6) 56.19 56.19
Joint venture Company:
- Engro Vopak Terminal Limited (note 2.1.7) 50 50
other subsidiary companies
2.1.1 engro Powergen limited
Engro Powergen Limited (EPL), a wholly owned subsidiary of ECL, is a public unlisted company incorporated in Pakistan. It is established with the primary objective to analyse potential opportunities in the Power Sector and undertake Independent Power Projects (IPPs) based on feasibilities of new ventures.
Following are the subsidiaries of EPL:
%age of direct holding2016 2015
- Engro Power Services Limited (note 2.1.1.1) - 100- Engro Power International Holding B.V. (note 2.1.1.2) 100 100- Kolachi Portgen (Private) Limited (2.1.1.3) 100 100- Engro Powergen Qadirpur Limited (note 2.1.1.4) 68.8 68.8- Engro Powergen Thar (Private) Limited (note 2.1.1.5) 50.1 64.1
Following are associated companies of EPL:
- GEL Utility Limited (note 2.1.1.6) 45 45- Sindh Engro Coal Mining Company Limited (note 2.1.1.7) 11.9 19.8
For the year ended December 31, 2016
notes to the ConsolidatedfinanCial statements(Amounts in thousand)
120 Dawood Hercules Corporation Limited
2.1.1.1 Engro Power Services Limited (EPSL), a private limited company, has been established in Nigeria with the objective to carry on business as power generating, transmission, distribution and servicing company. EPSL is currently providing Operations and Management (O&M) services to a Captive Power Plant located in a refinery within Nigeria. The agreement of providing O&M services was entered into by EPL. EPSL is acting as an agent of EPL to discharge its obligations under the agreement.
During the year, EPL re-structured its holding in Engro Power Services Limited (Nigeria) and transferred its shareholding to Engro Power Services Holding B.V. (EPSH B.V.) in the Netherlands, a 100% owned subsidiary of EPL through EPIH B.V.
However, this transaction shall bear no effect on the existing rights and obligations under O&M services subcontract arrangement with EPSL.
2.1.1.2 Engro Power International Holding B.V. (EPIH), a private limited company, has been established in Rotterdam, Netherlands with the objective to incorporate, participate, manage and supervise business and companies. During the year, EPIH incorporated two wholly owned subsidiaries namely Engro Power Services Holding B.V. (EPSH) and Engro Power Investments International B.V. (EPII) both based in Netherlands.
2.1.1.3 Kolachi Portgen (Private) Limited (KPPL) has been established and incorporated in Pakistan with the objective to operate and own a Regasified Liquefied Natural Gas (RLNG) based power generation plant. During the year, 10,000 shares of Rs. 10 each (2015: Nil) were issued to EPL.
2.1.1.4 Engro Powergen Qadirpur Limited (EPQL) is a public listed company incorporated in Pakistan with the primary objective to undertake the business of power generation, distribution, transmission and sale. EPQL completed construction and testing of its 217.3 MW combined cycle power plant and has commenced commercial operation on March 27, 2010. The electricity generated is transmitted to the National Transmission and Dispatch Company (NTDC) under the Power Purchase Agreement (PPA) dated October 26, 2007, valid for a period of 25 years.
2.1.1.5 Engro Powergen Thar (Private) Limited (EPTPL), a private limited company, has been established and incorporated in Pakistan. The principal operations of EPTPL is to carry out the business of power generation, distribution, transmission and sale of electricity. EPTL has been formed for the purpose of the development of 2 x 330 MW mine mouth power plants at Thar Block II, Sindh.
During the year, EPTPL achieved financial close on April 4, 2016 for construction of 2 x 330 MW mine mouth power plant. The key agreements includes Engineering, Procurement and Construction (EPC) contract with China Machinery Engineering Corporation (CMEC) dated February 14, 2015, Power Purchase Agreement (PPA) dated May 4, 2015 with National Transmission and Dispatch Company, Implementation Agreement with Government of Pakistan dated May 04, 2015, Coal Supply Agreement dated June 7, 2015 with Sindh Engro Coal Mining Company Limited (SECMC) and Water Use Agreement dated November 19, 2015 with the Government of Sindh and Thar Power Company Limited (TPCL). Further, EPTL has also signed Engro Supply and Services Agreement dated September 8, 2015 with EPL.
Total cost of the project is estimated at USD 1,108 million which is proposed to be financed through equity commitments of USD 277 million and Debt portion of USD 831 million. Debt portion is a mix of local and foreign financing. EPTPL signed all major financing agreements with lenders on December 21, 2015. Partial drawdowns against local and foreign financing agreement have been made during the year.
For the year ended December 31, 2016
notes to the ConsolidatedfinanCial statements(Amounts in thousand)
Annual Report 2016 121

Further, during the year, additional 537,189,393 ordinary shares were subscribed by EPL in the capital of Engro Powergen Thar (Private) Limited (EPTL). EPL now holds 50.10% of the issued capital of EPTL while the balance share holding is held by CMEC Thar Power Investment Limited, Habib Bank Limited and Liberty Mills Limited.
2.1.1.6 GEL is a private limited company in Nigeria with the objective of generation and distribution of energy, power and other related services and has undertaken a project of 72 MW triple redundancy captive power plant, which commenced commercial operations from November 21, 2014. The Group holds 12,272,727 ordinary shares of Naira 1 each in GEL representing a 45% (2015: 45%) equity stake.
2.1.1.7 Sindh Engro Coal Mining Company Limited (SECMC) was formed under a Joint Venture Agreement (JVA), dated September 8, 2009, between the Government of Sindh (GoS 40%) and EPL (60%). The aforementioned JVA is consequent to the selection of SECMC as GoS’s joint venture partner, through an International Competitive Bidding process, for the development, construction and operations of an open cast lignite mine in Block-II of Thar Coal Field, Sindh (the Project), with an annual mining capacity of 6.5 million tons of coal.
The GoS has granted a 30 year mining lease to SECMC for exploration and mining activities in Thar Block-II. Based on the detailed feasibility study conducted by SECMC, Thar Block-II has estimated coal reserves of approximately 2 billion tons, independently verified by a Competent Person Statement (CPS) in 2012, of which 195 million tons will be mined at the rate of 6.5 million tons per year over the period of the mining lease. SECMC, during 2011, had also received a firm proposal for Engineering, Procurement & Construction (EPC) for 6.5 million tons per annum mining capacity and 1,200 MW power plant from an international contractor. However, in May 2013, SECMC in order to reduce its capital investment and optimize the project size and cost decided to decouple the mining and power projects. Further, pursuant to the decision of the Cabinet of Economic Coordination Committee (ECC) dated May 31, 2013, Sovereign Guarantee amounting to USD 700,000 has been approved for the debt portion of the mining project conditional upon the revision of the Joint Venture Agreement.
During the year, SECMC achieved financial close of the Project on April 4, 2016 for construction of coal mine with the capacity of 3.8 million tonnes per annum. This coal will be supplied to Engro Powergen Thar (Private) Limited (EPTL) as per Coal Supply Agreement dated June 7, 2015. Other key agreements entered into for the Project include Engineering, Procurement and Construction (EPC) contract with China Machinery Engineering Corporation (CMEC) dated September 10, 2014 and Implementation Agreement with GoS dated November 19, 2015.
Total cost of the Project is estimated at USD 845,000, which would be financed through equity injection of USD 211,250 and Debt portion of USD 633,750. Debt portion is a mix of local and foreign financing. SECMC signed all major financing agreements with the lenders on December 21, 2015. Partial drawdowns against the local and foreign financing agreements have been made during the year.
During the year, EPL acquired 3,359,331 (2015: 988,948) additional ordinary shares of the Sindh Engro Coal Mining Company Limited (SECMC) out of the total 219,698,267 (2015: 165,578,298) ordinary shares issued. EPL’s percentage holding in the shareholding of the SECMC as at December 31, 2016 was 11.91% (December 31, 2015: 19.80%).
For the year ended December 31, 2016
notes to the ConsolidatedfinanCial statements(Amounts in thousand)
122 Dawood Hercules Corporation Limited

2.1.2 elengy terminal Pakistan limited
Elengy Terminal Pakistan Limited (ETPL), a wholly owned subsidiary of ECL, is a public unlisted company, incorporated in Pakistan. The principal business of ETPL is to establish and operate a terminal for handling, re-gasification, storage, treatment and processing, along with import, export and trading, of Liquefied Natural Gas (LNG), Re-gasified Liquefied Natural Gas (RLNG), Liquid Petroleum Gas (LPG), Natural Gas Liquid (NGL) and all other related liquids, gases and chemical and petroleum products. Engro Elengy Terminal (Private) Limited (EETPL) is a wholly owned subsidiary of ETPL.
During the year, ETPL issued 190,572,852 ordinary shares of Rs. 10 each as fully paid right shares, out of which 150,035,215 shares were subscribed by ECL and the balance 40,537,637 right shares were renunciated by ECL in favor of International Finance Corporation (IFC). As a result, ECL, as at the reporting date, holds 80% of the issued share capital of ETPL.
2.1.3 engro eximp agriproducts (Private) limited
Engro Eximp Agriproducts (Private) Limited (EEAPL) is a private limited company, incorporated in Pakistan. The principal activity of the EEAPL is to produce, manufacture and trade all kinds of raw, processed and prepared food products including agriculture, dairy and farming products. EEAPL has set up a rice processing plant in District Shaikhupura, which commenced commercial production in 2011.
On April 1, 2015, ECL acquired the entire shareholding of EEAPL comprising of 190,798,200 ordinary shares and 10,000,000 preference shares for Rs. 4,400,000 as part of its restructuring plans.
During the year, ECL subscribed 62,700 further shares in EEAPL at Rs.10,000 per share by investing Rs. 377,000 during the year and converted the advance against issue of share capital amounting to Rs. 250,000.
2.1.4 engro foods limited
Engro Foods Limited (EFoods), is a public listed company, incorporated in Pakistan. The principal activity of EFoods is to manufacture, process and sell dairy products, beverages, ice cream and frozen desserts. It also owns and operates a dairy farm.
During the year, on March 3, 2016, ECL notified the Pakistan Stock Exchange (PSX) that it has received a public announcement of intention by a potential acquirer to acquire up to 51% of the total issued ordinary shares of Engro Foods Limited (EFoods) under a Share Purchase Agreement (SPA) and through a Mandatory Tender Offer (MTO) to the remaining shareholders of EFoods. ECL, on July 4, 2016, informed the PSX that the SPA has been entered into between FrieslandCampina Pakistan Holding B.V. (FCP), a wholly owned subsidiary of Royal FrieslandCampina N.V. (RFC) and ECL with respect to the sale of up to 51% of the total issued shares of EFoods. In respect thereof the shareholders of ECL in its Extra Ordinary General Meeting, held on August 5, 2016, unanimously approved the disposal of up to 51% of ECL’s shareholding in EFoods.
FCP as required under the takeover laws, made MTO on October 5, 2016, to acquire upto 49.8 million
ordinary shares of EFoods, representing 6.5% of the total issued ordinary shares of EFoods at an offer price of Rs. 151.85 per share. Consequent to the MTO, ECL divested 361,299,052 ordinary shares of Rs. 10 each held in EFoods representing 54.1% of it’s investment at a price of Rs. 120.15 per share, determined in accordance with the terms of the SPA. The terms of the SPA also entitiles ECL to receive
For the year ended December 31, 2016
notes to the ConsolidatedfinanCial statements(Amounts in thousand)
Annual Report 2016 123

additional consideration of Rs. 0.40 per share consequent to recovery of sales tax refundable balances of EFoods for the periods 2006 - 2011, upon certain conditions. As a result of the above, ECL, as at the reporting date, holds 39.9% of the issued share capital of EFoods.
As at December 31, 2016, ECL has received an amount of Rs. 43,355,886 from FCP, out of the total consideration of Rs. 43,553,428. Accordingly, the balance amount has been recorded as receivable from FCP, as disclosed in note 16.
ECL has also granted EFoods, the right to use its know-how in connection with the manufacturing, packaging, marketing, sale, use and distribution of dairy products under the Know-How License agreement effective December 20, 2016. In consideration of the right granted, ECL is entitled to a royalty fee of 0.5% of the net sales of EFoods derived from the sales of all products in the territory, when EFoods meets certain agreed sales targets.
2.1.5 engro fertilizers limited
Engro Fertilizers Limited (EFert), is a public listed company, incorporated in Pakistan. The principal activity of EFert is manufacturing, purchasing and marketing of fertilizers.
During the year, ECL sold 297,196,000 ordinary shares of Rs. 10 each held in EFert, representing 28.34% of its investment, through private placement, at a price of Rs. 65.47 per share, determined through a book building mechanism. These shares were placed to local / foreign institutional investors and high net-worth individuals.
As a result of the aforementioned events, ECL, as at the reporting date, holds 56.45% of the issued share capital of EFert.
Following are the subsidiaries of EFert:
%age of direct holding2016 2015
- Engro Eximp (Private) Limited - EEPL (2.1.5.1) Amalgamated in Efert 100- Engro Eximp FZE (note 2.1.5.2) 100 100
2.1.5.1 Last year, the Board of Directors of EEPL and the Board of Directors of EFert gave approval to proceed with the scheme of Amalgamation (the Scheme) of EEPL with EFert. The said scheme was sanctioned by the court on April 30, 2016 pursuant to which EEPL ceased to exist as a legal entity, with all its assets being merged and amalgamated into EFert.
2.1.5.2 Engro Eximp FZE is incorporated in the Jebel Ali Free Zone, Emirate of Dubai and is engaged in the business of trading seeds, agricultural tools, chemical fertilizers, organic fertilizers, plant seeds, ghee, vegetable oil, grains, cereals legumes, sugar, flour, agricultural equipment and accessories.
2.1.6 engro Polymer and Chemicals limited
Engro Polymer and Chemicals Limited (EPCL), is a public listed company, incorporated in Pakistan. The principal activity of EPCL is to manufacture, market and sell Poly Vinyl Chloride (PVC), Vinyl Chloride Monomer (VCM), caustic soda and other related chemicals. It is also engaged in supply of surplus power generated from its power plants to EFert (NPK Plant).
For the year ended December 31, 2016
notes to the ConsolidatedfinanCial statements(Amounts in thousand)
124 Dawood Hercules Corporation Limited

Further, EPCL has a wholly owned subsidiary, Engro Polymer Trading (Private) Limited (EPTL), which is a private limited company incorporated in Pakistan. EPTL’s principal activity is to purchase, market and export PVC, VCM and related chemicals.
During the year, ECL, in its Annual General Meeting held on April 15, 2016, has obtained shareholders approval for the disposal of the ECL’s entire 56.19% shareholding in EPCL i.e. 372,810,000 ordinary shares of Rs. 10 each. Pursuant to the public announcement of intention to the stock exchange by the potential acquirer, to acquire the entire shareholding of ECL in EPCL and commencement of due diligence, the potential acquirer was granted an extension in time for making the public announcement of offer by the SECP to complete the due diligence and finalise certain outstanding commercial matters. The potential acquirer on August 20, 2016, informed the SECP and the PSX that it was not in a position to make the offer in the time period allocated by the SECP, as the negotiations had not reached completion and as the time period to make the offer has lapsed, it is withdrawing its intention to acquire the aforesaid shares of EPCL whilst reserving its right to make a further announcement of intention should this be deemed viable.
Further, during the year, ECL, in its Annual General Meeting held on April 15, 2016, has obtained its shareholder’s approval for the disposal of the ECL’s entire shareholding in EPCL representing 56.19% i.e. 372,810,000 shares.
2.1.7 Joint venture Company - engro vopak terminal limited
Engro Vopak Terminal Limited (EVTL), a 50% share joint venture of ECL is a public unlisted company incorporated in Pakistan. EVTL is a joint venture of ECL and Royal Vopak Netherlands B.V. EVTL has been granted the exclusive concession, right and license to design, finance, insure, construct, test, commission, complete, operate, manage and maintain an Integrated Liquid Chemical Terminal and Storage Farm at the south western zone of Port Qasim on Build, Operate and Transfer (BOT) basis.
2.2 “associate Company - the hub Power Company limited
The Hub Power Company Limited (HUBCO) is a public listed company incorporated in Pakistan. The Global Depository Receipts of HUBCO are listed on the Luxembourg Stock Exchange. The principal activities of the HUBCO are to develop, own, operate and maintain power stations. The HUBCO owns an oil-fired power station of 1,200 MW (net) in Balochistan (Hub plant) and a 214 MW (net) oil-fired power station in Punjab (Narowal plant).”
3. summary of signifiCant aCCounting PoliCies
The significant accounting policies applied in the preparation of these consolidated financial statements are set out below. These policies have been consistently applied to all periods presented, unless otherwise stated.
3.1 Basis of preparation and statement of compliance
3.1.1 These consolidated financial statements have been prepared under the historical cost convention, as modified by remeasurement of biological assets and certain financial assets and financial liabilities, including derivative instruments, at fair value, and certain staff retirement and other service benefits at present value.
For the year ended December 31, 2016
notes to the ConsolidatedfinanCial statements(Amounts in thousand)
Annual Report 2016 125
3.1.2 These consolidated financial statements have been prepared in accordance with the requirements of the Ordinance, directives issued by the SECP and approved financial reporting standards as applicable in Pakistan. Approved financial reporting standards comprise of such International Financial Reporting Standards (IFRS) issued by the International Accounting Standards Board (IASB) as are notified under the provisions of the Ordinance. Wherever the requirements of the Ordinance or directives issued by the SECP differ with the requirements of these standards, the requirements of the Ordinance and the said directives have been followed.
3.1.3 The preparation of consolidated financial statements in conformity with the above requirements requires the use of certain critical accounting estimates. It also requires management to exercise its judgement in the process of applying the Group’s accounting policies. The areas involving high degree of judgement or complexity, or areas where assumptions and estimates are significant to the consolidated financial statements are disclosed in note 4.
3.1.4 initial application of standards, amendments or an interpretation to existing standards a) Standards,amendmentstopublishedstandardsandinterpretationsthatareeffectivein2016
The following amendments to published standards are mandatory for the financial year beginning
January 1, 2016: - IFRS 5 ‘Non-current assets held for sale and discontinued operations’.The amendment
clarifies that, when an asset (or disposal group) is reclassified from ‘held for sale’ to ‘held for distribution’, or vice versa, this does not constitute a change to a plan of sale or distribution, and does not have to be accounted for as such. This means that the asset (or disposal group) does not need to be reinstated in the consolidated financial statements as if it had never been classified as ‘held for sale’ or ‘held for distribution’ simply because the manner of disposal has changed. The amendment also rectifies an omission in the standard by explaining that the guidance on changes in a plan of sale should be applied to an asset (or disposal group) which ceases to be held for distribution but is not reclassified as ‘held for sale’. This amendment will not have any significant impact on the Group’s financial statements.
- IFRS 11 ‘Joint arrangements’. This amendment provides specific guidance on accounting for the acquisition of an interest in a joint operation (‘JO’) that is a business. The amendment address diversity in practice related to the accounting for these transactions. The Group’s current accounting treatment is already in line with this amendment.
- IAS 1 ‘Presentation of financial statements’ These amendments clarify guidance in IAS 1 on materiality and aggregation, the presentation of subtotals, the structure of financial statements and disclosures of accounting policies. The amendments form a part of the IASB’s Disclosure Initiative, which explores how financial statement disclosures can be improved. This amendment will not have any significant impact on the Group’s financial statements.
- IAS 19 (Amendment), ‘Employee benefits’. The amendment clarifies that, when determining the discount rate for post-employment benefit obligations, it is the currency that the liabilities are denominated in that is important, not the country where they arise. The assessment of whether there is a deep market in high-quality corporate bonds is based on corporate bonds in that currency, not corporate bonds in a particular country. Similarly, where there is no deep market in high-quality corporate bonds in that currency, government bonds in the relevant currency should be used. The amendment is retrospective but limited to the beginning of
For the year ended December 31, 2016
notes to the ConsolidatedfinanCial statements(Amounts in thousand)
126 Dawood Hercules Corporation Limited

the earliest period presented. The Group’s accounting treatment is already in line with this amendment.
- IAS 27 ‘Separate financial statements’. This amendment restores the option to use the equity method to account for investments in subsidiaries, joint ventures and associates in an entity’s separate financial statements. The Group’s current accounting treatment is already in line with this amendment.
- IAS 34 ’Interim financial reporting’. This amendment clarifies what is meant by the reference in the standard to ‘information disclosed elsewhere in the interim financial report’. The amendment also amends IAS 34 to require a cross-reference from the interim financial statements to the location of that information. The amendment is retrospective. This amendment will not have any significant impact on the Group’s financial statements.
The other new standards, amendments to published standards and interpretations that are mandatory for the financial year beginning on January 1, 2016 are considered not to be relevant or to have any significant effect on the Group’s financial reporting and operations.
b) Standards,amendmentstopublishedstandardsandinterpretationsthatarenotyeteffectiveand have not been early adopted by the group
The following new amendments to published standards are not effective for the financial year beginning on January 1, 2016 and have not been early adopted by the Group: - IFRS 15 ‘Revenue from contracts with customers’ (effective for periods beginning on or
after January 1, 2018). This standard is yet to be notified by SECP. This standard deals with revenue recognition and establishes principles for reporting useful information to users of financial statements about the nature, amount, timing and uncertainty of revenue and cash flows arising from an entity’s contracts with customers. Revenue is recognised when a customer obtains control of a good or service and thus has the ability to direct the use and obtain the benefits from the good or service. The standard replaces IAS 18 ‘Revenue’ and IAS 11 ‘Construction contracts’ and related interpretations. The Group is yet to assess the full impact of the standard.
- IFRS 9 ‘Financial instruments’ (effective for periods beginning on or after January 1, 2018). This standard is yet to be notified by SECP. This standard replaces the guidance in IAS 39. It includes requirements on the classification and measurement of financial assets and liabilities; it also includes an expected credit losses model that replaces the current incurred loss impairment model. It is unlikely that the standard will have any significant impact on the Group’s financial statements.
- IFRS 16 ‘Leases’ (effective for periods beginning on or after January 1, 2019). This standard is yet to be notified by SECP. This standard replaces the current guidance in IAS 17 and is a far reaching change in accounting by lessees in particular. Under IAS 17, lessees were required to make a distinction between a finance lease (on balance sheet) and an operating lease (off balance sheet). IFRS 16 now requires lessees to recognise a lease liability reflecting future lease payments and a ‘right-of-use asset’ for virtually all lease contracts. The IASB has included an optional exemption for certain short-term leases and leases of low-value assets;
For the year ended December 31, 2016
notes to the ConsolidatedfinanCial statements(Amounts in thousand)
Annual Report 2016 127

however, this exemption can only be applied by lessees. For lessors, the accounting stays almost the same. However, as the IASB has updated the guidance on the definition of a lease (as well as the guidance on the combination and separation of contracts), lessors will also be affected by the new standard. At the very least, the new accounting model for lessees is expected to impact negotiations between lessors and lessees. Under IFRS 16, a contract is, or contains, a lease if the contract conveys the right to control the use of an identified asset for a period of time in exchange for consideration. The Group is yet to assess the full impact of the standard.
- Amendments to IAS 12 ‘Income taxes’ on Recognition of deferred tax assets for unrealized
losses (effective for periods beginning on or after January 1, 2017). These amendments on the recognition of deferred tax assets for unrealized losses clarify how to account for deferred tax assets related to debt instruments measured at fair value. It is unlikely that the standard will have any significant impact on the Group’s financial statements.
- “IAS 7 ‘Cash flow statements: Disclosure initiative’ (effective for periods beginning on or after January 1, 2017). This amendment requires disclosure to explain changes in liabilities for which cash flows have been, or will be classified as financing activities in the statement of cash flows. The amendment only covers balance sheet items for which cash flows are classified as financing activities. In case other items are included within the reconciliation, the changes in liabilities arising from financing activities will be identified separately. Reconciliation of the opening to closing balance is not specifically required but instead the information can be provided in other ways. In the first year of adoption, comparative information need not be provided. It is unlikely that this standard will have any significant impact on the Group’s financial statements.
There are number of other standards, amendments and interpretations to the published standards
that are not yet effective and are also not relevant to the Group and therefore, have not been presented here.
3.1.5 Basis of consolidation i) subsidiaries
Subsidiaries are all entities over which the Group has the power to govern the financial and
operating policies generally accompanying a shareholding of more than one half of the voting rights. The existence and effect of potential voting rights that are currently exercisable or convertible are considered when assessing whether the Group controls another entity. Further, the Group also considers whether:
- it has power to direct the relevant activities of the subsidiaries;
- is exposed to variable returns from the subsidiaries; and - decision making power allows the Group to affects its variable returns from the subsidiaries.
Subsidiaries are fully consolidated from the date on which control is transferred to the Group. They are de-recognised from the date the control ceases. These consolidated financial statements include Dawood Hercules Corporation Limited and all companies in which it directly or indirectly controls, beneficially owns or holds more than 50% of the voting securities or otherwise has power to elect and appoint more than 50% of its directors (the Subsidiaries).
For the year ended December 31, 2016
notes to the ConsolidatedfinanCial statements(Amounts in thousand)
128 Dawood Hercules Corporation Limited
The Group uses the acquisition method of accounting to account for business combinations. The consideration transferred for the acquisition of a subsidiary is the fair value of the assets transferred, the liabilities incurred and the equity interests issued by the Group. The consideration transferred includes the fair value of any asset or liability resulting from a contingent consideration arrangement. Acquisition-related costs are expensed as incurred. Identifiable assets acquired and liabilities (including contingent liabilities) assumed in a business combination are measured initially at their fair values at the acquisition date. On an acquisition-by-acquisition basis, the Group recognises any non-controlling interest in the acquiree either at fair value or at the non-controlling interest’s proportionate share of the acquiree’s identifiable net assets.
If the business combination is achieved in stages, the acquisition date carrying value of the acquirer’s previously held equity interest in the acquiree is re-measured to fair value at the acquisition date; any gains or losses arising from such re-measurement are recognised in consolidated profit and loss account.
Goodwill is initially measured as the excess of the aggregate of the consideration transferred and the fair value of non-controlling interest over the net identifiable assets acquired and liabilities assumed. If this is less than the fair value of the net assets of the subsidiary acquired in the case of a bargain purchase, the difference is recognised in profit and loss account.
Inter-company transactions, balances, income and expenses on transactions between group companies are eliminated. Profits and losses (unrealized) are also eliminated. Accounting policies of subsidiaries have been changed where necessary to ensure consistency with the policies adopted by the Group.
ii) transactions and non-controlling interests
The Group treats transactions with non-controlling interests that do not result in loss of control as transactions with equity owners of the Group. The difference between fair value of any consideration paid and the relevant share acquired of the carrying value of net assets of the subsidiary is recorded in equity. Gains or losses on disposals to non-controlling interests are also recorded in equity.
iii) disposal of subsidiaries
When the Group ceases to have control or significant influence, any retained interest in the entity is remeasured to its fair value, with the change in carrying amount recognised in profit and loss account. The fair value is the initial carrying amount for the purposes of subsequently accounting for the retained interest as an associate, joint venture or financial asset depending on the level of influence retained. In addition, any amounts previously recognised in other comprehensive income in respect of that entity are accounted for as if the Group had directly disposed off the related assets or liabilities. This may mean that amounts previously recognised in other comprehensive income are reclassified to consolidated profit and loss account.
3.2 exploration and evaluation assets
Exploration and evaluation assets in respect of area of interest includes license fee, detailed feasibility
study and all other related studies to ensure bankability of the project including ancillary (operating and administrative) cost related thereto.
For the year ended December 31, 2016
notes to the ConsolidatedfinanCial statements(Amounts in thousand)
Annual Report 2016 129

The aforementioned expenditure supporting the technical feasibility and economic / commercial viability, are capitalised as exploration and evaluation assets, where: - such costs are expected to be recouped through successful development and exploration of the
area of interest or alternatively, by its sale; or
- exploration and / or evaluation activities in the area of interest have not yet reached a stage which permits a reasonable assessment of the existence, or otherwise of economically recoverable reserves, and active and significant operations in, or in relation to, the area are continuing.
Capitalised exploration and evaluation expenditure is recorded at cost less impairment charges. As asset is not available for use, it is not depreciated, however, an estimate of recoverable amount of assets is made for possible impairment on an annual basis.
Cash flows associated with exploration and evaluation expenditure are classified as investing activities in the consolidated statement of cash flows.
3.3 development properties
Development expenditure represents expenditure incurred in area in which economically recoverable resources have been identified. Such expenditure comprises costs directly attributable to the construction of a mine and related infrastructure.
Once a development decision has been taken the carrying amount of the exploration and evaluation asset is transferred to development expenditure and classified under non-current assets as ‘development properties’.
Capitalised development properties expenditure is recorded at cost less impairment, if any. As asset is not available for use, it is not depreciated; however, an estimate of recoverable amount of assets is made for possible impairment on an annual basis.
Cash flows associated with development properties are classified as investing activities in the consolidated statement of cash flows.
3.4 Property, plant and equipment
3.4.1 owned assets
These are stated at historical cost less accumulated depreciation and impairment losses, if any, except free-hold land and capital work in progress which are stated at cost. Historical cost includes expenditure that is directly attributable to the acquisition of the items including borrowing costs. The cost of self constructed assets includes the cost of materials and direct labour, any other costs directly attributable to bringing the asset to a working condition for its intended use, and the costs of dismantling and removing the items and restoring the site on which they are located. Purchased software that is integral to the functionality of the related equipment is capitalised as part of that equipment.
Where major components of an item of property, plant and equipment have different useful lives, they are accounted for as separate items of property, plant and equipment.
For the year ended December 31, 2016
notes to the ConsolidatedfinanCial statements(Amounts in thousand)
130 Dawood Hercules Corporation Limited

Subsequent costs are included in the asset’s carrying amount or recognised as a separate asset, as appropriate, only when it is probable that future economic benefits associated with the item will flow to the Group and the cost of the item can be measured reliably. The carrying amount of the replaced part is derecognised. All other repairs and maintenance are charged to the profit and loss account during the financial period in which they are incurred.
The carrying values of property, plant and equipment are reviewed at each reporting date for indications that an asset may be impaired and carrying values may not be recovered. If any such indication exists and where the carrying value exceeds the estimated recoverable amount, the asset or cash generating unit is written down to its recoverable amount. The recoverable amount of property, plant and equipment is the greater of fair value less cost to sell and value in use.
Useful lives are determined by the management based on the expected usage of assets, physical wear and tear, technical and commercial obsolescence, legal and similar limits on the use of the assets and other similar factors.
Maintenance and normal repairs are charged to profit and loss account as and when incurred. Major renewals and improvements, if any, are capitalised in accordance with IAS 16 “Property, Plant and Equipment” and depreciated in a manner that best represents the consumption pattern and useful lives.
Depreciation is charged to consolidated profit and loss account using the straight line method, except for catalyst whose depreciation is charged on the basis of number of production days, whereby the cost of an operating asset less its estimated residual value is written off over its estimated useful life. Depreciation on addition is charged from the month following the month in which the asset is available for use and on disposals upto the preceding month of disposal.
Disposal of asset is recognised when significant risk and rewards incidental to ownership have been transferred to buyers. Gains and losses on disposals are determined by comparing the proceeds with the carrying amount and are recognised within ‘Other operating expenses / income’ in the consolidated profit and loss account.
The Group reviews appropriateness of the rate of depreciation, useful life and residual value used in the calculation of depreciation.
3.4.2 leased assets
Leases in terms of which the Group assumes substantially all the risks and rewards of ownership, are classified as finance lease. Upon initial recognition, the leased asset is measured at an amount equal to the lower of its fair value and present value of minimum lease payments. Subsequent to initial recognition, the asset is accounted for in accordance with the accounting policy applicable to similar owned asset. Outstanding obligations under the lease less finance cost allocated to future periods are shown as a liability.
Finance cost under lease agreements are allocated to the periods during the lease term so as to produce a constant periodic rate of finance cost on the remaining balance of principal liability for each period.
For the year ended December 31, 2016
notes to the ConsolidatedfinanCial statements(Amounts in thousand)
Annual Report 2016 131

Leased assets are depreciated over the shorter of the lease term and their useful lives unless it is reasonably certain that the Group will obtain ownership by the end of the lease term.
Operating lease / Ijarah arrangements in which a significant portion of the risks and rewards of ownership are retained by the lessor are classified as operating leases / Ijarah arrangements. Rentals due under operating lease / Ijarah arrangements are recognised in the consolidated profit and loss account. Any initial direct costs incurred for the lease are amortised over the term of the lease.
3.4.3 dredging expenditure
Dredging expenditure is categorised into capital dredging and major maintenance dredging. Capital dredging is expenditure, which creates new harbour and deepens or extends the basin in front of jetty in order to allow access to larger ships. This expenditure is capitalised and is being depreciated over a period of 15 years.
Major maintenance dredging is expenditure incurred to restore the depth to its previous condition. The management estimates that maintenance dredging has an average service potential of 5 years. Maintenance dredging is regarded as a separate component and is capitalised and depreciated over a period of 5 years on straight line basis.
3.5 Capital spares
Spare parts and servicing equipment are classified as property, plant and equipment rather than stores, spares and loose tools when they meet the definition of property, plant and equipment. Upon utilisation, the capital spares and servicing equipment are depreciated over their useful life, or the remaining life of principal asset, whichever is lower.
3.6 Biological assets
Livestock are measured at their fair value less estimated point-of-sale costs. Fair value of livestock is determined by an independent valuer on the basis of best available estimate for livestock of similar attributes. Milk is initially measured at its fair value less estimated point-of-sale costs at the time of milking. The fair value of milk is determined based on market prices in the local area.
Gains or losses arising from changes in fair value less estimated point-of-sale costs of livestock and milk are recognised in the consolidated profit and loss account.
Crops in the ground and at the point of harvest at reporting date are measured at cost being an approximation of fair value, as these are presently being used as internal consumption for cattle feed and have a very short biological transformation and consumption cycle.
3.7 intangible assets
Intangible assets are recognised when it is probable that the expected future economic benefits will
flow to the Group and the cost of the assets can be measured reliably. Cost of the intangible assets includes purchase cost and directly attributable expenses incidental to make the asset available for use in the manner as intended by management.
For the year ended December 31, 2016
notes to the ConsolidatedfinanCial statements(Amounts in thousand)
132 Dawood Hercules Corporation Limited

a) goodwill
Goodwill represents the difference between the consideration paid for acquiring interests in a company and the value of the Group’s share of its net assets at the date of acquisition.
b) Brands
These are stated at cost less impairment, if any. Carrying amounts of these intangibles are subject to impairment review at each reporting date and where conditions exist, impairment is recognised.
The useful lives of intangible assets are reviewed at each reporting date to determine whether events and circumstances continue to support an indefinite useful life assessment for the asset.
c) Computer software and licenses
Costs associated with maintaining computer software programmes are recognised as an expense when incurred. However, costs that are directly attributable to identifiable software and have probable economic benefits exceeding the cost beyond one year, are recognised as an intangible asset. Direct costs include the purchase cost of software (license fee), related overhead cost and directly attributable expenses incidental to make the asset available for use in the manner as intended by management..
Expenditure which enhances or extends the performance of computer software beyond its original specification and useful life is recognised as a capital improvement and added to the original cost of the software.
Computer Softwares are stated at cost less accumulated amortisation and accumulated impairment losses, It is charged over the estimated useful life of the asset on a systematic basis by applying the straight line method.
Useful life of intangible assets is reviewed, at each reporting date and adjusted if the impact of amortisation is significant.
d) rights for future gas utilisation
Rights for future gas utilisation represents premium paid to the Government of Pakistan for allocation of 100 MMCFD natural gas for a period of 20 years for EFert’s Enven Plant Network. The rights are being amortized from the date of commercial production on a straight-line basis over the remaining allocation period.
3.8 Impairmentofnon-financialassets
“Assets that are subject to depreciation / amortisation are reviewed at each reporting date to identify circumstances indicating occurrence of impairment loss or reversal of previous impairment losses. An impairment loss is recognised for the amount by which the asset’s carrying amount exceeds its recoverable amount. The recoverable amount is the higher of an asset’s fair value less cost to sale and value in use. Reversal of impairment loss is restricted to the original cost of the asset.
Goodwill is measured as described in note 3.7. Goodwill on acquisitions of subsidiaries is included in intangible assets. Goodwill is not amortised but it is tested for impairment annually, or more frequently if events or changes in circumstances indicate that it might be impaired, and is carried at cost less
For the year ended December 31, 2016
notes to the ConsolidatedfinanCial statements(Amounts in thousand)
Annual Report 2016 133
accumulated impairment losses. Assets are grouped at the lowest levels for which there are separately identifiable cash inflows which are largely independent of the cash inflows from other assets or groups of assets (cash-generating units). Goodwill is allocated to cash-generating units for the purpose of impairment testing. The allocation is made to those cash-generating units or groups of cash-generating units that are expected to benefit from the business combination in which the goodwill arose.
3.9 investments in Joint ventures
The Group’s interest in jointly controlled entity is accounted for in the financial statements using the equity method.
3.10 Investmentsinassociates
Associates are all entities over which the Group has significant influence but not control. Investment in associates are accounted for using the equity method of accounting. Under the equity method, the investment is initially recognised at cost and the carrying amount is increased or decreased to recognise the investors share of profit or loss of the investee after the date of acquisition. The Group’s investment in associate includes goodwill identified on acquisition. The Group determines at each reporting date whether there is any objective evidence that the investment in associate is impaired. If this is the case, the Group calculates the impairment loss as the difference between the recoverable amount of associates and its carrying value and recognises it in the profit and loss account.
3.11 other investments
Other investments are carried at cost. At subsequent reporting dates, the recoverable amounts are estimated to determine the extent of impairment losses, if any, and carrying amounts are adjusted accordingly.
3.12 non current assets (or disposal groups) held-for-sale
Non-current assets (or disposal groups) are classified as assets held for sale when their carrying amount is to be recovered principally through a sale transaction rather than continuing use and a sale is considered highly probable. They are stated at the lower of carrying amount and fair value less costs to sell. Impairment losses on initial classification as held for sale and subsequent gains or losses on remeasurement are recognised in consolidated profit and loss account.
3.13 financial instruments
3.13.1 financial assets
The Group classifies its financial assets in the following categories: at fair value through profit or loss, held to maturity, loans and receivables, and available-for-sale. The classification depends on the purpose for which the financial assets were acquired. Management determines the classification of its financial assets at initial recognition. a) Atfairvaluethroughprofitorloss
Financial assets at fair value through profit or loss are financial assets held for trading. A financial
For the year ended December 31, 2016
notes to the ConsolidatedfinanCial statements(Amounts in thousand)
134 Dawood Hercules Corporation Limited

asset is classified in this category if acquired principally for the purpose of selling in the short-term. Derivatives are also categorised as held for trading unless they are designated as hedges. Assets in this category are classified as current assets if expected to be settled within 12 months, otherwise, these are classified as non-current.
b) loans and receivables
Loans and receivables are non-derivative financial assets with fixed or determinable payments that are not quoted in an active market. They are included in current assets, except for maturities greater than 12 months after the end of the reporting period, which are classified as non-current assets. Loans and receivables with maturity period of less than twelve months after the reporting date are classified as advances, deposits and prepayments and other receivables in the balance sheet.
c) held to maturity
Held to maturity financial assets are non-derivative financial assets with fixed or determinable payments and fixed maturity with a positive intention and ability to hold to maturity.
d) Available-for-salefinancialassets
Available-for-sale financial assets are non-derivatives that are either designated in this category or not classified in any of the other categories. They are included in non-current assets unless the investment matures or management intends to dispose it off within 12 months of the end of the reporting date.
Regular purchases and sales of financial assets are recognised on the trade date - the date on which
the Group commits to purchase or sell the asset. Investments are initially recognised at fair value plus transaction costs except for financial assets carried at fair value through profit or loss. Financial assets carried at fair value through profit or loss are initially recognised at fair value, and transaction costs are expensed in the consolidated profit and loss account. Financial assets are derecognised when the rights to receive cash flows from the investments have expired or have been transferred and the Group has transferred substantially all risks and rewards of ownership. Available-for-sale financial assets and financial assets at fair value through profit or loss are subsequently carried at fair value. Held to maturity and loans and receivables are subsequently carried at amortized cost using the effective interest method.
Gains or losses arising from changes in the fair value of the ‘financial assets at fair value through profit or loss’ category are presented in the consolidated profit and loss account within ‘other operating income / expenses’ in the period in which they arise. Dividend income from financial assets at fair value through profit or loss is recognised in the profit and loss account as part of other income when the Group’s right to receive payments is established.
Changes in fair value of monetary and non-monetary securities classified as available-for-sale are recognised in other comprehensive income. When securities classified as available-for-sale are sold or impaired, the accumulated fair value adjustments recognised in consolidated statement of comprehensive income are included in the consolidated profit and loss account.
Interest on available-for-sale securities calculated using the effective interest method is recognised
in the consolidated profit and loss account as part of other income. Dividends on available for
For the year ended December 31, 2016
notes to the ConsolidatedfinanCial statements(Amounts in thousand)
Annual Report 2016 135

sale equity instruments are recognised in the consolidated profit and loss account as part of other income when the Group’s right to receive payments is established.
The Group assesses at the end of each reporting period whether there is objective evidence that a financial asset or a group of financial assets is impaired. If any such evidence exists for available-for-sale financial assets, the cumulative loss is removed from equity and recognised in the consolidated profit and loss account. Impairment losses recognised in the consolidated profit and loss account on equity instruments are not reversed through the consolidated profit and loss account. Impairment testing of trade debts and other receivables is described in (note 3.17).
Financial assets are derecognised when the rights to receive cash flows from the assets have expired or have been transferred and the Group has transferred substantially all the risks and rewards of ownership.
3.13.2 financial liabilities
Financial liabilities are recognised at the time when the Group becomes a party to the contractual provisions of the instrument. All financial liabilities are recognised initially at fair value less directly attributable transactions costs, if any, and subsequently measured at amortized cost using effective interest rate method.
A financial liability is derecognised when the obligation under the liability is discharged or cancelled or expired. Where an existing financial liability is replaced by another from the same lender on substantially different terms, or the terms of an existing liability are substantially modified, such an exchange or modification is treated as a derecognition of the original liability and the recognition of a new liability, and the difference in respective carrying amounts is recognised in the consolidated profit and loss account.
3.13.3 Offsettingoffinancialassetsandliabilities
A financial asset and a financial liability are off set and the net amount is reported in the consolidated balance sheet if the Group has a legally enforceable right to set-off the recognised amounts and intends either to settle on a net basis or to realize the asset and settle the liability simultaneously. The legally enforceable right must not be contingent on future events and must be enforceable in the normal course of business and in the event of default, insolvency or bankruptcy of the Group or the counter party.
3.14 Derivativefinancialinstrumentsandhedgingactivities
Derivatives are recognised initially at fair value on the date a derivative contract is entered into; attributable transaction cost are recognised in consolidated profit and loss account when incurred. Subsequent to initial recognition, derivatives are measured at fair values, and changes therein are accounted for as described below:
a) fair value hedges Changes in the fair value of derivatives that are designated and qualify as fair value hedges are
recorded in the consolidated profit and loss account, together with any changes in the fair value of the hedged asset or liability that are attributable to the hedged risk.
For the year ended December 31, 2016
notes to the ConsolidatedfinanCial statements(Amounts in thousand)
136 Dawood Hercules Corporation Limited
b) Cashflowhedges
Changes in fair value of derivative hedging instrument designated as a cash flow hedge are recognised directly in equity to the extent that the hedge is effective. To the extent the hedge is ineffective, changes in fair value are recognised in consolidated profit and loss account.
If the hedging instrument no longer meets the criteria for hedge accounting, expires or is sold, terminated or exercised, the hedge accounting is discontinued prospectively. The cumulative gain or loss previously recognised in equity remains there until the forecast transaction occurs. When the hedged item is a non-financial asset, the amount recognised in equity is transferred to the carrying amount of the asset when it is recognised. In other cases the amount recognised in equity is transferred to consolidated profit and loss account in the same period that the hedge item affects consolidated profit and loss account.
c) other non-trading derivatives
When a derivative financial instrument is not held for trading, and is not designated in a qualifying hedge relationship, all changes in its fair value are recognised immediately in consolidated profit and loss account.
d) embedded derivatives
Fair value of derivatives embedded in financial instruments or non-derivative host contracts are separated from the host contract if the risks and economic characteristics of the embedded derivative are not closely related to those of the host contracts and the host contracts are not measured at fair value through profit or loss.
If the fair value of an embedded derivative that is required to be separated cannot be reliably measured, the entire combined contract is measured at fair value through profit or loss.
The Group holds derivative financial instruments to hedge its foreign currency and interest rate risk exposure.
3.15 stores, spares and loose tools
These are valued at weighted average cost except for items in transit which are stated at invoice value plus other charges paid thereon till the consolidated reporting date. For items which are slow moving and / or identified as surplus to the Group’s requirements, adequate provision is made for any excess book value over estimated realizable value. The Group reviews the carrying amount of stores and spares on a regular basis and provision is made for obsolescence, if any.
3.16 stock-in-trade
These are valued at the lower of cost and net realizable value. Cost is determined using weighted average method except for raw material and certain purchased products in transit which are stated at cost (invoice value) plus other charges incurred thereon till the consolidated reporting date. Cost in relation to finished goods includes applicable purchase cost and manufacturing expenses. The cost of work in process includes material and proportionate conversion costs.
For the year ended December 31, 2016
notes to the ConsolidatedfinanCial statements(Amounts in thousand)
Annual Report 2016 137

Net realizable value signifies the estimated selling price in the ordinary course of business less all estimated costs of completion and costs necessarily to be incurred in order to make the sales.
3.17 trade debts and other receivables
These are recognised initially at fair value plus directly attributable transaction costs, if any and subsequently measured at amortized cost using effective interest rate method less provision for impairment, if any. A provision for impairment is established if there is objective evidence that the Group will not be able to collect all amounts due according to the original terms of receivables. The amount of provision is charged to consolidated profit and loss account. Trade debts and other receivables considered irrecoverable are written-off.
Exchange gains and losses arising on translation in respect of trade debts and other receivables in foreign currency are added to the carrying amount of the respective receivables.
3.18 Cash and cash equivalents
Cash and cash equivalents are carried in the balance sheet at cost. Cash and cash equivalents in the consolidated statement of cash flows includes cash in hand and in transit, cheques in hand, balances with banks on current, deposit and saving account, other short term highly liquid investments with original maturities of three months or less and short term borrowings (other than term finance) including running finance and short term finance facilities availed by the Group, which are payable on demand and form an integral part of the Groups’s cash management.
3.19 share capital
Ordinary shares are classified as equity and recognised at their face value. Incremental costs directly attributable to the issue of new shares or options are shown in equity as a deduction, net of tax, from the proceeds.
3.20 Employees’shareoptionscheme
The grant date fair value of equity settled share based payment to employees is initially recognised in the consolidated balance sheet as deferred employee compensation expense with a consequent credit to equity as employee share option compensation reserve.
The fair value determined at the grant date of the equity settled share based payments is recognised as an employee compensation expense on a straight line basis over the vesting period.
When an unvested option lapses by virtue of an employee not conforming to the vesting conditions after recognition of an employee compensation expense in the consolidated profit and loss account, such employee compensation expense is reversed in the consolidated profit and loss account equal to the amortized portion with a corresponding effect to employee share option compensation reserve in the consolidated balance sheet.
When a vested option lapses on expiry of the exercise period, employee compensation expense already recognised in the consolidated profit and loss account is reversed with a corresponding reduction to employee share option compensation reserve in the consolidated balance sheet.
For the year ended December 31, 2016
notes to the ConsolidatedfinanCial statements(Amounts in thousand)
138 Dawood Hercules Corporation Limited

When options are exercised, employee share option compensation reserve relating to these options is transferred to share capital and share premium account. An amount equivalent to the face value of related shares is transferred to share capital. Any amount over and above the share capital is transferred to share premium account.
3.21 Borrowings
Borrowings are recognised initially at fair value, net of transaction costs incurred. Borrowings are subsequently carried at amortized cost; any difference between the proceeds (net of transaction costs) and the redemption value is recognised in the consolidated profit and loss account over the period of the borrowings using the effective interest method.
Borrowings are classified as current liabilities unless the Group has an unconditional right to defer settlement of the liability for at least 12 months after the reporting date.
Exchange gains and losses arising in respect of borrowings in foreign currency are added to the carrying amount of the borrowing.
3.22 trade and other payables
Trade and other payables are recognised initially at fair value and subsequently measured at amortized cost using the effective interest method.
These are classified as current liabilities if payment is due within one year or less (or in the normal operating cycle of the business if longer). If not, they are presented as non-current liability.
Exchange gains and losses arising in respect of liabilities in foreign currency are added to the carrying amount of the respective liabilities.
3.23 operating lease
Lease arrangements in which a significant portion of the risks and rewards of ownership are retained by the lessor are classified as operating lease arrangements. Rentals due under operating lease arrangements are recognised in the profit and loss account.
3.24 Provisions
Provisions are recognised when the Group has a legal or constructive obligation as a result of past events and it is probable that outflow of economic benefits will be required to settle the obligation and a reliable estimate of the amount can be made. Provisions are reviewed at each reporting date and adjusted to reflect current best estimate.
3.25 dividend
Dividend distribution to the Company’s shareholders is recognised as a liability in the period in which dividend is approved by the shareholders in case of final dividend, and in case of interim dividend on the date of commencement of the book closure period.
For the year ended December 31, 2016
notes to the ConsolidatedfinanCial statements(Amounts in thousand)
Annual Report 2016 139

3.26 income tax
The tax expense for the year comprises current and deferred tax. Tax is recognised in the consolidated profit and loss account, except to the extent that it relates to items recognised in other comprehensive income or directly in equity. In which case, the tax is also recognised in other comprehensive income or directly in equity.
3.26.1 Current tax
Provision for current taxation is based on the taxable income for the year calculated on the basis of the tax laws enacted or substantively enacted at the reporting date, and any adjustment to tax payable in respect of previous years.
3.26.2 deferred tax
Deferred tax is recognised using the balance sheet method, providing for all temporary differences between the carrying amounts of assets and liabilities for financial reporting purposes and the amounts used for taxation purposes. Deferred tax is measured at the tax rates that are expected to be applied to the temporary differences when they reverse, based on the laws that have been enacted or substantively enacted by the reporting date.
A deferred tax asset is recognised to the extent that is probable that future taxable profits will be available against which temporary difference can be utilized. Deferred tax assets are reviewed at each reporting date and are reduced to the extent that it is no longer probable that the related tax benefit will be realized.
3.27 Retirementandotherservicebenefits
3.27.1 Definedcontributionplans
A defined contribution plan is a post - employment benefit plan under which a Group pays fixed contribution into a separate entity and will have no legal or constructive obligation to pay further amounts. Obligations for contributions to defined contribution plans are recognised as an employee benefit expense in the consolidated profit and loss account when they are due. Prepaid contributions are recognised as an asset to the extent that a cash refund or a reduction in future payments is available.
the group operates: - defined contribution provident funds for its permanent employees. Monthly contributions are made
both by the Group and employees to the fund at the rate of 10% to 15% of basic salary;
- defined contribution pension funds for the benefit of management employees. Monthly contributions are made by the Group to the fund at the rate ranging from 12.5% to 13.75% of basic salary; and
- defined contribution gratuity funds for the benefit of management employees. Monthly contributions are made by the Group to the fund at the rate of 8.33% of basic salary.
For the year ended December 31, 2016
notes to the ConsolidatedfinanCial statements(Amounts in thousand)
140 Dawood Hercules Corporation Limited

3.27.2 Definedbenefitplans
A defined benefit plan is a post-employment benefit plan other than the defined contribution plan. The Group’s net obligation in respect of defined benefit plans is calculated by estimating the amount of future benefit that employees have earned in return for their service in current and prior periods; that benefit is discounted to determine its present value. The calculation is performed annually by a qualified actuary using the Projected Unit Credit method.
Remeasurements (actuarial gains / losses) in respect of defined benefit plan are recognised directly in equity through other comprehensive income.
Contributions require assumptions to be made of future outcomes which mainly includes increase in remuneration, expected long-term return on plan assets and the discount rate used to convert future cash flows to current values. Calculations are sensitive to changes in the underlying assumptions.
The Group operates defined benefit funded gratuity schemes for its management employees and non-management employees of EFert.
The Group also operates defined benefit funded pension scheme for EFert’s management employees; the pension scheme provides life time pension to retired employees or to their spouses. Contributions are made annually to these funds on the basis of actuarial recommendations. The pension scheme has been curtailed and effective from July 1, 2005, no new members are inducted in this scheme. Actuarial gains on curtailment are recognised immediately once the certainty of recovery is established.
Annual provision is also made under a service incentive plan for certain category of experienced employees to continue in the Group’s employment.
3.27.3 Employees’compensatedabsences
The Group accounts for compensated absences on the basis of unavailed leave balance of each employee at the end of the year.
3.27.4 Otherbenefits-ServiceIncentivePlan
Provision is made under a service incentive plan for certain category of experienced employees to continue in the Group’s employment. The provision is made on the basis of management’s estimates of incentives to be paid to employees on fulfillment of criteria given in the incentive plan.
3.28 foreign currency transactions and translation
3.28.1 These consolidated financial statements are presented in Pakistan Rupees, which is the Group’s functional currency. Foreign currency transactions are translated into the functional currency using the exchange rates prevailing at the dates of the transactions. Foreign exchange gains and losses resulting from the settlement of such transactions and from the translation at year-end exchange rates of monetary assets and liabilities denominated in foreign currencies are recognised in the consolidated profit and loss account.
3.28.2 The results and financial position of all the Group entities (none of which has the currency of a hyper-
For the year ended December 31, 2016
notes to the ConsolidatedfinanCial statements(Amounts in thousand)
Annual Report 2016 141

inflationary economy) that have a functional currency different from the presentation currency are translated into the presentation currency as follows: - assets and liabilities for each balance sheet presented are translated at the closing rate at the date
of that balance sheet;
- income and expenses for each consolidated profit and loss account item are translated at average exchange rates (unless this average is not a reasonable approximation of the cumulative effect of the rates prevailing on the transaction dates, in which case income and expenses are translated at the rate on the dates of the transactions); and
- all resulting exchange differences are recognised as a separate component of equity.
3.29 Contingent liabilities
Contingent liabilities are disclosed when: - there is a possible obligation that arises from past events and whose existence will be confirmed
only by the occurrence or non occurrence of one or more uncertain future events not wholly within the control of the Group; or
- there is a present obligation that arises from past events but it is not probable that an outflow of resources embodying economic benefits will be required to settle the obligation or the amount of the obligation cannot be measured reliably.
3.30 Revenuerecognition
Revenue is recognised to the extent that it is probable that the economic benefits will flow to the Group and the amount of revenue can be measured reliably. Revenue is measured at the fair value of the consideration received or receivable. Revenue is recognised on the following basis: - Sales revenue is recognised when products are dispatched to customers or services are
rendered.
- Income on deposits and other financial assets is recognised on accrual basis
- Commission income is recognised on an accrual basis in accordance with the substance of the relevant agreement.
- Interest income on delayed payment income on overdue trade receivables is recognised on accrual basis.
- service revenue is recognised on the basis of delivery of services.
- Revenue from construction activities, if the outcome of such activity can be reliably measured, is recognised by reference to stage of completion of the activity at year end (the percentage completion method). In applying the percentage completion method, revenue recognised corresponds to the total contract revenue multiplied by the actual completion rate based on the proportion of total contract costs incurred to date and the estimated costs to complete.
For the year ended December 31, 2016
notes to the ConsolidatedfinanCial statements(Amounts in thousand)
142 Dawood Hercules Corporation Limited

- Dividend income is recognised when the Company’s right to receive dividend is established.
- Fee from O&M projects is recognised on accrual basis under the terms of O&M agreements. Recoveries against reimbursable expenses are adjusted against the related expenses and net amount is recognised in the profit and loss account as other income.
- Revenue from sale of electricity is recognised as follows:
- Capacity revenue based on the capacity made available to National Transmission and Dispatch Company Limited (NTDC); and
- Energy revenue based on the Net Electrical Output (NEO) delivered.
- Revenue from consultancy services is recognised at the time the services are rendered.
- Revenue from re-gasification and transportation of Liquefied Natural Gas (LNG) to Sui Southern Gas Company Limited (SSGCL) is recognised on the following basis:
- Capacity and flexibility revenue on the basis of capacity made available to SSGCL.
- utilisation revenue on the basis of Regasified Liquefied Natural Gas (RLNG) throughput to SSGCL.
- Revenue generated from the provision of LNG carrier services of Floating, Storage and Re-gassification Unit (FSRU) is recognised on accrual basis.
- Royalty income from associates is recognised on accrual basis in accordance with the agreements entered therewith.
3.31 Borrowing costs
Borrowing costs are recognised as an expense in the period in which they are incurred except where such costs are directly attributable to the acquisition, construction or production of a qualifying asset in which such costs are capitalised as part of the cost of that asset. Borrowing costs includes exchange differences arising from foreign currency borrowings to the extent these are regarded as an adjustment to borrowing costs and net gain / loss on the settlement of derivatives hedging instruments.
3.32 research and development costs
Research and development costs are charged to income as and when incurred, except for certain development costs which are recognised as intangible assets when it is probable that, the developed project will be a success and certain criteria, including commercial and technical feasibility have been met.
3.33 government grant
Government grant that compensates the Group for expenses incurred is recognised in the consolidated profit and loss account on a systematic basis in the same period in which the expenses are recognised. Government grants are deducted in reporting the related expenses.
For the year ended December 31, 2016
notes to the ConsolidatedfinanCial statements(Amounts in thousand)
Annual Report 2016 143

3.34 earnings per share
The Group presents basic and diluted earnings per share (EPS) data for its ordinary shares. Basic EPS is calculated by dividing the profit or loss attributable to ordinary shareholders of the Holding Company by the weighted average number of ordinary shares outstanding during the year. Diluted EPS is determined by adjusting the profit or loss attributable to ordinary shareholders and the weighted average number of ordinary shares outstanding for the effects of all dilutive potential ordinary shares.
3.35 transactions with related parties
Sales, purchases and other transactions with related parties are carried out on commercial terms and conditions agreed between the parties.
3.36 dividend and appropriation to reserves
Dividends and appropriations to reserves are recognised in the period in which these are approved.
3.37 segment reporting
Operating segments are reported in a manner consistent with the internal reporting provided to the chief operating decision-maker. The chief operating decision-maker, who is responsible for allocating resources and assessing performance of the operating segments, has been identified as the Board of Directors of the Holding Company that makes strategic decisions.
4. signifiCant aCCounting estimates and Judgements
The preparation of financial statements in conformity with approved accounting standards requires the use of certain significant accounting estimates. It also requires management to exercise its judgment in the process of applying the Group’s accounting policies. Estimates and judgments are continually evaluated and are based on historical experience and other factors, including expectations of future events that are believed to be reasonable under the circumstances. The estimates and assumptions that have a significant risk of carrying material adjustment to the carrying amounts of assets and liabilities within the next financial year are as follows: a) Property, plant and equipment and intangibles
The Group reviews appropriateness of the rate of depreciation / amortisation, useful life, residual
value used in the calculation of depreciation/amortization. Further where applicable, an estimate of recoverable amount of assets is made for possible impairment on an annual basis.
b) Investmentsatfairvaluethroughprofitorloss
The Group determines fair value of certain investments by using quotations from active market and conditions and information about the financial instruments. These estimates are subjective in nature and involve some uncertainties and matters of judgment.
For the year ended December 31, 2016
notes to the ConsolidatedfinanCial statements(Amounts in thousand)
144 Dawood Hercules Corporation Limited

c) derivatives
The Group reviews the changes in fair values of the derivative hedging financial instruments at each reporting date based on the valuations received from the contracting banks. These valuations represent estimated fluctuations in the relevant currencies / interest rates over the reporting period and other relevant variables signifying currency and interest rate risks.
d) stock-in-trade
The Group reviews the net realizable value of stock-in-trade to assess any diminution in the respective carrying values. Net realizable value is determined with reference to estimated selling price less estimated expenditures to make the sales.
e) impairment of goodwill
The Group reviews the recoverable amount of cash generating units for testing of impairment of goodwill annually, or more frequently if events or changes in circumstances indicate that it might be impaired, and is carried at cost less accumulated impairment losses, if any.
f) income taxes
In making the estimates for current income taxes payable by the Group, the management considers the applicable laws and the decisions / judgments of appellate authorities on certain issues in the past. Accordingly, the recognition of deferred tax is also made taking into account these judgments and the best estimates of future results of operations of the Group.
g) Provisionforretirementandotherservicebenefitsobligations
The present value of these obligations depend on a number of factors that are determined on actuarial basis using a number of assumptions. Any changes in these assumptions will impact the carrying amount of these obligations.
h) Impairmentoffinancialassets
In making an estimate of future cash flows from the Group’s financial assets including investment in joint ventures and associates, the management considers future dividend stream and an estimate of the terminal value of these investments. In making an estimate of impairment, investments are considered to be impaired if there is a significant or prolonged decline in the recoverable amount and carrying value of investments.
i) Construction revenue and cost
Construction revenue is recognised using the percentage completion method. This is determined with reference to the stage of completion of project which is based on the proportion of contract costs incurred to date and the estimated costs to complete the project.
For the year ended December 31, 2016
notes to the ConsolidatedfinanCial statements(Amounts in thousand)
Annual Report 2016 145

j) Provisions Provisions are based on management’s best estimates. Any change in the estimates in future years
might effect the carrying amounts of the provisions with a corresponding affect on the profit and loss account of the Group.
k) Contingencies and commitments
The Group uses assumptions and estimates in disclosure and assessment of provision for contingencies as disclosed in note 28.
l) fair value of investment in associates
Certain estimates have been used to determine the fair value of investment in associate (previously subsidiary) upon loss of control, as disclosed in note 8.6.
m) Consolidation of entities in which the Company holds less than half of the voting rights
Management considers that the Company has control over ECL even though it has less than 50% of the voting rights. The pattern of shareholding of ECL shows that the Company is the single largest shareholder having shareholding of 37.22% with remaining widely dispersed shareholding pattern, which enables the Company to exercise control over ECL.
2016 2015-------------Rupees-------------
5. PROPERTY, PLANT AND EQUIPMENT
Operating assets, at net book value (note 5.1) 106,365,681 123,743,680 “Capital work in progress - Expansion and other projects (note 5.5)” 23,819,084 3,708,782 Capital spares and standby equipments 1,349,490 1,082,062
131,534,255 128,534,524
For the year ended December 31, 2016
notes to the ConsolidatedfinanCial statements(Amounts in thousand)
146 Dawood Hercules Corporation Limited

5.1Op
erati
ng as
sets
Land
Build
ing
Leas
e ho
ld im
prove
ment
Pipelin
esPla
nt an
d mac
hinery
Catal
yst
Furni
ture fi
xture
and e
quipm
ents
Vehic
lesDa
ta
proce
ssing
eq
uipme
ntJe
ttyCa
pital
dredg
ingTo
talFre
ehold
Leas
ehold
Freeh
oldLe
aseh
oldOw
ned
Leas
edOw
ned
Leas
edOw
ned
Leas
ed
------
------
------
------
------
------
------
------
------
------
------
------
------
------
------
------
------
------
------
------
------
------
------
------
------
-- Ru
pees
-----
------
------
------
------
------
------
------
------
------
------
------
------
------
------
------
------
------
------
------
------
------
------
------
------
------
-----
As at
Janu
ary 1
, 201
5Co
st 70
8,550
61
2,069
9,
092,1
90
1,82
7,473
10
,406
2,90
3,160
15
0,253
,473
12,74
1 2,
263,4
49
1,89
2,214
21
,723
1,58
8,978
38
,446
64,51
6 -
- 17
1,289
,388
Accu
mulat
ed de
precia
tion
- (1
05,66
7) (2
,053,3
27)
(528
,684)
(88)
(493
,638)
(39,59
6,911
) (1
2,741
) (1
,672,9
83)
(1,26
3,791
) (2
1,002
) (8
72,36
0) (3
8,446
) (5
4,992
) -
- (46
,714,6
30)
Accu
mulat
ed im
pairm
ent
- -
(7,00
1) -
- -
(58,4
90)
- -
- -
- -
- -
- (6
5,491
)Ne
t boo
k valu
e 70
8,550
50
6,402
7,
031,8
62
1,29
8,789
10
,318
2,40
9,522
11
0,598
,072
- 59
0,466
62
8,423
72
1 71
6,618
-
9,52
4 -
- 12
4,509
,267
Year
ende
d Dec
embe
r 31,
2015
Open
ing ne
t boo
k valu
e 70
8,550
50
6,402
7,
031,8
62
1,29
8,789
10
,318
2,40
9,522
11
0,598
,072
- 59
0,466
62
8,423
72
1 71
6,618
-
9,52
4 -
- 12
4,509
,267
Amort
izatio
n of re
valua
tion s
urplus
- (2
,572)
- (1
,140)
- 3,
355
(33,6
49)
- -
- -
- -
- -
- (3
4,006
)
Addit
ions i
nclud
ing tra
nsfer
s (n
ote 5
.5) 1,
108
141,2
95
184,4
50
5,54
9 11
,298
- 4,
654,3
44
- -
325,4
19
- 23
2,171
-
10,84
7 5,
304,5
92
2,63
8,673
13
,509,7
46
Capit
alizati
on of
exch
ange
gain
by S
ubsid
iary C
ompa
ny
(no
te 5.1
.1) -
- -
- -
- 36
4,019
-
- -
- -
- -
- -
364,0
19
Adjus
tmen
ts / r
eclas
sifica
tions
Cost
2,48
8 -
- -
- -
(79,6
06)
- -
352
- -
- -
- -
(76,7
66)
Accu
mulat
ed de
precia
tion
- -
- -
- -
5,72
7 -
- -
- -
- -
- -
5,72
7 2,
488
- -
- -
- (7
3,879
) -
- 35
2 -
- -
- -
- (7
1,039
)Ad
justm
ents
-
Dispo
sals
/ Write
offs (
note
5.4)
Cost
- -
(13,9
48)
- -
- (1
26,56
1) -
- (7
8,529
) -
(283
,291)
(46)
(113
) -
- (5
02,48
8)Ac
cumu
lated
depre
ciatio
n -
- 6,
493
- -
- 37
,899
- -
52,81
5 -
193,8
76
46
33
- -
291,1
62
Accu
mulat
ed im
pairm
ent
- -
7,00
1 -
- -
1,73
6 -
- -
- -
- -
- -
8,73
7 -
- (4
54)
- -
- (8
6,926
) -
- (2
5,714
) -
(89,4
15)
- (8
0) -
- (2
02,58
9)
Depre
ciatio
n cha
rge (n
ote 5.
2) -
(15,2
17)
(445
,542)
(81,0
69)
(1,13
5) (9
7,109
) (7
,863,1
40)
- (2
17,59
7) (2
79,31
4) -
(222
,692)
- (5
,249)
(174
,568)
(146
,593)
(9,54
9,225
)
Impa
irmen
t (note
5.3)
- (1
34,92
1)-
(642
,779)
- -
(2,51
3,546
) -
- (8
8,342
) -
(915
) -
- -
- (3
,380,5
03)
Disco
ntinu
ed op
eratio
ns -
(227
,941)
- (1
1,498
) -
- (1
,045,8
36)
- (9
3,280
) (9
,723)
- (9
,883)
- (3
,829)
- -
(1,40
1,990
)
Net b
ook v
alue
712,1
46
267,0
46
6,77
0,316
56
7,852
20
,481
2,31
5,768
10
3,999
,459
- 27
9,589
55
1,101
72
1 62
5,884
-
11,21
3 5,
130,0
24
2,49
2,080
12
3,743
,680
As at
Dec
embe
r 31,
2015
Cost
712,1
46
522,8
51
9,26
2,692
1,
727,3
55
21,70
4 2,
906,5
15
151,3
02,22
7 12
,741
1,96
0,174
2,
080,4
33
21,72
3 1,
449,1
54
38,40
0 25
,944
5,30
4,592
2,
638,6
73
179,9
87,32
4
Accu
mulat
ed de
precia
tion
- (1
20,88
4) (2
,492,3
76)
(516
,724)
(1,22
3) (5
90,74
7) (4
4,732
,468)
(12,7
41)
(1,68
0,585
) (1
,440,9
90)
(21,0
02)
(822
,355)
(38,4
00)
(14,7
31)
(174
,568)
(146
,593)
(52,8
06,38
7)
Accu
mulat
ed im
pairm
ent
- (1
34,92
1) -
(642
,779)
- -
(2,57
0,300
) -
- (8
8,342
) -
(915
) -
- -
- (3
,437,2
57)
Net b
ook v
alue
712,1
46
267,0
46
6,77
0,316
56
7,852
20
,481
2,31
5,768
10
3,999
,459
- 27
9,589
55
1,101
72
1 62
5,884
-
11,21
3 5,
130,0
24
2,49
2,080
12
3,743
,680
(Amou
nts in
thou
sand
)
For t
he y
ear e
nded
Dec
embe
r 31,
201
6
note
s to
the
Co
nso
lida
ted
fina
nCia
l st
atem
ents
Annual Report 2016 147

5.1Op
erati
ng as
sets
- con
tinue
d
Land
Build
ing
Leas
e ho
ld im
prove
ment
Pipelin
esPla
nt an
d mac
hinery
Catal
yst
Furni
ture fi
xture
and e
quipm
ents
Vehic
lesDa
ta
proce
ssing
eq
uipme
ntJe
ttyCa
pital
dredg
ingTo
talFre
ehold
Leas
ehold
Freeh
oldLe
aseh
oldOw
ned
Leas
edOw
ned
Leas
edOw
ned
Leas
ed---
------
------
------
------
------
------
------
------
------
------
------
------
------
------
------
------
------
------
------
------
------
------
------
------
-----
Rupe
es --
------
------
------
------
------
------
------
------
------
------
------
------
------
------
------
------
------
------
------
------
------
------
------
------
------
------
--Ye
ar en
ded D
ecem
ber 3
1, 20
16Op
ening
net b
ook v
alue
712,1
46
267,0
46
6,77
0,316
56
7,852
20
,481
2,31
5,768
10
3,999
,459
- 27
9,589
55
1,101
72
1 62
5,884
-
11,21
3 5,
130,0
24
2,49
2,080
12
3,743
,680
Amort
izatio
n of
rev
aluati
on su
rplus
- (2
,572)
- (1
,140)
- 3,
355
(33,6
49)
- -
- -
- -
- -
- (3
4,006
)
Addit
ions i
nclud
ing tra
nsfer
s (n
ote 5
.5) -
39
304,4
71
35
274
- 3,
400,4
20
- 24
8,848
35
4,317
-
330,5
68
- 3,
050
- 22
5,476
4,
867,4
98
Trans
fer to
capit
al sp
ares
- -
- -
- -
(491
,037)
- -
- -
- -
- -
- (4
91,03
7)
Capit
alizati
on of
exch
ange
loss
b
y Sub
sidiar
y Com
pany
(
note
5.1.1)
- -
- -
- -
(2,56
6) -
- -
- -
- -
- -
(2,56
6)
Adjus
tmen
ts / r
eclas
sifica
tions
Cost
2,48
8 -
- -
- -
(32,5
81)
- -
- -
- -
- -
- (3
0,093
)Ac
cumu
lated
depre
ciatio
n -
- -
- -
- -
- -
- -
- -
- -
- -
2,48
8 -
- -
- (3
2,581
) -
- -
- -
- -
- (3
0,093
)
Dispo
sals
/ Write
offs (
note
5.4)
Cost
- -
(625
) -
- -
(310
,093)
- -
(41,6
29)
- (2
66,70
5) -
(1,15
4) -
- (6
20,20
6)Ac
cumu
lated
depre
ciatio
n -
- 62
5 -
- -
259,1
68
- -
27,78
1 -
207,1
01
- 59
1 -
- 49
5,266
Ac
cumu
lated
impa
irmen
t -
- -
- -
- 7,
758
- -
850
- 53
-
- -
- 8,
661
- -
- -
- -
(43,1
67)
- -
(12,9
98)
- (5
9,551
) -
(563
) -
- (1
16,27
9)
Depre
ciatio
n cha
rge (n
ote 5.
2) -
(16,2
38)
(453
,321)
(45,4
03)
(2,19
5) (9
7,109
) (7
,514,0
86)
- (2
00,58
9) (2
52,60
6) -
(211
,705)
- (6
,024)
(229
,200)
(202
,276)
(9,23
0,752
)
Impa
irmen
t loss
(note
5.3)
- -
- -
- -
(105
,412)
- -
(976
) -
- -
- -
- (1
06,38
8)
Disco
ntinu
ed O
perat
ions (
note
19)
Cost
(408
,580)
- (3
,959,8
17)
- -
- (1
6,656
,897)
(12,7
41)
- (6
19,78
6) -
(762
,388)
(38,4
00)
- -
- (2
2,458
,609)
Accu
mulat
ed de
precia
tion
- -
1,26
6,028
-
- -
7,87
8,696
12
,741
- 45
6,571
-
394,4
97
38,40
0 -
- -
10,04
6,933
Ac
cumu
lated
impa
irmen
t -
- -
- -
- 17
6,312
-
- 12
6 -
862
- -
- -
177,3
00
(408
,580)
- (2
,693,7
89)
- -
- (8
,601,8
89)
- -
(163
,089)
- (3
67,02
9) -
- -
- (1
2,234
,376)
Net b
ook v
alue
306,0
54
248,2
75
3,92
7,677
52
1,344
18
,560
2,22
2,014
90
,575,4
92
- 32
7,848
47
5,749
72
1 31
8,167
-
7,67
6 4,
900,8
24
2,51
5,280
10
6,365
,681
As at
Dec
embe
r 31,
2016
Cost
306,0
54
520,3
18
5,60
6,721
1,
726,2
50
21,97
8 2,
909,8
70
137,1
75,82
4 -
2,20
9,022
1,
773,3
35
21,72
3 75
0,629
-
27,84
0 5,
304,5
92
2,86
4,149
16
1,218
,305
Accu
mulat
ed de
precia
tion
- (1
37,12
2) (1
,679,0
44)
(562
,127)
(3,41
8) (6
87,85
6) (4
4,108
,690)
- (1
,881,1
74)
(1,20
9,244
) (2
1,002
) (4
32,46
2) -
(20,1
64)
(403
,768)
(348
,869)
(51,4
94,94
0)
Accu
mulat
ed im
pairm
ent
- (1
34,92
1) -
(642
,779)
- -
(2,49
1,642
) -
- (8
8,342
) -
- -
- -
- (3
,357,6
84)
Net b
ook v
alue
306,0
54
248,2
75
3,92
7,677
52
1,344
18
,560
2,22
2,014
90
,575,4
92
- 32
7,848
47
5,749
72
1 31
8,167
-
7,67
6 4,
900,8
24
2,51
5,280
10
6,365
,681
"Ann
ual ra
te of
depre
ciatio
n (%)
"-
1 to 8
2.5 to
332.5
to 10
105
2.5 to
2520
No.
of pro
ducti
on
days
3 t
o 33
205 t
o 25
2533
.33 to
506.6
76.6
7 to 2
0
(Amou
nts in
thou
sand
)
For t
he y
ear e
nded
Dec
embe
r 31,
201
6
note
s to
the
Co
nso
lida
ted
fina
nCia
l st
atem
ents
148 Dawood Hercules Corporation Limited

5.1.1 Represents exchange gain netted amounting to Rs 2,566 (2015: exchange loss capitalized amounting to Rs 364,019) pertaining to Engro Powergen Qadirpur Limited.
2016 2015----------- Rupees -----------
5.2 Depreciation charge for the year has been allocated as follows:
Cost of goods sold (note 30.1) 8,330,442 8,757,422 Cost of services rendered (note 30.2) 533,561 417,336 Selling and distribution expenses (note 31) 247,531 236,526 Administrative expenses (note 32) 119,218 137,941
9,230,752 9,549,225 5.2.1 During the year, EPCL re-assessed useful lives of its plant and machinery. For this purpose, EPCL
engaged an independent expert / valuer and, based on the assessment carried out by the expert, has increased the useful lives of relevant assets by 5 to 31 years. Based on the report of the expert the useful lives of the relevant assets have been increased with effect from January 1, 2016. This change in the accounting estimate of useful lives has been accounted for prospectively in accordance with the requirements of IAS 8 - 'Accounting Policies, Changes in Accounting Estimates and Errors', which has resulted in reduction in depreciation charge for the year by Rs. 443,612 and increase in carrying value of property, plant and equipment by the same amount.
Had there been no change in the accounting estimate of useful lives of plant and machinery, the profit after tax for the current year would have been lower by Rs. 297,472.
2016 2015----------- Rupees -----------
5.3 Impairment loss for the year has been allocated as follows:
Operating assets (note 5.1) 106,388 3,380,503 Stores, spares and loose tools (note 11) - 73,681
106,388 3,454,184 5.3.1 Last year, the management taking cognizance of the significant losses suffered by EEAPL, as an
indicator of impairment, had conducted an impairment test of its Rice processing plant. The recoverable amount so determined was less than the carrying value of the plant & machinery, thereby resulting in an impairment loss of Rs. 3,384,030 which was recognized in the profit and loss account for the year ended December 31, 2015.As at December 31, 2016, the management re-assessed the recoverable amount of the rice processing plant, using revised corporate plan of EEAPL. Based on the re-assessment, no further impairment or reversal of impairment is required as at December 31, 2016.
The recoverable amount of Rs. 986,923 as at December 31, 2016 (including property, plant & equipment and stores and spares) was determined on the basis of value in use, discounted using a pre-tax risk adjusted weighted average cost of capital of 11.48%. In this assessment key assumptions relating to plant recovery rates, primary margins, fixed and conversion costs etc. had been based on past performance of EEAPL while paddy purchase price and selling price of rice including brands were estimated on management's expectation of market development. Further, volume of paddy procurement and utilisation plant capacity was based on management’s approved Corporate Plan.
For the year ended December 31, 2016
notes to the ConsolidatedfinanCial statements(Amounts in thousand)
Annual Report 2016 149

5.3.2 During the year, EFoods based on a review for impairment on the operating assets identified that the carrying values of certain operating assets in Dairy and Beverages segment exceed their estimated recoverable amounts. These assets were deemed as idle primarily due to discontinuation of certain SKUs to rationalise product portfolio of EFoods. The recoverable amount of these assets amounted to Rs. 79,045, determined on the basis of fair value less cost of disposal of underlying assets which is based on the historical experience of net recovery proceeds on similar nature of assets. The valuation is considered to be level 3 in the fair value hierarchy due to unobservable inputs used in the valuation. Accordingly, provision for impairment amounting to Rs. 106,388 was recognised in this respect.
5.4 Thedetailsofoperatingassetsdisposed/writtenoffduringtheyearareasfollows:description and sold to
Cost accumulated depreciation & impairment
net book value
sale proceeds method of disposal
---------------------------- Rupees ----------------------------
Buildings and civil works on freehold land Write off 625 625 - - data processing equipment
Insurance claim Adamjee Insurance Company Limited 172 79 93 80 Adamjee Insurance Company Limited 257 107 150 176
429 186 243 256
Company policy Faraz Salim 99 46 53 54 Ghias uddin Khan 103 43 60 60
202 89 113 114 Return back to supplier Samsung 88 11 77 85 Plant and machinery
Sold to Third Party under MAZ Consolidation 69,866 51,911 17,955 35,543 Company Policy Smart Power Systems 875 612 263 158 Sold through auction M/s Shafiq 873 784 89 20
M/s Shama Engineering 1,483 602 881 33 Insurance Claims Pak Kuwait Takaful Company Ltd. 114 10 104 77
EFU General Insurance Limited 57 5 52 57 Assets having net book value of less than Rs. 50 124,029 118,204 5,825 7,431
Write off 112,796 94,798 17,998 -
310,093 266,926 43,167 43,319 Furniture,fixtureandequipmentSold to Third Party
under Company Policy Agility Logistics 214 98 116 116 By Company policy to existing / Khalid Siraj Subhani 420 90 330 -
resigned / retired executives Naz Khan 175 106 69 - or on transfer of employee
Insurance claims EFU General Insurance Limited 1,209 649 560 715 Various 18,369 7,373 10,996 24,334
Items having net book value upto Rs.50 each 17,129 16,803 326 1,084
Write-off 4,113 3,512 601 -
41,629 28,631 12,998 26,249 Balance carried forward 353,066 296,468 56,598 70,023
For the year ended December 31, 2016
notes to the ConsolidatedfinanCial statements(Amounts in thousand)
150 Dawood Hercules Corporation Limited

description and sold to Cost accumulated depreciation & impairment
net book sale method of disposal value proceeds
--------------------------Rupees-------------------------- Balance brought forward 353,066 296,468 56,598 70,023 vehiclesBy Company policy to existing / Farman Ahmad Khan Lodhi 2,083 1,561 522 522
resigned / retired executives Nadeem Munawar 1,560 1,170 390 390 or on transfer of employee Jawed Hussain 1,560 1,170 390 390
Imran Raza Shaikh 1,560 1,170 390 390 Rabia Wafah Khan 1,560 1,170 390 390 Muhammad Asad Waheed 2,091 1,568 523 523 Ahmad Shakoor 8,000 6,000 2,000 2,000 Aasim Butt 8,000 6,000 2,000 2,000 Mohammad Imran Khaliq 1,638 1,228 410 410 Hurmat Bano 1,638 1,229 409 409 Umed Ali Mallah 1,638 1,229 409 409 Mudassir Yaqoob Rathor 2,447 1,835 612 612 Usman Asif 1,638 1,229 409 409 Saqib Ansari 1,638 1,229 409 409 Mirza Arsalan Baig 1,560 1,170 390 390 Sadia Malik 1,638 1,228 410 410 Faiz Chapra 2,332 1,749 583 583 Jahangir Piracha 8,000 5,625 2,375 2,000 Ikram Nabi 1,638 1,152 486 410 Rahim Anwar 1,648 1,030 618 464 Mudassir Bashir 1,638 1,203 435 409 Najam Saeed 2,058 1,447 611 515 Syed Ali Akbar 2,176 1,632 544 544 Muhamamd Imran Baloch 1,638 1,203 435 410 M. Saad Khan 1,638 1,177 461 410 Iftikhar Ahmed Dar 1,406 1,055 351 351 Sarah Aziz 1,645 1,234 411 411 Ahsan Afzaal Ahmad 8,000 6,288 1,712 2,000 Adil Aizaz 1,646 494 1,152 993 Jawad Akhtar 1,726 906 820 1,034 Mushtaq Vighio 1,592 806 786 1,358 Salman Ali Khan 1,568 823 745 1,215 Muhammad Imran Khalil 2,392 1,659 733 598 Adnan Mahmood 2,392 1,682 710 598 Syed Ali Abbas 1,773 1,064 709 942 Zahid Mahmood 2,383 1,806 577 815 Naveed Zafar 1,706 1,151 555 816 Muhammad Muddasir 2,146 1,610 536 537 Rameez Ahmed Faraz 2,091 1,568 523 523 Ayaz Ahmed 1,594 1,076 518 941 Faheem Ahmed 683 179 504 547 Muhammad Raza 683 205 478 506 Hassan Nazir 1,593 1,135 458 717 Dawar Iqbal 690 234 456 277 Usman Saif 1,711 1,283 428 1,055 M Ali Raza 683 282 401 398 Muhammad Bilal 1,555 1,166 389 903 Muhammad Naeem Zulfiqar 1,495 1,121 374 374 Faiz Ul Hassan 1,495 1,121 374 374 Laraib Zafar 1,474 1,106 368 369 Rehan Khaliq 1,474 1,106 368 369 Muhammad Shoaib 1,474 1,106 368 369 Ramzan Buriro 1,461 1,096 365 365 Muhammad Farjad 710 346 364 424 Adnan Ishtiaq 1,424 1,068 356 356 Muhammad Ali 1,534 1,179 355 868 Muhammad Imran 683 333 350 397 Sabir Mahmood 1,466 1,120 346 346 Imran Khatak 1,625 1,279 346 530 Zeeshan Ur Rab 1,374 1,031 343 344 Mustafa Hasan Qureshi 1,424 1,092 332 356 Bilal Muhammad Niazi 1,555 1,224 331 798 Nasir Iqbal 1,515 1,193 322 851 Sarfaraz Soomro 1,845 1,556 289 663 Safwan Munir 667 400 267 311 Nabeel Ahmed 1,478 1,218 260 762 Ali Rashid Khan 1,648 1,405 243 510 M Ali Hafeez 1,499 1,259 240 751 Athar Jameeli 1,482 1,248 234 719 Ahtesham Waheed Baig 1,569 1,353 216 795 Muhammad Anis Dayala 2,011 1,877 134 603 Reon Energy Limited 2,572 472 2,100 2,143
Balance carried forward - vehicle 141,627 101,419 40,208 48,090 Balance carried forward - others 353,066 296,468 56,598 70,023
For the year ended December 31, 2016
notes to the ConsolidatedfinanCial statements(Amounts in thousand)
Annual Report 2016 151

description and sold to Cost accumulated depreciation & impairment
net book sale method of disposal value proceeds
------------------------------Rupees------------------------------ Balance brought forward - others 353,066 296,468 56,598 70,023 Balance brought forward - vehicle 141,627 101,419 40,208 48,090
Muhammad Akhtar Tahir 1,495 1,285 210 707 Naeem Shah 667 463 204 274 Obaid Khan 667 463 204 300 Ali Sulaiman 1,586 1,398 188 714 Muhammad Shahzad 1,586 1,398 188 714 Kamran Chishti 1,495 1,317 178 706 Muhammad Zubair 1,699 1,529 170 340 Mubashir Tahir 676 507 169 270 Syed Imran Haider 1,625 1,462 163 325 Imran Aslam 1,586 1,428 158 714 Muhammad Rafiq Shah 1,586 1,428 158 724 Irfan Ali 1,586 1,428 158 714 Bakshal Shah Bukhari 1,586 1,428 158 714 Zain Ul Abidin 1,586 1,428 158 714 Tariq Mehmood 1,569 1,412 157 706 Muhammad Yousif Noori 1,569 1,412 157 707 Fayyaz Ahmed 1,569 1,412 157 706 Amin Khalique 1,569 1,412 157 706 Khurram Shehzad 1,555 1,399 156 700 Awais Ahmed Bhatti 1,555 1,399 156 700 Saud Farooq 1,534 1,381 153 690 Imran Ali Sheikh 657 505 152 202 Mohsin Ali 1,499 1,349 150 674 Kashif Nisar 1,495 1,346 149 673 Shaharyar Jehangir 1,495 1,345 150 400 Nabeel Gilani 1,495 1,345 150 673 Rashid Saeed Kunwar 1,495 1,345 150 673 Ameerzada Mumtaz 1,495 1,345 150 673 Usman Ali Dogar 1,495 1,345 150 673 Usman Faiq 1,495 1,345 150 747 Muhammad Imran 1,495 1,345 150 673 Muhammad Atiq Chishty 1,495 1,345 150 673 Armughan Ishrat 1,495 1,345 150 673 Babar Iqbal Khan 1,495 1,345 150 908 Raja Ali Ahsan 1,495 1,345 150 673 Tehseen Ullah 1,485 1,337 148 668 Ismail Shah 1,485 1,337 148 668 Siraj Ur Rehman 1,485 1,337 148 668 Faheem Khan 1,482 1,333 149 667 Imran Haider Klasoon 1,482 1,333 149 667 Raja Masood Akhtar 1,482 1,333 149 667 Muhammad Iqbal 1,482 1,333 149 667 Kashif Mehmood 1,481 1,333 148 667 Akhtar Tahir 1,481 1,333 148 667 Faisal Iqbal 1,481 1,333 148 667 Syed Ali Akbar Shah 1,423 1,282 141 760 M.Asad Malik 612 470 142 204 Kamran Abbasi 612 470 142 153 Muhammad Pervaz Rafiq 666 533 133 133 Farhan Shokat 671 542 129 134 Shahid Saleem 671 542 129 215 Babar Mughal 612 482 130 199 Noman Ali 595 476 119 178 Muhamamd Akram 612 493 119 178 Ali Mumtaz Khan 581 464 117 116 Syed Ghazanfar Ali 574 459 115 115 Abid Anwar 554 443 111 111 Zeeshan Akram 554 443 111 111 Muhammad Yahya 549 439 110 110 Muhammad Imran 537 430 107 107 Irshad Hussain 586 483 103 340 Muhammad Khubaib 586 494 92 117 Raheel Ahmed Siddiqui 612 539 73 122 Masood Aqeel 610 538 72 214 Babar Ahmed Khan 586 515 71 117 Abid Jalal 586 515 71 117 Jahangir Shah 586 515 71 127 Saif Ullah Jamali 612 551 61 122 Kashif Liaquat 612 551 61 122 Kazim Hussain 612 551 61 122 Junaid Khalid 612 551 61 134 Khalid Rehman 612 551 61 122 Mairaj Mughal 610 549 61 122 Muhammad Noman 610 549 61 122 Ather Abbas 610 549 61 122
84,133 74,095 10,038 33,472 Balance carried forward - vehicle 225,760 175,514 50,246 81,562 Balance carried forward - others 353,066 296,468 56,598 70,023
For the year ended December 31, 2016
notes to the ConsolidatedfinanCial statements(Amounts in thousand)
152 Dawood Hercules Corporation Limited

description and sold to Cost accumulated net book sale method of disposal depreciation value proceeds
& impairment ------------------------------Rupees------------------------------
Balance brought forward - others 353,066 296,468 56,598 70,023
Balance brought forward - vehicle 225,760 175,514 50,246 81,562 Imran Qasim Malik 586 526 60 117 Muhammad Aslam Javaid 1,394 1,334 60 349 Ali Rafique 586 528 58 117 Irfan Qadir 586 528 58 117 Tauqeer Ahmed 586 528 58 117 Dr Noor 586 528 58 137 Dr. Zubair 586 528 58 117 Usman Amin 586 527 59 143 Dr Liaquat Ali 586 527 59 117 Dr Rameez 586 527 59 117 Muhammad Yasir 583 525 58 117 Dr Faseh 583 525 58 117 Mehboob Alam 583 525 58 117 Jawad Saleem 572 515 57 114 Saeed Ahmed 554 499 55 111
9,543 8,670 873 2,024
235,303 184,184 51,119 83,586
Sale through bid / auction Waqar Ahmed 750 600 150 574 Imran Ahmed 654 523 131 568 Umer Ayaz Khan 1,398 1,048 350 897 Waseem Mirza 1,956 1,760 196 888 Syed Riaz Ahmed 1,268 1,141 127 735 Waseem Mirza 596 525 71 347 Khalid Anwar 680 612 68 951 Adam Khan Afridi 630 567 63 321 Muhammad Amir Khan 622 560 62 299 Muhammad Idrees 598 538 60 379 Muhammad Javed 597 537 60 344 Abrar Khan 597 537 60 348 Khalid Anwar 597 537 60 305 Muhammad Amir Khan 586 528 58 275 Sheikh Waheed 586 528 58 190 Muhammad Amir Khan 586 528 58 273 Sheikh Waheed 586 528 58 195 Syed Adil Ali 586 528 58 189 Syed Riaz Ahmed 528 475 53 296 Adam Khan Afridi 528 475 53 371
14,929 13,075 1,854 8,745
Insurance claims EFU General Insurance Limited 4,899 1,499 3,400 4,587 Adamjee Insurance Company Limited 691 104 587 562
5,590 1,603 3,987 5,149
Items having net book value upto Rs.50 each Various 11,118 8,397 2,721 2,834
Write Off 200 200 - -
267,140 207,459 59,681 100,314
Year ended December 31, 2016 620,206 503,927 116,279 170,337
Year ended December 31, 2015 502,488 299,899 202,589 251,080
For the year ended December 31, 2016
notes to the ConsolidatedfinanCial statements(Amounts in thousand)
Annual Report 2016 153

2016 2015----------------Rupees----------------
5.5 Capital work in progress
Plant and machinery 23,341,140 3,136,563 Building and civil works including pipelines 195,647 289,202 Furniture, fixture and equipment 34,013 67,108 Advances to suppliers 135,153 137,838 Other ancillary cost 113,131 65,071 Vehicles - 13,000
23,819,084 3,708,782
Balance as at January 1 3,708,782 10,035,603 Additions during the year 25,764,701 6,556,268
Transferred to:
- operating assets (note 5.1) (4,846,721) (12,652,662)- intangible assets (note 7) (65,620) (79,683)- capital spares (9,647) -
Less: Discontinued operations (note 19) (732,411) (150,744)
Balance as at December 31 23,819,084 3,708,782
6. BIOLOGICAL ASSETS
Dairy livestock (note 6.1)- mature 567,873 606,622 - immature 370,279 427,473
938,152 1,034,095 Provision for culling (notes 6.2 and 34) (26,067) (24,748)
912,085 1,009,347 Crops - feed stock 20,641 14,904 Less: Discontinued operations (note 19) (932,726) -
- 1,024,251
6.1 Reconciliation of carrying amounts of livestock
Carrying amount at beginning of the year 1,009,347 845,123
Add:Changes in fair value due to biological transformation- Gain due to new births [inclusive of cost of feeding
immature herd of Rs. 180,862 (2015: Rs. 168,657)] 228,197 250,179 - Loss due to increase in age of livestock (46,173) (14,244)
182,024 235,935 Changes in fair value due to price changes- Gain due to currency devaluation 494 36,287 - Loss due to decrease in international market price (174,403) (28,619)
(173,909) 7,668
Total gain (note 33) 8,115 243,603
Less: Decrease due to deaths / disposals (79,310) (54,631)Provision for culling (notes 6.2 and 34) (26,067) (24,748)
Carrying amount at end of the year, which approximates the fair value 912,085 1,009,347
For the year ended December 31, 2016
notes to the ConsolidatedfinanCial statements(Amounts in thousand)
154 Dawood Hercules Corporation Limited
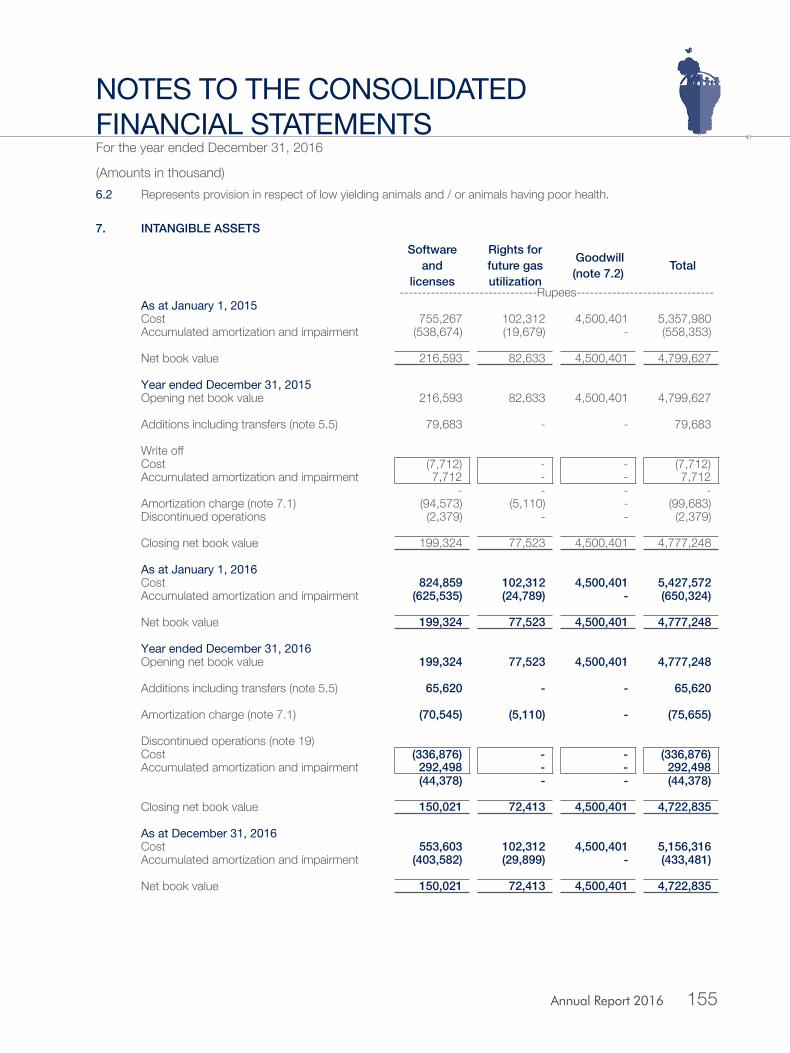
6.2 Represents provision in respect of low yielding animals and / or animals having poor health.
7. INTANGIBLE ASSETSSoftware
andlicenses
Rights for future gasutilization
Goodwill (note 7.2) Total
-------------------------------Rupees------------------------------- AsatJanuary1,2015Cost 755,267 102,312 4,500,401 5,357,980 Accumulated amortization and impairment (538,674) (19,679) - (558,353)
Net book value 216,593 82,633 4,500,401 4,799,627
YearendedDecember31,2015Opening net book value 216,593 82,633 4,500,401 4,799,627
Additions including transfers (note 5.5) 79,683 - - 79,683
Write offCost (7,712) - - (7,712)Accumulated amortization and impairment 7,712 - - 7,712
- - - - Amortization charge (note 7.1) (94,573) (5,110) - (99,683)Discontinued operations (2,379) - - (2,379)
Closing net book value 199,324 77,523 4,500,401 4,777,248
AsatJanuary1,2016Cost 824,859 102,312 4,500,401 5,427,572 Accumulated amortization and impairment (625,535) (24,789) - (650,324)
Net book value 199,324 77,523 4,500,401 4,777,248
YearendedDecember31,2016Opening net book value 199,324 77,523 4,500,401 4,777,248
Additions including transfers (note 5.5) 65,620 - - 65,620
Amortization charge (note 7.1) (70,545) (5,110) - (75,655)
Discontinued operations (note 19)Cost (336,876) - - (336,876)Accumulated amortization and impairment 292,498 - - 292,498
(44,378) - - (44,378)
Closing net book value 150,021 72,413 4,500,401 4,722,835
AsatDecember31,2016Cost 553,603 102,312 4,500,401 5,156,316 Accumulated amortization and impairment (403,582) (29,899) - (433,481)
Net book value 150,021 72,413 4,500,401 4,722,835
For the year ended December 31, 2016
notes to the ConsolidatedfinanCial statements(Amounts in thousand)
Annual Report 2016 155
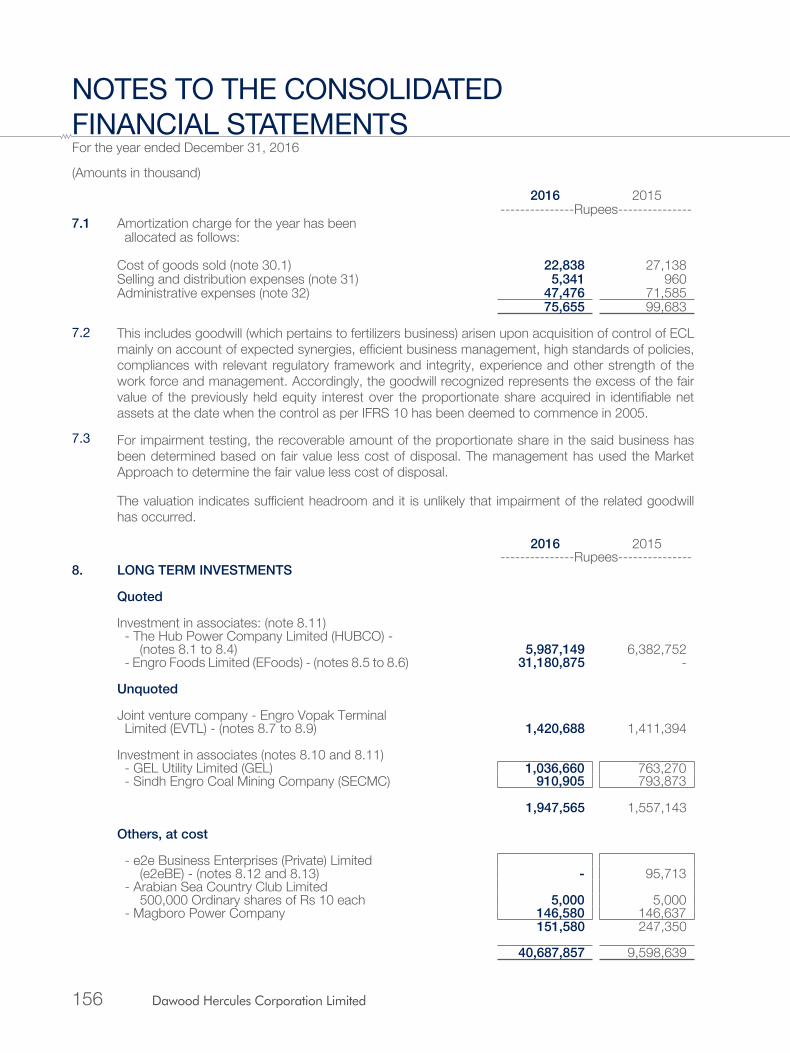
2016 2015---------------Rupees---------------
7.1 Amortization charge for the year has been allocated as follows:
Cost of goods sold (note 30.1) 22,838 27,138 Selling and distribution expenses (note 31) 5,341 960 Administrative expenses (note 32) 47,476 71,585
75,655 99,683
7.2 This includes goodwill (which pertains to fertilizers business) arisen upon acquisition of control of ECL mainly on account of expected synergies, efficient business management, high standards of policies, compliances with relevant regulatory framework and integrity, experience and other strength of the work force and management. Accordingly, the goodwill recognized represents the excess of the fair value of the previously held equity interest over the proportionate share acquired in identifiable net assets at the date when the control as per IFRS 10 has been deemed to commence in 2005.
7.3 For impairment testing, the recoverable amount of the proportionate share in the said business has been determined based on fair value less cost of disposal. The management has used the Market Approach to determine the fair value less cost of disposal.
The valuation indicates sufficient headroom and it is unlikely that impairment of the related goodwill has occurred.
2016 2015---------------Rupees---------------
8. LONG TERM INVESTMENTS
Quoted
Investment in associates: (note 8.11)- The Hub Power Company Limited (HUBCO) -
(notes 8.1 to 8.4) 5,987,149 6,382,752 - Engro Foods Limited (EFoods) - (notes 8.5 to 8.6) 31,180,875 -
Unquoted
Joint venture company - Engro Vopak Terminal Limited (EVTL) - (notes 8.7 to 8.9) 1,420,688 1,411,394
Investment in associates (notes 8.10 and 8.11)- GEL Utility Limited (GEL) 1,036,660 763,270 - Sindh Engro Coal Mining Company (SECMC) 910,905 793,873
1,947,565 1,557,143
Others, at cost
- e2e Business Enterprises (Private) Limited (e2eBE) - (notes 8.12 and 8.13) - 95,713
- Arabian Sea Country Club Limited 500,000 Ordinary shares of Rs 10 each 5,000 5,000
- Magboro Power Company 146,580 146,637 151,580 247,350
40,687,857 9,598,639
For the year ended December 31, 2016
notes to the ConsolidatedfinanCial statements(Amounts in thousand)
156 Dawood Hercules Corporation Limited

2016 2015---------------Rupees---------------
8.1 Details of investment in HUBCO is as follows:
At the beginning of the year 6,382,752 5,643,701 Add: Share of profit for the year 1,761,852 1,610,234 Less: Share of other comprehensive income 180 1,435 Add: Shares purchased from Patek (Private) Limited - 731,698 Add: Transaction cost - 7,143 Less: Dividend received during the year 2,157,275 1,608,589
5,987,149 6,382,752
8.2 The Holding Company has 14.91% (2015: 14.91%) of the voting power in HUBCO by virtue of its shareholding. Due to the representation of the Holding Company’s nominees on the Board of Directors of HUBCO, the Holding Company has significant influence over HUBCO.
8.3 The market value of investment in HUBCO as at December 31, 2016 was Rs 21,310,425 (2015: Rs 17,706,913).
8.4 The details of shares pledged as security against various facilities are as follows:
As at December 31, 2016 As at December 31, 2015
BankNumber
of shares pledged
Face value of pledged
shares
Market value of pledged
shares
Number of shares pledged
Face value of pledged
shares
Market value of pledged
shares (in ‘000) --------(Rupees)-------- (in ‘000) --------(Rupees)--------
Pledged against financing facilities availed by the Holding CompanyLong term:Allied Bank Limited 82,570 825,700 10,195,744 82,570 825,700 8,471,682
Short term:Bank AL Habib Limited 20,256 202,560 2,501,211 31,256 312,560 3,206,866 Habib Metropolitan Bank Limited 25,850 258,500 3,191,958 - - - MCB Islamic Bank Limited 4,762 47,620 588,012 - - - United Bank Limied 16,182 161,815 1,998,092 15,656 156,560 1,606,306
2016 2015---------------Rupees---------------
8.5 Details of investment in EFoods is as follows:
At the beginning of the year - - Investment in associate 31,219,746 - Less: Share of loss for the year (note 36) (38,871) - At the end of the year 31,180,875 -
8.6 As stated in note 2.1.4 ECL has partially disposed-off its investment in EFoods resulting in loss of control as at December 19, 2016. As per the Group policy for accounting for investment in associate upon loss of control, the retained interest in EFoods comprising of 306,075,948 ordinary shares of Rs. 10 each (39.9% shareholding), has been valued on the date of loss of control at fair value of Rs. 102 per share. The fair value of Rs. 102 per share has been estimated by adjusting the quoted price of Rs. 170.03 per share as at December 19, 2016 by 40% to account for the changes in ownership / governance structure of EFoods and lock-up period under SPA, based on management’s best estimate.
For the year ended December 31, 2016
notes to the ConsolidatedfinanCial statements(Amounts in thousand)
Annual Report 2016 157

2016 2015---------------Rupees---------------
8.7 Details of investment in EVTL is as follows:
At the beginning of the year 1,411,394 1,411,957 Add: Share of profit for the year (note 36) 1,044,294 786,937 Less: Dividend received during the year 1,035,000 787,500 At the end of the year 1,420,688 1,411,394
8.8 As at December 31, 2016, ECL held 45,000,000 ordinary shares (2015: 45,000,000 ordinary shares) of EVTL representing 50% of issued, subscribed & paid-up capital of EVTL.
8.9 The summary of financial information of EVTL as of December 31 is as follows:
Balance Sheet Profit and LossParticulars 2016 2015 Particulars 2016 2015
-------- Rupees -------- -------- Rupees --------
Cash and cash equivalent 188,679 270,960 Revenue 3,155,262 2,598,949 Current financial liabilties (excluding
trade and other payables) - 247,957 Depreciation and amortization 226,170 224,275 Non-current financial liabilities
(excluding trade and other payables) - - Interest income 19,394 19,515 Non-current assets 2,687,074 2,876,880 Current assets 596,801 673,134 Interest expense 1,602 11,021 Non-current liabilities (8,094) (5,547)Current liabilities (399,610) (686,883) Income tax expense 268,344 246,203
2,876,171 2,857,584 Group’s share at 50% (2015: 50%) 1,438,086 1,428,792 Profit / total comprehensive income Others (17,398) (17,398) for the year 2,088,588 1,573,873 Carrying amount 1,420,688 1,411,394
8.10 details of investment in associates is as follows:
2016 2015Particulars GEL SECMC GEL SECMC
--------------------------Rupees--------------------------At beginning of the year 763,270 793,873 535,945 782,255
Add:
- Investment in associates - 49,785 - - - Share of profit / (loss) for the year (note 36) 273,390 (5,316) 227,325 4,683 - Gain on deemed disposal (note 33) - 72,563 - 6,935
1,036,660 910,905 763,270 793,873
For the year ended December 31, 2016
notes to the ConsolidatedfinanCial statements(Amounts in thousand)
158 Dawood Hercules Corporation Limited

8.11 The summary of financial information / reconciliations of HUBCO as of September 30 whereas for EFoods, GEL and SECMC as of December 31 is as follows:
2016Particulars EFoods HUBCO GEL SECMC
------------------------- Rupees -------------------------
Revenue 44,346,031 88,506,574 1,764,246 27,136
Profit / (loss) after tax 2,386,712 12,446,569 669,624 (36,834)Other comprehensive income 12,168 (1,209) - (1,106)Total comprehensive income / (loss) 2,398,880 12,445,360 669,624 (37,940)
Non-current assets 14,246,416 57,304,617 7,632,812 22,236,353 Current assets 10,467,356 94,341,404 2,119,023 2,266,348 Total assets 24,713,772 151,646,021 9,751,835 24,502,701
Less:Non-current liabilities 2,105,824 26,696,138 4,588,204 12,251,353 Current liabilities 5,457,429 89,062,631 2,954,529 4,731,858 Total Liabilities 7,563,253 115,758,769 7,542,733 16,983,211
Net assets 17,150,519 35,887,252 2,209,102 7,519,490 Group’s share in % 39.90% 14.91% 45% 11.9%Share of net assets 6,843,057 5,350,789 994,096 895,571 Recognition of investment
at fair value (notes 8.6 and 33) 24,337,818 - - - Others - 636,360 42,564 15,334 Carrying amount 31,180,875 5,987,149 1,036,660 910,905
2015Particulars EFoods HUBCO GEL SECMC
------------------------- Rupees -------------------------
Revenue - 118,048,820 1,822,860 19,320
Profit after tax - 12,296,510 443,075 21,913 Other comprehensive income - (10,066) - 202 Total comprehensive income - 12,286,444 443,075 22,115
Non-current assets - 59,394,810 8,022,203 3,567,985 Current assets - 85,219,105 995,570 712,624 Total assets - 144,613,915 9,017,773 4,280,609
Less:Non-current liabilities - 29,627,563 6,451,493 100,362 Current liabilities - 75,448,148 1,023,104 179,881 Total Liabilities - 105,075,711 7,474,597 280,243
Net assets - 39,538,204 1,543,176 4,000,366 Group’s share in % - 14.91% 45% 19.8%Share of net assets - 5,895,146 694,429 792,072 Others - 487,606 68,841 1,801 Carrying amount - 6,382,752 763,270 793,873
For the year ended December 31, 2016
notes to the ConsolidatedfinanCial statements(Amounts in thousand)
Annual Report 2016 159

2016 2015---------------Rupees---------------
8.12 Details of investment in e2eBE is as follows: 95,713 231,620
At beginning of the yearLess: Share of loss for the year - (20,960)Less: Disposal of shares - (107,286)Less: Impairment loss (note 32) (95,713) (7,661)
- 95,713 8.13 The Holding Company had made an investment in e2eBE which was set up for the production, sale and
marketing of Rice Bran Oil (RBO) and was planned to start commercial operations in 2014 However, due to certain technical issues it has not been able to start the commercial operations of the project till date. Further, due to serious financial and liquidity crises, it has not been able to service its outstanding loans and working capital requirements.
The Holding Company has assessed the carrying amount of its investment in e2eBE in accordance with the requirements of IAS 36 ‘Impairment of Assets’ and recorded an impairment loss of Rs 95,713 (2015: 20,933) representing the full amount of its investment as the possibility of turnaround of e2eBE operations is remote.
9. DEFERRED TAXATION
2016 2015Assets Liabilities Assets Liabilities
---------------------------Rupees---------------------------
Engro Corporation Limited - 476,017 1,124 - Engro Fertilizers Limited - 7,491,859 - 6,419,916 Engro Foods Limited - - - 1,816,289 Engro Eximp (Private) Limited - - 73,472 - Engro Powergen Limited - 69,461 - - Engro Polymer and Chemicals Limited 549,328 - 908,103 - Engro Elengy Terminal (Private) Limited - 723,949 - 219,748 Net effect of consolidation adjustments 28,143 221,420 - 240,248
577,471 8,982,706 982,699 8,696,201 9.1 The temporary differences amounting to Rs 47,032,136 relates to investments in subsidiaries for
which deferred tax liability has not been recognised, as the parent entity is able to control the timing of distributions from this subsidiary and is not expected to distribute these profits in the foreseeable future.
2016 2015---------------Rupees---------------
9.2 Credit / (Debit) balances arising on account of:
- Accelerated depreciation allowance 17,636,684 18,686,280 - Recoupable carried forward tax losses (note 9.3) (2,778,309) (4,433,352)- Recoupable minimum turnover tax (note 9.4) (2,346,967) (2,517,145)- Unrealized foreign exchange losses, unpaid liabilities
and provision for retirement and other service benefits (68,421) (101,804)- Provision for Gas Infrastructure Development
Cess, Custom duty and Special Excise Duty (618,568) (325,412)- Provision for net realizable value of stock-in-trade (109,811) (14,312)- Recoupable Alternative Corporate Tax (note 9.5) (3,962,572) (3,962,572)- Deferred tax on recognition of investment at fair value 478,244 - - Others 174,955 381,818
8,405,235 7,713,501
For the year ended December 31, 2016
notes to the ConsolidatedfinanCial statements(Amounts in thousand)
160 Dawood Hercules Corporation Limited
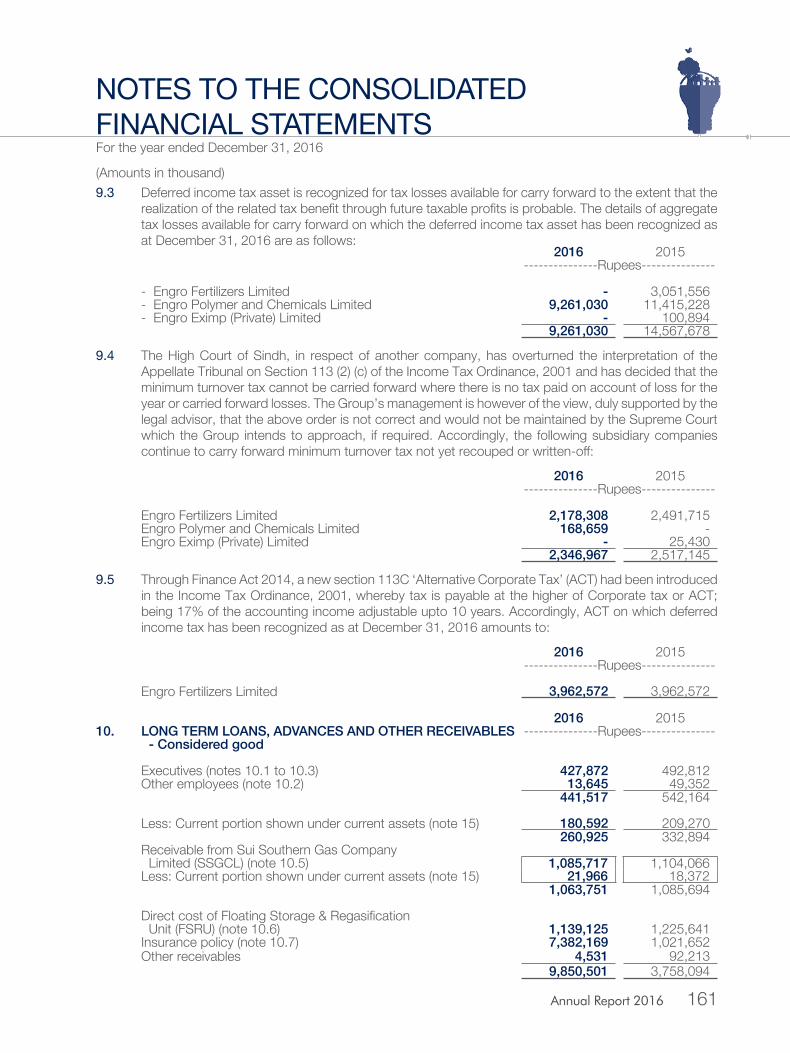
9.3 Deferred income tax asset is recognized for tax losses available for carry forward to the extent that the realization of the related tax benefit through future taxable profits is probable. The details of aggregate tax losses available for carry forward on which the deferred income tax asset has been recognized as at December 31, 2016 are as follows:
2016 2015---------------Rupees---------------
- Engro Fertilizers Limited - 3,051,556 - Engro Polymer and Chemicals Limited 9,261,030 11,415,228 - Engro Eximp (Private) Limited - 100,894
9,261,030 14,567,678
9.4 The High Court of Sindh, in respect of another company, has overturned the interpretation of the Appellate Tribunal on Section 113 (2) (c) of the Income Tax Ordinance, 2001 and has decided that the minimum turnover tax cannot be carried forward where there is no tax paid on account of loss for the year or carried forward losses. The Group’s management is however of the view, duly supported by the legal advisor, that the above order is not correct and would not be maintained by the Supreme Court which the Group intends to approach, if required. Accordingly, the following subsidiary companies continue to carry forward minimum turnover tax not yet recouped or written-off:
2016 2015---------------Rupees---------------
Engro Fertilizers Limited 2,178,308 2,491,715 Engro Polymer and Chemicals Limited 168,659 - Engro Eximp (Private) Limited - 25,430
2,346,967 2,517,145
9.5 Through Finance Act 2014, a new section 113C ‘Alternative Corporate Tax’ (ACT) had been introduced in the Income Tax Ordinance, 2001, whereby tax is payable at the higher of Corporate tax or ACT; being 17% of the accounting income adjustable upto 10 years. Accordingly, ACT on which deferred income tax has been recognized as at December 31, 2016 amounts to:
2016 2015---------------Rupees---------------
Engro Fertilizers Limited 3,962,572 3,962,572
2016 201510. LONG TERM LOANS, ADVANCES AND OTHER RECEIVABLES ---------------Rupees---------------
- Considered good
Executives (notes 10.1 to 10.3) 427,872 492,812 Other employees (note 10.2) 13,645 49,352
441,517 542,164
Less: Current portion shown under current assets (note 15) 180,592 209,270 260,925 332,894
Receivable from Sui Southern Gas CompanyLimited (SSGCL) (note 10.5) 1,085,717 1,104,066
Less: Current portion shown under current assets (note 15) 21,966 18,372 1,063,751 1,085,694
Direct cost of Floating Storage & Regasification Unit (FSRU) (note 10.6) 1,139,125 1,225,641
Insurance policy (note 10.7) 7,382,169 1,021,652 Other receivables 4,531 92,213
9,850,501 3,758,094
For the year ended December 31, 2016
notes to the ConsolidatedfinanCial statements(Amounts in thousand)
Annual Report 2016 161
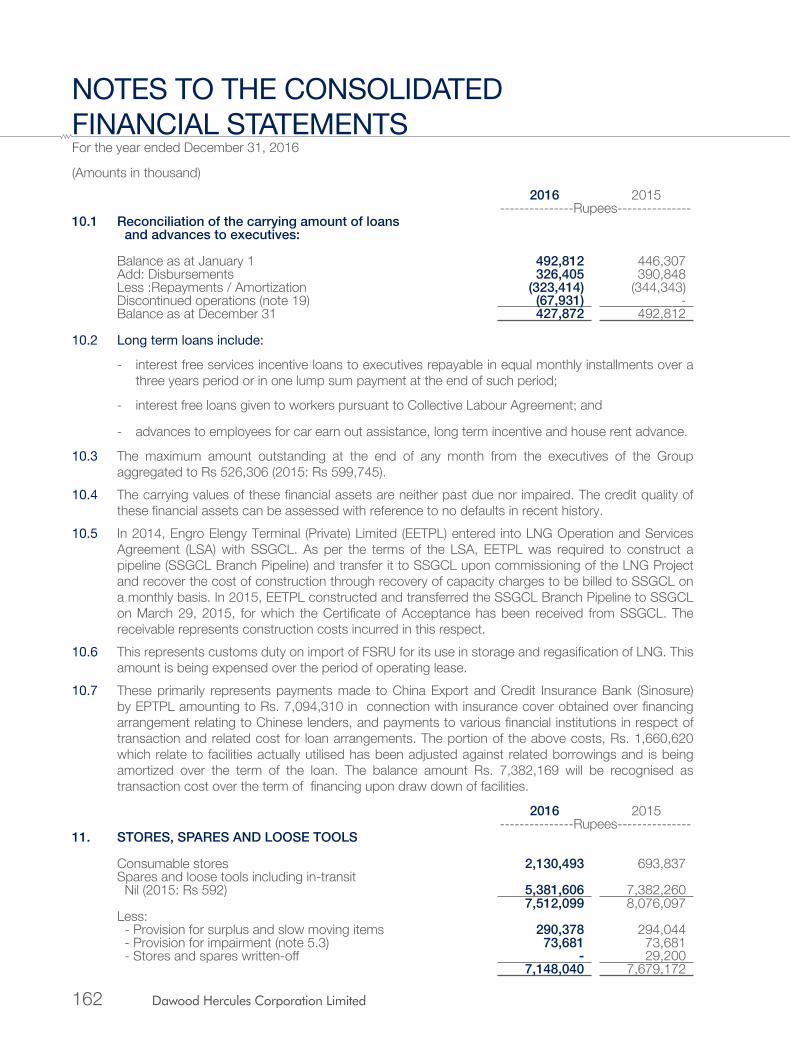
2016 2015---------------Rupees---------------
10.1 Reconciliation of the carrying amount of loansand advances to executives:
Balance as at January 1 492,812 446,307 Add: Disbursements 326,405 390,848 Less :Repayments / Amortization (323,414) (344,343)Discontinued operations (note 19) (67,931) - Balance as at December 31 427,872 492,812
10.2 long term loans include:
- interest free services incentive loans to executives repayable in equal monthly installments over a three years period or in one lump sum payment at the end of such period;
- interest free loans given to workers pursuant to Collective Labour Agreement; and
- advances to employees for car earn out assistance, long term incentive and house rent advance.
10.3 The maximum amount outstanding at the end of any month from the executives of the Group aggregated to Rs 526,306 (2015: Rs 599,745).
10.4 The carrying values of these financial assets are neither past due nor impaired. The credit quality of these financial assets can be assessed with reference to no defaults in recent history.
10.5 In 2014, Engro Elengy Terminal (Private) Limited (EETPL) entered into LNG Operation and Services Agreement (LSA) with SSGCL. As per the terms of the LSA, EETPL was required to construct a pipeline (SSGCL Branch Pipeline) and transfer it to SSGCL upon commissioning of the LNG Project and recover the cost of construction through recovery of capacity charges to be billed to SSGCL on a monthly basis. In 2015, EETPL constructed and transferred the SSGCL Branch Pipeline to SSGCL on March 29, 2015, for which the Certificate of Acceptance has been received from SSGCL. The receivable represents construction costs incurred in this respect.
10.6 This represents customs duty on import of FSRU for its use in storage and regasification of LNG. This amount is being expensed over the period of operating lease.
10.7 These primarily represents payments made to China Export and Credit Insurance Bank (Sinosure) by EPTPL amounting to Rs. 7,094,310 in connection with insurance cover obtained over financing arrangement relating to Chinese lenders, and payments to various financial institutions in respect of transaction and related cost for loan arrangements. The portion of the above costs, Rs. 1,660,620 which relate to facilities actually utilised has been adjusted against related borrowings and is being amortized over the term of the loan. The balance amount Rs. 7,382,169 will be recognised as transaction cost over the term of financing upon draw down of facilities.
2016 2015---------------Rupees---------------
11. STORES, SPARES AND LOOSE TOOLS
Consumable stores 2,130,493 693,837 Spares and loose tools including in-transit
Nil (2015: Rs 592) 5,381,606 7,382,260 7,512,099 8,076,097
Less: - Provision for surplus and slow moving items 290,378 294,044 - Provision for impairment (note 5.3) 73,681 73,681 - Stores and spares written-off - 29,200
7,148,040 7,679,172
For the year ended December 31, 2016
notes to the ConsolidatedfinanCial statements(Amounts in thousand)
162 Dawood Hercules Corporation Limited

2016 2015---------------Rupees---------------
12. STOCK-IN-TRADE
Raw materials and packing materials (note 12.1 and 12.3) 2,469,134 5,459,117 Unprocessed rice 351,231 369,320 Fuel stock (note 12.2) 381,244 382,085 Work-in-process 32,868 213,415
Finished goods: - own manufactured product (note 12.1) 6,333,929 3,950,386 - purchased product (note 12.1) 1,135,905 3,714,378
7,469,834 7,664,764 10,704,311 14,088,701
12.1 includes:
- materials in transit amounting to Rs 548,142 (2015: Rs 416,837);
- inventories carried at net of realisable value of Rs 70,067 (2015: Rs 561,853); and
- inventories held at storage facilities of third parties amounting to Rs 365,765 (2015: Rs 735,799)
12.2 Represents High Speed Diesel (HSD) inventory required to be maintained for operating the power plant in case supply of gas is unavailable to Engro Powergen Qadirpur Limited (EPQL). As per clause (b) of section 5.14 of the Power Purchase Agreement (PPA), EPQL is required to maintain HSD at a level sufficient for operating the power plant at full load for seven days. However, due to non payment of dues in full by National Transmission and Dispatch Company (NTDC), EPQL is maintaining HSD inventory at a level sufficient for operating the power plant at full load for around five days.
12.3 During the year packaging material of rice amounting to Rs. 7,800 (2015: Nil) has been written off.
2016 2015---------------Rupees---------------
13. TRADE DEBTS
Considered good- secured (note 13.1 and 13.2) 13,502,229 6,297,449 - unsecured 231,253 436,164
13,733,482 6,733,613 Considered doubtful 24,400 24,682
13,757,882 6,758,295 Less: Provision for impairment (note 13.3) 24,400 24,682
13,733,482 6,733,613
13.1 Trade debts are generally secured by way of bank guarantees and letters of credit from customers. Trade debts of Engro Powergen Qadirpur Limited (EPQL) amounting to Rs 3,896,828 (2015: Rs 2,760,311), are secured by a guarantee from the Government of Pakistan under the Implementation Agreement.
For the year ended December 31, 2016
notes to the ConsolidatedfinanCial statements(Amounts in thousand)
Annual Report 2016 163

13.2 Includes Rs 2,131,284 (2015: Rs 1,017,916) due from SSGCL, in respect of capacity and utilization charges billed in accordance with the terms of LSA.
13.3 As at December 31, 2016, trade debts aggregating to Rs 24,400 (2015: Rs 24,682) were past due and impaired and have been provided for. The movement in provision during the year is as follows:
2016 2015---------------Rupees---------------
Balance as at January 1 24,682 29,359 Less: Disposal of subsidiary company / reversal (282) (4,677)Balance as at December 31 24,400 24,682
13.4 As at December 31, 2016, trade debts aggregating to Rs 1,247,504 (2015: Rs 483,778) were past due but not impaired. These relate to various customers for which there is no recent history of default. The aging analysis of these trade debts is as follows:
2016 2015---------------Rupees---------------
Upto 3 months 1,247,504 477,878 3 to 6 months - 5,900
1,247,504 483,778
14. DERIVATIVE FINANCIAL INSTRUMENTS
2016 2015Assets Liabilities Assets Liabilities
------------------------Rupees------------------------
Conversion option on loan from International Finance Corporation (IFC) - 194,999 - 298,749
Foreign exchange forward contracts (note 14.1) - - - 23,982 Cash flow hedges:
- Foreign exchange forward contracts (note 14.1) - 54,654 29,207 57,173 - Interest rate swaps (note 14.2) - 2,107 - 30,548
- 251,760 29,207 410,452 Less: Current portion shown under current
assets / liabilities
Conversion option on loan from IFC - 194,999 - 298,749 Foreign exchange forward contracts - - - 23,982 Cash flow hedges:
- Foreign exchange forward contracts - 54,654 29,207 57,173 - Interest rate swaps - - - 13,166
- 54,654 29,207 70,339
- 249,653 29,207 393,070 - 2,107 - 17,382
14.1 The Group entered into various forward exchange contracts to hedge its foreign currency exposure. As at December 31, 2016, the Group, had multiple forward contracts to purchase various currencies involving amounts equivalent to USD 19,625 (2015: USD 120,604) at various maturity dates to hedge its foreign currency exposure against loan obligations and payments under the terms of supplier credit. The net fair value of these contracts as at December 31, 2016 is negative Rs 54,654 (2015: negative Rs 51,948).
For the year ended December 31, 2016
notes to the ConsolidatedfinanCial statements(Amounts in thousand)
164 Dawood Hercules Corporation Limited

14.2 interest rates swaps
The Group has entered into multiple interest rate swap agreements to hedge its interest rate exposure on floating rate committed borrowings for notional amounts of USD 2,666 (2015: USD 15,727). Under these contracts the Group receives USD-LIBOR and pays fixed 2.79% - 3.73% settled semi-annually. As at December 31, 2016, the fair value of all the interest rate swaps is negative Rs 2,107 (2015: negative Rs 30,548).
14.3 embedded derivatives
Engro Powergen Qadirpur Limited’s (EPQL) tariff like other power companies, comprises of various price components with indexations falling within the ambit of embedded derivatives. Such embedded derivative as per International Accounting Standard (IAS) 39, ‘Financial Instrument: Recognition and Measurement’ are required to be separated from the host contract and accounted for as derivative if economic characteristics and risks of the embedded derivative are not closely related to the host contract.
EPQL had sought clarification from the Institute of Chartered Accountants of Pakistan (ICAP) in respect of the indexations pertaining to (i) USD/PKR exchange rate (applicable to EPQL’s price components of debt, return on equity, return on equity during construction); and (ii) US CPI & USD/PKR exchange rate (applicable to EPQL’s price components of fixed and variable operations and maintenance – foreign) whether these derivatives were closely or not closely related to the host contract.
In addition, EPQL had also requested ICAP to prescribe a definite basis or guidelines for the valuation of such embedded derivatives considering the subjectivity involved therein if these were considered to be not closely related to the host contract. Further, as indexation of USD/PKR exchange rate related to debt component being not recognized separately as embedded derivative, EPQL taking cognizance of the ‘matching principle’ requested the SECP to allow deferment of recognizing exchange loss on translation of borrowings under IAS 21 - Foreign Currency Transactions in the profit or loss till the clarification sought on the recognition of the foreign currency indexations from ICAP had been received.
On January 16, 2012, SECP vide SRO 24 (I) 2012 had granted waivers to all IPPs from the requirement of IFRIC 4 “Determining whether an arrangement contains a lease” and IFRIC 12 “Service Concession Agreements”. Further, SECP through the aforementioned SRO has also allowed the IPPs to continue capitalizing the exchange differences, and not to recognize embedded derivatives under IAS 39 where these are not closely related to the host contract. However, in the case of such derivatives, for periods beginning on or after January 1, 2013, the companies are required to give “Additional Disclosure” as if the accounting for embedded derivatives had been adopted in preparing the financial statements.
In view of the above SRO, EPQL has capitalized exchange loss aggregating to Rs 2,524,087 (2015: Rs 2,526,653) as at December 31, 2016, which is net off exchange gain of Rs 2,566 pertaining to current year (2015: exchange loss of Rs 364,019) in property, plant and equipment (note 5.1).
14.3.1 AdditionaldisclosureunderSRO24(1)2012
If EPQL were to follow IAS 39 and had accounted for embedded derivatives and had not capitalized the exchange loss on translation of foreign currency borrowing, the effect on the consolidated financial statements line items would be as follows:
For the year ended December 31, 2016
notes to the ConsolidatedfinanCial statements(Amounts in thousand)
Annual Report 2016 165

Non controlling
interest
Unappropriated profit
Property, plant and equipment
Derivative financial assets / (liability)
(Increase) / Decrease
(Increase) / Decrease
Increase / (Decrease)
Increase / (Decrease)
------------------------------Rupees------------------------------
As at January 1, 2015 204,741 2,004,544 (1,984,722) (224,563)
For the year ended December 31, 2015- Recognition of exchange loss 80,038 177,235 (257,273) - - Change in fair value of derivatives 835,473 1,850,073 - (2,685,546)
915,511 2,027,308 (257,273) (2,685,546)As at December 31, 2015 1,120,252 4,031,852 (2,241,995) (2,910,109)
For the year ended December 31, 2016- Recognition of exchange loss (795) (1,761) 2,556 - - Change in fair value of derivatives 396,210 877,368 - (1,273,578)
395,415 875,607 2,556 (1,273,578)As at December 31, 2016 1,515,667 4,907,459 (2,239,439) (4,183,687)
2016 2015---------------Rupees---------------
15. LOANS, ADVANCES, DEPOSITS AND PREPAYMENTS
Current portion of long term loans and advances to executives and other employees (note 10) 180,592 209,270 Advances to executives and other employees (note 15.1) 25,354 57,745 Current portion of receivable from SSGCL (note 10) 21,966 18,372 Advance and deposits 514,732 422,077 Prepayments:- insurance 231,897 253,095 - others 460,560 592,848
1,435,101 1,553,407 Less: Provision for impairment - 3,509
1,435,101 1,549,898
15.1 These includes interest free advances to executives for house rent, given in accordance with the Group’s policy.
15.2 The carrying values of the loan and advances are neither past due nor impaired. The credit quality of these financial assets can be assessed with reference to no defaults ever.
For the year ended December 31, 2016
notes to the ConsolidatedfinanCial statements(Amounts in thousand)
166 Dawood Hercules Corporation Limited

2016 201516. OTHER RECEIVABLES ---------------Rupees---------------
Receivable from Government of Pakistan against:- Sales tax refundable 1,079,652 4,255,640 - Subsidy (note 16.1) 6,309,486 1,303,180 Less: Provision for impairment (note 16.6) - 180,140
7,389,138 5,378,680
- Special excise duty refundable (note 16.2) 36,687 36,687 Less: Provision for impairment (note 16.6) 36,687 36,687
- -
- Customs duty claims refundable (note 16.3) 18,043 18,043 Less: Provision for impairment (note 16.6) 18,043 18,043
- -
- Others 211,762 194,713 7,600,900 5,573,393
Delayed payment charges (note 16.4) 1,021,505 1,066,282 Reimbursable cost from NTDC in respect of:- Workers’ profits participation fund 236,385 263,881 - Workers’ welfare fund 205,638 205,638
Receivable from:- Tetra Pak Pakistan Limited - 462,509 - Ecolean AB - 132,474 - Engro Vopak Terminal Limited 187 22,148 - GEL Utility Limited 83,925 83,300 - Tenaga Generasi Limited 13,916 33,772 - Engro Foundation 1,801 9 - Sindh Engro Coal Mining Company Limited 1,427 2,086 - Thar Power Company Limited 146 627 - Engro Foods Limited 7,123 - - FrieslandCampina Pakistan Holding B.V. (note 2.1.4) 197,542 -
Claims on suppliers and insurance companies 1,629 10,278
Others (note 16.7) 212,090 183,422 Less: Provision for impairment (note 16.6) - 35,718
212,090 147,704
9,584,214 8,004,101
16.1 During 2015, the Government of Pakistan had notified payment of subsidy at the rate of Rs. 500 per 50 kg bag of Di-Ammonia Phosphate (DAP), Rs. 217 per 50 kg bag of Nitrophos (N) and Nitrogen, Phosphorous and Potassium (NPK) fertilizers (based on phosphorous content) sold. This subsidy scheme was effective till May 27, 2016.
During the current year, another subsidy scheme was announced by the Government of Pakistan effective June 25, 2016 and onwards. Through this scheme the Government has notified payment of subsidy on sold product at the rate of Rs. 156 per 50 kg bag of Urea, Rs. 300 per 50 kg bag of DAP and for Nitrophos 22:20 & 18:18 grade (based on phosphorus content) and Nitrogen, Phosphorus and Potassium (NPK) fertilizers (based on phosphorus content) sold.
For the year ended December 31, 2016
notes to the ConsolidatedfinanCial statements(Amounts in thousand)
Annual Report 2016 167

16.2 During the year 2007, Special Excise Duty (SED) amounting to Rs. 91,616 was paid on import of certain fixed assets by EPCL. Out of the total SED paid, an amount of Rs. 54,299 was adjusted through input claim in sales tax returns. Subsequently, the remaining amount of Rs. 36,687 could not be adjusted as the said duty was disallowed as adjustment from output tax under section 7 of Sales Tax Act, 1990. Therefore, full provision has been recognized thereagainst on the basis of prudence. However, EPCL is pursuing the recovery of the remaining amount from the tax authorities based on the view that the SED can be recovered as it was paid prior to the change in the Sales Tax Act.
16.3 The Customs Appellate Tribunal, Karachi Bench, through its order dated October 31, 2011, disposed off appeal of Engro Polymer and Chemicals Limited (EPCL) filed on April 11, 2008 against the order of Collector of Customs, Port Muhammad Bin Qasim, Karachi, for the refund of custom duty paid during the period June 16, 2006 to July 24, 2006 on imports of Vinyl Chloride Monomer (VCM). The Tribunal was informed that all aforementioned VCM consignments were released after the issuance of SRO 565(1)/2006 dated June 6, 2006 and the benefit of five percent duty reduction was also passed on to the customers. However, as the price of the EPCL’s product was increased which is linked with international market, the Tribunal inadvertently presumed that the said benefit had not been transferred to the customers and passed an order against EPCL. EPCL has filed an appeal with the High Court of Sindh against the aforesaid order of the Tribunal. However, based on prudence, EPCL is maintaining full provision against the aforementioned custom duty refundable till such time that all available legal courses are exhausted.
16.4 Represents mark-up receivable on overdue trade debts of Engro Powergen Qadirpur Limited , as delayed payment charges from NTDC in accordance with the terms of the PPA. These include mark-up over due amounting to Rs 958,029 (2015: Rs 1,040,167).
16.5 As at December 31, 2016 other receivables aggregating to Rs 1,024,033 (2015: Rs 1,107,713) were past due but not impaired. The aging analysis of these receivables is as follows:
2016 2015---------------Rupees---------------
Upto 3 months 35,384 96,894 3 to 6 months 44,152 59,919 More than 6 months 944,497 950,900
1,024,033 1,107,713
16.6 As at December 31, 2016, receivables aggregating to Rs 54,730 (2015: Rs 270,588) were deemed to be impaired being outstanding for more than six months and provided for. The movement in provision during the year is as follows:
2016 2015---------------Rupees---------------
Balance as at January 1 270,588 55,414 Add: (Reversal) / provision made during the year - net (215,858) 215,174 Balance as at December 31 54,730 270,588
16.7 These includes receivable from the associates of the Holding Company aggregating to Rs 15,142 (2015: Rs 114,258).
For the year ended December 31, 2016
notes to the ConsolidatedfinanCial statements(Amounts in thousand)
168 Dawood Hercules Corporation Limited

2016 2015---------------Rupees---------------
17. SHORT TERM INVESTMENTS
At fair value through profit or loss
Fixed income placements (note 17.1) 1,786,782 52,000 Treasury Bills (note 17.2) 60,864,369 11,775,935
62,651,151 11,827,935
Held to maturityFixed income placements (note 17.1) 1,225,000 1,117,643 Treasury Bills 849,376 488,700 Eurobonds - 615,834
2,074,376 2,222,177
64,725,527 14,050,112
17.1 These represents foreign and local currency deposits with various banks, at the interest rates ranging upto 7.00% (2015: 9.75%) per annum.
17.2 These represent treasury bills carrying interest at the rate ranging upto 6.68% (2015: 6.42%) per annum. These have maturity dates of upto one year from reporting date.
2016 2015---------------Rupees---------------
18. CASH AND BANK BALANCES
Balances with banks in: - deposit accounts (notes 18.1 and 18.2) 5,356,229 2,521,480 - current accounts 785,372 1,736,974
Cheques / demand drafts in hand 38,068 853,005 Cash in hand 6,998 8,898
6,186,667 5,120,357
18.1 Local currency deposits carry return up to the rate of 3.43% to 5.75% (2015: 4.00% to 7.50%) per annum.
18.2 Includes Rs 641,747 (2015: Rs 1,193,568) held in foreign currency bank accounts and carry return at the rate of 1.00% (2015: 0.71%) per annum.
For the year ended December 31, 2016
notes to the ConsolidatedfinanCial statements(Amounts in thousand)
Annual Report 2016 169

19. disContinued oPerations
19.1 As explained in note 2.1.4, ECL has disposed-off its partial investment in EFoods resulting in loss of control as at December 19, 2016. As a result, assets and liabilities of EFoods have been classified as assets and liabilities attributable to discontinued operation, a summary of which is as follows:
December 19,2016
RupeesAssets attributable to discontinued operation
Property, plant and equipment 13,120,693 Biological assets 932,726 Intangible assets 44,378 Long term advances and deposits 93,984 Deferred employee share option compensation expense 108,942 Stores, spares and loose tools 841,394 Stock-in-trade 3,861,318 Trade debts 69,654 Advances, deposits and prepayments 144,879 Other receivables 114,661 Sales tax recoverable 2,736,249 Taxes recoverable 2,039,370 Cash and bank balances 702,944 Total Assets 24,811,192
Liabilities associated with discontinued operations
Long term finances 2,195,988 Short term finances 65,120 Deferred taxation 1,605,824 Deferred income 522 Accrued interest / mark-up 31,565 Accrued and other liabilities 3,664,234 Total Liabilities 7,563,253
Net assets attributable to discontinued operations as at December 19, 2016 17,247,939
For the period from January
1, 2016 to December 19,
2016
For the period from January
1, 2015 to December 31,
2015---------------Rupees---------------
Financial performance of discontinued operations (note 2.1.4)
Net sales 43,328,112 49,834,089 Cost of sales (33,400,229) (38,303,002)Gross profit 9,927,883 11,531,087
Distribution and marketing expenses (4,879,987) (4,952,143)Administrative expenses (880,942) (1,385,412)Other operating expenses (331,682) (368,648)Other income 137,989 325,520
Operating profit 3,973,261 5,150,404
For the year ended December 31, 2016
notes to the ConsolidatedfinanCial statements(Amounts in thousand)
170 Dawood Hercules Corporation Limited

For the period from January
1, 2016 to December 19,
2016
For the period from January
1, 2015 to December 31,
2015---------------Rupees---------------
Finance cost (341,119) (856,419)
Profit before taxation 3,632,142 4,293,985 Taxation (1,148,011) (1,131,530)Profit after tax from discontinued operations 2,484,131 3,162,455 Gain on disposal of investment in subsidiary- net of tax 34,342,608 - Gain due to recognition of retained interest in subsidiary
(now associate) at fair value 24,337,818 - Less: Tax on recognition of investmnet at fair value 478,244 - Gain due to recognition of retained interest in subsidiary
(now associate) at fair value, net of tax 23,859,574 - Profit for the year 60,686,313 3,162,455 Other comprehensive income/ (loss) from discontinued operation 12,168 (22,675)Profit after tax from discontinued operation 60,698,481 3,139,780 Cash flows attributable to discontinued operations (note 2.1.4)Net cash generated from operating activities 5,121,505 4,516,967 Net cash utilized in investing activities (1,188,097) (790,020)Net cash utilized in financing activities (3,175,878) (1,721,870)Net increase in cash and cash equivalents 757,530 2,005,077
20. SHARE CAPITAL
20.1 authorized share capital
2016 2015 2016 2015---------Number of shares--------- ---------------Rupees---------------
1,000,000,000 1,000,000,000 Ordinary shares of Rs 10 each 10,000,000 10,000,000
20.2 issued, subscribed and paid-up share capital
2016 2015 2016 2015---------Number of shares--------- ---------------Rupees---------------
Ordinary shares of Rs 10 each fully paid in cash 13,900,000 13,900,000 139,000 139,000
Ordinary shares of Rs 10 each issued as fully
467,387,116 467,387,116 paid bonus shares 4,673,871 4,673,871
481,287,116 481,287,116 4,812,871 4,812,871
For the year ended December 31, 2016
notes to the ConsolidatedfinanCial statements(Amounts in thousand)
Annual Report 2016 171

2016 2015------- (Number of shares) -------
20.3 Shares held by related parties
Dawood Lawrencepur Limited 77,931,896 77,931,896 Percentage of holding 16.19% (2015: 16.19%)
The Dawood Foundation 18,991,988 18,991,988 Percentage of holding 3.95% (2015: 3.95%)
Cyan Limited 794,380 794,380 Percentage of holding 0.165% (2015: 0.165%)
Sach International (Private) Limited 6,996 6,996 Percentage of holding 0.001% (2015: 0.001%)
21. MAINTENANCE RESERVE
In accordance with the Power Purchase Agreement (PPA), Engro Powergen Qadirpur Limited (EPQL) is required to establish and maintain a separate reserve fund (the Fund) with a depository institution for payment of major maintenance expenses. Any interest income resulting from the depository arrangements of the Fund is to remain in the Fund to the extent of any shortfall from the contractual limit.
Under the PPA, 1/24th of the annual operating and maintenance budget of the Power Plant less fuel expenses is required to be deposited into the Fund on each capacity payment date until such reserve equals to nine such deposits. After the second agreement year and thereafter the Fund may be re-established at such other level that EPQL and NTDC mutually agree.
In 2012, EPQL due to uncertain cash flows resulting from delayed payments by NTDC has, as per flexibility available under the PPA, reduced the amount deposited in a schedule bank to Rs. 50,000, which has been invested in investment certificates as at December 31, 2016 (note 17). Till such time the amount is deposited again to the required level, EPQL has unutilized short term financing available to meet any unexpected maintenance requirements that may arise in the foreseeable future.
2016 2015---------------Rupees---------------
22. HEDGING RESERVE
Fair values of :
- Forward foreign exchange contracts (note 14.1) (22,939) (24,525)- Interest rate swaps (note 14.2) (4,018) (9,278)
(26,957) (33,803)Less:
- Deferred tax 2,717 3,436 - Non-Controlling interest (8,490) (4,092)
(5,773) (656)
(32,730) (34,459)
For the year ended December 31, 2016
notes to the ConsolidatedfinanCial statements(Amounts in thousand)
172 Dawood Hercules Corporation Limited

2016 2015---------------Rupees---------------
23. BORROWINGS - secured (non-participatory)
Engro Rupiya Certificates (note 23.1) 3,983,839 3,966,617 Islamic Finances (note 23.2) 7,689,810 8,903,580 Conventional Finances (note 23.3) 39,308,507 27,923,449 Term Finance Certificates (note 23.4) - 6,000,000 Foreign currency borrowings and others (note 23.5) 26,025,309 16,781,535
77,007,465 63,575,181 Less:
Current portion shown under current liabilities 13,272,722 22,692,902 63,734,743 40,882,279
Installments 2016 201523.1 Engro Rupiya Certificates Note Mark-up
NumberCommenced/
Commencing from----------------Rupees----------------
Engro Islamic Rupiya Certificates I 23.1.1 13% Lump sum 2,987,879 2,974,963 Engro Islamic Rupiya Certificates II 23.1.1 13.5% Lump sum 995,960 991,654
3,983,839 3,966,617
23.2 Islamic Finances
Dubai Islamic Bank Limited 23.3.6 6 months KIBOR + 0.4% 4 half yearly November 30, 2018 800,000 800,000 Privately Placed Subordinated Sukuk Certificates 23.2.1 6 months KIBOR + 1.75% 10 half yearly January 9, 2015 2,860,174 3,006,272 Standard Chartered Bank (Pakistan) Limited 6 Months KIBOR + 0.9% 4 half yearly June 14, 2013 594,942 593,090 Standard Chartered Bank (Pakistan) Limited 23.2.2 6 Months KIBOR + 0.8% 1 half yearly March 18, 2016 1,000,000 - Islamic Offshore Finance 23.2.3 6 months LIBOR + 2.57% 9 half yearly March 28, 2013 1,762,711 3,525,468 Sukuk Certificates 6 month KIBOR + 0.69% 4 half yearly July 13, 2015 - 878,750 Islamic Facility Agreement 23.4.5 3 months KIBOR + 3.5% 20 half yearly 671,983 - Master Istisna IV 6 months KIBOR + 2.6% Single April 2016 - 100,000
7,689,810 8,903,580
For the year ended December 31, 2016
notes to the ConsolidatedfinanCial statements(Amounts in thousand)
Annual Report 2016 173
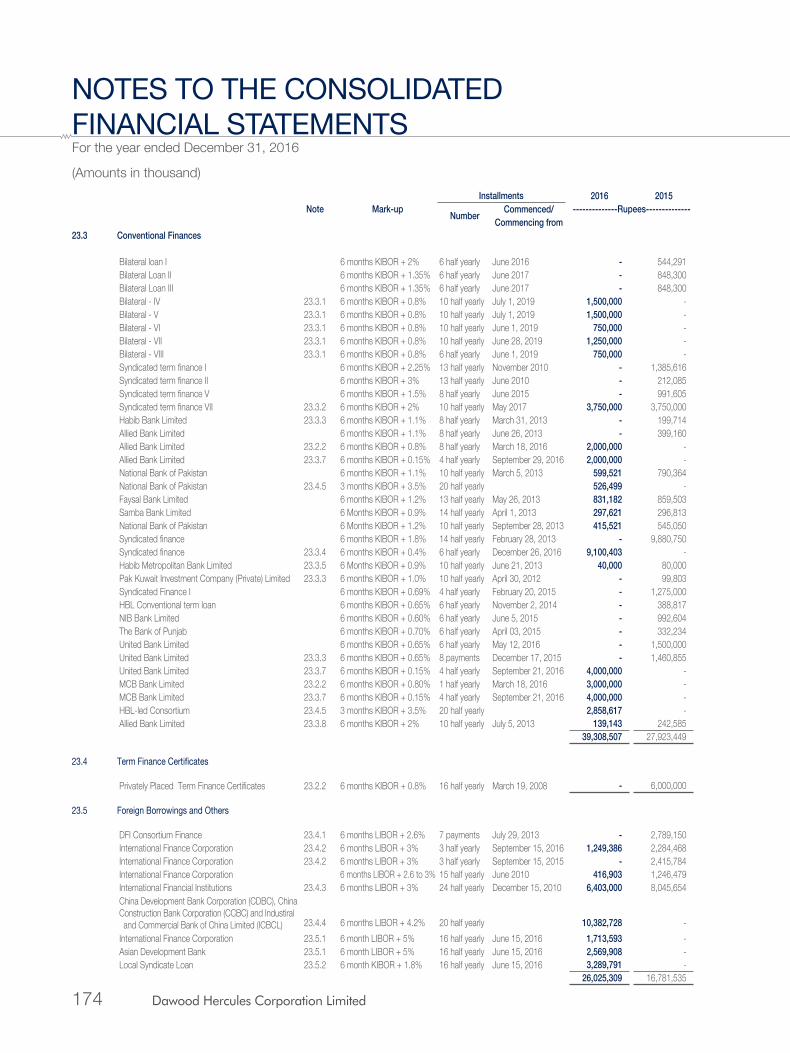
Installments 2016 2015Note Mark-up Number Commenced/
Commencing from--------------Rupees--------------
23.3 Conventional Finances
Bilateral loan I 6 months KIBOR + 2% 6 half yearly June 2016 - 544,291 Bilateral Loan II 6 months KIBOR + 1.35% 6 half yearly June 2017 - 848,300 Bilateral Loan III 6 months KIBOR + 1.35% 6 half yearly June 2017 - 848,300 Bilateral - IV 23.3.1 6 months KIBOR + 0.8% 10 half yearly July 1, 2019 1,500,000 - Bilateral - V 23.3.1 6 months KIBOR + 0.8% 10 half yearly July 1, 2019 1,500,000 - Bilateral - VI 23.3.1 6 months KIBOR + 0.8% 10 half yearly June 1, 2019 750,000 - Bilateral - VII 23.3.1 6 months KIBOR + 0.8% 10 half yearly June 28, 2019 1,250,000 - Bilateral - VIII 23.3.1 6 months KIBOR + 0.8% 6 half yearly June 1, 2019 750,000 - Syndicated term finance I 6 months KIBOR + 2.25% 13 half yearly November 2010 - 1,385,616 Syndicated term finance II 6 months KIBOR + 3% 13 half yearly June 2010 - 212,085 Syndicated term finance V 6 months KIBOR + 1.5% 8 half yearly June 2015 - 991,605 Syndicated term finance VII 23.3.2 6 months KIBOR + 2% 10 half yearly May 2017 3,750,000 3,750,000 Habib Bank Limited 23.3.3 6 months KIBOR + 1.1% 8 half yearly March 31, 2013 - 199,714 Allied Bank Limited 6 months KIBOR + 1.1% 8 half yearly June 26, 2013 - 399,160 Allied Bank Limited 23.2.2 6 months KIBOR + 0.8% 8 half yearly March 18, 2016 2,000,000 - Allied Bank Limited 23.3.7 6 months KIBOR + 0.15% 4 half yearly September 29, 2016 2,000,000 - National Bank of Pakistan 6 months KIBOR + 1.1% 10 half yearly March 5, 2013 599,521 790,364 National Bank of Pakistan 23.4.5 3 months KIBOR + 3.5% 20 half yearly 526,499 - Faysal Bank Limited 6 months KIBOR + 1.2% 13 half yearly May 26, 2013 831,182 859,503 Samba Bank Limited 6 Months KIBOR + 0.9% 14 half yearly April 1, 2013 297,621 296,813 National Bank of Pakistan 6 Months KIBOR + 1.2% 10 half yearly September 28, 2013 415,521 545,050 Syndicated finance 6 months KIBOR + 1.8% 14 half yearly February 28, 2013 - 9,880,750 Syndicated finance 23.3.4 6 months KIBOR + 0.4% 6 half yearly December 26, 2016 9,100,403 - Habib Metropolitan Bank Limited 23.3.5 6 Months KIBOR + 0.9% 10 half yearly June 21, 2013 40,000 80,000 Pak Kuwait Investment Company (Private) Limited 23.3.3 6 months KIBOR + 1.0% 10 half yearly April 30, 2012 - 99,803 Syndicated Finance I 6 months KIBOR + 0.69% 4 half yearly February 20, 2015 - 1,275,000 HBL Conventional term loan 6 months KIBOR + 0.65% 6 half yearly November 2, 2014 - 388,817 NIB Bank Limited 6 months KIBOR + 0.60% 6 half yearly June 5, 2015 - 992,604 The Bank of Punjab 6 months KIBOR + 0.70% 6 half yearly April 03, 2015 - 332,234 United Bank Limited 6 months KIBOR + 0.65% 6 half yearly May 12, 2016 - 1,500,000 United Bank Limited 23.3.3 6 months KIBOR + 0.65% 8 payments December 17, 2015 - 1,460,855 United Bank Limited 23.3.7 6 months KIBOR + 0.15% 4 half yearly September 21, 2016 4,000,000 - MCB Bank Limited 23.2.2 6 months KIBOR + 0.80% 1 half yearly March 18, 2016 3,000,000 - MCB Bank Limited 23.3.7 6 months KIBOR + 0.15% 4 half yearly September 21, 2016 4,000,000 - HBL-led Consortium 23.4.5 3 months KIBOR + 3.5% 20 half yearly 2,858,617 - Allied Bank Limited 23.3.8 6 months KIBOR + 2% 10 half yearly July 5, 2013 139,143 242,585
39,308,507 27,923,449
23.4 TermFinanceCertificates
Privately Placed Term Finance Certificates 23.2.2 6 months KIBOR + 0.8% 16 half yearly March 19, 2008 - 6,000,000
23.5 foreign Borrowings and others
DFI Consortium Finance 23.4.1 6 months LIBOR + 2.6% 7 payments July 29, 2013 - 2,789,150 International Finance Corporation 23.4.2 6 months LIBOR + 3% 3 half yearly September 15, 2016 1,249,386 2,284,468 International Finance Corporation 23.4.2 6 months LIBOR + 3% 3 half yearly September 15, 2015 - 2,415,784 International Finance Corporation 6 months LIBOR + 2.6 to 3% 15 half yearly June 2010 416,903 1,246,479 International Financial Institutions 23.4.3 6 months LIBOR + 3% 24 half yearly December 15, 2010 6,403,000 8,045,654 China Development Bank Corporation (CDBC), China Construction Bank Corporation (CCBC) and Industiral and Commercial Bank of China Limited (ICBCL) 23.4.4 6 months LIBOR + 4.2% 20 half yearly 10,382,728 - International Finance Corporation 23.5.1 6 month LIBOR + 5% 16 half yearly June 15, 2016 1,713,593 - Asian Development Bank 23.5.1 6 month LIBOR + 5% 16 half yearly June 15, 2016 2,569,908 - Local Syndicate Loan 23.5.2 6 month KIBOR + 1.8% 16 half yearly June 15, 2016 3,289,791 -
26,025,309 16,781,535
For the year ended December 31, 2016
notes to the ConsolidatedfinanCial statements(Amounts in thousand)
174 Dawood Hercules Corporation Limited

23.1.1 Engro Islamic Rupiya (EIR) Certificates are AA rated, listed and secured Ijaratul Musha & Murabaha Sukuk certificates of a total issue size of Rs. 4,000,000 duly approved by the Securities and Exchange Commission of Pakistan (SECP). EIR - I Certificates amounting to Rs. 3,000,000 have a tenure of 36 months with an expected profit rate of 13% per annum payable semi-annually, while EIR - II Certificates amounting to Rs. 1,000,000 have a tenure of 60 months with an expected profit rate of 13.5% per annum payable semi-annually. The certificate holder, however, may request ECL for early redemption at any time from the date of investment subject to an Early Redemption Discount service charge on the outstanding issue price. ECL, in this respect, has appointed Meezan Bank Limited as a trustee.
The proceeds from the EIR Certificates I and II were utilized to pay-off conventional liabilities and to meet funding requirements of the subsidiaries and to finance new projects.
23.2.1 This represents EFert Privately Placed Subordinated Sukuk (PPSS) amounting to Rs. 3,200,000. Pak Brunei Investment Company Limited is the Trustee while Meezan Bank Limited acts as the Investment Agent for this Sukuk. EFert used PPSS to refinance the subordinated loan from ECL.
23.2.2 During the year, EFert exercised the call option of the Privately Placed Term Finance Certificates (PPTFCs). As a result, EFert paid Rs. 6,000,000 to the holders of PPTFCs and refinanced this amount through three bilateral loans from Allied Bank Limited, Standard Chartered Bank (Pakistan) Limited and MCB Bank Limited amounting to Rs. 2,000,000 Rs. 1,000,000 and Rs. 3,000,000 respectively. These loans are repayable in a single installment in March 2018 and carry mark up / profit at the rate of 6 months KIBOR plus 0.80%, per annum.
23.2.3 The borrowings also include EFert’s Offshore Islamic Finance Facility of US$ 36,000 with Habib Bank Limited and National Bank of Pakistan and Rs. 3,618,000 with Faysal Bank, Dubai Islamic Bank Pakistan Limited and Standard Chartered Bank. During the year, Habib Bank Limited bought out SAMBA financial group’s portion in the US$ portion of the facility.
23.3.1 During the year, EPCL after negotiations with the relevant banks / financial institutions pre-paid all its existing borrowings, except for loans from IFC and obtained new finances from these financial institutions at renegotiated terms to re-profile its balance sheet at lower interest / mark-up rates. EPCL has obtained new borrowings of Rs. 5,750,000 under the new financing arrangements.
23.3.2 This represents utilised portion of syndicated term finance facility sanctioned by a syndicate of banks led by Allied Bank Limited aggregating to Rs. 4,000,000 (2015: Rs 4,000,000). The facility is secured against HUBCO shares as more fully explained note 8.4. The facility carries mark-up at the rate of six months KIBOR plus 200 basis points per annum. The facility is for a period of 5 years and is payable semi annually with the first principal repayment to be made after the expiry of 2 years grace period commencing from May 2017.
23.3.3 These represents Efert’s loans which have been matured during the year.
23.3.4 This represents the balance amount, availed by EFert in 2016, of a syndicated Finance Agreement entered with National Bank of Pakistan, MCB Bank Limited, Allied Bank, Habib Bank Limited, Bank Alfalah Limited, with National Bank of Pakistan acting as the Agent for the Syndicate members. The loan was made a part of the Inter Creditor Agreeent (ICA) and thus has the same charge, as the other Senior Lenders.
23.3.5 This represents EFert’s outstanding balance amount of a facility agreement amounting to Rs. 200,000 with Habib Metropolitan Bank Limited.
For the year ended December 31, 2016
notes to the ConsolidatedfinanCial statements(Amounts in thousand)
Annual Report 2016 175
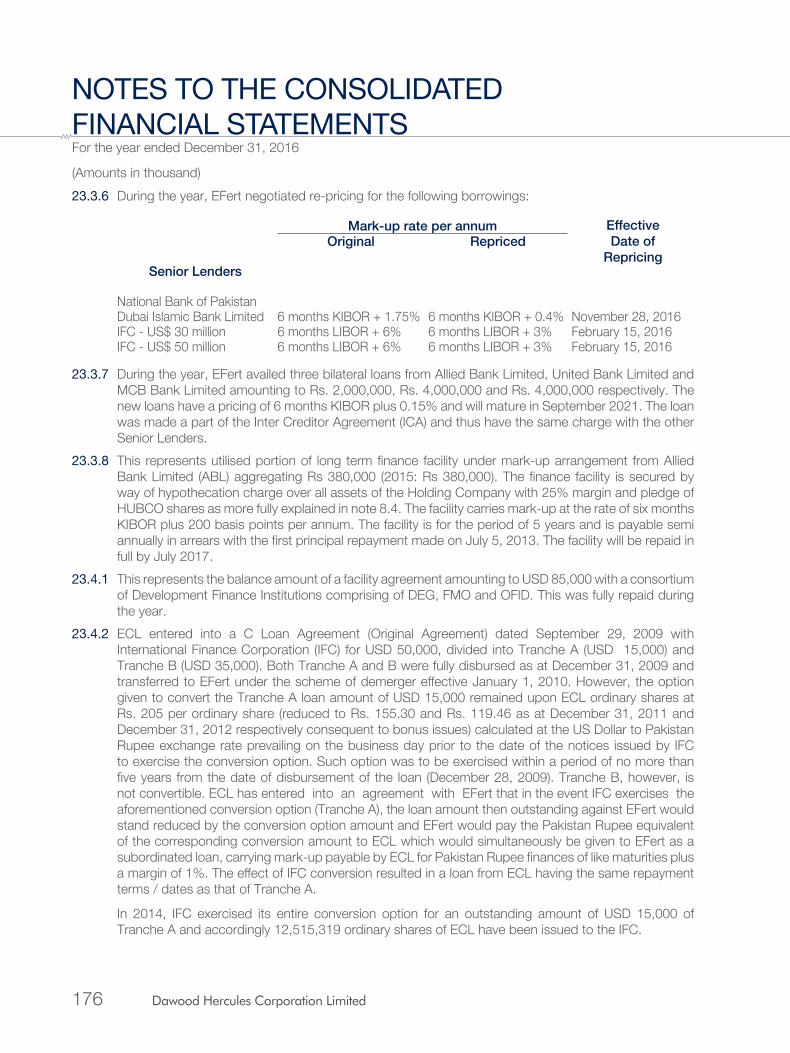
23.3.6 During the year, EFert negotiated re-pricing for the following borrowings:
Mark-up rate per annum Effective Date of
RepricingOriginal Repriced
Senior Lenders
National Bank of PakistanDubai Islamic Bank Limited 6 months KIBOR + 1.75% 6 months KIBOR + 0.4% November 28, 2016IFC - US$ 30 million 6 months LIBOR + 6% 6 months LIBOR + 3% February 15, 2016IFC - US$ 50 million 6 months LIBOR + 6% 6 months LIBOR + 3% February 15, 2016
23.3.7 During the year, EFert availed three bilateral loans from Allied Bank Limited, United Bank Limited and MCB Bank Limited amounting to Rs. 2,000,000, Rs. 4,000,000 and Rs. 4,000,000 respectively. The new loans have a pricing of 6 months KIBOR plus 0.15% and will mature in September 2021. The loan was made a part of the Inter Creditor Agreement (ICA) and thus have the same charge with the other Senior Lenders.
23.3.8 This represents utilised portion of long term finance facility under mark-up arrangement from Allied Bank Limited (ABL) aggregating Rs 380,000 (2015: Rs 380,000). The finance facility is secured by way of hypothecation charge over all assets of the Holding Company with 25% margin and pledge of HUBCO shares as more fully explained in note 8.4. The facility carries mark-up at the rate of six months KIBOR plus 200 basis points per annum. The facility is for the period of 5 years and is payable semi annually in arrears with the first principal repayment made on July 5, 2013. The facility will be repaid in full by July 2017.
23.4.1 This represents the balance amount of a facility agreement amounting to USD 85,000 with a consortium of Development Finance Institutions comprising of DEG, FMO and OFID. This was fully repaid during the year.
23.4.2 ECL entered into a C Loan Agreement (Original Agreement) dated September 29, 2009 with International Finance Corporation (IFC) for USD 50,000, divided into Tranche A (USD 15,000) and Tranche B (USD 35,000). Both Tranche A and B were fully disbursed as at December 31, 2009 and transferred to EFert under the scheme of demerger effective January 1, 2010. However, the option given to convert the Tranche A loan amount of USD 15,000 remained upon ECL ordinary shares at Rs. 205 per ordinary share (reduced to Rs. 155.30 and Rs. 119.46 as at December 31, 2011 and December 31, 2012 respectively consequent to bonus issues) calculated at the US Dollar to Pakistan Rupee exchange rate prevailing on the business day prior to the date of the notices issued by IFC to exercise the conversion option. Such option was to be exercised within a period of no more than five years from the date of disbursement of the loan (December 28, 2009). Tranche B, however, is not convertible. ECL has entered into an agreement with EFert that in the event IFC exercises the aforementioned conversion option (Tranche A), the loan amount then outstanding against EFert would stand reduced by the conversion option amount and EFert would pay the Pakistan Rupee equivalent of the corresponding conversion amount to ECL which would simultaneously be given to EFert as a subordinated loan, carrying mark-up payable by ECL for Pakistan Rupee finances of like maturities plus a margin of 1%. The effect of IFC conversion resulted in a loan from ECL having the same repayment terms / dates as that of Tranche A.
In 2014, IFC exercised its entire conversion option for an outstanding amount of USD 15,000 of Tranche A and accordingly 12,515,319 ordinary shares of ECL have been issued to the IFC.
For the year ended December 31, 2016
notes to the ConsolidatedfinanCial statements(Amounts in thousand)
176 Dawood Hercules Corporation Limited

On December 22, 2010, EFert and IFC entered into an amended agreement for further disbursement of USD 30,000 over and above the aforementioned disbursed amount of USD 50,000. The amount was fully disbursed as at June 30, 2011. The salient features of the Original Loan essentially remained the same and some of the terms of the loan were further amended through an agreement dated January 29, 2014. The additional loan of USD 30,000 is divided into (i) Tranche A2: 30% convertible loan on the shares of EFert at Rs. 24.00 per ordinary share calculated at the US Dollar to Pakistan Rupee exchange rate prevailing on the business day prior to the date of the notices issued by IFC to exercise the conversion option; and (ii) Tranche B2: 70% non-convertible loan. The additional loan is repayable by September 15, 2017 in three equal installments and carries interest at six months LIBOR plus a spread of 6%.
On June 25, 2014, EFert received a notice from IFC for exercise of option on loan of USD 5,000, as a result of which 20,541,667 ordinary shares of EFert have been allotted to IFC. During 2015, EFert received a notice from IFC for exercise of further loan of USD 3,000 on January 9, 2015 out of the remaining USD 4,000 of Tranche A2, accordingly, 12,590,625 ordinary shares of EFert have been allotted to the IFC on January 26, 2015. The fair value of the remaining conversion option, included in derivative financial instruments, amounts to Rs. 194,999.
During the year, the pricing of the IFC loans was revised to 6 months LIBOR plus 3.0% from 6 months LIBOR plus 6.0%, effective February 15, 2016. Furthermore, US$ 50,000 disbursed on December 31, 2009, was fully repaid in September 2016.
23.4.3 EPQL entered into a financing agreement with a consortium comprising of international financial institutions amounting to US$ 144,000. The finance carries markup at the rate of six months LIBOR plus 3% payable semi-annually over a period of twelve years. The principal is repayable in twenty semi-annual instalments commencing from December 15, 2010. As at December 31, 2016, the outstanding balance of the borrowing was US$ 61,394 (2015: US$ 77,146).
The borrowing is secured by an equitable mortgage on the immovable property and the hypothecation of current and future assets of EPQL, except receivables from NTDC in respect of Energy Purchase Price. Further, EPQL has also extended a letter of credit in favour of the senior lenders.
23.4.4 EPTL has entered into a USD Facility Agreement on December 21, 2015 with three commercial banks namely China Development Bank Corporation (CDBC), China Construction Bank Corporation (CCBC) and Industrial and Commercial Bank of China Limited (ICBCL) for an aggregate amount of USD 621,000 for a period of 14 years. The amount is repayable in 20 semi-annual installments commencing from the earlier of (i) First fixed date falling after 48 months since facility effective date and (ii) Second fixed date falling after Commercial Operations Date; where fixed dates are defined as First June or First December of any year. This loan carries mark-up at the rate of 6 month Libor plus 4.2%. The facility is secured primarily through First ranking hypothecation charge over the project assets of EPTL. Further, the shareholders of EPTL have committed to provide cost overrun support for 10% of entire debt and pledge shares in favor of the Security Trustee. Additionally, shareholders other than Habib Bank Limited (HBL) have also provided Stand By Letter of Credits (SBLCs) as coverage for their equity commitments in the project. As at December 31, 2016, EPTL has made draw down of USD 114,542 from this facility while the undrawn amount is equal to USD 506,458.
23.4.5 EPTL has entered into following loan agreements:
- Rupee Facility Agreement with an HBL-led consortium (comprising HBL, United Bank Limited, Bank Alfalah Limited, Askari Bank Limited, Soneri Bank Limited, Sindh Bank Limited, Bank of Punjab, NIB Bank Limited and Pak Brunei Investment Company Limited) for an aggregate amount of Rs.17,016,000. As at December 31, 2016, EPTL has made draw down of Rs. 2,858,617 from this facility while the undrawn amount is equal to Rs. 14,157,382.
For the year ended December 31, 2016
notes to the ConsolidatedfinanCial statements(Amounts in thousand)
Annual Report 2016 177
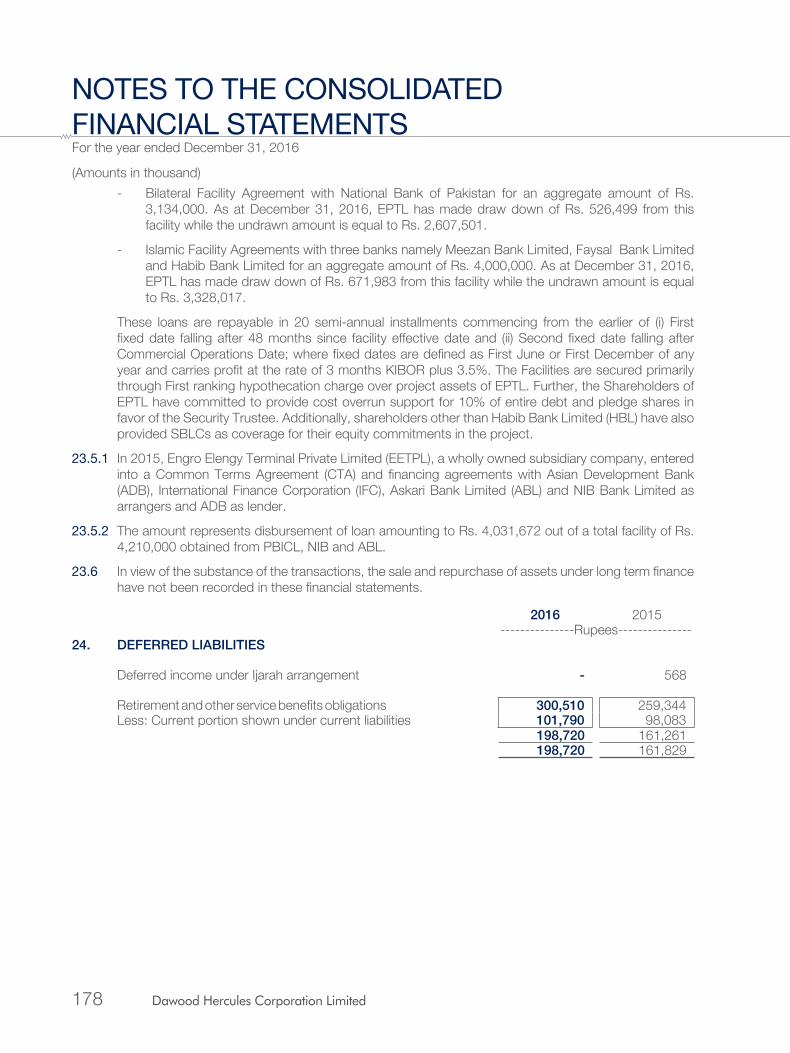
- Bilateral Facility Agreement with National Bank of Pakistan for an aggregate amount of Rs. 3,134,000. As at December 31, 2016, EPTL has made draw down of Rs. 526,499 from this facility while the undrawn amount is equal to Rs. 2,607,501.
- Islamic Facility Agreements with three banks namely Meezan Bank Limited, Faysal Bank Limited and Habib Bank Limited for an aggregate amount of Rs. 4,000,000. As at December 31, 2016, EPTL has made draw down of Rs. 671,983 from this facility while the undrawn amount is equal to Rs. 3,328,017.
These loans are repayable in 20 semi-annual installments commencing from the earlier of (i) First fixed date falling after 48 months since facility effective date and (ii) Second fixed date falling after Commercial Operations Date; where fixed dates are defined as First June or First December of any year and carries profit at the rate of 3 months KIBOR plus 3.5%. The Facilities are secured primarily through First ranking hypothecation charge over project assets of EPTL. Further, the Shareholders of EPTL have committed to provide cost overrun support for 10% of entire debt and pledge shares in favor of the Security Trustee. Additionally, shareholders other than Habib Bank Limited (HBL) have also provided SBLCs as coverage for their equity commitments in the project.
23.5.1 In 2015, Engro Elengy Terminal Private Limited (EETPL), a wholly owned subsidiary company, entered into a Common Terms Agreement (CTA) and financing agreements with Asian Development Bank (ADB), International Finance Corporation (IFC), Askari Bank Limited (ABL) and NIB Bank Limited as arrangers and ADB as lender.
23.5.2 The amount represents disbursement of loan amounting to Rs. 4,031,672 out of a total facility of Rs. 4,210,000 obtained from PBICL, NIB and ABL.
23.6 In view of the substance of the transactions, the sale and repurchase of assets under long term finance have not been recorded in these financial statements.
2016 2015---------------Rupees---------------
24. DEFERRED LIABILITIES
Deferred income under Ijarah arrangement - 568
Retirement and other service benefits obligations 300,510 259,344Less: Current portion shown under current liabilities 101,790 98,083
198,720 161,261 198,720 161,829
For the year ended December 31, 2016
notes to the ConsolidatedfinanCial statements(Amounts in thousand)
178 Dawood Hercules Corporation Limited

2016 2015---------------Rupees---------------
25. TRADE AND OTHER PAYABLES
Creditors (note 25.1) 13,941,425 18,305,509 Accrued liabilities (notes 25.2) 13,809,932 10,728,995 Advances from customers 763,081 2,197,559 Deposits from dealers/ distributors refundable on termination of dealership 18,155 16,297 Retention money 33,442 207,714 Contractors’/ suppliers’ deposits 124,511 103,854 Workers’ welfare fund (note 25.4) 2,055,148 1,982,449 Workers’ profits participation fund 125,940 142,602 Sales tax payable 203,982 125,775 Payable to retirement benefit funds 8,198 80,060 Withholding tax payable 9,718 111,916 Unclaimed dividends 331,571 169,776 Payable to : - Engro Foods Limited 1,943 - - Engro Vopak Limited 33,885 - Others 646,128 446,467
32,107,059 34,618,973
25.1 Includes due to following related parties:
- Mitsubishi Corporation 2,682,171 2,195,710 - Engro Vopak Terminal Limited 120,135 120,135
2,802,306 2,315,845
25.2 Includes:
- professional fee payable to financial advisors Rs.1,193,122 (2015: Nil).
- accrual in respect of gas charges amounting to Rs. 848,844 (2015: Rs. 753,078).
- Rs. 212,193 relating to provisions recognised on prudence basis in respect of certain claims raised against EPQL. The Group, however, is confident of favourable outcome against these claims.
- accrual for Gas Infrastructure Development Cess (GIDC) of Engro Fertilizer Limited (EFert) and Engro Polymer and Chemicals Limited (EPCL) amounting to Rs.1,782,787 (2015: Rs. 789,775) and Rs. 2,129,764 (2015: Rs.1,148,873) respectively. During the year, GIDC Act, 2015 was struck down by the Sindh High Court being ultra vires, against which the Ministry of Petroleum and Natural Resources obtained a suspension order.
25.3 Engro Elengy Terminal (Private) Limited (EETPL)
In 2015, EETPL, a wholly owned subsidary of Elengy Terminal Pakistan Limited (EPTL), received a notice from Model Customs Collectorate (the ‘Customs Authorities’) seeking information on import of FSRU and contending that the import attracts all leviable duties and taxes i.e. customs duty and advance income tax. EETPL was of the view that the FSRU had been classified as plant, machinery and equipment vide SRO 337(I)/2015 dated April 22, 2015 and accordingly, along with sales tax, custom duty is also exempt under SRO 678(I)/2004 dated August 7, 2004, read with condition (vii) relating to
For the year ended December 31, 2016
notes to the ConsolidatedfinanCial statements(Amounts in thousand)
Annual Report 2016 179

the clause 2(a), being of the nature of import-cum-export or temporary import of plant, machinery and equipment. Further, since the EETPL’s profits and gains are exempt from income tax for 5 years from the date of commercial operations, EETPL is also entitled to exemption from collection of advance income tax. The Customs Authorities were not in agreement with EETPL’s views on the same and to treat import of FSRU for 15 years as a temporary import. The Company in response filed a suit with the High Court of Sindh (the ‘Court’) which through its order dated June 29, 2015 had restrained Customs Authorities from collection of customs duty and advance income tax. However, EETPL, based on the merits of the case and opinion of its legal advisor had provided for the potential exposure relating to customs duty amounting to Rs. 1,297,737, being 5% of the value of FSRU. The Court, in a judgement passed during the year, held EETPL liable to custom duty and remanded the matter related to advance tax to Customs Authorities with directions. EETPL in response to the aforementioned judgement and demand raised by Customs Authorities has paid an amount of Rs. 1,325,103 in respect of custom duty.
25.4 During the year, the Supreme Court of Pakistan issued a judgment dated November 11, 2016, as a result of which changes made through the Finance Acts of 2006 and 2008 in the Workers’ Welfare Ordinance, 1971 have been held to be ultra-vires to the Constiution. However, the taxation authorities have proceeded to file a review petition thereagainst in the Supreme Court of Pakistan.Due to review and other legal uncertainities, the Group continues to carry payable in respect of those entities which did not attract the levy prior to the changes brought by Finance Act 2006 and 2008.
During 2015, the Government of Sindh promulgated Sindh Workers Welfare Fund Act, 2014 (the Act) thereby repealing the Workers Welfare Ordinance, 1971 (the Ordinance) in its application to the province of Sindh. As per the Act, every industrial establishment located in province of Sindh whose total income for any year of account commencing on or after December 31, 2013, is not less than Rs. 500 is required to pay a sum equal to 2% of total income to the Sindh Revenue Board (SRB). However, the management based on advice of its tax consultant, is of the view that ECL does not classify as an “industrial establishment” as defined under clause 2(g) of the Act and accordingly is not liable for Workers’ welfare fund under the Act. Accordingly, no charge for current year and for the year 2015, under the Act, has been recognized in the financial statements.
2016 201526. ACCRUED INTEREST / MARK-UP ---------------Rupees---------------
Accrued interest / mark-up on secured:
- long term borrowings 913,765 970,231 - short term borrowings 324,296 457,558
1,238,061 1,427,789 27. SHORT TERM BORROWINGS
Running finances utilized under mark-up arrangements (note 27.1) 7,304,519 5,528,453 Export refinance facility 300,000 - Money market loan 800,000 - Short term finance - 1,080,000
8,404,519 6,608,453
For the year ended December 31, 2016
notes to the ConsolidatedfinanCial statements(Amounts in thousand)
180 Dawood Hercules Corporation Limited
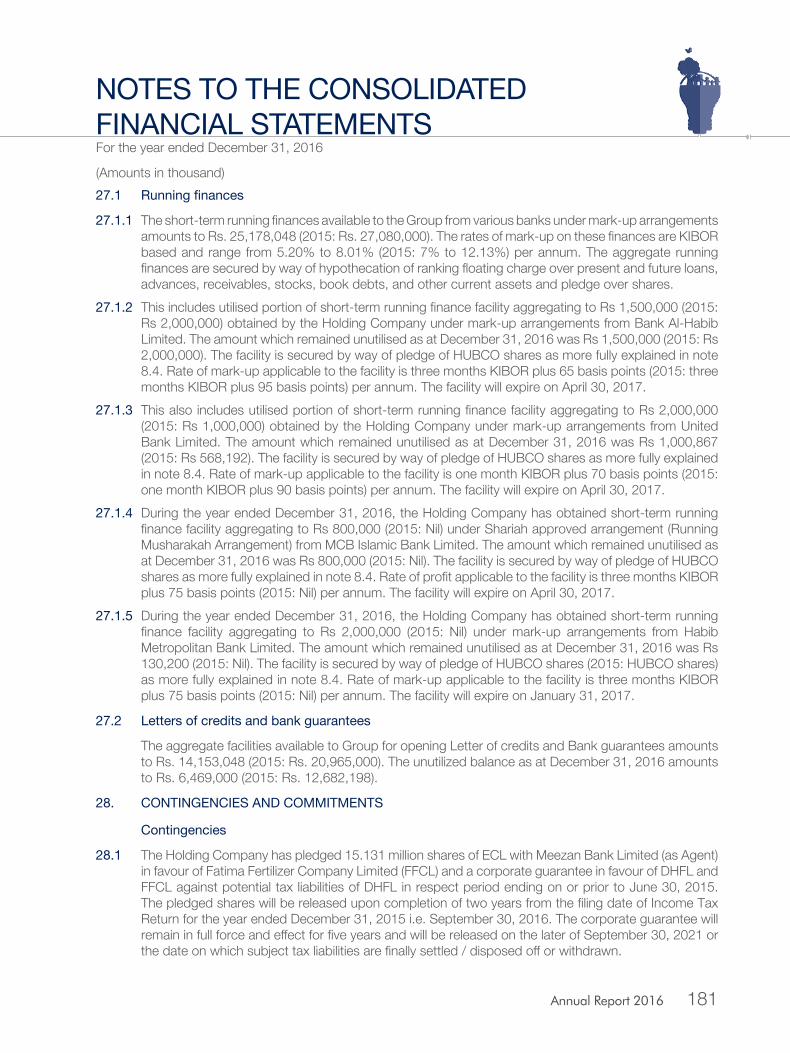
27.1 Runningfinances
27.1.1 The short-term running finances available to the Group from various banks under mark-up arrangements amounts to Rs. 25,178,048 (2015: Rs. 27,080,000). The rates of mark-up on these finances are KIBOR based and range from 5.20% to 8.01% (2015: 7% to 12.13%) per annum. The aggregate running finances are secured by way of hypothecation of ranking floating charge over present and future loans, advances, receivables, stocks, book debts, and other current assets and pledge over shares.
27.1.2 This includes utilised portion of short-term running finance facility aggregating to Rs 1,500,000 (2015: Rs 2,000,000) obtained by the Holding Company under mark-up arrangements from Bank Al-Habib Limited. The amount which remained unutilised as at December 31, 2016 was Rs 1,500,000 (2015: Rs 2,000,000). The facility is secured by way of pledge of HUBCO shares as more fully explained in note 8.4. Rate of mark-up applicable to the facility is three months KIBOR plus 65 basis points (2015: three months KIBOR plus 95 basis points) per annum. The facility will expire on April 30, 2017.
27.1.3 This also includes utilised portion of short-term running finance facility aggregating to Rs 2,000,000 (2015: Rs 1,000,000) obtained by the Holding Company under mark-up arrangements from United Bank Limited. The amount which remained unutilised as at December 31, 2016 was Rs 1,000,867 (2015: Rs 568,192). The facility is secured by way of pledge of HUBCO shares as more fully explained in note 8.4. Rate of mark-up applicable to the facility is one month KIBOR plus 70 basis points (2015: one month KIBOR plus 90 basis points) per annum. The facility will expire on April 30, 2017.
27.1.4 During the year ended December 31, 2016, the Holding Company has obtained short-term running finance facility aggregating to Rs 800,000 (2015: Nil) under Shariah approved arrangement (Running Musharakah Arrangement) from MCB Islamic Bank Limited. The amount which remained unutilised as at December 31, 2016 was Rs 800,000 (2015: Nil). The facility is secured by way of pledge of HUBCO shares as more fully explained in note 8.4. Rate of profit applicable to the facility is three months KIBOR plus 75 basis points (2015: Nil) per annum. The facility will expire on April 30, 2017.
27.1.5 During the year ended December 31, 2016, the Holding Company has obtained short-term running finance facility aggregating to Rs 2,000,000 (2015: Nil) under mark-up arrangements from Habib Metropolitan Bank Limited. The amount which remained unutilised as at December 31, 2016 was Rs 130,200 (2015: Nil). The facility is secured by way of pledge of HUBCO shares (2015: HUBCO shares) as more fully explained in note 8.4. Rate of mark-up applicable to the facility is three months KIBOR plus 75 basis points (2015: Nil) per annum. The facility will expire on January 31, 2017.
27.2 letters of credits and bank guarantees
The aggregate facilities available to Group for opening Letter of credits and Bank guarantees amounts to Rs. 14,153,048 (2015: Rs. 20,965,000). The unutilized balance as at December 31, 2016 amounts to Rs. 6,469,000 (2015: Rs. 12,682,198).
28. ContingenCies and Commitments
Contingencies
28.1 The Holding Company has pledged 15.131 million shares of ECL with Meezan Bank Limited (as Agent) in favour of Fatima Fertilizer Company Limited (FFCL) and a corporate guarantee in favour of DHFL and FFCL against potential tax liabilities of DHFL in respect period ending on or prior to June 30, 2015. The pledged shares will be released upon completion of two years from the filing date of Income Tax Return for the year ended December 31, 2015 i.e. September 30, 2016. The corporate guarantee will remain in full force and effect for five years and will be released on the later of September 30, 2021 or the date on which subject tax liabilities are finally settled / disposed off or withdrawn.
For the year ended December 31, 2016
notes to the ConsolidatedfinanCial statements(Amounts in thousand)
Annual Report 2016 181

2016 2015---------------Rupees---------------
28.2 Guarantees issued in favour of Subsidiary Companies by Engro Corporation Limited:
- Engro Fertilizers Limited (note 28.2.1) 1,257,600 30,905,573 - Engro Powergen Qadirpur Limited (note 28.2.2) 1,048,000 1,047,500 - Engro Powergen Limited (note 28.2.3) 9,544,136 228,000 - Engro Elengy Terminal (Private) Limited (note 28.2.4) 3,217,360 3,320,575
15,067,096 35,501,648 Others 1,535,000 610,000
16,602,096 36,111,648
28.2.1 During the year, corporate guarantees extended on behalf of Engro Fertilizers Limited, a subsidiary company, other than those extended to International Finance Corporation (IFC) under the C Loan Agreement (Original Agreement) and the Amended Facility Agreement amounting to USD 12,000 have been released.
28.2.2 Represents Corporate Guarantee amounting to USD 10,000 issued to Allied Bank Limited to open DSRA letter of credit in favour of senior long term lenders of Engro Powergen Qadirpur Limited (EPQL).
28.2.3 ECL has provided following corporate guarantees in favour of Engro Powergen Limited:
- During 2015, a bank has issued performance guarantee on behalf of Engro Powergen Thar (Private) Limited (EPTL) in favour of Private Power and Infrastructure Board (PPIB). The performance guarantee relates to 2 x 330 MW mine mouth power plants to be constructed by EPTL and has been submitted to PPIB as a condition precedent for the issuance of Letter of Support (LoS) by PPIB for the Thar Power Project. The performance guarantee was valid upto March 30, 2016 and was further extended upto September 30, 2016 and is secured by way of first exclusive charge on all present and future assets of Engro Powergen Limited (EPL), a wholly owned subsidiary of ECL and parent company of EPTL. In this regard, the ECL has extended corporate guarantee amounting to Rs. 228,000 to the bank against Letter of Guarantee facility granted to EPL which was released during the year.
- During the year, ECL has pledged shares of Engro Fertilizers Limited and Engro Foods Limited against the Standby Letters of Credit (Equity SBLCs) provided by Engro Powergen Limited, a subsidiary company, through National Bank of Pakistan amounting to USD 18,900 and USD 51,100 (in PKR equivalent) for its equity commitments related to the Sindh Engro Coal Mining Company Limited (SECMC), its associated company, and Engro Powergen Thar (Pvt.) Limited (EPTL), its subsidiary company, in favour of the Intercreditor Agent (Habib Bank Limited) and the Project Companies (i.e. SECMC and EPTL). Equity SBLCs expire on earlier of (i) four years after the issuance of SBLCs i.e. March 21, 2020; and (ii) fulfillment of sponsor obligations under Sponsor Support Agreements. Subsequent to equity injection during the year after Financial Close amounting to USD 335 and USD 9,064 (in PKR equivalent) in SECMC and EPTL respectively, the amount of Equity SBLCs have been reduced to USD 18,565 and USD 42,036 for SECMC and EPTL respectively.
-
During the year, ECL has pledged shares of Engro Fertilizers Limited and Engro Foods Limited against a Standby Letter of Credit (Put Option SBLC) provided by Engro Powergen Limited, the subsidiary company through Allied Bank of Pakistan amounting to USD 21,070 in favour of the Put Option Fronting Bank (Habib Bank Limited). The Put Option SBLC has been furnished to meet sponsor obligations under Sponsor Support Agreement (Put Option SSA) and expires on earlier of (i) June 30, 2017; and (ii) fulfillment of sponsor obligations pursuant to Put Option SSA.
For the year ended December 31, 2016
notes to the ConsolidatedfinanCial statements(Amounts in thousand)
182 Dawood Hercules Corporation Limited
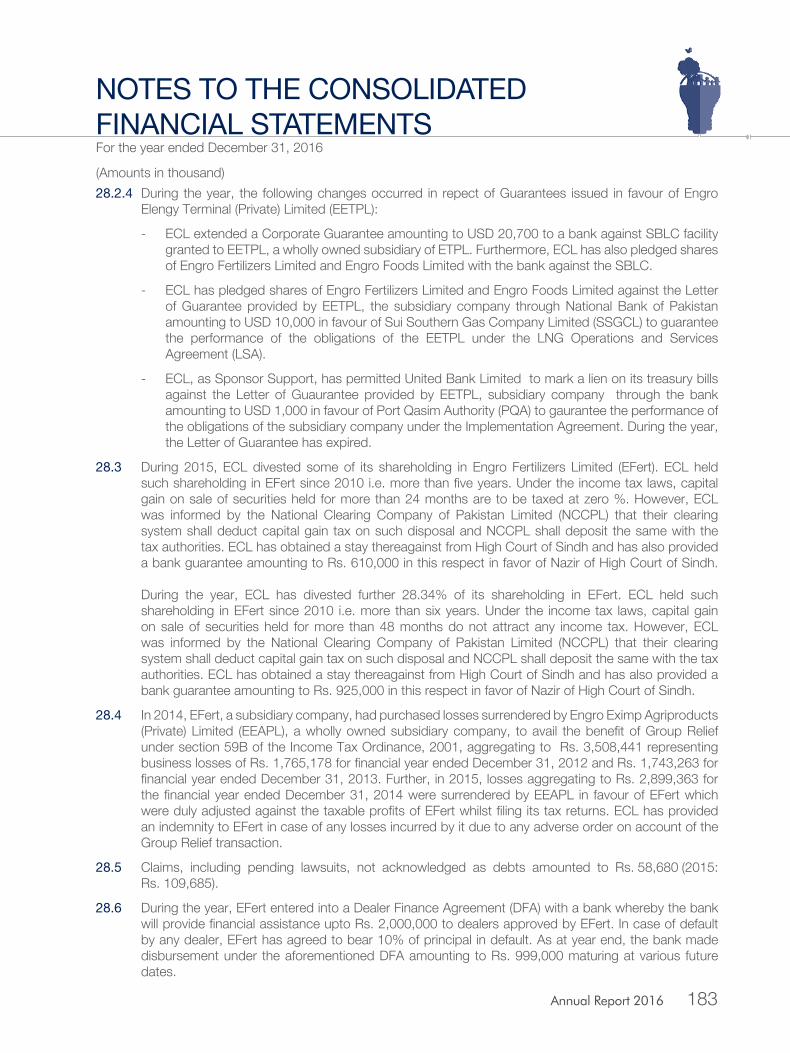
28.2.4 During the year, the following changes occurred in repect of Guarantees issued in favour of Engro Elengy Terminal (Private) Limited (EETPL):
- ECL extended a Corporate Guarantee amounting to USD 20,700 to a bank against SBLC facility granted to EETPL, a wholly owned subsidiary of ETPL. Furthermore, ECL has also pledged shares of Engro Fertilizers Limited and Engro Foods Limited with the bank against the SBLC.
- ECL has pledged shares of Engro Fertilizers Limited and Engro Foods Limited against the Letter of Guarantee provided by EETPL, the subsidiary company through National Bank of Pakistan amounting to USD 10,000 in favour of Sui Southern Gas Company Limited (SSGCL) to guarantee the performance of the obligations of the EETPL under the LNG Operations and Services Agreement (LSA).
- ECL, as Sponsor Support, has permitted United Bank Limited to mark a lien on its treasury bills against the Letter of Guaurantee provided by EETPL, subsidiary company through the bank amounting to USD 1,000 in favour of Port Qasim Authority (PQA) to gaurantee the performance of the obligations of the subsidiary company under the Implementation Agreement. During the year, the Letter of Guarantee has expired.
28.3 During 2015, ECL divested some of its shareholding in Engro Fertilizers Limited (EFert). ECL held such shareholding in EFert since 2010 i.e. more than five years. Under the income tax laws, capital gain on sale of securities held for more than 24 months are to be taxed at zero %. However, ECL was informed by the National Clearing Company of Pakistan Limited (NCCPL) that their clearing system shall deduct capital gain tax on such disposal and NCCPL shall deposit the same with the tax authorities. ECL has obtained a stay thereagainst from High Court of Sindh and has also provided a bank guarantee amounting to Rs. 610,000 in this respect in favor of Nazir of High Court of Sindh. During the year, ECL has divested further 28.34% of its shareholding in EFert. ECL held such shareholding in EFert since 2010 i.e. more than six years. Under the income tax laws, capital gain on sale of securities held for more than 48 months do not attract any income tax. However, ECL was informed by the National Clearing Company of Pakistan Limited (NCCPL) that their clearing system shall deduct capital gain tax on such disposal and NCCPL shall deposit the same with the tax authorities. ECL has obtained a stay thereagainst from High Court of Sindh and has also provided a bank guarantee amounting to Rs. 925,000 in this respect in favor of Nazir of High Court of Sindh.
28.4 In 2014, EFert, a subsidiary company, had purchased losses surrendered by Engro Eximp Agriproducts (Private) Limited (EEAPL), a wholly owned subsidiary company, to avail the benefit of Group Relief under section 59B of the Income Tax Ordinance, 2001, aggregating to Rs. 3,508,441 representing business losses of Rs. 1,765,178 for financial year ended December 31, 2012 and Rs. 1,743,263 for financial year ended December 31, 2013. Further, in 2015, losses aggregating to Rs. 2,899,363 for the financial year ended December 31, 2014 were surrendered by EEAPL in favour of EFert which were duly adjusted against the taxable profits of EFert whilst filing its tax returns. ECL has provided an indemnity to EFert in case of any losses incurred by it due to any adverse order on account of the Group Relief transaction.
28.5 Claims, including pending lawsuits, not acknowledged as debts amounted to Rs. 58,680 (2015: Rs. 109,685).
28.6 During the year, EFert entered into a Dealer Finance Agreement (DFA) with a bank whereby the bank will provide financial assistance upto Rs. 2,000,000 to dealers approved by EFert. In case of default by any dealer, EFert has agreed to bear 10% of principal in default. As at year end, the bank made disbursement under the aforementioned DFA amounting to Rs. 999,000 maturing at various future dates.
For the year ended December 31, 2016
notes to the ConsolidatedfinanCial statements(Amounts in thousand)
Annual Report 2016 183
28.7 EFert is contesting a penalty of Rs. 115,631 paid and expensed in 1997, imposed by the State Bank of Pakistan (SBP) for alleged late payment of foreign exchange risk cover fee on long term loans and has filed a suit in the High Court of Sindh. A partial refund of Rs. 62,618 was, however, recovered in 1999 from SBP and the recovery of the balance amount is dependent on the Court’s decision.
28.8 EFert had commenced two separate arbitration proceedings against the Government of Pakistan for non-payment of marketing incidentals relating to the years 1983-84 and 1985-86 respectively. The sole arbitrator in the second case has awarded EFert Rs. 47,800 whereas the award for the earlier years is awaited. The award for the second arbitration was challenged in High Court of Sindh (the Court) and during the year the Court has upheld the award. However, as this can be challenged by way of further appeals, it will be recognized as income on realization thereof.
28.9 EFert had filed a constitutional petition in the High Court of Sindh, Karachi against the Ministry of Petroleum and Natural Resource (MPNR), Ministry of Industries and Production (MIP) and Sui Northern Gas Pipeline Company Limited (SNGPL) for continuous supply of 100 mmcfd gas per day to the Enven Plant and to prohibit from suspending, discontinuing or curtailing the aforesaid supply. The High Court of Sindh, in its order dated October 18, 2011, has ordered that SNGPL should supply 100 mmcfd of gas per day to EFert’s new plant. However, five petitions have been filed in the Supreme Court of Pakistan against the aforementioned order of High Court of Sindh by SNGPL, MPNR, Agritech Limited, Pak Arab Fertilizers and Kohinoor Mills Limited along with 21 other companies (mainly engaged in textile business). The aforementioned petitions are pending for further hearing. EFert’s management as confirmed by the legal advisor considers the chances of petitions being allowed to be remote.
Further, EFert upon continual curtailment of gas after the aforementioned decision of the High Court has filed an application in respect of Contempt of Court under Article 199 & 204 of the Constitution of Pakistan. EFert, in the aforementioned application has submitted that SNGPL and MPNR have failed to restore full supply of gas to EFert’s plant despite the judgment of High Court in EFert’s favour. A show cause notice has also been issued against MPNR and SNGPL dated December 31, 2011 by the High Court. The application is pending for hearing and no orders have yet been passed in this regard.
28.10 All Pakistan Textile Processing Mills Association (APTPMA), Shan Dying & Printing Industries (Private) Limited, Agritech Limited (Agritech) and 27 others have each contended, through separate proceedings filed before the Lahore High Court that the supply to EFert’s expansion plant is premised on the output of Qadirpur gas field exceeding 500 mmcfd by 100 mmcfd and the Gas Sale and Purchase Agreement (GSA) dated April 11, 2007 with Sui Northern Gas Pipeline Limited (SNGPL) be declared void ab initio because the output of Qadirpur gas field has infact decreased. Agritech has additionally alleged discrimination in that it is receiving less gas than the other fertilizer companies on the SNGPL system. EFert has out rightly rejected these contentions, and is of the view that it has a strong case for the reasons that (i) 100 mmcfd gas has been allocated to EFert through a transparent international competitive bidding process held by the Government of Pakistan, and upon payment of valuable license fee; (ii) GSA guarantees uninterrupted supply of gas to the expansion plant, with right to first 100 mmcfd gas production from the Qadirpur gas field; and (iii) both EFert and gas field (Qadirpur), that is to initially supply gas to EFert, are located in Sindh. Also neither the gas allocation by the Government of Pakistan nor the GSA predicates the gas supply upon Qadirpur field producing 100 mmcfd over 500 mmcfd. No orders have been passed in this regard and the petition has also been adjourned sine die. However, EFert’s management, as confirmed by the legal advisor, considers chances of petitions being allowed to be remote.
For the year ended December 31, 2016
notes to the ConsolidatedfinanCial statements(Amounts in thousand)
184 Dawood Hercules Corporation Limited

28.11 EFert along with other fertilizer companies, received a show cause notice from the Competition Commission of Pakistan (CCP) for initiating action under the Competition Act, 2010 in relation to unreasonable increase in fertilizer prices. EFert has responded in detail that factors resulting in such increase were mainly the imposition of infrastructure cess and sales tax and partially the gas curtailment. The CCP has issued an order in March 2013, whereby it has held that EFert enjoys a dominant position in the urea market and that it has abused this position by unreasonable increases of urea prices in the period from December 2010 to December 2011. The CCP has also held another fertilizer company to be responsible for abusing its dominant position. In addition, the CCP has imposed a penalty of Rs. 3,140,000 and Rs. 5,500,000 on EFert and that other fertilizer company respectively. An appeal has been filed in the Competition Appellate Tribunal (at present non-functional) and a writ has been filed in the Sindh High Court and stay has been granted against the recovery of the imposed fine. EFert’s management believes that the chances of ultimate success are very good, as confirmed by legal advisor. Hence, no provision has been made in these consolidated financial statements.
28.12 Bank guarantees have been provided to:
- SNGPL amounting to Rs. 2,496,126 (2015: Rs. 2,496,126) representing an amount equivalent to three months contractual quantities of gas in accordance with the terms of Gas Supply Agreement (GSA) between EPQL and the SNGPL;
- Other third parties amounting to Rs. 2,178,048 (2015: Rs. 1,402,223).
28.13 A Corporate Guarantee amounting to USD 3,500 for principal plus interest amount has been issued on December 19, 2015, by Engro Powergen Limited on behalf of Engro Power Investments International B.V (EPII) in favor of UBL Switzerland AG against the term loan. As of December 31, 2016, EPII has not utilized this facility.
28.14 On October 05, 2016 EPL, furnished a bank guarantee amounting to Rs. 767 to Punjab Power Development Board (PPDB) for obtaining letter of interest (LOI) for development of 7.1 MW D.G. Khan Link – III Canal, RD. 0+000 to RD. 14+000, located in District DG Khan. Engro has approached investors and will act as a Technical Partner and minority shareholder in lieu of Project Management and O&M.
28.15 The Sindh Finance Act, 1994, prescribed the imposition of an infrastructure fee at the rate of 0.5% of the C&F value of all goods entering or leaving the province of Sindh via sea or air. The Act thereafter was last amended through Sindh Finance Act, 2014 according to which infrastructure fee will range from 0.9% to 0.95% of total value of goods as assessed by the Custom Authorities (the Authorities) plus one paisa per kilometer against various slab of net weight of goods. In 2014, Engro Elengy Terminal Private Limited (EETPL) filed a petition against the aforementioned levy before the High Court of Sindh (the Court) where it is currently pending. Earlier, the Court through an interim order on petitions filed by other companies, directed companies to clear the goods on paying 50% of the amount of levy and furnishing bank guarantee / security for the balance amount.
EETPL estimates the amount of levy as at December 31, 2014 to be Rs. 8,774. In this respect, EETPL has paid 50% of the above levied cess and has provided bank guarantee amounting to Rs. 8,000 in favor of the Authorities to comply with interim orders of the Court. The bank guarantee shall continue and remain valid until the decision of the Court in the above mentioned case. However, based on the merits of the case and as per the opinion of its legal advisor, EETPL expects a favorable outcome on the matter and accordingly no provision has been made in this respect in these consolidated financial statements.
For the year ended December 31, 2016
notes to the ConsolidatedfinanCial statements(Amounts in thousand)
Annual Report 2016 185
28.16 During the year, EETPL imported steel linepipes (the goods) for the LNG Project, on which the authorities allowed exemption from custom duty, however, refused to allow exemption from sales tax. EETPL filed a petition before the Court against levy of sales tax on the goods and to restrain the authorities from hindering clearance of the same. Under interim orders, the Court directed the authorities to release the goods subject to deposit of pay order with the Nazir of the Court amounting to Rs. 9,026, which has been duly deposited. The matter is currently pending for further hearing.
EETPL based on the merits of the case and as per the opinion of its legal advisor, expects a favorable outcome on the matter and accordingly no provision has been made in this respect in these consolidated financial statements.
28.17 EETPL during the year in connection with the import of FSRU received a demand from Customs Authority amounting to Rs. 1,530,494. The demand was raised on reassessment of the matter in connection with the judgement of the Court. EETPL in response to the above has filed an appeal based on which the Chief Commissioner Inland Revenue remanded the case back to the concerned commissioner. EETPL, based on the merits of the case and opinion of its tax consultant and legal advisor, considers the possibility of matter being decided against the EETPL to be remote.
28.18 The Deputy Commissioner Inland Revenue (DCIR) through order dated January 8, 2016, raised a sales tax demand of Rs. 524,589 on account of alleged short payment of sales tax due on the finished products that would have been produced and sold from the excess wastage of raw material. EPCL filed thereagainst before the Commissioner Inland Revenue Appeals [CIR(A)] on the grounds that the order passed against EPCL was absolutely baseless as the DCIR had used inappropriate theoretical assumptions for calculating the sales tax liability. The CIR(A) through his order dated March 10, 2016, has decided the matter in favor of EPCL. However, the department has challenged the said order of CIR(A) before Appellate Tribunal Inland Revenue (ATIR). No proceedings regarding this matter has been carried out by ATIR, till the year end. The management of EPCL, based on the advice of its tax consultant, is confident of favourable outcome of this matter, accordingly, no provision has been made in this respect.
28.19 Engro Powergen Limted (EPL) has also provided sponsor support contractual commitment, among other commitments, in favor of Senior Lenders amounting to USD 5,400 and USD 41,600 as cost overrun support pursuant to the Sponsor Support Agreements (SSA) dated February 22, 2016 for SECMC and February 1, 2016 for EPTL respectively (and the Amendment and Restatement Agreement dated February 12, 2016 relating to the SSA in case of EPTL).
28.20 Faysal Bank Limited (FBL) has issued a performance guarantee of USD 16,517 on behalf of EPTL in favour of National Transmission and Dispatch Company (NTDC) to secure EPTL’s performance obligations under the Power Purchase Agreement. The performance guarantee expires on July 25, 2019 and is secured by way of performance bonds issued under the EPC Contract and ranking charge over all (present and future) fixed assets, current assets, book debts and receivable of EPTL.
28.21 Habib Bank Limited (HBL), a related party of EPTL, has issued a guarantee of Rs. 4,725,000 on behalf of EPTL in favor of Sindh Engro Coal Mining Company Limited (SECMC) to secure EPTL’s payment obligations under the Coal Supply Agreement. The guarantee expires on July 20, 2017 and is secured by first ranking mortgage over receivables due under the Power Purchase Agreement (PPA), mortgage over EPTL’s rights and benefits under all project documents and project insurances, first ranking hypothecation charge over all movable assets (current and future) of EPTL, equitable mortgage over EPTL’s immovable property, with a 20% margin. Further, the shareholders of EPTL shall pledge shares in favor of the Security Trustee.
For the year ended December 31, 2016
notes to the ConsolidatedfinanCial statements(Amounts in thousand)
186 Dawood Hercules Corporation Limited

28.22 Subsequent to the balance sheet date, Engro Foods Limited (EFoods) received an order from Competition Commission of Pakistan, imposing a penalty of Rs. 62,293 in respect of EFoods’ marketing activities relating to one of its products. Presently, EFoods is in the process of filing an appeal against the aforementioned order. Further, as per the terms of the Share Purchase Agreement with FrieslandCampina Pakistan Holding B.V. (FCP), the Holding Company is required to reimburse 51% of the amount together will all reasonable cost and expenses to FCP in case any such penalty materializes. ECL, based on the opinion of the legal advisor, is confident of a favorable outcome of the appeal, and accordingly no provision has been recognized in these consolidated financial statements in this respect.
28.23 In accordance with the terms of the Share Purchase Agreement with FrieslandCampina Pakistan Holding B.V. (FCP), ECL is required to compensate FCP for the negative consequences of the 25% regulatory duty payable on the import of powdered milk and whey powder into Pakistan. ECL will reimburse the amount to the extent that the sum of the regulatory duty and the custom duties incurred by EFoods occuring within 18 months from the date of disposal of EFoods exceeds Euro 10,000. Provided that in no case the amount of such reimbursement will exceed Euro 4,000.
28.24 In accordance with the terms of Share Purchase Agreement (SPA), ECL is required to pay to FrieslandCampina Pakistan Holding B.V., an amount equal to 47.1% of any tax liability (as defined in the SPA) together will all reasonable costs and expenses incurred, in case any tax contingency materializes. ECL, based on the opinion of EFoods’ tax advisors, is confident of favorable outcomes, and accordingly no provision has been recognized in these consolidated financial statements in this respect.
Commitments
28.25 Details of commitments as at December 31, 2016 entered by the Group are as follows:
28.25.1 Commitment in respect of operating lease arragements
The amount of future payments in operating lease arrangements relating to office premises, and the period in which these payments will become due are as follows:
2016 2015---------------Rupees---------------
Not later than one year 10,766 7,885
The amount of Rs 10,000 represents commitments in respect of office premises. The Holding Company has signed lease agreements for premises on rent from Dawood Foundation, a related party, for Karachi office which is due to expire in September 2017. The same is revocable by either party through prior notice of at least 3 months. The remaining amount of Rs 766 represents lease rental commitment of a car provided to an executive.
28.25.2 Commitments in respect of capital expenditure contracted but not incurred amount to Rs. 54,022,835 (2015: Rs.1,295,668).
28.25.3 Commitments in respect of letters of credit / contracts other than for capital expenditures amount to Rs. 1,190,663 (2015: Rs. 6,183,587). This includes a letter of credit amounting to Rs. 840,663 (2015: Rs. 840,663) extended by Engro Powergen Qadirpur Limited (EPQL) in favor of its senior lenders.
28.25.4 Other commitments in respect of subsidiary companies amounts to Rs. 1,122,468 (2015: Rs. 1,175,460).
For the year ended December 31, 2016
notes to the ConsolidatedfinanCial statements(Amounts in thousand)
Annual Report 2016 187

28.25.5 The aggregate facility for performance guarantees to be issued by banks as at December 31, 2016 amounts to Rs. 1,156,000 (2015: Rs. 1,098,000). The amount utilized thereagainst as at December 31, 2016 was Rs. 1,140,280 (2015: Rs. 1,097,280).
28.25.6 Engro Polymers and Chemicals Limited (ECL) has entered into various contracts with Engro Vopak Terminal Limited, a related party, for storage and handling of Ethylene and Vinyl Chloride Monomer (VCM) valid till March, 2026 and December 2018, respectively, and Ethylene Di-Chloride (EDC) valid till May 2018. Annual fixed cost payable to Engro Vopak Terminal Limited, under these contracts, approximates to USD 9,165.
28.25.7 The Group has entered into lease arrangements for computer / office equipments and for storage and handling of Ethylene Di Chloride (EDC) & caustic soda. The future aggregate lease payments under these arrangements are as follows:
2016 2015---------------Rupees---------------
Not later than 1 year 14,400 109,945 Later than 1 year and no later than 5 years 22,800 158,094
37,200 268,039
28.25.8 Engro Elengy Terminal Private Limited (EETPL) has entered into lease arrangement for hire of Floating Storage & Regasification Unit (FSRU). The future aggregate lease payments as daily hire charges under this arrangement are as follows:
2016 2015---------------Rupees---------------
Not later than 1 year 4,016,460 4,016,460 Later than 1 year and no later than 5 years 16,839,026 16,404,344 Later than 5 years 36,718,871 41,182,208
57,574,357 61,603,012
2016 201529 REVENUE ---------------Rupees---------------
Own manufactured products (note 29.1) 136,314,701 168,597,868 Less: - Sales tax (14,280,086) (20,085,102)- Discounts (2,134,505) (3,797,384)
119,900,110 144,715,382
Purchased product / services rendered 38,587,674 38,637,608 Less: Sales tax (1,280,116) (1,373,304)
37,307,558 37,264,304
157,207,668 181,979,686
29.1 Includes export sales amounting to Rs 1,820,568 (2015: Rs 3,561,108).
For the year ended December 31, 2016
notes to the ConsolidatedfinanCial statements(Amounts in thousand)
188 Dawood Hercules Corporation Limited

2016 201530 COST OF REVENUE ---------------Rupees---------------
Cost of goods sold (note 30.1) 114,696,346 131,958,774 Cost of services rendered (note 30.2) 6,668,509 4,800,072
121,364,855 136,758,846
30.1 Cost of Goods Sold
Raw and packing materials consumed including unprocessed rice (note 30.1.2) 52,869,031 62,931,392
Salaries, wages and staff welfare (note 30.1.3) 4,749,571 5,262,963 Fuel and power 20,579,888 21,465,054 Repairs and maintenance 2,923,763 2,007,397 Depreciation (note 5.2) 8,330,442 8,757,422 Amortization (note 7.1) 22,838 27,138 Impairment (note 5.3) 101,942 3,454,184 Consumable stores 940,528 2,106,896 Staff recruitment, training, safety and other expenses 408,061 142,557 Purchased services 1,229,643 1,097,012 Storage and handling 1,641,527 1,678,134 Travel 268,548 307,791 Communication, stationery and other office expenses 225,756 307,867 Insurance 771,918 756,532 Rent, rates and taxes 583,875 641,998 Provision / (Reversal of provision) against:
- stock-in-trade 29,909 (1,653,298)- slow moving spares 35,474 42,421
Catalysts and chemicals - 778 Other expenses 139,373 287,384 Manufacturing cost 95,852,087 109,621,622
Add: Opening stock of work-in-process (note 12) 213,415 678,292 Less: Closing stock of work-in-process (note 12) 462,630 213,415 Less: Discontinued operations - 73,982
(249,215) 390,895 Cost of goods manufactured 95,602,872 110,012,517
Add: Opening stock of finished goods manufactured (note 12) 4,041,032 4,581,087
Less: Closing stock of finished goods manufactured (note 12) 7,350,526 4,041,032
(3,309,494) 540,055 Cost of goods sold
- own manufactured product 92,293,378 110,552,572 - purchased product (note 30.1.1) 22,402,968 21,406,202
114,696,346 131,958,774
30.1.1 Cost of sales - purchased product
Opening stock (note 12) 4,117,746 298,214 Add: Purchases 19,421,127 25,225,734 Less: Closing stock (note 12) 1,135,905 4,117,746
22,402,968 21,406,202
For the year ended December 31, 2016
notes to the ConsolidatedfinanCial statements(Amounts in thousand)
Annual Report 2016 189
30.1.2 This is net of reversal of provision amounting to Nil (2015: Rs 881,860) in respect of duty on import of raw materials and GIDC of prior periods.
30.1.3 Includes Rs. 375,989 (2015: Rs. 341,980) in respect of staff retirement benefits.
2016 2015---------------Rupees---------------
30.2 Cost of services rendered
Fixed expenses (note 30.2.1) 5,037,250 3,881,982 Variable expenses (note 30.2.2) 875,689 350,079 Depreciation (note 5.2) 533,561 417,336 Amortization of direct cost on FSRU 86,516 72,096 Salaries, wages and benefits 27,887 44,707 Repairs and maintenance 64,990 22,128 Travelling and entertainment 6,467 4,418 Security and other expense 36,149 7,326
6,668,509 4,800,072
30.2.1 Includes expenses in respect of rental, operating and maintenance charges of FSRU and for its use as LNG carrier amounting to Rs 4,960,238 (2015: Rs 3,783,314).
30.2.2 This includes royalty paid to Port Qasim Authority amounting to Rs 540,077 (2015: Rs 203,383).
2016 2015---------------Rupees---------------
31 SELLING AND DISTRIBUTION EXPENSES
Salaries, wages and staff welfare (note 31.1) 1,469,277 1,486,778 Staff recruitment, training, safety and other expenses 87,735 72,724 Product transportation and handling 5,997,196 5,559,310 Repairs and maintenance 92,537 87,184 Advertising and sales promotion 3,143,322 2,589,747 Rent, rates and taxes 488,379 260,754 Communication, stationery and other office expenses 91,311 105,434 Travel 185,528 160,002 Depreciation (note 5.2) 247,531 236,526 Amortization (note 7.1) 5,341 960 Impairment (note 5.3) 4,446 - Purchased services 45,974 22,127 Insurance - 3 Sales promotion, advertising and market development - 2,202 Others 194,181 182,065
12,052,758 10,765,816
31.1 Includes Rs 137,840 (2015: Rs 119,748) in respect of staff retirement benefits.
For the year ended December 31, 2016
notes to the ConsolidatedfinanCial statements(Amounts in thousand)
190 Dawood Hercules Corporation Limited

2016 2015---------------Rupees---------------
32 ADMINISTRATIVE EXPENSES
Salaries, wages and staff welfare (notes 32.1 and 32.2) 2,163,059 2,222,980 Staff recruitment, training, safety and other expenses 150,119 164,737 Repairs and maintenance 73,191 72,872 Advertising 18,738 93,092 Rent, rates and taxes 373,315 348,090 Communication, stationery and other office expenses 270,875 371,920 Travel 192,618 419,402 Depreciation (note 5.2) 119,218 137,941 Amortization (note 7.1) 47,476 71,585 Purchased services 443,566 383,390 Donations (note 50) 125,490 149,237 Legal and professional charges 44,342 617,141 Insurance 4,155 3,467 Subscriptions and periodicals 22,983 26,637 Impairment charge 95,713 7,661 Others 207,302 119,419
4,352,160 5,209,571
32.1 Includes Rs 182,860 (2015: Rs 151,222) in respect of staff retirement benefits.
32.2 Includes reversal of Rs 35,816 (2015: charge of Rs 157,972) in respect of Employees’ share option compensation expense.
2016 201533 OTHER INCOME ---------------Rupees---------------
Financial assets:Income on deposits / other financial assets 1,294,224 1,701,868 Exchange gain / exchange loss 11,520 46,550 Interest on receivable from SSGCL 234,895 205,643 Delayed payment charges on overdue receivables 151,223 195,865
Non financial assets:Subsidy from Government of Pakistan 7,878,050 2,611,879 Insurance claims 98,736 141,936 Gain on disposal of property, plant and equipment 72,657 49,687 Income from sale of spares / scrap 67,330 57,669 Capital gain on disposal of investments in subsidiary company (note 33.1) 34,342,608 - Gain due to recognition of retained interest in
subsidiary (now associate) at fair value (note 8.6) 24,337,818 - Gain on deemed disposal of SECMC 72,563 6,935 Loss arising on sale of investment in e2e BE - (105,286)Gain arising from changes in fair value less estimated
point-of-sale costs of biological assets (note 6.1) 8,115 243,603 Reversal of provision against infrastructure cess (note 33.2) - 148,583 Gain on disposal of subsidiary - 5,156,097 Others (note 33.3) 282,341 225,463
68,852,080 10,686,492
33.1 Represents capital gain upon disposal of partial shareholding of EFoods to FCP (note 2.1.4), net of transaction costs.
For the year ended December 31, 2016
notes to the ConsolidatedfinanCial statements(Amounts in thousand)
Annual Report 2016 191

33.2 As per the interim arrangement with the Excise and Customs authorities, the bank guarantees furnished by the Group (Appellants before the Supreme Court) upto December 27, 2006 were discharged and returned. As agreed, 50% in value of the Bank Guarantees furnished for consignments released after the aforesaid date were permitted to be enchased; the remaining 50% were to be retained until a judicial resolution. It was specifically agreed, as per the joint statement, that after May 31, 2011 all imports would be released on payment of 50% cash and 50% bank guarantee. Last year, the management of the Group being confident that no demand will be raised for any amount pertaining to the period prior to December 27, 2006, has reversed the provision relating to that period.
33.3 This includes Rs. Nil (2015: Rs. 141,936) in respect of damaged compressor claim received against insurance claim of asstes written-off in 2014.
2016 2015---------------Rupees---------------
34. OTHER OPERATING EXPENSES
Workers’ profits participation fund 977,432 1,482,985 Workers’ welfare fund 377,122 561,821 Legal and professional charges 418,469 814,640 Research and development 400,286 56,405 Reversal of provision for trade debts, loans
advances and other receivables - 1,086 Provision for dispatch claims - 35,718 Provision against refundable sales tax - 180,000 Auditors’ remuneration (note 34.1) 33,349 43,422 Provision for culling of biological assets (note 6) 26,067 24,748 Others 118,079 35,265
2,350,804 3,236,090 34.1 Auditors’remuneration
The aggregate amount charged in respect of auditors’ remuneration, including remuneration of auditors’ of foreign subsidiaries, is as follows:
2016 2015---------------Rupees---------------
Fee for:- audit of annual financial statements 11,717 7,909 - review of half yearly financial statements 2,177 2,483
Special audit, certifications, audit of retirement benefit funds, review of compliance with Code of Corporate Governance and other advisory services 6,954 18,331
Tax services 10,101 11,786 Reimbursement of expenses 2,400 2,913
33,349 43,422
2016 201535. FINANCE COST ---------------Rupees---------------
Interest / mark-up on:- long term borrowings 3,969,983 5,917,941 - short term borrowings 1,950,598 1,334,658
Interest on Workers’ profits participation fund - 154 (Gain) / loss on fair value of IFC conversion option (103,750) 28,551 Foreign exchange loss - net 154,930 1,121,793 Financial charges on usance letters of credit 20,604 83,662 Bank charges 1,367 42,584 Others 436,858 389,320
6,430,590 8,918,663
For the year ended December 31, 2016
notes to the ConsolidatedfinanCial statements(Amounts in thousand)
192 Dawood Hercules Corporation Limited

2016 2015---------------Rupees---------------
36. SHARE OF INCOME FROM JOINT VENTURE AND ASSOCIATES
Joint venture:
Engro Vopak Terminal Limited Share of profit before taxation 1,178,465 910,038 Less: Share of provision for taxation (134,171) (123,101)
1,044,294 786,937
Associates:
Sindh Engro Coal Mining Company, GEL Utility Limited,Engro Foods Limited and HUBCO
Share of profit / (loss) from:- Sindh Engro Coal Mining Company (5,316) 4,683 - GEL Utility Limited 273,390 227,325 - Engro Foods Limited (38,871) - - The Hub Power Company Limited 1,761,852 1,610,234
Others:
e2e Business Enterprises (Private) LimitedLess: Share of loss - (20,960)
3,035,349 2,608,219 37. TAXATION
Current - for the year 6,144,035 6,306,386 - for prior years 511,831 466,091
6,655,866 6,772,477
Deferred 2,449,719 2,248,197
9,105,585 9,020,674
37.1 engro Corporation limited (eCl) - Principal subsidiary Company
In 2013, the income tax department, in respect of the tax year 2011, determined additional income tax liability of Rs. 218,790 and raised a demand of Rs. 139,575 whereby the Deputy Commissioner Inland Revenue (DCIR) - Audit disallowed allocation of expenses against interest income and apportioned expenses against dividend income and capital gains. ECL filed an appeal with the Commissioner Inland Revenue (CIR) - Appeals who maintained the apportionment of expenses against dividend income and capital gains but allowed the allocation of administrative expenses against interest income, thereby reducing the income tax liability to Rs. 184,191 and revised the demand to Rs. 104,976. ECL paid Rs. 53,250 thereagainst and simultaneously filed an appeal against the CIR - Appeals decision with Appellate Tribunal Inland Revenue (ATIR) which granted a stay to ECL. During 2014, the ATIR issued an order whereby the aforementioned appeal was remanded back to the assessing officers for denovo proceedings, thereby accepting the ECL’s contention. The income tax department, in response thereagainst, had filed an appeal with ATIR, which was pending for hearing. Subsequent to the year end, the ATIR has also dismissed the appeal of the CIR.
For the year ended December 31, 2016
notes to the ConsolidatedfinanCial statements(Amounts in thousand)
Annual Report 2016 193

In 2014, the income tax department in respect of tax year 2012, amended the assessment and raised an additional demand of Rs. 250,773 on similar grounds as above. ECL filed an appeal against the said order with CIR - Appeals, whereby the order has remanded back to assessing officers for denovo proceedings.
During 2015, in respect of pending tax assessments for tax year 2011 and tax year 2012, ECL received notices of demand amounting to Rs. 105,955 and Rs. 250,773, respectively, whereby the Deputy / Additional Commissioner Inland Revenue - Audit again disallowed allocation of expenses against interest income and apportioned expenses against dividend income and capital gains. ECL filed appeals thereagainst with the CIR - Appeals and also obtained stays from the High Court of Sindh from initiating any recovery proceedings in respect of both tax years. Subsequently, in respect of tax year 2011, the CIR - Appeals accepted ECL’s plea and annulled the order passed by the DCIR. In response the DCIR filed an appeal before the ATIR for rectification of the order passed by the CIR - Appeals for both tax years.
During the year, an amendment was introduced in the Income Tax Ordinance 2001 (the Ordinance) via the finance Act 2016 which imposed tax on inter-corporate dividends, previously exempt to companies designated as a Group under section 59B of the Ordinance.
ECL has challenged the application of the aforementioned amendment in the Sindh High Court and has been granted a stay in this respect.
37.2 Subsidiary Companies of Engro Corporation Limited
37.2.1 Engro Fertilizers Limited (EFert)
37.2.1.1 In 2015, the income tax department amended the assessment filed by EFert for tax year 2014. EFert filed the appeal before CIR - Appeals against disallowances made through the assessment, which mainly pertained to exchange gain and loss, loss on derivative and losses purchased from Engro Eximp Agriproducts (Private) Limited under section 59B of the Income Tax Ordinance, 2001. In addition the tax department raised demand for the Alternative Corporate Tax through the same order, for which EFert specifically obtained a stay order. The case is pending to be heard with the CIR - Appeals and EFert is confident of a favourable outcome.
37.2.1.2 During the year ended 2014, the income tax department amended the assessment filed by EFert for tax years 2010 and 2011. EFert filed the appeals before ATIR against the said disallowances, which through its decision, provided relief in respect of certain items and confirmed certain disallowances in favor of the tax department. The said disallowances included the charge in respect of exchange gain and loss incurred for tax year 2010 and tax year 2011, and loss on derivative for tax year 2011. During last year, EFert has challenged the said decision before High Court of Sindh, which is pending to be heard and is confident of a favourable outcome.
37.2.1.3 During the year, EFert has taxable income on which tax has been computed at the applicable normal corporate tax rate. Last year, the tax expense mainly comprised of alternative corporate tax under section 113C of the Income Tax Ordinance, 2001 amounting to Rs. 2,599,772 and minimum turnover tax amounting to Rs. 876,153.
EFert had filed a suit in the High Court of Sindh, contesting both the retrospective and prospective application of the advance corporate tax under section 113C and has been granted stay in this respect for the years 2013, 2014 and 2015.
For the year ended December 31, 2016
notes to the ConsolidatedfinanCial statements(Amounts in thousand)
194 Dawood Hercules Corporation Limited

37.2.1.4 This includes an amount of Rs. 656,000 (net off of reversal of last year provision on this account of Rs. 361,258) on account of provision in accordance with section 4B ‘Super Tax for rehabilitation of temporarily displaced persons’ again inserted in the Income Tax Ordinance, 2001 (the Ordinance) through Finance Act, 2016, whereby tax at three per cent is payable on specified income exceeding Rs. 500 million for the year ended December 31, 2015 (tax year 2016). Initially, this provision was inserted in the Ordinance through Finance Act, 2015 for the year ended December 31, 2014 (tax year 2015), which was not applicable to company’s case for the said year, as clarified through Finance Act, 2016.
37.2.1.5 As a result of demerger in 2009, all pending tax issues of ECL, Engro Chemical Pakistan Ltd. had been transferred to EFert. Major issues pending before the tax authorities is described below:
In previous years, the department had filed reference applications in High Court against the below-mentioned ATIR’s decisions in EFert’s favor. No hearing has been conducted to-date. The reference application includes the following matters:
• Group Relief (Financial year 2006 to 2008): Rs. 1,500,847
• Inter-Corporate Dividend (Financial year 2007 and 2008): Rs. 336,500
• G.P. Apportionment (Financial years 1995 to 2002): Rs. 653,000
EFert is confident that all pending issues will eventually be decided in its favour.
37.2.1.6 In 2015, EFert received a sales tax order from the tax department for the year ended December 31, 2013 pertaining to discharge of output tax liability, on assumed production of urea amounting to Rs. 402,875 and on presumption that output tax liability is not being discharged by EFert on advances received from dealers amounting to Rs. 1,844,075. EFert filed appeal with CIR - Appeals which has decided the matters in favour of EFert. The department has now challenged the decision of the CIR - Appeals with ATIR , which is pending to be heard.
37.2.1.7 As a result of EXIMP merger, all pending tax issues of Eximp have been transferred to EFert. Major pending issue pertains to exercise of option to be taxed in NTR (introduced through Finance Act, 2012) by EXIMP for years 2012 and 2013, resulting in an aggregate refund of Rs 796 million. The tax department has not accepted the said treatment, however the matter was decided in favor of EFert by the Commissioner Appeals.
37.2.2 engro elengy terminal (Private) limited (eetPl)
EETPL has been granted tax holiday for a period of 5 years from the date of commencement of operations through Finance Act, 2015.
37.2.3 engro eximp agriProduct (Private) limited (eeaPl)
EEAPL’s return for tax year 2011 was selected for audit by the tax authorities through balloting under section 214C of Income Tax Ordinance, 2001, (ITO). As a result of the audit, the assessing officer passed an amended assessment order under section 122 of ITO, whereby it disallowed total depreciation including initial allowance amounting to Rs. 569,062 and also disallowed certain manufacturing and trading expenses amounting to Rs. 26,900. EEAP, in response to the amended assessment order, had filed an appeal before Commissioner Inland Revenue (Appeals) which reverted the case to the Commissioner and directed to assess the case in the light of evidences and supports available with the management. During the year, the remanded back proceedings have been concluded and EEAP
For the year ended December 31, 2016
notes to the ConsolidatedfinanCial statements(Amounts in thousand)
Annual Report 2016 195

has succeeded in establishing substantial claim of depreciation amounting to Rs. 481,717 while for disallowed depreciation of Rs. 87,345 it has filed appeal which is pending before the Commissioner (Appeals). The management based on advice of tax consultant, is confident that matters will be decided in favor of EEAP. Accordingly, no provision has been recognized in these consolidated financial statements.
37.2.4 engro Polymer & Chemicals limited (ePCl)
37.2.4.1Taxyear2008
The DCIR through the order dated November 26, 2009 raised a tax demand of Rs. 213,172. The demand arose as a result of additions on account of trading liabilities of Rs. 47,582 under section 34(5) of the Income Tax Ordinance, 2001 (the Ordinance); disallowance of provision for retirement benefits of Rs. 5,899; adding imputed interest on loans to employees and executives of Rs. 16,069 to income; disallowing finance cost of Rs. 134,414 and not considering adjustment of minimum tax paid for tax years 2004 to 2007 against the above demand.
EPCL filed an appeal against the aforesaid order before CIR - Appeals, but discharged the entire demand through adjustment against assessed refunds of Rs. 180,768 and paying the balance of Rs. 32,404 ‘under protest’. Through his appellate order, the CIR - Appeals maintained certain additions aggregating Rs. 189,810 including finance cost amounting to Rs. 134,414 and remanded back the issue of imputed interest on loans to employees and executives and directed the DCIR to allow credit of the minimum tax charged for the period of tax years 2004 to 2007. An appeal against the said appellate order was filed by EPCL before the ATIR. The department also filed an appeal against the said appellate order challenging the actions of the CIR - Appeals.
In 2013, the ATIR issued an order whereby the aforementioned appeal was disposed off by accepting EPCL’s position except for additions on account of trading liabilities to the extent of Rs. 20,280 and minimum turnover tax for tax years 2004 and 2007 to the extent of Rs. 19,692 and Rs. 7,300 respectively, which were maintained.
EPCL filed a reference to the High Court of Sindh against the additions maintained by ATIR. Likewise, the tax department has also filed reference to the High Court of Sindh against the order passed by the ATIR in favour of EPCL. The management of EPCL, based on the advice of its tax consultant, is confident that the ultimate outcome of the aforementioned matters would be favorable and, accordingly, has not recognized the effects for the same in these consolidated financial statements.
37.2.4.2Taxyear2009
The DCIR through his order dated November 30, 2010 raised a tax demand of Rs. 163,206. The demand arose as a result of disallowance of finance cost of Rs. 457,282; additions to income of trading liabilities of Rs. 21,859 under section 34(5) of the Ordinance; disallowance of provision for retirement benefits of Rs. 14,239; disallowance of provision against Special Excise Duty refundable of Rs. 36,689; addition of imputed interest on loans to employees and executives of Rs. 20,599 and not considering net loss.
The entire demand of Rs. 163,206 was adjusted against assessed tax refunds and an appeal was filed by EPCL before the CIR - Appeals. Through his appellate order, the CIR - Appeals maintained certain additions aggregating to Rs. 493,971 including disallowance of finance cost amounting to Rs. 457,282 and remanded back the issue of imputed interest on loans to employees and executives. An appeal against the said appellate order was filed before the ATIR. The department also filed an appeal against the said appellate order challenging the action of CIR - Appeals, regarding deletion of addition on account of provision for the retirement benefits.
For the year ended December 31, 2016
notes to the ConsolidatedfinanCial statements(Amounts in thousand)
196 Dawood Hercules Corporation Limited

In 2013, the ATIR issued an order whereby the aforementioned appeal was disposed off by accepting EPCL’s position except for additions on account of SED provision of Rs. 36,687 and imputed interest on loans to employees and executives to the extent of Rs. 17,430, which were maintained. EPCL filed a reference to the High Court of Sindh against the additions maintained by ATIR. Likewise, the tax department has also filed reference to the High Court of Sindh against the order passed by the ATIR in favour of EPCL. The management of EPCL, based on the advice of its tax consultant, is confident that the ultimate outcome of the aforementioned matters would be favorable and, accordingly, has not recognized the effects for the same in these consolidated financial statements.
37.2.5 engro Powergen limited (ePl)
Subsequent to the year end, Commissioner Inland Revenue (CIR) through his order dated January 12, 2017 made certain additions and disallowances in respect of tax year 2014 as a result of audit of income tax affairs under section 214C of the Income Tax Ordinance, 2001 and raised tax demands of Rs. 268,583. EPL intends to contest the demand and based on the views of tax advisor of EPL, the management believes that the matters will ultimately be decided in favour of the EPL. Accordingly, no provision has been made in this respect in these consolidated financial statements.
37.3 Relationshipbetweentaxexpenseandaccountingprofit
The tax on the Group’s profit before tax differs from the theoretical amount that would arise using the Group’s applicable tax rate as follows:
2016 2015---------------Rupees---------------
Profit before taxation 82,543,930 30,385,411
Tax calculated at the rate of 31% (2015: 32%) 25,588,618 9,723,332 Depreciation on exempt assets not deductible for tax purposes 3,389 3,044 Effect of exemption from tax on certain income (1,528,842) (2,753,629)Effect of applicability of lower tax rate, FTR and other tax credits / debits (15,853,607) (3,041,637)Prior year current and deferred tax charge 294,970 732,382 Un-recoupable minimum turnover tax 1,104 161,613 Effect of derecognition of carried forward losses - 1,181,778 Effect of provision for impairment against long term investment - 1,492,405 Tax effect of minimum tax liability on imports, exports and local trading (52,862) 66,700 Others 652,815 1,454,686 Tax charge for the year 9,105,585 9,020,674
38. EARNINGS PER SHARE - BASIC AND DILUTED
Basic earnings per share has been calculated by dividing the profit attributable to equity holders of the Group by weighted average number of ordinary shares in issue during the year.
Diluted earnings per share has been calculated by adjusting the weighted average number of ordinary shares outstanding for assumed conversion of equity option on IFC loan throughout the year. The effect of these options is anti-dilutive as at December 31, 2015.
For the year ended December 31, 2016
notes to the ConsolidatedfinanCial statements(Amounts in thousand)
Annual Report 2016 197

2016 2015---------------Rupees---------------
Profit / (loss) for the year (attributable to the owners of the Holding Company) from:- Continuing operations 3,094,459 3,582,493 - Discontinued operations 22,470,093 5,644,408
25,564,552 9,226,901 The information necessary to calculate basic and diluted earnings per share is as follows:Profit for the year from continuing operations 3,094,459 3,582,493 Add:- Interest on IFC loan - net of tax 718 1,422 - (Gain) / Loss on revaluation of conversion options on IFC loan - net of tax (16,360) 5,300
(15,642) 6,722
3,078,817 3,589,215
------Number in thousands------
weighted average number of ordinary shares 481,287 481,287
39. remuneration of Chief eXeCutive, direCtors and eXeCutives
The aggregate amounts for remuneration, including all benefits, to the Chief Executive and Directors of the Holding Company and Executives of the Group are as follows:
2016 2015Directors Executives Directors Executives
Chief Others Chief OthersExecutive Executive
-------------------------------------------Rupees-------------------------------------------
Managerial remuneration 160,057 51,485 3,782,037 19,355 62,696 4,577,771 Retirement benefits funds including ex-gratia 4,410 - 382,906 4,515 1,588 510,871 Other benefits 12,647 24,071 469,884 12,498 32,471 281,903 Fees - 7,950 2,408 - 4,550 234,640 Total 177,114 83,506 4,637,235 36,368 101,305 5,605,185
Number of persons including those who worked part of the year 2 2 1,061 1 3 1,770
39.1 The Group also makes contributions to pension and gratuity funds and provides certain household items for use of some executives.The Group also provides certain household items for use of some employees and Chief executive. Cars are also provided for use of certain employees and directors. In addition, entertainment and security expenses are also incurred for directors.
39.2 Premium charged during the year in respect of directors indemnity insurance policy, purchased by the Group, amounts to Rs 3,425 (2015: Rs 1,254).
39.3 On resignation of Mr Abdul Samad Dawood as Chief Executive Officer (CEO) of the Holding Company, Mr Inam ur Rahman was appointed as CEO with effect from December 1, 2016. Hence, above remuneration includes remuneration of Mr Abdul Samad Dawood and Mr Inam ur Rahman for their respective periods of service.
For the year ended December 31, 2016
notes to the ConsolidatedfinanCial statements(Amounts in thousand)
198 Dawood Hercules Corporation Limited

40. retirement Benefits
40.1 Definedbenefitplans
The Group offers a defined post-employment gratuity benefit to permanent management and non-management employees. In addition, until June 30, 2005, the Group offered a defined post-employment pension benefit to management employees in service which has been discontinued and the plan now only covers a handful of retired pensioners.
The gratuity and pension funds are governed under the Trusts Act, 1882, Trust Deed and Rules of Fund, Companies Ordinance, 1984, the Income Tax Ordinance, 2001 and the Income Tax Rules, 2002.
Responsibility for governance of plan, including investment decisions and contribution schedule lie with Board of Trustees of the Fund.
The Group faces the following risks on account of defined benefit plans:
Final salary risk - The risk that the final salary at the time of cessation of service is greater than what the Company has assumed. Since the benefit is calculated on the final salary, the benefit amount would also increase proportionately.
Asset volatility - Most assets are invested in risk free investments of 3, 5 or 10 year SSC’s, RIC’s, DSC’s or Government Bonds. However, investments in equity instruments is subject to adverse fluctuations as a result of change in the market price.
Discount rate fluctuation - The plan liabilities are calculated using a discount rate set with reference to corporate bond yields. A decrease in corporate bond yields will increase plan liabilities, although this will be partially offset by an increase in the value of the current plans’ bond holdings.Investment risks - The risk of the investment underperforming and not being sufficient to meet the liabilities. This risk is mitigated by closely monitoring the performance of investment. Risk of insufficiency of assets - This is managed by making regular contribution to the Fund as advised by the actuary.In addition to above, the pension fund exposes the Group to Longevity Risk i.e. the pensioners survive longer than expected.
40.1.1 valuation results
The latest actuarial valuation of the defined benefit plans was carried out as at June 30, 2016 for the Holding Company and December 31, 2016 for the subsidiary companies, using the Projected Unit Credit Method. Details of the defined benefit plans are as follows:
Defined Benefit Gratuity Plan Funded
Defined Benefit Pension Plan Funded (Curtailed)
2016 2015 2016 2015--------------------------Rupees--------------------------
40.1.2 Balance sheet reconciliation
Present value of defined benefit obligation 481,202 1,006,295 32,132 33,367 Fair value of plan assets (435,108) (897,109) (44,213) (40,835)Deficit / (Surplus) 46,094 109,186 (12,081) (7,468)Payable to Defined Contribution Gratuity Fund 10,513 10,141 - - Payable in respect of inter group transfers (271) (75) - - Unrecognized asset - - 12,081 7,468
Net (asset) / liability recognized in the balance sheet 56,336 119,252 - -
For the year ended December 31, 2016
notes to the ConsolidatedfinanCial statements(Amounts in thousand)
Annual Report 2016 199

Defined Benefit Gratuity Plan Funded
Defined Benefit Pension Plan Funded (Curtailed)
2016 2015 2016 2015--------------------------Rupees--------------------------
40.1.3 movement in net (assets) / liability recognized in the balance sheet
Net liability at beginning of the year 119,252 16,367 - - Expense / (income) for the year 137,232 117,920 (672) (464)Net contribution by the Group (26,855) (116,045) - - Remeasurement loss / (gain) to Other Comprehensive Income (33,516) 125,169 672 464 Discontinued operations (139,777) (24,159) - - Net liability at end of the year 56,336 119,252 - -
40.1.4 Movementinpresentvalueofdefinedbenefitobligation
As at beginning of the year 1,006,295 1,011,159 33,367 34,406 Current service cost 130,302 114,617 - - Past service cost - 6,345 - - Interest cost 96,353 95,672 2,823 3,400 Benefits paid during the year (143,652) (294,458) (4,028) (4,054)Remeasurement loss / (gain) to Other
Comprehensive Income 1,448 122,061 (30) (385)Liability transferred in respect of inter-company transfer 1,257 (1,076) - - Liability in respect of defined contribution transfers (571) (23,866) - - Discontinued operations (610,230) (24,159) - - As at end of the year 481,202 1,006,295 32,132 33,367
40.1.5 movement in fair value of plan assets
As at beginning of the year 897,109 1,006,329 40,835 38,824 Expected return on plan assets 89,423 98,714 3,495 3,864 Contributions by the Group 26,855 116,045 - - Benefits paid during the year (143,652) (294,458) (4,028) (4,054)Remeasurement (loss) / gain to Other Comprehensive Income 34,964 (3,108) 3,911 2,201 Inter group asset transfers 311 (2,547) - - Assets adjusted in respect of defined contribution transfers (571) (23,866) - - Discontinued operations (469,331) - - - As at end of the year 435,108 897,109 44,213 40,835
40.1.6 Charge for the year
Current service cost 130,302 114,617 - - Past service cost - 6,345 - - Net Interest (income) / cost 6,930 (3,042) (672) (464)
137,232 117,920 (672) (464)
For the year ended December 31, 2016
notes to the ConsolidatedfinanCial statements(Amounts in thousand)
200 Dawood Hercules Corporation Limited

Defined Benefit Gratuity Plan Funded
Defined Benefit Pension Plan Funded (Curtailed)
2016 2015 2016 201540.1.7 Principal actuarial assumptions used in --------------------------Rupees--------------------------
the actuarial valuation
Discount rate 8% - 10.75% 9% - 10.5% 8% 9%Expected rate of return on plan assets - per annum 8% - 10.75% 9% - 10.5% 8% 9%Expected rate of increase in pension - per annum - - - 1%Expected rate of increase in future salaries - per annum 7% - 10.75% 8% - 10% - 8%
40.1.8 actual return on plan assets 121,471 87,038 4,826 3,823
40.1.9 Plan assets comprise of the following 2016 2015
Rupees (%) Rupees (%)Defined Benefit Gratuity Plans
Debt 313,800 72% 645,786 72%Mutual funds 14,325 3% 21,159 2%Equity 87,802 20% 119,230 13%Others 19,181 5% 110,934 13%
435,108 100% 897,109 100%
Defined Benefit Pension Plan
Debt 42,017 95% 38,998 96%Others 2,196 5% 1,837 4%
44,213 100% 40,835 100%
40.1.10 The expected return on plan assets was determined by considering the expected returns available on the assets underlying the current investment policy. Expected yields on fixed interest investments are based on gross redemption yields as at the balance sheet date.
40.1.11 Historicalinformationofstaffretirementbenefits
2016 2015 2014 2013 2012---------------------------------------Rupees--------------------------------------
Defined benefit gratuity plans Present value of defined
benefit obligation (481,202) (1,006,295) (1,011,159) (951,224) (836,528)Fair value of plan assets 435,108 897,109 1,006,330 835,743 773,942 Deficit (46,094) (109,186) (4,829) (115,481) (62,586)
Defined benefit pension plan Present value of defined
benefit obligation (32,132) (33,367) (34,406) (32,218) (181,783)Fair value of plan assets 44,213 40,835 38,824 38,535 187,719 Surplus 12,081 7,468 4,418 6,317 5,936
For the year ended December 31, 2016
notes to the ConsolidatedfinanCial statements(Amounts in thousand)
Annual Report 2016 201

40.1.12Expected future cost / (reversal) for the year ending December 31, 2017 is as follows:
rupees
Defined benefit gratuity plans 33,699 Defined benefit pension plan (930)
40.1.13 remeasurement recognized in other Comprehensive income
Defined Benefit Gratuity Plan Funded
Defined Benefit Pension Plan Funded (Curtailed)
2016 2015 2016 2015--------------------------Rupees--------------------------
Gain / (Loss) from change in experience adjustments 14,576 (106,250) (128) 138 (Loss) / Gain from change in financial assumptions (16,024) (15,811) 158 247
remeasurement of obligation (1,448) (122,061) 30 385
Actual Return on plan assets 121,471 87,038 4,826 3,823 Expected Return on plan assets (89,423) (98,714) (3,495) (3,864)Difference in opening fair value of plan assets 2,916 8,568 2,580 2,242 remeasurement of Plan assets 34,964 (3,108) 3,911 2,201 Effectofassetceiling - - (4,613) (3,050)
33,516 (125,169) (672) (464)
40.1.14sensitivity analysis
The impact of 1% change in following variables on defined benefit obligation is as follows:
Defined Benefit Gratuity Plans Funded
Defined Benefit Pension Plan Funded (Curtailed)
Increase in Assumption
Decrease in Assumption
Increase in Assumption
Decrease in Assumption
--------------------------Rupees--------------------------
Discount rate 438,000 501,062 30,261 34,235 Long term salary increases 498,634 439,604 - - Long term pension increases - - 34,390 30,101
Gratuity Pension40.1.15MaturityProfile Plans Plan
---------Rupees---------Time in years
1 29,805 4,013 2 70,303 4,013 3 95,701 4,013 4 26,598 4,013 5-10 259,033 4,013 11-15 301,316 4,013 16-20 432,352 4,013 20+ 1,061,185 4,013
Weighted average duration 10.14 - 11 6.30
For the year ended December 31, 2016
notes to the ConsolidatedfinanCial statements(Amounts in thousand)
202 Dawood Hercules Corporation Limited

40.1.16mortality rate
The rates assumed were based on the SLIC 2001 - 2005 with 1 year setback mortality table.
40.2 Definedcontributionplans
An amount of Rs 275,937 (2015: Rs 293,053) has been charged during the year in respect of defined contribution plans maintained by ECL.
2016 2015---------------Rupees---------------
41. Cash generated from oPerations
Profit before taxation 82,543,930 30,385,411 Less: Profit before taxation attributable to discontinued operations (62,312,568) (4,293,985)Profit before taxation from continuing operations 20,231,362 26,091,426
Adjustment for non-cash charges and other items:
Depreciation 7,334,815 7,571,931 Amortization of intangible assets 48,206 48,964 Provision for impairment in major spare parts
& stand-by equipment - 3,270 Provision for advances and receivables - 1,086 Unrealised exchange (gain) / loss (14) 8,558 Impairment loss on E2E - 7,661 Amortization of prepaid financial charges 132,132 27,069 Amortization of direct cost on FSRU 86,516 72,096 Gain on disposal of property, plant and equipment - net (14,772) (42,730)Stores and spares / stocks written-off 11,898 29,795 Loss on fair value adjustments of
embedded derivatives and hedging instruments (23,982) - Provision for retirement and other service benefits 247,289 210,446 Income on deposits / other financial assets (1,256,871) (1,700,976)Share of income from joint venture and associates (3,035,349) (2,608,219)Financial charges (note 35) 5,661,522 8,071,451 Foreign currency translation 32,114 28,004 Provision for surplus and slow moving stores and spares 21,034 150,211 Provision for stock in trade (34,243) 56,812 Provision for impairment of other receivable - 215,718 Impairment of long term investment 95,713 -Provision for impairment of property, plant and equipment
and intangible assets - 3,430,816 Provisions against concessionary duty on import of raw materials
and gas infrastructure development cess 980,891 134,690 (Gain) / Loss on disposal of investment in subsidiary - (5,156,097)Realised loss on disposal of investments at ‘fair value
through profit or loss’ - 104,395 Provisions 208,384 - Gain on deemed disposal of SECMC (72,563) - Working capital changes (note 41.1) (12,501,121) (24,822,240)
18,152,961 11,934,137
For the year ended December 31, 2016
notes to the ConsolidatedfinanCial statements(Amounts in thousand)
Annual Report 2016 203

2016 2015---------------Rupees---------------
41.1 working capital changes
(Increase) / decrease in current assets- Stores, spares and loose tools (265,241) (268,084)- Stock-in-trade 310,046 (3,219,968)- Trade debts (7,107,117) (2,096,825)- Loans, advances, deposits and prepayments (226,048) (28,710)- Other receivables - net (5,751,689) (1,280,109)
(13,040,049) (6,893,696)Increase / (decrease) in current liabilities- Trade and other payables and provisions 538,928 (17,928,544)
(12,501,121) (24,822,240)
42. Cash and Cash equivalents
Cash and bank balances (note 18) 6,186,667 5,120,357 Short term investments (note 17) 27,014,748 12,570,835 Short-term borrowings (note 27) (7,304,519) (5,858,453)
25,896,896 11,832,739
43. finanCial instruments By Category
finanCial assets
loans and receivables at amortized costLoans and advances 3,903,433 5,427,328 Trade debts 13,733,482 6,733,613 Other receivables 1,541,291 2,006,290 Cash and bank balances 6,186,667 5,120,357 Accrued income 426,268 45,101
25,791,141 19,332,689 available for sale investmentsOthers, at cost - e2e Business Enterprises (Private) Limited
- unqouted - 95,713
Fairvaluethroughprofitandloss 62,651,151 11,827,935
held till maturity
Short term investments 2,074,376 2,222,177
finanCial liaBilities
financial liabilities measured at amortized cost
Borrowings 85,411,984 70,183,634 Trade and other payables 28,609,421 32,256,231 Accrued interest / mark-up 1,238,061 1,427,789
115,259,466 103,867,654
- Fair value through profit and lossDerivative financial instruments 251,760 381,245
For the year ended December 31, 2016
notes to the ConsolidatedfinanCial statements(Amounts in thousand)
204 Dawood Hercules Corporation Limited

44. finanCial risK management
44.1 financial risk factors
The Group’s activities expose it to a variety of financial risks: market risk (including currency risk, interest rate risk and other price risk), credit risk and liquidity risk. The Group’s overall risk management programme focuses on having cost efficient funding as well as to manage financial risk to minimize earnings volatility and provide maximum return to shareholders.
Risk management is carried out by the Group’s Finance and Planning departments under policies approved by the Senior Management.
a) market risk
i) Currency risk
Currency risk is the risk that the fair value of future cash flows of a financial instrument will fluctuate because of changes in foreign exchange rates.
This exists due to the Group’s exposure resulting from outstanding import payments, foreign commercial transactions, foreign currency loan liabilities and related interest payments. A foreign exchange risk management policy has been developed and approved by the management. The policy allows the Group to take currency exposure for limited periods within predefined limits while open exposures are rigorously monitored. The Group ensures to the extent possible that it has options available to manage exposure, either through forward contracts, options or prepayments, etc. subject to the prevailing foreign exchange regulations.
Engro Corportion Limited has given guarantees in favor of its subsidiary companies amounting to USD 133,542 (2015: USD 130,947). The devaluation / revaluation of currency will only impact contingent liabilities and the impact on consolidated post tax profit for the year is Nil.
At December 31, 2016, if the Pakistani Rupee had weakened / strengthened by 1% against the US Dollars with all other variables held constant, consolidated post tax profit for the year would have been lower / higher by Rs. 87,151, mainly as a result of foreign exchange losses / gains on translation of US Dollar denominated liabilities.
ii) interest rate risk
Interest rate risk is the risk that the fair value or future cash flows of a financial instrument will fluctuate because of changes in market interest rates. The Group’s interest rate risk arises from short and long-term borrowings and obligations under finance lease. These are benchmarked to variable rates which expose the Group to cash flow interest rate risk.
The Group analyses its interest rate exposure on a regular basis by monitoring interest rate trends to determine whether they should enter into hedging alternatives.
The Group manages its interest rate exposure through floating to fixed rate interest swaps on its foreign currency borrowings.
As at December 31, 2016, if interest rates on Group’s borrowings had been 1% higher / lower with all other variables held constant, consolidated post tax profit for the year would have been lower / higher by Rs 525,645, mainly as a result of interest exposure on variable rate borrowings.
For the year ended December 31, 2016
notes to the ConsolidatedfinanCial statements(Amounts in thousand)
Annual Report 2016 205

iii) other price risk
Other price risk is the risk that the fair value or future cash flows of a financial instrument will fluctuate because of changes in market prices (other than those arising from currency risk or interest rate risk), whether those changes are caused by factors specific to the individual financial instrument or its issuer, or factors effecting all similar financial instruments traded in the market.
As at December 31, 2016, the Group is not exposed to any significant price risk.
b) Credit risk
Credit risk represents the risk of financial loss being caused if counter party fails to discharge an obligation.
Credit risk arises from deposits with banks and financial institutions, trade debts, loans, advances, deposits, bank guarantees and other receivables. The credit risk on liquid funds is limited because the counter parties are banks with a reasonably high credit rating or mutual funds which in turn are deposited in banks and government securities. The Maximum exposure to credit risk is equal to the carrying amount of financial assets. The Group maintains internal policies to place funds with commercial banks/mutual funds having a minimum short term credit rating of A1 and AM3. The Group accepts bank guarantees of banks of reasonably high credit ratings as approved by management.
The Group’s fertilizer segment is exposed to a concentration of credit risk on its trade debts by virtue of all its customers being agri-based businesses in Pakistan. However, this risk is mitigated by applying individual credit limits and by securing a majority of trade debts against bank guarantees inland letter of credits and by the fact that the exposure is spread over a wide customer base.
The Group’s power segment is not exposed to any credit risk on its trade debts as these are secured by sovereign guarantee from the Government of Pakistan.
The Group’s polymers segment is not materially exposed to credit risk on trade debts as unsecured credit is provided to selected parties with no default in recent history and a major part is secured by bank guarantees and letters of credit from customers or written terms of agreement.
The Group monitors the credit quality of its financial assets with reference to historical performance of such assets and available external credit ratings. The carrying values of financial assets which are neither past due nor impaired are as under:
2016 2015---------------Rupees---------------
Loans and advances 3,903,433 5,427,328 Trade debts 12,485,978 6,249,835 Other receivables 1,541,291 1,961,189Accrued income 426,268 45,101 Short term investments 64,725,527 14,050,112Cash and bank balances 6,179,669 5,110,947
89,262,166 32,844,512
For the year ended December 31, 2016
notes to the ConsolidatedfinanCial statements(Amounts in thousand)
206 Dawood Hercules Corporation Limited

The credit quality of receivables can be assessed with reference to their historical performance with no or negligible defaults in recent history. The credit quality of Group’s bank balances and short term investments can be assessed with reference to external credit ratings as follows:
Bank Rating agency
RatingShort term Long term
Al-Baraka Bank Pakistan Limited JCR-VIS A1 AAllied Bank Limited PACRA A1+ AA+Askari Bank Limited JCR-VIS A1+ AABank Al Habib Limited PACRA A1+ AA+Bank Alfalah Limited PACRA A1+ AABank Islami Pakistan Limited PACRA A1 A+Burj Bank Limited JCR-VIS A-2 BBB+CIMB Bank Berhud Moody’s P2 A3Citibank N.A. Moody’s P1 A1Deutsche Bank AG Moody’s P2 Baa2Dubai Islamic Bank (Pakistan) Limited JCR-VIS A-1 A+Faysal Bank Limited PACRA A1+ AAFirst Bank of Nigeria Fitch Rating - BHabib Bank Limited JCR-VIS A1+ AAAHabib Metropolitan Bank Limited PACRA A1+ AA+Habibsons Bank Limited JCR-VIS A-1+ AAAHSBC Bank Middle East Limited Moody’s P1 A2Industrial & Commercial Bank of China Moody’s P1 A1JS Bank Limited PACRA A1+ A+MCB Bank Limited PACRA A1+ AAAMCB Islamic Bank Limited PACRA A-1+ AMeezan Bank Limited JCR-VIS A1+ AAMashreq Bank Moodys P-2 Baa2National Bank of Pakistan JCR-VIS A1+ AAANIB Bank Limited PACRA A1+ AA-Samba Bank Limited JCR-VIS A1 AASoneri Bank Limited PACRA A1+ AA-Standard Chartered Bank (Pakistan) Limited PACRA A1+ AAASummit Bank Limited JCR-VIS A1 A-The Bank of Punjab PACRA A1+ AA-United Bank Limited JCR-VIS A1+ AA+
c) liquidity risk
Liquidity risk represents the risk that the Group will encounter difficulties in meeting obligations associated with financial liabilities.
Prudent liquidity risk management implies maintaining sufficient cash and marketable securities, the availability of funding through an adequate amount of committed credit facilities. Due to dynamic nature of the business, the Group maintains flexibility in funding by maintaining committed credit lines available.
The Group’s liquidity management involves projecting cash flows and considering the level of liquid assets necessary to meet these, monitoring balance sheet liquidity ratios against internal and external regulatory requirements and maintaining debt financing plans.
For the year ended December 31, 2016
notes to the ConsolidatedfinanCial statements(Amounts in thousand)
Annual Report 2016 207

The table below analyses the Group’s financial liabilities into relevant maturity groupings based on the remaining period at the balance sheet date to contractual maturity dates. The amounts disclosed in the table are the contractual undiscounted cash flows.
2016 2015Maturity Maturity Maturity Maturity
upto after Total upto after Totalone year one year one year one year
---------------------------------------------- Rupees ----------------------------------------------Financial liabilities
Derivatives 249,653 2,107 251,760 393,070 17,382 410,452 Trade and other payables 28,609,421 - 28,609,421 29,808,836 - 29,808,836 Accrued interest / mark-up 1,238,061 - 1,238,061 1,427,789 - 1,427,789 Borrowings 21,681,347 63,754,640 85,435,987 29,410,102 40,773,532 70,183,634
51,778,482 63,756,747 115,535,229 61,039,797 40,790,914 101,830,711
44.2 Capital risk management
The Group’s objective when managing capital are to safeguard the Group’s ability to continue as a going concern in order to provide returns for share holders and benefit for other stake holders and to maintain an optimal capital structure to reduce the cost of capital.
The Group manages its capital structure and makes adjustments to it in the light of changes in economic conditions. To maintain or adjust the capital structure, the Group may adjust the dividend payment to shareholders or issue new shares.
The management seeks to maintain a balance between higher returns that might be possible with higher levels of borrowings and the advantages and security afforded by a sound capital position.
The regulatory regime in which the Group’s power segment operates, renders the value of the equity to a bond given the guaranteed IRR of 15% with an indexation allowed under the Power Purchase Agreement for changes in US $ / PKR exchange rate.
The Group’s strategy is to ensure compliance with the Prudential Regulations issued by the State Bank of Pakistan and is in accordance with agreements executed with financial institutions so that the total long term borrowings to equity ratio does not exceed the lender covenants. The total long term borrowings to equity ratio as at December 31, 2016 and 2015 are as follows:
2016 2015---------------Rupees---------------
Borrowings 77,007,465 63,575,181 Equity 172,962,421 92,866,877
249,969,886 156,442,058
Gearing Ratio 31% 41%
The Group finances its operations through equity, borrowings and management of working capital with a view to maintaining an appropriate mix between various sources of finance to minimize risk.
For the year ended December 31, 2016
notes to the ConsolidatedfinanCial statements(Amounts in thousand)
208 Dawood Hercules Corporation Limited
45. fair value estimation
45.1 The carrying value of all financial assets and liabilities reflected in the financial statements approximate their fair values. The table below analyses financial instruments carried at fair value by valuation method. The different level have been defined as follows:
- Quoted prices (unadjusted) in active markets for identical assets or liabilities (level1);
- Inputs other than quoted prices included within level 1 that are observable for the asset or liability, either directly (i.e. as prices) or indirectly (i.e. derived from prices) (level 2); and
- Inputs for the asset or liability that are not based on observable market data (level 3).
Level 1 Level 2 Level 3 Total----------------------------Rupees----------------------------
assets
Financial assets at fair value through profit and loss- Short term investments - 62,651,151 - 62,651,151
liabilities
Financial liabilities at fair value through profit and loss- Derivatives - 251,760 - 251,760
45.2 valuation techniques used to derive level 2 fair values
Level 2 fair valued instruments comprise short term investments and hedging derivatives.
Heding derivatives include forward exchange contracts, interest rate swaps and conversion option on IFC loans. These forward foreign exchange contracts have been fair valued using forward exchange rates that are received from the contracting banks and financial institutions. Interest rate swaps are fair valued using mark to market rates received from the banks and financial institutions The fair value of conversion options on IFC loan is determined using the option pricing model where its determinants are derived from observable market inputs.
Short term investments comprise treasury bills and fixed income placements which are valued using discounted cash flow model.
There were no transfers amongst the levels during the year.
46. Provident fund
46.1 The employees of the Group participate in a Provident Fund maintained by the Holding Company and ECL. Monthly contribution are made both by companies in the Group and employees to the fund maintained by the Holding Company and ECL at the rate ranging from 10% to 15% of basic salary.
For the year ended December 31, 2016
notes to the ConsolidatedfinanCial statements(Amounts in thousand)
Annual Report 2016 209

46.2 The following information is based upon the latest unaudited financial statements as at December 31, 2016 and the unaudited financial statements as at December 31, 2015 of the Provident Fund of the Holding Company and unaudited financial statements as at June 30, 2016 and the audited financial statements as at June 30, 2015 of the Provident Fund of the subsidiary companies.
2016 2015-----------Rupees-----------
Size of the fund - Total assets 3,265,886 3,221,418
Cost of the investments made 2,854,879 2,390,652
Percentage of investments made 94% 87%
Fair value of investments 3,074,607 2,795,119
46.3 the break-up of investments is as follows:
2016 2015Rupees % Rupees %
National Savings Scheme 790,504 26% 223,037 8%
Government securities 728,597 23% 1,045,090 36%
Listed securities and Unit trusts 927,211 30% 1,164,311 42%
Mutual Funds 19,098 1% 14,854 1%
Balances with banks in savingsaccount 609,197 20% 347,827 12%
3,074,607 100% 2,795,119 100%
46.4 The investments out of the fund have been made in accordance with the provisions of section 227 of the Ordinance and the rules formulated for the purpose.
For the year ended December 31, 2016
notes to the ConsolidatedfinanCial statements(Amounts in thousand)
210 Dawood Hercules Corporation Limited

47.
segm
ent r
ePor
ting
A busi
ness
segme
nt is a
grou
p of a
ssets
and o
perat
ions e
ngag
ed in
provid
ing pr
oduc
ts tha
t are
subjec
t to ris
ks an
d retu
rns th
at are
differ
ent fr
om th
ose o
f othe
r busi
ness
segme
nts. T
he m
anag
emen
t has
deter
mined
the o
perat
ing se
gmen
ts ba
sed on
the in
forma
tion t
hat is
prese
nted t
o the
Board
of Di
rector
s of
the Gr
oup f
or allo
catio
n of re
sourc
es an
d asse
ssmen
t of p
erform
ance
. Base
d on in
terna
l man
agem
ent re
portin
g stru
cture
and p
roduc
ts pro
duce
d and
sold,
the G
roup i
s orga
nized
into t
he fo
llowing
opera
ting se
gmen
ts:t y
pe of
segm
ents
n atur
e of b
usine
ssFe
rtilizer
This p
art of
the b
usine
ss ma
nufac
ture,
purch
ase an
d mark
et fer
tilizers
. The
opera
tions
of this
segm
ent in
clude
a wid
e ran
ge of
fertili
zer br
ands
, besi
des u
rea, w
hich p
rimaril
y com
prises
of En
gro Za
rkhez,
Zing
ro, En
gro DA
P and
Envy
etc. o
ptimiz
ed fo
r loca
l cultiv
ation
need
s and
dema
nd. F
urthe
r, the
segm
ent is
a lea
ding im
porte
r and
seller
of ph
osph
ate pr
oduc
ts wh
ich ar
e mark
eted e
xtensi
vely a
cross
Pakis
tan as
phos
patic
fertiliz
ers;
Polym
erTh
is part
of th
e busi
ness
manu
factur
es, m
arket
and s
ell Po
ly Viny
l Chlo
ride (
PVC),
PVC c
ompo
unds
, Cau
stic so
da an
d rela
ted ch
emica
ls all o
ver Pa
kistan
and f
ew Ce
ntral A
sian c
ountr
ies;
Food
This p
art of
the b
usine
ss ma
nufac
tures,
proc
esses
and s
ells da
iry pro
ducts
, beve
rages,
ice-cr
eam,
frozen
deser
ts an
d othe
r food
prod
ucts
all ove
r Paki
stan a
nd fe
w part
s of A
fghan
istan a
nd M
iddle e
ast. T
he se
gmen
t mark
ets an
d prom
otes it
s own
bran
ds in
local a
nd
foreig
n mark
ets th
rough
a ne
twork
of di
stribu
tors;
Powe
rTh
is part
of th
e busi
ness
includ
es po
wer g
enera
tion,
distrib
ution,
transm
ission
and s
ale of
electr
icity in
Pakis
tan an
d man
agem
ent s
ervice
s in Ni
geria;
Othe
r ope
ration
sTh
is part
of th
e busi
ness
comp
rises o
f othe
r ope
ration
s inclu
ding o
perat
ing a
termin
al for
hand
ling, re
gasifi
catio
n, sto
rage,
treatm
ent a
nd pr
ocess
ing of
LNG a
nd re
lated p
etrole
um pr
oduc
ts. It
also in
clude
s man
agem
ent o
f inves
tmen
ts in s
ubsid
iary co
mpan
ies an
d join
t ven
tures
by th
e Hold
ing Co
mpan
y.Ma
nage
ment
monito
rs the
opera
ting re
sults
of the
above
mentio
ned s
egme
nts se
parat
ely fo
r the p
urpos
e of m
aking
decis
ions a
bout
resou
rces t
o be a
llocate
d and
of as
sessin
g perf
orman
ce. S
egme
nt pe
rform
ance
is eva
luated
based
on op
erating
profit
or lo
ss wh
ich in
certa
in res
pects
, as e
xplain
ed in
table
be
low, is
mea
sured
differ
ently
from
profit a
nd los
s in th
e fina
ncial
statem
ents.
Segm
ent re
sults
and a
ssets
includ
e item
s direc
tly att
ributa
ble to
a seg
ment.
The f
ollowin
g infor
matio
n pres
ents
opera
ting re
sults
regard
ing op
erating
segm
ents
for th
e yea
r end
ed De
cemb
er 31
, 201
5 and
asset
inform
ation r
egard
ing op
erating
segm
ents
as at
Dece
mber
31, 2
016:
fertil
izer
Polym
erfo
odPo
wer
othe
r ope
ration
seli
mina
tion -
net
Cons
olida
ted2016
2015
2016
2015
2016
2015
2016
2015
2016
2015
2016
2015
2016
2015
------
------
------
------
------
------
------
------
------
------
------
------
------
------
------
------
------
------
------
------
------
------
--Rup
ees--
------
------
------
------
------
------
------
------
------
------
------
------
------
------
------
------
------
------
------
------
------
-----
Reve
nue f
rom ex
terna
l cus
tomers
(note
29)
69,53
7,253
86
,961,6
68
22,85
4,024
22
,263,7
42
44,24
6,343
51
,715,3
27
11,48
3,679
13
,419,2
58
17,50
2,225
16
,055,3
15
(8,41
5,856
) (8
,435,6
24)
157,2
07,66
8 18
1,979
,686
Segm
ent g
ross p
rofit /
(loss
) exc
luding
impa
irmen
t 17
,439,1
67
29,71
6,640
3,
935,0
09
2,77
3,243
9,
696,8
85
10,69
9,165
2,
274,3
32
2,53
0,479
10
,833,9
51
11,25
5,243
(8
,336,5
31)
(8,29
9,746
) 35
,842,8
13
48,67
5,024
Segm
ent e
xpen
ses -
net o
f othe
r inco
me (7
72,08
3) (6
,644,5
65)
(1,82
9,359
) (2
,028,8
84)
(6,12
1,740
) (6
,503,1
44)
(429
,962)
(427
,054)
60,35
0,742
6,
506,9
63
(2,69
7,389
) (1
,578,2
27)
48,50
0,209
(1
0,674
,911)
Incom
e on d
epos
its / o
ther
finan
cial a
ssets
(note
33)
153,6
52
1,35
9,711
1,
234
38,69
2 88
3 3,
444
155,5
96
97,29
0 2,
012,0
73
1,28
3,855
(6
31,57
6) (6
33,06
6) 1,
691,8
62
2,14
9,926
Impa
irmen
t -
-
-
-
-
(3
,406,8
49)
-
-
(95,7
13)
-
-
(47,3
35)
(95,7
13)
(3,45
4,184
)
Finan
cial c
harge
s (no
te 35
) (3
,186,7
55)
(5,11
3,731
) (9
19,58
7) (1
,143,1
22)
(415
,994)
(1,00
5,007
) (6
73,30
5) (4
43,59
1) (1
,820,6
26)
(1,61
3,736
) 58
5,677
40
0,524
(6
,430,5
90)
(8,91
8,663
)
Share
of in
come
from
joint
ventu
re an
d ass
ociat
e (no
te 36
) -
-
-
-
(3
8,871
) -
26
8,074
23
2,008
2,
806,1
46
2,37
6,211
-
-
3,
035,3
49
2,60
8,219
Incom
e tax
charg
e (no
te 37
) (4
,350,5
28)
(6,30
3,267
) (5
27,36
4) (2
84,05
3) (1
,154,5
35)
(1,14
2,226
) (1
31,90
3) (4
7,303
) (2
,466,7
08)
(1,22
1,385
) (4
74,54
7) (2
2,440
) (9
,105,5
85)
(9,02
0,674
)
Segm
ent p
rofit /
(loss
) afte
r tax
9,28
3,453
13
,014,7
88
659,9
33
(644
,124)
1,96
6,628
(1
,354,6
17)
1,46
2,832
1,
941,8
29
64,35
8,115
18
,587,1
51
(4,13
2,832
) (1
0,180
,290)
73,43
8,345
21
,364,7
37
Segm
ent p
rofit /
(loss
) afte
r tax f
rom
disco
ntinu
ed op
eratio
ns -
4,
619,5
50
-
-
2,48
4,131
3,
162,4
55
-
-
58,20
2,182
-
-
-
60
,686,3
13
7,78
2,005
Segm
ent a
ssets
102,8
03,51
2 11
0,817
,000
24,42
0,761
24
,211,7
64
1,88
5,446
29
,152,8
43
52,83
2,909
22
,438,9
83
110,6
12,19
3 59
,794,1
93
(31,7
74,56
9) (4
7,302
,234)
260,7
80,25
2 19
9,112
,549
Inves
tmen
t in jo
int ve
nture
and
asso
ciate
(note
8) -
-
-
-
31
,180,8
75
-
1,94
7,565
1,
557,1
43
7,40
7,837
7,
794,1
46
-
-
40,53
6,277
9,
351,2
89
Total
segm
ent a
ssets
10
2,803
,512
110,8
17,00
0 24
,420,7
61
24,21
1,764
33
,066,3
21
29,15
2,843
54
,780,4
74
23,99
6,126
11
8,020
,030
67,58
8,339
(3
1,774
,569)
(47,3
02,23
4) 30
1,316
,529
208,4
63,83
8
Total
segm
ent li
abiliti
es 61
,155,1
28
67,88
0,391
18
,416,5
82
18,87
8,036
60
6,569
12
,860,1
34
32,13
4,666
12
,275,8
02
23,86
2,823
22
,113,7
99
(7,82
1,660
) (1
8,411
,201)
128,3
54,10
8 11
5,596
,961
Capit
al ex
pend
iture
includ
ing
biolog
ical a
ssets
3,01
0,417
1,
985,3
48
644,6
57
660,7
08
1,39
8,909
1,
025,0
75
19,70
4,142
75
2,656
34
8,852
5,
467,7
74
-
-
25,10
6,977
9,
891,5
61
Depre
ciatio
n (no
te 5.2
) 5,
019,3
38
4,82
4,283
86
3,732
1,
269,1
08
2,03
0,341
2,
273,2
40
729,1
57
717,0
93
585,8
50
465,5
01
2,33
4 -
9,
230,7
52
9,54
9,225
Amort
isatio
n of in
tangib
le as
sets
(note
7.1)
17,60
8 24
,725
14,46
4 14
,871
30,44
1 53
,595
8,38
0 6,
217
4,76
2 27
5 -
-
75
,655
99,68
3
(Amou
nts in
thousa
nd)
For t
he y
ear e
nded
Dec
embe
r 31,
201
6
note
s to
the
Co
nso
lida
ted
fina
nCia
l st
atem
ents
Annual Report 2016 211

48. transaCtions with related Parties
Related party comprise subsidiaries, joint venture companies, associates, other companies with common directors, retirement benefit funds, directors and key management personnel. Details of transactions with related parties during the year, other than those which have been disclosed elsewhere in these financial statements, are as follows:
2016 2015-----------Rupees-----------
associated CompaniesPurchases and services 4,483,180 7,549,002 Sale of goods and rendering of services 416,447 358,545 Dividend Income 2,157,275 1,728,349 Investment inTreasury bills - 608,070 Redemption of investment in Treasury bills - 719,701 Payment of interest on TFCs and repayment
of principal amount 78,808 45,349 Advance against issue of share capital - 675,048 Share capital issued 9,984,463 168,000 Investment in mutual funds securities - 490,000 Redemption of mutual funds securities - 491,210 Reimbursement to associated companies 52,182 253,616 Reimbursement from associated companies 11,724 28,030 Expenses paid on behalf of associated companies 32,490 12,773 Utilization of overdraft facility 130,000 467,112 Repayment of overdraft facility 130,000 467,112 Mark-up on utilization of overdraft facility 157 2,172 Commitment in respect of operating lease 10,008 7,885 Membership fee and other subscriptions - 121 Commitment fee 2,712 5,492 Interest on deposit 60 1,504 Bank charges 1 4 Sale Of Brand - 5,900,000 Dividend Paid 2,519,029 1,270,986 Loan repaid 282,991 - Finance costs paid 90,861 - Accrued markup 5,398 - Interest on borrowing 85,935 - Investment in shares of associate 49,785 - Payments made to associated companies 16,422,469 - Payment against services to local banks 678,183 - Loans received 293,993 -
Joint venturesPurchase of services 1,030,385 1,147,606 Services rendered 306,610 18,801 Reimbursements 91,596 67,473 Dividend received 1,035,000 -
For the year ended December 31, 2016
notes to the ConsolidatedfinanCial statements(Amounts in thousand)
212 Dawood Hercules Corporation Limited

2016 2015-----------Rupees-----------
retirement fundsContribution to retirement benefit schemes / funds 464,994 840,272
Key management personnelSale of property, plant and equipment 858 567 Salaries and other short term employee benefits 934,770 1,078,764 Reimbursement of expenses 10,146 11,786 Commitment in respect of operating lease arrangements 758 -
othersMembership fee and other subscriptions 125 - Sale of operating assets to employees - 3,011 Dividend paid 131,195 - Other benefits paid 77,413 71,021
49. waiver from aPPliCation of ifriC - 4 “determining whether an arrangement Contains a lease”
The Securities and Exchange Commission of Pakistan (SECP) in pursuance of SRO 24 (1) / 2012 dated January 16, 2012 has granted waiver from the application of International Financial Reporting Interpretation Committee (IFRIC) - 4 “Determining Whether an Arrangement Contains a Lease” to all companies including power sector companies. However, the SECP made it mandatory to disclose the impacts on the results had IFRIC - 4 been applied.
If the Group were to apply IFRIC - 4, the agreement between EETPL and SSGCL for operating and provision of services, would have been classified as operating lease. However, the impact of such application over the assets, liabilities or the net profit of the Group for the year would have been immaterial.
50. donations
Donations include the following in which the Director of the Company or Group companies is interested:
Director Interest Name of donee 2016 2015in Donee -------------Rupees---------------
Ghias Khan Chairman Engro Foundation 106,000 102,500 Khalid Siraj Subhani ChairmanRuhail Mohmmad TrusteeShamshuddin A. Shaikh TrusteeBabur Sultan TrusteeSyed Mohammad Ali TrusteeNaz Khan TrusteeImran Anwar TrusteeJahangir Piracha Trustee
For the year ended December 31, 2016
notes to the ConsolidatedfinanCial statements(Amounts in thousand)
Annual Report 2016 213

51. ProduCtion CaPaCityDesigned
Annual Capacity Actual Production2016 2015 2016 2015
Urea Metric Tons 2,275,000 2,275,000 1,881,016 1,964,034 NPK Metric Tons 100,000 100,000 94,610 126,074 PVC Resin Metric Tons 178,000 178,000 172,000 162,000 EDC Metric Tons 127,000 127,000 106,000 100,000 Caustic soda Metric Tons 106,000 106,000 103,000 98,000 VCM Metric Tons 204,000 204,000 174,000 162,000 Power (note 52.1) Mega watt 1,881,005 1,855,782 1,264,667 1,424,015 Dairy and beverages Thousand Litres - 748,000 - 552,532
Milling / Drying unit ofrice processing plant(note 51.2) Metric Tons 414,000 414,000 28,474 45,982
Ice Cream Thousand Litres - 39,000 - 19,364
51.1 Output produced by the plant is dependent on the load demanded by NTDC and plant availability.
51.2 Three months season design capacity and production is dependent on availability of rice paddy.
52. numBer of emPloyees of the grouP
2016 2015
Number of employees 2,037 3,975 Average number of employees 2,014 4,040
53. seasonality
The Group’s fertilizer business is subject to seasonal fluctuations as a result of two different farming seasons viz, Rabi (from October to March) and Kharif (from April to September). On an average fertilizer sales are more tilted towards Rabi season. The Group manages seasonality in the business through appropriate inventory management.
The Group’s agri business is subject to seasonal fluctuation as majority of paddy / unprocessed rice is procured during the last quarter of the year which is the harvesting period for all rice varieties grown in Pakistan. However, rice is sold evenly throughout the year. The Group manages seasonality in the business through appropriate inventory management.
54. loss of Certain aCCounting reCords
During 2007, a fire broke out at PNSC Building, Karachi where the Head Office and registered office of ECL was located. Immediately following this event ECL launched its Disaster Recovery Plan due to which operational disruption and financial impact resulting from this incident remained minimal.
The fire destroyed a substantial portion of its hard copy records related to the financial years 2005, 2006 and the period January 01, 2007 to August 19, 2007 although, electronic data remained intact due to ECL’s Disaster Recovery Plan. The ECL launched an initiative to recreate significant lost records and was successful in gathering the same in respect of the financial year 2007. Hard copy records related to the already reported financial years 2005 and 2006 have not been recreated.
For the year ended December 31, 2016
notes to the ConsolidatedfinanCial statements(Amounts in thousand)
214 Dawood Hercules Corporation Limited
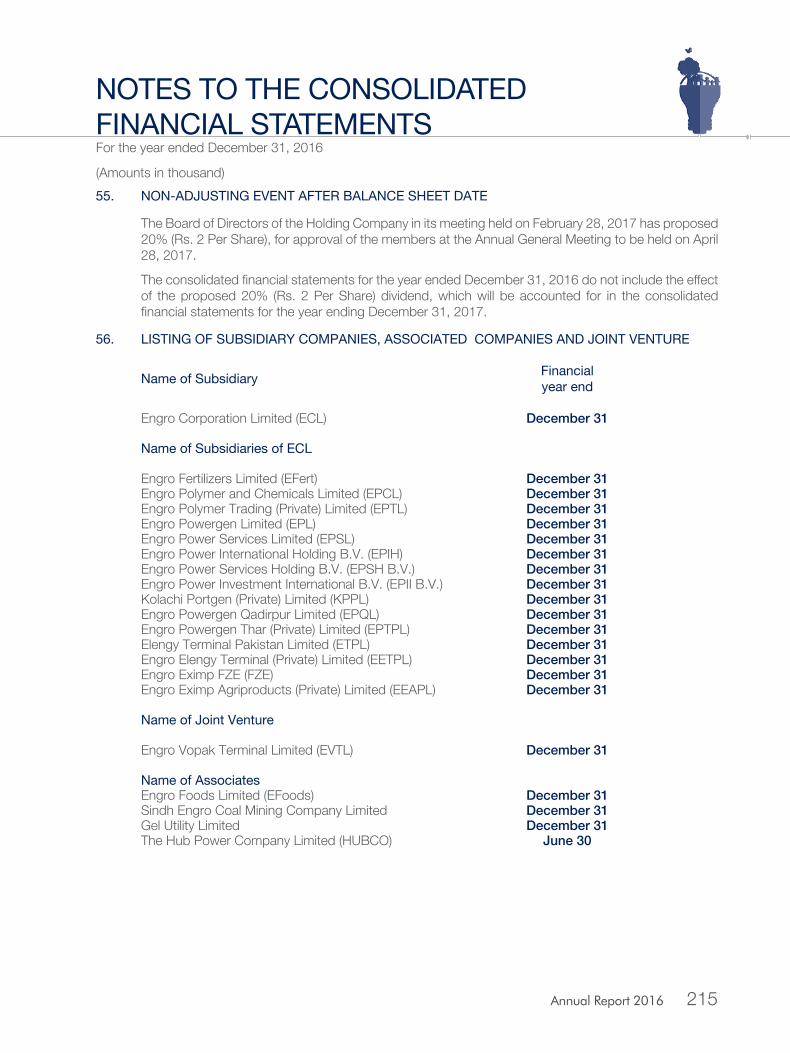
55. non-adJusting event after BalanCe sheet date
The Board of Directors of the Holding Company in its meeting held on February 28, 2017 has proposed 20% (Rs. 2 Per Share), for approval of the members at the Annual General Meeting to be held on April 28, 2017.
The consolidated financial statements for the year ended December 31, 2016 do not include the effect of the proposed 20% (Rs. 2 Per Share) dividend, which will be accounted for in the consolidated financial statements for the year ending December 31, 2017.
56. listing of suBsidiary ComPanies, assoCiated ComPanies and Joint venture
name of subsidiary financialyear end
Engro Corporation Limited (ECL) December 31
name of subsidiaries of eCl
Engro Fertilizers Limited (EFert) December 31Engro Polymer and Chemicals Limited (EPCL) December 31Engro Polymer Trading (Private) Limited (EPTL) December 31Engro Powergen Limited (EPL) December 31Engro Power Services Limited (EPSL) December 31Engro Power International Holding B.V. (EPIH) December 31Engro Power Services Holding B.V. (EPSH B.V.) December 31Engro Power Investment International B.V. (EPII B.V.) December 31Kolachi Portgen (Private) Limited (KPPL) December 31Engro Powergen Qadirpur Limited (EPQL) December 31Engro Powergen Thar (Private) Limited (EPTPL) December 31Elengy Terminal Pakistan Limited (ETPL) December 31Engro Elengy Terminal (Private) Limited (EETPL) December 31Engro Eximp FZE (FZE) December 31Engro Eximp Agriproducts (Private) Limited (EEAPL) December 31
name of Joint venture
Engro Vopak Terminal Limited (EVTL) December 31
name of associatesEngro Foods Limited (EFoods) December 31Sindh Engro Coal Mining Company Limited December 31Gel Utility Limited December 31The Hub Power Company Limited (HUBCO) June 30
For the year ended December 31, 2016
notes to the ConsolidatedfinanCial statements(Amounts in thousand)
Annual Report 2016 215

56.1 Set out below is summarised financial information for each subsidiary that has Non-Controlling Interests (NCI). The amounts disclosed for each subsidiary are before inter-company eliminations:
Name of Subsidiaries ECL EPQL EPTPL ETPL EFert EPCL
Total Assets 91,031,855 20,092,057 32,833,304 16,004,951 102,803,512 24,420,761 Total Liabilities 6,991,738 11,637,405 16,605,203 9,759,528 61,155,128 18,416,582 Total Comprehensive Income / (Loss) 61,866,809 1,787,688 (15,505) 1,449,953 9,298,650 670,451 Total Comprehensive Income
/ (Loss) allocated to NCI 38,839,983 552,143 (7,328) 185,117 3,150,739 293,725 Accumulated NCI 52,760,385 2,659,091 10,599,679 1,237,815 18,097,449 2,659,299 Cash and Cash Equivalent 24,213,198 (2,829,377) 1,281,552 2,256,372 14,365 1,086,509 Cash (utilized in) / generated from
- operating activities (1,133,580) 2,315,826 1,791,772 1,164,849 1,047,279 3,106,877 - investing activities 39,531,658 (179,401) (22,950,247) 8,729 (1,676,472) (636,768)- financing activities (14,584,390) (2,893,113) 22,144,673 (598,969) (10,823,254) (245,736)
Dividend paid to NCI 8,815,659 251,875 - - 3,707,442 -
57. CorresPonding figures
Corresponding figures and balances have been rearranged and reclassified, wherever necessary, for the purpose of comparison, the effects of which are not material.
58. date of authoriZation for issue
These consolidated financial statements were authorized for issue on February 28, 2017 by the Board of Directors of the Holding Company.
KarachiFebruary 28, 2017
Inam ur RahmanChief Executive
M. Abdul AleemDirector
For the year ended December 31, 2016
notes to the ConsolidatedfinanCial statements(Amounts in thousand)
216 Dawood Hercules Corporation Limited

As at December 31, 2016Disclosure requirement under the Code of Corporate Governance
Pattern of shareholding
Number ofshare held
1. Associated Companies, Undertaking and Related Parties
Dawood Lawrencepur Limited 77,931,896 Dawood Foundation 18,991,988 Cyan Limited 794,380 Sach International (PVT) Limited. 6,996
2. Mutual Funds
CDC - Trustee Meezan Islamic Fund 5,079,500 CDC - Trustee National Investment (Unit) Trust 1,427,196 CDC - Trustee Al Meezan Mutual Fund 905,200 CDC - Trustee NAFA Islamic Stock Fund 645,400 CDC - Trustee HBL - Stock Fund 614,300 CDC - Trustee NAFA Stock Fund 590,400 CDC - Trustee Meezan Tahaffuz Pension Fund - Equity Sub Fund 563,900 CDC - Trustee MCB Pakistan Stock Market Fund 553,700 CDC - Trustee Meezan Balanced Fund 438,000 CDC - Trustee KSE Meezan Index Fund 376,900 CDC - Trustee Nafa Islamic Active Allocation Equity Fund 341,900 CDC - Trustee MCB Pakistan Islamic Stock Fund 325,700 CDC - Trustee HBL Islamic Stock Fund 314,700 CDC - Trustee NAFA Islamic Asset Allocation Fund 267,200 CDC - Trustee Pak. Int. Element Islamic Asset Allocation Fund 215,000 CDC - Trustee Atlas Islamic Stock Fund 150,000 CDC - Trustee PICIC Islamic Stock Fund 138,400 CDC - Trustee Meezan Asset Allocation Fund 130,000 CDC - Trustee HBL Islamic Asset Allocation Fund 101,500 CDC - Trustee HBL Multi - Asset Fund 76,300 CDC - Trustee AKD Index Tracker Fund 71,496 MCBFSL - Trustee Pak Oman Islamic Asset Allocation Fund 62,000 CDC - Trustee PICIC Stock Fund 50,000 CDC - Trustee NIT Islamic Equity Fund 48,000 CDC - Trustee Askari Asset Allocation Fund 36,000 MCBFSL - Trustee Pak Oman Advantage Asset Allocation Fund 35,000 CDC - Trustee PIML Value Equity Fund 30,000 M C F S L - Trustee Askari Islamic Asset Allocation Fund 26,000 CDC - Trustee First Capital Mutual Fund 25,000 CDC - Trustee PIML Islamic Equity Fund 25,000 CDC - Trustee Askari Equity Fund 23,800 CDC - Trustee NIT-Equity Market Opportunity Fund 10,000 CDC - Trustee NAFA Multi Asset Fund 9,000
3. Directors, CEO and their Spouse(s) and minor children
Mr. Hussain Dawood - Chairman 34,058,516 Ms. Kulsum Dawood (W/o Mr. Hussain Dawood) 11,202,400 Mr. Shahzada Dawood 5,496,616 Ms. Sabrina Dawood 5,492,616 Mr. Samad Dawood 3,916,616 Mr. Inam ur Rahman 9,680
Annual Report 2016 217

As at December 31, 2016Disclosure requirement under the Code of Corporate Governance
Pattern of shareholding
Number ofshare held
4. Executives 3,000
5. Public Sector Companies and Corporations 16,388,937
6. Banks, Development Finance Institutions, Non-Banking Finance Institutions, Insurance Companies, Takaful, Modaraba and Pension Funds 8,687,610
7. Shareholder Holding five percent or more voting Rights in the Listed Company
Dawood Lawrencepur Limited 77,931,896 Calfran Limited 45,722,500 Hercules Enterprises Limited 43,281,216 Alzarat Limited 38,376,008 Zincali Limited 38,376,008 Palmrush Investments Limited 36,240,796 Persica Limited 36,240,796 Mr. Hussain Dawood 34,058,516
8. Trades in the shares of the Company by Directors, Executives, their spouses and minor children
Following trades in the share of the Company were made by an executive:
Name Date Purchased Sold Rate / per share
Mr. Zubair Abdullah 4-Oct-16 100 - 135.69Mr. Zubair Abdullah 4-Oct-16 2,900 - 135.7
218 Dawood Hercules Corporation Limited

As at December 31, 2016Category - Wise
Pattern of shareholding
Shareholders Category No. of Shareholder
Total Shares Held
Percentage%
Directors, Chief Executive Officer, and their spouse and minor children 6 60,176,444 12.50%
Associated Companies, Undertakings and related Parties 4 97,725,260 20.30%
NIT and ICP 2 680 0.00%
Banks, Development Financial Institutions, Non Banking Financial Institutions 17 10,378,886 2.16%
Insurance Companies 7 14,301,288 2.97%
Modarabas and Mutual Funds 35 13,721,492 2.85%
Share holders holding 10% 1 77,931,896 16.19%
General Public :a. Local 3,924 21,525,968 4.47%b .Foreign - - -
OthersForeign Companies 12 261,128,492 54.26%Others 65 2,328,606 0.49% Total (excluding : share holders holding 10%) 4,072 481,287,116 100.00%
Annual Report 2016 219

No. of Shareholders Shareholding Total Shares Held 600 1 100 24,637 779 101 500 270,389 471 501 1,000 418,936
1,587 1,001 5,000 3,485,255 258 5,001 10,000 1,901,098 115 10,001 15,000 1,419,898 54 15,001 20,000 991,531 38 20,001 25,000 861,695 10 25,001 30,000 287,072 14 30,001 35,000 478,886 11 35,001 40,000 425,824 7 40,001 45,000 297,842
20 45,001 50,000 983,176 6 50,001 55,000 316,992 8 55,001 60,000 469,656 3 60,001 65,000 186,856 5 65,001 70,000 344,012 7 70,001 75,000 506,097 4 75,001 80,000 309,800 1 80,001 85,000 80,500 1 90,001 95,000 91,500 7 95,001 100,000 688,308 4 100,001 105,000 406,900 2 105,001 110,000 219,000 2 120,001 125,000 244,796 3 130,000 135,000 397,100 1 135,001 140,000 138,400 1 150,000 155,000 150,000 1 160,000 165,000 160,000 2 170,001 175,000 348,116 1 195,001 200,000 197,352 2 215,000 220,000 430,900 1 230,001 235,000 234,600 1 250,000 255,000 250,000 1 260,000 265,000 260,000 1 265,001 270,000 267,200 1 300,000 305,000 300,000 1 310,001 315,000 314,700 1 325,001 330,000 325,700 1 335,001 340,000 336,072 1 340,001 345,000 341,900 1 350,001 355,000 353,420 1 375,001 380,000 376,900 1 435,001 440,000 438,000 2 500,000 505,000 1,000,000 1 530,001 535,000 534,000 1 550,001 555,000 553,700 1 560,001 565,000 563,900 1 590,001 595,000 590,400 1 600,000 605,000 600,000 1 610,001 615,000 614,300 1 630,001 635,000 631,192 1 645,001 650,000 645,400 1 790,001 795,000 794,380 1 905,001 910,000 905,200 1 1,020,001 1,025,000 1,021,000 1 1,315,001 1,320,000 1,317,400 1 1,425,001 1,430,000 1,427,196 1 1,970,001 1,975,000 1,970,100 1 3,565,001 3,570,000 3,569,300 1 3,915,001 3,920,000 3,916,616 1 4,180,001 4,185,000 4,183,192 1 5,075,001 5,080,000 5,079,500 2 5,490,001 5,495,000 10,985,228 1 5,495,001 5,500,000 5,496,616 1 11,200,001 11,205,000 11,202,400 1 12,200,001 12,205,000 12,204,788 1 18,990,001 18,995,000 18,991,988 1 20,930,001 20,935,000 20,930,568 1 34,055,001 34,060,000 34,058,516 2 36,240,001 36,245,000 72,481,592 2 38,375,001 38,380,000 76,752,016 1 43,280,001 43,285,000 43,281,216 1 45,720,001 45,725,000 45,722,500 1 77,930,001 77,935,000 77,931,896
4,072 Total 481,287,116
As at December 31, 2016Pattern of shareholding
220 Dawood Hercules Corporation Limited
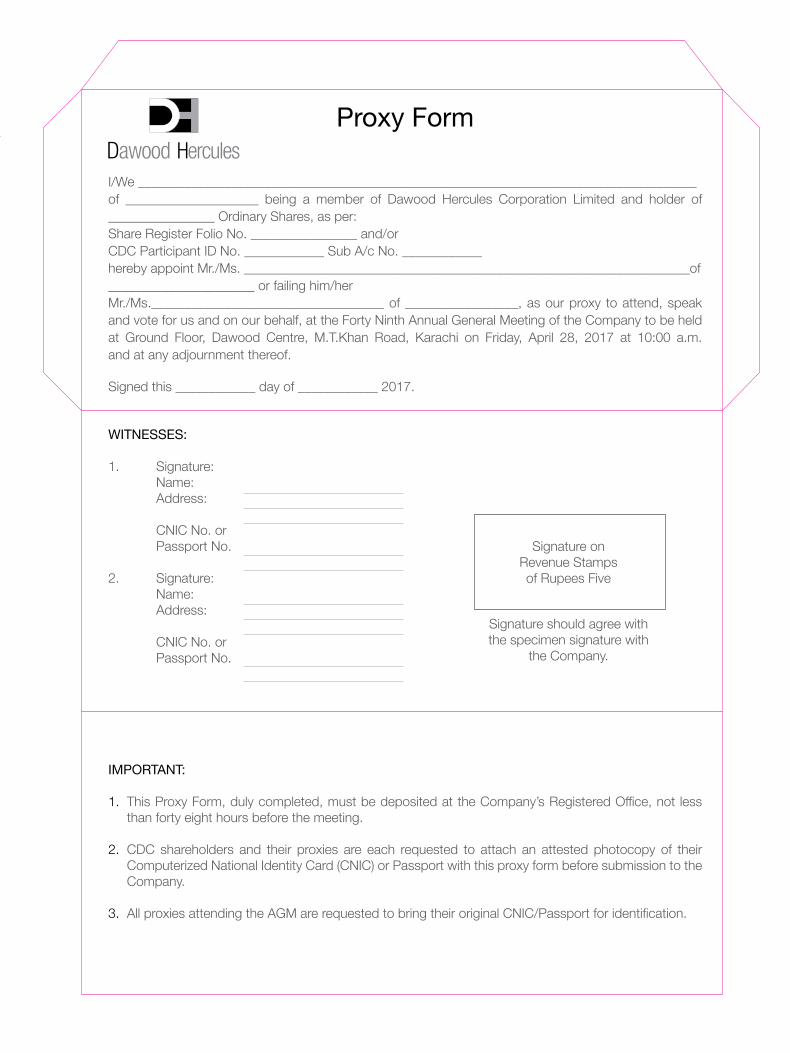
Proxy form
I/We ____________________________________________________________________________________of ____________________ being a member of Dawood Hercules Corporation Limited and holder of ________________ Ordinary Shares, as per:Share Register Folio No. ________________ and/orCDC Participant ID No. ____________ Sub A/c No. ____________hereby appoint Mr./Ms. ___________________________________________________________________of______________________ or failing him/her Mr./Ms.___________________________________ of _________________, as our proxy to attend, speak and vote for us and on our behalf, at the Forty Ninth Annual General Meeting of the Company to be held at Ground Floor, Dawood Centre, M.T.Khan Road, Karachi on Friday, April 28, 2017 at 10:00 a.m. and at any adjournment thereof.
Signed this ____________ day of ____________ 2017.
witnesses:
1. Signature: Name: Address: CNIC No. or Passport No.
2. Signature: Name: Address:
CNIC No. or Passport No.
imPortant:
1. This Proxy Form, duly completed, must be deposited at the Company’s Registered Office, not less than forty eight hours before the meeting.
2. CDC shareholders and their proxies are each requested to attach an attested photocopy of their Computerized National Identity Card (CNIC) or Passport with this proxy form before submission to the Company.
3. All proxies attending the AGM are requested to bring their original CNIC/Passport for identification.
Signature onRevenue Stampsof Rupees Five
Signature should agree with the specimen signature with
the Company.

AFFIXCORRECTPOSTAGE

úÒÏ»Ãgx
______________________________________ ‚Á ____________________________________ ~Bë_____________ ¬x‰ì.¥gZe¯C� ________________________ MŠZîŠCÙÃ:»g7gc™ÆgÁzqï__________________ HxBH) ___________ Zzgf~3M� ____________________ ZzgBc*Ïe~ÏÆÑZÇWðe~�________________________________ c*zg‹ŠvHxBH) _________________________________ ‚Á
ÃZK(',zi-ñgQ82Z6,s71021‰Ü00:01Wð®x¤/Zî&+jgÔŠZîŠçÔZ*K _________________________________ ‚Á{ygzeÔ™Zc~Âc*–~ƒäzZávÆ94z,‚Ñ:Z°µ¬x~gZñŠyÏÆnZCúÒ{Hg™@*B™CƒVX
7102 _______________ ',zi _____________ Š\
ÍZ{)1(____________________ Š\ÍZ{:____________________ **x:____________________ Ø:____________________
Š\vÆ0*k¬ÐôpŠ%:Æ_.ƒä¢zg~÷X ____________________ ¸òÙ!»ge�c*:___________________ 0*7g�:
ÍZ{)2(___________________ Š\ÍZ{:___________________ **x:___________________ Ø:___________________
___________________ ¸òÙ!»ge�c*:___________________ 0*7g�:
â^:0Óx**'׊ŠHVZÏßg]~ñW,ƒVÏZ#6,ZËÃgx¯xvÆgZeW~~Z°kÆHg{z‰ÜÐ84]IñßwƒVX0Ïe~Ï_2.ç IJGƒ®giZzgZyÆúÒzVÐ�ÛŠU�ÛŠUŠgpZ„ìāz{ZLÛR,Z,eòÙ!»geŤ&”{Üc*0*7g^ÔúÒÏÃgxŠZ4™ä
ÐIZkÆ‚BÝ™,X0Óx6,Z˃®giZKÙ|#ÆnZ°kÆz‰ÜZCZÝÙ!»gec*0*7g¢zg7™,X
£/)0*õgz9»(g-Š]ðV™,ZzgŠ\™,
AFFIXCORRECTPOSTAGE

ZÖgÎ
1geZLÓx‰c*§y»ZyÆZOŠZzg¬zyÆn"u]¦/ZgìXëZLÓxzŠZgZyøwZLÑq-»gâ1CZzgŠvZŠZgzV»ÌµŠwÐ]tZŠZ™**eT÷MVäëЬzyZzgZOŠHZzgZ7¢ŠÑD÷āëZyÆ¢ŠZ]ÆDÆn%æFN³x÷X
ëZKZOðZzg5i}»]tZŠZ™**eT÷MVävÅF,¹Zzgp¥àÆnïmŠwÐÃÒÅX
ZÅxZ°Ý
rZhÁ
Annual Report 2016 225

(,}»gz!*g~ZŠZgzV6,%ÃiìZzgë,÷āt¿F,¹ÅgZ{~g»z^0YìXÎZÃgz!*g~e-i+&+i6,LÆÎfÐZŠZgzVÅpŠÃ(,}eä6,ÂWŠ¶ÅF,µ]~¶zZµƒÏXÂg7gã»çVÆ!*)ÎZÑZòZŠZgzVÅ0*Îy~uât»g~ÅÌj,(˃ÏX
Z�ÛZŠ~]~â�ZâVÅgzi',zi(,fƒð®ZŠÆ7ÃZq-LZzgÃu»gz!*g~Å¢zg]ì�Z7ZLZ0+g_.[™Æ»gMæà~¯nX¡Ó#Öc*)±%ZyÑÅVâ�ZâVÅgÉðZzgZOx7™YXëZk!*]6,¢gnp÷āÓä0*åV»gz!*g~Å×e$~ƒãeÂYètÓx¬@èV
Åuât»g~ЪCÙƒ@*ìX RFC ~EFoods ~F,¹»ã~¬ïìXZkÐ0*Îãu~¬@Šp~ÌZŸ†ƒÇ6ā
�ÛË,giÆn7©A¥Zk**]»qïì@*ëZk!*]ÆZ÷ág}÷ā¬@R6,IÅaZzZgLc*ËuJ-ic*Š{ƒÏX{xZ**`ÅaZzZg~ 2016/17 ‚w
ÆMU*g’gó4ƒDƒñr~ÆqÑ]Ôic*Š{ 2017 Á†VÆ!*z�Š‚iÇgñÌZzgŠv”VÆ',@ic*Š{oxVÅzzÐZŸ±ÅµìX‚iÇgñÌZzg¼(,~r-V~4(ÏZzgçÙqÑ]Å$+zª{áplMÒ÷X
:N ~ZŸ±ÅÑb½ã7VgëgÐYg~g„ Nutrients ƒZzgÐV 2.9%186 MT ~¬@R6,�ÛË,gÅÔÔ4~Æ‚B 2016/17
Ôg„X 33Mt Æ‚B 2.3% K Zzg 42Mt Æ‚B 30% ~PÔ111Mt Æ‚B 3.0%
ÅY+$Ð EFert £òR6,-gc*ÅÔ~‚âVÅ4MæãZzgÓ#ÖÅY+$Њ~YäzZà]4hå EH~Zzgœ1]Æ!*)ZŸ±ÅµìX’ÅHÐZkÅæ~ZŸ†ƒÇX 26MMSCFD
½ZðZâYÃZyÆŠ/ÔïÔ:©Zzg].]§Zi~ÐÃZ+{q݃ÇZzgZL™g@Ã4+£gÅ¡¬]�ÛZë™} EFoods ÅY+$Дwƈ RFC
äZkZŸ±Ã(,~uJ- EFoods ÏXZ¤/pg&½3ð GY
G{~e-KÆÎfZzgek,~¡¬]ÃIŠgz~eZ%Æ!*)aZzZg~ц~ZŸ†ƒZìÔ@*ë_.[™1ìZzgZL™g@6,Zk»¹„Á1úeZÑìXÓxzŠZgZyÅY+$ÐÓäR6,e-KZzgƒVÃx¯äÆnÃ@VÅ¢zg]ì@*āÓxzŠZgZyÃ)z~îg6,»x™ä»ñµxMnX
ÂZ**ðZzgÂZ**ð»ãCŠ~eJçÅZŸ°RöÃZEw™nÇZzgZk 200MMSCFD ZK EEPTL ZsZ+Y»»gz!*goÊg7ÂZ**ðÆdZy6,‡10*ä~ZCµ™ŠZgZŠZ™g;ìX
ÅZOðÃMÒ{‚wLMU*gŵìX
RöÅàg~Š}Š~ì�r#‚V$6, 1,320MW Å (CPHG) ÆnÔÓ#ÖäZkÅ�Zzz#-?ç GEFveÑ0*zgr#¾cv (HUBCO) 85½ðE
(Æ�Šg»g+³iÅ@*gõ~0*õâ{ÅÂW™Š~ìX0*zgö.$Zzg Letter of Support ä@*G~â) PPIP ŠgMæ~Ã%ÅãCŠ6,yÅYg„ìXNIiÃÃu™Šc*ŠHì@*āµ"Å',z‰ÜŠÃD¯c*YnX EPC wÆ
~ZL+³iƈÐ−jgëgÐF,¹™g„ìX 2016 ‚zÅâ´ì�Z6,s 8 85½ðEÔ�|ZEzÃwâ•vÆ
226 Dawood Hercules Corporation Limited

»ìwg3ŠHìZzgZyÐËÌnƤ/m,ÆgZ5 (IFRS) â1Cˆ!*]Å»g~~Ô0*Îy~‡.ÞZ:tÎZÑZòâ1Cg7gãÆ£gZ] (d
oƒîgÐÈK‰÷X
ZÚ9Nzw»ÂxLìZzgZkŸW,Z0+ZiÐYõZzgZ:tÃD¯c*ŠHìX (e
vÆ©wÆZ0+Ziлg¦/Zgg�Å&¢A6,ËnÆÃð“uz2]ñ�Š7÷X (f
»g7gf$ÍgSÅ4+gzZc*]ÐËn»âŠ~¤/m,7HŠHì‰ÆÅh45ëHEYgcø~¬]÷áï÷X (g
¦/¸b‚wÆ¿»g~Zzgâ1]Æ}ò¿~g7g^Æ‚BÝ÷X (h
eZ],IiÅF,šMÆ6,z¤/Zx -XIV
ik,Y,{‚wÆŠzgZyvÆZq-ZzgeZ],Iä_5½3ð GGgúZhZÞâzMs0*ÎyÅ¢zgc*]Æ_.»g7gf$ÍgS7g’Z¹ÎæE6,z¤/ZxÔeZ],IZ�m6,z¤/ZxÅŠ™àìX
�Û¢ÐAŠ+ -XV
ÃeMs»g7gf$ÍgSÅ¢zgc*]Æ_.vä�Û¢ÐAŠ+ÅÓx¬]MewZzg1geÆ‚t!*nKMY,}Zzgàg~Æn7™Š~÷X
wÆMU*g -XVI
ÀòY,{¤/z\ÂZ**ðÆ~uât»g~Æ!*)Ïg6,z¤/ZxÆ�u»ƒÐ(,ZÑZ•ŠZg0ŠHìTäÃ%Å»y0ZzgÂZ**ðŠzâV~ŠpªCÙÅìXòZÌÆqï)bÆiÆnøg}ÑÆ7ÃZŒŠz‚wÆŠzgZyÂZ**ðÆZyZU*NV~ÐZÒdwƒYNÐZzg0*ÎyÂZ**ðÅ
(Fossil aZzZg~pŠÓƒYñÇXëÂZ**ðÅZ½Cƒð(ß;.çEGE{mîg6,‡.Þ‰h+ˆ6,Âz%ÃigOÐTÅ$+zªMÒ{‚ßV~nãZgï6,Z®gÁHYnÇX…uÆŠv‡V6,ÌÏgƵZW,Z]ŵìZzg'×h+uât»g-VÅMæÅÌ7ÍðÅYg„ìX Fuels)
Æ‚Bøg~ÑZ•Ðek,~Zzg½ZðÃ`äÆn¡¬]Zzg(ß;.çEGEÅZq-5gf”gsƒÏXë Royal Friesland Campina µìā½Zðˆ~½7gçz-$Yg~gppÆn%æFNZy÷X
MÐ^™�ÛË,g»»gz!*gã~™ŠZg»qïƒÇYèøg~ÂzÃg/Æ].h+§jZzg&»41¹é GEG]Æ�Ûzr6,%Ãiì@*āaZzZgZzgÃg/ÆoxV~ZŸ†HYnXëZk!*]6,¢gnp÷āÃg/ÅaZzZg~Z¦ZŠ~ZŸ±Æn(ßY»™ŠZgZ•ðZëìT»ÃZ+{Zz‰à~ÃÇZzg�‚âVÅçÙqª~4~»!*)̶ÇX
gc{~âjw
o~gc{~âjw'×h+ë{ƒ@*Yg;ìYè0*Îyic*Š{»gz!*g~Ës”gs™zZäÆnÃ÷áVìX@*ëÔøg}x@}~Mc*ìāÓxF,Âz
Annual Report 2016 227
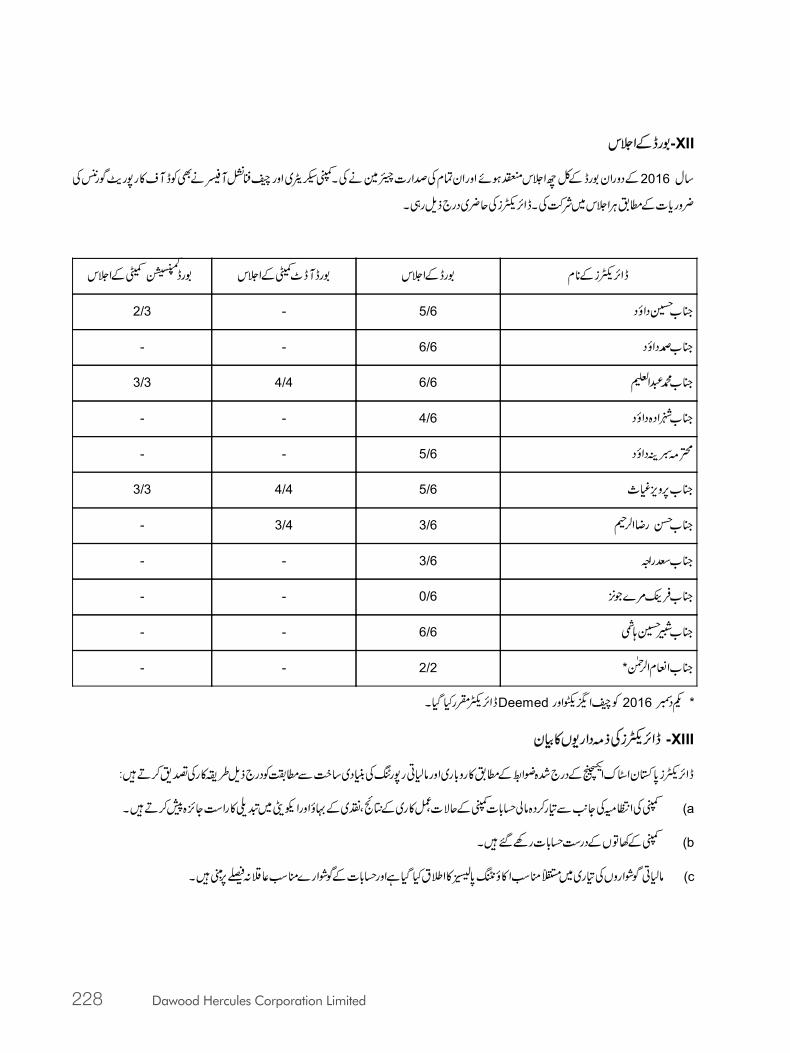
1geÆZ°k -XII
ÆŠzgZy1geÆÀbZ°kƒñZzgZyÓxÅœZg]ç}äÅXvóñ~Zzgr+MWäÌÃeMs»g7gf$ÍgSÅ 2016 ‚w¢zgc*]Æ_.CÙZ°k~Ñ•ÅXeZ],IiÅq¢~Šg`fsg„X
1ge².54h4jè FEGIEwÆZ°k 1geMewÆZ°k 1geÆZ°k eZ],IiÆ**x
2/3 - 5/6 »[@ŠZîŠ
- - 6/6 »[/ŠZîŠ
3/3 4/4 6/6 »[·†Z£
- - 4/6 »[PZŠ{ŠZîŠ
- - 5/6 H)hÜŠZîŠ3/3 4/4 5/6 »[6,zm,#_
- 3/4 3/6 gŸZ°° »[Œ
- - 3/6 »[ÄgZz
- - 0/6 »[�Ûi%}�4,
- - 6/6 »[Yn@;×
- - 2/2 * »[ZÅxZ°Ý
eZ],IHgHŠHX Deemed ÃrZhÁZzg 2016 JŠc *
eZ],IiÅf)ŠZg-V»Òy -XIII
eZ],Ii0*ÎyZ6uZÞâÆŠg`”{çZ*Æ_.»gz!*g~Zzgâ1Cg7gãÅãCŠ~‚|#Ð_“Êg`fs§i»gŤ&™D÷:
vÅZOðÅY+$лg™Š{âàˆ!*]vÆqÑ]Ô¿»g~Æ}òÔ×~Æ·îZzgZr¨~p~»gZ„Y,{7™D÷X (a
vÆ3ÂVÆŠg„ˆ!*]glj÷X (b
â1CÍØZgzVÅ»g~~MoƒZ»îì0*É4n.ç GGE»Z:tHŠHìZzg!*]ÆÍØZg}oƒ¬!:Ÿ6,FF÷X (c
228 Dawood Hercules Corporation Limited

âgLçâqZzgÍ7 -VI
144.33 �gz9(¶²âgLz= 57,341:2015 �gz9) 69,464 (Market Capitalization) ‚wÆZ!x6,vÅâgLçâqgz9°‰(g„X 70.22:2015 gz9°‰) 64.08 gz9(Zzg',q-Z\z= 119.14:2015 gz9°‰)
H-VII
‚(î×e-i+&+Å?m,7™D÷ 20 gz9°‰) 2 z,‚Ñ:Z°k¬x~‰c*§yÅàg~Æn 49 vÆeZ],Ii.e$ä]Æ‚B‚(»ˆg~e-i+&+Ì÷áïåX 135 gz9°‰) 13.5 gz9°‰åT~ 15.50 XZk‚w»Àe-i+&+
Z"54-ö GEHHg| -VIII
6,',ŒÛZgg„X A1+ ',ŒÛZgg¿X¾æCg|ÌLMU*gÆ‚B AA- ävÅîsæC™i+^g| PACRA ik,Y,{‚w~
¸ò�ZäZzgu~z -IX
�gz9(ZŠZGX 41,540:2015 �gz9) 42,150 ik,Y,{‚wÆŠzgZy¤/z\äƒVZzgÑ]Åæ~ù¦îg6,
6,zzi+.$Zzg¤/�¨-i -X
vÆ5i}ÃYzZágð],4ÆZZ+Ågx»‚w~Zq-%ûMe^HY@*ìZzgZ7ñizVuât»g-VÆfg)oƒZ0+ZiÐ7gZHY@*ìX)
�gz9(g„X 58.24:2015 �gz9) 58.74 Me^”{Z»îÛÆ_.6,zze.$-Åuât»g-VÅâqù¦îg6,
�gz9( 20.41:2015 �gz9¶) 16.88 J-¤/�¨öyÅXi{g¶ÆZU*NVÅgZ„7 2016 Šc31
1geMseZ],Ii -XI
eZ],Ii6,ŒìX1geMZyÅF,KMŠg`fsì: 11 1ge
5 Z&+"545å GFGEH.$eZ],Ii
4 **yZhÁeZ],Ii
)øwZq-e')åGHeZ],I( 2 ZhÁeZ],Ii
Annual Report 2016 229

�gz9ÆvyÆ£«~ZÏ‚w 644 ä¦/‚w EPQL Å@*gõÅ—F,+aZzZg~ÑbìX EPQL ƒ� 103KT »8ÎeZÅaZzZg�gz9»ZiLo«ªCÙHX 660
â1Cg7g -B
â1C»g™ŠÏ -I
Zg[gz9 35.84 Æn¤/z\»ù¦Ào« 2016 Zg[gz9g„X 157 Zg[gz9Æ£«~ 182 ¤/z\Åù¦Mæã¦/‚wÅZÏæ]ÆFriesland ‚‰ 51 ÆEFoods Å»g™ŠÏ~¶¶XŠzgZy‚w¤/z\ä EFoods Zzg EFert Zg[gz9ÁåZzgZkÅzz 9.38 g;�
Zg[gz9»o«Ì 24 ™ä6, Remeasure Ɖà EFoods Zg[gz9»uâtqÝHX'×h+',MV¤/z\Æ 34 Ã�Ûz|#GZzg Campina
Æ£« 2015 Zg[gz9»ZŸ†ƒZXÑq-»gµVZzg�Zzz#-?ç GEFiÃäzZáo«»z‚w 58 HXù¦îg6,Zk§bZŸ°Wæã~ Recognize
52.07 Æ£«~ 2015 Zg[gz9g;�‚w 73 Zg[gz9LÅZŠZ5Æv»ZiLo« 9 Zg[gz9g;X 3 ‚ZŸ±Æ‚B 16 ~�gz9g„�ā 7,422 �gz9Æ£«~ 21,932 Zg[gz9iZZ+ìXik,Y,{‚w~vÅMæãZÐZŠ~ãCŠ6,¦/¸‚wÅZÏæ]Æ
Æ2015 �ÛË,gi(ÅY+$ÐzZue-i+&+åXÓxF,ZyZY]Æv»ˆZiLo« DH �gz9Á¶ZzgZk¶Åzz‚—f~v) 14,510
�gz9g;X 5,470 �gz9Æ£«~ 20,194
°‰Mæã -II
53.12 gz9°‰¶Xù¦°‰MæãZk‚w 41.96 ~2015 gz9°‰g„�‚w 11.37 ~vÅ)ù¦°‰Mæã 2016 ‚wgz9(X 2015:19.17 gz9°‰g„)
Meñi -III
ñ�Š{MeñiÔZ}Zp�ÛÍÍZhvÔegR,eZ»î&454øEHEHÔMÒ{‚Ñ:Z°k¬xÆZ!xJ-gð],ƒgì÷ZzgZrVäpŠÃŠz!*g{½g~Æn7™Šc*ìX
ûƒäzZá‚wÆnxiZ}Zp�ÛÍÍZhvÔegR,eZ»î&454øEHEHÅ�gvÆMeñi½g~Å?m,7ÅìZzg1ge 2017 Šc31 Mewä
äZk?m,ÅÂ}ÅìX
PSX ‰Åyh+z�Ûz|#ÔZz‰©Zzg -IV
gz9¶² 132.82 �‰Åg]ňXgziZ:ÅZ!òÑbÅãCŠ6,vƉÅZz‰7 74.6 ik,Y,{‚w~0*ÎyZ6uZÞâ~vÆgz9°‰¶X 165.00 gz9Zzg 100.42 ÆŠzgZy!*nKM 2016 àVŃÐÁZzgƒÐic*Š{Ñb 52
‰c*q»{ā -V
J-vʼnc*q»{āÔìŠv¢zg~¥â]ÔZkg7gÆMy~6,ZËÃgxÆ‚Bñ�ŠìX 2016 Šc31
230 Dawood Hercules Corporation Limited
~oÆigIŠ!Æf{],~ƒÐic*Š{zeZ%zZàzZuƒÐ(,~esìX 2016
Æn”h+£«ÆgDyZzg6MäzZßVÅzzЙg@ÅF,¶]~¬gèp=VÆ!*)t‚w»°Miâ›U*"$ƒZXÓ#ÖäŠgMæ EFoods
�44,300 äEFoods ”{ek,~0*îeg6,g&½3ð GY
G{~e-KÆÎfZzgek,~¡¬]ÅŠz!*g{ŠgzÈ~™Æek,~¡¬]6,ZŸ°L¬Z+™Šc*ìX킶ƈ 24.5 �gz9Æ£«~ 3.162 ä¦/¸‚wÆ EFoods ‚ÁìX 11 gz9»ù¦o«ªCÙH�¦/¸‚wÆ£«~
�gz9»{Øo«ªCÙHX 2,387
gz9°‰Æˆ[Ð×e-i+&+Å?m,Š~ìTÅàg~MÒ{‚Ñ:Z°k¬x~‰c*§yÅY+$ 10 äEFoods Æn 2016 âà‚wЊ~YñÏX
ÂZ**ðZzgÂZ**ð»ãCŠ~eJç
‚g;X@*ëðÆyh+ZgzVÆMI 100.3 ‚Æ£«~‡.ÞZ´y 99.7 ÅŠø7!»K¦/‚wÅZÏæ]Æ (EPQL) ZEz0*zgX‡Šg7g™Å EPQL ‚g;X 67.2 ‚Æ£«~ 76.7 µ1ºé
YGzZ^ÅÁF,−Åßg]~',MæƒZZzgße1¦/¸‚wÆ 1,265 0*zgR,Z$i¨é EEg%>ƒä»³
�gz9ÁìX 10 �gz9g;� 1,788 �gz9gkgeÅZzg{Øo« 11,452 ‚¶Æˆ 14 Mæã¦/‚wÆ£«~µ1ºéY
GzZ^g„XZkæ]ÅÀ 18 ÃÑzqHŠHTÐðÅù¦F,−‚wÆZ!xJ- 2016 ZÆ', 11 Æ�z&+z0*zgö.$ (TGL) ÚǾZÏ™�gz9g„X 292.31 Mæã
EPC Ãâ1CZ!xqÝ™1ìX 2016 Z6,s 4 äâ1Cç@zVÆ�Óx¢zg~ÑZ_å™à÷Zzg (SECMC) �|ZEzÃwâ•6,z�2017 ‚w SECMC .îVÅeg#å™àˆTÐ 27 ÃÑzq™Šc*ŠHZzg 2016 NIiÂV$6,Ãu™Šc*ŠHìZzgèZzgßUä»»x#
Ð0*ãï%»M¸i™mXÍgZâÅfí{Ç{ëwuJ-åìZzg0*ãfí{™äÆn»gìX (aquifers) Å«�â„~M[Z0+z|#
�|Ð II ‡ìÅìTÆ��|~êÃwìšu SPV Ì�g (TEL) äZq-ZzgÀ$Ó»4-öGGf~vêZ3,Y™ (HUBCO) Š~r#0*zgv™Æ¢sÅŠgpZ„"2.ç EGFZäZÆ', TEL Æê5V$Ãw{âíâîB0*zgö.$ƪx»µ/¯c*ŠHìX (MW) ~zZ^ 1x330 µZ3,Y0*gu~
(EPC) äŠc~Zb8-Ô6,zYg4ZzgP TEL ÌYg~™Šc*ìX (Letter of Support) äŠc~@*G~â PPIB ~àg™àìX»M¸iƒŠHìX PPA Zzg IA ÆTEL à 2017 †g~ 25 ç@}6,ÌŠ\™ŠØ÷X!*ÆHyZkæ]ÆZ!xJ-Ô
~æ™ä»¿Yg~ìX (NEL) 85½ðEäZL**gzzZwö.$»°xZ‡xå™1ìZzgèÃg{ö.$ÃZkÆÓxF,ZU*NVZzgzZ‚]Æ‚B**gzzZwZ3,Y™85½ðEÅZq-À$Ó»4-öGGf~vìX NEL
�gz9Åù¦ÂZ**ðÅF,−ÅX 48,227 �gz9Æ£«~ 50,281 ûƒäzZà�„~¦/‚wÅZÏæ]Æ 2016 Šc31 85½ðEä�gz9Æ£«~ 5,308 Æ2015 ÅÆZzzg;#Zzg**gzzZwö.$Æ0*õZ+>.ç
EEEEÅ%#Ö¶Xù¦{Øo« 1 Zk¶ÅãCŠ~zzr#ö.$Æ-.$
gz9g„X 4.38 gz9Æ£«~ 4.59 �gz9g;Xù¦°‰Mæã¦/‚wÅZÏæ]Å 5,069
7Ê-,çGZzgØ
Zzg 174KTÅ VCMÔ172 KT ÅaZzZg PVC ä4»g™ŠÏZzgic*Š{aZzZg»bCÙ{HTÐ (EPCL) ÆŠzgZyZEz7Ê-,çGiZhØ™ 2016
Annual Report 2016 231

5.5 ƈgkgeÅYäzZàƒÐic*Š{Ñbìpt 2008-09 ‚ÅÑbÐZŸ†gkgeHŠH� 4.71 ÆŠzgZy0*Îãu~ 2016 âà‚w‚ÅÑb 6.80 (‚¶X@*ëQ%~ 0.19) ‚Æ£/@sÐÁìTÅãCŠ~zz¾kÔezwZzghÅaZzZg~¶Æ!*)ig¦%ÅÁF,¹
‚ÅÑbÐZŸ†ƒZX 5.71~ ÐZŸ†gkgeHŠHZzg}.â]Æ%
)±Zr¨uât»g-VÆMîjÅzzÐZr¨âgLŬ@R6,Ngz~Æ!*z�Š0*ÎyZ6uZÞâÆZ÷ágzV~ûZgZŸ†ŠÚ~Mc*TÆË‚»ZŸ†ªCÙHXz{¼ŠúZï� 45.7 ‚Æ£« 2 Æ¡ 2015 ŠgZÅug™àZzg‚w 47,806 Ã0*ÎyZ6uZÞâä 2016 Šc30~
(iii) (,}eä6,£òÈi+¨ (ii) 0*ÎyZ6uâgLÅ�Û&42.ç EHGJÐZ\kBâgL~4~ (i) ZkOW,Á»g™ŠÏ~çzyU*"$ƒñÔŠg`fs6,Œ÷ŠgZ~LLLóóMU*gÆ‚BF,¹X0*ÎyZ6uZÞâ "B" ÅY+$Ð0*ÎyÅg|Å S&P(v) Ïgµ1V6,7gÄZzg (iv) F,¹5+k,u
�Z%OeZ°Å)±�Ûz|#ÌâgLÆ%æFK³x 339 Z\kBÔŠzâVŠg�V~4+»g™ŠÏÅqïg„X©ā‚wÆŠzgZy MSCI �Û&42.ç EHGJZzg MSCI
gDyÆjA-:™mX
»gz!*g»Y, -II
väZEz»g7gcZzg85½ðEÆ‚BZCãCŠ~uât»g~7g¯CYg~g3XZk‚wÆŠzgZy�ÛË,giÔ½ZðZâÔØZzgÂZ**ðÆ%Y]»gz!*g~Šp»ãCŠ~%œ/gìX
�ÛË,gi‚ZŸ† 34 ~†V~¦/‚wÅZÏæ]Æ£«~ 2016 ik,Y,{æ]~3ŠÅ©¬@gCr~~¤/Zz^Æ!*)$+2gÁg÷Ô@*ëZ~
gz9ƒX 1,560 Z%OeZ°°HƒIÔTÐ0*Îy~°1g~3ŠÅ7(,|™ 240 ƒZ�(,|™
’Å�ÛZbÅàg~Š~ì�ZkÆŠzöÛÆ¿»gƒäÆn»°ìXŠzgZy‚w 26 MMSCFD Æn (EFert) äZEz�ÛË,g ECC
12 -gc*ÅaZzZgqÝÅX�Ûz|#»w¦/‚wÆ£«~ 1,881KT Æ',@ 1,968KTÅ 2015 ö.$äð”{R,yZgZî&+Æ!*) EFert
‚g;X 30 ‚¶Æ‚B 4 »âgL»z¦/‚wÆ£«~ EFert ~$YäzZàÃå3ŠÅZŸ°�ÛZb¶X 2015 ‚Ág;TÅzzâgL~
‚¶ 37 ¦/‚wÆ£«~ (PAT) ‚Á¶XíZiLo« 12 �gz9Åù¦MæãqÝÅ�¦/‚wÆ£«~ 77,415äEFert
�gz9ƒŠHXZk¶Æ:1»g�ÛâúZï~Á�Ûz|#Ô¼Š!*g†V~¶÷áï¸X»ZiZ!bz~îg6,îsZ=]Zzg¾Z=]ŒÛ£ 9,283 ƈgz9°‰ 2.5 äMÒ{‚Ñ:Z°k¬x~ZL‰c*§yÅàg~Æn EFert Æn 2016 Y]6,ÃU*ã”{ÁÑbÅ$+zªƒZXâà‚w
gz9°‰»ˆg~e-i+&+¬„ZŠZHY[ìX 4.5 e-i+&+Å?m,Š~ì²
½ZðZâäZL7g¯CÖq¯äZzguâñÅHÅÕiÆ�ZLHg{F,¹ÆZ@ZsÆŠgxyuât»g-VÊz!*g{áZiy™äÆn¼Š ECorp
ÆEFoods ~ZEz»g7gcä 2016 ~HåXŠc (EFoods) ZŠZâ]G÷XZy~Z(„Zq-ŠxZKuât»g~ÆZÒzÅZEzeiRoyal Friesland �Ûz|#GX� Friesland Campina Pakistan Holding B.V gz9°‰Å7�Ûz|#6, 120.5 �‰Ô 361
ÅŠzu~(,~‰c*CvìXtes EFoods ‚ÅzZã!Æ‚B 40 ÔECorp ÅZq-À$Ó»4-öGGf~vìXíÔ Campina M.V (RFC)
232 Dawood Hercules Corporation Limited

ŠZîŠCÙÃ:»g7gc™eZ],IiÅg7g^
ûƒäzZá‚wÆnâ1C‚wÅeZ],Iig7g^ZzgMe^”{â1CÍØZg}7™ä 2016 Šc31 ŠZîŠCÙÃ:»g7gc™)v(ÆeZ],Ii~ä]Ck™D÷X
u»Y,{
çÙ©**) -1
ÅMy~�â„~¬@u~Z½CƒðâgLÆ´Å4ßg�wZzgF,¹c*CèVÅLF,¹‰úZïÆZâZ`Æ!*)! 2016 ¬@u:‚ZŸ†ŠÚ~Mc*Zzg¬@u7gZ‚wLF,+g„X 2.7 ‚ZŸ±ÐiZZ+ª 2.5 gëg~»gDyg;Xa¶�â„~¬@u~Š~�â„Æ
Æ2015 ‚ZŸ±ÅrðÐZq-ŠgziZZ+g;Ô@*ëtZŸ† 2.5 ‚ƒŠH�ZkÐI 2.6 »ù¦ZŸ† 2016 a¶�â„ÆLZ÷ág-VÅ$+zª‚w~gëgF,¹~¶Æ!*z�Š¬@uäÂßg]qw~ÌZCYg~g3Zzg$+2gëwZ0+Ziлg™ŠÏ»bCÙ{HX 2016 ‚л°ÁåX 3.0
ñŠZW,Z]Æ!*)ñÌÅMiâ›ßg�w䉘´!*<mZ½Cƒðâgµ54øGHÆ´~igZ®)Æ%6,”h+tZW,Z]%A$GX ElNino ”h+
Åa¶�â„~Ñzq 2016 F,¹5+k,´~¼�â‘VÅNgëgF,¹ÆˆçÙø»]’gó4~ÅY+$Ç'×y÷XZâñÜsņV~(Protectionism) ƒäzZÑZŸ†Z½CƒðâgLÆ´ÅZÒe$ÆnplMÒìXZkÆ!*z�Š¬@©**óÊg7ƒÐ(,Zç{Dˆg]
~ZŸ±»gDyì�MZÑZògCç@zVÆZkÇÆZ!x»!*)0YìÔTäqDŠ;ÇV~¬@u»gc³HåXZke~œg‚{ 40 ƽã (GDP) ÐZµ™ä»êHÔ�Š*Åù¦F,ªCaZzZg (TPP) ÃZ%MÃR,Z÷Xôç@} 2017 †g~ 23 ez&Óå EHR,"Öä
Æ',Z',Zq-xˆgCç@{åZzgZkÕi»%œ/~KåTÆ�Z¨~uÆ(,_ƒñ™ŠZg»£™**°ŠåXZ[ƒÅÃ,uÆÜsGYäzZáÂZŠZâ]6,÷�Z%MÆ‚Bg]ÐZq-Lo«qÝ™@*ìXZ¤/uÆÜs¼{mˆgC0*Èc*V¬Z+ÅYC÷ÂZk»³Dîg6,Š*ÅŠzƒÐ(,~èVÆŠgxygCkBÅßg]~',MæƒÇX
£òuZâñÜsZzgZgïŤ/Cƒð©ÔÂZ**ðÅŠø7!~ZŸ±ZzgZð¬)Å4ßg]qwÆ!*)çÙF,¹~0*GZgbàÆZ÷ág}X÷Xâà‚w
~ãCŠ~eJvVZzgÂZ**ð (CPEC) ÆZ’ZðZ°ZŠzÑgQF,¹~ZŸ±ÃªCÙ™D÷X¸yZ™~!~ÅãCŠ~zz0*uuZOŠ~gZ@Zg~ 2016
Ƶ1V»M¸iìX
µÅYg„ìā4ˆgC»g™ŠÏÅ$+zªËuJ-ig¦ˆ~ƒäzZáv**]»ZiZ!ƒnÇX'×h+',MVÔ}.â]ƈ~Ìâà%ÔëwMIñ!*bg5�Ûz|#ÔÈgÇ{6,u¤/ò~ZŸ±Zzg8»xÆic*Š{o«Æ!*)F,¹ÅµìÔZ¤/pðu�ÛzÙZzgyŠ{�ÛzÙ~@*qw4~Å¢zg]ìX
¼ZZ+Æ!*z�ŠÔ0*Îy~ZKãF,¹ÆÁZ÷ágzVÅ$+zªZkÅZ�ÛZŠ~¸]ÅaZzZge$ZzgçÙF,¹OW,ƒðX½Åœ1]J-g‚ð$+2gÁìZzg6,ZÎ~½ÅŠÅÑbŠ*ÅÁF,+ÑjV~ÐZq-ìX
Annual Report 2016 233

All Rights Reserved. No part of this publication may be reproduced without the prior written permission of the publisher.© 2017, Dawood Hercules Corporation Limited

Annual Report 2016
FOOD & ENERGY
MAKING
AVAILABLE, AFFORDABLE, SUSTAINABLE
Dawood Hercules Corporation LimitedDawood Centre, M.T. Khan Road, Karachi - 75530
Tel: +92-21-35686001 Fax: +92-21-35693416
www.dawoodhercules.com
Daw
ood Hercules C
orporation Limited
Annual Report 2016