Food and Nutrition Security - Front page 1 October... · MICS Multiple Indicator Cluster Survey MMR...
38
Food and Nutrition Security In the Democratic People’s Republic of Korea
Transcript of Food and Nutrition Security - Front page 1 October... · MICS Multiple Indicator Cluster Survey MMR...

Food and Nutrition Security
In the
Democratic People’s
Republic of Korea


Foreword
Food insecurity and malnutrition in the Democratic People’s Republic of Korea are chronic in nature and re-
main highly vulnerable to shocks, especially those affecting domestic food production. While important action
has been taken to improve the situation in DPRK, more can and needs to be done. Achieving the best results,
moreover, relies on close partnership and cooperation in implementing complementary activities across multi-
ple sectors.
To better understand and map the situation in the country, the United Nation’s World Food Programme
(WFP) initiated a programme in 2012 to analyze food and nutrition security in the country, culminating in this
report on Food and Nutrition Security in the Democratic People’s Republic of Korea. For WFP, this work will
serve as one of the important guides helping the organization to better develop its programmes and interven-
tions, allocate limited resources, and improve targeting for better outcomes. It is hoped that this publication
will also serve as a key reference for the DPRK government and humanitarian partners working across the
country, expanding the evidence base necessary for improved decision making.
This work also stands as an advocate for greater availability of geographically disaggregated data in DPRK. Cur-
rently, information available at county and lower administrative levels is sparse, thereby restricting the ability to
analyze and understand the relative influence of underlying factors on food and nutrition security and limiting
the capacity to effectively and efficiently target vulnerable populations.
WFP would like to express its sincere gratitude to the government of DPRK for its continuous support of WFP
projects and looks forward to a fruitful partnership towards improving assistance in the future.
Dierk Stegen
September 2013
WFP Representative
Pyongyang, DPRK
ii
Acknowledgements
This report on Food Security and Nutrition in the Democratic People’s Republic of Korea was an initiative of
Claudia von Roehl and prepared under the overall coordination of Siemon Hollema and Anna-Leena Rasanen of
the World Food Programme. Synthesis and analysis of available food security and nutrition data and literature
review was conducted by Herbert Yanes, VAM Officer from WFP Honduras. Emily Mitchard Turano (WFP
Bangkok) provided writing as well as analysis and mapping support. Cinzia Papavero (WFP Bangkok) provided
additional analysis and mapping support. The report benefited greatly from the review and valuable contribu-
tions of many people, including Claudia von Roehl, Ariuntuya Tsend-Ayush, Marina Garcia Real, Liu Xuerong,
Nanna Skau, Soomee Baumann and Ruangdech Poungprom (WFP) and Marie-Claude Desilets (UNICEF DPRK).
Thanks goes also to Navchaa Suren (UNFPA-DPRK) for making available the 2008 Population Census Data, to
Belay Derza Gaga (FAO-DPRK) for making available the agricultural information and for recommendations on
the document, and to the DPRK National Coordination Committee (NCC-DPRK) for providing updated infor-
mation on population, weather, agricultural production and inputs, and food imports.
Photo credits:
Cover: Weeding Rice Paddies, Gerald Bourke/WFP
Foreword (Page v): Girl eating noodles, Rein Skullerud/WFP; Boy eating lunch, Rein Skullerud/WFP;
Schoolgirls at lunch, Gerald Bourke/WFP
Availability (Page 9): Road through the Mountains, Marcus Prior/WFP; Hay Mound, Marcus Prior/WFP
Access (Page 13): Bowls of Rice, Ruangdech Poungprom/WFP; Kitchen Garden: Marcus Prior/WFP
Utilization (Page 17): Food Aid, Ruangdech Poungprom/WFP; Woman Cooking, Rein Skullerud/WFP;
Mother and Child, Marcus Prior/WFP
For questions or comments concerning the food security and nutrition analysis, please contact:
WFP Country Office, DPRK
Anna-Leena Rasanen VAM Officer [email protected]
WFP Regional Bureau, Thailand
Siemon Hollema Senior Regional Programme Advisor [email protected]
Map Designations Used:
The depictions and use of boundaries, geographic names and related data shown on maps and included in the
tables throughout the document are not warranted to be error-free, nor do they necessarily imply official en-
dorsement or acceptance by the World Food Programme.

iv
Table of Contents
Foreword……………………………………………………………………………………………
Acknowledgments……….…………………………………………………………………..………
List of Acronyms .…………………………………………………………………………...………
Executive Summary …………………………………………………………………………………
Section I: What is Food and Nutrition Security?
A. The IPC Analytical Framework………………………………………………………….………
1. Food Security Outcomes …………………………………………………………………………
2. Availability ………………………………………………………………………………………...
3. Access ……………………………………………………………………………………………..
4. Utilization …………………………………………………………………………………………
5. Risk and Vulnerability ……………………………………………………………………………..
B. Who is Food Insecure in DPRK?....................................................................................................………
1. Methodology……………………………………………………………………………………….
Section II: Food Security Context in DPRK
A. Population and Economy ………………………………………………………………..………
B. Food Security Related Policies ………………………………………………………….………
1. Self-Sufficiency …………………………………………………………………………………….
2. PDS and Market Policies ...………………………………………………………………………..
Section III: Food Availability
A. Domestic Production……………………………………………………………………………
B. Food Assistance and Commercial Imports ……………………………………………..………
C. Food Balance ……………………………………………………………………………………
D. Production Challenges…………………………………………………………………...……...
1. Sloping Land ……………………………………………………………………………………….
2. Seasonality and Double-Cropping... ………………………………………………………………
3. Soil Fertility ………………………………………………………………………………………..
4. Other Agricultural Inputs …………………………………………………………………………
Section IV: Food Access
A. Physical Access ………………………………………………………………………….………
1. Public Distribution System ………………………………………….…………………………….
2. Wild Foods………………………………………………………………………………………...
3. Household Gardens and Livestock ………………………………………….……………………
ii
iii
vi
viii
1
2
2
2
2
2
3
3
5
6
6
6
7
8
8
9
9
9
10
10
11
11
12
12
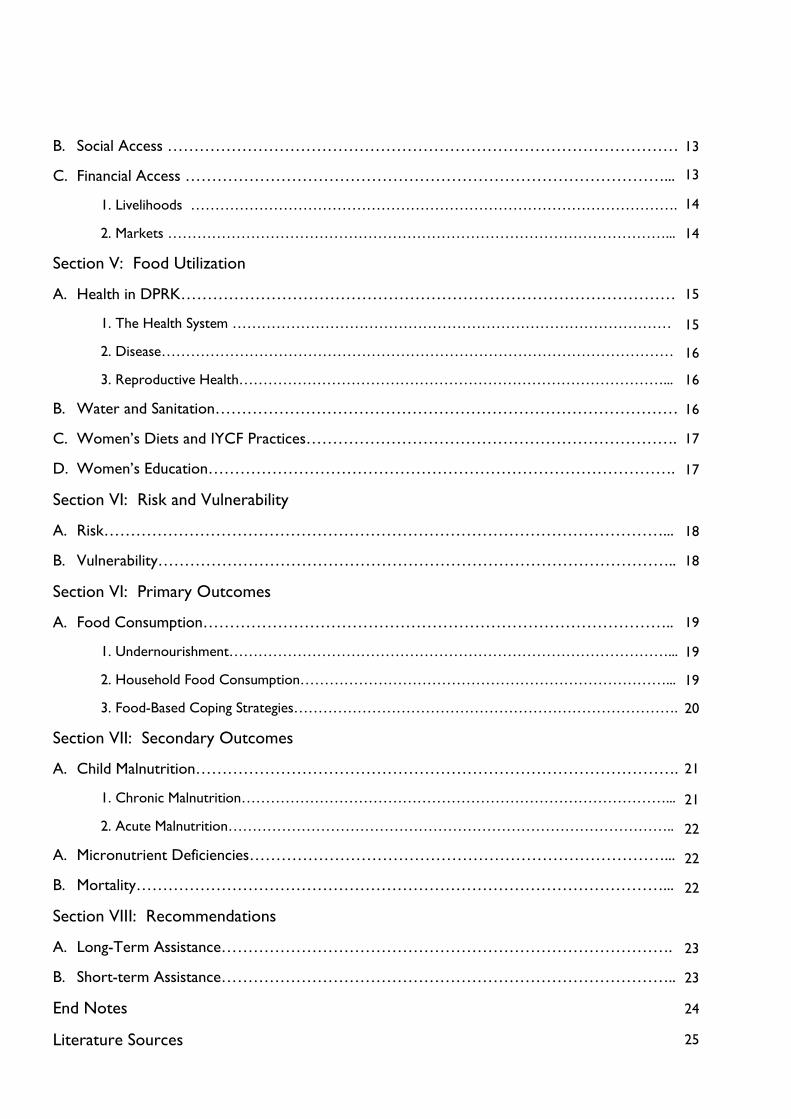
B. Social Access ……………………………………………………………………………………
C. Financial Access ………………………………………………………………………………...
1. Livelihoods ……………………………………………………………………………………….
2. Markets …………………………………………………………………………………………...
Section V: Food Utilization
A. Health in DPRK…………………………………………………………………………………
1. The Health System ………………………………………………………………………………
2. Disease……………………………………………………………………………………………
3. Reproductive Health……………………………………………………………………………...
B. Water and Sanitation……………………………………………………………………………
C. Women’s Diets and IYCF Practices…………………………………………………………….
D. Women’s Education…………………………………………………………………………….
Section VI: Risk and Vulnerability
A. Risk……………………………………………………………………………………………...
B. Vulnerability……………………………………………………………………………………..
Section VI: Primary Outcomes
A. Food Consumption……………………………………………………………………………..
1. Undernourishment………………………………………………………………………………...
2. Household Food Consumption…………………………………………………………………...
3. Food-Based Coping Strategies…………………………………………………………………….
Section VII: Secondary Outcomes
A. Child Malnutrition……………………………………………………………………………….
1. Chronic Malnutrition……………………………………………………………………………...
2. Acute Malnutrition………………………………………………………………………………..
A. Micronutrient Deficiencies……………………………………………………………………...
B. Mortality………………………………………………………………………………………...
Section VIII: Recommendations
A. Long-Term Assistance………………………………………………………………………….
B. Short-term Assistance…………………………………………………………………………..
End Notes
Literature Sources
13
13
14
14
15
15
16
16
16
17
17
18
18
19
19
19
20
21
21
22
22
22
23
23
24
25
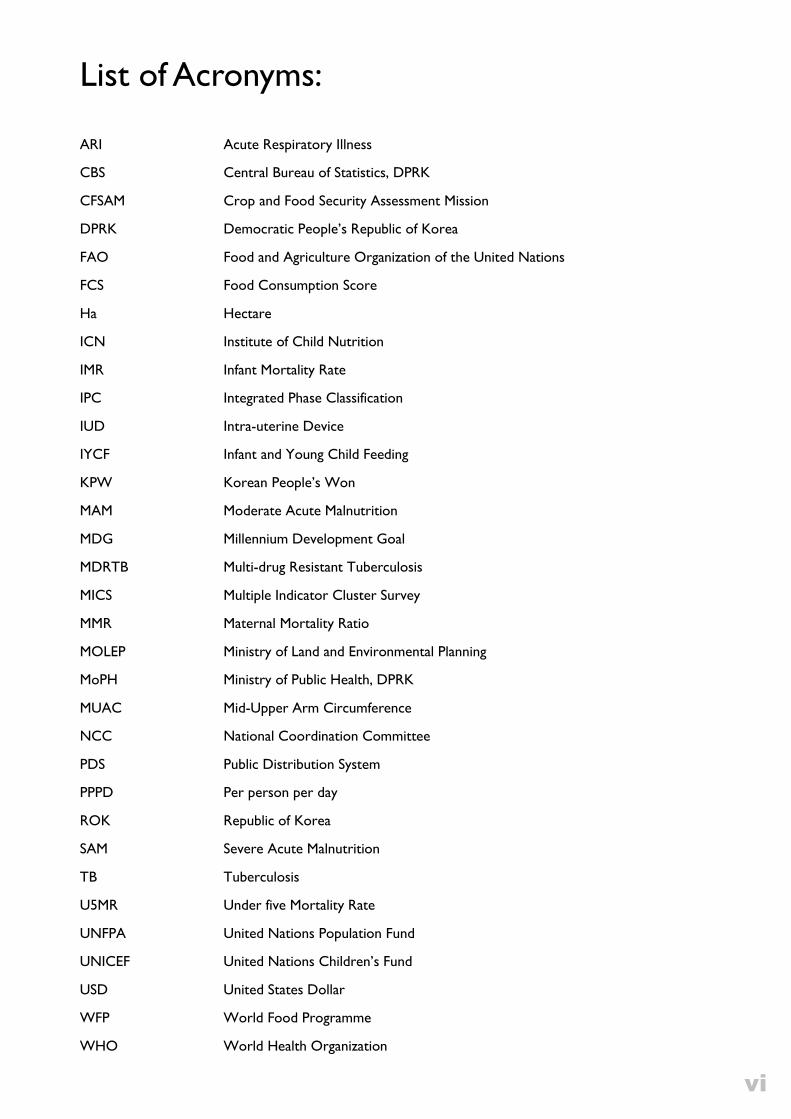
List of Acronyms:
ARI Acute Respiratory Illness
CBS Central Bureau of Statistics, DPRK
CFSAM Crop and Food Security Assessment Mission
DPRK Democratic People’s Republic of Korea
FAO Food and Agriculture Organization of the United Nations
FCS Food Consumption Score
Ha Hectare
ICN Institute of Child Nutrition
IMR Infant Mortality Rate
IPC Integrated Phase Classification
IUD Intra-uterine Device
IYCF Infant and Young Child Feeding
KPW Korean People’s Won
MAM Moderate Acute Malnutrition
MDG Millennium Development Goal
MDRTB Multi-drug Resistant Tuberculosis
MICS Multiple Indicator Cluster Survey
MMR Maternal Mortality Ratio
MOLEP Ministry of Land and Environmental Planning
MoPH Ministry of Public Health, DPRK
MUAC Mid-Upper Arm Circumference
NCC National Coordination Committee
PDS Public Distribution System
PPPD Per person per day
ROK Republic of Korea
SAM Severe Acute Malnutrition
TB Tuberculosis
U5MR Under five Mortality Rate
UNFPA United Nations Population Fund
UNICEF United Nations Children’s Fund
USD United States Dollar
WFP World Food Programme
WHO World Health Organization
vi


Executive Summary
In the context of domestic and foreign policies grounded in self-sufficiency, food security and nutritional adequacy in
the Democratic People’s Republic of Korea rely heavily on its domestic agricultural capacity. While national cereal
production has steadily improved in recent years, food shortages still pose a considerable challenge and key gaps ex-
ist particularly in the production of foods rich in necessary nutrients such as protein. According to government
sources, food produced throughout the country is centrally collected and re-distributed to all households in the na-
tion through the Public Distribution System (PDS). However, distribution can be erratic and rations often insufficient.
With international trade constrained, household market activity restricted, and individual and household movement
limited, household access to additional nutritious food exists mainly through small-scale home gardening and live-
stock production, collection of wild foods and informal mechanisms such as exchange and bartering. The result is a
food system remarkably vulnerable to natural disasters and other shocks to domestic agricultural productivity.
This analysis of food and nutrition security in DPRK aims to provide an overview of trends in food security and nu-
trition in the country based on the most recent available data and supplemented with a series of thematic maps. At
present, analysis is largely available at the national and provincial levels or related to certain sectors, such as agricul-
ture or health, with very little available at more disaggregated levels. As such, this document is an attempt to start
more disaggregated analyses that can be used to improve the targeting of the most food insecure and malnourished
counties and population groups, and facilitate the prioritization of activities accordingly.
As there is no single measure of food insecurity, the report employs the analytical framework of the Integrated Phase
Classification (IPC) to describe vulnerable populations according to the three food security dimensions (availability,
access and utilization), the contributing factors of vulnerability and the main outcomes of food and nutrition security.
A map of relative food insecurity, based on a composite index of data selected to reflect each of the three food secu-
rity dimensions provides an indication of which areas are likely to experience greater food insecurity. Subsequent
sections of the report then explore in greater depth the individual dimensions and factors affecting food and nutri-
tion security.
Overall this analysis indicates that geographic disparities of food insecurity in DPRK are largely driven by patterns of
food availability and access. The northern and eastern counties and districts tend to be more vulnerable to food inse-
curity when compared to those in the “cereal bowl” areas of the country (southern and western counties/districts)
where most of the production occurs. Households in small more remotely located urban districts tend also to be
more food insecure as access to home gardening is more limited.
Access to food is impacted by access to the PDS, with select groups such as workers in the defence, public admin-
istration, compulsory social security, mining, quarrying and construction sectors, as well as cooperative farmers, re-
ceiving preferential access. Household access to gardening space and to forests and rivers can increase access to nu-
tritious foods, carrying geographic implications such as for urban households compared to rural. Informal exchange in
the form of bartering and gifts is common practice for households and can also improve access to food.
viii
A major bottleneck for food utilization and for nutrition outcomes in DPRK remains the quality and diversi-
ty of women’s and children’s diets. Household food consumption is poor and for most households consists
of cereals or tubers combined with vegetables and oil in small quantities. While the prevalence rates of
stunting and underweight in DPRK have seen steady improvement since the late 1990s, seasonal peaks in
acute child malnutrition as well as micronutrient deficiencies remain major concerns. Mortality rates have
also declined, but remain high compared to regional neighbours.
Given the unique context of DPRK, a twin-track approach of long-term initiatives, including large-scale in-
vestment in agriculture and promotion of market reform and trade liberalization, combined with short-
term approaches including provision of humanitarian food, nutrition support and livelihood assistance is
needed to lift DPRK out of its current situation of recurrent food insecurity. Inherently, the long-term
changes necessary to improve food and nutrition security will involve both environmental and infrastructur-
al changes as well as changes to individual behavioural and management practices.

What is Food and Nutrition Security?
Food and nutrition security exists when all people, at all times, have physical, social and economic
access to food which is consumed in sufficient quantity and quality to meet their dietary needs and
food preferences, and is support by an environment of adequate sanitation, health services and care,
allowing for a healthy and active life (Committee on World Food Security, 2012).
Household food security is influenced by a complex interaction of agro-environmental, socio-economic and biologi-
cal factors with no direct measure. The Integrated Phase Classification (IPC) analytical framework integrates the
conceptual frameworks from food security, nutrition and livelihoods analysis in order to provide a comprehensive
and integrated approach to the analysis of food and nutrition security.
Food Security Contributing Factors
Causal Factors
Vulnerability: (exposure, susceptibility, and resilience to
specific hazards events or ongoing conditions).
Livelihood strategies (food & income sources, coping,
& expenditures)
Livelihood assets (human, financial, social, physical, &
natural)
Policies, Institutions, and Processes
Food Security Outcomes
Primary outcomes
Secondary outcomes
Food Con-
sumption
Feedback
Risk/Change
Food Security Dimensions
Stability (at all times)
Availability
Production
Reserves
Markets
Transportation
Access
Physical Access
Financial Access
Social Access
Utilization
Preferences
Preparation
Feeding practices
Food storage
Food safety
Water & sanitation
Impact
Acute events or ongoing conditions:
(natural, socio-economic, conflict, disease and others)
Non food security specific con-
tributing factors:
Disease
Water/Sanitation
Health social services
Others...
Nutrition
Mortality
Livelihood
Change
The IPC Analytical Framework
Improving food and nutrition security requires knowing where the most vulnerable are located and understanding
what makes them vulnerable. Targeting is a key mechanism for reaching vulnerable populations and ensuring efficient
and effective use of limited resources. It relies on the availability of up-to-date, disaggregated data. At present, food
security analyses in DPRK provide an overview at the national and provincial levels in relation to certain sectors
such as agriculture or health. Very little data and information is available at more disaggregated levels. As such, this
document is an attempt to start more disaggregated analysis that can be used to improve the targeting of the most
food insecure counties and population groups, and facilitate the prioritization of activities accordingly.

Food Security Outcomes
Risk & Vulnerability
Availability Access Utilization
Agricultural production in DPRK has
seen steady improvement over the
last several years but remains critically
vulnerable to natural hazards, limited
arable land, low soil fertility, and a lack
of key inputs. Production is particular-
ly low in the mountainous northern
regions. Double-cropping and cultiva-
tion of sloping land as means to im-
prove utilization of arable land and
increase production have limited suc-
cess given climate risks, lack of inputs
and soil erosion in the case of sloping
land. Food assistance from bilateral
and multilateral sources has been in-
termittent and import capacity is low.
The PDS is a key determinant of
access to food for most of the pop-
ulation. However, PDS rations have
been below target for years and
distribution can be erratic. House-
hold gardens, raising of small live-
stock and gathering of wild foods
can improve access to food, partic-
ularly in rural areas where land is
more available. Economic access
improves in urban areas, especially
in and around the bigger cities, as
incomes are higher and there is
greater access to daily markets.
There is anecdotal evidence that
the contribution of markets to
food access is gaining importance.
While the health system provides
wide coverage in DPRK, access to
healthcare is higher in urban areas
compared to rural given the greater
proportion of skilled healthcare
workers and larger number of facili-
ties. However, the lack of medicines
and medical supplies hampers the
system nationwide. The prevalence
of childhood diseases (diarrhoea and
acute respiratory infections) is still
high and requires attention. A major
bottleneck in food utilization is ade-
quate dietary intake for women and
children, and low practice of appro-
priate infant and young child feeding
(IYCF) practices.
Natural hazards are a major risk factor in DPRK. Heavy rains, floods, cyclones and dry spells can wreak hav-
oc on agricultural production particularly in the southern and western parts of the country, often referred
to as the “cereal bowl”. In the north, extremely cold and prolonged winters can delay agricultural produc-
tion, while drought in the central and southern regions can force extensive replanting of crops. Hazards can
also have a major impact on infrastructure and the distribution of food, thus affecting household access to
food. Floods and storms can also play an important role in the prevalence of infectious diseases, which can
impact the body’s utilization of nutrients and overall nutritional status.
Primary Outcomes
Malnutrition in DPRK has improved steadily over the
past 14 years, with stunting and underweight on average
declining by more than 2 and 3 percent per year respec-
tively. However, national prevalence rates remain of
“medium” public health significance according to WHO
thresholds at 27.9 percent stunted and 15.2 percent un-
derweight in 2012. The highest rates of stunting are seen
in Ryanggang, South Hamgyong and Chagang. Seasonal
fluctuations in acute malnutrition and persistence of mi-
cronutrient deficiencies are major concerns.
The typical diet in DPRK is heavily based on staples with
frequent vegetable consumption and limited consump-
tion of protein source foods. Consumption patterns are
highly vulnerable to national declines in agricultural pro-
duction and households fall easily from borderline to
poor consumption in the wake of a hazard. At the same
time, an acceptable consumption pattern is difficult to
reach and hard to maintain. The lack of household food
stocks plays a key role in this fragility. Due to limited
data, it is not possible to assess livelihood change.
Secondary Outcomes
Two sets of outcomes, primary and secondary, are identified as directly related to household food security status.
Only one of the four outcomes, food consumption, is exclusively related to food security. The other three out-
comes, livelihood change, malnutrition, and mortality, all have additional non-food impacts that require analysis from
other sectors including health, water and sanitation.
2
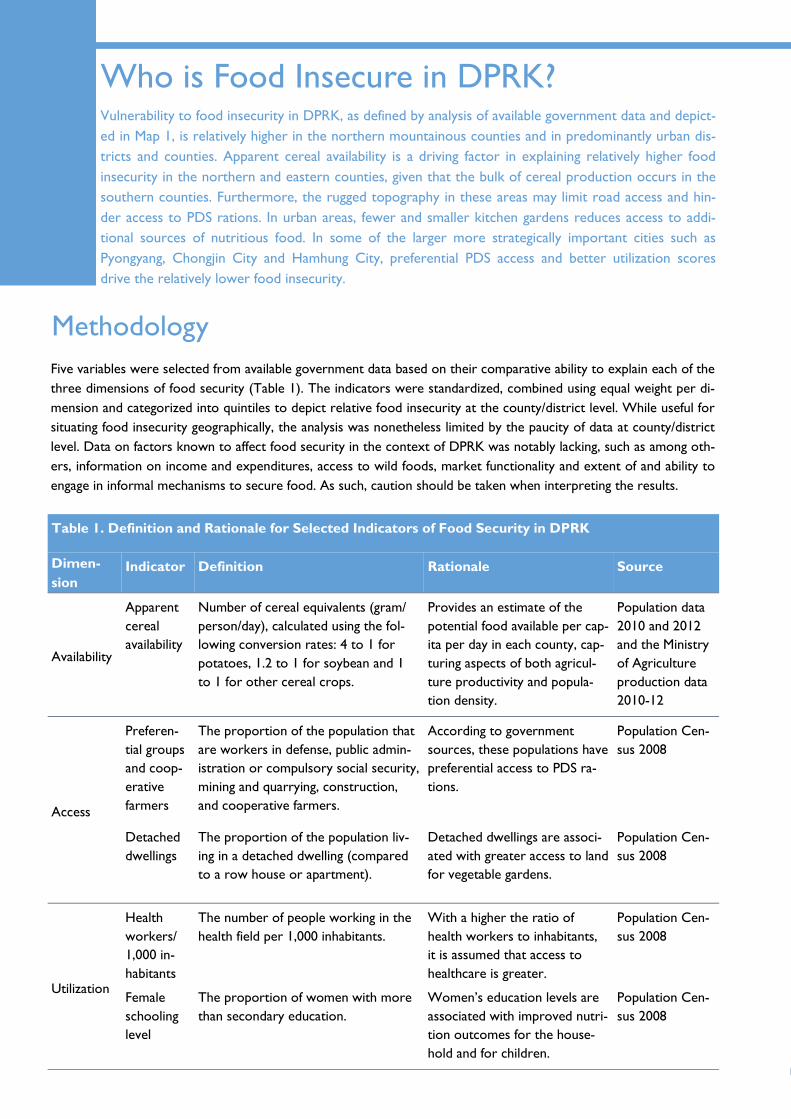
Who is Food Insecure in DPRK?
Table 1. Definition and Rationale for Selected Indicators of Food Security in DPRK
Dimen-
sion Indicator Definition Rationale Source
Availability
Apparent
cereal
availability
Number of cereal equivalents (gram/
person/day), calculated using the fol-
lowing conversion rates: 4 to 1 for
potatoes, 1.2 to 1 for soybean and 1
to 1 for other cereal crops.
Provides an estimate of the
potential food available per cap-
ita per day in each county, cap-
turing aspects of both agricul-
ture productivity and popula-
tion density.
Population data
2010 and 2012
and the Ministry
of Agriculture
production data
2010-12
Access
Preferen-
tial groups
and coop-
erative
farmers
The proportion of the population that
are workers in defense, public admin-
istration or compulsory social security,
mining and quarrying, construction,
and cooperative farmers.
According to government
sources, these populations have
preferential access to PDS ra-
tions.
Population Cen-
sus 2008
Detached
dwellings
The proportion of the population liv-
ing in a detached dwelling (compared
to a row house or apartment).
Detached dwellings are associ-
ated with greater access to land
for vegetable gardens.
Population Cen-
sus 2008
Utilization
Health
workers/
1,000 in-
habitants
The number of people working in the
health field per 1,000 inhabitants.
With a higher the ratio of
health workers to inhabitants,
it is assumed that access to
healthcare is greater.
Population Cen-
sus 2008
Female
schooling
level
The proportion of women with more
than secondary education.
Women’s education levels are
associated with improved nutri-
tion outcomes for the house-
hold and for children.
Population Cen-
sus 2008
Vulnerability to food insecurity in DPRK, as defined by analysis of available government data and depict-
ed in Map 1, is relatively higher in the northern mountainous counties and in predominantly urban dis-
tricts and counties. Apparent cereal availability is a driving factor in explaining relatively higher food
insecurity in the northern and eastern counties, given that the bulk of cereal production occurs in the
southern counties. Furthermore, the rugged topography in these areas may limit road access and hin-
der access to PDS rations. In urban areas, fewer and smaller kitchen gardens reduces access to addi-
tional sources of nutritious food. In some of the larger more strategically important cities such as
Pyongyang, Chongjin City and Hamhung City, preferential PDS access and better utilization scores
drive the relatively lower food insecurity.
Five variables were selected from available government data based on their comparative ability to explain each of the
three dimensions of food security (Table 1). The indicators were standardized, combined using equal weight per di-
mension and categorized into quintiles to depict relative food insecurity at the county/district level. While useful for
situating food insecurity geographically, the analysis was nonetheless limited by the paucity of data at county/district
level. Data on factors known to affect food security in the context of DPRK was notably lacking, such as among oth-
ers, information on income and expenditures, access to wild foods, market functionality and extent of and ability to
engage in informal mechanisms to secure food. As such, caution should be taken when interpreting the results.
Methodology
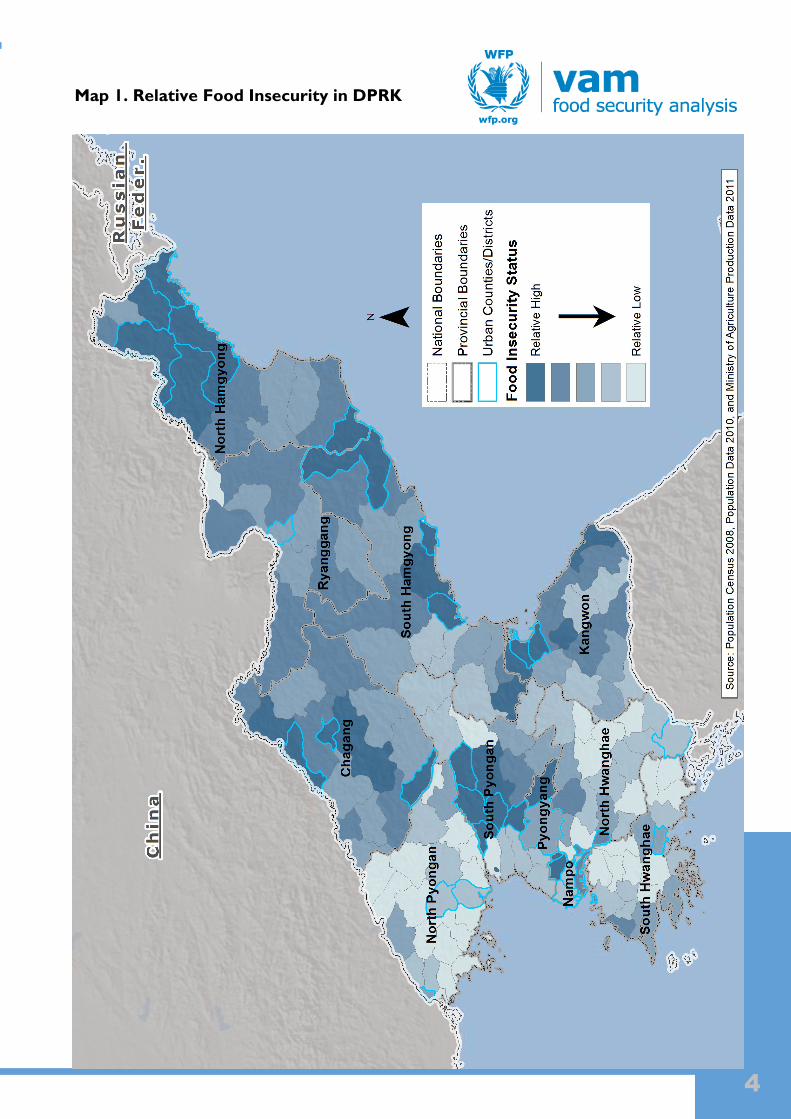
Map 1. Relative Food Insecurity in DPRK
4

Food Security Context in DPRK
The Democratic People's Republic of Korea (DPRK), located in East Asia, occupies the northern half of
the Korean Peninsula and shares borders with the Republic of Korea, the People’s Republic of China
and the Russian Federation. Of a total land area of 123,138 square kilometres, approximately 80 per-
cent is mountainous terrain and 17 percent is arable land concentrated in the south and coastal plains
of the east. The country has a centralized model of government based out of the capital, Pyongyang.
Based on the 2008 census, there are 9 provinces, 208 counties/districts/cities, and over 4,000 smaller
units known as Ri in rural areas and Dong in urban areas.
According to the census conducted in 2008, the popula-
tion of DPRK is about 24 million, 61 percent of whom live
in urban areas. The population is almost completely ho-
mogenous, with the exception of small Chinese and Japa-
nese-origin communities. The average density of the popu-
lation is 198 people per square kilometre with an annual
population growth rate of 0.85 percent.
In the 14 years between the censuses, the age structure
has shifted towards a more elderly population (Fig. 1),
with approximately 8.7 percent 65 years and older in 2008
compared to 5.4 percent in 1993. In general, the mortality
conditions in the country have worsened over the 14 year
span, reflected in the shorter life expectancy in 2008 com-
pared to 1993 (Table 2). However, data from several sur-
veys conducted in the interim suggest that the risk of
dying was highest in the mid/late-1990s before begin-
ning a steady decline through the 2000s: According to
the MDG baseline survey in 1998 and infant mortality
was 23.5 and maternal mortality was 105.
The planned economy of DPRK is based on state-
owned enterprises and cooperative farms. The agricul-
tural sector is the major contributor to the gross do-
mestic product (GDP). However, the importance of the
sector has declined over time, from approximately 30
percent of GDP in the early 2000s to 21 percent in
2010 (FAO-WFP 2012). In terms of employment, the
sector provides jobs for more than one third of the
working population (36 percent). Other major job-
Source: Population Census 2008
-10 -5 0 5 10
fe male male
Age
gro
ups
(in 4
year
incr
em
ents
)
0-4
5-9
10-14
15-19
20-24
25-29
30-34
35-39
40-44
45-49
50-54
55-59
60-64
65-69
70-74
75-79
80+
Percent of total population
Figure 1. Population Pyramid, 2008
Census Years
1993 2008
Total Population 21,213,378 24,052,231
Male 10,329,699 11,721,838
Female 10,883,679 12,330,393
Sex Ratio 94.9 95.1
Life Expectancy at Birth 72.7 69.3
Male 68.4 65.6
Female 76.0 72.7
Urban (%) 60.9 60.8
Dependency Rate 0.50 0.49
Total Fertility Rate 2.1 2
Infant Mortality Rate 14.1 19.3
Maternal Mortality Rate 54.0 85.1
Table 2. Trends in Selected Demographic Data
Source: Population Census 1993, 2008
Population & Economy 1
Food Security-Related Policies
Self-Sufficiency
The PDS & Market Policies
Several key policies contribute greatly to shaping the food security context in DPRK. The directive of self-sufficiency
in food underscores food availability in the country and the PDS supposedly acts as the main distributor of food,
providing rations to about 70 percent of households. Although market activities seem to be increasingly practiced,
policies related to market trade have remained restrictive, directly affecting household access to food.
Self-sufficiency in food is at the heart of DPRK agricul-
tural policies. The government aims to produce a tar-
get of 7 million tons of cereals per year, a figure it
estimates to be sufficient to meet the caloric needs of
the population (Mandal 2012). Three major themes
guide its agricultural strategies: (1) the principle of
Free trade was initially banned in DPRK in December
1957 and the PDS was established to control the dis-
tribution of food centrally. Under this system, the
National People’s Committee (NPC) reportedly re-
ceives production data from all over the country and,
based on factors such as household size and age com-
position, occupations of all household members and
number of hours worked per day, determines how to
distribute the food equitably. For approximately 16.5
million people (70 percent of the population), this is
an important means of accessing staple foods in the
diet (see section on Access for more details). Follow-
ing the economic crisis and precipitous decline in agri-
cultural production in the 1990s, the distribution of
rations through the PDS all but ground to a halt.
ognized farmers’ markets. However, according
to government sources, the PDS was re-
instated in 2006 following improvements in
agricultural production and the private sale of
grain was again forbidden. Farmers’ markets
continue to operate on a limited scale, open
three days per month and serving primarily as
a venue for the sale of products from home
gardens and a limited supply of consumer
goods.
creating sectors include the manufacturing sector,
which employs 24 percent of the population, and the
mining/quarrying sector and public administration sec-
tor, which each employ 6 percent (CBS 2009).
Between 2006 and 2011, total economic growth in
DPRK was relatively slow, with a cumulative increase
in GDP of about 3 percent. For three out of these six
years, the country experienced negative growth rates,
seeing most of the positive growth in recent years
(0.7 percent in 2010 and 1.9 percent in 2011). This
recent economic recovery is attributable to relatively
good performance of the agriculture sector, significant
expansion of the construction sector, increased exports
of natural resources, as well as remittance inflows from
workers sent to China and Russia (FAO-WFP 2012).
Economic trade is limited to a few countries: In 2010, Chi-
na and the Republic of Korea accounted for almost 90
percent of the country’s total international trade. Between
2003 and 2008, the trade deficit increased by almost 50
percent, from US $983 million to an estimated record
high of US $1.52 billion. However, increasing exports to
China has helped reduce the annual deficit in recent years,
a trend expected to continue in the future (FAO-WFP
2012).
6
"the right crop on the right soil and the right crop in the
right time"; (2) increased production area (cropping inten-
sity, reclamation of tidal lands, use of sloped lands) and (3)
increased agricultural yields (through better soil and crop
management, and greater use of improved inputs).
Households were encouraged to find alternative means of
accessing food. In 2002, economic reforms were imple-
mented that allowed small-scale private farming and rec-
Food Availability Until the 1980s, DPRK was self-sufficient in food production, in large part due to effective subsidies for fuel
and fertilizer from China and the Union of Soviet Socialist Republics (USSR). However, with the dissolu-
tion of the Soviet trading bloc and shifts in China’s trade policy in the late 1980s, prices for key inputs rose
sharply, agricultural productivity plummeted and food imports shrank. In the mid-1990s, an already weak-
ened agriculture sector was further hit by heavy flooding, together resulting in a devastating decline in
availability. Food assistance was given in the immediate aftermath, continuing at scale until domestic crop
production sustained several years of good returns, at which point it was sharply curtailed.3 In the context
of limited imports and restricted assistance, a situation of chronic food shortages has emerged.
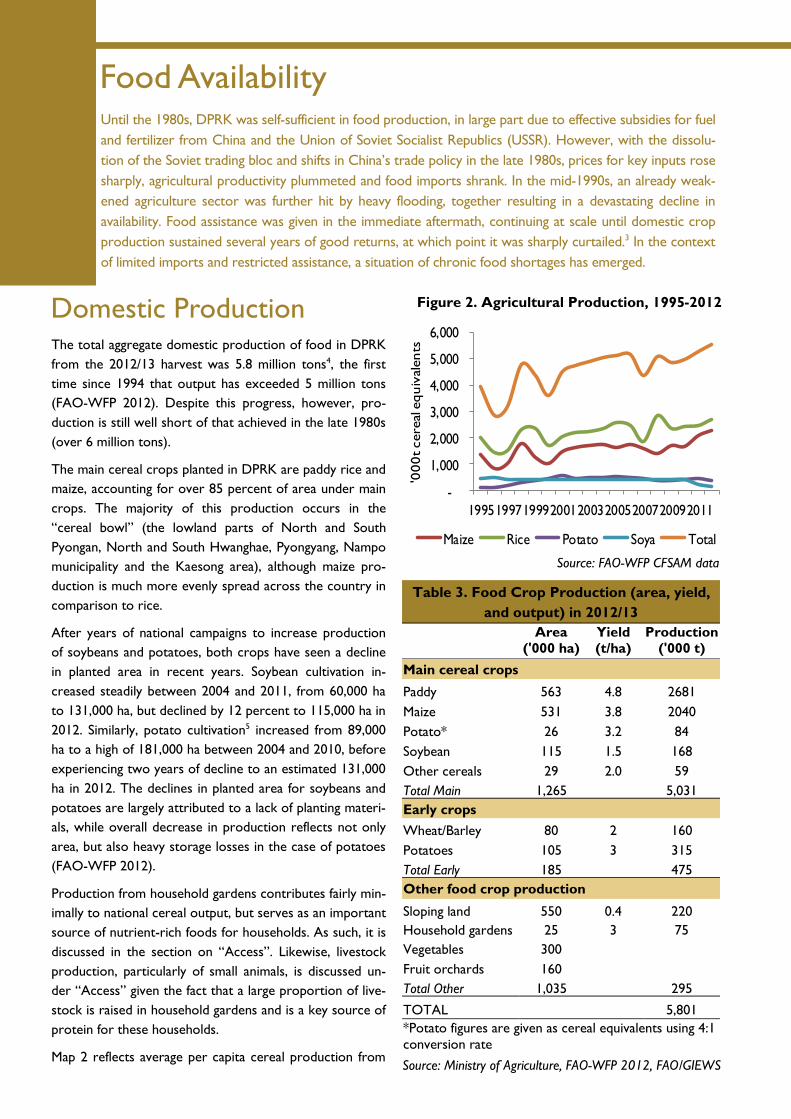
Domestic Production The total aggregate domestic production of food in DPRK
from the 2012/13 harvest was 5.8 million tons4, the first
time since 1994 that output has exceeded 5 million tons
(FAO-WFP 2012). Despite this progress, however, pro-
duction is still well short of that achieved in the late 1980s
(over 6 million tons).
The main cereal crops planted in DPRK are paddy rice and
maize, accounting for over 85 percent of area under main
crops. The majority of this production occurs in the
“cereal bowl” (the lowland parts of North and South
Pyongan, North and South Hwanghae, Pyongyang, Nampo
municipality and the Kaesong area), although maize pro-
duction is much more evenly spread across the country in
comparison to rice.
After years of national campaigns to increase production
of soybeans and potatoes, both crops have seen a decline
in planted area in recent years. Soybean cultivation in-
creased steadily between 2004 and 2011, from 60,000 ha
to 131,000 ha, but declined by 12 percent to 115,000 ha in
2012. Similarly, potato cultivation5 increased from 89,000
ha to a high of 181,000 ha between 2004 and 2010, before
experiencing two years of decline to an estimated 131,000
ha in 2012. The declines in planted area for soybeans and
potatoes are largely attributed to a lack of planting materi-
als, while overall decrease in production reflects not only
area, but also heavy storage losses in the case of potatoes
(FAO-WFP 2012).
Production from household gardens contributes fairly min-
imally to national cereal output, but serves as an important
source of nutrient-rich foods for households. As such, it is
discussed in the section on “Access”. Likewise, livestock
production, particularly of small animals, is discussed un-
der “Access” given the fact that a large proportion of live-
stock is raised in household gardens and is a key source of
protein for these households.
Map 2 reflects average per capita cereal production from
Table 3. Food Crop Production (area, yield,
and output) in 2012/13
Area
('000 ha) Yield (t/ha)
Production ('000 t)
Main cereal crops
Paddy 563 4.8 2681
Maize 531 3.8 2040
Potato* 26 3.2 84
Soybean 115 1.5 168
Other cereals 29 2.0 59
Total Main 1,265 5,031
Early crops
Wheat/Barley 80 2 160
Potatoes 105 3 315
Total Early 185 475
Other food crop production
Sloping land 550 0.4 220
Household gardens 25 3 75
Vegetables 300
Fruit orchards 160
Total Other 1,035 295
TOTAL 5,801
*Potato figures are given as cereal equivalents using 4:1
conversion rate
Source: Ministry of Agriculture, FAO-WFP 2012, FAO/GIEWS
Figure 2. Agricultural Production, 1995-2012
Source: FAO-WFP CFSAM data
-
1,000
2,000
3,000
4,000
5,000
6,000
199519971999200120032005200720092011
'000t cere
al e
quiv
alents
Maize Rice Potato Soya Total
Food Assistance & Commercial Imports
Food Balance
Prior to 2008/09, DPRK received more than 400,000
tons of rice per year in bilateral assistance from the
Republic of Korea and substantial multilateral assis-
tance through WFP. In recent years, however, bilat-
eral and multilateral food assistance has declined con-
siderably, with only 35,000 tons received in 2012/13
(FAO-WFP 2012). China continues to contribute with
20,000 tons of soybeans each year, as well as a supply
of critical non-food assistance (fuel, agricultural sup-
port). Other countries, including Russia, Myanmar,
Vietnam, Taiwan, Brazil and India have provided cere-
While food shortages are a chronic problem in DPRK,
the trend since 2000 has been one of declining cereal
deficits, mainly a function of increasing agricultural
production and sustained imports, as well as food aid
during critical years. The cereal deficit is calculated as
the sum of domestic production and estimated food
imports less the projected total food utilization.6 In
Figure 3, the deficit after the estimated imports but
before food aid is reflected in the total height of the
columns. Between 2000 and 2013, with the notable
exception of 2008/09,7 the total deficit has declined by
more than 80 percent, from about 1.5 million to
207,000 tons required (FAO-WFP CFSAM data 1995-
2012).8 Notably, this deficit does not reflect on nutri-
ent-specific deficits, particularly for protein, which
remain a key challenge for the country.
als, but not in quantities sufficient to compensate for the
general decline in assistance.
Commercial imports of food are generally limited by the
high prices, growing trade imbalance and domestic eco-
nomic policies (Hari Har Ram 2012). Additionally, China,
as a main source of food imports for DPRK, has recently
become a net importer of food. Overall, the quantities of
cereal imports have been low and slowly declining from
400,000 tons in the early 2000s to 300,000 tons in
2012/13. In the last two years, sustained agricultural pro-
duction has meant reduced need for imports.
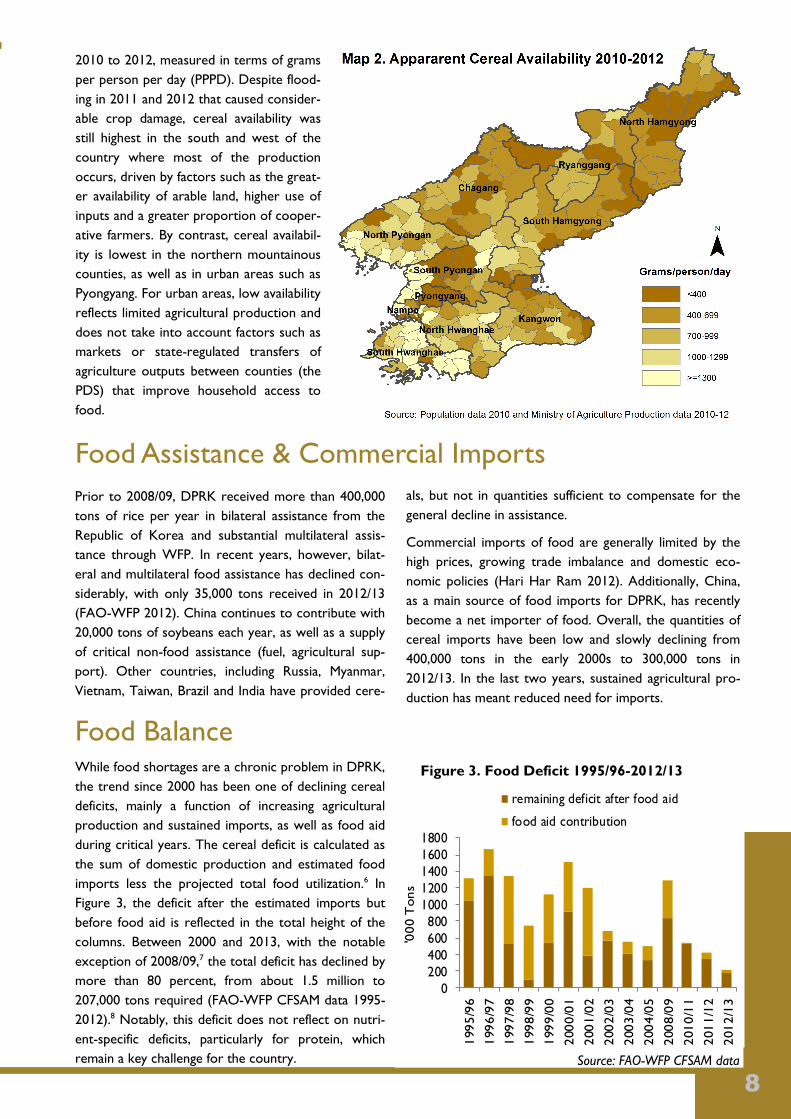
2010 to 2012, measured in terms of grams
per person per day (PPPD). Despite flood-
ing in 2011 and 2012 that caused consider-
able crop damage, cereal availability was
still highest in the south and west of the
country where most of the production
occurs, driven by factors such as the great-
er availability of arable land, higher use of
inputs and a greater proportion of cooper-
ative farmers. By contrast, cereal availabil-
ity is lowest in the northern mountainous
counties, as well as in urban areas such as
Pyongyang. For urban areas, low availability
reflects limited agricultural production and
does not take into account factors such as
markets or state-regulated transfers of
agriculture outputs between counties (the
PDS) that improve household access to
food.
8
Figure 3. Food Deficit 1995/96-2012/13
Source: FAO-WFP CFSAM data
0
200
400
600
800
1000
1200
1400
1600
1800
1995/9
6
1996/9
7
1997/9
8
1998/9
9
1999/0
0
2000/0
1
2001/0
2
2002/0
3
2003/0
4
2004/0
5
2008/0
9
2010/1
1
2011/1
2
2012/1
3
'000 T
ons
remaining deficit after food aid
food aid contribution

Production Challenges
Sloping Land
Aside from the impact of natural disasters, key determinants of low productivity include a lack of arable land, poor
soil fertility, the low use of agricultural inputs and low yields. Since opportunities to expand land area are limited,
DPRK seeks to maximize land use through double-cropping and improve yields by enhancing soil fertility, increasing
use of agricultural inputs and improving management practices.
As a result of pressure for additional agricultural land,
marginal lands such as sloping land have increasingly come
under cultivation. Indeed, state policies in the 1980s al-
lowed the removal of natural forest which contributed
substantially to the estimated loss of 2.5 million hectares
of natural forest (an average of 127,000 hectares lost per
year in the last 2 decades) and increased the risk of soil
In 1997, the government introduced a new policy to pro-
mote a two-crop farm system (double-cropping). Double-
cropping involves planting different crops with short-
growth periods on the same piece of land within the same
year, one in the early and one in the main season.
The main crop season, beginning in April and ending in
mid/late August (maximum duration of 135 days) results in
the production of approximately 80 percent of food in
DPRK. The early season, falling between March and June/
mid-July (maximum duration of 90 days) sees the produc-
Seasonality and Double-cropping
tion of mainly wheat, barley and potatoes, which to-
gether account for less than 10 percent of total annual
production. Indeed in 2012, early crops contributed
less than 8 percent of total production.
The main challenges to early crop production are risk
associated with climatic variability (e.g. dry spells),
heavy demand on labour and/or inputs,10 and insuffi-
cient inputs, particularly tractors and plastic sheeting
to protect seedlings during cold weather. The harsh
winters make double-cropping virtually impossible in
the north.
erosion and landslides.9 While the Ministry of Land
and Environmental Protection has since initiated regu-
lations on the use of sloping land and promoted refor-
estation, the rehabilitation and renewal process has
been slow. According to the most recent estimates,
550,000 hectares of sloping land remains under culti-
vation (JRC 2012).
Jan Feb Mar Apr May Jun Jul Aug Sep Oct Nov Dec
Early
crops
Winter barley/wheat
Spring barley/wheat
Early potato
Main
crops
Paddy rice
Maize
Soybean
potatoes
Vegeta-
bles
Early garden vegetables
Main garden vegetables
Lean Season Planting Growing Harvesting
Figure 4. Crop Seasons in DPRK
Source: Ministry of Agriculture DPRK, FAO-DPRK, FAO/GIEWS 2012

Soil Fertility
Other Agricultural Inputs
The economic isolation of DPRK contributes to a crit-
ical shortage of key agricultural inputs that limits agri-
cultural production. Use is low country-wide, but the
difficulty in accessing areas of the north (lack of infra-
structure, poor weather) and priority on supporting
farms in the south where returns are higher with few-
er inputs means use is even lower in northern coun-
ties. Mechanization represents perhaps the biggest
challenge and potential in DPRK. The rehabilitation of
old and acquisition of new tractors has improved the
availability, but use is still constrained by a lack of
spare parts, tires and fuel (FAO-WFP 2012).13 Distri-
bution of tractors varies by province, with 60 percent
of tractors found in 4 provinces, North and South
Hwanghae, and North and South Pyongan (ranging
from 12 to 21 percent).
Irrigation potential has increased in recent years due
to the re-alignment of canals as gravity-fed systems,
thus reducing dependency on electrically-powered
pumping stations. However, irrigation is typically lim-
ited to paddy fields with supplementary irrigation in
the face of dry spells or drought (e.g. in 2012) depend-
Land in DPRK tends to be of poor fertility as a result
of low levels of organic matter and high levels of soil
acidity.11 Poor soil fertility in turn directly affects
achievable yields. Average yields plummeted to low
levels in the mid- to late-1990s following the decline in
fuel and fertilizer imports, but have steadily increased
since then as fertilizer use and soil management prac-
tices have expanded (Fig. 5).
Appropriate fertilization, through application of organic
manure, crop residues or chemical compounds, can
help to mitigate poor fertility. However, while the use
of organic manure is reportedly improving,12 it remains
limited due to the small populations of livestock and
resulting constraints on manure availability; in addition,
the use of crop residue is limited by competing de-
mands within the household for heating and livestock
feed.
The appropriate use of chemical fertilizers is a major
challenge for several reasons: (1) overall availability of
fertilizer has decreased dramatically as a result of a
decline in domestic production and a corresponding
increase in the dependence on imports; (2) when ferti-
lizers are available, it is often as an imbalanced formula
that can lead to further acidification of the soil; and (3) ap-
plication of lime to reduce acidity and of phosphate soil to
improve fertility requires large-scale excavation, transport
and spreading, a process that requires the mobilization of
large labour forces in the absence of adequate fuel and ma-
chinery (FAO-WFP 2004, 2011, 2012). As a result, typical
application rates for lime remain at half a ton/ha every
three years, well below the recommended application rate
of 2 to 7.8 tons/ha every 3 to 5 years for soils with such
level of acidity (Goodbody 2013; FAO-WFP 2004, 2010).
ent on massive mobilization of labour forces to dig wells
and carry water (FAO-WFP 2012).
Additional inputs that can improve productivity include
high-yielding seeds, planting materials (e.g. plastic sheeting)
and pesticides. In terms of high-yielding seeds, the govern-
ment is promoting and supporting initiatives for quality
seed production. However, these initiatives face key chal-
lenges to simultaneously attain high-yield varieties while
addressing resistance to major diseases and pests.
Plastic sheets are particularly important in the
early season to protect seedlings against the cold.
The availability of plastic sheets has improved
substantially as a result of an FAO-MoA initiative;
however limited supply creates major challenges
in the early season.
Pesticide use is very low in DPRK. The shortage
of pesticides increases reliance on labour inten-
sive means of controlling pests, labour that could
otherwise be used for more productive activities
(FAO-WFP 2011).
10
Figure 5. Average Yields, 1995-2012
Source: FAO-WFP CFSAM data
0.0
1.0
2.0
3.0
4.0
5.0
6.0
1995
1996
1997
1998
1999
2000
2001
2002
2003
2004
2005
2006
2007
2008
2009
2010
2011
2012
Yeild (
t/ha)
Maize Rice
Food Access According to the government, the PDS is the main means of accessing food for the vast majority (70
percent) of households in DPRK. However, rations are frequently below target and distribution can be
at best erratic, especially in the more remote areas of the country. Physical access to land for kitchen
gardens and to raise small livestock, as well as access to forests and coasts for gathering of wild foods,
are important in providing nutritious supplements to the PDS ration. Economic access to additional
food depends largely on employment, salaries and access to markets, information about which is ex-
ceedingly limited in DPRK. Informal exchange in the form of bartering and gifts is common practice for
households and can also improve access to food.
Physical Access
The PDS is a centrally-controlled system of food distribu-
tion in DPRK. According to government sources, national
production is redistributed to households based on fac-
tors such as household size and age composition, occupa-
tions of all household members and number of hours
worked per day. From within the PDS-dependent popula-
tion, three groups are considered priority populations
based on their occupation: (1) the defence, public admin-
istration and compulsory social security workers; (2) min-
ing and quarrying workers; and (3) construction workers.
The average household with workers from one of the pri-
ority populations receives a ration of 700 grams PPPD.
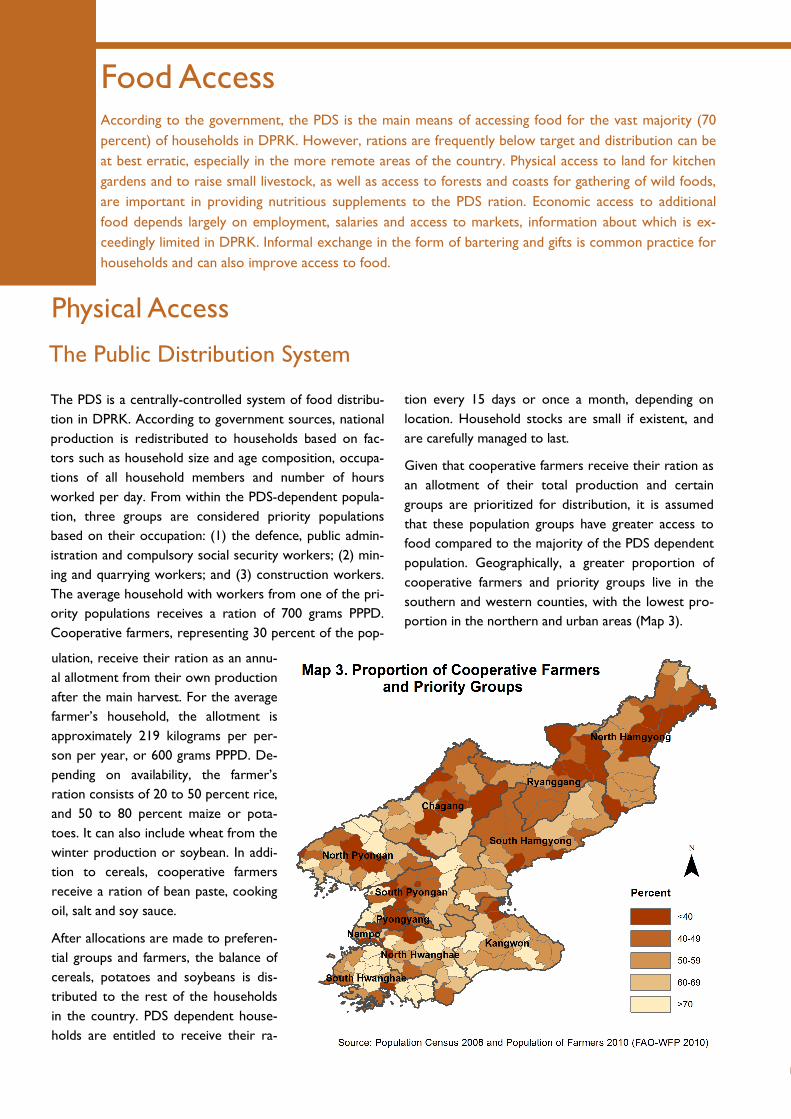
Cooperative farmers, representing 30 percent of the pop-
tion every 15 days or once a month, depending on
location. Household stocks are small if existent, and
are carefully managed to last.
Given that cooperative farmers receive their ration as
an allotment of their total production and certain
groups are prioritized for distribution, it is assumed
that these population groups have greater access to
food compared to the majority of the PDS dependent
population. Geographically, a greater proportion of
cooperative farmers and priority groups live in the
southern and western counties, with the lowest pro-
portion in the northern and urban areas (Map 3).
The Public Distribution System
ulation, receive their ration as an annu-
al allotment from their own production
after the main harvest. For the average
farmer’s household, the allotment is
approximately 219 kilograms per per-
son per year, or 600 grams PPPD. De-
pending on availability, the farmer’s
ration consists of 20 to 50 percent rice,
and 50 to 80 percent maize or pota-
toes. It can also include wheat from the
winter production or soybean. In addi-
tion to cereals, cooperative farmers
receive a ration of bean paste, cooking
oil, salt and soy sauce.
After allocations are made to preferen-
tial groups and farmers, the balance of
cereals, potatoes and soybeans is dis-
tributed to the rest of the households
in the country. PDS dependent house-
holds are entitled to receive their ra-

0
5000
10000
15000
20000
25000
30000
35000
1996 1997 1998 1999 2000 2001 2002 2003 2004 2008 2009 2010 2011 2012
'000 h
ead
Draught cattle Pigs Sheep Goats
Rabbits Chickens Ducks Geese
Household Gardens & Livestock
Wild Foods
Kitchen gardens are important household assets not
only for providing vitamin and mineral-rich foods to
supplement PDS rations, but also for providing a mod-
est source of income, items for gifting, bartering or
exchange, and a key space to rear of small livestock.
The average size of a kitchen plot varies widely—for
cooperative farmers, plot size ranges from 15 to 30
pyong, for rural PDS dependents, average size is 20
pyong, and for urban PDS dependents, 7 pyong (FAO-
WFP 2012).14 Kitchen gardens are intensively cultivat-
ed with an early crop of potatoes and green maize,
followed by vegetables such as cabbages, peppers,
radishes and garlic. Many of these vegetables are then
In DPRK, gathering of wild foods is both a traditional
practice as well as a key coping mechanism to meet
food shortages at specific times in the year. In addi-
tion, these foods play an important nutritional role in
the diet as their nutritional value can be high.
The main products collected include algae in coastal
areas, acorns, bellflower roots, edible grasses, mush-
rooms, pine nuts, and wild berries, with most gathering
occurring in the spring season. Most of the gathered food
is typically consumed within the household, either immedi-
ately or preserved for use in the winter, while a smaller
proportion may be reserved for sale, bartering or gifting to
elderly or urban relatives. Wild foods can also be found in
state shops and markets (FAO-WFP 2012).
preserved in a popular dish known as “kimchi” that can be
eaten year-round and throughout the lean season.
Small livestock, such as rabbits, goats and poultry, are fre-
quently raised in gardens and provide a key source of pro-
tein for the household. Indeed, the populations of small
livestock have grown substantially in recent years in con-
trast to the relatively stagnant growth of larger livestock, a
trend partially informed by the high demand of large live-
stock on limited grain supplies (Fig. 7).15
Of all population groups, cooperative farmers have the
greatest access to kitchen gardens. Among PDS depend-
ents, rural households tend to have greater opportunities
According to government sources, the planned aver-
age target ration for PDS dependents is 573 grams
PPPD. In reality, however, rations face monthly ad-
justments and rarely reach the target. Indeed in the
last four years, according to government sources,
the ration size has rarely exceeded an average of
400 grams PPPD, an amount which would provide
approximately 1600 kcal PPPD and is well below the
recommended intake of 2100 kcal. In 2007/08 and
again in 2010/11, ration sizes reportedly dropped as
low as 150 grams PPPD in the lean season (April to
August), reflecting a serious shortage of food.
12
Figure 7. Livestock Populations in DPRK, 1996-2012
Source: FAO-WFP CFSAM data
Figure 6. Monthly PDS Rations
Source: FAO-WFP CFSAM data
100
200
300
400
500
600
OctNovDec Jan Feb Mar Apr May Jun Jul Aug Sep
gra
ms/
pers
on/d
ay
Govt. Target 2007/08 2008/09
2009/10 2010/11 2011/12
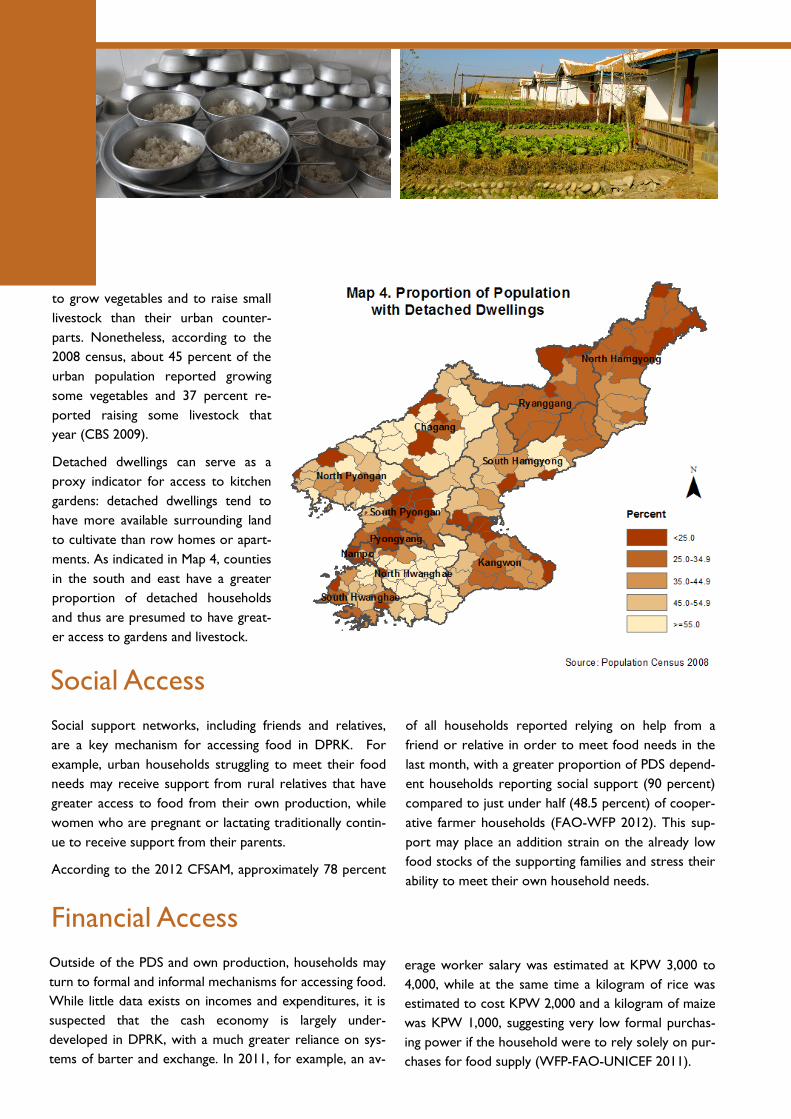
to grow vegetables and to raise small
livestock than their urban counter-
parts. Nonetheless, according to the
2008 census, about 45 percent of the
urban population reported growing
some vegetables and 37 percent re-
ported raising some livestock that
year (CBS 2009).
Detached dwellings can serve as a
proxy indicator for access to kitchen
gardens: detached dwellings tend to
have more available surrounding land
to cultivate than row homes or apart-
ments. As indicated in Map 4, counties
in the south and east have a greater
proportion of detached households
and thus are presumed to have great-
er access to gardens and livestock.
Social Access
Outside of the PDS and own production, households may
turn to formal and informal mechanisms for accessing food.
While little data exists on incomes and expenditures, it is
suspected that the cash economy is largely under-
developed in DPRK, with a much greater reliance on sys-
tems of barter and exchange. In 2011, for example, an av-
Financial Access
erage worker salary was estimated at KPW 3,000 to
4,000, while at the same time a kilogram of rice was
estimated to cost KPW 2,000 and a kilogram of maize
was KPW 1,000, suggesting very low formal purchas-
ing power if the household were to rely solely on pur-
chases for food supply (WFP-FAO-UNICEF 2011).
Social support networks, including friends and relatives,
are a key mechanism for accessing food in DPRK. For
example, urban households struggling to meet their food
needs may receive support from rural relatives that have
greater access to food from their own production, while
women who are pregnant or lactating traditionally contin-
ue to receive support from their parents.
According to the 2012 CFSAM, approximately 78 percent
of all households reported relying on help from a
friend or relative in order to meet food needs in the
last month, with a greater proportion of PDS depend-
ent households reporting social support (90 percent)
compared to just under half (48.5 percent) of cooper-
ative farmer households (FAO-WFP 2012). This sup-
port may place an addition strain on the already low
food stocks of the supporting families and stress their
ability to meet their own household needs.
Formal markets in DPRK can be classified as three
main types: state shops, urban daily markets and coun-
ty-level farmers’ markets. As part of their ration,
households receive coupons to purchase essential
commodities such as soy sauce, bean paste and cook-
ing oil at subsidized prices from the state shops. Each
household is assigned to a state shop and is entitled to
a monthly quota for certain commodities that is set by
the Ministry of Commerce. However, full allocation of
the quota to households depends primarily on the
availability of the commodities, which can vary from
county to county.
Urban daily markets and rural farmers’ markets (held
3 days/month) are organized such that people can ne-
gotiate directly with sellers to buy food and other
items. However, cooperative farmers are not allowed
to sell their surplus produce directly in these markets.
The markets also offer opportunities for people to
sell, barter or exchange handicrafts and other industri-
al products, including processed food.
With no private sector, the population of DPRK de-
pends almost entirely on the government for employ-
ment. Of a total working population16 of 17.4 million,
70 percent are working in government institutions,
state enterprises or on cooperative farms/enterprises.
Of the remaining working-aged population, 24 percent
are not engaged in any economic activity, either as
students (5.4 percent) or as retired workers (18 per-
cent) and 5.3 percent identified household work as
their primary activity, most of them female (CBS
2009).Within the working population, the majority (60
percent) are working in just two sectors: either agri-
culture, forestry and fishing or manufacturing. As such, a
large proportion of the population is vulnerable to a shock
affecting one of these two sectors.
Nationally, the work participation rate is higher for males
(80 percent) than females (62 percent). However, women
workers outnumber men in certain sectors, particularly
wholesale and retail trade (68 percent female workers)
and slightly more in the agriculture, forestry and fishing
sector (53 percent). Participation in the market for sale of
goods or food from gardens is often restricted to older
women in DPRK. The sectors in which men dominate
include manufacturing, mining and quarrying and public
administration.
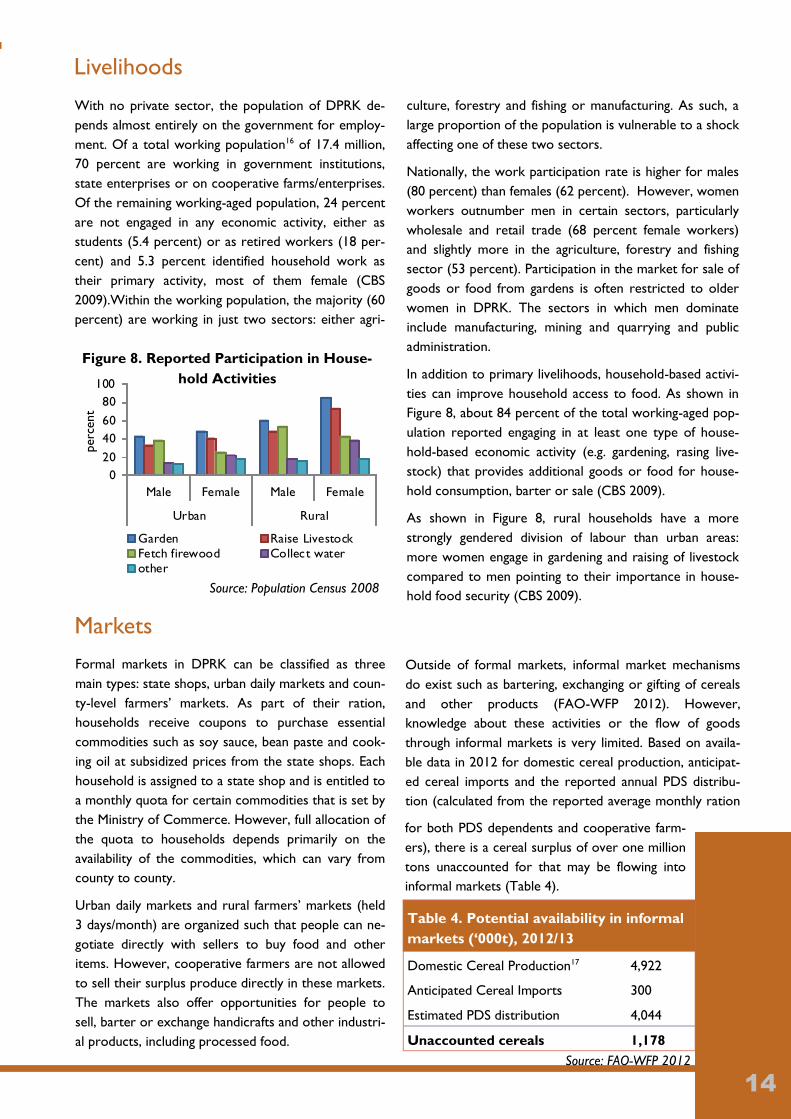
In addition to primary livelihoods, household-based activi-
ties can improve household access to food. As shown in
Figure 8, about 84 percent of the total working-aged pop-
ulation reported engaging in at least one type of house-
hold-based economic activity (e.g. gardening, rasing live-
stock) that provides additional goods or food for house-
hold consumption, barter or sale (CBS 2009).
As shown in Figure 8, rural households have a more
strongly gendered division of labour than urban areas:
more women engage in gardening and raising of livestock
compared to men pointing to their importance in house-
hold food security (CBS 2009).
Markets
Outside of formal markets, informal market mechanisms
do exist such as bartering, exchanging or gifting of cereals
and other products (FAO-WFP 2012). However,
knowledge about these activities or the flow of goods
through informal markets is very limited. Based on availa-
ble data in 2012 for domestic cereal production, anticipat-
ed cereal imports and the reported annual PDS distribu-
tion (calculated from the reported average monthly ration
Livelihoods
for both PDS dependents and cooperative farm-
ers), there is a cereal surplus of over one million
tons unaccounted for that may be flowing into
informal markets (Table 4).
14
Table 4. Potential availability in informal
markets (‘000t), 2012/13
Domestic Cereal Production17 4,922
Anticipated Cereal Imports 300
Estimated PDS distribution 4,044
Unaccounted cereals 1,178
Source: FAO-WFP 2012
0
20
40
60
80
100
Male Female Male Female
Urban Rural
Percent
Garden Raise Livestock
Fetch firewood Collect water
other
Figure 8. Reported Participation in House-
hold Activities
Source: Population Census 2008
perc
ent

Food Utilization The health system in DPRK provides extensive coverage with a focus on prevention, driven by a sys-
tem of household doctors. A significant achievement of the system has been the extensive vaccination
campaigns resulting in over 90 percent coverage. Nonetheless, a lack of medical supplies continues to
pose a serious challenge to the healthcare system. Access to clean water and improved sanitation is
widespread, although there is limited information on the maintenance of piping systems and therefore
the quality of piped water to households. Poor quality and diversity of women’s and children’s diets
remains a critical concern.
Health in DPRK
DPRK has a free centralized health management system
focused on prevention and primary healthcare. The system
provides significant coverage across the country, but the
quality of treatment is hampered by widespread shortages
of basic medications and medical supplies and aging infra-
structure. The system relies primarily on household doc-
tors and additional networks of hospitals and clinics in ur-
ban, rural and industrial areas. One household doctor spe-
cializing in preventive and curative services is placed per
130 households and province and county hospitals provide
more specialized care (MoPH 2012). In total, there are
216,000 health personnel in DPRK, of which 80 percent
are nurses and doctors (Table 5). Overall, 33 medical doc-
tors are provided per 10,000 people (MoPH and WHO
Table 5. Health Personnel in DPRK
Staff Cate-
gory
Numbers
of staff by cate-
gory
% work-
force
Staff per
1,000 in-habitants
Doctors 79,931 37% 3.3
Nurses 93,400 43% 3.9
Pharmacist 8,622 4% 0.4
Midwives 7,368 3% 0.3 Other
health per-sonnel
26,406 12% 1.1
Total 215,727 100%
2011). The number of health workers per
1,000 inhabitants tends to be higher in
urban areas and in the western region of
the country (Map 5).
The Ministry of Public Health has taken
key actions to increase local vaccine plant
capacity and, through greater coopera-
tion with different international organiza-
tions, to ensure increased vaccination
coverage for children. As a result of these
efforts, the immunization rate is between
90 and 99 percent for BCG, hepatitis B,
poliomyelitis, pertussis, DPT3 plus hepati-
tis B, measles and tetanus (MoPH 2012).
However, adequate care for vulnerable
populations such as pregnant and lactating
women, newborns and children under
five remains compromised, as evidenced
in the consistently high mortality rates for
these groups (See mortality section).
The Health System
Source: MoPH and WHO 2011

Reproductive Health
Water & Sanitation
The main communicable diseases are acute respirato-
ry infections (ARI) and diarrhoea amongst children,
and tuberculosis amongst adults (MoPH and WHO
2011). According to the Ministry of Public Health, no
cases of HIV/AIDS have been detected in DPRK to
date. In 2012, the prevalence of diarrhoea among chil-
dren younger than 5 years was estimated at 8.5 per-
cent and ARI at 6.5 percent.18 The prevalence of tu-
berculosis was estimated at 418 cases per 100,000
people in 2008, of which 4 percent was multi-drug
resistant (MoPH and WHO 2011). The National TB
control programme, with support of the Global Fund,
has continued to increase the proportion of TB pa-
On average, women between 15 and 49 years of age
bear two children. Contraception is quite common in
DPRK, with approximately 70 percent of married
women reporting the use of some kind of contracep-
tive method, most commonly an IUD (CBS and UN-
FPA 2010).
Antenatal care is a key forum for delivering health
messages to improve the health and nutrition of the
mother and baby. Over half of women (61.6 percent)
receive the recommended number of antenatal visits
(16) over the course of their pregnancy, with higher
access in urban compared to rural areas. Antenatal
care is typically provided by skilled medical personnel.
Access to safe water and improved sanitary facilities is
directly linked to reduced incidence of disease and
therefore to the body’s utilization of food. Based on
the available data from the 2008 census and 2009
MICS, some 90 percent of the households have access
to piped water, and for majority, the pipes reach the
dwelling. While distribution of water is maintained and
managed by people’s committees at the local level,
little information exists on the level of maintenance
and current state of the piped water system, with im-
plications for the quality of the water delivered to
households. In 2009, only 20 percent of households
treated water before use, mostly by boiling it (CBS
2010).
The proportion of the population using improved san-
itary facilities such as private flush toilets and private
tients treated with DOTS, from 65.2 percent in 2006 to
94.5 percent in 2010. Prevalent vector-borne diseases
include malaria and Japanese encephalitis. While DPRK
was declared malaria-free in the 1970s, the disease re-
turned again in the late 1990s. Since then, progress has
been made in efforts to control it and the incidence of
malaria dropped from 300,000 in 2001 to 7,400 in 2007.
Non-communicable diseases (cerebro-, cardio-vascular,
cancers and respiratory illnesses) account for an increas-
ing burden of morbidity and mortality in DPRK. The high
prevalence of adult male smokers (52.3 percent in 2009) is
a major contributor to the disease burden.
Disease
Low birth weight of the infant is an important outcome
indicator of the health and nutrition of the mother during
pregnancy, and a risk factor for health and nutrition of the
child: The risk of stunting increases substantially for infants
weighing less than 2,500 grams at birth. Between 1998 and
2009, the proportion of low birth weight babies has de-
clined by 37 percent (6 percent in 2009) (MoPH 2012).
Most deliveries occur in health facilities (87.9 percent) and
are attended by a doctor (CBS and UNFPA 2010). None-
theless, pregnancy-related deaths remain fairly common
(MMR of 85.1), suggesting a critical gap in quality care and
the provision of adequate supplies (CBS 2009).
pit latrines is 83 percent (CBS 2010). Flushable toilets are
available to more than half (58 percent) of all households
while 35 percent use pit latrines and another 7 percent use
public facilities or share with other households. Access to
16
improved sanitation facilities is higher in urban
areas than in rural areas (90 versus 73 percent).
For all, the risk of water contamination and diar-
rheal diseases increases during periods of flooding
as sewage systems are easily overwhelmed.
Education on hygienic practices is supported
throughout DPRK. Household doctors pass on
messages on hygiene as part of their routine
work; messages are included in schoolroom edu-
cation; and health education and sanitary messages
are distributed through mass media via television
and newspapers (MoPH 2012).
Diets of Women and Children
Women’s Education
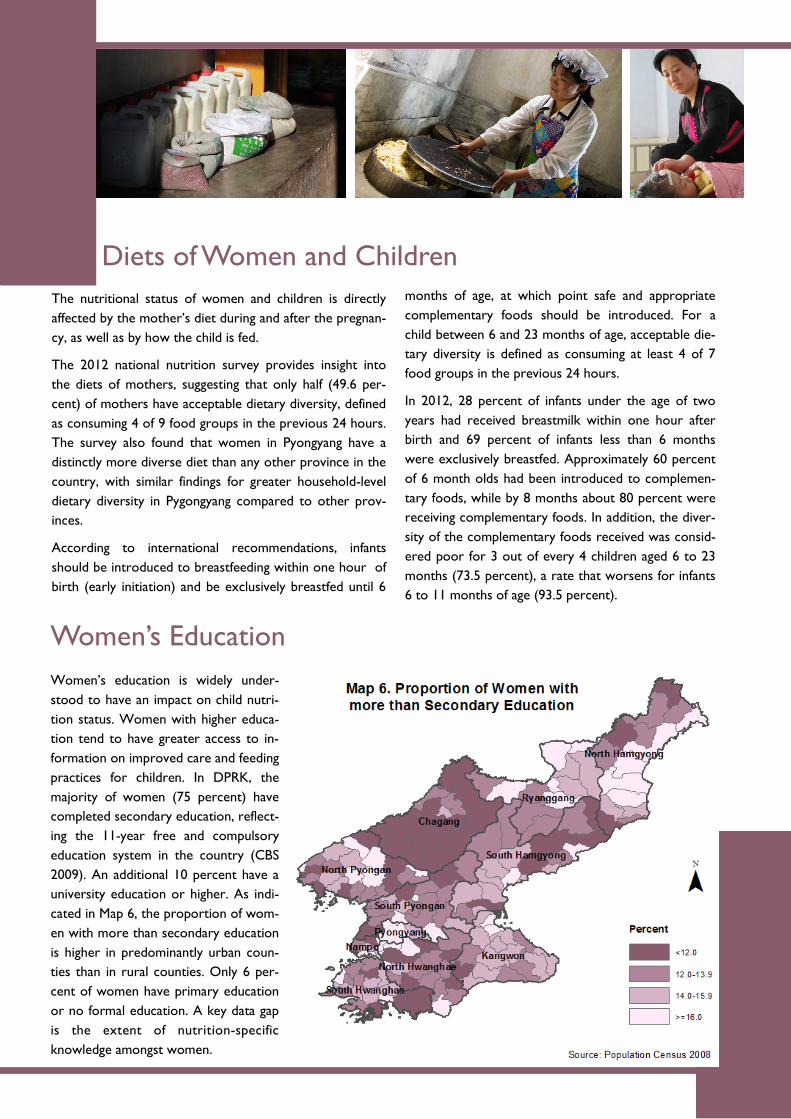
The nutritional status of women and children is directly
affected by the mother’s diet during and after the pregnan-
cy, as well as by how the child is fed.
The 2012 national nutrition survey provides insight into
the diets of mothers, suggesting that only half (49.6 per-
cent) of mothers have acceptable dietary diversity, defined
as consuming 4 of 9 food groups in the previous 24 hours.
The survey also found that women in Pyongyang have a
distinctly more diverse diet than any other province in the
country, with similar findings for greater household-level
dietary diversity in Pygongyang compared to other prov-
inces.
According to international recommendations, infants
should be introduced to breastfeeding within one hour of
birth (early initiation) and be exclusively breastfed until 6
Women’s education is widely under-
stood to have an impact on child nutri-
tion status. Women with higher educa-
tion tend to have greater access to in-
formation on improved care and feeding
practices for children. In DPRK, the
majority of women (75 percent) have
completed secondary education, reflect-
ing the 11-year free and compulsory
education system in the country (CBS
2009). An additional 10 percent have a
university education or higher. As indi-
cated in Map 6, the proportion of wom-
en with more than secondary education
is higher in predominantly urban coun-
ties than in rural counties. Only 6 per-
cent of women have primary education
or no formal education. A key data gap
is the extent of nutrition-specific
knowledge amongst women.
months of age, at which point safe and appropriate
complementary foods should be introduced. For a
child between 6 and 23 months of age, acceptable die-
tary diversity is defined as consuming at least 4 of 7
food groups in the previous 24 hours.
In 2012, 28 percent of infants under the age of two
years had received breastmilk within one hour after
birth and 69 percent of infants less than 6 months
were exclusively breastfed. Approximately 60 percent
of 6 month olds had been introduced to complemen-
tary foods, while by 8 months about 80 percent were
receiving complementary foods. In addition, the diver-
sity of the complementary foods received was consid-
ered poor for 3 out of every 4 children aged 6 to 23
months (73.5 percent), a rate that worsens for infants
6 to 11 months of age (93.5 percent).

Risk and Vulnerability
In DPRK, where national food security is shaped by low or non-existent food reserves, no established
trade relations for commodities and a unreliable system of centralized distribution, the lack of resili-
ence in the face of a shock, particularly to domestic agriculture production, is striking. At household
level, vulnerability to food insecurity is compounded by restrictions on movement and on market en-
gagement, activities that might otherwise enable a household to weather a shock to its supply of food.
Natural shocks or hazards in DPRK include droughts, floods, tidal surges, typhoons and extremely cold
winters. Non-natural hazards, such as deforestation and hazards related to urbanization including deg-
radation of urban air, water and soil and indoor pollution, are increasingly of concern as well.
Despite positive achievements in terms of disaster
management, the country remains highly vulnerable to
natural disasters, with serious implications for food
security. Heavy rainfall, storms and flooding are fairly
common with the risk rising during the summer
months (July through early September). Moderate dry
spells, while not major disasters, can pose a consider-
able challenge to production particularly in the spring
season when risk is higher. In the last 20 years, the
country has experienced approximately 20 floods, 7
storms and one major dry spell (April 2012), that
have affected over 15 million people (EM-DAT
2013).
In the last two years alone, natural disasters have
caused considerable damage and placed millions of
people at risk of food insecurity. In 2011, three
floods hit the main food producing provinces in the
south-eastern cereal bowl, particularly South and
North Hangwae, affecting over 50,000 people and
resulting in serious damage to crops (EM-DAT
2013).
In 2012, a dry spell in April, flood in July and a storm
Hazards
Vulnerability
There is considerable variation in the exposure to
hazards around the country. In the north, ex-
treme cold and prolonged winter seasons fre-
quently delay crop planting. Flooding, storms and
dry spells are more likely to impact the coastal
and southern cereal bowl regions of the country.
On sloping lands, landslides are also a risk.
Given the lack of private assets and alternative
livelihoods, as well as the formal restrictions in
cereal trade and population movement, all households in
DPRK are strikingly vulnerable to food insecurity in the
face of a large-scale natural disaster that affects food pro-
duction. However, households in counties with low food
production that are reliant on inflows of food from coun-
ties with higher production are particularly vulnerable as
transport and accessibility are a challenge. These counties
can be found mostly in the northern and eastern provinc-
es of Ryanggang, Chagang, North Hamgyong, South
Hamgyong, and Kangwon.
in August together affected 3.14 million people (EM-DAT
2013). The flood and cyclone together resulted in a total
estimated loss of 11,400 hectares of crop land, flattened
47,000 hectares and caused widespread damage to infra-
structure (FAO-WFP 2012).
Non-natural hazards, including deforestation and urbaniza-
tion, often exacerbate the impacts of natural hazards, in-
Source: EM-DAT 2013
0
1000000
2000000
3000000
4000000
5000000
6000000
7000000
1995 1996 2000 2001 2004 2006 2007 2012
Affe
cted
Per
sons
Figure 9. Population Affected by the Top 10
Natural Disasters between 1995 and 2012
Storm
2 Floods
Flood
Floods Flood
Flood,
Drought
18

Primary Outcomes
Primary outcomes associated with a household’s food security status include food consumption pat-
terns and changes in livelihood patterns. Information on changes in livelihoods, however, is limited in
DPRK. Undernourishment, as an indicator of hunger, has shown little improvement overall since the
1990s: in 2012, undernourishment was estimated at 32 percent of the population (FAO 2012). Food
consumption patterns in DPRK are strikingly similar across households and are characterized by heavy
reliance on staples, almost daily consumption of vegetables and low protein intake. Consumption pat-
terns are highly vulnerable to shocks to agricultural production and food-based coping strategies are
commonly employed. The lack of household food stocks plays a key role in this vulnerability.
The food consumption score (FCS) is a tool developed to
assess dietary diversity at the household level and can pro-
vide important insight into household access to food and
resulting consumption patterns. The FCS weights food
groups based on their relative nutritive value and takes
into account the frequency of consumption of each group
within the past seven days. Based on agreed thresholds,
the households are then classified into three food con-
sumption groups: poor, borderline and acceptable.19
Dietary diversity in DPRK is remarkably similar from
household to household, a function mainly of the central-
ized distribution of rations and similarity in household
crop and garden production. The diet is heavily based on
staple grains (rice and/or maize), with daily consumption of
pickled vegetables (kimchi) and condiments (bean paste),
but limited consumption of oils and fats. Protein-source
foods are poorly represented in the diet, with average
consumption on one or two days of the week. A re-
cent assessment indicated that one in five households
(19 percent) did not consume protein of any kind in
the past week. Households with livestock have great-
er access to animal-source protein in the diet, but
meat consumption is still primarily reserved for spe-
cial occasions (FAO-WFP 2012, WFP 2012).
Using a typical ration-based diet comprised of 260
grams of cereals, 15 grams of oil, 30 grams of bean
paste and 30 grams of soy sauce, a macro-nutrient gap
analysis suggests that the diet falls short of recom-
mended intake of energy by 30 percent, of protein by
25 percent, and of fats by 30 percent (FAO-WFP
2012).
In DPRK, households achieve acceptable consumption
usually when they are able to access more protein-
source foods. Since meat consumption is generally
Undernourishment
Food Consumption
Household Food Consumption
Undernourishment, not to be confused with under-
weight, is a proxy indicator of hunger in a country,
reported as the proportion of the population that has
food consumption (kilocalories) falling below the mini-
mum energy requirements. It is not a measure of nu-
tritional status, but a theoretical construct of the po-
tential per capita availability of food. According to the
FAO State of Food Insecurity in the World 2012,
trends in undernourishment for DPRK have shown an
increase overall between 1990/92 and 2010/12 (26
percent increase), although with some improvement
in the last few years (Fig. 10). In 2010/12, an estimat-
ed 8 million people were considered hungry, equal to
32 percent of the total population.
Figure 10. Undernourishment 1990-2012
Source: FAO 2012
25.4
37 36.1
39.7
32
5
8
9
10
8
0
2
4
6
8
10
12
0
5
10
15
20
25
30
35
40
45
1990/92 1999/01 2004/06 2007/09 2010/12
Num
ber
of
People
Perc
ent
of th
e p
opula
tion

As highlighted in the section on Access, PDS rations
rarely reach targeted levels and are often unable to
meet the needs of households. In addition, distribu-
tions may be unreliable, especially in more remote
areas of the country. During the lean season or in the
event of a shock, household food supply from rations
may therefore decline dramatically. While some
households may be able to increase reliance on
household kitchen gardens, small livestock, fishing and
collecting of wild foods, capacity is limited. It is com-
mon for households to resort to food-based coping
strategies in which food intake is reduced, water is
added to foods to increase bulk and less-preferred
foods are consumed. In addition, households fre-
Food-Based Coping Strategies
quently increase reliance on relatives to improve house-
hold food supply.
While the sample of households was small and controlled,
the 2012 CFSAM still found that three in four households
reported worrying about the ability to get enough food,
and approximately three in four indicated that they ate
smaller meals than they need (Fig 12).
Skipping meals was less common, although just under half
of households reported having to eat fewer meals than
usual. Overall, the low resilience of the food system in
DPRK translates into a high level of vulnerability for
households, particularly PDS dependents. Access to food
for the majority of households is precarious and can tip
easily over the edge into food insecurity.
Figure 12. Household-Level Impacts of Food Security 2012
reserved for special occasions, increasing protein
sources depends on access to plant-based foods such
as soya products. The decline in production and distri-
bution of soybeans therefore poses a serious chal-
lenge to the improvement of consumption patterns in
the country.
A striking characteristic of consumption patterns over
time in DPRK is the widespread vulnerability to sea-
sonality (peak lean season in June/July) and to hazards
that affect production and therefore distribution via
the PDS. The lack of resilience, due in part to negligi-
ble household food stocks, translates into relatively
rapid shifts from one food consumption category
into another, such as from borderline to poor con-
sumption, in the face of shortages.
Overall, consumption patterns of cooperative farm-
ers tend to be more resilient to shocks than PDS
dependent households, given their greater access to
own production, gardens and livestock. According
to the 2012 CFSAM, households overall reported better
consumption patterns compared to a year ago, with 37
percent having acceptable consumption, another 37 per-
cent borderline, and 26 percent poor. However, 45 per-
cent of cooperative farmer households had acceptable
consumption compared to 32 percent of PDS dependent
households (Fig. 11).
20
0
10
20
30
40
50
Poor Borderline Acceptable
Per
cent
All PDS dependent Cooperative farmer
Figure 11. Food Consumption Groups 2012
Source: FAO-WFP 2012
Source: FAO-WFP 2012
0102030405060708090
100
Worry
that there
wasn'tenough
food?
Not able
to eat the
kind offood
preferred
Ate a
limited
variety offoods
Ate food
you really
did notwant to
eat
Ate
smaller
meals thanyou
needed
Ate fewer
meals than
usual
No food
to eat of
any kind
Went to
bed feeling
hungry
Went a
whole day
and nightwithout
eating
Perc
ent
PDS dependent
Cooperative Farmer

Secondary Outcomes Child malnutrition and mortality rates are considered secondary outcomes of household food insecuri-
ty. While the prevalence rates of stunting, underweight and wasting in DPRK have seen steady im-
provement since the late 1990s, child malnutrition, and particularly vulnerability to seasonal fluctua-
tions, remains a major concern. In 2012, the national prevalence of stunting was 27.9 percent, consid-
ered “serious” according to the WHO thresholds. Micronutrient deficiencies are a major concern,
particularly anemia and iodine deficiency disorders. Mortality rates have also declined since 1998, but
remain higher than those in 1993.
Child Malnutrition
Chronic Malnutrition
Child nutritional status is measured based on
child’s weight, height and/or age. Overall, child un-
dernutrition indicators have improved in DPRK
since 1998, with stunting declining at more than 2
percent per year. However the rates differ be-
tween the provinces with the northern parts having
consistently worse rates of malnutrition. While the
2012 Nutrition Survey did not disaggregate accord-
ing to rural/urban locale, the MICS 2009 results
indicate that children in rural areas have generally
worse indicators for malnutrition as well. In terms
of the MDG for child undernutrition (underweight),
DPRK has reached its goal by halving malnutrition
from 60.6 percent already in year 2000.
Chronic malnutrition, or stunting, is measured as low
height-for-age. Generally stunting is a result of inadequate
nutrition over a prolonged period of time and/or pro-
longed or recurrent infections. Stunting that
occurs within the first 24 months is consid-
ered irreversible and carries serious implica-
tions for the development capacity and future
income-earning potential of the next genera-
tion (Lancet series, 2008).
While DPRK has experienced a steady decline
overall in the prevalence of stunting among
children under 5, from 62 percent in 1998 to
28 percent in 2012, regional disparities are still
evident. As indicated in Map 7, stunting re-
mains highest in the northern and eastern
provinces of Ryanggang, Chagang and South
Hamgyong.
The 2012 national survey also found that
stunting increases rapidly between 6 and 23
months, pointing to the importance of ad-
dressing stunting in the first 1000 days of life,
from inception to 2 years. This focus also draws fur-
ther attention to the health and nutrition of the moth-
er pre-, during and post-pregnancy.
62.4
45.239.2
37.032.4
27.9
60.6
27.920.1 23.3
18.815.215.6
10.4 8.1 7.0 5.2 4.0
0.0
10.0
20.0
30.0
40.0
50.0
60.0
70.0
1998 MICS
1
2000 MICS
2
2002
NutritionAssessment
2004
NutritionAssessment
2009 MICS
3
2012
NutritionSurvey
Perc
en
t o
f ch
ild
ren
<5 y
rs
Stunting Underweight Wasting
Figure 13. Trends in Child Malnutrition

Acute Malnutrition
Micronutrient Deficiencies
Mortality
DPRK mortality indicators, while showing declines since
the 1998 MDG baseline values, remained higher in 2008
compared to 1993. In addition, a child and a mother’s
risk of dying remained worse in rural areas in 2008: IMR
Poor dietary diversity can also contribute to micronu-
trient deficiencies. Data on micronutrient deficiencies in
DPRK is limited to Vitamin A supplementation for
women and children, micronutrient supplementation
during pregnancy, anaemia in women and children, and
salt iodization.
The Government has made significant progress to-
wards universal coverage of Vitamin A supplementation
for children and for post-partum women. Data from
2012 reported 98 percent coverage of children, while
data from 2009 reported 97.5 percent coverage of post
-partum women. Similarly, micronutrient supplementa-
tion for pregnant women is quite high, found to be 98
percent in 2009, although dropping to 74 percent in
The prevalence of acute malnutrition (wasting) meas-
ured as low weight-for-height, is one of the short-
term consequences of extreme food shortages and/or
severe illness and accordingly is a key indicator in
emergencies. In DPRK, wasting reflects the seasonal
vulnerability of children, with noted peaks in preva-
lence occurring during the rainy season and pre-
harvest (May-Aug).
National assessments, typically conducted post-
harvest (September/October), generally fail to capture
the fluctuations in wasting that can occur rapidly and
pose a serious threat to child health and mortality.
Measures of the Mid-Upper Arm Circumference
(MUAC) are often used as a proxy indicator for in-
creased risk of mortality and for acute malnutrition,
with less than 115 mm circumference considered se-
verely malnourished, and between 115 and 125 mm
considered moderately malnourished.20
Several assessments conducted in the second half of 2011
in response to a shock to food production reveal the vul-
nerability of children to acute malnutrition and the speed
in which the situation can become serious. One assess-
ment was conducted by the Institute of Child Nutrition in
a random sample of 35 WFP-assisted counties and the
other by the Ministry of Public Health in 25 UNICEF
counties. The ICN assessment found that 14.1 percent of
the children were malnourished, of which 1.6 percent
were severely malnourished. Similarly, the MoPH results
found 17.4 percent of children were malnourished. These
rates far exceed the prevalence reported by MICS 2009
(5.2 percent) and by the 2012 National Nutrition Survey
(4 percent). A follow-up screening in the UNICEF coun-
ties conducted 6 months later found that the proportion
of malnourished children had declined to 5.4 percent.
2012. Likewise, compliance to take the supplements for
the intended six months had reduced from 44 percent to
some 20 percent.
Approximately 31 percent of mothers were found to have
anaemia in 2012, a slight improvement from the 35 per-
cent of women of reproductive age in 2004. Some 29 per-
cent of children under the age of five and almost half of
children under two were anaemic in 2012, constituting a
serious public health problem. In terms of iodine, only
24.5 percent of households consume adequately iodized
salt in 2009, with higher use in urban households (29 per-
cent) compared to rural households (18 percent). As a
result, goitre tends to be more prevalent in the mountain-
ous counties of DPRK.
and U5MR were 21.7 and 29.6 deaths per 1,000 live
births each and MMR was 105.0 deaths per 100,000
live births in rural areas, compared to 17.6, 24.6
and 70.0 respectively in urban areas.
22
Table 6. Mortality Indicators
Indicator 1993 1998 2000 2002 2004 2006 2008
IMR 14.1 23.5 21.8 22.7 21.1 19.5 19.3
U5MR -- 49.7 47.6 48.4 45.5 38.7 26.7
MMR 54 105 -- 97 -- 90 85.1
Source: MoPH 2012
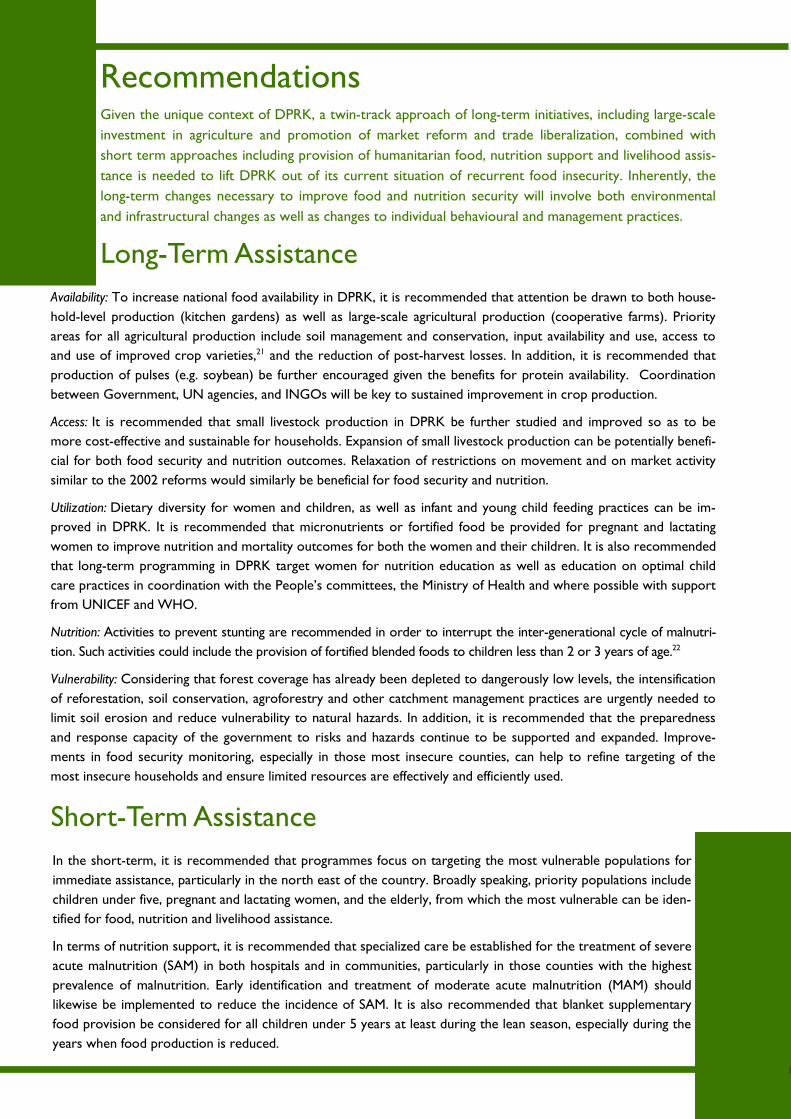
Recommendations
Availability: To increase national food availability in DPRK, it is recommended that attention be drawn to both house-
hold-level production (kitchen gardens) as well as large-scale agricultural production (cooperative farms). Priority
areas for all agricultural production include soil management and conservation, input availability and use, access to
and use of improved crop varieties,21 and the reduction of post-harvest losses. In addition, it is recommended that
production of pulses (e.g. soybean) be further encouraged given the benefits for protein availability. Coordination
between Government, UN agencies, and INGOs will be key to sustained improvement in crop production.
Access: It is recommended that small livestock production in DPRK be further studied and improved so as to be
more cost-effective and sustainable for households. Expansion of small livestock production can be potentially benefi-
cial for both food security and nutrition outcomes. Relaxation of restrictions on movement and on market activity
similar to the 2002 reforms would similarly be beneficial for food security and nutrition.
Utilization: Dietary diversity for women and children, as well as infant and young child feeding practices can be im-
proved in DPRK. It is recommended that micronutrients or fortified food be provided for pregnant and lactating
women to improve nutrition and mortality outcomes for both the women and their children. It is also recommended
that long-term programming in DPRK target women for nutrition education as well as education on optimal child
care practices in coordination with the People’s committees, the Ministry of Health and where possible with support
from UNICEF and WHO.
Nutrition: Activities to prevent stunting are recommended in order to interrupt the inter-generational cycle of malnutri-
tion. Such activities could include the provision of fortified blended foods to children less than 2 or 3 years of age.22
Vulnerability: Considering that forest coverage has already been depleted to dangerously low levels, the intensification
of reforestation, soil conservation, agroforestry and other catchment management practices are urgently needed to
limit soil erosion and reduce vulnerability to natural hazards. In addition, it is recommended that the preparedness
and response capacity of the government to risks and hazards continue to be supported and expanded. Improve-
ments in food security monitoring, especially in those most insecure counties, can help to refine targeting of the
most insecure households and ensure limited resources are effectively and efficiently used.
In the short-term, it is recommended that programmes focus on targeting the most vulnerable populations for
immediate assistance, particularly in the north east of the country. Broadly speaking, priority populations include
children under five, pregnant and lactating women, and the elderly, from which the most vulnerable can be iden-
tified for food, nutrition and livelihood assistance.
In terms of nutrition support, it is recommended that specialized care be established for the treatment of severe
acute malnutrition (SAM) in both hospitals and in communities, particularly in those counties with the highest
prevalence of malnutrition. Early identification and treatment of moderate acute malnutrition (MAM) should
likewise be implemented to reduce the incidence of SAM. It is also recommended that blanket supplementary
food provision be considered for all children under 5 years at least during the lean season, especially during the
years when food production is reduced.
Given the unique context of DPRK, a twin-track approach of long-term initiatives, including large-scale
investment in agriculture and promotion of market reform and trade liberalization, combined with
short term approaches including provision of humanitarian food, nutrition support and livelihood assis-
tance is needed to lift DPRK out of its current situation of recurrent food insecurity. Inherently, the
long-term changes necessary to improve food and nutrition security will involve both environmental
and infrastructural changes as well as changes to individual behavioural and management practices.
Long-Term Assistance
Short-Term Assistance
End Notes
5 Area planted with potatoes includes early season and main season crop production. 6 “Utilization” in terms of the food balance sheet includes food use, feed use, seed requirements, post-harvest
losses and stock build-up. 7 The deficit in 2008/09 reflected poor domestic production as a result mainly of low availability of inputs and
soil infertility. 8 The 2012/13 balance sheet breakdown (’000t): 4,922 available (after post harvest losses), 5,429 utilized, 300
imported, 35 in food aid.
9 Forest cover was also lost as a result of firewood extraction and logging.
10 The short time between the harvest of the first crop and the planting of the second crop puts a heavy de-
mand on labour and tractors (FAO, 2003).
11 Acidic soils have a pH between 4.5 and 5.5, while optimal soil pH is 6.5.
12 In 2012, several farms reportedly increased the use of organic manure at a target application rate of 20 tons/
hectare.
13 The steady increase in the number of draught oxen over the last few years is indicates the continuing short-
age of farm power.
14 One pyong is equal to 3.3 square metres. 15 In 2012, the rabbit population was estimated at 1.2 rabbits per capita and represented a significant source of
food and protein.
16 The working population is defined in the population census as those at least 16 years of age.
17 Domestic cereal production reflects cereal equivalents after subtracting estimated post-harvest losses (FAO-
1 The economic data for DPRK is based on publications from EIU, Bank of Korea, Korea Development
Institute, Seoul and FAO-WFP CFSAMs.
2 The official exchange rate is currently 129 KPW to US $1 and 172 KPW to 1 EURO.
3 After two consecutive years of summer flooding in 2006 and 2007, food assistance returned in 2008,
with continued support in 2011 and 2012. 4 Measured in cereal equivalents, domestic production includes main and early season outputs from coopera-
tive farms and individual plots, plus outputs from sloping land and gardens.
24
WFP 2012).
18 However, data on infections was collected in September and October and therefore does not cap-
ture seasonal changes in infection levels.
19 The thresholds for food consumption score applied in DPRK are the following: poor <28; borderline
28-42; acceptable >42.
20 MUAC cutoffs are determined on the basis of admission criteria to selective feeding programmes.
21 Varieties with tolerance to both weather stress and to major diseases and pests.
22 Fortified blended food should be formulated to be ideal for stunting prevention instead of wasting
prevention.

Literature References
CBS and UNFPA (2009) Maternal Mortality Study, CBS-DPRK.
CBS (2010) Multiple Indicator Cluster Survey 2009, CBS-DPRK, 147pages.
CBS and UNFPA (2010) Reproductive Health Survey, CBS-DPRK.
CBS (2013) Final Report of the National Nutrition Survey 2012, CBS-DPRK, 96 pages.
Food and Agriculture Organization (FAO) (2003) Fertilizer Use by Crop in the Democratic People's Republic of
Korea, Land and Plant Nutrition Management Service Land and Water Development Division, First version,
Rome, Italy, 46 pages.
FAO (2006) Fertilizer Use by Crop, Fertilizer and Plant Nutrition Bulletin, No 17, FAO, Rome, Italy, 124 pages.
FAO (2008) Integrated Crop Management Vol.6-2008, An International Technical Workshop Investing in Sus-
tainable Crop Intensification: The Case for Improving Soil Health, FAO, Rome, Italy: 22-24 July 2008, 140 pages.
FAO (2012) State of the Food Insecurity in the World (SOFI), Rome, Italy.
FAO-WFP (2010) Crop and Food Security Assessment Mission to the Democratic People’s Republic of Korea,
Special Report, FAO-WFP, Rome, Italy, November 2010, 28pages.
FAO-WFP (2011) Crop and Food Security Assessment Mission to the Democratic People’s Republic of Korea,
FAO-WFP, Special Report, Rome, Italy, November 2011, 34 pages.
FAO-WFP (2012) Crop and Food Security Assessment Mission to the Democratic People’s Republic of Korea,
FAO-WFP, Special Report, November 2012, 41 pages.
FAO (2012) Statistic of Harvested area, Production and Yield in DPRK, faostat.fao.org/site/567/
default.aspx#ancor.
Goodbody, S. (2013) Personal Communication, April 2013.
Hari Har Ram (2012) Improved Seed Production for Sustainable Agriculture. (DRK/10/004/01/99-VEGETABLE
SEED PRODUCTION). End of Assignment Report, FAO, DPRK, April-2012, 21 pages.
Joint Research Centre, European Union. (2012) Assessment of Cropland Area on Sloping Land in DPRK. (JRC
IES/H04/F/HKE/hke D(2012)(15133)).
Lancet (2008) Maternal and Child Undernutrition Series.
Mandal-Bir (2012) Food & Nutrition Security Situation in DPR Korea, CTA DRK/010/004 and DRK/010/005
projects funded by UNDP, 6pages.
Ministry of Agriculture (MoA) (2012), Food Production Statistics, MoA-DPRK.
Central Bureau of Statistic (CBS) and Institute of Child Nutrition (2005) Nutrition Assessment Re-
port of Survey Results, CBS-DPRK.
CBS (2008a) 2008 Census of Population Key Findings, CBS-DPRK, 4pages.
CBS (2009) Democratic People’s Republic of Korea 2008 Population Census, National Report, 271
pages.

Ministry of Public Health (MoPH) (2012) Annual Health Report Towards MDGs in DPRK, MoPH-DPRK,
67pages.
MoPH and WHO (2011b) Medium Term Strategic Plan for the Development of the Health Sector in DPRK
2010-2015, MoPH-DPRK,102 pages.
Ministry of Land and Environment Protection (MoLEP) (2007) Major Environmental issues in DPRK. MoLEP-
DPRK.
Université Catholique de Louvain, (2012) EM-DAT: The OFDA/CRED International Disaster Database.
www.emdat.be, Brussels, Belgium.
World Food Programme (WFP) (2009) Comprehensive Food Security & Vulnerability Analysis Guidelines, UN-
WFP, Food Security Analysis Service Rome, Italy, 347 pages.
WFP (2001) Guidelines for Undertaking a Secondary Data Analysis, UN-WFP, Rome, 27pages.
WFP (2004) Gathering and Utilization of Wild Foods in DPRK, UN-WPP, September 2004, 9pages.
WFP (2009) Emergency Operation 10757.0 Mid-Term Review 30 June-30 July 2009.
WFP-FAO-UNICEF (2011) Rapid Food Security Assessment Mission to the Democratic People’s Republic of
Korea, Special Report, March 2011, 35 pages.
WFP (2012a) Democratic People’s Republic of Korea Synthesis Paper, WFP DPRK, Country Office, 11 pages.
WFP (2012b) Emergency Operation 200266.0 End-of-Project Review, WFP DPRK, Country Office, 34 pages.
WHO (2012) Trend in Maternal Mortality: 1990-2010, WHO-UNICEF-UNFPA and World Bank Estimations.
WHO, Geneva, Switzerland, 60 pages.
26


![Barteringandtradingtaxissues1.pptx [Read-Only] · • The options for bartering and trading is numerous Examples of Bartering • You are a self‐employed attorney who performs legal](https://static.fdocuments.in/doc/165x107/5f38848028ddfb16c20ef8d2/bartering-read-only-a-the-options-for-bartering-and-trading-is-numerous-examples.jpg)