
Food and Beverage - wholesale.wf.com · •Frozen Food 3Q’18 average unit price increased 0.6%...
18
August 2012 Industry Research Update: Food and Agribusiness 1 November 2018 © 2018 Wells Fargo Bank, N.A. All rights reserved. For public use. 1 Key Demand Developments • Wells Fargo Securities has the inflation forecast as largely unchanged for 2019 and 2020. Rising labor and material costs will likely continue to generate additional inflation pressures throughout 2019. We expect inflation to soften slightly in 2020 as energy prices begin to moderate. • Wells Fargo economists have updated the bank’s forecast for Q4-2018 U.S. real GDP growth to 2.5%. Government spending will continue to provide a boost to growth, and the bank expects a rebound in business fixed investment in Q4. For personal consumption growth, the bank feels a cool down from the third quarter pace is imminent, but that personal consumption will remain supportive of overall GDP growth. Residential construction is likely to remain a weak spot moving forward. • Wells Fargo economists have pared back expectations for global growth. Even with U.S. outperformance, growth continued to slow down in China and the Eurozone for Q3. A potential meeting at the G20 summit in late November between President Xi and President Trump will be key to the global trade outlook for growth. Consumer and Producer Price Indices • The Producer Price Index (PPI All Food) declined by 1.8% Y/Y for Sept 2018. The spread between restaurant and food retail pricing is steady for both Y/Y and M/M for September 2018, yet remains higher than the Jan 2018 low. Over the 3-5 year period, these trends appear to be demonstrating less volatility in macroeconomic indicators as CPI and PPI are moving in a smaller channel. • Restaurant pricing measured by the CPI Food Away from Home index (CPI-FAFH) grew 2.6% Y/Y in Sept 2018, which is outpacing the CPI Food At Home index with .3% growth Y/Y. Both of these measurements remain steady over the last several months. Industry Update Food and Agribusiness Price and Food Inflation Developments Food Retail Sales According to Nielsen, U.S. Food Retail sales growth increased in dollar volume by 1.3% Y/Y, while unit sales decreased 1.9% Y/Y. With overall value turning around since last month and unit sales decline decreasing, this begs the question of whether retail is beginning to find a strategic balance versus competition. Nielsen forecasts that fast-moving consumer goods (FMCG), including food, will continue to face growth headwinds through 2019 and 2020, notably for grocery, drug, and mass merchandise channels. -8% -6% -4% -2% 0% 2% 4% 6% 8% 10% Jan-14 Jul-14 Jan-15 Jul-15 Jan-16 Jul-16 Jan-17 Jul-17 Jan-18 Jul-18 Y/Y Change (%) CPI Food Away From Home CPI Food At Home PPI All Food Source: U.S. Bureau of Labor Statistics
Transcript of Food and Beverage - wholesale.wf.com · •Frozen Food 3Q’18 average unit price increased 0.6%...

August 2012
Industry Research Update: Food and Agribusiness 1
November 2018
© 2018 Wells Fargo Bank, N.A. All rights reserved. For public use.
1
Key Demand Developments
• Wells Fargo Securities has the inflation forecast as largely unchanged for 2019 and 2020. Rising labor and material costs will likely continue to generate additional inflation pressures throughout 2019. We expect inflation to soften slightly in 2020 as energy prices begin to moderate.
• Wells Fargo economists have updated the bank’s forecast for Q4-2018 U.S. real GDP growth to 2.5%. Government spending will continue to provide a boost to growth, and the bank expects a rebound in business fixed investment in Q4. For personal consumption growth, the bank feels a cool down from the third quarter pace is imminent, but that personal consumption will remain supportive of overall GDP growth. Residential construction is likely to remain a weak spot moving forward.
• Wells Fargo economists have pared back expectations for global growth. Even with U.S. outperformance, growth continued to slow down in China and the Eurozone for Q3. A potential meeting at the G20 summit in late November between President Xi and President Trump will be key to the global trade outlook for growth.
Consumer and Producer Price Indices
• The Producer Price Index (PPI All Food) declined
by 1.8% Y/Y for Sept 2018. The spread between
restaurant and food retail pricing is steady for
both Y/Y and M/M for September 2018, yet
remains higher than the Jan 2018 low. Over the
3-5 year period, these trends appear to be
demonstrating less volatility in macroeconomic
indicators as CPI and PPI are moving in a smaller
channel.
• Restaurant pricing measured by the CPI Food
Away from Home index (CPI-FAFH) grew 2.6%
Y/Y in Sept 2018, which is outpacing the CPI
Food At Home index with .3% growth Y/Y. Both
of these measurements remain steady over the
last several months.
Industry Update
Food and Agribusiness
Price and Food Inflation Developments
Food Retail Sales
According to Nielsen, U.S. Food Retail sales growth increased in dollar volume by 1.3% Y/Y, while unit sales decreased 1.9% Y/Y. With overall value turning around since last month and unit sales decline decreasing, this begs the question of whether retail is beginning to find a strategic balance versus competition. Nielsen forecasts that fast-moving consumer goods (FMCG), including food, will continue to face growth headwinds through 2019 and 2020, notably for grocery, drug, and mass merchandise channels.
-8%
-6%
-4%
-2%
0%
2%
4%
6%
8%
10%
Jan-14 Jul-14 Jan-15 Jul-15 Jan-16 Jul-16 Jan-17 Jul-17 Jan-18 Jul-18
Y/Y
Change (
%)
CPI Food Away From Home CPI Food At Home PPI All Food
Source: U.S. Bureau of Labor Statistics
August 2012
2
© 2018 Wells Fargo Bank, N.A. All rights reserved. For public use.
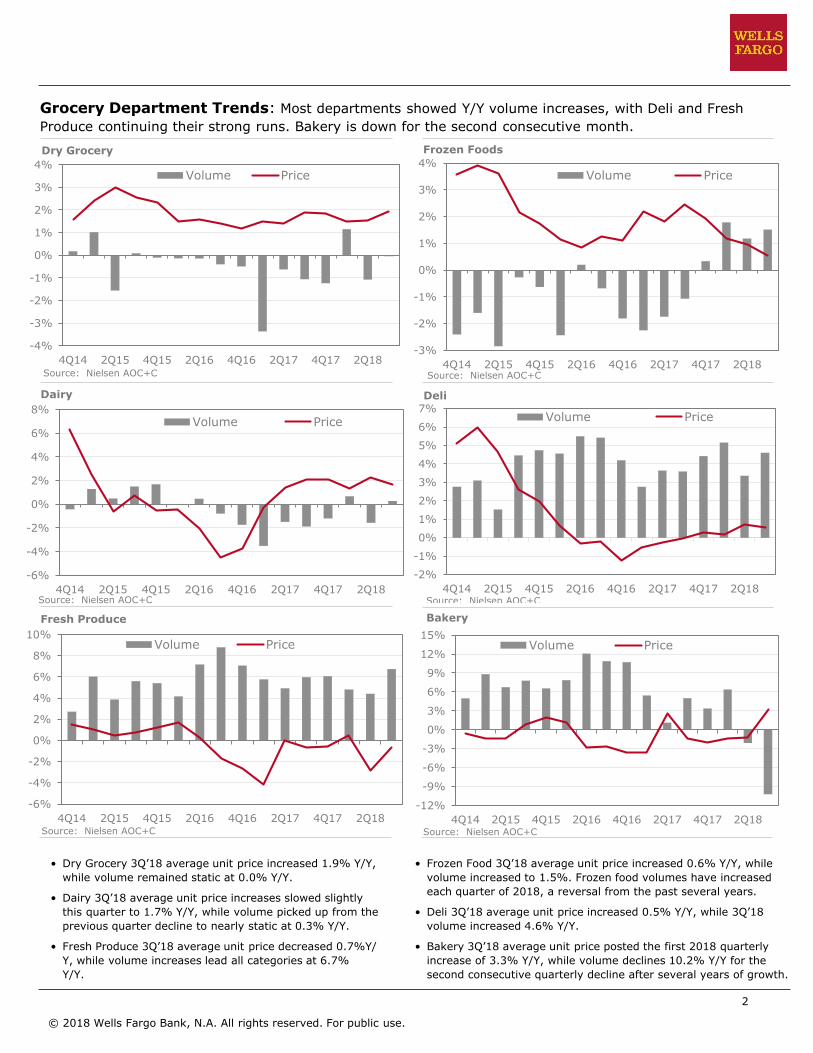
Grocery Department Trends: Most departments showed Y/Y volume increases, with Deli and Fresh
Produce continuing their strong runs. Bakery is down for the second consecutive month.
Dry Grocery Frozen Foods
Bakery
Deli
• Dry Grocery 3Q’18 average unit price increased 1.9% Y/Y,
while volume remained static at 0.0% Y/Y.
• Dairy 3Q’18 average unit price increases slowed slightly
this quarter to 1.7% Y/Y, while volume picked up from the
previous quarter decline to nearly static at 0.3% Y/Y.
• Fresh Produce 3Q’18 average unit price decreased 0.7%Y/
Y, while volume increases lead all categories at 6.7%
Y/Y.
Dairy
Fresh Produce
• Frozen Food 3Q’18 average unit price increased 0.6% Y/Y, while
volume increased to 1.5%. Frozen food volumes have increased
each quarter of 2018, a reversal from the past several years.
• Deli 3Q’18 average unit price increased 0.5% Y/Y, while 3Q’18
volume increased 4.6% Y/Y.
• Bakery 3Q’18 average unit price posted the first 2018 quarterly
increase of 3.3% Y/Y, while volume declines 10.2% Y/Y for thesecond consecutive quarterly decline after several years of growth.
-4%
-3%
-2%
-1%
0%
1%
2%
3%
4%
4Q14 2Q15 4Q15 2Q16 4Q16 2Q17 4Q17 2Q18
Volume Price
Source: Nielsen AOC+C
-6%
-4%
-2%
0%
2%
4%
6%
8%
4Q14 2Q15 4Q15 2Q16 4Q16 2Q17 4Q17 2Q18
Volume Price
Source: Nielsen AOC+C
-6%
-4%
-2%
0%
2%
4%
6%
8%
10%
4Q14 2Q15 4Q15 2Q16 4Q16 2Q17 4Q17 2Q18
Volume Price
Source: Nielsen AOC+C
-2%
-1%
0%
1%
2%
3%
4%
5%
6%
7%
4Q14 2Q15 4Q15 2Q16 4Q16 2Q17 4Q17 2Q18
Volume Price
Source: Nielsen AOC+C
-3%
-2%
-1%
0%
1%
2%
3%
4%
4Q14 2Q15 4Q15 2Q16 4Q16 2Q17 4Q17 2Q18
Volume Price
Source: Nielsen AOC+C
-12%
-9%
-6%
-3%
0%
3%
6%
9%
12%
15%
4Q14 2Q15 4Q15 2Q16 4Q16 2Q17 4Q17 2Q18
Volume Price
Source: Nielsen AOC+C

August 2012
3
© 2018 Wells Fargo Bank, N.A. All rights reserved. For public use.
Monthly avg. corn, wheat, soybeans in $/bu; broilers, shrimp in $/lb; cattle, hogs, milk in $/cwt; salmon in $/kg; gas in $/Mct; oil in $/gal; electricity in $/kWh; labor in $/h
Sources: CBOT, USDA, Urner Barry, EIA, BLS
• Economic Backdrop: Wells Fargo’s updated forecast for
Q3-2018 U.S. real GDP growth is 3.3%, up from 3.1% in our
last monthly report. Real personal consumption appears to
be growing in excess of a 3% annualized rate, while federal,state and local government spending is likely to boost growth
in the quarter.
• Corn, Wheat & Soybeans: Corn and wheat prices are
above the past two years with U.S. and world stocks forecast
to moderate in 2018/19 from large levels in 2017/18.
Soybean prices remain low with the U.S. stocks/use ratio
projected the highest in 33 years on a large crop and small
exports to China.
• Chicken: Boneless, skinless breast prices dip down to 90
cents/lb., the lowest level in decades. Despite low grain
prices lending support, gross margins continue to drop for
producers.
• Beef: Demand remained strong in October, driven by export
sales to Asia. Beef production in 2018 was revised lower by
USDA on a slower than expected marketing pace for fed
cattle in the fourth quarter.
• Pork: African Swine Fever continues to spread in China,
creating uncertainty for global supplies into Q1. Lower prices
helped keep September exports above last year’s levels.
Seasonally higher hog supplies are expected to pressure
prices in the next couple of months.
• Packer Margin Environment: Pork, chicken and beef
packer margins followed their seasonal patterns in October.
Pork packers are gaining leverage against producers as plant
capacity is tested. Chicken margins struggle with low product
prices.
• Seafood: Prices continue to advance for both cod and
pollock on forecasted lower quotas in 2019. The expected
lower quota is overshadowing concerns about the U.S. 10%
import tariff on product brought back into the U.S. afterChinese processing.
• Dairy: Cheese prices moved lower in October due to higher
production. Dairy cow numbers are shrinking, but stronger
milk per cow growth is offsetting any potential production
declines.
• Specialty and Non-Grain Crops: U.S. spot sugar prices are
up roughly 9% Y/Y. Continued significant price advances are
unlikely.
• Nuts: California tree nut harvest is virtually complete with
processing continuing through end of year. Pecan harvest
has started in California and continues in Texas and the
Southeast. Georgia harvest has been hampered by the effect
of Hurricane Michael. The harvest has produced large crops
of excellent quality, but smaller nut sizing is being noted.
• Wine: Harvest is wrapping up in California, Oregon and
Washington with all areas reporting a large crop of good quality.
Expectations are in line with an approximate harvest in the 4MM
ton range for California. Bulk wine is available for purchase
depending on variety, quality and location. Industry is looking at
the possible effect of smoke taint in areas that experience
wildfires, and competition with legalized cannabis consumption.
• Fruit Crops: Table grape harvest will be winding down, although
fruit will continue to be sold out of cold storage. Apple harvest is
complete, with the U.S. crop down ~3MM boxes Y/Y. Fruits on
store shelves are transitioning to imported product, and citrus
growers are preparing to get harvest crews in the orchards.
• Vegetable Crops: Processing tomato harvest has wrapped up,
with an estimated 12.2MM tons delivered in CA. Cucumbers,
peppers, and tomatoes continue to be harvested in Tulare
County, with harvest expected to begin in FL soon. Lettuce
harvest is winding down in CA and moving to Arizona/Imperial
Valley. Sweet potato and sweet corn prices have increased
materially after weather issues in North Carolina.
• Forest Products: Lumber and structural panel prices fell sharply
in October to the lowest level in more than a year.
• Crop Inputs: Ammonia prices are the highest in 2½ years while
urea, DAP and potash prices are the highest in 3 years.
• Energy and Labor: The Energy Information Administration
estimates that U.S. crude oil production averaged 11.4MM barrels
per day in October, down from September levels because of
hurricane-related outages in the Gulf of Mexico.
Price vs. Volume Grain Protein Labor Energy
Constructive Mixed Mixed Inflationary Mixed
Food Company Margin Heat Map Y/Y
Food Company Input Cost Summary: As we end 3Q’18, commodity prices have been volatile when compared to 3Q’17 levels as M/M prices generally are up across the board. Commodity Price* Y/Y M/M
Corn $3.68 +5.4% +4.7%
HRW Wheat $5.14 +19.1% +1.3%
Soybeans $8.60 -12.0% +3.0%
Broilers $0.84 -1.5% +0.5%
Cattle $1.13 +0.7% +1.6%
Hogs $0.61 -1.4% +7.0%
Class III Milk $15.53 -7.0% -3.5%
Shrimp $4.00 -14.0% -1.2%
Salmon $5.66 +6.0% +0.5%
Natural Gas $8.93 +1.2% +4.0%
Electricity $10.97 -0.2% +1.4%
Heating Oil $3.23 +40.9% +0.3%
Restaurant Labor $13.94 +3.8% +0.4%
Supermarket Labor $13.45 +3.0% +0.4%
Food Labor $17.38 +3.9% +0.3%
Key Commodity Heat Map
*All prices for October except natural gas (July), Electricity (July),
heating oil (August) and supermarket labor (September)
August 2012
4
© 2018 Wells Fargo Bank, N.A. All rights reserved. For public use.
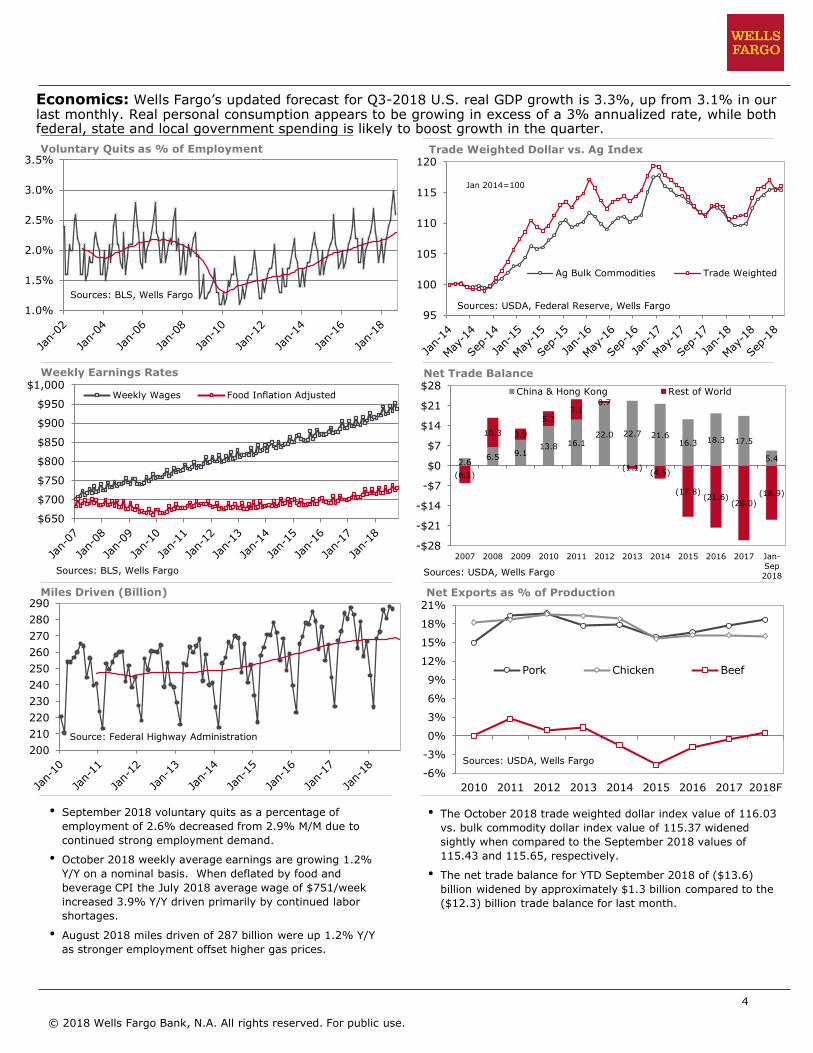
Economics: Wells Fargo’s updated forecast for Q3-2018 U.S. real GDP growth is 3.3%, up from 3.1% in our last monthly. Real personal consumption appears to be growing in excess of a 3% annualized rate, while both federal, state and local government spending is likely to boost growth in the quarter.
Miles Driven (Billion)
Trade Weighted Dollar vs. Ag Index
Net Exports as % of Production
Net Trade Balance
• September 2018 voluntary quits as a percentage of
employment of 2.6% decreased from 2.9% M/M due to
continued strong employment demand.
• October 2018 weekly average earnings are growing 1.2%
Y/Y on a nominal basis. When deflated by food and
beverage CPI the July 2018 average wage of $751/week
increased 3.9% Y/Y driven primarily by continued labor
shortages.
• August 2018 miles driven of 287 billion were up 1.2% Y/Y
as stronger employment offset higher gas prices.
• The October 2018 trade weighted dollar index value of 116.03
vs. bulk commodity dollar index value of 115.37 widenedsightly when compared to the September 2018 values of
115.43 and 115.65, respectively.
• The net trade balance for YTD September 2018 of ($13.6)
billion widened by approximately $1.3 billion compared to the
($12.3) billion trade balance for last month.
Voluntary Quits as % of Employment
Weekly Earnings Rates
1.0%
1.5%
2.0%
2.5%
3.0%
3.5%
Sources: BLS, Wells Fargo
$650
$700
$750
$800
$850
$900
$950
$1,000Weekly Wages Food Inflation Adjusted
Sources: BLS, Wells Fargo
200
210
220
230
240
250
260
270
280
290
Source: Federal Highway Administration
95
100
105
110
115
120
Ag Bulk Commodities Trade Weighted
Jan 2014=100
Sources: USDA, Federal Reserve, Wells Fargo
2.6 6.5 9.1
13.8 16.1 22.0 22.7 21.6
16.3 18.3 17.5
5.4
(6.1)
10.3 3.9
5.2 7.1
0.7
(1.1)(4.5)
(17.8)(21.6)
(26.0)
(18.9)
-$28
-$21
-$14
-$7
$0
$7
$14
$21
$28
2007 2008 2009 2010 2011 2012 2013 2014 2015 2016 2017 Jan-
Sep
2018
China & Hong Kong Rest of World
Sources: USDA, Wells Fargo
-6%
-3%
0%
3%
6%
9%
12%
15%
18%
21%
2010 2011 2012 2013 2014 2015 2016 2017 2018F
Pork Chicken Beef
Sources: USDA, Wells Fargo

August 2012
5
© 2018 Wells Fargo Bank, N.A. All rights reserved. For public use.
• Nearby corn futures averaged $3.68
per bushel in October, up 17 cents
from September and up 19 cents Y/Y.
• Prices were supported by the USMCA
agreement and USDA’s smaller-than
expected U.S. production and ending
stocks forecasts released October 11.
• USDA’s world corn production and
stocks estimates were raised sharply
in November on adoption of higher
China production estimates back to
2007. For 2018/19, USDA now
forecasts world corn production up 2%
from 2017/18 and world stocks down
10% to the lowest level in four years.
• Nearby Kansas City wheat futures
averaged $5.14 per bushel in October.
This was up 7 cents from September
and up 82 cents from a year earlier.
• Support came from slow planting of
winter wheat amid wet conditions, but
gains were limited by a stronger U.S.
dollar and limited improvement in
export sales. The market received
some positive news late in the month
as Egypt bought a cargo U.S. wheat
for the first time in about 18 months.
• USDA projects global wheat production
down 4% in 2018/19 on large declines
in Russia, the EU and Australia. Global
stocks are forecast to fall 4% after
rising five straight years to a record.
Wheat
Grain Prices: Corn and wheat prices are above the past two years with U.S. and world stocks forecast
to decline in 2018/19. Soybean prices remain low with U.S. stocks/use projected the highest in 33 years.
Corn
Soybeans
• Nearby soybean futures averaged
$8.60 in October, which was up 25
cents from September but down $1.17
from October 2017.
• Support came from wet weather in the
Midwest, which slowed harvest and
brought concern about yields. Gains
were limited by export sales and
shipments that remind well below
recent years due to China’s high tariff.
• USDA projects world soybean
production up 9% in 2018/19 on this
year’s larger U.S. crop and an
assumed rebound in Argentina’s crop
in 2019. World stocks are projected to
jump 12% to a record level.
$3.20
$3.40
$3.60
$3.80
$4.00
$4.20
Jan Feb Mar Apr May Jun Jul Aug Sep Oct Nov Dec
2016 2017 2018 Futures
Source: CME
$/B
ushel
$3.90
$4.20
$4.50
$4.80
$5.10
$5.40
$5.70
Jan Feb Mar Apr May Jun Jul Aug Sep Oct Nov Dec
2016 2017 2018 Futures
Source: CME
$/B
ushel
$8.00
$8.50
$9.00
$9.50
$10.00
$10.50
$11.00
$11.50
$12.00
Jan Feb Mar Apr May Jun Jul Aug Sep Oct Nov Dec
2016 2017 2018 Futures
Source: CME
$/B
ushel

August 2012
6
© 2018 Wells Fargo Bank, N.A. All rights reserved. For public use.
Grain Fundamentals: U.S. corn and wheat stocks are forecast to moderate in 2018/19 from large levels
in 2017/18. U.S. soybean stocks are forecast to increase sharply on a large crop and small exports to China.
• USDA cut its U.S. corn crop estimate
152 million bushels in November on a
reduction in yield to 178.9 bushels,
which still would be a record.
• Projected ending stocks were lowered
77 million bushels with the smaller crop
partly offset by usage cuts. Feed and
residual usage was lowered 50 million
bushels due to the smaller crop and a
higher price outlook, while exports were
lowered 25 million on larger Ukrainian
production and exports. The implied
stocks-to-use ratio of 11.5% would be
below the past four years.
• USDA’s long-term projections released
in early November included 2019 corn
planted acres of 92 million, up 3% Y/Y.
Wheat
Corn
Soybeans
• USDA raised its forecast of 2018/19
seed usage of U.S. wheat by 7 million
bushels in November. This trimmed its
ending stocks projection to 949 million
bushels.
• USDA’s export forecast of 1,025 million
bushels could be too high if export sales
do not significantly improve soon.
• USDA’s long-term projections included
2019/20 wheat plantings of 51.0 million
acres, which would be up 7% Y/Y.
However, wet conditions this fall have
hindered winter wheat planting progress
and could limit the increase in acreage.
• USDA cut its U.S. soybean yield estimate
1.0 bushel per acre to 52.1 bushels,
which reduced its production estimate by
90 million bushels.
• The smaller crop and a 10-million-bushel
increase in crush were more than offset
by cuts in the other usage categories.
Exports were slashed 160 million bushels
as business to China remains minimal
due to the high tariff. USDA’s carryout
forecast increased 70 million bushels to
955 million, reflecting the largest stocks-
to-use ratio in 33 years.
• USDA’s long-term projections included
2019 soybean plantings of 82.5 million
acres, which would be down 7% Y/Y.
Source: USDA WASDE
Source: USDA WASDE
Source: USDA WASDE
2016/17 2017/18 2018/19F 2018/19F M/M Change Y/Y Change
October November 18/19 Forecast 18/19 Forecast
Acres Planted (mm) 94.0 90.2 89.1 89.1 0.0 -1.1
Acres Harvested 86.7 82.7 81.8 81.8 0.0 -0.9
Yield per Harvested Acre (bu) 174.6 176.6 180.7 178.9 -1.8 2.3
Beginning Stocks (mm bu) 1,737 2,293 2,140 2,140 0 -153
Production 15,148 14,604 14,778 14,626 -152 22
Imports 57 36 50 50 0 14
Total Supply 16,942 16,934 16,968 16,816 -152 -118
Feed and Residual 5,470 5,302 5,550 5,500 -50 198
Food, Seed & Industrial 6,885 7,054 7,130 7,130 0 76
Ethanol 5,432 5,601 5,650 5,650 0 49
Total Domestic 12,355 12,355 12,680 12,630 -50 275
Exports 2,294 2,438 2,475 2,450 -25 12
Total Use 14,649 14,793 15,155 15,080 -75 287
Ending Stocks 2,293 2,140 1,813 1,736 -77 -404
Stocks to Use (%) 15.7% 14.5% 12.0% 11.5% -0.5% -3.0%
Average Farm Price ($/bu) $3.36 $3.36 $3.50 $3.60 $0.10 $0.24
2016/17 2017/18 2018/19F 2018/19F M/M Change Y/Y Change
October November 18/19 Forecast 18/19 Forecast
Acres Planted (mm) 50.1 46.0 47.8 47.8 0.0 1.8
Acres Harvested 43.9 37.5 39.6 39.6 0.0 2.1
Yield per Harvested Acre (bu) 52.7 46.3 47.6 47.6 0.0 1.3
Beginning Stocks (mm bu) 976 1,181 1,099 1,099 0 -82
Production 2,309 1,740 1,884 1,884 0 144
Imports 118 157 140 140 0 -17
Total Supply 3,402 3,078 3,123 3,123 0 45
Food 949 964 970 970 0 6
Seed 61 63 62 69 7 6
Feed and Residual 161 50 110 110 0 60
Total Domestic 1,171 1,078 1,142 1,149 7 71
Exports 1,051 901 1,025 1,025 0 124
Total Use 2,222 1,979 2,167 2,174 7 195
Ending Stocks 1,181 1,099 956 949 -7 -150
Stocks to Use (%) 53.2% 55.5% 44.1% 43.7% -0.5% -11.9%
Average Farm Price ($/bu) $3.89 $4.72 $5.10 $5.10 $0.00 $0.38
2016/17 2017/18 2018/19F 2018/19F M/M Change Y/Y Change
October November 18/19 Forecast 18/19 Forecast
Acres Planted (mm) 83.4 90.1 89.1 89.1 0.0 -1.0
Acres Harvested 82.7 89.5 88.3 88.3 0.0 -1.2
Yield per Harvested Acre (bu) 52.0 49.3 53.1 52.1 -1.0 2.8
Beginning Stocks (mm bu) 197 302 438 438 0 136
Production 4,296 4,411 4,690 4,600 -90 189
Imports 22 22 25 25 0 3
Total Supply 4,515 4,734 5,153 5,063 -90 329
Crushings 1,899 2,055 2,070 2,080 10 25
Exports 2,174 2,129 2,060 1,900 -160 -229
Seed 105 104 103 96 -7 -8
Residual 35 8 34 32 -2 24
Total Use 4,213 4,296 4,268 4,107 -161 -189
Ending Stocks 302 438 885 955 70 517
Stocks to Use (%) 7.2% 10.2% 20.7% 23.3% 2.5% 13.1%
Average Farm Price ($/bu) $9.47 $9.33 $8.60 $8.60 $0.00 -$0.73
August 2012
7
© 2018 Wells Fargo Bank, N.A. All rights reserved. For public use.
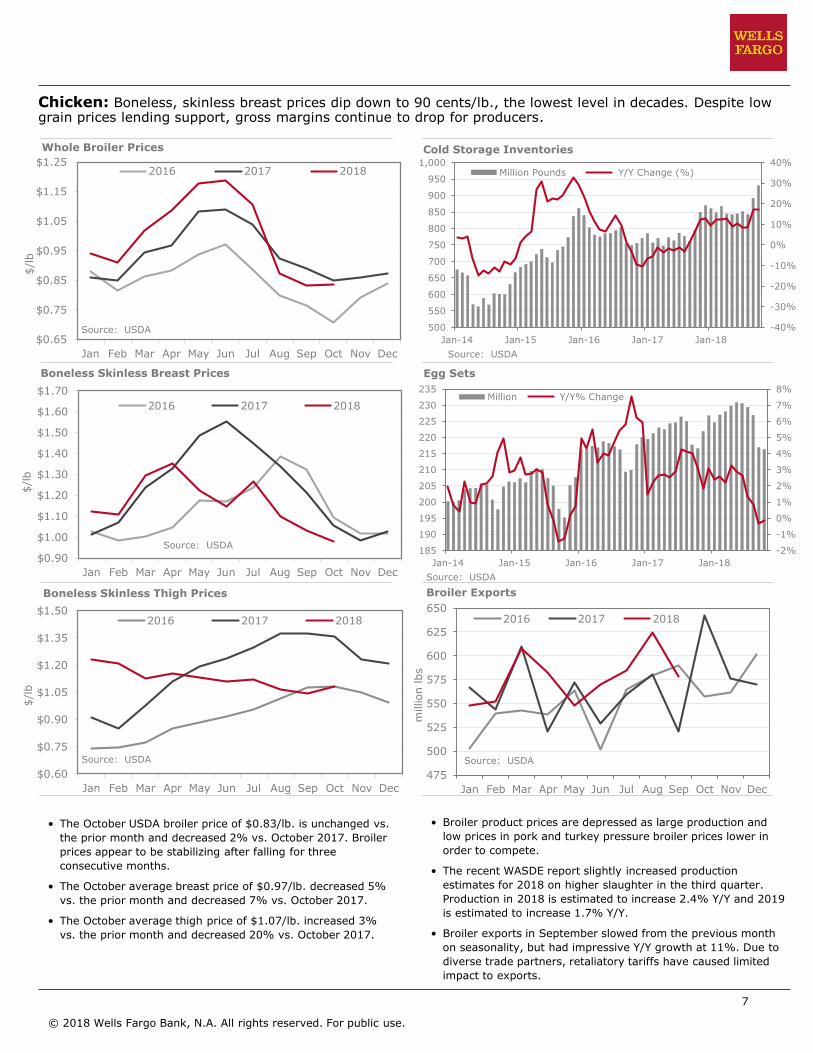
Chicken: Boneless, skinless breast prices dip down to 90 cents/lb., the lowest level in decades. Despite low grain prices lending support, gross margins continue to drop for producers.
Whole Broiler Prices Cold Storage Inventories
Broiler Exports
Egg Sets
• The October USDA broiler price of $0.83/lb. is unchanged vs.
the prior month and decreased 2% vs. October 2017. Broiler
prices appear to be stabilizing after falling for three
consecutive months.
• The October average breast price of $0.97/lb. decreased 5%
vs. the prior month and decreased 7% vs. October 2017.
• The October average thigh price of $1.07/lb. increased 3%
vs. the prior month and decreased 20% vs. October 2017.
• Broiler product prices are depressed as large production and
low prices in pork and turkey pressure broiler prices lower in
order to compete.
• The recent WASDE report slightly increased production
estimates for 2018 on higher slaughter in the third quarter.
Production in 2018 is estimated to increase 2.4% Y/Y and 2019
is estimated to increase 1.7% Y/Y.
• Broiler exports in September slowed from the previous month
on seasonality, but had impressive Y/Y growth at 11%. Due to
diverse trade partners, retaliatory tariffs have caused limited
impact to exports.
Boneless Skinless Breast Prices
Boneless Skinless Thigh Prices
$0.65
$0.75
$0.85
$0.95
$1.05
$1.15
$1.25
Jan Feb Mar Apr May Jun Jul Aug Sep Oct Nov Dec
$/l
b
2016 2017 2018
Source: USDA
$0.90
$1.00
$1.10
$1.20
$1.30
$1.40
$1.50
$1.60
$1.70
Jan Feb Mar Apr May Jun Jul Aug Sep Oct Nov Dec
$/l
b
2016 2017 2018
Source: USDA
$0.60
$0.75
$0.90
$1.05
$1.20
$1.35
$1.50
Jan Feb Mar Apr May Jun Jul Aug Sep Oct Nov Dec
$/l
b
2016 2017 2018
Source: USDA
-40%
-30%
-20%
-10%
0%
10%
20%
30%
40%
500
550
600
650
700
750
800
850
900
950
1,000
Jan-14 Jan-15 Jan-16 Jan-17 Jan-18
Million Pounds Y/Y Change (%)
Source: USDA
-2%
-1%
0%
1%
2%
3%
4%
5%
6%
7%
8%
185
190
195
200
205
210
215
220
225
230
235
Jan-14 Jan-15 Jan-16 Jan-17 Jan-18
Million Y/Y% Change
Source: USDA
475
500
525
550
575
600
625
650
Jan Feb Mar Apr May Jun Jul Aug Sep Oct Nov Dec
million lbs
2016 2017 2018
Source: USDA
August 2012
8
© 2018 Wells Fargo Bank, N.A. All rights reserved. For public use.
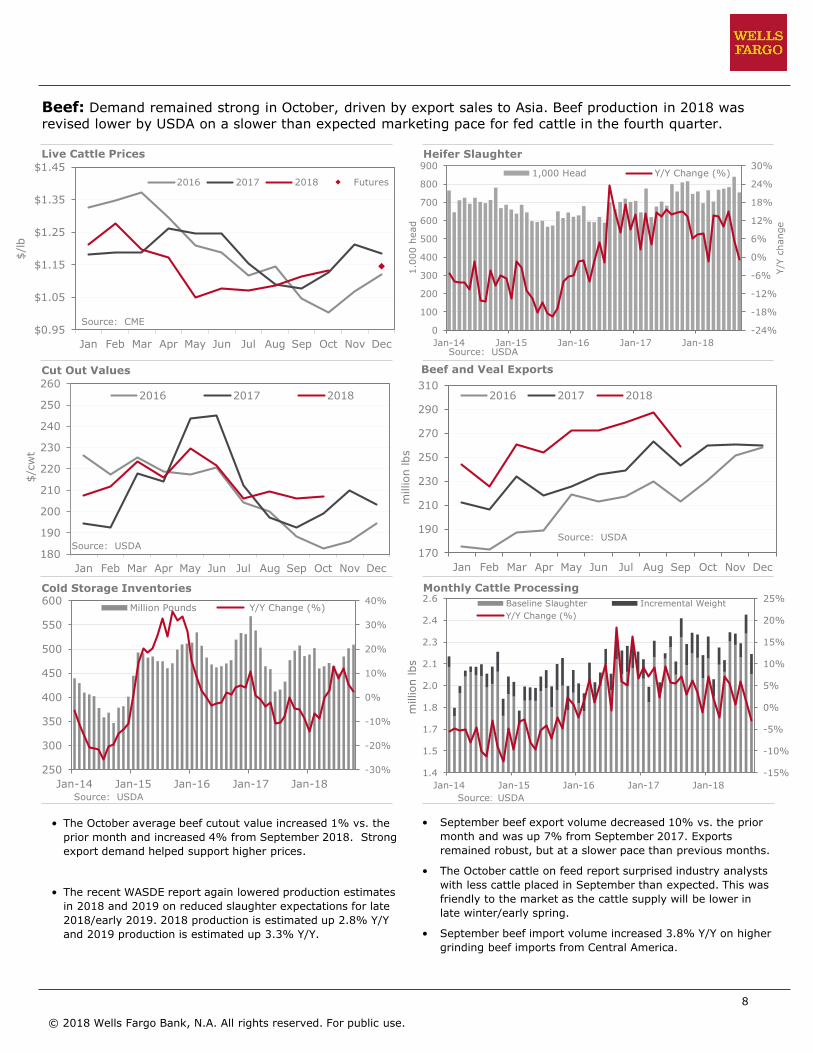
Beef: Demand remained strong in October, driven by export sales to Asia. Beef production in 2018 was
revised lower by USDA on a slower than expected marketing pace for fed cattle in the fourth quarter.
Cut Out Values
Cold Storage Inventories
Live Cattle Prices
Monthly Cattle Processing
Beef and Veal Exports
Heifer Slaughter
• The October average beef cutout value increased 1% vs. the
prior month and increased 4% from September 2018. Strong
export demand helped support higher prices.
• The recent WASDE report again lowered production estimates
in 2018 and 2019 on reduced slaughter expectations for late
2018/early 2019. 2018 production is estimated up 2.8% Y/Y
and 2019 production is estimated up 3.3% Y/Y.
• September beef export volume decreased 10% vs. the prior
month and was up 7% from September 2017. Exports
remained robust, but at a slower pace than previous months.
• The October cattle on feed report surprised industry analysts
with less cattle placed in September than expected. This was
friendly to the market as the cattle supply will be lower in
late winter/early spring.
• September beef import volume increased 3.8% Y/Y on higher
grinding beef imports from Central America.
$0.95
$1.05
$1.15
$1.25
$1.35
$1.45
Jan Feb Mar Apr May Jun Jul Aug Sep Oct Nov Dec
$/l
b
2016 2017 2018 Futures
Source: CME
180
190
200
210
220
230
240
250
260
Jan Feb Mar Apr May Jun Jul Aug Sep Oct Nov Dec
$/c
wt
2016 2017 2018
Source: USDA
-30%
-20%
-10%
0%
10%
20%
30%
40%
250
300
350
400
450
500
550
600
Jan-14 Jan-15 Jan-16 Jan-17 Jan-18
Million Pounds Y/Y Change (%)
Source: USDA
-24%
-18%
-12%
-6%
0%
6%
12%
18%
24%
30%
0
100
200
300
400
500
600
700
800
900
Jan-14 Jan-15 Jan-16 Jan-17 Jan-18
Y/Y
change
1.0
00 h
ead
1,000 Head Y/Y Change (%)
Source: USDA
170
190
210
230
250
270
290
310
Jan Feb Mar Apr May Jun Jul Aug Sep Oct Nov Dec
million lbs
2016 2017 2018
Source: USDA
-15%
-10%
-5%
0%
5%
10%
15%
20%
25%
1.4
1.5
1.7
1.8
2.0
2.1
2.3
2.4
2.6
Jan-14 Jan-15 Jan-16 Jan-17 Jan-18
million lbs
Baseline Slaughter Incremental Weight
Y/Y Change (%)
Source: USDA

August 2012
9
© 2018 Wells Fargo Bank, N.A. All rights reserved. For public use.
Pork: African Swine Fever continues to spread in China, creating uncertainty for global supplies into Q1. Lower prices helped keep September exports above last year’s levels. Seasonally higher hog supplies are expected to pressure prices in the next couple of months.
Cut Out Values
Cold Storage Inventories
Lean Hog Prices
Pork Exports
Monthly Processing
Sow Slaughter
• Nearby lean hog futures averaged $0.61/lb. in October.This increased 7% from September, and decreased 1% Y/Y.
• The average cut-out value increased 6% in October, and wasup 5% Y/Y. Supply disruptions from Hurricane Michael gavesupport to cut-out prices.
• The recent WASDE report lowered production estimates in2018 and 2019 on reduced slaughter expectations and lowercarcass weights. 2018 production is estimated at 2.9% Y/Yand 2019 production is estimated at 5.3% Y/Y.
• Pork exports in September were 3% higher Y/Y, but haveslowed from their robust pace in the first half of the year.Although volume was higher, the dollar value was 3.5%lower Y/Y, indicating that cheaper product was needed toattracted buyers.
• Hog slaughter traditionally hits its seasonal highs in Q4.Record hog production in 2018 is challenging packerslaughter capacity.
$0.40
$0.50
$0.60
$0.70
$0.80
$0.90
$1.00
Jan Feb Mar Apr May Jun Jul Aug Sep Oct Nov Dec
$/l
b
2016 2017 2018 Futures
Source: CME
60
70
80
90
100
110
Jan Feb Mar Apr May Jun Jul Aug Sep Oct Nov Dec
$/c
wt
2016 2017 2018
Source: USDA
-20%
-15%
-10%
-5%
0%
5%
10%
15%
20%
25%
300
350
400
450
500
550
600
650
700
750
Jan-14 Jan-15 Jan-16 Jan-17 Jan-18
Million Pounds Y/Y Change (%)
Source: USDA
-12%
-8%
-4%
0%
4%
8%
12%
0
2
4
6
8
10
12
Jan-14 Jan-15 Jan-16 Jan-17 Jan-18
Y/Y
change
million h
ead
Million Head Y/Y Change
Source: USDA
360
390
420
450
480
510
540
570
Jan Feb Mar Apr May Jun Jul Aug Sep Oct Nov Dec
million lbs
2016 2017 2018
Source: USDA
-15%
-10%
-5%
0%
5%
10%
15%
20%
25%
1.6
1.7
1.8
1.9
2.0
2.1
2.2
2.3
2.4
Jan-14 Jan-15 Jan-16 Jan-17 Jan-18
million lbs
Baseline Slaughter Incremental Weight
Y/Y Change (%)
Source: USDA
August 2012
10
© 2018 Wells Fargo Bank, N.A. All rights reserved. For public use.
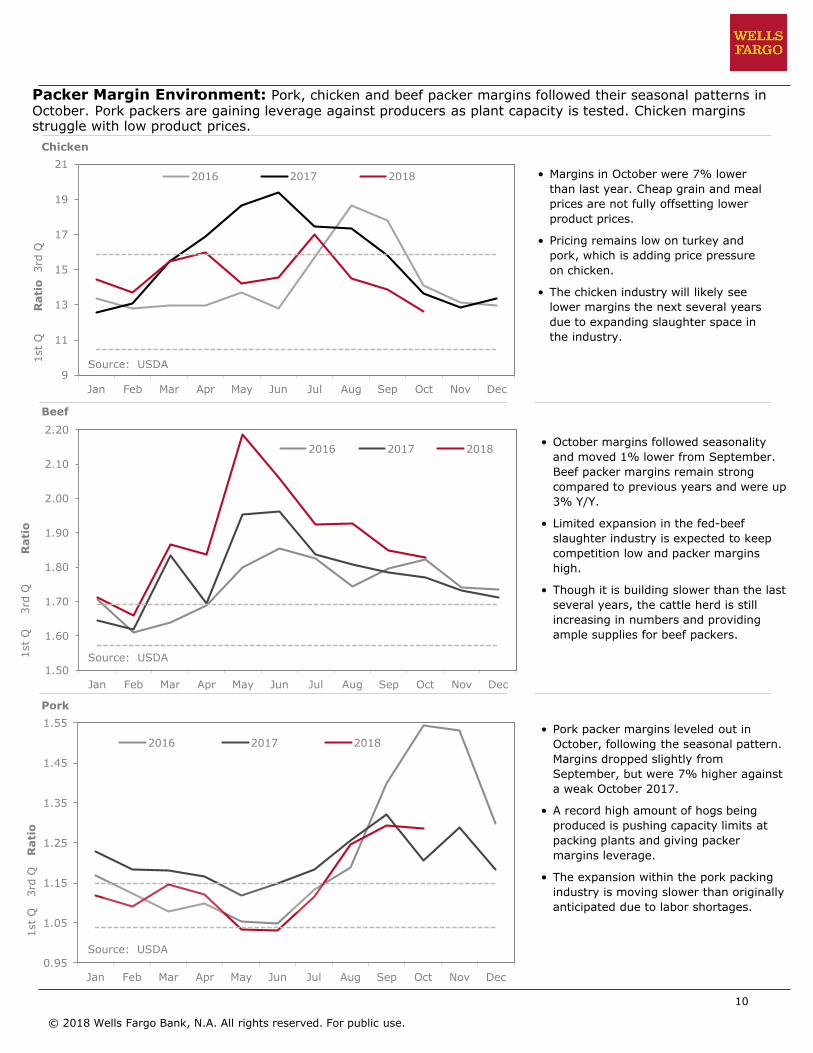
Packer Margin Environment: Pork, chicken and beef packer margins followed their seasonal patterns in October. Pork packers are gaining leverage against producers as plant capacity is tested. Chicken margins struggle with low product prices.
Beef
Chicken
Pork
• October margins followed seasonality
and moved 1% lower from September.
Beef packer margins remain strong
compared to previous years and were up3% Y/Y.
• Limited expansion in the fed-beef
slaughter industry is expected to keep
competition low and packer margins
high.
• Though it is building slower than the last
several years, the cattle herd is still
increasing in numbers and providing
ample supplies for beef packers.
• Pork packer margins leveled out in
October, following the seasonal pattern.
Margins dropped slightly from
September, but were 7% higher against
a weak October 2017.
• A record high amount of hogs being
produced is pushing capacity limits at
packing plants and giving packer
margins leverage.
• The expansion within the pork packing
industry is moving slower than originally
anticipated due to labor shortages.
• Margins in October were 7% lower
than last year. Cheap grain and meal
prices are not fully offsetting lower
product prices.
• Pricing remains low on turkey and
pork, which is adding price pressure
on chicken.
• The chicken industry will likely see
lower margins the next several years
due to expanding slaughter space in
the industry.
9
11
13
15
17
19
21
Jan Feb Mar Apr May Jun Jul Aug Sep Oct Nov Dec
1st
Q
Rati
o3rd
Q
2016 2017 2018
Source: USDA
1.50
1.60
1.70
1.80
1.90
2.00
2.10
2.20
Jan Feb Mar Apr May Jun Jul Aug Sep Oct Nov Dec
1st
Q
3rd
Q
Rati
o
2016 2017 2018
Source: USDA
0.95
1.05
1.15
1.25
1.35
1.45
1.55
Jan Feb Mar Apr May Jun Jul Aug Sep Oct Nov Dec
1st
Q 3
rd Q
R
ati
o
2016 2017 2018
Source: USDA

August 2012
11
© 2018 Wells Fargo Bank, N.A. All rights reserved. For public use.
Seafood: Prices continue to advance for both cod and pollock on forecasted lower quotas in 2019. The
expected lower quota is overshadowing concerns about the U.S. 10% import tariff on product brought back into the U.S. after Chinese processing.
• The UB farm-raised white shrimp index in October was$4.00/lb., down 14% Y/Y. YTD ’18 shrimp imports are1,083MM lbs., up 4% Y/Y. Low prices continue to generateincreased demand for shrimp imports.
• The UB fresh-farmed salmon index was slightly higher inOctober at $5.66/lb., which is up 6% Y/Y. YTD Atlantic salmonimports through September totaled 537MM lbs., up 10% Y/Y.
• Pollock prices are expected to continue rising due to a 2.7%projected decline in global pollock supply in 2019. Alaskanpollock quota is expected to be cut by 6%. Russia will also seea decline in quota, but not until 2020.
Urner Barry Fresh Farmed Salmon Index
Urner Barry Farm-Raised White Shrimp Index Shrimp Import Volume
Alaskan Pollock Prices
Atlantic Salmon Import Volume
• Cod prices remained flat in October, but are 14% higher Y/Y.
The cod quota for 2019 was cut by 5%. The lower quota is
expected to support prices into early 2019.
• Live lobster prices averaged $8.66/lb. in October. This is up
slightly from September, and up 12% Y/Y. Lobster prices are
stable despite the Chinese tariff.
• Scallop prices jumped higher to $11.22/lb. in October, up 7%
from September and 7% higher Y/Y.
Scallop and Lobster Prices
3.80
3.95
4.10
4.25
4.40
4.55
4.70
4.85
5.00
Jan Feb Mar Apr May Jun Jul Aug Sep Oct Nov Dec
$/l
b
2016 2017 2018
Source: Urner Barry
4.00
4.50
5.00
5.50
6.00
6.50
7.00
Jan Feb Mar Apr May Jun Jul Aug Sep Oct Nov Dec
$/l
b
2016 2017 2018
Source: Urner Barry
0.60
0.75
0.90
1.05
1.20
1.35
1.50
1.65
Jan-16 Jul-16 Jan-17 Jul-17 Jan-18 Jul-18
$/l
b
Single Freeze Alaskan Minced
Source: Urner Barry
35
40
45
50
55
60
65
70
Jan Feb Mar Apr May Jun Jul Aug Sep Oct Nov Dec
million k
g
2016 2017 2018
Source: NOAA
20
21
22
23
24
25
26
27
28
29
30
Jan Feb Mar Apr May Jun Jul Aug Sep Oct Nov Dec
million k
g
2016 2017 2018
Source: NOAA
5
6
7
8
9
10
11
12
13
14
15
16
Jan-16 Jul-16 Jan-17 Jul-17 Jan-18 Jul-18
$
Scallops (US Natural, 10/20 ct)
Live Lobster (1 1/4 lb)
Source: Urner Barry

August 2012
12
© 2018 Wells Fargo Bank, N.A. All rights reserved. For public use.
Dairy: Cheese prices moved lower in October due to higher production. Dairy cow numbers are shrinking,but stronger milk per cow growth is offsetting any potential production declines.
Class I Milk
Cheddar Cheese, 40-lb. block
Milk Production
Dairy Product Exports
• The October USDA Class I milk price of $16.33/cwt increased
10% vs. the prior month and decreased 1% vs. October
2017. The October average Class III milk price of
$15.53/cwt. decreased 3% vs. the prior month and
decreased 7% vs. October 2017.
• The recent WASDE report slightly lowered production
estimates based on lower cow herd numbers. Stronger
growth in milk per cow is expected to partially offset lower
herd numbers. 2018 production is estimated up 1.1% Y/Y
and 2019 production is estimated up 1.4% Y/Y.
• U.S. milk production in September was up 1.3% Y/Y on stronger
milk per cow growth. The milk cow herd size was down slightly
vs. the prior year.
• Cheese production in September increased 3.1% Y/Y, a record
for the month. Butter production decreased slightly at 0.1%
Y/Y.
• The October USDA average cheddar cheese price of $1.59/lb.
decreased 3% vs. the prior month and decreased 8% Y/Y
• October average USDA Grade AA butter prices of $2.26/lb.
increased slightly at 0.2% vs. the prior month and decreased
3% vs. October 2017.
Class III Milk
Butter Prices, Grade AA
13
14
15
16
17
18
Jan Feb Mar Apr May Jun Jul Aug Sep Oct Nov Dec
$/c
wt
2016 2017 2018
Source: USDA
12
13
14
15
16
17
18
Jan Feb Mar Apr May Jun Jul Aug Sep Oct Nov Dec
2016 2017 2018 Futures
Sources: USDA, CME
$/c
wt
1.3
1.4
1.5
1.6
1.7
1.8
1.9
Jan Feb Mar Apr May Jun Jul Aug Sep Oct Nov Dec
$/l
b
2016 2017 2018
Source: USDA
-2%
-1%
0%
1%
2%
3%
4%
5%
13
14
15
16
17
18
19
20
Jan-14 Jan-15 Jan-16 Jan-17 Jan-18
billion lbs
Million Pounds Y/Y Change (%)
Source: USDA
1.6
1.8
2.0
2.2
2.4
2.6
2.8
Jan Feb Mar Apr May Jun Jul Aug Sep Oct Nov Dec
$/l
b
2016 2017 2018
Source: USDA
300
350
400
450
500
550
Jan Feb Mar Apr May Jun Jul Aug Sep Oct Nov Dec
million lbs
2016 2017 2018
Source: USDA
August 2012
13
© 2018 Wells Fargo Bank, N.A. All rights reserved. For public use.
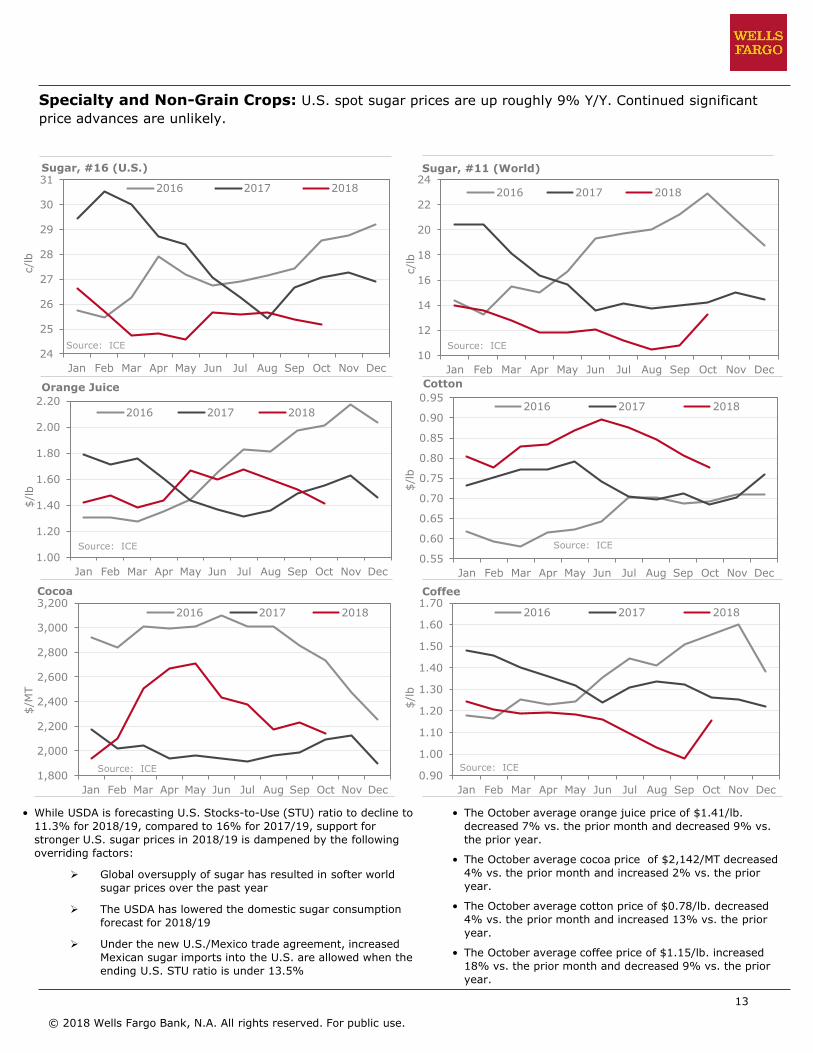
Specialty and Non-Grain Crops: U.S. spot sugar prices are up roughly 9% Y/Y. Continued significant
price advances are unlikely.
Sugar, #16 (U.S.)
Cocoa
Sugar, #11 (World)
CottonOrange Juice
Coffee
• While USDA is forecasting U.S. Stocks-to-Use (STU) ratio to decline to11.3% for 2018/19, compared to 16% for 2017/19, support for
stronger U.S. sugar prices in 2018/19 is dampened by the following
overriding factors:
Global oversupply of sugar has resulted in softer world
sugar prices over the past year
The USDA has lowered the domestic sugar consumption
forecast for 2018/19
Under the new U.S./Mexico trade agreement, increased
Mexican sugar imports into the U.S. are allowed when the
ending U.S. STU ratio is under 13.5%
• The October average orange juice price of $1.41/lb.
decreased 7% vs. the prior month and decreased 9% vs.
the prior year.
• The October average cocoa price of $2,142/MT decreased
4% vs. the prior month and increased 2% vs. the prior
year.
• The October average cotton price of $0.78/lb. decreased
4% vs. the prior month and increased 13% vs. the prior
year.
• The October average coffee price of $1.15/lb. increased
18% vs. the prior month and decreased 9% vs. the prior
year.
24
25
26
27
28
29
30
31
Jan Feb Mar Apr May Jun Jul Aug Sep Oct Nov Dec
c/l
b
2016 2017 2018
Source: ICE
1.00
1.20
1.40
1.60
1.80
2.00
2.20
Jan Feb Mar Apr May Jun Jul Aug Sep Oct Nov Dec
$/l
b
2016 2017 2018
Source: ICE
1,800
2,000
2,200
2,400
2,600
2,800
3,000
3,200
Jan Feb Mar Apr May Jun Jul Aug Sep Oct Nov Dec
$/M
T
2016 2017 2018
Source: ICE
10
12
14
16
18
20
22
24
Jan Feb Mar Apr May Jun Jul Aug Sep Oct Nov Dec
c/l
b
2016 2017 2018
Source: ICE
0.55
0.60
0.65
0.70
0.75
0.80
0.85
0.90
0.95
Jan Feb Mar Apr May Jun Jul Aug Sep Oct Nov Dec
$/l
b2016 2017 2018
Source: ICE
0.90
1.00
1.10
1.20
1.30
1.40
1.50
1.60
1.70
Jan Feb Mar Apr May Jun Jul Aug Sep Oct Nov Dec
$/l
b
2016 2017 2018
Source: ICE

August 2012
14
© 2018 Wells Fargo Bank, N.A. All rights reserved. For public use.
0
1
2
3
4
5
2008 2009 2010 2011 2012 2013 2014 2015 2016 2017
million t
ons
Grape Crush Trends, 2008 - 2017
Raisin Table Red White
Specialty and Non-Grain Crops: Tree Nut and Wine Grape Harvest are wrapping up. Nut harvest has produced large crops of excellent quality, but smaller nut sizing is being noted. West Coast wine grape areas report a large crop of good quality.Almonds
Walnuts Hazelnuts
• Almond, pistachio, and walnut harvest are wrapping up across
California with large crops being reported. Quality is very good,
although smaller than normal nut size is being reported.
• Almond pollinators were coming in heavier than the non-pareil
varietal. Early season indications are that crop will not meet
USDA 2.45B lb. projection. Prices stable at $2.00 to $2.50/lb.
depending on variety and size.
• Walnut harvest is wrapping up, and it is being reported that
yields may not reach the 680M lb. USDA projection. Walnut
prices continue to be reported in the $.90 to $.91 per pound for
new crop Jumbo Chandlers.
• Pistachio harvest is expected to come in heavy, around
900MM to 975MM pounds. Prices are holding firm within the
$2.50 to$3.00 range.
• Hurricane Michael has effected the Georgia Pecan crop.
Damage has been reported from trees blowing over and to
harvested nuts on the ground due to water damage. Damage
estimates are not yet available.
Pistachios
2017 Grape Crush Results
• Vintners reported abundant yields in line with the UnitedStates Department of Agriculture’s August forecast of 4.1 MMtons.
• Vintners are enthusiastic about both the quality and quantityof the 2018.
• Industry potentially feeling an oversupply issue as bulk wineprices are low to clear tanks for new harvest.
• Pricing in the spot market is trending down on most varietalsand locations.
Source: Gomberg Fredrikson and Wine Institute
0
60
120
180
240
300
360
420
480
0
150
300
450
600
750
900
1,050
1,200
80/81 85/86 90/91 95/96 00/01 05/06 10/11 15/16
c/l
b
1,0
00 a
cre
s
Bearing Acres Price
Source: USDA
0
70
140
210
280
350
420
490
0
50
100
150
200
250
300
350
80/81 85/86 90/91 95/96 00/01 05/06 10/11 15/16
c/l
b
1,0
00 a
cre
s
Bearing Acres Price
Source: USDA
0
100
200
300
400
500
600
700
800
0
40
80
120
160
200
240
280
320
80/81 85/86 90/91 95/96 00/01 05/06 10/11 15/16
c/l
b
1,0
00 a
cre
s
Bearing Acres Price
Source: USDA
0
70
140
210
280
350
420
490
560
0
5
10
15
20
25
30
35
40
80/81 85/86 90/91 95/96 00/01 05/06 10/11 15/16
c/l
b
1,0
00 a
cre
s
Bearing Acres Price
Source: USDA

August 2012
15
© 2018 Wells Fargo Bank, N.A. All rights reserved. For public use.
Framing Lumber Index U.S. Housing Starts
Repair & Remodel Expenditures (LTM total)
• The Framing Lumber Composite Index dropped another
15% in October to $367/thousand sq. ft. This was down
16% Y/Y and the lowest since January 2017 as demand has
not been strong enough to sustain prices at the lofty levels
seen during the first half of 2018. Despite the decline in
recent months, lumber prices are in line with levels seen
during much of 2016.
• The Structural Panel Composite Index fell 11% in October
to $419/thousand sq. ft. amid the drop in lumber prices.
This was down 22% Y/Y and the lowest since June 2017.
• U.S. housing starts of 1.20 million units in September
were up 4% Y/Y. Declines in lumber and structural panel
prices from their high levels during the first half of 2018
appear to have help housing starts rebound.
• LTM repair and remodel expenditures of $331.1 billion
during 3Q’18 were up 2% from the previous quarter and
up 7% Y/Y, reflecting the largest Y/Y increase since 2007.
Structural Panel Index
Forest Products: Lumber and structural panel prices fell sharply in October to the lowest level in over a year. September housing starts were up 4% Y/Y, and repair/remodel spending rose again in 3Q’18.
$280
$320
$360
$400
$440
$480
$520
$560
$600
Jan Feb Mar Apr May Jun Jul Aug Sep Oct Nov Dec
$/1
,000 s
qft
2016 2017 2018
Source: Random Lengths
$320
$360
$400
$440
$480
$520
$560
$600
Jan Feb Mar Apr May Jun Jul Aug Sep Oct Nov Dec
$/1
,000 s
qft
2016 2017 2018
Source: Random Lengths
-20%
-10%
0%
10%
20%
30%
40%
800
900
1,000
1,100
1,200
1,300
1,400
Jan-14 Jan-15 Jan-16 Jan-17 Jan-18
1,0
00 u
nits
New Units Y/Y Change (%)
Source: U.S. Fed
0%
1%
2%
3%
4%
5%
6%
7%
8%
200
220
240
260
280
300
320
340
1Q12 1Q13 1Q14 1Q15 1Q16 1Q17 1Q18
$ b
illion
$ Billion Y/Y Change (%)
Source: Harvard Joint Center for Housing Studies
August 2012
16
© 2018 Wells Fargo Bank, N.A. All rights reserved. For public use.
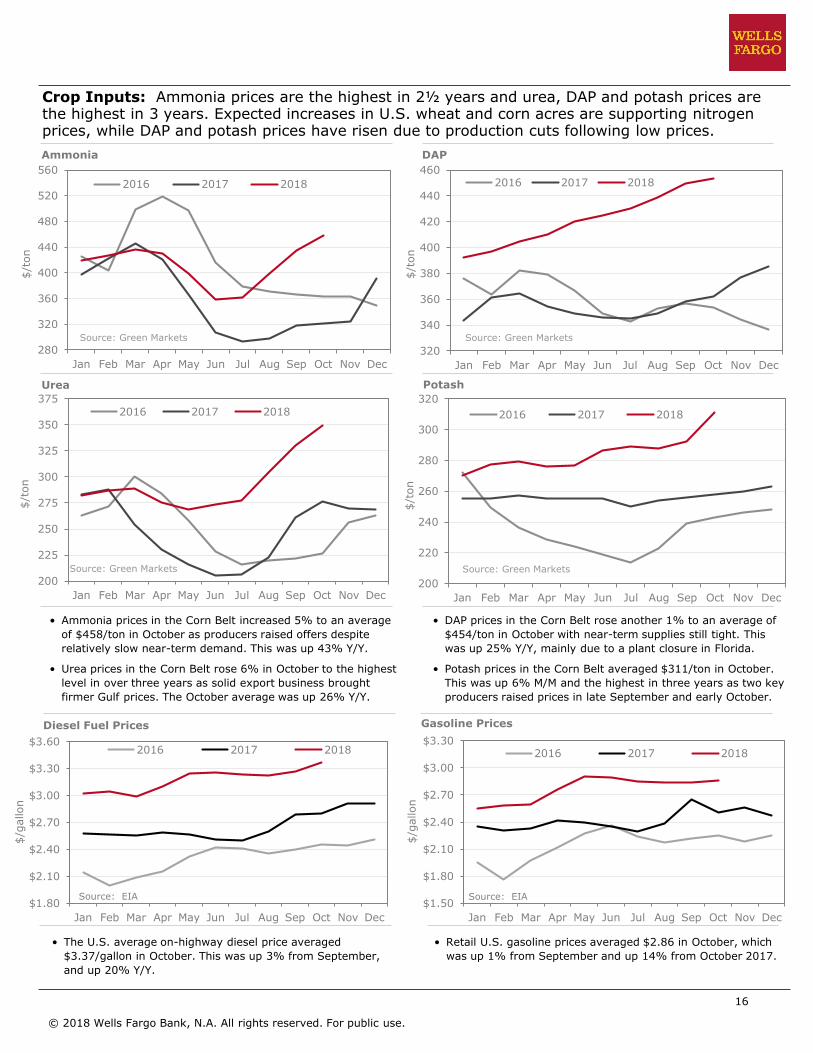
Crop Inputs: Ammonia prices are the highest in 2½ years and urea, DAP and potash prices are the highest in 3 years. Expected increases in U.S. wheat and corn acres are supporting nitrogen prices, while DAP and potash prices have risen due to production cuts following low prices.
Ammonia DAP
Urea Potash
• Ammonia prices in the Corn Belt increased 5% to an average
of $458/ton in October as producers raised offers despite
relatively slow near-term demand. This was up 43% Y/Y.
• Urea prices in the Corn Belt rose 6% in October to the highest
level in over three years as solid export business brought
firmer Gulf prices. The October average was up 26% Y/Y.
• DAP prices in the Corn Belt rose another 1% to an average of
$454/ton in October with near-term supplies still tight. This
was up 25% Y/Y, mainly due to a plant closure in Florida.
• Potash prices in the Corn Belt averaged $311/ton in October.
This was up 6% M/M and the highest in three years as two key
producers raised prices in late September and early October.
Diesel Fuel Prices Gasoline Prices
• The U.S. average on-highway diesel price averaged
$3.37/gallon in October. This was up 3% from September,
and up 20% Y/Y.
• Retail U.S. gasoline prices averaged $2.86 in October, which
was up 1% from September and up 14% from October 2017.
280
320
360
400
440
480
520
560
Jan Feb Mar Apr May Jun Jul Aug Sep Oct Nov Dec
$/t
on
2016 2017 2018
Source: Green Markets
200
225
250
275
300
325
350
375
Jan Feb Mar Apr May Jun Jul Aug Sep Oct Nov Dec
$/t
on
2016 2017 2018
Source: Green Markets
320
340
360
380
400
420
440
460
Jan Feb Mar Apr May Jun Jul Aug Sep Oct Nov Dec
$/t
on
2016 2017 2018
Source: Green Markets
200
220
240
260
280
300
320
Jan Feb Mar Apr May Jun Jul Aug Sep Oct Nov Dec
$/t
on
2016 2017 2018
Source: Green Markets
$1.80
$2.10
$2.40
$2.70
$3.00
$3.30
$3.60
Jan Feb Mar Apr May Jun Jul Aug Sep Oct Nov Dec
$/g
allon
2016 2017 2018
Source: EIA$1.50
$1.80
$2.10
$2.40
$2.70
$3.00
$3.30
Jan Feb Mar Apr May Jun Jul Aug Sep Oct Nov Dec
$/g
allon
2016 2017 2018
Source: EIA
August 2012
17
© 2018 Wells Fargo Bank, N.A. All rights reserved. For public use.
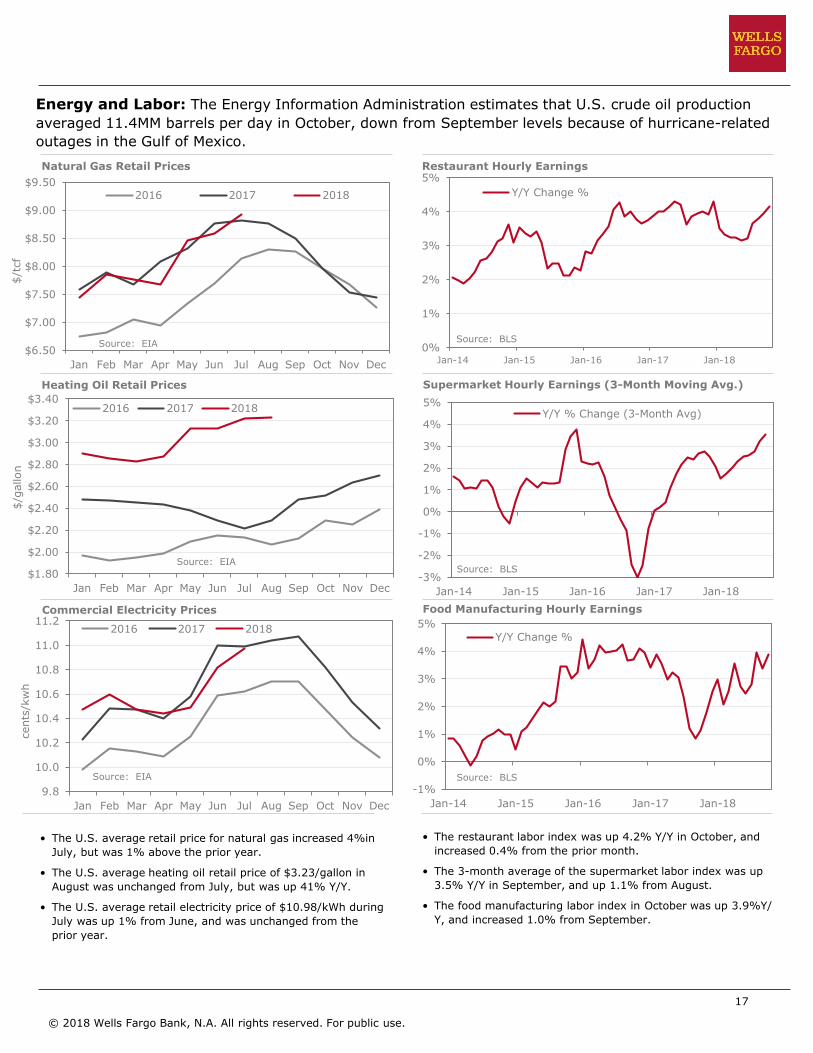
Energy and Labor: The Energy Information Administration estimates that U.S. crude oil production
averaged 11.4MM barrels per day in October, down from September levels because of hurricane-related
outages in the Gulf of Mexico.
Natural Gas Retail Prices Restaurant Hourly Earnings
Heating Oil Retail Prices Supermarket Hourly Earnings (3-Month Moving Avg.)
Commercial Electricity Prices Food Manufacturing Hourly Earnings
• The U.S. average retail price for natural gas increased 4%in
July, but was 1% above the prior year.
• The U.S. average heating oil retail price of $3.23/gallon in
August was unchanged from July, but was up 41% Y/Y.
• The U.S. average retail electricity price of $10.98/kWh during
July was up 1% from June, and was unchanged from the
prior year.
• The restaurant labor index was up 4.2% Y/Y in October, and
increased 0.4% from the prior month.
• The 3-month average of the supermarket labor index was up
3.5% Y/Y in September, and up 1.1% from August.
• The food manufacturing labor index in October was up 3.9%Y/
Y, and increased 1.0% from September.
$6.50
$7.00
$7.50
$8.00
$8.50
$9.00
$9.50
Jan Feb Mar Apr May Jun Jul Aug Sep Oct Nov Dec
$/t
cf
2016 2017 2018
Source: EIA
$1.80
$2.00
$2.20
$2.40
$2.60
$2.80
$3.00
$3.20
$3.40
Jan Feb Mar Apr May Jun Jul Aug Sep Oct Nov Dec
$/g
allon
2016 2017 2018
Source: EIA
9.8
10.0
10.2
10.4
10.6
10.8
11.0
11.2
Jan Feb Mar Apr May Jun Jul Aug Sep Oct Nov Dec
cents
/kw
h
2016 2017 2018
Source: EIA
0%
1%
2%
3%
4%
5%
Jan-14 Jan-15 Jan-16 Jan-17 Jan-18
Y/Y Change %
Source: BLS
-3%
-2%
-1%
0%
1%
2%
3%
4%
5%
Jan-14 Jan-15 Jan-16 Jan-17 Jan-18
Y/Y % Change (3-Month Avg)
Source: BLS
-1%
0%
1%
2%
3%
4%
5%
Jan-14 Jan-15 Jan-16 Jan-17 Jan-18
Y/Y Change %
Source: BLS
August 2012
18
© 2018 Wells Fargo Bank, N.A. All rights reserved. For public use.
Food and Agribusiness Industry Advisors
General disclosuresThe views expressed are intended for Wells Fargo customers only. They present the opinions of the authors on prospective trends and related matters in food and agribusiness as of this date, and do not necessarily reflect the views of Wells Fargo & Co., its affiliates and subsidiaries. Opinions expressed are based on diverse sources that we believe to be reliable, though the information is not guaranteed and is subject to change without notice. This is not an offer to sell or the solicitation to buy or sell any security or foreign exchange product.
Karol Aure-FlynnSpecialty Crops Analyst, Analyst Team [email protected]
Chris EggermanSector Analyst: Grains, Crop Inputs, Forest Products [email protected]
Lakiesha McCainCredit Portfolio Consultant: Systems Administrator [email protected]
Brad RubinSector Analyst: Specialty and Non-Grain Crops [email protected]
Courtney SchmidtSector Analyst: Protein, [email protected]
Michael Swanson, Ph.D.Chief Agricultural Economist [email protected]
Kevin BergquistForest Products Sector [email protected]
Matt DusiSpecialty and Non-Grain Crops Sector Manager [email protected]
Scott EtzelProtein - Seafood and Sugar Sector [email protected]
Tim LuginslandGrains and Oilseeds Sector Manager [email protected]
Lee Ann PearceSpecialty and Non-Grain Crops Sector Manager [email protected]
Lon SwansonCrop Inputs/Feed Sector [email protected]


![[Frozen Food Market Research] Frozen Food Insights - Zpryme Research - July 2011](https://static.fdocuments.in/doc/165x107/5414026b8d7f7294698b47d5/frozen-food-market-research-frozen-food-insights-zpryme-research-july-2011.jpg)
