Food and Agriculture Organization (FAO) of the … · Food and Agriculture Organization (FAO) of...
37
University of Cologne Development Research Center Universität zu Köln Arbeitsstelle für Entwicklungsländerforschung Food and Agriculture Organization (FAO) of the United Nations Agricultural Management, Marketing, and Finance Service (AGSF) A Global Study to Examine Innovative Linkages to Expand Rural Financial Services Supported by the Ford Foundation Linkages between Banks and Microfinance Institutions in Mali: A Case Study By Hans Dieter Seibel General notes: • Are we doing % or percent? • Months should be written in full • We need to standardise the referencing method March 2005
Transcript of Food and Agriculture Organization (FAO) of the … · Food and Agriculture Organization (FAO) of...

University of Cologne Development Research Center
Universität zu Köln Arbeitsstelle für Entwicklungsländerforschung
Food and Agriculture Organization (FAO) of the United Nations Agricultural Management, Marketing, and Finance Service (AGSF)
A Global Study to Examine Innovative Linkages to Expand Rural Financial Services
Supported by the Ford Foundation
Linkages between Banks and Microfinance Institutions in Mali: A Case Study
By
Hans Dieter Seibel
General notes:
• Are we doing % or percent? • Months should be written in full • We need to standardise the referencing method
March 2005

Contents Table of contents List of tables Note on the currency unit and exchange rate
iiiiii
Abbreviations and acronyms iiiExecutive summary
iv
Part I: Overview 1. The country: poor, but stable 12. The financial sector and microfinance 13. Bank linkages: mainly for liquidity balancing, also for portfolio expansion
8
Part II: Case studies 1. BNDA, the linkage partner 1.1 The bank 1.2 Linkages
1011
2. Kafo Jiginew: Bank linkages for liquidity balancing 2.1 The network 2.2 Linkages
1315
3. CVECA-Office du Niger: Bank linkages for financial deepening 3.1 The network 3.2 Linkages
2022
Postscript: Why the striking difference?
25
References
26
List of tables Table 1: Microfinance networks in Mali, Dec. 2003 (amounts in million Euro) .........................5 Table 2: Comparative data on three microfinance subsectors in Mali, Dec. 2003 (in percent) 7 Table 3: Non-performing assets in three microfinance subsectors, Dec. 2002-03 (in percent)7 Table 4: Disbursements and commitments of BNDA by borrower category, 2000-03, in
percent ............................................................................................................................10 Table 5: Credit lines of BNDA to MFIs*, 1997-2003 (in ‘000 Euro) ........................................11 Table 6: Kafo Jiginew, consolidated data (amounts in million Euro) ......................................14 Table 7: Kafo Jiginew: external sources of funds, 31/12/2003 (amounts in million Euro) ......15 Table 8: Kafo Jiginew: Donor credit funds and bank borrowings, 2002-03 (in million Euro) ..16 Table 9: Semi-annual fluctuations in client loans, deposits and liquidity balances, 2001-03 .18 Table 10: Kafo Jiginew, monthly variations in sources of funds, 2003 (in million Euro) .......219 Table 11: CVECA-ON: Basic data (amounts in million Euro).................................................23
Note on the currency unit and exchange rate:
The currency in the UEMOA is the FCFA with a fixed rate of exchange, historically to the French Franc and subsequently the Euro, at 655.96, or ~656. All currency amounts since the devaluation of 1994 are calculated at this rate; amounts before that date are calculated at a rate of 327.98 or ~328. Given the wide fluctuations of the exchange rate of the USD to the Euro, it would be confusing to present currency amounts in USD.
ii

Abbreviations and acronyms ADA Appui au Développement Autonome, Luxemburg AFD Agence Française de Développement APIM Association Professionnelle des Institutions de Microfinance, BCEAO Banque Centrale des Etats de l’Afrique de l’Ouest BIM Banque Internationale pour le Mali, Bamako BMS Banque Malienne de Solidarité, Bamako BNDA Banque Nationale de Développement Agricole, Bamako BOAD Banque Ouest-Africaine de Développement CAREC Centre d’appui au réseau d’épargne et de crédit, Niono CAS/SFD Cellule d’Appui et de Suivi des Systèmes Financiers Décentralisés CECCM CIDA
Consortium Européen de Crédit Coopératif Malien Canadian International Development Agency
CIDR Centre International du Développement et de Recherche CMDT Compagnie Malienne de Développement de Textile CMEC CNCE CVECA
Caisse Mutuelle d’Epargne et de Crédit Caisse Nationale des Caisses d’Épargne, France Caisse villageoise d’épargne et de crédit autogérée
DEG EIB/BEI FAO
Deutsche Entwicklungs- und Investitionsgesellschaft, Cologne European Investment Bank Food and Agriculture Organization of the United Nations, Rome
FCFA FCRMD
Franc de la Communauté Française d'Afrique Fédération des caisses rurales mutualistes du Delta
FDV Fonds de développement villageois FIDA Fonds International de Développement Agricole, Rome (see IFAD) FIDES Finances pour le Développement Economique et Social, MontpellierFODESA Programme Fonds de Développement en Zone Sahélienne du Mali GCNM Groupe Consultatif National pour la Microfinance GECE/ESBG Groupement Européen des Caisses d’Épargne, Brussels GIE Groupement d’intérêt économique GDP GTZ
Gross Domestic Product Deutsche Gesellschaft für Technische Zusammenarbeit, Eschborn
IFC/CIF IFAD
International Finance Company (World Bank Group) International Fund for Agricultural Development, Rome (see FIDA)
KfW KJ MFI O.N.
Kreditanstalt für Wiederaufbau, Frankfurt Kafo Jiginew Microfinance institution Office du Niger
PACCEM Projet d’appui à la commercialisation des céréales Mali PARMEC Programme d’Appui à la Réglementation sur les Mutuelles
d’Epargne et de Crédit PASACOOP/SD Projet d’Appui aux Structures Associatives et Coopératives dans les
cercles de San et Djenné ROSCA SFD
Rotating Savings and Credit Association Système financier décentralisé
UEMOA Union Economique et Monétaire Ouest-Africaine
iii

Linkages between Banks and Microfinance Institutions in Mali: A Case Study Executive summary The country: Mali, with a population of 11.7m, 70 percent rural, is located in the Sahel zone of West Africa. With a per capita income of US$245 and a Human Development Index rank of 174, it is among the poorest countries in the world, highly vulnerable to external impacts. The microfinance sector: Since the mid-1980s microfinance has evolved rapidly. The Parmec law (introducted in 1994) provides full recognition to financial cooperatives and renewable licensing to other types of MFIs. Prudential regulation applies to the whole sector, including an interest rate ceiling (27 percent). Regulation and supervision are entrusted to a unit in the Ministry of Finance, CAS/SFD, with limited capacity. As of 2003, the microfinance sector comprises 41 networks with 752 local entities and a total membership of 614,000, covering close to one-third of all families in Mali. Total assets are €69m, total deposits of clients €36m, and total loans outstanding €49m; the repayment rate is 94 percent. The sector comprises three subsectors: cooperatives with 70 percent of total outreach, so-called village banks (caisses villageoises) with 20 percent, and solidarity credit groups in the Grameen tradition with 10 percent. The subsectors are similar in operational terms, including joint liability. They differ with regard to savings in terms of total resources: 57 percent among the cooperatives, 39 percent among the village banks and 27 percent among the solidarity groups. The sector is highly concentrated: 88 percent of all deposits and 84 percent of all loans outstanding are in the cooperative subsector, and two-thirds of that in just two networks. The linkage banks: Mali has a small banking sector of nine banks, including an agricultural development bank (BNDA). Historically, BNDA has been the main bank providing financial services to MFIs, first as a channelling, later as an executing bank for donor funds (particularly AFD and KfW), and as a lender of its own resources. BNDA has largely abandoned retail lending, which it found too risky, and is now mainly a wholesale and corporate lender. Only 2.9 percent of is loans outstanding are invested in the microfinance sector (2003; down from 5.5 percent in 2000). With such a small share and an interest rate of 8 percent (compared to a corporate rate of 15 percent), its microfinance operations are closer to social than commercial lending. Since 1994, BIM, a commercial bank, has entered the market, concentrating on three major networks. It is prepared to lend more, but faces a shortage of effective demand. The banks have a highly effective system of loan protection with a repayment rate of 100 percent, shifting all risks to within the networks. In 2003, a solidarity bank (BMS) designed as a bank for MFIs became operative, soon to be joined by a regional solidarity bank. It is expected that the increased supply of funds will not be matched by effective demand: the big cooperative networks adhere to a policy of self-reliance through deposit mobilization; most of the smaller networks, with a shortage of loanable funds, are not creditworthy. Linkage models: Quantitatively, the main overall function of bank linkages in Mali is liquidity balancing through bank deposits and borrowings. This is exemplified by Kafo Jiginew, the largest network of financial cooperatives. A second model is expansion of the portfolio through bank borrowings, historically backed by donor funds. This is most clearly exemplified by the village banking network CVECA-ON. Kafo Jiginew (KJ) is a federation of savings and credit cooperatives and the largest network of MFIs in Mali, located originally in the operating area of CMDT, a parastatal for growing cotton. KJ comprises 129 cooperatives with 165,000 members, the majority cotton farmers; in recent years it has moved into urban areas and diversified its membership. Total assets are €23.6m, bank deposits €2.4m, and loans outstanding €16.7m. Deposits of clients amount
iv

to €12.2m, bank borrowings to €5.5m. The repayment rate is 93 percent, return on assets 0.8 percent, return on equity 5.3 percent (2003). All linkages are mediated by the federation through its central fund, which lends directly to the cooperatives; there are plans to convert the fund into a bank or finance company by 2008. In 2003 the three national banks provided loans amounting to 21 percent of loans outstanding (BNDA €1.40m, BIM €1.38m, both at 8 percent interest, BMS €0.70m at 7 percent interest); the European Investment Bank has been refinancing the network’s input loans, accounting for 12 percent of outstandings (at 6.5 percent interest). Additional funds are provided by several donors for special projects. KJ’s financial strategy is explicitly geared to self-reliance on the basis of deposits and equity, constituting 80 percent of loans outstanding (December 2003). Domestic bank borrowings are mainly used for liquidity balancing, 88 percent of it short-term, with wide seasonal fluctuations according to the agricultural cycle. During the planting and growing season, loans outstanding are up to twice the amount of the harvesting and marketing season, paralleled by variations in bank borrowings of a similar ratio, which constitute but a fraction of the portfolio. The village banking system, comprising six networks with 120,000 members, has been initiated by CIDR, a French NGO. KfW and AFD have been the main financiers through BNDA. Village banks are almost identical to cooperatives, except that not just members but all adult residents of a village have a voice and vote in the annual general assembly. CVECA-ON is the second-largest network, located in the area of the Office du Niger, a parastatal originally for cotton and now for paddy on irrigated land in the interior Niger delta. There are three networks of MFIs operating in different parts in the area, all operating in similar ways, with a joint credit information bureau. CVECA-ON was established in 1994 when the Office du Niger was reorganized and divested of its credit function. It comprises 51 village banks (Dec. 2003) organized in three financially independent unions as linkage partners; there is no central fund. CVECA-ON is a network, not a federation, coordinated by a technical assistance office, CAREC, with capacity-building, accounting and supervisory services. The unions and CAREC are financed by the village banks. The 51 village banks have 26,300 members, most of them paddy growers, supplemented by horticulture. Total assets are €3.23m, bank deposits €0.33m and loans outstanding € 2.43m. Deposits of clients amount to €0.73m, bank borrowings to €1.55m. The repayment rate is 96 percent; return on assets is 1.25 percent. BNDA is the only financier of the CVECA-ON unions, which in turn act as financiers of the village banks. Consolidated reporting is done by CAREC. Loan negotiations are held at the BNDA branch in Niono at minimal transaction costs. BNDA lends to the unions at 8 percent p.a. and 10 percent of the loan amount have to be deposited to be used as collateral. The unions lend to the village banks at 10 percent. Interest rates to members vary between the village banks, from 20 percent to 25 percent, except for input loans with a flat charge of 12 percent regardless of loan period (usually 4-6 months). The portfolio is divided into two parts according to source of funds; loans from external funds for inputs and planting costs (57 percent); loans from internal resources for small trade, horticulture and livestock (43 percent). Penalties are stiff, at 1 percent-3 percent per day overdue, perhaps a worst practice leading to a domino effect of non-repayment. BNDA Niono acts as the central fund for unions. Bank deposits are remunerated at 3.5 percent, except sight deposits. The village banks offer sight deposits which are not remunerated and not used as loanable funds; term deposits at 5-10 percent and ROSCA savings at 3-5 percent. BNDA disburses cash loans to the account of each union and from there automatically to the sub-accounts of the village banks. Loans in kind for inputs are disbursed directly to the traders after delivery of the fertilizer to the village banks for distribution to the end-borrower. There are three functions of bank linkages of the CVECA-ON network. The first is expansion of the portfolio. A second and minor function is liquidity balancing. In 2004, on
v

lending funds (refinanced by CIDA) to an organization of paddy farmers, through separate memberships of the organization in 23 village banks, has been added as a third function. Borrowings from BNDA constitute 64 percent of loans outstanding, member deposits 30 percent (2003). Bank deposits are a mere 21 percent of bank borrowings (compared to 44 percent in Kajo Jiginew). Bank borrowings more than double the loan portfolio of the village banks. The three main effects of the refinancing linkage with BNDA are a substantial increase in overall outreach, satisfactory performance of the overall credit portfolio (serious problems of some village banks notwithstanding), and coverage of marginal clients. Outreach is fully due to the availability of bank refinance, says CAREC. Searching for an explanation: Does donor generosity lead to MFI complacency? Why the striking difference between CVECA-ON, which links up with banks to expand its portfolio, and Kafo Jiginew, which uses bank funds just for liquidity balancing, in similar environments? And what is the impact of this difference in strategies on growth in terms of savings mobilization and loans outstanding? Is it because of the initial and continual availability of ample donor credit lines in the first case and a policy of self-reliance in the latter? If so, this hypothesis might explain the difference in terms of propensity to save: virtually all members (96 percent) of the Kafo Jiginew cooperatives save, and they save significantly more (€74 per member) compared to the members of CVECA-ON, less than half of whom (44 percent) have a savings account, with average savings per member just €28. Moreover, the Kafo Jiginew cooperatives are far more dynamic than the CVECA-ON village banks in terms of growth of client deposits during 2001-03 (69 percent vs. –1 percent) and loans outstanding (85 percent vs. 17 percent). A sequel to our first question is thus: Does donor generosity lead to MFI complacency in terms of savings mobilization and in a slow-down of growth? Will backward linkages with donors become superfluous? With BIM willing to lend more to MFIs but meeting a limited demand, and BMS newly entering the market as the designated bank of MFIs, are donor credit lines still needed to refinance BNDA? It appears that they have played an important role in the first stage of evolution of microfinance in Mali. They may now gradually be taken over by domestic banks, marking the second stage of evolution. The coming of the third stage has already been announced: the establishment of a bank of its own by the largest network of MFIs.
vi

Part I:
Overview 1. The country: poor, but stable Mali, located in the Sahel zone of West Africa, has a surface of 1.24 million km² and a population of 11.7 million (2003); 70 percent live in rural areas. The population grows at 2.4 percent annually; the average population density is 9.4/km². Agriculture produces 36.3 percent of GDP. The northern part of the country is desert and thinly populated. The agriculturally productive and more densely populated area is in the south, most of it rain fed, with the Niger as the main source of water for irrigated rice and vegetable cultivation in a vast area known as the Niger Delta. The main cash crop is cotton (on 568,500 ha); the main food crops are millet and sorghum (2,481,000 ha), rice (360,000 ha) and maize (317,000 ha). The cultivation of cotton and paddy, planted by smallholders, has been in the hands of two parastatals, the CMDT and the Office du Niger, respectively. Livestock (goats, camels) is of particular importance in the dry parts of the country. An early history of socialism and central planning, dependency on cotton as a monoculture, climatic factors, fluctuating world prices for cotton and the reluctance to-date of the parastatals to be privatised have made Mali one of the poorest countries in the world, with a per capita income of US$ 245. 64 percent are below the national poverty line; 55 percent of the population above the age of 14 are illiterate. Life expectancy is 41 years, infant mortality 122 per 1000 births. With per capital income of US$245 and an HDI rank of 174, it is among the poorest countries in the world. Mali has been part of the West African Economic and Monetary Union (UEMOA), with the Franc CFA as the regional currency pegged to the Euro (formerly the FF) at a fixed exchange rate1 – an impediment to economic development. However, structural adjustment beginning in 1982 has replaced the former command economy; and democratisation and decentralization since 1992 have led to political and social stability and incipient growth. percent percent percent percent percent percent percent 2. The financial sector and microfinance Regulatory framework: Conducive with repressive elements Financial and monetary policy is in the hands of a regional central bank, BCEAO, with its seat in Dakar and branches in the member countries. For microfinance institutions (MFIs), a legal framework was established in 1993, and ratified by Mali in 1994, the Parmec law2. The law provides legal status to financial cooperatives, submitting them to prudential regulation and supervision, and defines a ceiling on interest rates for loans (presently 27 percent effective p.a.), at twice the rediscount rate. All other MFIs may enter into an agreement (convention cadre) with the central bank for five years, which provides no definite legal status but only a license to operate limited in time; yet they are supposed to be bound by all the stipulations of the Parmec law including interest rate ceilings. In 1998 the central bank issued a series of regulations applicable to MFIs, pertaining to financial statements, declaration of assets, loan classification, provisioning3, claims and debts, prudential ratios and annual reporting. The Parmec law has effectively prevented the emergence of local private banks. 1 1 Euro = 656 FCFA. 2 Loi No 94-040 portant réglementation des institutions mutualistes ou coopératives d’épargne et de crédit. The acronym refers to the project which prepared the law :Projet d’Appui à la Réglementation des Mutuelles d’ Épargne et Crédit. The focus on financial cooperatives appears to have been due to the influence of the Canadian credit union movement, with Société de Développement Internationale Desjardins (SDID) serving as a consultant to BCEAO. Donors, including the World Bank, failed to comment on early drafts of the law, but have continued since its enactment to complain about the cooperative bias and its interest rate restrictions, to-date without any success. 3 Provisioning is set at 40% for loans overdue 91-180 days, 80% for loans overdue 181-365 days and 100% for loans overdue >365 days.
1
The majority of MFIs in Mali are financial cooperatives, owned and managed by their members with equal voting rights. To distinguish those which fully regulated with an unlimited licence (under the Parmec law) from those a limited licence (authorized by an agreement), the former are usually referred to as mutualist organizations (mutuelles). The mutualist MFIs are directly and individually licensed by the ministries of finance in the respective countries. The others, under the convention cadre, need the additional approval of the central bank in Dakar and its branch in Bamako. As this is a cumbersome procedure, licensing has only been sought by their networks or associations, not by the individual MFIs. Regulation and supervision of banks is in the hands of the central bank, the Ministerial Council and the Banking Commission as regional bodies. Implementation of microfinance registration, regulation and supervision in Mali is entrusted to CAS/SFD (Cellule d’Appui et de Suivi des Systèmes Financiers Décentralisés)4. With a total professional staff of seven it does not have the capacity for effective supervision; only around 20 percent of the MFIs listed in its directory have been field-inspected.5 What is evolving here is a system of delegated supervision, entrusted to the various networks of MFIs, which may employ private auditing firms. This works reasonably well in the big networks, which may use the services of external auditors and do not hesitate to close non-performing institutions, but much less so in the smaller ones. The CAS/SFD is also in charge of designing and implementing national microfinance action plans (PNAMF), the first one for the period 1999-20026. Since 1998, the CAS/SFD has been supported by a national microfinance consultative group (GCNM)7, bringing together all major government, donor and MFI agencies under the chairmanship of the Ministry of the Economy and Finance. In the past CAS/SFD8 has been part of the Ministry of the Economy and Finance, which still houses the unit. However, its functions are in the process of being divided between two ministries: regulation and supervision under the Ministry of the Economy and Finance, developmental functions and donor coordination under the Ministry for the Promotion of Investments and Small and Medium Enterprises, which has published the annual report 2003 of the CAS/SFD. The banking sector: small and conservative Mali has nine banks and four non-bank financial institutions (NBFIs). Total assets amounted to €1,274mn, total loans outstanding to €776mn, total deposits to €790mn, and total equity to €122mn (31 Dec. 2003). The four NBFIs account for a mere 1.5 percent of total assets. The largest bank is the Banque de Développement du Mali (BDM), which accounts for 38 percent of the total assets of the sector.9 In nominal terms, the banking sector is moderately over liquid, mobilizing more in deposits than lending to clients; however, 75 percent of deposits are sight deposits. The overall economic environment of Mali is not favourable to commercial banking, which is largely confined to short-term deposit-taking from, and short-term lending to, the formal sector. The rural and urban microenterprise sector has very limited, if any, access to banking services. 4 By law regulation and supervision of MFIs could also be carried out by BCEAO and the Banking Commission; but they have left this task to the Ministry of Finance and its microfinance unit, CAS/SFD, in all UMOA countries. Since 1998 GTZ has been providing consultancy services to the CAS/SFD. 5 GECE 2004:34. 6 Evaluated by GECE 2004. 7 Established by decree N° 98-242/P-RM. 8 Established in 1994 as unit and formalized by decree No 99-008/P-RM in 1999. 9 Together, the Development Bank of Mali (BDM) and the Agricultural Development Bank (BNDA) account for over 50% of total assets of the sector (51.5% of the banking sector, 50.7% of the formal financial sector including finance companies).
2

The microfinance sector: fragile, but expanding rapidly At the lowest level accessible on principle to all, Mali has a flourishing informal financial sector of indigenous origin, comprising rotating savings and credit associations10 practiced particularly by women, and money lenders. They all operate on a very small, local scale. There is no systematic information on linkages with semiformal and formal financial institutions. It appears that the importance of informal finance has declined with the ascent of the new microfinance sector. As a remnant of the transition from the command economy of the 60s and 70s to a decentralized economy, there is a pervasive structure of semiformal community associations (associations villageoises, not to be confused with the famed caisses villageoises)11 found throughout Mali, introduced by the party in 1985. These are quasi-cooperative village or neighborhood associations without legal status used by the government to channel inputs and credit, or, in recent times, to provide nonformal guarantees to BNDA’s input credit scheme. They are semiformal in the sense that they are recognized by the government as well as by BNDA, but not regulated, nor supervised. They suffer from serious problems of management and over indebtedness. The modern microfinance movement started in the mid-1980s as a tripartite venture of NGOs, government and donors and was soon joined by BNDA as a banking partner; linkages were at its origin. The movement was initiated by the Centre International de Développement et de Recherche (CIDR), a French NGO, among the Dogon, an ethnic group famous for its art and philosophy and for its poverty. In this remote and marginal area, CIDR set up the first network of self-managed and self-financed village funds, or village banks, caisses villageoises d’épargne et de crédit autogérées (CVECA). These are member-based organizations: cooperatives in spirit, though not in law, as all residents of a community have a say regardless of actual membership. In1994, as the demand for credit exceeded the volume of savings, Kreditanstalt für Wiederaufbau (KfW), the German government’s development bank, gave a loan to the Government of Mali for refinancing the village banks through BNDA. KfW had been refinancing BNDA’ retail lending since 1986, but due to their unsatisfactory performance decided to shift support to wholesale lending. The early experience of the CIDR-supported village banks inspired CECCM, a European consortium, in 1987 to establish Kafo Jiginew as a network of financial cooperatives in the Raiffeisen tradition, which in turn inspired the establishment of numerous other networks and single institutions of the same type. 1994 marks a turn-around in the development of microfinance when a legal framework, the Parmec law, was passed, ratified in Mali the following year, and numerous new donors provided their support. BNDA, which had acted as a channelling bank for donor funds (particularly by KfW), saw its role converted in 1994 to that of an executing bank12. Subsequently CIDR replicated its approach in several other areas, each with its own network. This was paralleled by a multitude of initiatives: the majority savings and credit cooperatives, a small number solidarity groups, or crédit solidaire, inspired by the Grameen approach in Bangladesh, with a focus on women and standardized loans repayable in weekly instalments, mutually guaranteed by the members of small groups.13 CAS/SFD provides on an annual basis detailed consolidated data on 40 microfinance networks, plus a recently established microfinance company, Azaouad Finances S.A. in 10Pari in Bambara, the main local language; tontines in French 11 The term associations villageoises is misleading, as they are formed on a neighborhood and not on a village basis; thus there may be several in one village. I have therefore translated them as community associations, rather than village associations, also to distinguish them from the caisses villageoises, commonly referred to as village banks in English, even though they are not banks in the legal sense. 12 As a channeling bank BNDA operated for a commission at the government’s terms and risk; as an executing bank it operates on its own terms and risks. 13 Two of seven solidarity credit networks were initiated and supported by CIDR: Nyeta Musow in Mopti and Miselini in Bamako. (CIDR 2004$)
3

Timbuktoo. percentThe sector comprises 752 MFIs with a total of 614,000 members: 37 percent female and 59 percent male; 59 percent rural and 41 percent urban. The MFIs also admit groups as members, constituting 4 percent of the membership; many of the group members are also individual members of the MFIs. If we add the group members who are not also individual MFI members, total outreach of the MFIs may be around 650,000. Accounting for a certain proportion of multiple memberships per household, we may assume that MFIs have a gross outreach to between 25 percent and 30 percent of the population14. The rounded number of depositors is 347,600 (57 percent of total membership), the number of active borrowers with loans outstanding 228,500 (37 percent of membership). If the number of deposit accounts is used as a proxy for active membership, net outreach of the MFI sector is reduced to about 15-17 percent. While this is a substantial achievement attained within about 20 years, there is plenty of room left for further expansion to at least double or triple the present number. In fact, the MFIs continue to expand rapidly: between 2002 and 2003 by 18 percent from 522,002 to 614,211 members. Total assets of the registered MFIs, equal to total liabilities and capital, amount to €69m. Total deposits amounted to 52.5 percent of liabilities and capital, capital (without grants) to 21.8 percent, credit lines to 21.8 percent, and grants to 3.6 percent; three-quarters are thus internal resources (deposits and capital), one-quarter external (credit lines and grants). Loans outstanding amounted to €48.5m, which is 70 percent of total assets, 134 percent of deposits and 95 percent of internal resources. The overall (weighted) repayment rate is 94 percent (down from 95.7 percent in 2002)15; the recovery rate, which includes collection of bad debts, is around 97-98 percent; but there is considerable variation between the networks, particularly the smaller ones. CAS/SFD also reports a variety of other performance measures and ratios for each network, but does not aggregate them (Table 1). The total number of MFI units (December 2003) was 752, compared to 48 bank offices. MFIs thus accounted for 94 percent of all bank and MF offices. Total assets of MFIs were equivalent to 5.4 percent of total assets of the banking sector and accounted for 5.1 percent of the combined banking and microfinance sector. Deposits in MFIs were equivalent to 4.0 percent of bank deposits and amounted to 3.8 percent of the total banking and MF sector. Loans outstanding of MFIs were equivalent to 6.2 percent of bank loans and 5.9 percent of the total banking and MF sector. Between 2002 and 2003 bank deposits grew at rate of 14 percent and MFI deposits at 18 percent; bank loans grew at 16 percent and MFI loans at 20 percent. (CAS/SFD 2004:30)
14 According to CAS/SFD 2004:10, the penetration rate in terms of population was 5.5% and in terms of families 33.2% in 2003; the latter ignores multiple memberships within a family. 15 The decline in repayment performance is due to deteriorating trade relations of borrowers with Ivory Coast, where the economy has been severely disrupted by the civil war. A financial system has to be able to cope with such events, as the MFIs in Mali apparently do.
4

Table 1: Microfinance networks in Mali, Dec. 2003 (amounts in million Euros) Regulated
(mutualistes) CVECA Solidarity credit Total*
Number of networks 27 6 7 41 Number of unions/associations 15 14 7 37 Number of institutions 431 276 44 752 Number of authorized entities 431 14 7 452 Number of members 430,166 120,206 63,247 614,211 percent female percent male percent groups
30 65 5
35 63 3
88 11 1
37 59 4
Number of depositors 267,112 25,253 55,214 347,579 Total assets 56.31 6.37 5.82 68.98 Deposits 32.03 2.46 1.54 36.24 Capital (without grants) 10.52 1.59 2.74 15.04 Bank credit lines 12.30 1.84 0.88 15.02 Grants 1.36 0.36 0.65 2.45 Soft loans 0.11 0.13 0 0.24 Bank deposits 6.83 0.70 0.87 8.40 No. of loans outstanding 12-03 142,510 34,800 51,148 228,458 No. of disbursements in 2003 153,085 41,631 63,672 258,388 Loans outstanding 40.65 4.10 3.49 48.52 Amount disbursed in 2003 45.99 4.83 7.89 58.70 Repayment rate** 93.3 96.3 95.7 93.8 Source: CAS/SFD 2004, various tables * Including Azaouad Finances S.A., not listed in the three preceding columns. ** Amount collected on due-date/loans outstanding Since the enactment of the cooperative microfinance law in 1994, a division of the microfinance networks in Mali has evolved into three sub-sectors, listed in a declining order in terms of their size :
(1) Savings and credit cooperatives16 with a permanent licence, referred to as mutualist (mutualistes): voluntary associations in which only members have a voice.17
(2) Village banks (caisses villageoises) or CVECA 18: savings and credit cooperatives in the CIDR tradition referred with a temporary license in which all adult residents of a village have a voice; normally non-residents cannot become members and hold savings and credit accounts.19
(3) Solidarity group networks (crédit solidaire) in the Grameen tradition. All of the above are regulated; and subjected to prudential norms defined by the Parmec law and observe the usury law (with a credit ceiling presently set at 27 percent). The rationale for a legal distinction between the three types is difficult to comprehend and has found much international criticism. Only the mutualist savings and credit cooperatives are fully and individually licensed without any time limit, as are their unions and federations. In contrast, 16 I am avoiding the term credit union, which is associated with the North American tradition of company-based cooperatives of wage and salary earners with a primary emphasis on saving for the rainy day. In contrast, the financial cooperatives which originated in Germany in the mid-19th century and spread from there worldwide focus on farmers and microentrepreneurs (usually in different movements) and the promotion of their enterprises through savings and credit, as is the case of virtually all MFIs in the three subsectors in Mali. 17 They are akin to the German Raiffeisen cooperatives (now cooperative banks, since they came under the banking law of 1934), from which they originated via the Canadian Desjardin movement. 18 The term caisse villageoise is inappropriately translated into English as village bank, as these institutions do not have banking status. The term village funds would be more appropriate, but does not have the same institutional connotation as in other languages (e.g., [Spar-] Kasse, caja, sanduq). 19 A national association was established in December 2003.
5

the other two types operate on the basis of an agreement (convention cadre) with the Ministry of the Economy and Finance, which gives them a provisional license limited to five years, after which the license may, or may not, be renewed. In these two subsectors licenses are only given to their networks or unions as subdivisions of a network; only these are directly part of the formal microfinance sector. The local financial institutions have no legal personality and are considered as branches, but for all practical purposes they are autonomous local MFIs. In a strict legal sense, they are semiformal institutions (registered and recognized) in a formal sector; this has enabled some of them to get away with disregarding the usury law. In 2003, 30 mutualist cooperative societies were newly licensed according to the Parmec law, compared to 64 in 2002. Only six non-mutualist cooperative societies were licensed by signing an agreement (convention cadre) with the Ministry of the Economy and Finance in 2003, none in 2002.20 To these three subsectors, a microfinance company has been recently added as an institutional novelty, which is licensed by a five-year agreement (convention cadre) with the Ministry of the Economy and Finance. As shown in Table 1 the fully regulated mutualist subsector is by far the largest, comprising 57 percent of the total number of societies and 70 percent of total membership; the CVECA subsector comprises 37 percent and 20 percent, respectively; the solidarity credit subsector is the smallest of the three, comprising 6 percent and 10 percent, respectively. The female membership in the first two subsectors is 30 percent and 35 percent, respectively, in the solidarity credit subsector 88 percent, as common among Grameen replicators. percentThe two largest networks are Kafo Jiginew (one of our two case studies) with 165,000 members and Nyèsigiso with 127,500 members, both mutualist, accounting together for almost half (47.5 percent) of total membership. Activity levels vary widely between the three subsectors (assuming the validity of date reported by CAS/SFD): of the members in the mutualist subsector 62 percent are depositors and 33 percent borrowers (with loans outstanding as of 31/12/2003, the peak time of the year); among the CVECA the percentages are 21 percent and 29 percent; in the solidarity credit network, where regular savings and borrowing are practically compulsory, 87 percent and 81 percent. One of the most obvious distinctions between the three subsectors is the relative weight of deposits in terms of total resources: 57 percent on average among the fully licensed institutions of the mutualist subsector, 39 percent among the CVECA and 27 percent among the MFIs of the solidarity credit subsector. However, this distinction disappears if we look at the proportion of internal resources as the sum total of deposits and capital: 75 percent, 64 percent and 74 percent, respectively. Most of the funds deposited and lent are in the mutualist subsector, which accounts for 88 percent of the total deposit volume and 84 percent of the total amount outstanding (table 2). This is largely due to the weight of the two biggest networks, which alone account for 59 percent of total sector deposits and 58 percent of total sector loans outstanding: Kafo Jiginew (33.8 percent of all deposits, 38 percent of all loans) and Nyésigiso (25.3 of all deposits, 20.0 of all loans). The solidarity credit subsector has a relatively larger share (13 percent) of total disbursements in 2003, reflecting a higher turnover. Average deposit balances as reported by CAS/SFD (2004: Ann. II/3) in the three subsectors are €120, €98 and €27, respectively; average loans outstanding per borrower are €285, €117 and €69, respectively. 86 percent of urban and 59 percent of rural clients of MFIs are organized in mutualist organizations. 33 percent of rural clients are organized in CVECA, 7 percent in solidarity credit groups. (CAS/SFD 2004:27)
20 In 2003, 34 mutualist (including three federations) and six non-mutualist organizations applied for licensing.
6

Table 2: Comparative data on three microfinance subsectors in Mali, Dec. 2003 (in percent) Mutualist CVECA Solidarity credit Total*
Institutions 57 37 6 100 Members Subsector: Percent female Percent depositors Percent borrower:
70
30 62 33
20
35 21 29
10
88 87 81
100
Total assets 82 9 8 99 Deposits 88 7 4 99 Loans outstanding 84 9 7 100 Amount disbursed in 2003 78 8 13 99 Credit lines 82 12 6 100 Source: Calculated on the basis of Table 1 Performance. The non-performing asset ratio was 6.2 percent in 2003, a substantial degradation from a ratio of 4.4 percent in 2002. In 2003 the ratio was 6.7 percent among the mutualists, 4.2 percent among the CVECA, 3.7 percent in the solidarity credit sub-sector, and 3.9 percent in the microfinance company. In contrast to the other two subsectors, only the solidarity credit subsector has improved its performance. The superior legal status of the mutualist subsector, in terms of the Parmec law, is thus not reflected in their performance, to the contrary: their overall asset quality is markedly lower than that of the other subsectors. The lower repayment rate in the mutualist sector is to some extent due to a number of poorly performing small, frequently one-unit networks with inadequate internal controls, but also of one of the larger networks21, as well as just average performance of the largest network, Kafo Jiginew. Table 3: Non-performing assets in three microfinance subsectors, Dec. 2002-03 (in percent)
Microfinance sub-sector 2002 2003 Regulated (mutualists) 4.6 6.7 CVECA 2.3 4.2 Solidarity credit 4.4 3.7 Other - 3.8 Total sector 4.4 6.2 Source: CAS/SFD 2004:18 Whether under the Parmec law or under agreement (convention cadre) with the Ministry of the Economy and Finance – a blurred distinction –, all MFIs are required to submit quarterly statistics and annual reports including balance sheet and income & expenditure statements. In 2003 CAS/SFD (2004:34-35) received quarterly reports from 27 organizations and annual reports from 77, most of them lacking in coherence22. percent percentI. In 2003 CAS/SFD (2004:38) carried out 17 inspection missions,and one of the major concerns is the violation of the usury law. One MFI was closed during 2003, 2 were suspended, 16 were fined. CAS/SFD (2004:44) notes a continual expansion of the microfinance sector and at the same time a decline in performance, indicated by an increase in financial and personnel costs and in the number of loss-making MFIs, attributed to governance and management problems. The sector is thus considered as very fragile, requiring effective supervision, consolidation and restructuring.
21, Kondo Jigima with 35 units and 34,287 members, at a repayment rate of 90%. 22 Very few submitted the required approval by their general assembly; 61% were too superficial; and 29% were received late.
7

3. Bank linkages: mainly for liquidity balancing, also for portfolio expansion Three of the nine banks in Mali have refinancing relations with MFIs:
• Bank Nationale de Développement Agricole (BNDA), a government-owned agricultural development bank and practically the only bank lending to the agricultural sector, historically the main bank serving the MFI sector, with an MFI loan portfolio of €4.65m as of Dec. 2003;
• Banque Internationale pour le Mali (BIM), a commercial bank, with a well-performing MFI portfolio of €4.44 in 2003 and €3.41m in 2004, concentrated on three networks23, willing but unable to lend more due to a lack of demand;
• Banque Malienne de Solidarité (BMS), a commercially operating bank established in 2002 from resources originally set aside for a national microfinance fund and nominally owned by the major MFI networks24, with the main objective of fighting poverty and serving the MFI sector.
Comparative balance sheet data for these three banks are only available from BCEAO for December 2002: BNDA had total assets of €153mn (€172mn by 2003), and BIM of €132.5mn. The new BMS, established upon the initiative of the President with a capital allocation of €2.29, showed total assets of €5.2mn by the end of 2002 and had grown to €11.8mn by 2003 and €17.0mn by 2004. As of December 2002, the three banks together stood for 26 percent of €1.13bn total assets of the formal financial sector. Linkages between banks and MFIs in Mali consist mainly of credit lines and bank deposits. Their main function is liquidity balancing of MFIs over the course of the year, characterized by large seasonal fluctuations, as will be shown below in the case studies. Excess liquidity increases during the first half of the year and peaks in July; liquidity shortage increases during the second half of the year and peaks in December. In addition, BNDA acts as executing bank for donor support to some MFI networks, the largest amongst them being Kafo Jiginew percent percent percentAs of 31 December 2003, the peak of liquidity shortage, bank credit lines (€15.02m) were equivalent to 179 percent of the amount of bank deposits (€8.40m) (Table 1). This reflects mainly the ratio in the weighty mutualist subsector, at 180 percent. The ratio is 263 percent in the CVECA subsector, indicating a higher reliance on bank loans. The solidarity credit sector is balanced at 101 percent. However, if we add grants to the credit lines, the ratio changes only little for the mutualists (200 percent) and somewhat more for the CVECA (314 percent), but brings the solidarity credit groups up from 101 percent to 176 percent, which is close to the ratio of the mutualist subsector. In relative terms, bank resources are most important to the CVECA and somewhat less important to the mutualists; in both subsectors, grants are of minor importance. In contrast, the solidarity credit subsector is far more donor-dependent (relative to its size). The main function of the bank credit lines is bridging seasonal liquidity shortages of the MFIs and their networks. The CVECA, with their substantially higher borrowing ratio, rely on bank credit as a source of funds also for deepening their outreach. Bank deposits of MFIs (€8.4m as of 31 Dec. 2003) amount to 12 percent of the sector’s total assets: 12 percent among regulated MFIs, 11 percent among CVECA, and 15 percent 23 The three largest networks: Kafo Jiginew, Nyésigiso and Kondo Jigima, all three mutualist. Only Kafo Jiginew continues to be a major borrower; since three years, Nyésigiso and Kondo Jigima have enough liquidity to be largely self-reliant. 24 In 2001 funds were allocated upon the initiative of the President of Mali for a national microfinance fund. However, before its formal establishment, resources amounting to FCFA 1.5bn, or €2.29 were reallocated to the establishment of the BMS. The capital allocation is to be in the name of the major networks of MFIs, which thereby become owners of BMS without investing any funds of their own. However, by January 2005, the formal agreement was still awaiting to be finalized.
8

among solidarity groups. Their main function is short-term liquidity balancing, as 72 percent are sight deposits: regulated MFIs 70 percent, CVECA 73 percent, solidarity groups 88 percent. The mutualist subsector deposits in banks the equivalent of 19 percent of the amount collected from clients, compared to only 2 percent in the other two subsectors.25 Does the provisional status accorded to non-mutualist MFIs discourage banks from lending to them, as earlier surmised by Samassékou (2000:5)? The prudentially regulated mutualists account for 82 percent of total assets in the MFI sector and equally for 82 percent of total credit lines. The CVECA, with 9 percent of total assets, account for a larger share of credit lines, namely 12 percent; while the solidarity credit subsector, with 8 percent of total assets, accounts for 6 percent of credit lines. Legal aspects are apparently irrelevant. It is institutional policy that matters: It is CVECA policy to use bank credit to expand their portfolio; accordingly they borrow more than the mutualists, which use credit lines mainly for liquidity balancing. The solidarity credit MFIs use credit lines mainly for liquidity balancing and donor funds for expanding their portfolio. In terms of refinancing, there appear to be two categories of MFIs: those which are healthy and expanding (mainly the bigger ones); and those which are poorly performing (mainly the smaller ones). The latter have a demand for credit, but are not found creditworthy by the banks; they should not be lured by donor guarantees into expanding an ill-performing portfolio. The former grow to a considerable extent on their own strength and tend to have excess liquidity; the banks are prepared to lend more, but there is a lack of demand. BIM, the only private commercial bank lending to MFIs, is a case in point. Starting to lend to MFIs in 1992 (with a loan of €0.46m to Kajo Jiginew), it has only been lending to three networks of the first category: Kafo Jiginew, Nyésigiso and Kondo Jigima (at 8 percent interest p.a.). This portfolio has been performing very well, and BIM would be prepared to lend more; but only Kafo Jiginew has requested, and received, loans in 2003 and 2004 amounting to €1.29m (€0.76m credit line and €0.53m medium-term loan). At the same time, total deposits of the three networks at BIM amounted to €1.44m in 2001, €2.48m in 2002, €4.44m in 2003 and €3.41 in 2004. The deposit balance of Kafo Jiginew amounted to €1.66m in 2003 and €2.41m in 2004: well above its borrowings from BIM.
25 Sectoral data on a monthly basis are not available.
9

Part II:
Case studies 1. BNDA, the linkage partner 1.1 The bank BNDA, the government’s agricultural development bank under banking law, has been the main institution banking with the MFI sector in Mali since the mid-1980s. BIM has been of minor importance. It is expected that the newly established BMS, the designated bank for MFIs, will be of increasing importance in the future, but probably not dethrone BNDA for some time to come. All data, unless otherwise indicated, refer to 31 December 2003. BNDA was established in 1981 with the mandate of financing the agricultural sector. It has recently started to expand into the urban sector in order to mobilize urban savings and to diversify its portfolio; and it has greatly improved its national and international money transfer services. It has its head office and two branch offices in Bamako and 19 branch offices in the countryside. It has a total staff of 167 (10 percent female), 53 percent of them in the branches. There has been little growth since 1997, when the bank had 20 branches and a staff of 150.26 Total paid-in capital is €16.5m: 37.3 percent held by the government of Mali, 19.2 percent by the central bank BCEAO, 22.4 percent by the French AFD, and 21.2 percent by the German DEG. Main sources of funds are deposits (63 percent), capital (11 percent) and bank borrowings (12 percent). Total assets of BNDA as of 31 December 2003 amounted to €173,2m (an increase of 12.1 percent over 2002). Total deposits amounted to €107.6m: 10 percent deposited by governmental and non-financial institutions, 90 percent by clients. Client deposits include 72 percent sight deposits, 18 percent passbook savings, 6 percent term deposits and 4 percent others. Gross loans outstanding were €101.4m (70.5 percent short-term), net loans outstanding €94.2m. BNDA gives more detailed information on disbursements and commitments, which in 2003 numbered 17,135 and amounted to €190.6m. In terms of loan accounts (including commitments), 84.5 percent were through community associations, 0.2 percent to the cooperative sector, 10.2 percent to individuals, 4.8 percent to corporations and 0.3 percent to MFIs. In terms of volume, the largest part goes to corporations, namely 60.7 percent, followed by loans through community associations (CA), namely 35.2 percent. The remaining 4.1 percent go to MFIs (2.9 percent), individuals (1.1 percent) and cooperatives (0.1 percent). This makes BNDA a corporate and wholesale lender. Lending to MFIs fits into this mission. Table 4: Disbursements and commitments of BNDA by borrower category, 2000-03, in percent
2000 2001 2002 2003 Borrower category Number Amount Number Amount Number Amount Number Amount
Loans guaranteed by CA 79.6 27.8 87.2 52.7 85.0 31.0 84.5 35.2 Cooperatives sector 2.7 0.4 1.4 0.4 0.4 0.1 0.2 0.1 Individuals 11.6 1.0 7.1 1.0 10.2 1.3 10.2 1.1 Corporations 3.8 65.3 3.7 41.4 3.8 63.7 4.8 60.7 MFIs 2.2 5.5 0.6 4.5 0.6 3.8 0.3 2.9 Total percent 99.9 100.0 100.0 100.0 100.0 99.9 100.1 100.0 Total (amount in million €) 3,213 69.6 7,163 85.5 11,649 141.0 17,135 190.6
Non-performing assets were 8.3 percent of gross loans outstanding. The total recovery rate, including collection of bad debts, was 97.0 percent. There is wide variation in recovery rates 26 http://www.fao.org/ag/ags/agsm/banks/banks/mali.htm
10

by product: 97.7 percent of loans guaranteed by community associations, 72.6 percent of loans to farmers’ cooperatives, 90.7 percent of individual loans, 96.6 percent of loans to societies and 100 percent of loans to MFIs. The surprising performance of the loans guaranteed by semi-formal community associations is due to the fact that 90 percent of their volume are input loans in kind with a repayment rate of 100 percent; they are largely repaid in kind to parastatals like CMDT and Office du Niger, which in turn repay BNDA. Return on assets was a meagre 0.43 percent in 2003, compared to 1.38 percent in 2002 and 1.61 percent in 2001. BNDA attributes the low return in 2003 to a more adequate coverage of its risk. 1.2 Linkages Forward and backward linkages: BNDA is involved in forward linkages with MFIs and backward linkages with donor organizations, particularly as executing agency for AFD and KfW. As a channelling bank for funds provided by KfW, BNDA (2002:8) started refinancing MFIs in the Dogon area in 1986, one of the poorest areas in Mali, where CIDR had been supporting the establishment of village banks of the CVECA type since 1983. Since 1994, BNDA has acted as executing bank . BNDA proudly reports that since then its MFI portfolio has multiplied. By 2003, disbursements and commitments reached €5.6m; the loan portfolio stood at €4.65m. Its backward linkages with the two donor organizations cover almost half (47.5 percent) of its portfolio; €1.75m were refinanced by AFD, €0.46m by KfW, totalling € 2.2m. (Table 5) Non-financial linkages, comprising funding for training of MFI staff and related forms of institution-building, are provided by BNDA as a channelling agency on behalf of AFD. Table 5: Credit lines of BNDA to MFIs*, 1997-2003 (in ‘000 Euro)
Units* 1997 1998 1999 2000 2001 2002 2003 MFIs financed by AFD: 5 1421 1351 1245 1581 1547 1727 1753 CVECA-Office du Niger 3 1207 1082 1091 1215 1372 1651 1677 PAAF Bamako 1 137 172 154 229 175 76 76 PAF Mopti 1 76 96 0 137 0 0 0 MFIs financed by KfW: 5 721 998 637 518 337 838 457 CVECA-Pays Dogon 3 572 762 305 218 76 305 152 CVECA-Kita/Bafoulabé 2 149 236 332 300 261 534 305 Other MFIs: 12 994 1020 1965 1649 1953 2757 2352 Kafo Jiginew 1 762 762 1524 1067 1067 915 1677
Canef Bougouni 1 91 183 305 305 305 305 305 NEF Douentza 1 64 37 0 64 152 23 0 Pasacoop-San/Djenné 2 0 38 59 105 110 133 142 CMEC/SAN 1 0 0 0 32 90 0 76 Kondo Jigima 1 0 0 76 76 76 76 76 Others 5 76 0 0 0 152 1305 76
Total 22 3136 3369 3848 3748 3837 5322 4649 Source : Mission d’évaluation AfD/DEG *Unions, associations or single-unit entities as legal borrowers. Portfolio concentration: BNDA’s portfolio is highly concentrated. The two largest borrowers are Kafo Jiginew and CVECA-Office du Niger, our two case studies, each with a credit ceiling of €1.68m, accounting for 72 percent of the portfolio as of Dec. 2003. In 2003 BNDA disbursed 56 loans to 15 MFI organizations belonging to 10 networks, amounting to €5.6m or 2.9 percent of total disbursements and commitments – an increase of 4.6 percent over 2002. Seven of these organizations have been refinanced by BNDA continually since 1997. The recovery rate of loans to the MFI sector is 100 percent. BNDA is regarded as a prudent lender, which has resisted donor pressure to lend to high-risk target groups; it also has been
11
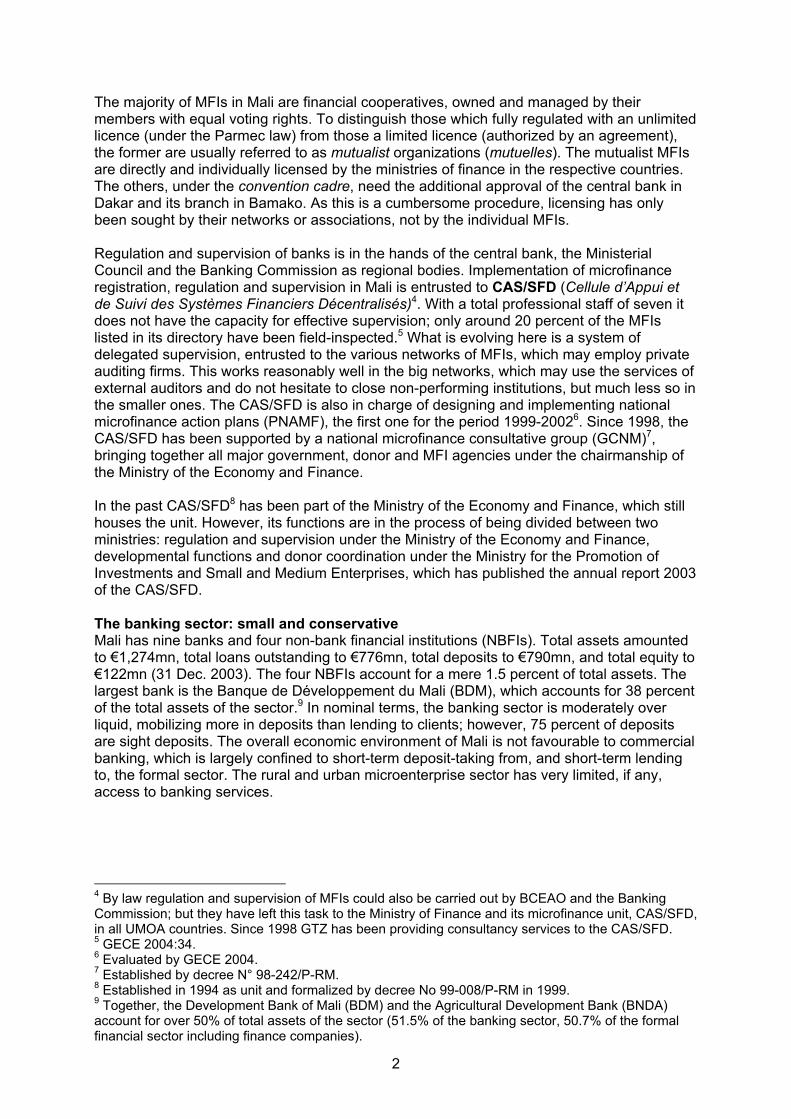
reluctant to get involved in adventurous lending even when donors are prepared to fully bear the risk. Risks are very low and mitigated at three different levels: borrowers provide a guarantee deposit with their local MFI (e.g., in the case of KJ 10 percent on smaller and 30 percent on larger loans); in the case of commodity loans (cotton, rice), repayment to the bank is guaranteed through deductions at source by the respective parastatals; part of the portfolio is guaranteed by donors27 – a substitute for what is one of the core functions of banking: risk management. Defaulting on loans provided by BNDA to MFIs is zero, compared to default rates of up to 50 percent of retail loans in an earlier phase. Social or commercial banking: BNDA pays 3 percent on ordinary deposits of MFIs (calculated on the number of days deposited) and 4.15 percent on time deposits. BNDA lends to MFIs at a preferential effective annual interest rate of 8 percent, which is lower than the interest rates on all other loans: 10 percent-12 percent to community associations and 15 percent to individuals and corporations. This puts the refinancing of MFIs more in the category of social than commercial lending. No data were available to ascertain whether BNDA is breaking even or making a loss on its MFI lending; a profitability study is reportedly in the planning stage. It may thus not be surprising that in relative terms, loans to MFIs have declined: from 5.5 percent of the total volume of disbursements in 2000 to 2.9 percent in 2003. However, the main reason for the relative decline is not a lack of willingness of the bank to lend, but a lack of effective demand (i.e., by creditworthy MFIs). In terms of numbers, both wholesale and retail loans are listed in the same table (BNDA 2004a:14). While the overall number of loans has dramatically increased from 3,213 to 17,135 during that period (particularly the number of agricultural input loans through community associations, from less than 2,000 to almost 11,000), the number of loans to MFI organizations has declined from 70 to 56, or, in percentage terms, from 2.2 percent to 0.3 percent. The business is regarded as so insignificant by BNDA that it does not bother to provide regular monitoring data other than number and amount of loans in its annual report. The last detailed report available in January 2005 was from July 2002 and covered the period 1998-2001, much of it based on CAS/SFD annual reports. No figures were available from BNDA on loans outstanding to MFIs and on deposits by MFIs; nor were there any statistics on monthly fluctuations of deposits and outstandings.
27 E.g., AFD via IFC in the case of a loan by BNDA to KJ, ADA-Luxemburg in the case of a loan of BIM to KJ; CFC in 1999. The justification is usually the innovative nature of a program.
12

2. Kafo Jiginew: Bank linkages for liquidity balancing
2.1 The network
Origin and structure: Kafo Jiginew (lit.: federation of granaries) is a federation of mutual savings and credit cooperatives in the south of Mali and the largest network of MFIs; it is not divided into unions or associations as separate legal entities. Its mission is “to organize the poor population of Mali and to help them take control of their finances,” combining outreach to the poor with self-reliance and institutional sustainability. It was initiated in 1987 by CECCM, a consortium of European NGOs which continues to provide financial and technical assistance28, in close cooperation with the Companie Malienne de Développement et de Textiles (CMDT) 29, a parastatal, and financed with grant from the EC. Since its inception Kafo Jiginew has received grants amounting to €2.33 million.30 The federation, with its seat in Koutiala in the cotton belt of Mali, comprises four regional offices, 129 cooperative MFIs with an additional 12 service units, a representative office in Bamako since 2001, and a central fund which may eventually be transformed into a finance company or a bank. Total staff is 162: 28 percent in the head office and the remainder in the regional offices; 21 percent are female.
Governance: The federation and each of the member-cooperatives, as autonomous MFIs, are regulated under the Parmec law and supervised by CAS/SFD; the regional offices have no legal personality and no organs of governance. Each cooperative is owned by its members, with the general assembly as its ultimate decision-making body, a credit committee and a supervisory council. The regional offices are in charge of guidance and supervision, assessment of major loans, and reporting. The federation is in charge of overall strategy, training, inspection, consolidated reporting and the management of a central fund for liquidity exchange and major loans. The federation, which is owned by the cooperatives as shareholders, has the right to open, suspend and close cooperatives. The operational costs of the federation are borne by the member-cooperatives, which also contribute to a disaster relief fund.
Membership: Most members are cotton farmers in the area of CMDT. Since 1994, the onset of a general policy focus on financial cooperatives, it has spread slowly into other parts of the country including urban areas (as net depositors, accounting for 30 percent of deposits and 18 percent of loans outstanding, June 2002, and diversified its membership to also include craftsmen, small traders, and wage and salary earners. The predominance of cotton farmers means that the performance of the cooperatives is closely connected with the world market for cotton. As of December 2003, the 129 cooperatives of the federation had 165,000 members: 71 percent male (mostly as heads of household), 25 percent female and 4 percent groups (down from 8 percent in 2002). The groups usually have on average 30 members, mostly women who are too poor to qualify for regular membership. The loans obtained by the groups are on-lent to their members.
28 The latest contract for the continual development of the network was signed in April 2002, over an amount of €132,700. 29 CMDT covers a territory of 96,000 km², with 2.8m inhabitants. 30 Grants received by Kafo Jiginew 1989-2002 include the following (in Euro): CECCM, 1987-94: start-up finance* 670,732CECCM, 1995-2003: projects, operational costs 589,939ADA, Luxemburg, since 1998: youth programs 21,341Freedom from Hunger, 1998-2002: Savings & Credit-cum-education 487,805Netherlands Development Service: revolving fund, other 207,317AFD, since 1998: leadership training; operational costs of: 128,811GTZ: establishment of cooperatives in Bougouni 138,720Embassy of the Netherlands, since 2000: institutional support 83,841Total 2,328,506
13

Interest rates on deposits31 are as follows: • savings deposits (also referred to as sight deposits) at 3 percent p.a. on amounts
stable over at least 3 months, with a minimum of €1.50 in rural and €3.00 in urban areas;
• 4 percent on term deposits with a minimum of €38. There are four loan products:
• Fertilizer loans of 4-6 months at a flat rate of 10 percent, equivalent to around 25 percent p.a.
• Short-term loans of 3-6 months at 30 percent p.a. • Seasonal loans of 9 months at 24 percent p.a. • Equipment loans up to three years at 18 percent p.a.
Basic data: By the end of 2003, there were 149,000 depositors (75 percent male) and 94,000 borrowers (90 percent male). Total consolidated assets amounted to €23.6m (an increase of 24 percent over 2002), loans outstanding to €16.7m, 75 percent of them in agriculture. The main source of funds are deposits of members, amounting to €12.2m; 78 percent are savings deposits withdrawable at any time, 10 percent term deposits and 12 percent guarantee deposits. Guarantee deposits are collected at a rate of 10 percent for loans up to €1,500 and 30 percent for loans above. The loans-to-deposit ratio was 137 percent. Next in importance are bank borrowings of €5.5m, grants of €1.9m and capital of €1.2m. The average cooperative thus had 1280 members, among them 1155 depositors and 730 borrowers, €183,000 in total assets, €130,000 in loans outstanding and €95,000 in deposits; or per member total assets of €143, loans outstanding of €102 and deposits of €74.
Table 6: Kafo Jiginew, consolidated data (amounts in million Euros) 2001 2002 2003 Number of cooperatives 129 129 Number of members 144,742 164,596 percent male percent female percent groups
7220
8
71 25
4 Number of depositors Percent male
122,603 75
149,109 75
Number of borrowers Percent male
77,135 90
93904 90
Total assets 12.83 19.02 23.58 Bank deposits 2.09 2.40 Loans outstanding 9.03 13.39 16.69 Percent agricultural 75 75 percent short-term percent medium-term percent long-term
8514
1
88 8 4
Deposits of clients 7,23 9.80 12.22 percent savings deposits percent term deposits percent guarantee deposits
78 10 12
Bank borrowings 3.85 5.48 Donor funds (loans and grants)
1.71
1.86
Capital (without grants) 1.01 1.19 Repayment rate in percent 95.1 93.2 Return on assets in percent 2.7 0.8 Return on equity 16.6 5.3 ROA calc. by PlaNet Finance (1.4) 1.0 June 2003: 1.4
31 Average costs of deposits: 1.5%.
14

AROA (adjusted for subsidies)*
(5.4) (1.6) n.a.
Sources: KJ 2004a, b. * PlaNet Finance (2004) Performance: Its consolidated performance as of 30 June 2002 was evaluated by PlaNet Finance; it received a B rating, which is remarkable given the difficult economic environment. From 2002 to 2003 performance has declined. This is attributed to a lack of rain in 2002, resulting in a decline in the production of cotton and grains by 25 percent and 24 percent, respectively; and the crisis in Côte d’Ivoire, which has closed an important market of Mali. From 2002 to 2003, the repayment rate fell from 95.2 percent to 93.2 percent. Short-term loans, accounting for 88 percent of the portfolio in 2003 (85 percent in 2002) declined slightly from 94.9 percent in 2002 to 94.3 percent in 2003. The biggest drop was among the medium-term loans , which accounted for 8 percent in 2003 (14 percent in 2002); they repayment rate fell from 96.6 percent in 2002 to 80.6 percent in 2003. Long-term loans, which accounted for 4 percent of loans outstanding in 2003 (1 percent in 2002) remained unaffected, at repayment rates of 100 percent in both years. (KJ 2004b:22) The loss ratio (overdue >1 year) in 2003 was 2.0 percent, compared to 1.5 percent in 2002 (KJ 2004b:23). The consolidated figures conceal that only 44.5 percent of the cooperatives are profitable, while 55.5 percent are loss-making. We may add here that KJ has more than recovered from this during 2004, with good rains and a record cotton harvest.
KJ reports a return on assets of 2.7 percent in 2002 and 0.8 percent in 2003; and a return on equity of 16.6 percent for 2002 and 5.3 percent for 2003. Adjusted for subsidies as calculated by PlaNet Finance (2004), returns on assets were negative (-5.4 percent in 2001, -1.6 percent in 2002).
2.2 Linkages Types of linkages: All linkages are mediated by the federation through its central fund; there are no direct linkages between member-cooperatives and banks or donors. KJ borrows funds and on lends them to the cooperatives; each cooperative is autonomous in its lending decisions, using its own capital, deposits mobilized and funds borrowed from the federation. Linkages are purely financial, comprising bank deposits and bank borrowings. Bank deposits, part of which serves as a guarantee fund, constitute 54 percent of bank borrowings as of Dec. 2002 and 43 percent as of Dec. 2003. These percentages vary widely over the year as bank borrowings, in contrast to deposits, are far more subject to seasonal fluctuations (see). KJ receives 3 percent p.a. on its ordinary bank deposits (the bulk of its deposits) and 4.15 percent on term deposits; it pays 8 percent p.a. on domestic bank borrowings and 6.5 percent on the EIB loan. Client deposits are its cheapest source of funds, averaging 1.5 percent. Institution-building through training of cooperative managers and board members is financed by AFD; the funds are channelled through BNDA. The banks provide no capacity-building to the MFIs and their networks. Linkage partners: Kafo Jiginew has three major types of linkage partners, providing €7.34m in loanable funds (31/12/2003): national banks provide about half of external funds, EIB and donor agencies about one-quarter each (Table 7). Table 7: Kafo Jiginew: external sources of funds, 31/12/2003 (amounts in million Euros)
Source of funds Amount Percent percent of loans outstanding
National banks 3.48 47 21 European Investment Bank 2.00 27 12 Donor agencies 1.86 25 11 Total 7.34 99* 43*
15

* Error due to rounding National bank borrowings constitute 21 percent of loans outstanding, international banks (EIB) 12 percent, and donor agencies 11 percent, together 43 percent (Table 7). Between 2002 and 2003, national bank borrowings increased by 88 percent, similar to the rate of increase of the total portfolio, 85 percent, over the two-year period, 2001-2003. Historically, BNDA was the first bank approached by KJ, followed later by BIM. In 2002 BIM was the main national lender, with €1.04m (guaranteed by ADA/Luxemburg at a charge of 2.5 percent to KJ), compared to €0.81m from BNDA (guaranteed by AFD). In 2003 there were three national lenders: BNDA and BIM with almost equal amounts €1.40m and €1.38m, respectively; and €0.70 from the newly established BMS.32 Almost two-thirds of national borrowings (63 percent) in 2003 were credit lines of a similar magnitude from all three lenders; 22 percent were short-term borrowings (up to one year) from BNDA; 15 percent were medium-term borrowings from BIM (Table 8). The EIB loan, granted in August 2002, is a five-year loan at 6.5 percent interest, with the main purpose of refinancing seasonal input loans33 of 4-6 months, mainly for fertilizer. Between 2001 and 2002, it enabled KJ to almost double the volume of its input lending (from 12 percent to 22 percent). This loan represents a net expansion of the credit portfolio of KJ: deepening its services to its members rather than expanding outreach. At the same time, it involves a financial paradox: the largest long-term loan of KJ is mainly used for very short-term loans to clients. The funds provided by donor agencies are for special projects, either directed at special target groups, such as women in a particular region, or at particular purposes. In most cases they use KJ as an organization to implement their own objectives.34 Table 8: Kafo Jiginew: Donor credit funds and bank borrowings, 2002-03 (in million Euros)
32 KJ (2004a:10) also mentions relations with Bank of Africa (BOA) and Banque de Développement du Mali (BDM); but these do not appear in any of its statistics. 33 It also includes an agricultural equipment component. 34 To which extent this is a benefit or a burden to the network and its member-cooperatives would have to be the object of a separate assessment.
16
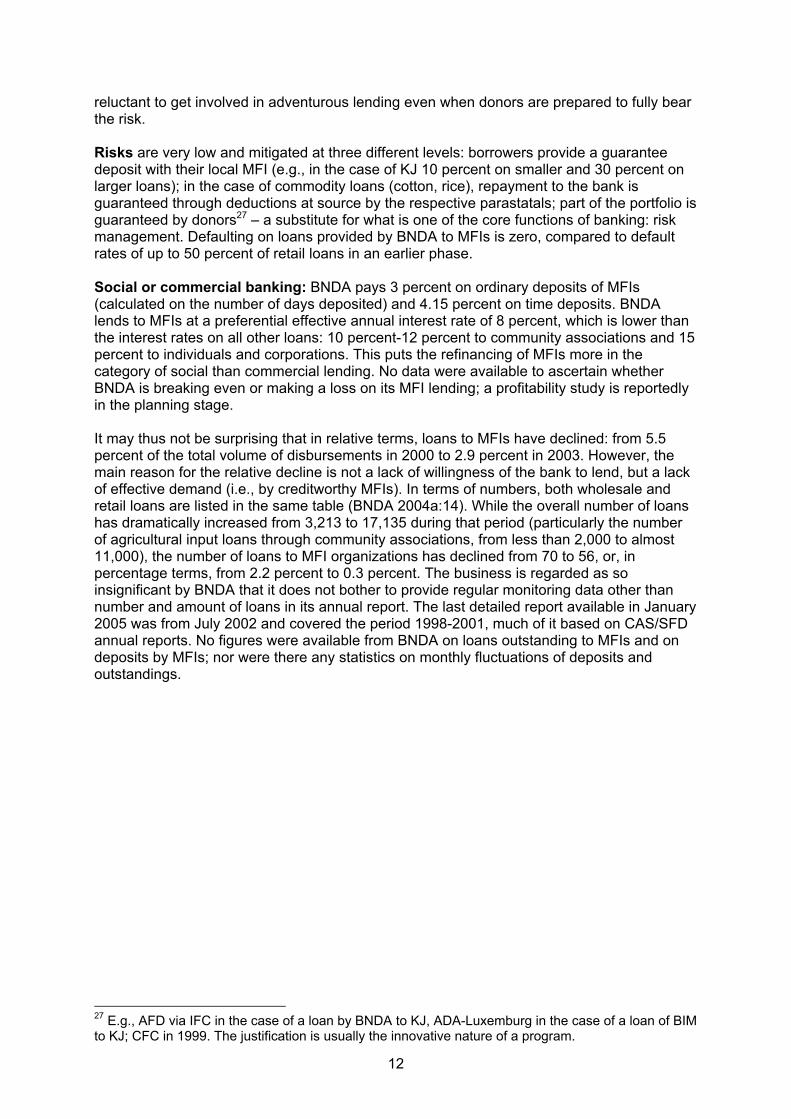
Bank 31/12 2002 31/12/2003(1) National banks:BNDA credit line 0.66 0.64BNDA short-term loan 0 0.76BNDA medium-term loan 0.15 0 Total borrowings from BNDA at 8% 0.81 1.4
BIM credit line 0.62 0.84BIM medium-term loan 0.42 0.53 Total borrowings from BIM at 8% 1.04 1.38BMS credit line 0 0.7 Total national banks 1.85 3.48(2) International banks:EIB medium-term loan at 6.5% 2 2 Total bank borrowings 3.85 5.48(3) Donor credit funds : SOS Faim Bruxelles at 0% 0.63 0.76SNV/PDCD 0.18 0.19FAO at 0% 0.05 0.05P/CIF 0.68 0.68ADA Luxemburg at 8% 0.03 0.03SYCREF at 5% 0.15 0.15 Total donor credit funds 1.71 1.86 Grand total 5.56 7.34
Kafo Jiginew’s financial strategy is explicitly geared to self-reliance: growth on the basis of deposits and own capital, which constituted 80 percent of loans outstanding as of December 2003, rather than bank borrowings. International funds are mainly used for special programs, with the exception of the EIB loan, which is being used to provide input loans to existing members. The main function of borrowing from national banks is liquidity balancing. 88 percent of KJ’s lending is short-term, i.e., less than one year (Table 6), with wide seasonal fluctuations as shown in Table 9. Cotton, the main commodity, is harvested during the first months of the year and sold in the following months; most loans are repaid towards the middle of the year, marking a low in loans outstanding. Planting is done towards the end of the year; the turn of the year thus marks a peak in loans outstanding. Year-end statistics, as they are commonly reported in annual reports, thus give a lop-side picture.35 While the overall number of borrowers with loans outstanding increase substantially from year-end to year-end (72 percent as of Dec. 2001, 35 percent as of 2002, 22 percent as of 2003), similarly the amounts of outstandings (55 percent, 48 percent and 25 percent, respectively), this hides substantial drops in the middle of the year. As of 30 June 2002 the number of borrowers is down by 48 percent compared to the preceding December, and in June 2003 by 36 percent; similarly, the amount of loans outstanding is down by 22 percent and 28 percent, respectively. In contrast, deposits of members peak in the middle of the year after harvest and are lowest around the turn of the year. The increases of deposits in December 2002 and 2003 over the preceding June are 59 percent and 21 percent, respectively, while changes in June of the preceding December are –14.8 percent and 3.3 percent, respectively. Thus, in December 2001, 2002 and 2003 loans outstanding exceeded deposits by 20 percent, 27 percent and 27 percent, respectively; while in June 2002 and 2003 they fell short by 62 percent and 23 percent, respectively. (Table 9; Graph 1)
35 Similarly, the PlaNet Rating study of 2003, with last data for June 2002, gives a contrasting lopsided picture. The semi-annual data reported in are taken from that study. Table 9
17

Table 9: Semi-annual fluctuations in client loans, deposits and liquidity balances, 2001-0336
Dec. 2000 Dec. 2001 June 2002 Dec. 2002 June 2003 Dec. 2003Number of borrowers 33,217 57,171 29,522 77,025 49,679 93,904% change over prev. Dec. 72.1 -48.4 34.7 -35.5 21.9% change over prev. 6 months -48.4 160.9 -35.5 89.0Loans outstanding in €m 5.84 9.03 7.08 13.39 9.62 16.69% change over prev. Dec. 54.5 -21.5 48.4 -28.1 24.6% change over prev. 6 months -21.5 89.0 -28.1 73.4Deposits of clients in €m 5.95 7.23 11.50 9.80 11.83 12.22% change over prev. Dec. 21.5 59.1 35.6 20.7 24.7% change over prev. 6 months 59.1 -14.8 20.7 3.3Excess of loans over dep. in €m -0.11 1.80 -4.42 3.59 -2.20 4.47Excess of loans over dep. in % -1.8 19.9 -62.4 26.8 -22.9 26.8Source: PlaNet Finance 2004
36 Discrepancies between Table 9 as reported by PlaNet Finance (2004) and
as reported by KJ (2004a) may be due to revisions by KJ. Table
18

Graph 1: Semi-annual fluctuations in client loans, deposits and liquidity balances, 2001-03
-5.00
0.00
5.00
10.00
15.00
20.00
Dec. 2000 Dec. 2001 June 2002 Dec. 2002 June 2003 Dec. 2003
Loans out st anding in €m
Deposit s of client s in €m
Excess of loans over dep. in €m How external resources contribute to liquidity balancing is shown in
19

Table 10. In 2003, the year is clearly divided in two parts in terms of loans outstanding: January to July, with a volume varying between €8.23 and €12.45 and a low in May; and August to December, varying between €16.69 and €18.48, with a peak in October and November; the highest monthly credit volume is €10.25m, or 125 percent, above the lowest. During the first part of the year when the harvest is sold, credit needs are significantly lower, and deposits increase over the period. During the second part of the year, which is planting and growing season, there is a high demand in loans and a drop in savings during September to November. In December where harvesting starts, the loan volume is still high but declining already; at the same time there is a jump in deposits. On the whole fluctuations in deposits are much less than those in loans; the highest monthly deposit balance is only €2.3m or 24 percent above the lowest, which is but a fraction of the credit differential. This shows that farmers prefer to do their own liquidity balancing mainly through loans and not through savings.37 Note should be taken that there are annual variations in this cycle up to two months. The variation in external borrowings follows the variation in loans outstanding with a time difference of 1-2 months. The lowest level of external borrowings is during the first part of the year, particularly March to July; the highest level is reached in December and January; the highest monthly volume of borrowings is €3.6m or 95 percent above the lowest, somewhat less than the differential in loans outstanding, indicating that a minor part of liquidity balancing is done from the network’s own resources. As external borrowings are largely medium-term funds, short-term liquidity balancing is mostly done from domestic bank borrowings, which are mainly credit lines and short-term loans. 38
37 This may look puzzling, but has a psychologically sound rationale, which is widespread among low-income people. “Our loans we pay back; if we withdraw our savings, we waste our money”, is a common explanation. 38 Monthly data are only reported for the total of external resources and not broken down by domestic and external borrowings.
20

Table 10: Kafo Jiginew, monthly variations in sources of funds, 2003 (in million Euros)
Source Jan Feb Mar Apr May Jun Jul Aug Sep Oct Nov DecInternal 11.72 12.10 12.03 12.86 12.30 12.52 12.62 12.55 11.62 10.81 11.96 13.32
Capital 1.02 1.03 1.04 1.06 1.08 1.10 1.13 1.15 1.16 1.16 1.19 1.19 Deposits 10.70 11.08 10.99 11.81 11.23 11.42 11.49 11.40 10.47 9.64 10.77 12.13
External 5.56 4.28 3.86 3.76 3.87 3.87 3.87 4.24 4.24 4.24 4.24 7.33Total funds 17.28 16.38 15.88 16.63 16.17 16.39 16.48 16.79 15.86 15.05 16.20 20.65Loans out'g 12.45 10.80 9.97 9.14 8.23 9.29 11.91 17.04 18.25 18.48 18.39 16.69 Non-financial transaction costs between KJ and its lenders are reportedly minimal. The domestic banks require documentation only at the time of negotiations. EIB demands monthly reporting, at little extra time. No changes in procedures were necessary. There are no constraints. Domestic vs. external resources. It appears that more domestic bank resources are offered than KJ is willing or able to accept. As BIM39 reports a lack of demand from the networks it has been financing and a willingness to expand its lending, it appears that donor funds, which were of crucial importance in the start-up phase of microfinance in Mali, might now be distorting financial markets to some extent. This is an issue which requires further study, all the more as BMS has entered the market as the new bank for MFIs and as a new regional solidarity bank (BRS), with a branch expected in Mali, is being established to serve the same market. In light of the intent of KJ to convert its central fund into bank, one may expect that there will be increasing competition and that the market for the commercial banks might be even more limited. One likely consequence is that the need for external liquidity will be greatly reduced. Will donors hear the message?
39 We have no such expression of intent from BNDA.
21

3. CVECA-Office du Niger: Bank linkages for financial deepening
3.1 The network The village banking system in Mali: CVECA-ON is one of six networks of so-called village banks (caisses villageoises) promoted by CIDR.40 Nationwide these comprise 276 units organized into 14 unions, with a total of 120,206 members (63 percent male, 35 percent female, 3 percent groups of mainly women). Ten unions belonging to the four older networks, self-managed and independent since 2001, are being refinanced by BNDA: eight with resources provided by donors: €1.68m by AFD to three unions of CVECA-ON, €1.52m to three unions of CVECA-Pays Dogon and €3.05m to two unions of CVECA-Kita/Bafoulabé by KfW; the two unions of Pasacoop-San/Djenné are refinanced by BNDA from its own resources with €1.42 (see Table 5). Credit lines comprise 45 percent of loans outstanding, 75 percent of deposits and 29 percent of total assets of the six networks; adding soft loans from donors, the respective percentages are 48 percent, 80 percent and 31 percent. External financings thus double the loan portfolio of the networks. A network of village banks in the interior Niger delta: CVECA-ON operates in the area of the Office du Niger (ON), a parastatal established in 1932 with the objective of irrigating 950,000 ha in an area called the interior Niger delta; only 60,000 ha have been actually developed. ON was nationalized in 1961 and restructured in 1984 and 1994; its activities are now confined to water and agricultural input management. Since 1970, cotton has been replaced by paddy, supplemented by sugar cane and vegetables. Its area of operation comprises 208 villages with 240,000 inhabitants, organized in 152 community associations and 205 interest groups. (MDR 2001:11-12, 5-6) There are three networks of MFIs in the area: CVECA-ON with its seat in Niono and 51 village banks, the Fédération des Caisses Rurales Mutualistes du Delta (FCRMD) with its seat in Niono and 54 cooperatives, and Nyésigiso with its seat in Bamako and a total of 49 cooperatives, 12 of these in the area of the Office du Niger. They all function in similar ways and have about the same average number of members per unit. Their target population are the inhabitants of the operational area of the Office du Niger, who are paddy and vegetable farmers. There is no competition between the networks, as they have divided the market among them, with one unit per village. In 1996 a credit information system (centrale des risques) was established in the area by CVECA, FCRMD and BNDA, where all borrowers and their repayment performance are to be registered; this worked well for several years, but is now experiencing operational difficulties. (Wonou & Biakité 2004:33) Origin and structure: CVECA-ON was established by CIDR as a project in 1994 when the Office du Niger was reorganized and divested of its credit function. Since 2001 it has operated on its own as an autonomous organization, without any foreign staff. It comprises three unions and 51 village banks (December 2003, reduced to 50 in 2004) with 26,290 members, 63 percent male, 35 percent female and 3 percent groups; both husband and wife may be members. Only 44 percent of the members are depositors, which mean that more than half the members do not maintain an active savings account. As the area is relatively monetized, this is interpreted as an indication of the difficulty of mobilizing savings in Mali (CVECA-On 2004:14). 38 percent of the members are borrowers. CVECA-ON is a network, not a federation, in the sense that, unlike the three unions, it has no legal status but comprises an area under a technical assistance office, Centre d’Appui au Réseau des
40 CIDR maintains an office in Bamako, which continues to provide technical assistance to the networks after they have attained financial autonomy.
22

Caisses d’Epargne et de Crédit (CAREC), financed the unions and village banks.41 CAREC has a technical staff of five, who provide capacity-building, accounting and supervisory services. Basic data: The network has consolidated total assets of €3,23m, a loan portfolio of €2.43m and bank deposits of €0.33m. Member deposits amount to €0.73m, capital and reserves to €0.86m and bank borrowings to €1.55m. The repayment rate in 2003 was 95 percent, return on assets was 1.25 percent (up from 0.37 percent in 2002). The portfolio-at-risk ratio (>1 month) increased from around 2 percent during 1999-2001 to 4.8 percent in 2002 and 12.4 percent in 2003. (Table ) Table 11: CVECA-ON: Basic data (amounts in million Euros)
2001 2002 2003 Number of cooperatives 51 51 51 Number of unions 3 3 3 Number of members 23,689 25,175 26,290 percent male percent female percent groups
35 32
63 35
3 Number of depositors 9416 11064 11529 Number of borrowers 8797 9233 10014 Total assets 3.09 3.23 Bank deposits 0.40 0.33 Net loans outstanding 2.08 2.28 2.43 Loans from internal funds in percent 42 43 43 Loans from external funds in percent 58 57 57 Percent agricultural 71 percent short-term loans 90 88 Deposits of clients 0.74 0.74 0.73 percent sight deposits percent term deposits percent other deposits
3166
3
28 70
2 Bank borrowings 1.44 1.55 Soft loans 0.04 0.04 Capital and reserves 0.85 0.86 Repayment rate in percent 96 Return on assets in percent 0.37 1.25 Portfolio at risk (>1 month) in percent
1.9 4.8 12.4
The average village bank has 515 members, €63,300 in assets, €47,650 in loans outstanding, €14,300 in member deposits, €16,900 in capital and reserves, and €30,400 in bank borrowings. However, performance of the village banks varies widely. Seven are loss making and are likely to be closed; one of them has already been closed in 2004. This has affected the three unions unevenly.42 CAREC functions as an effective supervisor: action is taken, remedial or terminal, when village banks are not performing well. In July 2003, the time of disbursement of new loans, five village banks were excluded from refinancing, which led to considerable tension.43
41 To cover the costs of CAREC the village banks have to pay € 550,000 p.a., or €1,1000 each. Currently there is a short-fall of around €3,000, which CAREC hopes to receive as a subsidy from AFD via BNDA. 42 PAR (>3 months) of the three unions is 3.9% in Macina, 5.9% in Kalari and 2.5% in Kouroumari. 43 Details are given in CVECA-ON 2004:5-8.
23

The agricultural cycle covers the period June to May: planting starts in June; October to December is harvest time; the produce is marketed during the following 4-5 months. The demand for credit fluctuates accordingly: starting in June it is high during the second half of the year and falling during the first half.
24

3.2 Linkages Linkage partners: BNDA is the only financier and corresponding bank of the CVECA-ON network. BNDA has backward linkages with AFD, which has provided the resources for a credit line of €1.68m in 2003 (Table 5), of which €1.39m were outstanding at the end of the year (Table ). The credit line ceiling constitutes 69 percent of the outstanding loan portfolio at year’s end; and 57 percent of the end-of-year outstandings are actually financed from external resources (BNDA and donors).
In terms of forward linkages with CVECA-ON, bank linkages comprise bank deposits and borrowings. They are in the hands of the three unions, which in turn act as financiers of the village banks. Consolidated reporting is done by CAREC as a technical assistance office for the three unions; there is no federation and no central fund at network level (Graph 2). Loan negotiations are held at the branch in Niono and involve little time and costs. Relations are considered very satisfactory. Graph 2: The organizational structure of CVECA-ON
cveca cvecacvecacvecacvecacvecacvecacvecacveca
CAREC (extermal service
provider)
Union du Kouroumari
Union du Kalari
Union du Macina
Financial products and interest rates: BNDA lends to the unions at 8 percent p.a.44 10 percent of the loan amount have to be deposited as a guarantee fund; there is no other collateral. The unions lend to the village banks at 10 percent. Interest rates vary between the village banks and are fixed annually by the general assembly. The village banks treat internal and borrowed funds separately, using different ledgers. Loans from internal resources (43 percent of the portfolio) are mainly used for small trade, horticulture and livestock; they carry interest rates of 20-25 percent. There are two types of loans refinanced by BNDA (57 percent of the portfolio in 2003): input loans at a flat rate of 12 percent p.a.,45 and loans for planting paddy at 20-25 percent. Penalties are stiff, at 1-3 percent per day overdue. The village banks and their members are aware of the source of funds of their respective loans and are very much concerned about repaying their bank-refinanced loans on time lest they loose their creditworthiness. New loans are reportedly issued only after full repayment. Repayment to BNDA is thus on time at 100 percent; the repayment problem is shifted to inside the network, as required by the logic of linkage banking. As the village banks and union do their job of repaying on time, so does BNDA with regard to disbursement: In contrast to the practice of
44 The market rate from commercial banks is estimated by CAREC at around 10-11%; but they are reportedly not yet willing to lend to MFIs. The CVECA networks are shareholders of BMS, which lends at 7%, but so far have remained loyal to BNDA. 45 Input loans by the village banks at 12% compete with those by the community associations (refinanced by BNDA) at 12.5%. According to CAREC, these are short-term loans of 4-6 months at a flat rate which create problems of liquidity management. They are not profitable and should be brought in line with the other interest rates; CAREC has suggested an interest rate of 18%.
25

agricultural development banks in many other countries, credit delivery by BNDA is reportedly on time. BNDA, through its branch in Niono, acts as the central fund for the village banks. Sight deposits are not remunerated. BNDA pays 3.5 percent on deposits withdrawable at any time. It does not offer term deposit accounts; with their higher interest rate, they would reduce the narrow margin of BNDA even further. There are reportedly plans to limit the amount that any individual or union may deposit in a remunerated account. The village banks offer three deposit products: unremunerated sight deposits, which are only safeguarded and not used as loanable funds; term deposits up to five years with interest rates of 5-10 percent depending on the duration; and ROSCA savings (dépôt à terme pari, DTP) 46 with interest rates of 3-5 percent depending on the duration. CAREC estimates the average cost of internal funds at 4.9 percent + 1 percent savings mobilisation costs, which is lower than the costs of borrowings from BNDA. Lending procedures: The preparation of a loan application involves the following steps: • The village bank members indicate their demands (regardless of source of funds) • These are checked and, if approved, processed by the credit committee • Joint liability forms are signed by the members • The committee, together with the cashier and the controller, decides which loans (for
diverse purposes) are to be financed from internal resources and which loans (for specific purposes, namely inputs and labor costs of planting rice seedlings) are to be financed from bank borrowings
• For loans from external resources, creditworthiness examinations and the preparations of documents are more thorough, which also has a positive effect on the examination of loans from internal resources
• For the bank borrowings, the committee prepares a loan request to the union; the whole process takes about two days
• The administrative council of the union analyses the requests and prepares its own request for a loan from BNDA; this takes about two days.
• The request together with the report on the loan examinations, the lists of the individual members and their indebtedness, and the financial standing of the village banks (defaults must not exceed 5 percent!) are checked by CAREC; this takes the involvement of two staff members for two days.
• The approved loan applications are submitted to the BNDA branch at Niono, together with a commission of €2.30 per union.
• The BNDA branch in Niono processes the applications and approves the loans In the case for cash loans, e.g., for labor involved in planting rice seedlings: • BNDA disburses in tranches to the account of each union. • From the union account, the sub-loans are automatically transferred to the sub-accounts
of the village banks at the BNDA branch. • The village banks credit the loans to the members’ accounts in the village bank. In the cases of input loans in kind: • Traders deliver the fertilizer to the village banks as distributors and obtain a signed
receipt, • which is cashed at the BNDA branch • and debited to the accounts of the unions and sub-accounts of the village banks. 46 Pari is the Bambara term for rotating savings and credit association or tontine, an indigenous informal financial institution. Traditionally, a pari is a system of regular standardized savings, with the total allocated to one member at a time in turn. One cycle usually covers as many time periods (e.g., days, weeks, months) as there are members; there is no interest payment. In the case of DTP, a person saves fixed amounts regularly in the village bank, mostly for a period of six months, after which he may withdraw the total, plus an interest margin. There are no doorstep services.
26

There are three functions of bank linkages of the CVECA-ON network:
The first is expansion of the portfolio; a second and minor function is liquidity balancing – the reverse of the order in Kafo
Jiginew. In 2004, onlending funds through the network as a wholesaler has been added as a
third function. Portfolio expansion: The village banks were reportedly established in the expectation of refinancing by BNDA; the very first ones obtained their loans only two months after their establishment:
“Sans le refinancement les caisses n’existeraient pas” (A. Cissé, CAREC). According to balance sheet data for 2003, borrowings from BNDA constitute 64 percent of loans outstanding, member deposits 30 percent. The loan portfolio is divided according to source of funds (not shown on the balance sheet): loans from external funds (BNDA) account for 57 percent, loans from internal funds for 43 percent. In 2004 the loan portfolio reportedly grew by 59 percent; 56 percent of the 2004 portfolio is refinanced by BNDA. Bank borrowings thus more than double the portfolio of the village banks. Savings reportedly do not suffice to finance the growing demand, despite the seasonal nature of the loans. Why do the farmers not save up-front every year when they sell their crop instead of borrowing and repaying after the harvest? Is it because of the absence of an emphasis on savings and of appropriate savings products? Most loans (88 percent in 2003) are short-term not exceeding one year. There is a shortage of funds for medium-term loans. CAREC is involved in negotiations with BNDA in Bamako for loans up to three years (e.g., for draft animals, carts, motor cultivators, rice hullers). Due to bad experience with three-year loans, BNDA is suggesting two years as a maximum period, a savings-for-credit product with a 24-months saving period followed by a 36-months loan period. Liquidity balancing: Bank deposits are a mere 21 percent of bank borrowings, compared to 44 percent in Kafo Jiginew, indicating the limited importance of liquidity balancing in CVECA-ON (December 2003). However, monthly data on bank deposits and borrowings were not available to demonstrate this in full detail. CVECA-ON as a wholesaler: In 2004 the gross loan portfolio grew by €1.5m from €2.6m to €4.1m. €0.9m of that amount are funds provided to CVECA-ON as a wholesaler to Fasojigi, an organization of paddy farmers in the area of the Office du Niger, assisted by the Cereal Marketing Assistance Program (PACCEM) and financed by the Canadian CIDA. The program has an ingenious structure, integrated into the village banking system: BNDA lends the resources to the three unions, which lend to 23 participating village banks These in turn led, in legal terms, to Fasojigi, but disburse the loans to the 2,212 members of Fasojigi, who may or may not be members of a village bank. Fasojigi, to be eligible as a borrower, becomes a member of each of the 23 village banks involved. Fasojigi guarantees the repayment and has deposited a guaranty fund of €91,500 in the unions. Institution-building in general and training of the staff of village banks and their unions was provided until 2001 by CIDR. Since then it is provided by CAREC and fully paid for by AFD through BNDA, without any local contribution. BNDA also finances the audits of CAREC, the unions and the village banks, implemented by a private auditing firm, as well as the preparation of a business plan. Guidance by CIDR continues to be available from its representative office in Bamako. A visit to the German Raiffeisen banking system has been supported by GTZ. Capacity building is thus a function of donor support, not of bank linkages.
27

Mutual benefits: There are three parties which have benefited from linkages. The managing director of CAREC, speaking on behalf of the village banks, concludes his assessment of bank linkages with the words: Our outreach is fully due to the availability of bank refinance! For BNDA a major advantage of working through the village banking network has been that, in contrast to former schemes of retail lending with their high default rates, the bank is now experiencing full repayment on time. At the same time, from the viewpoint of the target population, the new credit discipline is increasingly reaching marginal clients who would previously have defaulted on individual loans from BNDA and become unbankable. The three main effects of the refinancing linkage with BNDA are thus a substantial increase in overall outreach, satisfactory performance of the credit portfolio, and coverage of marginal clients. Yet, major challenges remain at the level of village banks.
28

Postscript: Why the striking difference? Remains one final issue: Why is that CVECA-ON links up with banks to expand its portfolio, while Kafo Jiginew uses bank funds just for liquidity balancing? And what is the impact of this difference in strategies on growth in terms of savings mobilization and loans outstanding? Both networks operate in comparable environments; there is not much difference in terms of total assets per individual member (€143 in Kafo Jiginew, €123 in CVECA-ON); and both have access to banks. Is it because of the initial and continual availability of ample donor credit lines in the first case, a tradition started by KfW in CVECA-Pays Dogon and continued by AFD in CVECA-ON, and a policy of self-reliance in the latter? Table 12: Bank borrowings and member deposits in Kafo Jiginew and CVECA-ON, 2003
Kafo Jiginew CVECA-ON Bank borrowings in percent of loans outstanding
33 57 (69)*
Depositors in percent of members 96 44 Deposits per MF unit in € 94,700 14,300 Deposits per member in € 74 28 Growth of client deposits, 2001-03, in percent 69 -1 Growth of loans outst’g, 2001-03, in percent 85 17 *57 percent in terms of loans outstanding at year’s end; 69 percent in terms of credit line ceiling. If so, this hypothesis might explain the difference in terms of propensity to save: virtually all members (96 percent) of the Kafo Jiginew cooperatives save, and they save significantly more (€74 per member) compared to the members of CVECA-ON, less than half of whom (44 percent) have a savings account, with average savings per member of just €28. Moreover, the Kafo Jiginew cooperatives are far more dynamic than the CVECA-ON village banks in terms of growth of client deposits during 2001-03 (69 percent vs. –1 percent) and loans outstanding (85 percent vs. 17 percent). A sequel to our first question is thus: Does donor generosity result in MFI complacency in terms of savings mobilization and in a slow-down of growth? This question warrants further research, perhaps in a dissertation. Chao-Béroff (2003:16-17), the spiritus rector of the village banks in Mali through CIDR, raises the issue by asking “Mobilizing Rural Savings to Reinforce the MFI or to Reinforce the Client?” She tentatively concludes that there is a “lack of incentive mechanisms and adapted products… the highest performing MFIs should be encouraged to develop and market (this type of savings). In rural areas, savings for productive self-financing has a future, especially as a financing mechanism for agricultural activities.” So, my question, and the related hypothesis, remains: why is it that the Kafo Jiginew cooperatives belong to the MFIs which have developed this type of savings, and the CVECA-ON village banks do not?
29

References Adler, M. 2001. Village Banks in Mali. D+C Development and Cooperation, 2001 (1):18-20. AFD – Agence Française de Développement. 2004. Rapport Annuel 2003. APIM – Association Professionnelle des Institutions de la Microfinance Mali. 2004. Rapport d’activités Oct. 2003 – Nov. 2004. APIM. 2003-2004. Kolon, Bulletin de la Microfinance. BIM - Banque Internationale pour le Mali. Selected statistics. BMS – Banque Malienne de Solidarité. 2005. Situation des emplois et des ressources au 31 Décembre 2004. BNDA – Banque Nationale de Développement Agricole du Mali. 2002. Revue et bilan des actions de la BNDA en faveur de la microfinance au Mali (1998-2001). BNDA. 2003. Rapport Annuel 2002. BNDA. 2004a. Rapport Annuel 2003. BNDA. 2004b. Octrois de crédit BNDA aux SFD, 1997-2003. Mission d’évaluation AfD/DEG. CAS/SFD – Cellule d’Appui et de Suivi des Systèmes Financiers Décentralisés. 2004. Rapport Annuel 2003. Chao-Béroff, R. 2003. Rural Savings Mobilization in West Africa : Guard Against Shocks or Build an Asset Base ? MicroBanking Bulletin, 2003 (July). CIDR – Centre International de Développement et de Recherche. 2004. Microfinance et Développement – Cellule Nationale de Diffusion et d’Appui des Systèmes Financiers Décentralisés au Mali. Note de présentation. Bamako CVECA-ON – Réseau des Caisses Villageoises d’Épargne et de Crédit Autogérées en Zone Office du Niger. 2004. Rapport Annuel d’Activités 2003. Fruman, C. & Seibel, H. D. 1995. Stratégie Nationale de Diffusion des Réseaux Financiers Décentralisés au Mali. Eschborn, GTZ. GECE – Groupement Européen des Caisses d’Epargne, avec la Caisse Nationale des Caisses d’Epargne, France. 2004. Evaluation du Plan d’Action National de la Micro Finance 1999-2002. Projet de Développement du Secteur Financier, Groupe Consultatif National pour la Microfinance, Ministère de l’Economie et des Finances. Bamako KJ – Kafo Jiginew. 2004a. Rapport Annuel 2003. KJ. 2004b. Etude de Rentabilité des Caisses de Kafo Jiginew 2003. KJ. 2004c. Rapport Annuel Inspection Générale 2003. KJ. 2004d. Rapport sur l’Exploitation 2003.
30

IMF – International Monetary Fund. 2003. Mali: Poverty Reduction Strategy Paper. Country Report 03/09 MDR – Ministère du Développement Rural. 2001. Le nouvel Office du Niger. Bamako, Éditions Jamana Planet Finance 2003. PlaNet Rating Kafo Jiginew. http://www.planetfinance.org/PlaNetFinance/FR+Language/Rating/Les+Ratings/RatingRealises.htm Republic of Mali. 2004. Report of the First Year of Implementation of the Poverty Reduction Strategic Paper (PRSP). Samassékou, S. 2000. Final Report of the Study on Intermediation between Banks and MFIs in Mali. Arlington VA, USA, Weidemann Associates Schneider, L. & Greathouse, G. 2004. Strategies for Financial Integration: Access to Commercial Debt. Occasional Paper. Women’s World Banking. Financial Products and Services Vol. 1 No. 1 Wonou, C. & Diakite, B. 2004. Plan de développement à moyen terme ddeess CCVVEECCAA OOffffiiccee dduu NNiiggeerr (( 22000044 –– 22000077 )).. NNiioonnoo,, CAREC – Centre d’appui au réseau d’épargne et de crédit
31