FOOD AND AGRICULTURAL RESEARCH COUNCIL P R O C ... - Mauritius
261
FOOD AND AGRICULTURAL RESEARCH COUNCIL P R O C E E D I N G S SECOND ANNUAL MEETING OF AGRICULTURAL SCIENTISTS REDUIT, MAURITIUS, 12-13 AUGUST 1997 March 1998
Transcript of FOOD AND AGRICULTURAL RESEARCH COUNCIL P R O C ... - Mauritius

FOOD AND AGRICULTURAL RESEARCH COUNCIL
P R O C E E D I N G S
SECOND ANNUAL MEETING OF
AGRICULTURAL SCIENTISTS
REDUIT, MAURITIUS, 12-13 AUGUST 1997
March 1998

P R O C E E D I N G S
Second Annual Meeting of Agricultural Scientists
Bonâme Hall, MSIRI
Réduit, Mauritius, 12 - 13 August 1997
Organised by
The Food and Agricultural Research Council (FARC)
in collaboration with
The Agricultural Research and Extension Unit (AREU)
The Agricultural Services, Ministry of Agriculture, Fisheries and Cooperatives (MOA)
The Faculties of Agriculture and Science, University of Mauritius (UOM)
The Mauritius Sugar Industry Research Institute (MSIRI)
Sponsored by
The World Bank
Edited by
J A Lalouette, D Y Bachraz, N Sukurdeep and B D Seebaluck
March 1998

SUGGESTED CITATION : Lalouette JA, Bachraz DY, Sukurdeep N and Seebaluck BD eds. 1998. Proceedings of the Second Annual Meeting of Agricultural Scientists, Réduit, Mauritius, 12 - 13 August 1997. Réduit, Mauritius : Food and Agricultural Research Council. © FARC 1998 ISBN


AMAS 1997. Food and Agricultural Research Council, Réduit, Mauritius v
Dedicated to the memory of Professor Robert Antoine (1920-1996) founding Executive Chairman of the
Food and Agricultural Research Council in 1985

AMAS 1997. Food and Agricultural Research Council, Réduit, Mauritius vi
PARTICIPATING INSTITUTIONS 1997 Agricultural Research and Extension Unit (AREU) Réduit Mauritius Telephone ( 230 ) 464 4876 Fax ( 230 ) 464 8809 e-mail [email protected] The Agricultural Research and Extension Unit functions under the aegis of the Food and Agricultural Research Council as from July 1995. The main objective of AREU is to serve its clients through excellence in cost-effective high quality research and extension and to meet the policy requirements of government. AREU has responsibility for livestock and all crops excluding sugarcane. Agricultural Services, Ministry of Agriculture, Fisheries and Cooperatives (MOA) Réduit Mauritius Telephone ( 230 ) 454 1018 Fax ( 230 ) 464 8749 The Agricultural Services of the Ministry of Agriculture, Fisheries and Co-operatives started life as the Department of Agriculture in 1913 itself taking over from the Station Agronomique created in 1893. It is the regulatory body of the Ministry and provides a number of services to the agricultural community. Food and Agricultural Research Council (FARC) Réduit Mauritius Telephone ( 230 ) 465 1011 Fax ( 230 ) 465 3344 e-mail [email protected] The Food and Agricultural Research Council was created in 1985. Its main objective is to promote, harmonise and co-ordinate research activities in agriculture, fisheries, forestry and food production in line with government policy and to ensure that the farming community draws the maximum benefits from such research. Mauritius Sugar Industry Research Institute (MSIRI) Réduit Mauritius Telephone ( 230 ) 454 1061 Fax ( 230 ) 454 1971 e-mail [email protected] The Mauritius Sugar Industry Research Institute is a statutory body created in 1953 with mandate to promote by means of research and investigation the technical progress of the sugar industry. It also carries out research on foodcrops that are grown in association with sugarcane. University of Mauritius (UOM) Réduit Mauritius Telephone ( 230 ) 454 1041 Fax ( 230 ) 454 9642 e-mail [email protected] The University of Mauritius was founded in 1965. While training remains one of its important mandates, it also focuses on research in diverse areas which include agriculture and allied subjects.

AMAS 1997. Food and Agricultural Research Council, Réduit, Mauritius vii
TABLE OF CONTENTS 1997 Page No
Dedication v Participating Institutions vi Foreword ix Opening Session
• Welcoming address by Alain Noël, G.O.S.K, C.B.E Chairman FARC x • Address by Dr The Honourable Arvin Boolell Minister of Agriculture Fisheries and
Cooperatives xi
• Keynote address by Professor Sir Colin Spedding, C.B.E xiii
Session 1 - Presentation by Mauritius Sugar Industry Research Institute Session Chairman - Professor Sir Colin Spedding
• Is nitrogen fertilisation of sugar cane harming our atmosphere? M A Bholah and K F Ng Kee Kwong.
1
• Development of centre pivot irrigation systems in Mauritius M Teeluck 7 • Preliminary studies on entomopathogens associated with sugar cane pests in Mauritius
N Behary Paray and A Rajabalee 15
• Prospects for sweetcorn in Mauritius K Rummun and N Govinden 21 • Geographic information system - a tool for small cane growers of Mauritius
M Chung, G Pillay, R Domaingue and I Jhoty 27
• Review of socio-economic studies undertaken to improve the productivity of small- sugarcane planters in Mauritius V Toory and J A Tonta
35
Session 2 - Presentation by University of Mauritius Session Chairman - Dr. J C Autrey
• A prototype information system for the agricultural community of Mauritius K J Bheenick
43
• The importance of the filière approach in mauritian agricultural policy K Mundil 51 • Effectiveness of irrigation in Mauritius V Proag 61 • Climate change and agriculture - Microclimatic considerations S D D V Rughooputh 73
Session 3 - Presentation by University of Mauritius Session Chairman - Mr. S N Naidu
• Substances naturelles actives: La flore mauricienne, une source d’approvisionnement potentielle T Bahorun
83
• Recent advances in aquaculture in Mauritius M Bhikajee 95 • Integrated pest management of Plutella xylostella, an important pest of crucifers in
Mauritius S Facknath 103
• Agricultural polymers D Jhurry 109 • Phosphorus fixation as influenced by soil characteristics of some mauritian soils B
Lalljee 115
Session 4 - Presentation by Agricultural Research and Extension Unit/

AMAS 1997. Food and Agricultural Research Council, Réduit, Mauritius viii
Agricultural Services, Ministry of Agriculture Session Chairman - Professor J Manrakhan • Pasture production profile of three grass species and their implications for
supplementary feeding of the mauritian deer (Cervus timorensis russa) M Bheekee, R K Ramnauth, P Dobee and A A Boodoo
123
• An assessment of the reproductive performance of small-holders’ dairy cows using the milk progesterone radio immunoassay technique K Boodhoo, P Toolsee, M Mooneeramsing, M Rangasamy and A A Boodoo
131
• Litter management: the use of bagasse as a potential source of litter material for poultry production N Davasgaium and A A Boodoo
139
• The pig industry in Mauritius and the role of Government in its development - A proposed genetic improvement program K L Yee Tong Wah
147
Session 5 - Presentation by Agricultural Research and Extension Unit Session Chairman - Professor A Osman
• Selection of onion cultivars for yield, early maturity and storage potential in Mauritius R Rajcumar
153
• Performance testing of some flue cured tobacco varieties in recent years P Hanoomanjee 161 • The current status of research on litchi (Litchi chinensis, Sonn.) in Mauritius N
Ramburn 167
• Comparison of production systems and varietal evaluation of strawberry S Lutchoomun and C L Cangy
175
Session 6 - Presentation by Agricultural Research and Extension Unit/ Agricultural Services, Ministry of Agriculture Session Chairman - Dr. G M Lallmohamed
• Integrated control of Plutella xylostella (L) (Lepidoptera: Yponomeutidae) in Mauritius C Dunahoor and D Abeeluck
181
• The Mycosphaerella leaf disease complex (MLDC) of banana in Mauritius S Soomary and S P Benimadhu
189
• Studies on bacterial wilt caused by Ralstonia solanacearum syn. Burkholderia solanacearum syn Pseudomonas solanacearum on Anthurium andreanum : an overview K Banymandhub- Munbodh
195
• An area wide control of fruit flies in Mauritius S Permalloo, S I Seewooruthun, A Joomye, A R Soonnoo, B Gungah, L Unmole and R Boodram
203
• An attempt at the eradication of the oriental fruit fly, Bactrocera dorsalis (Hendel) S I Seewooruthun, P Sookar, S Permalloo, A Joomye, M Alleck, B Gungah and A R Soonnoo,
211
• Estimation of soil erodibility and erosivity of rainfall patterns in Mauritius M A Attawoo and J M Heerasing
219
• The effect of temperature on curd initiation in cauliflower D Nowbuth 225 Author and Subject Index 233

AMAS 1997. Food and Agricultural Research Council, Réduit, Mauritius ix
FOREWORD 1997
This second Annual Meeting of Agricultural Scientists of Mauritius, organised as part of the World Bank assisted Agricultural Management Services Project, is dedicated to the late Professor Robert Antoine, founding Executive Chairman of the Food and Agricultural Research Council; his contagious enthusiasm and dedication will always be remembered by those who had the privilege to come in contact with him.
It was decided at the start to encourage the younger scientists from the four institutions at Réduit namely the Agricultural Research and Extension Unit, the Agricultural Services of the Ministry, the Sugar Industry Research Institute and the University to present papers at this meeting. As a result thirty papers were received and they were all accepted; these papers are published in the proceedings.
We are most grateful to the staff of FARC and to all those who in one way or another have contributed to the success of the meeting.
Jean Alain LalouetteJean Alain Lalouette Director General

AMAS 1997. Food and Agricultural Research Council, Réduit, Mauritius x
WELCOMING ADDRESS 1997
Alain Noël G.O.S.K., C.B.E Chairman FARC
Honourable Minister of Agriculture, Fisheries and Cooperatives Honourable Members of the National Assembly Excellencies of the Diplomatic Corps Professor Sir Colin Spedding Permanent Secretary, Ministry of Agriculture, Fisheries and Cooperatives Distinguished guests Fellow Scientists I have the honour and pleasure as Chairman of the Food and Agricultural Research Council (FARC) to welcome you to our second Annual Meeting of Agricultural Scientists (AMAS). You will recall that the first meeting was held in June 1995 under the chairmanship of the founder of the Food and Agricultural Research Council, the late Professor Robert Antoine. I would call upon you to observe one minute of silence in his memory. Thank you, Ladies and Gentlemen This meeting is being organised by the FARC in collaboration with the Agricultural Research and Extension Unit, the Mauritius Sugar Industry Research Institute, the Faculties of Agriculture and Science of the University of Mauritius and the Agricultural Services of the Ministry of Agriculture, as part of the initiatives under the World Bank assisted Agricultural Management Services Project. The main objective of AMAS is to provide opportunities for research organisations to present the highlights of ongoing or completed research projects and to give to the younger scientists the possibility to experience their baptême de feu. Thirty papers will be presented during these two days on a wide range of subjects. I have no doubt that this will help all those concerned in their efforts to continue the harmonious development of agriculture in our country. I would like to express my heartfelt thanks to the organising committee who have spared no efforts to make this annual meeting of agricultural scientists a success. A very special word of thanks to Professor Sir Colin Spedding for having so spontaneously accepted to spare his time in spite of his so many responsibilities to deliver the Professor Antoine Memorial Lecture. Before ending, I should like to thank you all ladies and gentlemen for your presence this morning.

AMAS 1997. Food and Agricultural Research Council, Réduit, Mauritius xi
MINISTER’S ADDRESS 1997
Dr. The Honourable Arvin Boolell Minister of Agriculture, Fisheries and Cooperatives
It is my pleasure to be present at the opening of this year’s meeting of agricultural scientists. I would like to extend a special word of welcome to the distinguished resource persons who are attending this meeting. If the main stakeholders in the field of agricultural research are gathered here today, it is mainly with the purpose of finding solutions to the numerous issues that currently face the agricultural sector. The future of our agricultural diversification policy depends to a large extent on the capability of our research organisations to respond to the changing needs of a highly competitive international economic environment. A well defined research policy is vital in a country which has limited land resources, whose agriculture is highly vulnerable to climatic conditions, and which has a large community of agricultural entrepreneurs to whom quality, efficiency and productivity still remain distant concepts. In the sugar sector, the country has the commitment to produce and supply its allocated quota of sugar. In the non sugar sector, the export potential still needs to be explored adequately; the regional cooperation framework and specially the opportunities offered by Mozambique open new avenues for entrepreneurs. As regards livestock, a greater effort towards quality and efficiency and better utilisation of subsidies and incentives is required. At the crop production level, there is room for improvement, with a more rational seed production policy and with the better utilisation of our limited land resources. In fact, the Central Statistics Office data on agriculture indicate that as far as area harvested and net food crops production are concerned, there has been a net decrease of 3.9% from 6769 hectares in 1995 to 6504 hectares in 1996 and 8.1%, from 97 533 tons to 89 629 tons in 1996 respectively. Production of pineapple fell by 29% and that of tomato by 19%. The production of subsidised products such as potato fell by 32.3% while maize production has declined to very low levels. The World Bank has expressed concern on various aspects of agricultural research, in particular the delay which has been accumulated over the years as regards the non sugar sector. There is a need to redirect our strategy towards more semi industrial on farm research, the development of new varieties and the proper dissemination of research findings. We have noted that in cases where planters are willing to innovate and improve, the research and extension back up is often inadequate and unable to provide the necessary guidance. In order to address these issues effectively, we are reviewing our decisions and strategies. A new Bill for the Food and Agricultural Research Council (FARC) has been approved and will be debated in the National Assembly. It will enable FARC to create operational units which would conduct research and extension activities in our non sugar sector. Consultancy is being sought for the preparation of necessary legislation for the protection of intellectual property in the field of agricultural research. The teething problems of the Agricultural Research and Extension Unit (AREU) have been almost settled now after negotiations with the unions and agreement has been reached on the incentives for employees of the ministry joining FARC. A Director has been appointed at FARC, which will give the required emphasis to setting priorities for research. There is no longer any reason why our research strategy should fail in its objectives. My ministry has also engaged into the exercise of preparing a master plan for agriculture, which would define the strategy for agricultural development up to the year 2010. All parties in the sector have been invited to participate in the exercise by sending their suggestions and proposals.

AMAS 1997. Food and Agricultural Research Council, Réduit, Mauritius xii
An Agricultural Development Incentives Act is being prepared to encourage agricultural development and the rationalisation of subsidies is being examined in order to ensure that they benefit planters directly rather than consumers and intermediaries. The importation and the price of potato will be liberalised as from 1 January 1998 and Government is committed to provide necessary incentives to increase local seed production. My ministry is equally considering schemes which would help planters to mechanise and professionalise their activities. However there is no doubt, that positive reforms in the sector can be achieved only if research organisations are able to provide the necessary support. This is indeed the right time for research scientists to think about ways and means of ensuring that our research structure is geared to face the new economic challenges, to break away from the conventional, to adopt a more outward looking and innovative approach, to direct research towards quality and productivity improvement, to reduce our sometimes excessive dependence on foreign sources, to ensure more rational and efficient land management, and on the whole to support the country’s growth. I would like to conclude with these thoughts which I hope will incite more reflections by the stakeholders. I wish that this meeting provides, as usual, the appropriate forum for constructive deliberations. I have now the pleasure to declare this meeting open

AMAS 1997. Food and Agricultural Research Council, Réduit, Mauritius xiii
PROFESSOR ANTOINE MEMORIAL LECTURE KEYNOTE ADDRESS 1997
SUSTAINABLE AGRICULTURE IN DEVELOPED AND DEVELOPING COUNTRIES IN THE FUTURE
Professor Sir Colin Spedding C.B.E.
University of Reading
The title suggests a large and complex subject but also one that is likely to concern us all in the future. I hope that it would have appealed to Robert Antoine, whose life’s work this Lecture commemorates, because, although he made an enormous contribution to the island of Mauritius, his interests and service to science and agriculture encompassed a much wider canvas. It is increasingly necessary for all of us to take a wide view, often global, because of the powerful interactions between one part of the world and another. But this often leads to rather simplistic generalisations and I have come to the conclusion that the greatest need is for clarity of thought in dealing with the important underlying concepts. Sustainability is currently the foremost example of this need. THE CONCEPT OF SUSTAINABILITY Sustainability has been defined in so many ways (Conway and Barbier 1990; Daly 1991; Crosson 1992; Riley 1992; Holdgate 1993; Spedding 1995), generally to suit the purpose of those defining it, that it would be easy to conclude that it has no useful meaning. But it is now in such widespread use that it cannot simply be abandoned. Furthermore, it does actually represent a strong and developing belief that we cannot continue to operate on such a short-term basis with little regard to the longer-term consequences or the burden placed on future generations. It is therefore incumbent on us to examine what the word could usefully mean. First, however, one must recognise that many powerful concepts are in the same category (e.g. freedom, truth, beauty): they have a generally understood meaning but can only be defined for particular circumstances. Clearly, they can also be misused - and that is what is happening to “sustainability”. The term is being used to describe programmes and proposals with a view to increasing the chances of funding, on the grounds that sustainable necessarily equates to good. It clearly does not. Any dispassionate view of the world will demonstrate that poverty and cruelty are perfectly sustainable, as are deserts. This does not make them good. For many things, sustainability is desirable, even essential, but it is never enough, by itself. In other disciplines, the idea of “necessary but not sufficient” is well established: in agriculture it appears to be unused. It is the same for breathing and human life: it is absolutely necessary but no-one would settle for just that - even though vital, it is not what life is about.

AMAS 1997. Food and Agricultural Research Council, Réduit, Mauritius xiv
So what can sustainability usefully mean? In common sense terms, it implies that an activity can be continued, if not indefinitely, at least for a very long time without giving rise to undesirable consequences (though “undesirable” is somewhat subjective). There are broadly four kinds of sustainability: (a) Physical (b) Biological (c) Economic (d) Social The first two are susceptible to objective scientific evaluation; the others are not. (a) Physical Sustainability A process or activity is sustainable if it will not run out of the resources needed and will not
give rise to unacceptable levels of pollution. “Unacceptable” is also subjective but some levels of pollution will actually render the process inoperable. Before taking too dogmatic a view of all this, note that a baby is not sustainable and nor is running. This illustrates the fact that, in a vast number of cases, sustainability is neither necessary nor even relevant.
When people talk of resource use, there is now a tendency to say that resources should be
renewable. The sun, of course, on which virtually all life on earth depends, is not. Nor does there seem to be any obvious merit in leaving a resource totally unused. For
example, if it is right for us to leave coal, oil and gas in the ground, it will be right for our successors. Thus the resource will never be used, and indeed, it cannot then be regarded as a resource at all.
Clearly, the crucial questions concern the rate of use, in relation to how long it will last and
how much pollution is caused by using it, and what it is used for. It may well be used to move society to a state of independence of that resource - as, in many
countries, wood gave way to coal, then coal to oil and oil to gas, each making it possible to make the means of exploiting its successor.
(b) Biological Sustainability Since individual organisms are not “sustainable”, biological sustainability can only mean the
continued existence of species or habitats, generally in combination. Evolution, of course, is based on the development of new species and the loss of established ones.
Current concerns focus on the apparently accelerating rate of loss and the need to retain
species that may offer useful genetic material or uniquely valuable properties, even if they are evolutionarily unsuccessful in the world we have created.
Before proceeding to examine (c) and (d), it may be helpful to recognise why they are on the
agenda. One of the most commonly quoted definitions of sustainability is that derived from the
Brundtland (1987) Report: “Sustainable development that meets the needs of the present without compromising the
ability of future generations to meet their own needs”.

AMAS 1997. Food and Agricultural Research Council, Réduit, Mauritius xv
Note that the use of the term “development” shows a recognition that we are not just concerned with preserving the present. Inherent in the Brundtland version are two key concepts:
1. The concept of needs, in particular the essential needs of the world’s poor, to which
overriding priority should be given, and 2. The idea of limitations imposed by the state of technology and social organisation on
the environment’s ability to meet present and future needs. But all this involves speculation about the future, and who judges needs? (c) Economic Sustainability This either means the sensible use of resources (which is what economics is really about), in
which case it is the same as physical sustainability, or it refers to their profitable use. However, future profit cannot be predicted since it depends upon wholly unforeseeable costs and prices. In any case, if “profitability” is what is meant, why not say so? It is much clearer than referring to “economic sustainability”.
(d) Social Sustainability This really has nothing to do with any objective measure of sustainability but reflects people’s
concerns that whatever systems we operate should respect certain social standards. These include the way people are treated and rewarded, especially those who are employed or immediately affected by the systems operated.
But, of course, what are acceptable standards depends on who you are, and this varies with
country and culture as well as personal morality. There are no absolute standards across the world and there is no short-term possibility of agreeing such standards.
We are therefore talking about “acceptability” or “desirability” and it would be better, as with
economics and profitability, to say so. Nothing is gained by calling it “social sustainability” and clarity is lost. However, we need also to recognise why the term is seen as relevant. It is because of a belief that, if people are not treated properly within a system of agriculture or (anything else), ultimately that system will not (or should not) be tolerated. It reflects a belief that, eventually, “unacceptable” systems will not be accepted / allowed and will therefore be unsustainable.
So what can we usefully mean by a sustainable agricultural system? AGRICULTURAL SYSTEMS We need to take a much wider view of agricultural systems (see Spedding, 1994) than has been customary. The system as seen and operated by the farmer is that bounded, approximately, by his own boundary fence: the contribution of agriculture to the so-called “greenhouse gases” involved in enhanced global warming, illustrates how this view is now far too limited. It is necessary to consider the major interactions between (a) the farming system and the environment more generally, (b) the economic framework within which the farm operates (which now includes important international trade agreements) and (c) the people affected, including, but not exclusively,

AMAS 1997. Food and Agricultural Research Council, Réduit, Mauritius xvi
consumers. This means, as a first step, taking into account all the inputs (and not just those paid for and under the control of the farmer) and all the outputs (and not just those products for which the system is operated). The main inputs of concern are listed in Table 1. In developed countries, public concern is focused on what is seen as excessive use of (and dependence on) support energy (i.e. fossil fuels), fertiliser, water and agrochemicals. In developing countries, by contrast, the worries are often focused on low inputs of these elements and excessive use of land and labour.
Table 1 Inputs of concern in sustainable animal production systems (from Spedding, 1995)
Input Use Alternatives
Support energy
Fertiliser manufacture Cultivation of soil Feed production and processing Transport of animals, feed and products
Biological nitrogen fixation Minimal cultivation systems Grazing for ruminants Avoidance of markets Slaughter near farm
Land Capture of solar radiation Feed from micro-organisms
Labour Skills Power
Electronics Animals
Fertiliser Raise levels of plant nutrients in soil
Biological nitrogen fixation
Water
Drinking Irrigation of crops Cooling (of animals or buildings)
Water-conserving species Drought-resistant crops Heat-tolerant spp
Agrochemicals Pest, weed and disease control Biological control Capital Investment Own efforts (DIY)
In general (and this is, of course, too sweeping a view), “sustainability” is seen as requiring reduced use of the inputs mentioned in developed countries and increased inputs of capital, agrochemicals, fertiliser and support energy in developing countries. This illustrates a real danger of oversimplifying debates on sustainability. It is sometimes argued that sustainable systems must mean a great reduction in the input of non-renewable resources. As already pointed out, this would include solar radiation, which nobody really intends, but there are behind this argument notions about dependency on inputs that might run out, as well as concerns about pollution arising from their use. The labour of individuals is non-renewable also: if work is not done today, the energy is not magically stored up for some future time. If fertilisers are not used, soil fertility may remain at a low level and recycling can only operate on the level that exists. Fertiliser inputs could be used to raise the fertility base in developing country soils, on which self-sufficient systems could then operate, without resulting in dependency. Fertilisers also provide a good example of the ways in which inputs can interact. For example, an increase in the fertiliser input to a crop usually makes it possible to use more of the incident solar radiation, so that the efficiency with which solar radiation is used goes up, even though the efficiency of support energy use (mainly because of the high cost of energy in the manufacture of fertilisers) decreases. The problems are how to reduce inputs in developed countries without catastrophic reductions in yield and productivity, and how to increase inputs in developing countries economically without the undesirable consequences to the environment, such as pollution. The main concerns about outputs are illustrated in Table 2.

AMAS 1997. Food and Agricultural Research Council, Réduit, Mauritius xvii
Table 2 Main outputs of concern (from Spedding, 1995)
Output Potential Problem
Main Product - milk, meat, breeding stock Overproduction - Food safety By-products - hides, fibre, offal, bone, culled animals Pollution from processing Excreta - Faeces Urine Slurry
N03 leaching Smell Raised B.O.D. in rivers
Gases - C02 - Methane Enhanced global warming Fertiliser nitrogen Leaching of N03 into water courses Excess agrochemicals Impact on the environment (flora and fauna) Dead and diseased stock Pollution, disease spread Most of these specifically relate to developed countries but developing countries should also be more concerned about food safety, pollution of water courses, global warming and the spread of diseases. In addition to the worries about inputs and outputs, there is concern, especially in developed countries, about the methods and processes used (see Table 3). This can easily reach the point where consumers may refuse to purchase products derived from methods or processes that they find unacceptable. These concerns develop with economic and social development and are most acute in the wealthier countries. It must be expected, however, that they will follow development in developing countries and, even before that, may affect willingness on the part of developed countries to import from developing countries. These concerns are expressed and effective at the point of sale more than at the point of production. These areas illustrate very clearly the ways in which “acceptability” will vary with both country and culture: but trade is increasingly international.
Table 3 Concerns about Methods / Processes (from Spedding, 1995)
Methods / Processes Purpose Objection
Intensive methods of keeping feeding
Production / performance Production / performance
‘Forced’ rate of performance Poor welfare
Mutilation (castrating, tailing beak trimming)
Control of breeding, fly-strike feather pecking and cannibalism
Suffering caused
Use of drugs
Avoidance and control of pests and diseases
Impact on environment (fauna and flora) Impact on human medicine
Intensive housing Intensive penning
Shelter / control Control / restraint efficient use of space
Restriction of basic behavioural patterns
Slaughter Transport Markets
Humane killing Movement of stock Sale of stock
Suffering caused
Processes involving gene transfer genetic modification hormone injection
Improvement of performance Resistance to disease Improvement of performance
We can now attempt to summarise the desirable attributes of future agricultural systems, wherever they are. This is done in Table 4.

AMAS 1997. Food and Agricultural Research Council, Réduit, Mauritius xviii
Table 4 Essential attributes of future agricultural systems(based on Spedding, 1996)
1. They should be highly productive, of safe, high quality products (within identified constraints, such as those listed below); 2. They should be physically sustainable (i.e. use physical resources at rates or in ways which allow adequate long-term development); 3. They should be biologically sustainable (i.e. the biological organisms and processes on which they depend must be sustainable in the long term); 4. They should satisfy agreed standards for human and animal welfare; 5. They must not give rise to unacceptable pollution, by-products or effects (including visual). This could encompass the avoidance of “internal” pollution, such as the build-up of heavy metals; 6. They must not have an undesirable impact on the natural environment, especially in relation to biodiversity and the health of the wild flora and fauna; 7. They must be profitable (since they will not be practised if they are not) - this also assumes that the products are wanted (otherwise there will be no demand and the business will collapse)
The attributes shown are very briefly stated but need to be expanded for any particular situation. Point 1 does not mention food processing, for example, whether carried out in a sophisticated food industry, or in the home or in catering establishments and institutions. Much that happens post-harvest has a considerable effect on food safety and quality: this includes transport, storage, processing and cooking. Point 2 illustrates the differences that occur between sites. For example, in some parts of the world soil erosion might be the main risk to physical sustainability. Point 3 includes the build-up of pests, the disturbance of essential biological balances and the elimination of soil organisms that occur in soils receiving very large inputs of artificial fertiliser, herbicides and pesticides. Point 4 clearly has to be related to the country and culture obtaining. Ultimately, common standards of both human and animal welfare may be agreed worldwide but we are far from this situation at the present time. As already mentioned, however, such concerns are increasingly global and international trade means that the acceptability to the consumer or purchaser of products may affect production in areas with quite different standards. Point 5 may be highly site-specific. The accumulation of heavy metals could occur anywhere as a result of applications of fertiliser but local sources of pollution and the siting of industry will be of greater importance in other areas. Irrigated areas may become salinated, areas near roads can become contaminated by lead or salt, but distant pollution can occur by deposition of sulphur or acid rain produced a long way away. Point 6 varies in importance with the part of the world considered but so do the problems. Elephants and tigers pose wildlife problems of a different order compared to the elimination of song-birds or butterflies.

AMAS 1997. Food and Agricultural Research Council, Réduit, Mauritius xix
Point 7 conceals the meaning of profitability in different situations. In subsistence economies, no money may be involved but it is still the case that the returns of effort must be greater than the effort. (This is even true for hunting for food: there is no point in expending more energy in catching the food than is obtained from eating it!) Some products or assets do not have monetary values. Livestock, in many developing countries have a value in ceremonial or religious terms and some may serve as a store (or a mark) of wealth. There is a real danger that the sustainability or unsustainability of a system or practice may be judged simply by one of these criteria. The issue is rarely as simple as this and sweeping generalisations are not helpful. Consider, for example, monoculture. MONOCULTURE This is often dismissed as “bad” because it is unsustainable - a proposition that is treated as though it was self-evident. This may seem strange in Mauritius! Even the dictionary definition allows that it may refer to the cultivation of one crop only, over a long time or a large area. But you will rarely hear this used as a basis for criticising permanent pasture, which may well be dominated by a single species and is intended to cover large areas almost indefinitely. So what is one crop? Does it mean one species, or one variety? Would cereal growing cease to be monocropping if it involved a succession of varieties? Whatever the features of monoculture that are, or appear to be, objectionable, clearly the same concept applies to animal production. Now, monoculture is, of course, practised for a reason, so it clearly has some advantages as well. It follows that any assessment must involve a balance of advantages and disadvantages: the usual criticism is that most assessments are short-term and that the advantages are in this category whilst the disadvantages are only seen in the long term. Some of the advantages are illustrated in Table 5 and the disadvantages in Table 6. These are generalised, because this is what is needed in thinking about the concept as applied to specific examples. When one does focus on specifics, the complexity becomes obvious and the sheer variety of examples has to be recognised. For instance, monocropping on a small area is the same in principle as on a large area - but some of the problems may be different. The area could be a field within an otherwise mixed farm (a particular field always being used for the same purpose - e.g. growing rushes - because of its soil type, pH, water content, aspect, frost or other susceptibility etc.) or most of a country (e.g. sugar cane in Mauritius) because of trade requirements, port facilities, vulnerability to cyclones or hurricanes and a host of other features. Relative profitability is a major determinant of what is grown where, and this, too, is an element to be taken into account in assessing sustainability. In the UK, this has commonly governed the choice of crop but, equally, the choice of animal production system (e.g. milk production). The same would be so for lamb production in New Zealand and cereal production in vast areas of North America and Eastern Europe. In thinking about all this, it has to be remembered that one of the main purposes of agriculture is to feed the people of the world, against a background that includes two stark propositions:

AMAS 1997. Food and Agricultural Research Council, Réduit, Mauritius xx
1. Millions are currently starving or inadequately fed and 2. World population is increasing very rapidly.
Table 5 Some advantages of monoculture
1. Optimum matching of needs of the production system to the natural attributes of the area. 2. Economies of scale: the same skills, equipment and infrastructure (storage facilities, workshops, transport) are applied on a large scale, thus minimising overheads per unit of production. 3. Volume and continuity of supply allow long-term marketing arrangements to be made, leading to a more reliable outlet for products. 4. Ease of operating machinery, for cultivations, treatments and harvesting. 5. Increased productivity and profitability, derived from 1-4.
Table 6 Some disadvantages of monoculture
1. Vulnerability of whole enterprise simultaneously to adverse changes in climate, including the economic climate (especially costs, prices and demands), short-term changes in the weather, availability of labour or skills. These changes may be short-term (especially the weather) or long-term, as with possible enhanced global warming and permanent changes in demand for the product. 2. Excessive, and increasing, dependence on inputs (e.g. fertiliser, agrochemicals) leading to vulnerability to supplies and price changes and possibly leading to pollution internal to the system, or external - to water courses and the atmosphere, for example). 3. Build-up of pests and diseases due to the quantity of easily located food material. (Why would this not also facilitate the build-up of their predators and parasites? The fact that these can rarely offer sufficient control - because of time lags - also applies in other situations). 4. Unattractive appearance of the countryside - lack of variety and features - monotonous. 5. Sometimes gives rise to unpleasant effects (smells, pollen etc.- as with oil-seed rape in the U.K). 6. Loss of biodiversity and natural flora and fauna. 7. Lack of interest and challenges to the operator.
FEEDING THE WORLD

AMAS 1997. Food and Agricultural Research Council, Réduit, Mauritius xxi
It is often assumed that the big challenge for science, and especially biological / agricultural science, is how to produce enough food for the future world population. Insofar as there is a technical answer to this, the consensus is probably that we can (Bunting 1992; Tribe 1994; Anderson 1995). But, of course, feeding people is not a purely technical matter. Producing food costs money, so it has to be sold profitably and those who have no money will not be fed (see Spedding 1996). They are not fed now. Apart from the immediate aftermath of major disasters, no-one who has money starves and, if the poor had money, food would be provided. Wherever the rewards for producing food are increased, more food is produced. That is why there are food surpluses in North America and Western Europe. The fact is that feeding the world does not pose a single question: it embraces at least three: 1. Can we produce enough? 2. Can the poor afford to buy it? and 3. Can social and other disruption be avoided? The first is a mainly technical question, though greatly influenced by economics (it subsumes the question: “Will we produce enough?”. The second depends upon both price and ability to pay. Price is not the same as cost of production but both are affected by demand and scarcity (and thus economics). The third question simply recognises that wars, corruption, mismanagement and greed can distort all parts of the food chain. Land itself can be rendered unusable, affecting the answers to all these questions. Solving the second question requires the generation of adequately paid employment. Solving the third, poses even greater problems. There is little sign that either can be solved quickly, so the technical problems may be the least of our worries. If poor people are not fed, quite apart from this being morally unacceptable, eventually one must expect a degree of social unrest that affects everybody. In these circumstances, civilisation itself may be unsustainable. REFERENCES ANDERSON J. 1995. Food and Agriculture: a global perspective. p. 21 - 33. In : CENTRE FOR
AGRICULTURAL STRATEGY. Priorities for a century - agriculture, food and rural policies in the European Union CAS Paper 31. UK : University of Reading.
BRUNDTLAND GH. 1987. Our common future. Oxford, UK : Oxford University Press, World
Commission of Environment and Development. BUNTING H. 1992. Feeding the world in future. p. 256 - 290. In : SPEDDING CRW ed. Fream’s
Principles of Food and Agriculture. Oxford, UK : Blackwell Scientific Publications. CONWAY GR and BARBIER EB. 1990. After the green revolution. London, UK : Earthscan
Publications. CROSSON P. 1992. Sustainable food and fibre production. (Paper presented at the Annual Meeting of
the American Association for the Advancement of Science, Chicago 9 February 1992).

AMAS 1997. Food and Agricultural Research Council, Réduit, Mauritius xxii
DALY HE. 1991. Steady state economics. Washington, USA : Island Press. HOLDGATE M. 1993. The biological basis for sustainable development. (Institute of Biology Charter
Award Lecture, 28 October 1993, London ). RILEY R. (1992). The challenge to science in food and agriculture. p. 13 - 15. In : Ninth symposium
towards sustainable crop production systems. RASE Monograph Series No. 11. SPEDDING CRW. (1994). Farming systems research / extension in the European context. Ch. 3. In :
DENT JB and McGREGOR MJ eds. Rural farming systems analysis. Wallingford, UK: CAB International.
SPEDDING CRW. (1995). Sustainability in animal production systems. Animal Science 61 (1): 1- 8.
(BSAS Hammond Memorial Lecture). SPEDDING CRW. 1996. Agriculture and citizen. London, UK : Chapman and Hall. TRIBE D. 1994. Feeding and greening the world. Wallingford, UK : CAB International.

AMAS 1997. Food and Agricultural Research Council, Réduit, Mauritius 1
IS NITROGEN FERTILISATION OF SUGARCANE HARMING OUR ATMOSPHERE ?
M A Bholah and K F Ng Kee Kwong
Mauritius Sugar Industry Research Institute
ABSTRACT The significance of N2O emission from soils cropped with sugarcane was measured at Réduit and
Belle Rive. The data demonstrated that N20 emissions from soils receiving 140 Kg N ha-1 was not markedly enhanced with regard to the background level emission from unfertilised soils.
INTRODUCTION Investigations on the appearance of the ozone hole in the stratosphere (Cicerone 1987) and on greenhouse warming (Lashof and Ahuja 1990) have unveiled the prominent role which nitrous oxide (N2O) plays in modifying the global atmospheric environment. Thus, though N2O accounts for about 6 to 8 percent of the anthropogenic greenhouse gases (CO2, CH4, N2O, CFCs), the global warming potential of each N2O molecule is about 250 times greater than that of CO2. Currently, the amount of N2O in the atmosphere is about 1500 Tg N2O-N, and it is increasing in the troposphere at the rate of 0.2 to 0.3 percent per year (Watson et al. 1990). This increase represents an annual input of about 3 to 4.5 Tg N2O-N to the atmosphere. The only known significant removal mechanism for tropospheric N2O is transport into the stratosphere where it is photolytically oxidised to NO which in turn destroys the stratospheric ozone to produce NO2 and O2 (Crutzen 1981). Estimates of global N2O suggest that soils contribute up to 90 percent of the total N2O emission and the gradual increase in atmospheric N2O concentration is believed to be linked with the increasing use of N fertilisers (Ryden 1983). Nitrification and denitrification in fertilised cropland (Eichner 1990), in grassland (Mosier et al. 1991) and in the oceans (Law and Owens 1990) are considered to be the major sources of N2O. In soils, N2O is produced primarily by microbial denitrification which is a respiratory process where nitrate (NO3
-) is utilised by bacteria as the terminal electron acceptor under O2 limiting conditions. NO3 is thus reduced stepwise to N2 as follows:
NO3 → NO2 → N0 → N2O → N2
Weier et al. (1996) showed that denitrification losses of applied N ranged from 13.2 to 38.6 percent
in sugarcane soils in Australia. In Mauritius, approximately 10 000 tonnes of N are applied annually over the 80 000 ha of sugarcane land. Although the agronomic and economic benefits of supplying fertiliser N to sugarcane are self evident, the impact of this N on the quality of the atmosphere have not been studied. Nitrogen balance studies using nitrogen-15 labelled fertiliser have shown that while leaching is not a major cause of N loss, 40 percent or more of the fertiliser N (on a national scale 4000 tonnes N or more) remained unaccounted for (Ng Kee Kwong and Deville 1987). There is good circumstantial evidence that the unaccounted for N is due to gaseous losses as N2 and N2O as a result of denitrification. Whereas N2 is an inert gas that poses no environmental risks the same cannot be said for N2O which exerts a deleterious effect on the atmospheric environment. A study has therefore been initiated to determine the impact of N fertilisation of sugarcane on the N2O emission to the atmosphere.

Is Nitrogen fertilisation of sugar cane harming our atmosphere ? M A Bholah and K F Ng Kee Kwong
AMAS 1997. Food and Agricultural Research Council, Réduit, Mauritius 2
MATERIALS AND METHODS Studies on N2O emission were carried out at 2 sites, namely at Belle Rive (3500 mm rainfall year-1) and Reduit (1500 mm rainfall year-1). Two treatments (with and without 140 Kg N ha-1) replicated four times in a randomised block design were applied to the sugarcane plots; plot size at Belle Rive consisted of 6 cane rows of 14.6 m each and spaced at 1.5 m; the plots at Reduit were made up of 7 rows of 9 m each with a 1.5 m spacing. Gas collection chambers constructed from cylindrical PVC pipes (240 mm i.d. x 300 mm tall) with a screw cap lid fitted with a sampling port were placed along sugarcane rows within the control and N fertilised plots. Gas sampling in 10 ml evacuated vacutainer vials fitted with rubber septa started in September/October soon after fertilisation, and it was carried out at 3-4 day intervals until the end of January. Thereafter, sampling was performed at fortnightly intervals. Gas samples were quantitatively analysed for N2O using a Varian 3300 Gas Chromatograph (GC) equipped with a 0.53 mm x 20 m Poraplot Q capillary column and Ni-63 Electron Capture Detector (ECD). The GC operating conditions were column temperature 400C, ECD temperature 3500C, injector temperature 600C and high purity N2 carrier gas at a flow rate of 29 ml min-1. The GC was calibrated with standard N2O gas (42 ppmV N2O) in the range 0 - 11.25 ng N2O. Five hundred µl of gas sample was then analysed and the concentration of N2O was calculated and expressed as N2O-N ha-1day-1. RESULTS AND DISCUSSION Measurements of the natural emission of N2O from soils showed that even when the sugarcane fields were not fertilised, as much as 18-70 g N ha-1 day-1 were lost as N2O (Figures 1,2). Over the period of October 1996 to February 1997 the amount of N emitted as N2O was 7.5 Kg N ha-1 at Reduit and 9.3 Kg N ha-1 at Belle Rive. Fertilising these soils with 140 Kg N ha-1 did not enhance to a significant extent the N2O emission as compared to that from the unfertilised soils. Thus, over the period October 1996 to February 1997, the increase in N2O emission as a result of 140 Kg N ha-1 applied ranged from 4.9 percent at Reduit to 7.2 percent at Belle Rive. The data obtained therefore showed that less than 0.5 percent of fertiliser N applied to sugarcane was emitted as N2O to the atmosphere. The temporal variation in fact clearly showed that fairly large N2O fluxes may occur even in the unfertilised plots. For instance at Reduit during the dry period of October to November, whilst the mean daily N2O emitted from unfertilised soils was approximately 32.3 g N ha-1, significant enhancement in emission by about 73 percent was observed following the wet period in early December (Figure 1). However, losses from soils receiving 140 Kg N ha-1 were almost similar to those from the unfertilised plot during the dry period and was only 18-27 percent greater compared to the background emission level after the early December showers. The data therefore emphasised that climatic factors such as rainfall may have a greater impact than fertiliser N application in controlling N2O release to the atmosphere from agricultural soils. Studies elsewhere have in fact showed a closer relationship of N2O losses with soil moisture content than with N source (see e.g. Byrnes et al. 1990).

Is Nitrogen fertilisation of sugar cane harming our atmosphere ? M A Bholah and K F Ng Kee Kwong
AMAS 1997. Food and Agricultural Research Council, Réduit, Mauritius 3
2-Oct-96 23-Oct-96 7-Nov-96 26-Nov-96 17-Dec-96 22-Jan-97 20-Feb-970
50
100
150
200
250
300
350
400
450
Rai
nfal
l mm
0
20
40
60
80
100
120
140
160
180
N2 O
Flux N
itrogen g ha -1 day-1
Rainfall mm 0 Nitrogen Nitrogen 140 kg ha-1
1-Oct-96 22-Oct-96 11-Nov-96 29-Nov-96 24-Dec-96 27-Jan-97 25-Feb-970
50
100
150
200
250
300
350
400
450
Rai
nfal
l m
m
0
20
40
60
80
100
120
140
160
180
N2 O
Flux N
itrogen g ha -1 day-1
Figure 2 Belle Rive
Figure 1 Réduit

Is Nitrogen fertilisation of sugar cane harming our atmosphere ? M A Bholah and K F Ng Kee Kwong
AMAS 1997. Food and Agricultural Research Council, Réduit, Mauritius 4
CONCLUSION
This study therefore demonstrated that N2O emissions from soils cropped with sugarcane were
agronomically insignificant and were only slightly enhanced following N fertilisation at the rate of 140 Kg N ha-1.
ACKNOWLEDGEMENT The assistance from the Mauritius Research Council is gratefully acknowledged. Thanks are also due to colleagues of the Agricultural Chemistry Department for their support in conducting this work. REFERENCES BYRNES BH, CHRISTIANSON CB, HOLT LS and AUSTIN ER. 1990. Nitrous oxide emissions
from the nitrification and nitrogen fertiliser. p 489 - 495. In: BOUWMAN AF ed. Soils and the greenhouse effect. Chichester , UK : Wiley.
CICERONE RJ. 1987. Changes in stratospheric ozone. Science 237 : 35-42. CRUTZEN PJ. 1981 . Atmospheric chemical processes of the oxides of nitrogen including nitrous
oxide. p 17 - 44. In: DELWICHE CC ed. Denitrification, nitrification and atmospheric nitrous oxide. New York, USA : Wiley.
EICHNER MJ. 1990. Nitrous oxide emissions from fertilised soils : Summary of available data.
Journal Environmental Quality 19 : 272 - 280. LASHOF DA and AHUJA DR. 1990. Relative contributions of greenhouse gas emissions to global
warming. Nature 344 : 529 - 531. LAW CS and OWENS NJP. 1990. Significant flux of atmospheric nitrous oxide from the Northwest
Indian Ocean. Nature 346 : 826 - 828. MOSIER A, SCHIMEL D, VALENTINE D, BRONSON K and PARTON W. 1991. Methane and
nitrous oxide fluxes in native, fertilised and cultivated grasslands. Nature 350 : 330-332. NG KEE KWONG KF and DEVILLE J. 1987. Residual fertiliser nitrogen as influenced by timing
and nitrogen forms in a silty clay soil under sugarcane in Mauritius. Fertiliser Research 14 : 219 - 226.
RYDEN JC. 1983. Denitrification loss from a grassland soil in the field receiving different rates of
nitrogen as ammonium nitrate. Journal of Soil Science 34 : 355 - 365. WATSON RT, RODHE H, OESCHGER H and SIEGENTHALER U. 1990. Greenhouse gases and
aerosols. p 5 - 27. In: HOUGHTON JT, JENKINS GJ and EPHRAUMS JJ eds. Climatic change : The IPCC scientific assessment. Cambridge, UK : Cambridge University Press.
WEIER KL, MC EWAN CW, VALLIS I, CATCHPOOLE VR and MYERS RJ. 1996. Potential for
biological denitrification for fertiliser nitrogen in sugarcane soils. Australian Journal Agricultural Research 47 : 67 - 79.

Is Nitrogen fertilisation of sugar cane harming our atmosphere ? M A Bholah and K F Ng Kee Kwong
AMAS 1997. Food and Agricultural Research Council, Réduit, Mauritius 5
COMMENTS Q. The increase of N20 seems to start before rainfall. Is temperature a responsible factor for the
increase? A. Soil moisture is a determining factor in the conversion of NH4N03 to N20 Q. Was moisture content taken into consideration? A. No, we did not measure soil moisture content but we based our findings principally on the
rainfall data. Q. 40% of N is unaccounted for. I wonder why you did not measure the other forms of N loss during this work. Did you think of measuring only N20 itself? A. We are in fact measuring total denitrification losses, but for the purpose of this presentation ,

6

AMAS 1997. Food and Agricultural Research Council, Réduit, Mauritius 7
DEVELOPMENT OF THE CENTRE PIVOT IRRIGATION SYSTEM IN MAURITIUS
M Teeluck
Mauritius Sugar Industry Research Institute
ABSTRACT The centre pivot irrigation system has only been recently introduced in Mauritius and yet it occupies almost 25% of the irrigated sugar cane area belonging to miller-planters. Its relative ease of operation, low energy and labour requirements as well as its lower investment cost compared to drip systems are among the arguments which explain the rapid expansion of the system. This paper presents an overview of centre pivot irrigation in Mauritius and examines some of the reasons for its adoption. The centre pivot irrigation scheduling software IRRIPIVO designed by MSIRI is briefly explained. The performance of the system and the quality of water application obtained under different operating conditions are discussed in terms of achievable cane yields and irrigation uniformity. Stress is laid on the importance of the system maintenance as this aspect is considered to be crucial for the sustainable use of the system. Some limitations which may prevent a wider use of the system in Mauritius are also analysed.
INTRODUCTION It is generally accepted that irrigation is one of the cultural practices that stabilises yields and improves productivity in any agricultural development. In Mauritius, in order to sustain cane production, irrigation is practised intensively in most of the Western sector and partly in the Northern sector - two sectors which contribute to about 30% of the total sugar production. In other areas such as the sub-humid and humid climatic zones where rainfall is relatively higher, supplementary irrigation is also necessary to make up for the erratic distribution of rainfall and to stabilise cane yields. Furthermore, given the shallow nature of the soils with a low water holding capacity, irrigation is necessary during certain periods of the year even where annual rainfall may reach 2000 mm. Irrigation in Mauritius has long been associated with surface and overhead or sprinkler systems. Since the 1950s several high pressure and high volume sprinklers such as the Boom-o-Rain, Target Masters and Rain Guns have been introduced and are well adapted with the existing cropping system. However, with the rising cost of energy and an increasing competition for the available water, these high pressure systems are gradually being phased out and replaced by medium to low pressure systems such as the dragline and fairly recently by the mechanised and automated centre pivot system. The centre pivot system is considered as a significant development in Mauritius and since its introduction in 1990, the number of operating units has been increasing among both miller-planters and large-planters, to reach at present a total of about 60 units irrigating an area of about 3000 hectares. This paper presents an overview of the centre pivot irrigation system and examines some of the reasons for its rapid adoption by sugar cane planters. The irrigation scheduling software, IRRIPIVO developed by MSIRI is briefly explained and the performance of the centre pivot is then examined in terms of water application uniformity and achievable yields. The last part emphasises the importance of maintenance aspects and analyses some limitations to a wider use of the system.

Development of the centre pivot irrigation system in mauritius M Teeluck
AMAS 1997. Food and Agricultural Research Council, Réduit, Mauritius 8
SYSTEM DESCRIPTION
The centre pivot system is classified as a medium to low pressure sprinkler system capable of irrigating large circular areas. It consists of a single galvanised steel lateral which rotates about a fixed point in the centre of the irrigated field. The lateral, equipped with nozzles or sprinklers, consists of 40 to 50 m long spans, each supported above the crop with as much as 3 m clearance by A-shaped steel frames (towers) mounted on powered wheels. Steel cables or trusses between the towers provide the strengthening support to the system. Starting from the pivot point, each additional span irrigates a larger area than the previous one. Therefore, for economic design centre pivots are reasonably long. Centre pivot systems 400 m long (irrigated area of about 50 hectares) are quite common in Mauritius, and a few systems even reach up to 850 m. Centre pivot systems are electrically driven. Each tower has an electric motor that drives the wheels through a gear box. The rotary movement of a pivot can be adjusted to meet the crop water requirement. The slower the lateral moves, the more water is applied. The movement of the system and therefore the depth of irrigation applied is controlled by regulating the speed of the outer most tower from a control panel located at the centre point. The advance of the last tower sets the other towers into motion one after the other by a system of sensors located on each tower and which is activated when the angle between the spans exceeds a pre-set limit. The sensor at each tower switches off again once a pre-set angle in front is reached. Each span therefore advances in short bursts starting with the next to last tower and progressing inward towards the pivot point. Safety devices present on the system stop the machine automatically whenever there is any malfunctioning. To ensure a uniform depth of water applied, the centre pivot system is equipped with either nozzles of different sizes spaced regularly along the lateral or with similar sized nozzles spaced more closely towards the lateral end. RAPID ADOPTION OF THE CENTRE PIVOT SYSTEM The centre pivot system was introduced in Mauritius at a time when the sugar industry was facing an acute labour shortage and an increase in energy cost. Several cultural practices had to be mechanised and the centre pivot system provided an ideal tool for a form of automated irrigation. Indeed, since its introduction in 1990, there has been a spectacular increase in the area under centre pivot irrigation as shown in Figure 1. Ah Koon (1994) attributes this rapid adoption to three main reasons: first, there was a pressing need to replace the existing high pressure overhead system which was becoming too costly to operate, in favour of systems like the centre pivot which require about half of the pressure (200 to 300 kPa) and hence less pumping costs than the existing system. Secondly, the system being mechanised, it is possible to irrigate large areas with reduced labour intervention and thirdly, the investment cost of the system is by far inferior to the drip system which has been claimed to be one of the potential replacements for the overhead systems. Indeed, the cost of a centre pivot ranges, on average, from 25 000 to 35 000 MUR ha-1 * compared to MUR 60 000 to MUR 80 000 for the drip system. Also the operating cost of a centre pivot system can be as much as four times lower than that of a comparable conventional sprinkler system. For example at Médine Sugar Estate, operation cost (labour and energy costs) amounts to about 4.50 to 6.00 MUR mm-1ha-1 for the centre pivot compared to 15 to 20 MUR for the Boom-o-Rain. The centre pivot has also other features that make it attractive to irrigation managers. It is easy to operate and does not require trained personnel. Water application can be easily adjusted to meet the soil and crop requirements. It also has greater management flexibility than other sprinkler systems. The system can be managed so as to apply the crop requirement either in small frequent doses or in one single application. Some models are computerised and therefore offer additional versatility.
* 1 MUR = 0.04545 USD approximately

Development of the centre pivot irrigation system in mauritius M Teeluck
AMAS 1997. Food and Agricultural Research Council, Réduit, Mauritius 9
1991 1992 1993 1994 1995 19960
10
20
30
40
50
60N
umbe
r of
uni
ts
0
400
800
1200
1600
2000
2400Irrigated area hectares
Area ha Units
Figure 1 Evolution of the centre pivot irrigation system in Mauritius
THE SOFTWARE, IRRIPIVO The software IRRIPIVO has been developed by MSIRI to assist centre pivot users to monitor their irrigation. It is based on the principle of budgeting the soil moisture of the root zone and it forecasts the next irrigation when a pre-set root zone depletion has been reached. Before IRRIPIVO can be run, data files need to be created in which the characteristics of the centre pivot, soil and crop parameters as well as irrigation management options are input. The software incorporates a data bank of water holding capacity of the different soil types, so that it may be used without prior soil testing. Once the data files are created, the user has just to input daily weather data (rainfall and adjusted pan evaporation or Penman evapotranspiration) and any previous irrigation applied. By keeping track of the moisture depletion in the root zone, the next irrigation amount is displayed when the readily available soil moisture (RAW) in the root zone reaches a pre-set level. The irrigation duration as well as the required speed of movement of the centre pivot are also displayed. Various levels of output can be chosen from daily to weekly output or annual summary sheets as well as a graphical display (Figure 2). The output shows the evolution of soil moisture reserves, the water balance component, the frequencies and the amounts of irrigation and rainfall. The graphical display appears to be better assimilated by the users and has proved to be more useful for decision making than the summary sheets. The amount of water applied with IRRIPIVO compares well with the amount used under the estate scheduling practices. For example, at Mon Désert Mon Trésor Sugar Estate, about 750 mm of water were applied for a period of ten months under IRRIPIVO compared to about 800 mm for an adjacent centre pivot without the software. Presently the software is under DOS environment, possibilities for a WINDOWS version are now envisaged. SYSTEM PERFORMANCE The performance of the centre pivot system has been evaluated by measuring the uniformity of water application under various operating conditions. The measure of irrigation uniformity most commonly used for the centre pivot system is the Christiansen’s Coefficient of Uniformity (CU) expressed as a percent and based on the absolute deviation from the mean application depth. The method used to measure this uniformity coefficient is that of Hermann and Hein (1968) which was adopted by the American Society of Agricultural Engineers (ASAE 1991). Uniformly spaced cans are placed along the radius of the Centre Pivot lateral and CU is calculated from the amount of water collected in each

Development of the centre pivot irrigation system in mauritius M Teeluck
AMAS 1997. Food and Agricultural Research Council, Réduit, Mauritius 10
can weighted for the difference in area represented by each can. The weighting accounts for the increase in area represented by successive cans as they progress toward the lateral end.
1 3 5 7 9 11 13 15 17 19 21 23 25 27 29 31
January 1996
0
5
10
15
20
25
30
35
40
45
50
Wat
er d
epth
m
m
-40
-35
-30
-25
-20
-15
-10
-5
0
5
10
Water depletion m
m
Rain Gross irrigation
Readily available water
Figure 2 Sample output from Irripivo V 2.5 software
Depletion
Results of twelve tests covering seven centre pivot units in different localities show that CU ranges from 68 to 85% and varies according to conditions imposed by climate, operating pressure, speed and direction of movement of the machine and also the type of nozzles used (Anon 1992, 1993, 1995, 1996). The effect of the type of nozzles on the performance of the centre pivot is shown in Table 1. Low drift nozzles with a mean CU of 85% seem to perform better than the standard spray nozzles (CU: 78%) under the conditions of the tests. Table 1 Coefficient of uniformity (CU) of two centre pivots
at Deep River Beau Champ Sugar Estate
Relative Standard “Senninger” Test No Wind Speed humidity spray nozzles low drift nozzles
km h-1 % CU % CU %
1 20.8 70.0 77 84
2 21.4 69.0 79 85
3 13.9 84.0 80 86
Mean 14.0 74.0 78 85
A comparison of the centre pivot CU results with the dragline system with reported CU values ranging from 57 to 67% (Anon 1996) and Rain Guns with CU ranging from 60 to 75% (Nicolin 1986), reveals the superiority of the centre pivot system to the other overhead systems with respect to water application uniformity. Does this improved application uniformity translate into improved cane yields? This is difficult to answer because available data on the different irrigation systems do not always allow a proper comparison. There are however some indications as shown in Table 2 that the centre pivot system produces better cane yields. Indeed, irrespective of locality or crop category, a centre pivot system produces on average about 20 t ha-1 more than the dragline system. However, the centre pivot system uses about 200 mm more water than the dragline.

Development of the centre pivot irrigation system in mauritius M Teeluck
AMAS 1997. Food and Agricultural Research Council, Réduit, Mauritius 11
Table 2 Cane yields of variety R570 under different irrigation systems
Estate Section Year Crop category
Centre Pivot*
Dragline*
t ha -1
Belle Vue Solitude 1993 2nd R 101 86 Belle Vue Solitude 1994 3rd R 113 83
Belle Vue Ferret 1996 3rd R 103 80
Médine R.Brunes 1994 - 1996 Mean** 128 109
Note: * Water applied: C. pivot = 850 - 1000 mm, dragline = 700 - 900 mm ** Mean = average of plant cane,1st and 2nd ratoon crops The superiority of the centre pivot system is also apparent in the commercial yield obtained in some sugar estates. An overall commercial yield increase of about 15 t ha-1 has been reported at Médine Sugar Estate by switching from a surface irrigation system to the centre pivot system. Although commercial yields as reported by the sugar estates do not always provide a reliable measure of comparison, in that yields of different cane categories or different methods of harvest are pooled together, the data presented in Table 3 nevertheless illustrate that irrespective of variety, cane yields obtained under the centre pivot are higher than those obtained from the other overhead systems. Table 3 Achievable commercial cane yields (t ha-1) with different irrigation systems at Belle Vue (Ferret Section)
Varieties Centre Pivot Dragline Target Master 1995 1996 1995 1996 1995 1996 M1557/70 86.4 93.0 - - 74.8 79.1 M1658/78 85.6 118.7 77.6 89.5 81.5 101.0 R 570 81.0 93.0 77.1 88.7 74.4 79.5
SYSTEM MAINTENANCE In order for centre pivot users to obtain high irrigation efficiencies with the system, it has to be well designed, properly installed and above all well maintained. Compared to other irrigation equipment, the centre pivot has a lot of moving parts which are liable to wear and tear. As the system is electrically powered, a regular supervision of the sensors, safety devices and other electrical components is required to make full use of their possibilities and life span. Indeed, Hillel (1987) pointed out that in a sprinkling system, the danger of system failure increases with technological complexity, requirement of expertise and quick availability of spare parts. Teeluck and Ah Koon (1996) reported that centre pivots in Mauritius operate in difficult weather and terrain and most centre pivots are found in areas not far from the sea and are therefore exposed to sea spray. Moreover, sloping terrain conditions and sometimes development of deep ruts in the wheel tracks affect the life span of gearboxes and motors. The long hours of operation (2000 to 5000 hours annually) and the nature of the crop (sugar cane) which causes friction of the vegetation with the moving parts, may cause additional stress and deterioration of the equipment. Regular servicing of gearboxes, motors and other accessories are recommended on a twice monthly basis during the irrigation period. An entire revision of the electrical components, nozzles, as well as the gearbox and motor are also necessary on an annual basis. Emphasis should also be laid on the proper anchorage of the centre pivot during cyclonic periods. Steel cables (6 - 10 mm diameter) or nylon ropes (20 - 25 mm diameter) are recommended. The minimum requirement for the anchorage is to have at least one attachment point on each span linked to two anchor blocks in an inverted V shape and one attachment point on each wheel linked to

Development of the centre pivot irrigation system in mauritius M Teeluck
AMAS 1997. Food and Agricultural Research Council, Réduit, Mauritius 12
another two anchor blocks. Further details are given in the centre pivot operation and maintenance manual produced by MSIRI (Teeluck and Ah Koon 1996). PROBLEMS AND PROSPECTS Centre pivot users are enthusiastic about the system on account of its performance and the number of units has been increasing every year. The system has, however, some limitations which may prevent its wider use in Mauritius. The nature of the terrain may impose some restrictions on the use of the centre pivot. The system is not particularly suitable for hummocky and sloppy terrain conditions. Slopes above 10 to 15% gradient are not recommended to avoid excessive stress on the machine. The irrigated area has to be free from obstacles like trees, streams, power lines, rock piles, etc. Lengths are often limited by high instantaneous application rates (IAR) inevitable at the outer end of centre pivots. Results of recent tests carried out on a 860 m-long centre pivot at Deep River Beau Champ Sugar Estates suggest IAR values of the last span ranging from 78 to 135 mm h-1. Such long systems are only suitable for soils with high permeability (e.g. Latosolic Reddish Prairie - P soils). The centre pivot system is not recommended in heavy clay soils such as the Dark Magnesium Clay found at Magenta or the Grey Hydromorphic soil of Balaclava. These soils have a low permeability which can be less than 10 mm ha-1 and are also sticky when wet and may cause the tower wheels to slip. Another major limitation of the centre pivot is the circular irrigation pattern. In a square field, this leaves 21% of land unirrigated. This circular configuration is a severe limitation of the Centre Pivot system in the Australian sugar industry (BSES 1991). As a solution to this problem, some manufacturers offer corner systems which swing out to irrigate the corner, but the benefits derived from such systems may be offset by additional costs and the complications added to an otherwise remarkably simple system. In Mauritius, centre pivot owners are using sprinkler systems like dragline to irrigate the corners. Another problem linked with the circular configuration of the centre pivot is its inability to apply different amounts of water within the irrigated area other than in sectors of a circle. Different irrigation amounts cannot be applied to other shapes within the circle. This can be a problem when fitting a centre pivot into an existing layout with crops requiring different irrigation amounts. The susceptibility of the centre pivot to damage by cyclonic winds may be another limitation of the system in Mauritius. During cyclone ‘Hollanda’ in 1994, a few units in the North and West suffered considerable damage. Proper cyclone precaution schedules such as those proposed by Teeluck and Ah Koon (1996) are therefore necessary to limit cyclonic damage CONCLUSION The centre pivot system appears to satisfy the immediate needs of irrigators in that it provides a uniform irrigation to large areas with moderate pressure and with very little labour. Cane growers are particularly enthusiastic about the system and it can be expected that more units will be installed in the near future. There is however a need for a proper comparison of the water use efficiency and the economics of the system with the other irrigation systems before the centre pivot can be fully assessed. In conclusion it is worth quoting Hillel (1987) to emphasise on the need for proper maintenance of the system. “Centre pivot systems are beautifully efficient as long as they operate perfectly, but without
expert maintenance, and spare parts, they are prone to breakdown. A malfunction in any one of the numerous parts can soon transform a working marvel of technology into a standing monument of inefficiency.”

Development of the centre pivot irrigation system in mauritius M Teeluck
AMAS 1997. Food and Agricultural Research Council, Réduit, Mauritius 13
ACKNOWLEDGMENTS I would like to thank Mr. D. Ah Koon, Head, Irrigation Department for reviewing the manuscript, Messrs. J. P. Pigeot of Médine Sugar Estate and I. Sahib of Belle Vue S.E for the yield data and Dr. J. C. Autrey, Director, Mauritius Sugar Industry Research Institute, for permission to present and publish this paper. REFERENCES AH KOON D. 1994. L’Irrigation avec le système pivot. PROSI Magazine ( 308 ) : 22- 27. ANON. 1992. Mauritius Sugar Industry Research Institute. Annual report. 1991, p. 32. ANON. 1993. Mauritius Sugar Industry Research Institute. Annual report. 1992, p. 36. ANON. 1995. Mauritius Sugar Industry Research Institute. Annual report. 1994, p. 39. ANON. 1996. Mauritius Sugar Industry Research Institute. Annual report. 1995, p. 42. AMERICAN SOCIETY OF AGRICULTURAL ENGINEERS . 1991. Test procedure for determining
the uniformity of water distribution of centre pivot, corner pivot and moving lateral irrigation machines equipped with spray or sprinkler nozzles. p. 653 - 654. In: ANSI/ASAE Standard S436. 38th edition. Michigan, USA : American Society of Agricultural Engineers.
ASAE see under American Society of Agricultural Engineers BSES see under Bureau Sugar Experimentation Stations BUREAU OF SUGAR EXPERIMENT STATIONS. 1991. Irrigation of sugar cane. Queensland,
Australia : BSES, 52 p. HERMANN DF and HEIN PR. 1968. Performance characteristics of self-propelled centre pivot
sprinkler irrigation system. Transactions of the American Society of Agricultural Engineers 11 (1) : 11- 15.
HILLEL D. 1987. The efficient use of water in irrigation : Principles and practices for improving
irrigation in arid and semiarid regions. World Bank Technical Paper No. 64. Washington, USA : World Bank, 108 p.
NICOLIN MG. 1986. Irrigation of interline and rotational crops on sugar cane lands in Mauritius:
Present status and prospects. Revue Agricole et Sucrière de l’Ile Maurice 65 ( 2&3 ) : 73 - 85.
TEELUCK M and AH KOON D. 1996. Centre pivot irrigation system : Operation and maintenance
manual. Reduit, Mauritius : Mauritius Sugar Industry Research Institute, 31 p. COMMENTS Q. Did you measure water use efficiency properly using the centre pivot? A. We tried to but still we need to do more experiments as there has been a lot of variation.

Development of the centre pivot irrigation system in mauritius M Teeluck
AMAS 1997. Food and Agricultural Research Council, Réduit, Mauritius 14
Q. What is the potential area in Mauritius which is suitable to be irrigated using the centre pivot system?
A. I do not know what is the exact area. We need to bear in mind that this system cannot be used
for areas with slopes exceeding 30 percent.

AMAS 1997. Food and Agricultural Research Council, Réduit, Mauritius 15
PRELIMINARY STUDIES ON ENTOMOPATHOGENS ASSOCIATED WITH SUGAR CANE PESTS IN MAURITIUS
N Behary Paray and A Rajabalee
Mauritius Sugar Industry Research Institute
ABSTRACT
Research work on entomopathogens has been initiated at the Mauritius Sugar Industry Research Institute primarily for the control of sugar cane white grubs. The local species, Heteronychus licas Klug, a chronic problem in young plant cane and Hoplochelus marginalis Fairmaire present in Reunion Island are our main concern. The search for promising isolates from local insect species is in progress. Metarhizium anisopliae Metsch. has been detected on sugar cane pests namely the red locust, Nomadacris septemfasciata Serv., the white grub, Phyllophaga smithi Arrow and the spotted borer, Chilo sacchariphagus Bojer. One Pæcilomyces sp has also been found on the latter. Laboratory infectivity trials show that the Phyllophaga isolate is highly infectious against a number of key agricultural pests . Placement of spores in the soil is an important aspect for efficacy in the field. The same isolate has been successfully mass-produced on rice; preliminary field trials have been set up to assess its efficacy against H. licas in highly infested zones. INTRODUCTION There is increased concern about the negative impact of chemical pesticides on the environment. Continuous use of these chemicals at high dosage rates against agricultural key pests has led to major problems such as pest resurgence resulting from development of resistance and destruction of natural enemies (Cisneros 1984; MSIRI 1988). The application of pest management with a minimum dependence on chemical control was a logical approach to these problems. In Mauritius, control of sugarcane insect pests is strongly associated with concern for the environment. Biological control in that sector is a well recognised success story and was initiated since 1762 with the introduction from India of the Mynah bird, Acridotheres tristis (L.) , for the control of the sugar cane red locust, Nomadacris septemfasciata Serv. In the search for new avenues in biological control, the importance of entomopathogens has been highlighted as an environment-friendly pest control method. Metarhizium and Beauveria spp have been studied for about a century but it is only during the last 20 years that special attention has been focused on them. In USA, Beauveria bassiana (Balsamo) Vuillemin and Paecilomyces fumosoroseus (Wize) Brown & Smith are under commercial development for whitefly control. The governments of Canada, Netherlands, Switzerland, UK and USA have supported the LUBILOSA (“Lutte Biologique contre les Locustes et les Sauteriaux”) research programme for the control of Sahelian locusts and grasshoppers using Metarhizium flavoviride Gams & Roszypal (Prior et al. 1992). A notable example is the successful control of the sugar cane white grub Hoplochelus marginalis Fairmaire using B. brongniartii (Saccardo) Petch in Reunion Island. Metarhizium and Beauveria are ubiquitous species but strain selection is vital, since a high level of variation exists among isolates in relation to pathogenicity, optimal temperature and viability. In Mauritius, Phyllophaga smithi Arrow, Heteronychus licas Klug and Alissonotum piceum Fabricius are the main white grub species on sugar cane. H. licas is a chronic problem in young plant cane in many areas and the threat of a possible introduction of the devastating Hoplochelus marginalis from neighbouring Reunion Island is of concern. Studies on entomopathogens have been, up to now, limited to white grubs. Maya’s disease, known to be caused by a densovirus, and a green-spored mycosis were recorded as early as 1912 by de Charmoy (1912). Petch (1941) also recorded a green-spored mycosis from P. smithi, and B. laxa (=B. bassiana)

Preliminary studies on entomophagens associated with sugarcane pests in Mauritius N Behary Paray and I Rajaballee
AMAS 1997. Food and Agricultural Research Council, Réduit, Mauritius 16
from Adoretus mauritianus. He noted that B. densa (=B. bassiana) and B. bassiana had been imported from the International Mycological Institute for the control of P. smithi. Moutia (1936) found that the introduced strain of B. bassiana was pathogenic in the laboratory but mass releases proved negative. There is no actual record of B. bassiana on P. smithi in the field in Mauritius. Bacterial septicaemia (“tâches noires”) resulting from infection of wounds occurred in dense populations. It is worth noting that Rhabdionvirus oryctes Huger, was introduced in 1970 and successfully controlled Oryctes rhinoceros (Linnaeus) (Monty 1974). The biological factors that influence populations of P. smithi are relevant to the potential problem of H. marginalis in Mauritius. There has been much speculation on the role played by antagonistic micro-organisms and pathogens acting on the larvae in the soil. Pathogens are in general more effective than entomophagous insects in the biological control of white grubs. The primary objective is to identify promising isolates of pathogens from our local insect pests and mass produce them for field application against H. licas which is a chronic problem in some areas. Subsequently, control of local white grub species could be achieved with the expectation that the selected isolates could adapt to H. marginalis, should the latter be introduced in Mauritius. Pathogens would therefore supplement existing control measures or help to reduce dependence on chemical pesticides and, therefore, lower cost of production. MATERIALS AND METHODS Detection and identification Entomopathogens from local insect pest species were isolated and identified according to the following procedures. All insects were brought to the laboratory and kept in air-tight plastic boxes saturated with moisture for a period of about 15 days. Presence of mycosis or any observable disease symptom was recorded. Isolation of any fungal pathogen was carried out on Sabouraud Dextrose Agar (SDA). After preliminary identification, cultures were made on agar slants for dispatch to International Mycological Institute for further characterization. Laboratory infectivity trials Laboratory bioassays were set up to assess infective potential of different pathogens and differential action of various strains of pathogens on major insect pest species. The latter were dipped for approximately 10 seconds in conidial suspensions in distilled water containing a few drops of Tween 20. They were then kept individually in air-tight plastic boxes saturated with moisture and observations on level of infection recorded after 4 weeks. The efficacy of M. anisopliae ‘Bel Etang’ isolate was also investigated on adult P. smithi in the soil. Treatments were as follows: a - beetles were placed in a plastic box containing sterilised soil which had been drenched with the biopesticide b - beetles were dipped in a conidial suspension and placed in a box containing sterilised soil c -beetles were released in a wooden cage containing a layer of sterilised soil sprayed with the
biopesticide d - beetles were released in a cage containing soil sprayed with distilled water Observations on level of infection was recorded after 12 days.

Preliminary studies on entomophagens associated with sugarcane pests in Mauritius N Behary Paray and I Rajaballee
AMAS 1997. Food and Agricultural Research Council, Réduit, Mauritius 17
Mass production of promising isolates on rice A mass production system for the development of an entomopathogen as a microbial control agent was set up for rapid multiplication of promising isolates for field application as and when required. A diphasic method consisting of a submerged fermentation for mycelial growth followed by incubation on a solid substrate for conidial production was adopted. A simple liquid medium containing bacteriological peptone and sucrose was inoculated with a conidial suspension of the mycopathogen in distilled water. The liquid culture was then transferred to partially cooked and sterilised rice in autoclavable bags which were incubated for about 10 days for sporulation. Contents of each bag were allowed to air-dry on plastic trays at room temperature (23°C) and conidia were extracted by sieving off the rice. Conidia were stored in the refrigerator in contact with silica granules. Field application A water formulation of the only isolate obtained from the white grub, P. smithi (see Results section for identification) was prepared and applied in areas infested with local white grub species. Field trials were laid down at Belle-Vue and Labourdonnais where high infestations by H. licas in young plant cane have been reported. The conidial suspension was applied in the open furrows prior to replanting at Labourdonnais. At Belle-Vue, the suspension was applied along cane rows followed by a drenching with large volumes of water where recruiting had already been carried out. Efficacy of the pathogen will be compared with the normal application of an insecticide (chlorpyrifos) through soil sampling of grub larvae 3-4 weeks after treatment. RESULTS
Detection and identification Low level of infection was found in field-collected insects. A single larva of Chilo sacchariphagus, out of a total of 829, was found to be infected with a fungal pathogen, probably Pæcilomyces sp last year (Table 1). Isolation of the latter on SDA proved to be difficult due to bacterial contamination of the plates. Various isolation procedures were tried and a pure culture was finally obtained by incorporating chloramphenicol in the medium. Metarhizium anisopliae, collected from several hosts (Table 1) in different localities, was much more easily isolated through careful removal of contaminated sections of the plate and/or subculturing on fresh plates. The different isolates were named as follows : 1. M. anisopliae ‘Bel Etang’ (ex. P. smithi, now identified by IMI as M. anisopliae var anisopliae). 2. M. anisopliae ‘Ebène’ (ex. C. sacchariphagus) 3. M. anisopliae ‘Rose-Belle’ (ex. C. sacchariphagus) 4. M. anisopliae ‘ Trianon’ (ex. N. septemfasciata) 5. M. anisopliae ‘laboratory’
Table 1 Level of infection in field-collected insect pests
Host Number of insects collected infected parasitised alive dead 1995 Mythimna spp 886 3* 146 521 216 1996 Chilo sacchariphagus 829 1+ 52 302 474 White grubs 813 9* 0 108 696 1997 Chilo sacchariphagus 308 4* 23 103 179 Nomadacris sp 10 3* 0 3 4
* M. anisopliae + Pæcilomyces sp

Preliminary studies on entomophagens associated with sugarcane pests in Mauritius N Behary Paray and I Rajaballee
AMAS 1997. Food and Agricultural Research Council, Réduit, Mauritius 18
Infectivity trials. M. anisopliae ‘Bel Etang’ was highly infectious against several agricultural key pests ( Table 2 ).
Table 2 Pathogenicity of Metarhizium anisopliae ‘Bel Etang’ on some major insect pest species
No. of insects Host Stage concentration
conidia ml-1 Treated Infected % Infection
H.armigera larva 6.0 x 10⁸ 11 10 91 Mythimna spp larva 5.0 x 10⁵ 50 29 58 C.sacchariphagus larva 6.0 x 10⁸ 80 69 86 H.licas larva 4.5 x 10⁴ 22 6 27 H.licas beetle 2.0 x 10⁷ 5 0 0 Temnorhynchus sp beetle 2.0 x 10⁷ 8 3 37 Adoretus sp beetle 2.0 x 10⁷ 6 0 0
Tests carried out with adult P. smithi showed that drenching the soil with the biopesticide or dipping the beetles into the suspension resulted in respectively 32 and 24 % infection 12 days after treatment. Spraying the soil surface did not result in infection (Table 3). An in-vivo culture of the Pæcilomyces sp was successfully maintained through artificial inoculation of live C. sacchariphagus larvae. Forty-four % of the larvae so treated were found infected.
Table 3 Efficacy of Metarhizium anisopliae on adult Phyllophaga smithi
Treatment Number of insects % treated infected infection Drenching 50 16 32 Dipping 50 12 24 Surface spraying 34 0 0 Control 34 0 0
Mass production M. anisopliae ‘Bel Etang’ was successfully mass produced on rice and was ready for subsequent field application. Growth of the Pæcilomyces sp on rice was, however, limited to the mycelial stage. Field application First results from field trials indicated no difference in the level of infection between the chemical and microbial treatments, but further assessments and trials are required before definite conclusions can be reached.

Preliminary studies on entomophagens associated with sugarcane pests in Mauritius N Behary Paray and I Rajaballee
AMAS 1997. Food and Agricultural Research Council, Réduit, Mauritius 19
CONCLUSION Bacterial contamination is a serious constraint to the preparation of pure cultures and refined methodologies need to be worked out. Identification to strain level will require an important input of biotechnology but is an essential prerequisite for detection of useful isolates. Except for Chilo larvae, laboratory bioassays have been carried out on field-collected insects. For more reliable results laboratory-bred larvae will have to be used. Breeding white grubs on artificial diet has, up to now, been a difficult process but further attempts in that direction are required. Mass production on rice aimed at providing sufficient conidia for preparation of water suspension for field application. An alternative to rice, as substrate, could provide a cheap formulation for direct field application. Not a single diseased larva of H. licas has yet been detected. This pest being the main target for control through entomopathogens, with or without insecticide, further search will now be focused on this grub. It is of note that in Reunion Island, application of the controlled-release formulation of chlorpyrifos-ethyl (Suxon or Suscon) in the furrows at planting is reputed to give good control and its use is heavily subsidised by the French government. The cost of the latter treatment is about 2040 FRF* ha-1 while a combination of Suxon with the biopesticide BETEL (a formulation of B. brongniartii) is as effective and much cheaper, costing 810 FRF ha-1. Side-effects of biopesticides on soil organisms need also to be considered. ACKNOWLEDGEMENTS We are grateful to Dr J C Autrey, Director MSIRI, for encouraging research on entomopathogens and for permission to publish the paper. Our thanks are also extended to Dr S Saumtally, Head Plant Pathology Department for laboratory facilities provided. REFERENCES CISNEROS FH. 1984. The need for integrated pest management in developing countries. p 19 - 30.
In: INTERNATIONAL POTATO CENTRE Report of the XXII Planning conference on integrated pest management. Lima, Peru : CIP.
De CHARMOY D. 1912. Report on Phytalus smithi (Arrow) and other beetles injurious to the sugar
cane in Mauritius. Parts 1 - 3. Port Louis, , Mauritius : Government Printing Office, 56 p. MONTY J. 1974. Tetralogical effects of the virus Rhabdionvirus oryctes on Oryctes rhinoceros (L).
(Coleoptera, Dynastidae). Bulletin of Entomological Research 64 : 633 - 636. MOUTIA LA. 1936. The sugar cane white grub Lachnosterna (Phytalus) smithi Arrow in Mauritius.
Proceedings International Society of Sugar Cane Technologists 5 : 436 - 445. MSIRI see under Mauritius Sugar Industry Research Institute MAURITIUS SUGAR INDUSTRY RESEARCH INSTITUTE. 1988. Annual Report 1987, 70 p. PETCH T. 1941. The entomogenous fungi of Mauritius. Mauritius Institute Bulletin 2: 14 - 20.
* 1 FRF = 1.9 USD approximately

Preliminary studies on entomophagens associated with sugarcane pests in Mauritius N Behary Paray and I Rajaballee
AMAS 1997. Food and Agricultural Research Council, Réduit, Mauritius 20
PRIOR C, LOMER LJ, HERREN H, PARAISO S, KOOYMAN C and SMIT JJ. 1992. The IIBC/IITA/DFPV collaborative research programme on biological control of locusts and grasshoppers. p. 8 - 18. In: LOMER CJ and PRIOR C eds. Biological control of locusts and grasshoppers. Oxon, UK : CAB International.
COMMENTS Q. Have you looked at the survival of entomopathogens in the soil? A. No, we are going to do so in our future projects. Trials in the laboratory to see viability of
spores in the soil and then the beetles will be introduced and their infection level will be assessed.
At present, our attention is focussed on detection and identification of our local isolates. Q. How harmful are entomopathogens to beneficial insects? A. Nothing has been recorded on the negative effects and we need to carry out infectivity tests
on beneficial insects to confirm the presence or absence of harmful effects.

AMAS 1997. Food and Agricultural Research Council, Réduit, Mauritius
21
PROSPECTS FOR SWEETCORN IN MAURITIUS
K Rummun and N Govinden
Mauritius Sugar Industry Research Institute
ABSTRACT Mauritius imports about MUR* 10 million worth of sweetcorn annually in the form of frozen or canned kernels. It is estimated that a further MUR 48 million worth could potentially be sold as fresh ears on the cob. This potential demand justifies an examination of the prospects for local production. The Mauritius Sugar Industry Research Institute has developed the necessary know-how to produce maize in pure stand and in interrows of sugar cane. Using this technology, up to 1800 ha were planted with maize in 1986. This production has now dwindled to insignificance because importation is now cheaper than production. Only about 300 ha are now used for the production of vegetable corn, leaving 1500 ha for other uses. Earlier attempts at sweetcorn production failed because imported hybrids had small ears and were very susceptible to foliar diseases. The first local hybrids had white kernels while consumers demanded yellow ones. Now that a composite variety with yellow kernels and large ears has been developed and has been found acceptable by consumers, production can be envisaged. Experimental results show that it is possible to produce 55000 ears ha-1. With the current farmgate price of MUR 1.50 per unit and a cost of production of MUR 25000 ha-1, sweetcorn production could be profitable. Research is still needed to increase resistance to ear worms and uniformity in ear-size. Other developments could include industrial processing into shelled frozen or canned kernels for the domestic market.
INTRODUCTION Sweetcorn (Zea mays L) is a high value maize. In the USA, it ranks second in farm value for processing (Alexander 1988). It is normally present as a special type of maize wherever this crop is grown. In some cases, it is grown exclusively for the domestic market, while in others it is exported in the processed form. In Mauritius, maize has continually been grown since the French first colonised the island in 1721. It has been used both for human consumption and for animal feed, especially poultry. But until recently, sweetcorn had not been grown for a number of reasons. In fact it may never have been introduced in the island, or even if introduced, it may have been immediately contaminated with field corn. This is because the sweetness of sweetcorn is due to a recessive gene which loses its effect when pollinated with a non sweetcorn. So, special care is required to maintain the sweetcorn gene a fact unknown to most growers. Sweetcorn is used only as the fresh cob and not as grain. As most of the maize previously grown was destined to feed poultry, excess sweetcorn would have been of no value. Although sweetcorn is not grown, it has a place in the Mauritian cuisine in the form of imported frozen or canned shelled kernels. Frozen kernels are imported from Europe and canned kernels from China. Import statistics are unavailable; the present import value is estimated to be MUR 10 million annually and this value appears to be increasing. * 1 MUR = 0.04545 USD approximately

Prospects for sweetcorn in Mauritius K Rummun and N Govinden
AMAS 1997. Food and Agricultural Research Council, Réduit, Mauritius
22
It is therefore worthwhile to examine the prospects for sweetcorn production in Mauritius. In this paper the four factors which determine the prospects will be discussed: the demand, the production method, the marketing strategy and the economic feasibility. THE DEMAND The demand for sweetcorn is evident from the value of the imports. However in assessing the importance of this demand, the peculiarities of the Mauritian cuisine should also be taken into account. At present, sweetcorn is used mainly as shelled kernels in the Chinese cuisine, but this is not the only way that it may be consumed. World-wide, sweetcorn is consumed predominantly as ear on the cob (Tracy 1994). In Mauritius, this niche is currently occupied by field corn, which has not been bred for this purpose. Although green cobs have traditionally been consumed as maize on the cob, the production of green cobs developed as an adjunct to grain production. Green cobs were harvested from fields meant for grain. Now that grain production has stopped, green cob production has continued in its own right. A market for green cobs exists, but it is quite small. Sweetcorn on the cob is virtually unknown in Mauritius. A small untapped market exists and overlaps with that of green cob. Sweetcorn on the cob may appeal to all ethnic groups. Since sweetcorn is a maize bred for consumption as ear on the cob, the kernels have a better taste, a softer pericarp and a better texture than field corn. On a conservative basis of two ears/month/person, it is estimated that the potential demand for sweetcorn ears for direct consumption as ear on the cob would be 24 million units per year worth MUR 48 million. If processing is undertaken, then a further market worth MUR 10 million may exist, making the total market worth over MUR 50 million. This potential demand makes it worthwhile to examine the production possibilities. THE PRODUCTION POTENTIAL Maize production is well established in Mauritius. The Mauritius Sugar Industry Research Institute (MSIRI) has developed the necessary technology for pure stand cropping and for intercropping with sugar cane. This know-how is widely used for the production of green cob and grain maize. Our experience in maize cultivation suggests that, except for the coolest months of the year on the central plateau (June-August) and during the cyclonic season (November-March), sweetcorn may be planted throughout the year in Mauritius. However sweetcorn production technology differs from that of grain maize in several significant ways. The main difference is due to the fact that maize exhibits xenia (Le Conte 1973), a characteristic whereby the kernel derives its endosperm type from the pollen as well as from the ovule. In sweet corn, this implies that if the silks are pollinated by non-sweet corn pollen, then the resulting kernel will not be a sweetcorn. However, such cross-pollination may be prevented by isolating the sweetcorn production fields either spatially or temporally. Of course, this adds a constraint to the choice of fields and the time of planting. Experience has shown that sweetcorn seeds need special care for good germination. For example, poor soil preparation or lack of soil moisture can cause a significant decrease in germination. It has also been noted that seeds stored for more than 2 years from harvest tend to have erratic germination. So fresh seeds are required each time. For the fresh cob market, it is very important that the ears be of high quality. Sweetcorn is very prone to ear worm (Helicoverpa armigera) attacks which render the tip of the ear unsightly. Surveys carried

Prospects for sweetcorn in Mauritius K Rummun and N Govinden
AMAS 1997. Food and Agricultural Research Council, Réduit, Mauritius
23
out in trials during 1993-94 showed up to 100% infection in Sweetie 82 (Anon 1994). Similar infestation levels have been observed in other varieties as well. Biological control of these insects has proved unsuccessful. Hence it is necessary to spray an insecticide once or twice during silking to control these insects. In a field of normal maize, when the ears are too small for marketing or when the price falls below a minimum, ears may be left to dry for grain. But dry sweetcorn grain is useless. Ears that cannot be marketed will have no value unless they can be saved for seed. This implies that firstly, hybrids should not be used since their seeds cannot be saved and secondly, care should be taken to avoid planting sweetcorn in the vicinity of normal maize fields, or else the sweetcorn would be contaminated. Because of the above differences, the cost of production of sweetcorn may be higher than that of fresh cobs of field maize by about 10%. Sweetcorn will therefore have to be sold at a slightly higher price. THE MARKETING STRATEGY Consumers may accept to pay a higher price for sweetcorn only if they find it better than field corn. The advantage of sweetcorn is its better taste. Field corn has been bred for use as dry grain, whereas in sweetcorn emphasis has been placed on the quality of the fresh kernels. The quality parameters are the thickness of the pericarp, taste, texture, tenderness and uniformity of the kernels. Some of these characteristics can only be appreciated if sweetcorn is prepared properly. It is important therefore that the consumer be able to distinguish between sweetcorn and field corn. This may be achieved by either properly labelling the product on the market or, still better, by using different retailing outlets for each product. Another important component of the marketing strategy would be to explain to consumers how to prepare fresh sweetcorn. The cooking procedure differs significantly from that of field corn; if the ear is boiled in water it loses part of its sweet taste; therefore, it should be steamed. THE ECONOMIC FEASIBILITY In 1993, imported sweetcorn cultivars Rosella, 12211, Sweetie 82, Honeysweet and Terrific were commercially evaluated. All the cultivars were very susceptible to rusts (Puccinia polysora and P sorghi) and blight (Helminthosporium maydis). The ears were small and highly infested with ear worms. This had the immediate effect of discouraging producers. To address the varietal problem, the MSIRI initiated a sweetcorn breeding programme. The objective was to develop high - yielding sweetcorn varieties that were less susceptible to rusts and blight. The first local variety of sweetcorn was rejected by consumers in 1994 (Anon 1996). It was belatedly found that consumers prefer large ears with yellow or orange kernels. So the sweetcorn breeding objective was changed to develop varieties with these characteristics. A composite with large ears (20 cm long) and yellow kernels, named MSIRI 8, has been bred and is currently undergoing semi-industrial trials prior to release. In a tasting test carried out in 1996 with MSIRI 8 and using a recipe designed for sweet corn, 42% of consumers found it excellent and 53% rated it as good. So, MSIRI 8 may be considered as acceptable. Sweetcorn will have to compete with field corn only on the fresh-cob market. It may also be sold as shelled frozen or canned kernels. Frozen or canned kernels are sold in the market at about MUR 50 kg-1. The farm-gate price of the equivalent in fresh cobs is estimated to be about MUR 7.5 kg-1. When the cost of industrial processing to produce shelled kernels is included, local sweet corn may be
Prospects for sweetcorn in Mauritius K Rummun and N Govinden
AMAS 1997. Food and Agricultural Research Council, Réduit, Mauritius
24
sold at very competitive prices compared to the imported product. Thus in the country's drive to develop agro-industries an opportunity exists for the processing of sweet corn. If industrial processing is envisaged, the potential of sweetcorn production is quite attractive. Because the crop is of short duration (about 80 days), intercropping with sugar cane is quite feasible without any adverse effect. Using this technology, the acreage under maize reached about 1800 ha in the 1980s. Grain maize production has now stopped and about 300 ha is devoted to green cob production. Sweet corn is a good alternative food crop for the remaining land. In trials carried out at Reduit, between 52 000 and 65 000 ears were obtained per hectare (Anon 1994). At the actual farmgate price of MUR 1.50 per ear and the cost of production of about MUR 25 000 ha-1, it is clear that sweetcorn production could be profitable. CONCLUSION Mauritius has the land, the know-how and the demand for sweetcorn. The development of the crop will depend on the willingness of producers and market agents to work together to tap the potential that exists. Problems may arise and research should be ready to address them. Further research is required to improve insect resistance so as to reduce the need for spraying. It is also necessary to increase the uniformity of cob size and of maturity so as to minimise the number of harvests and the number of undersized cobs. However, the research work may only be undertaken if the crop is produced on a reasonable scale. Unless a serious attempt is made sweetcorn may never develop its full potential as a vegetable crop in Mauritius. Now that potential producers have been made aware of the prospects, it is up to them to express their views. REFERENCES ALEXANDER DH. 1988 . Breeding special nutritional and industrial types. p 363 - 386 In: Sprague
GF and Dudley JW eds. Corn and corn improvement. Madison, U.S.A : ASA, CSSA, SSSA. ANON 1994 . Mauritius Sugar Industry Research Institute. Annual Report 1993, p. 67. ANON 1995 . Mauritius Sugar Industry Research Institute. Annual Report 1994, p. 65. ANON 1996 . Mauritius Sugar Industry Research Institute. Annual Report 1995, p. 68. LE CONTE J. 1973 . Maize breeding glossary. L’ Agronomie Tropicale 28 ( 10 ) : 963 - 973. TRACY WF. 1994 . Sweetcorn. p 148 - 181. In : HALLAUER AR ed. Speciality corns. Florida :
CRC Press.

Prospects for sweetcorn in Mauritius K Rummun and N Govinden
AMAS 1997. Food and Agricultural Research Council, Réduit, Mauritius
25
COMMENTS Q. When you are producing sweet corn, you will have to find people to process it which makes
me feel very pessimistic about its profitability, in your strategy of marketing you need to be very aggressive. Have you thought about the way you are going to promote sweet corn?
A. In the production of 1 kg, the ear will cost five rupees. I have added fifteen rupees for
processing costs. The whole operation will cost twenty rupees. It is being sold at MUR 100 kg-1 for the canned product. There is no doubt about its profitability.
As to marketing strategy, there is the need for an aggressive one. In the past, sweet corn has
been marketed as any other field corn and it did not have any impact. There is the need for some consumer education regarding its sweetness and tenderness.

26

AMAS 1997. Food and Agricultural Research Council, Réduit, Mauritius 27
GEOGRAPHIC INFORMATION SYSTEM - A TOOL FOR SMALL CANE GROWERS OF MAURITIUS
M Chung, G Pillay, R Domaingue and I Jhoty
Mauritius Sugar Industry Research Institute
ABSTRACT The heterogeneity of the group of small cane growers in terms of cultivated cane area, their geographical distribution and the cane production is a complex subject. To satisfy the additional quota of production, this group of planters is called upon to improve their production despite their socio-economic constraints. Ways and means to simplify complex technical information for cane production into ‘digestible’ visual aids to help them are explored. The use of new technologies like GIS to breakthrough the geographical limits and reach planters at field level and to accelerate the dissemination of recent research results among them is a must for research workers at the Institute. Different base maps like soil, factory area, villages and the conventional recommendation sheets of cane varieties were used to generate maps showing the recommended cane varieties across the island at village level. The paper gives the broadlines of the methodology used and discusses on the benefits and other potentials of such derived GIS products. INTRODUCTION Small cane growers, 34 000 in number, own an average of two plots each, ranging from 0.1 ha to 40 ha (MSIRI1990), they occupy almost 28% of the total cultivated cane area in Mauritius. Ways and means to help this category of planters to boost their productivity, which is on average 75% of that of the Miller planter group (MSIRI 1995), are being devised by the Government. A Small Planters' Desk was set up at the Mauritius Sugar Industry Research Institute (MSIRI) with the objective to transfer the latest research results to these planters, in addition to the existing support services. The latest breakthrough is the conversion of the traditional recommendation sheets of cane variety into maps, showing geographical zones where the cane growers can easily locate their villages and the cane varieties recommended for the area. Using Geographical Information System (GIS) tools, the product was delivered in three months for general distribution. METHODOLOGY Users requirements The output requirements were defined jointly by the departments involved in the project: namely the Extension and Liaison, the Plant Breeding and the Land Resources Departments. The three major inputs to be translated are the major villages where small cane-growers plots are found, the factory area to which these plots belong, the cane varieties recommended for these regions shown in a simple graphic way. The ease of updating the latter is necessary, as the list of recommended varieties is being revised every year. The possibility of circulating the information to a wide community in various forms(digital, and paper prints) is another prerequisite. The print for distribution has to be A4 size, which fits a factory area boundary, with the relevant text and colours.

Geographic information system - a tool for small cane growers of Mauritius M Chung et al.
AMAS 1997. Food and Agricultural Research Council, Réduit, Mauritius
28
Database compilation Base map preparation Following the merging of factory areas in the last 5 years, factory area maps had to be updated. A list of major villages was compiled according to districts, and located on the topographic map for digitising. The scale of 1:100,000 was chosen because most documents use at this scale, which was considered sufficiently detailed for the project. Annex 1, shows the list of map sources used. Checking, correcting and editing of the DXF-format digital copy of the soil map (Parish and Feillafe 1965) were necessary. The spatial database design was finalised for feature labelling. As the ARCInfo GIS software accepts only numeric fields for feature encoding, the eventual linking with appropriate text labels in look up tables was necessary. Topology building for each feature was performed in ARCInfo, and defined as either polygon, arc or point.
Design of attribute database
The attribute database is created in a relational database environment, namely the Info database of ARCInfo, which contains the recommended varieties, and the major soil groups for cane cultivation. The link of the geographical database is the soil group, from which the cane variety recommendations are derived. The latest recommendation sheet, (MSIRI 1996) was used to include the newly released varieties, and a provisional recommendation for marginal lands, where small planters' plots are commonly found, was also added. Map Projections transformation Co-ordinate transformation of the digitised sheets into real-world co-ordinates was performed. As the base maps were from different sources, the conversion into a single cartographic projection was necessary for the spatial analysis. The Lambert Conformal Orthomorphic projection was adopted, as it is most commonly used for the published maps of Mauritius. Also the conversion of geographical co-ordinates into a common unit: the National Grids (Easting, Northing) was preferred. Spatial data processing Reclassification The soil map has 65 entities, which needed to be regrouped into 14 soil groups as defined for cane variety recommendations. Features merging to a primary level, was facilitated with the database design. Legend formulation followed the colour pattern of the published soil maps (Parish and Feillafe 1965) so as to avoid confusion and facilitate interpretation among the agricultural community. Split
As the factory area is the determining factor in this spatial analysis, two series of splitting were performed, to obtain villages and soil groups on a factory area basis. A total of 19 coverages were obtained during each process, 17 of which were unique factory areas and other 2 having 2 sub-parts geographically apart (Figure 1). Files optimisation were automated to have 'clean' files, before the next step was undertaken. Thus a total of 38 coverages were utilised for the output. MAP OUTPUT The ARCView module is a tool developed for end-users to view, query, and print the finalised digital files. It contains a graphic user interface(GUI), which enables quick symbolisation of encoded features; and a template creation for a series of standardised prints. Overlaying of map coverages can

Geographic information system - a tool for small cane growers of Mauritius M Chung et al.
AMAS 1997. Food and Agricultural Research Council, Réduit, Mauritius
29
be easily performed, since they were georeferenced. Thus, for each factory area, corresponding coverages or spatial files for soil groups and villages were displayed simultaneously, together with the attribute table for recommended varieties linked through the soil group key. The views created were then loaded as map components in the preset template for serial printing. Several templates were designed, and the best chosen. As the digital products have to be viewed in other PC environments, without the ARCView software package, the map components were downloaded into another standard office software, Powerpoint, as graphics elements, so that automated screen display, and prints may be reproduced. About 35000 copies have been published for distribution. An example of the new-look Planters' Info sheet for Saint Félix factory area is shown in Annex 2. FUTURE DEVELOPMENT The distribution of cane recommendation sheets in the form of map prints to the small grower community has started since the beginning of this year, and the first responses are favourable. Additional information like harvest period, disease susceptibility of cane varieties in the different agro-ecological zones would be the add-ons in the second phase of the project. The addition of parameters to existing ones is easy, as the geographic database allows such flexible interactions. The ARCView software offers map symbolisation facilities, however, the art and the science of cartography can never be better expressed than in the following quote: "With no guidance and poorly chosen standard symbols, the users of mapping software are as
accident-prone as inexperienced hunters with hair-trigger firearms." (Monmonier,1991). The challenge is therefore in the scope of cartographic design, to distil the essence of the core information, from such a significant number of parameters.
#
# #
#
s p l i t
Villages points
Reclassified soil polygons
2 sets of overlay of 19 polygons of factory area = 38 coverages
Figure 1 Spatial analysis of map layers split by factory areas

Geographic information system - a tool for small cane growers of Mauritius M Chung et al.
AMAS 1997. Food and Agricultural Research Council, Réduit, Mauritius
30
Better graphics communication for the software One of the limitations encountered in the product finalisation is the loss of colour and resolution quality encountered during exports to the graphics software on McIntosh platform for commercial reproduction. Unless a better interface is found, older versions of the newly released McIntosh version of ARCView. Otherwise, the inclusion of a film recorder to the system to output the screen display onto slides may be a solution, and may decrease the conversion time for publishing. Product integration As enunciated in the development strategy of GIS at MSIRI (Chung et al.1995), and in the consultancy report on the GIS requirements and the implementation strategy for the sugar industry (GIMS 1996), the accessibility of Geographical Information Systems for Sugar Cane lands (GISCANE) to researchers will be through the establishment of a local area network (LAN) within the research institute; this project may be viewed in the ARCView environment. Otherwise, the map components may be downloaded to standard office packages, like Powerpoint, and Netscape and automated by a computer novice. Also, the varieties may be easily updated, using the text editing facilities, or a database editor. The SIRITELL (MSIRI 1995), an application product designed in-house for the Extension Service, to display detailed information on cane varieties, can also accept the digital products of the project, for demonstration purposes. Digital data publishing on CD After feedback is gathered from the first phase, a second phase is anticipated, to include the supplementary information required by the planters concerning cane diseases, and harvest periods. These digital data will then be published on CDs with customised menus or icons, to encourage a still wider distribution of the products to the agricultural community and to support services like banks, and insurance companies. CONCLUSION More collaborative projects are foreseen with other departments of the Institute to produce visual aids in the form of maps, to translate the complex technical results into 'digestible' graphics and easily transportable digital files, using GIS analysis tools (MSIRI 1994). This project is a test case, which would spur interaction of researchers and lay-men, for a better understanding and assimilation of the scientific information in a real-world situation. With the increasing importance of Information Technology, real-time communication is becoming a way of life, and new avenues of transfer of research results have to be exploited to decrease the time lag.

Geographic information system - a tool for small cane growers of Mauritius M Chung et al.
AMAS 1997. Food and Agricultural Research Council, Réduit, Mauritius
31
REFERENCES CHUNG M, JHOTY I, LI YIM FM and DEVILLE J. 1995. GIS in Mauritius. 10 p. In : Conference
Proceedings of Environmental System Research Institute ( South. Asia ) 4th Annual User Group, 4 - 6 September 1995. Singapore : ESRI
MSIRI see under Mauritius Sugar Industry Research Institute MAURITIUS SUGAR INDUSTRY RESEARCH INSTITUTE. 1990. The LandIndex project for small
planters. Reduit : MSIRI, 45 p. MAURITIUS SUGAR INDUSTRY RESEARCH INSTITUTE. 1994. Research & development
programme 1993 - 1998. Reduit : MSIRI, 42 p. MAURITIUS SUGAR INDUSTRY RESEARCH INSTITUTE. 1995. SIRITELL : A user’s manual.
Reduit : MSIRI, 9 p. MAURITIUS SUGAR INDUSTRY RESEARCH INSTITUTE. 1996. Recommendations Sheet No. 90. MAURITIUS SUGAR INDUSTRY RESEARCH INSTITUTE. 1996a. Geographic information
management systems. GIS requirement and implementation strategy. A consultancy report for the Mauritian Sugar Industry by Geographic Information Management Systems, South Africa. Reduit : MSIRI, 73 p.
MONMONIER M. 1991. How to lie with maps. Chicago, USA : University of Chicago Press, 176 p. PARISH DH and FEILLAFE SM. 1965. Notes on the 1:100 000 soil map of Mauritius. MSIRI
Occasional Paper No. 22. Reduit : MSIRI, 43 p.

Geographic information system - a tool for small cane growers of Mauritius M Chung et al.
AMAS 1997. Food and Agricultural Research Council, Réduit, Mauritius
32
ANNEX 1 Maps used for the compilation of spatial data 1. For villages siting: Source map: Directorate of Overseas Survey (1983). Map of
Mauritius 1:100,000 Projection: Transverse Mercator Grid: UTM Zone 40 2. Soil map: Digital File Format: DXF converted to ARC/Info Not projected, no attribute, no topology. Source Map: Parish, D.H. & the Late S.M Feillafe (1965) Notes on the 1:100,000 Soil Map of Mauritius. M.S.I.R.I. Occasional Paper No. 22. Edition 1962 Projection: Lambert Conical Orthomorphic Spheroid: Clarke(1880) 3. Factory Area map: Source map: 1. Factory Area Map(S.I.F.B, 1990), updated 1996 2. Directorate of Overseas Survey(1990). Map of Mauritius 1:100,000.Edition 1983. Projection: Lambert Conical Orthomorphic Spheroid: Clarke(1880)

Geographic information system - a tool for small cane growers of Mauritius M Chung et al.
AMAS 1997. Food and Agricultural Research Council, Réduit, Mauritius
33
Annex 2 Planters’ Info Sheet for St Félix Factory Area
Sols Variétés Recommandées
M3035/66,M52/78,M1658/78
M3035/66,M52/78,M1658/78
M3035/66,M695/69,M1557/70,M52/78,M1658/78,R570,R575
M555/60,M1557/70,M1176/77,M261/78,M1551/80,R570,R575
M555/60,M695/69,M1557/70,M1176/77,M52/78,M261/78 M1658/78,M1551/80,R570,R575
M555/60,M1557/70,M1176/77,M261/78,M1551/80,R570,R575
Sols Variétés Suggérées
M555/60,M1557/70,M1176/77,R570
M555/60,M1176/77,R570
Pas de recommandations
Planters’ Info Sheet No.3.9 Février 1997
LES RECOMMANDATIONS VARIÉTALES
POUR DE PLUS AMPLES RENSEIGNEMENTS, VEUILLEZ CONTACTER LE “FARMERS’ SERVICE CENTRE”(FSC) LE PLUS PROCHE DE VOTRE LOCALITÉ

Geographic information system - a tool for small cane growers of Mauritius M Chung et al.
AMAS 1997. Food and Agricultural Research Council, Réduit, Mauritius
34
COMMENTS Q. How long does it take to update GIS, if there is a new variety released. A. Almost immediately

AMAS 1997. Food and Agricultural Research Council, Réduit, Mauritius
35
A REVIEW OF SOCIO-ECONOMIC STUDIES UNDERTAKEN TO IMPROVE THE PRODUCTIVITY OF
SMALL SUGAR CANE PLANTERS IN MAURITIUS
V Toory and J A Tonta
Mauritius Sugar Industry Research Institute
ABSTRACT
In Mauritius the findings of technical research undertaken on sugar cane by the Mauritius Sugar Industry Research Institute (MSIRI) are disseminated to all categories of sugar cane growers, namely, the miller-planters, the large- and small-planters. However, the small-planters, on account of their narrow resource base and the numerous constraints which they have to face, have lagged behind in the adoption of new techniques and technologies as developed or adapted by research. A revision of the research strategy and the adoption of an alternative approach which could strengthen the research-client linkage was therefore required. Consequently, in the mid 1980s socio-economic research was included in the research and development (R & D) programme of the MSIRI. This paper highlights the need for socio-economic research at the MSIRI. Past achievements are critically reviewed. The future avenues of research to improve further the efficiency of small-scale growers of sugar cane are also discussed.
BACKGROUND In Mauritius, sugar cane cultivation is undertaken by three categories of growers, namely, the miller-planters, the large-planters and the small-planters. The miller-planters who constitute the corporate sector of the industry, cultivate about 55% of the total area under cane (about 40 000 ha) and the size of their farms varies between 750 and 5200 ha. They produce nearly 60% of total sugar output of the island. The large-planters are those who by definition, own plots which are over 42 ha in size. They harvest some 12 000 ha of sugar cane each year. The small-planter group consists of around 33 000 individuals who on aggregate, cultivate about 25 000 ha. The majority of them have fields which are less than 0.5 ha. They are mostly part-time farmers who are also employed in other sectors of the economy. Hence, revenue from sugar supplements their household budget. The annual sugar production of the island which on average was about 519 000 t in the 1950s jumped to 616 000 t in the 1980s. This remarkable achievement is undeniably due to intense efforts made by research in areas pertaining principally to breeding, physiology, plant nutrition and protection. However, the productivity increase at field level has not been of the same order of magnitude for each producer group. Over the period referred to, the average yields of miller-planters increased from 75 to 80 t ha-1 and those of small-planters moved from 48 to 62 t ha-1, with the result that the productivity of the latter group has continued to lag behind that of the corporate sector. The persistence of this yield gap has been a growing source of concern for national planners, the sugar industry and research scientists.

A review of socio-economic studies undertaken to improve the productivity .of small sugar cane planters V Toory and J A Tonta
AMAS 1997. Food and Agricultural Research Council, Réduit, Mauritius 36
It is rightly believed that by increasing the productivity of the small-planter sector to levels comparable to those of the corporate sector, the national sugar production can be greatly increased, therefore bringing additional income for the country. Furthermore, as small-planters are more vulnerable to changes in economic and environmental conditions, there exists the danger that if proper measures are not undertaken in the medium- to long-term, they will gradually disappear and this may eventually lead to serious social and economic difficulties. THE NEED FOR SOCIO-ECONOMIC STUDIES The small-planters, just like other categories of producers, have always been serviced by research undertaken by the Mauritius Sugar Industry Research Institute (MSIRI) which is the sole body responsible for all work pertaining to sugar cane agronomy and processing. However, the methods used for the dissemination of research findings towards the various producer groups have always been different. While the miller-planters have direct links with research, the small-planters had to rely exclusively on the Extension Services of the Ministry of Agriculture for access to information. This approach, though appropriate for logistic reasons, certainly had its drawbacks as it did not favour the direct interaction between the research scientists and the planters. As reported by Lutchmeenaraidoo et al. (1973), for a long time, little was known of the production environment in which the small-farmers operate. Thus, the research administration came to realise that there was the need to revise the research strategy and to adopt an alternative approach which through the strengthening of the research-extension linkage could lead to improvement in the small-planters’ productivity. In the mid 1980s, the MSIRI included socio-economics in its research and development (R&D) programme. The main objectives of socio-economic research were to promote a better understanding of small-farming systems, to identify constraints to higher productivity and to identify the specific needs of small-planters, if any, in terms of technological innovation and/or adaptation. More recently, the terms of reference were enlarged to evaluate projects implemented to improve the productivity of small-planters. ACHIEVEMENTS In the last 15 years, six projects have been undertaken. The approach adopted for the conduct of these studies was either partially or totally based on the Farming Systems Research procedures which in essence consist, firstly, of surveys to identify problems which may be of physical, biological and socio-economic nature and secondly, of on-farm experimentation to test the validity of suggested solutions. In the sections that follow, each of these projects is briefly discussed. Emphasis is also laid on feedback on the needs of clients and on issues identified in these studies which require the attention of agricultural scientists.

A review of socio-economic studies undertaken to improve the productivity .of small sugar cane planters V Toory and J A Tonta
AMAS 1997. Food and Agricultural Research Council, Réduit, Mauritius 37
The Landindex project for small-planters The aim of the project was to compile a database of the physical, geographical and agronomic characteristics of sugar cane lands, together with some socio-economic factors, with a view to carrying out studies related to productivity of small-planters. The survey revealed that factors like rockiness, lack of irrigation in some areas, gaps in cane rows, the cultivation of non-recommended varieties and maintenance of very old ratoons had a depressing effect on productivity. The growing unavailability of agricultural labour and transport facilities for conveying the crop to the mill were also aggravating the situation of small-farmers. This project has by far been the most important study to identify planters’ constraints to higher productivity. An extensive computerised database has now been created and is updated yearly. It is currently being used as a tool to guide extension work (Ricaud 1990). Labour and transport problems of small-scale planters
In the light of findings of the Landindex project, a survey was carried out in four contrasting cane growing regions to understand the causes for labour shortages and transport problems among small-planters. It was found that the main factors which were responsible for the occurrence of these constraints were farm size, the number of holdings per planter and his place of residence in relation to the location of his plot. Research highlighted the need for the introduction of field mechanisation for harvesting and the organisation of labour and transport on a co-operative basis (Anon 1990). The Souvenir drip irrigation pilot project
During the 1970s, many pilot drip irrigation schemes were installed as cane growers (mainly miller-planters and large-planters) looked to drip irrigation as a means of increasing yields and irrigation efficiency and reducing operation costs (Batchelor and Soopramanien 1993). In the second half of the 1980s, Government initiated the above project as a response to the difficulties encountered with earlier irrigation schemes in the northern plains of the island. A site of approximately 160 ha of sugar cane land, split in a 60:40 ratio between 180 small-planters and a sugar estate was earmarked for drip irrigation. As it was the first time that technology developed for large plantations was to be transferred to small plots, it was necessary to assess the technical and managerial difficulties that might arise. The development of drip irrigation on adjoining small-planters’ and miller-planters’ lands was therefore, an ideal opportunity for a pilot socio-economic study of the small-planter being exposed to a new technology. The study was undertaken in two phases. Phase I aimed at understanding the characteristic features of the existing farming systems and identifying major technical and socio-economic constraints prior to the introduction of drip irrigation. It was found that planters in the project area were mostly ageing males, and owning a plot which on average was below 0.32 ha in size (Berthelot and Pillay 1988). An old variety (M13/56) which was mainly planted in winter and meant for early harvest was predominant. Planters had the tendency to overfertilise their fields and had recourse to manual weeding. In the light of these findings a technological package which included drip irrigation, new varieties and improved husbandry practices was proposed to the targeted planters. The project beneficiaries were also encouraged to form a Water Users Co-operative Society which would ensure an efficient management of the irrigation scheme (Doyle 1991). The second phase, building on the first one, attempted to monitor and quantify emerging changes resulting from the introduction of the new technological package. It was observed by 1992, or 5 years after the implementation of the project, that though most of the planters had yield improvements of the order of 75 % through adoption of high yielding varieties and irrigation, certain issues like planter participation in research planning, improved co-ordination between institutions servicing planters and the need for increased extension input had still to be addressed. For example, many planters continued to overfertilise their fields and did not adopt chemical weeding (Tonta and Toory 1995).

A review of socio-economic studies undertaken to improve the productivity .of small sugar cane planters V Toory and J A Tonta
AMAS 1997. Food and Agricultural Research Council, Réduit, Mauritius 38
Socio-economic profile of small-planters The first phase of the Souvenir drip irrigation project which enabled the establishing of the socio-economic profile of planters in a given region triggered the need to extend similar studies to other parts of the island. Consequently, a survey was conducted in four regions of the island in order to develop a clear understanding of the socio-economic characteristics and constraints of small-planters. It was expected that the foregoing would be a prerequisite to any attempt at improving technology transfer. The study revealed that more than 75 % of planters interviewed were above 40 years of age and that 46% of them had at least attended primary schools. They were mainly constrained by unfavourable climatic conditions, poor weed control, high input cost and shortage of labour (MSIRI 1994). It was also found that planters were reticent to borrow from financial institutions to undertake development projects and that record-keeping to keep track of the evolution of components in production costs was practically inexistent. These findings were of much relevance to a new extension agency, the Farmers Service Corporation (FSC), created in 1989. The reasonable level of schooling of farmers has enabled the FSC to emphasise the publication of info-sheets and the organisation of vocational training programmes as part of its extension activities. Rehabilitation of abandoned cane lands A present source of concern for the sugar industry is the decline in sugar production as a result of cane cultivation being abandoned in some sectors; this is most prevalent among the small holders. It is estimated that over the 1980-1995 period, some 6000 ha of cane lands have been abandoned or converted to other uses (Julien et al.1995). As a further decline in our sugar production would jeopardise our capability to honour our European Union quota of 507 000 tonnes of sugar together with the additional allocation of 85 000 tonnes acquired through the Special Preferential Sugar agreement of 1995 and other market commitments, a task force set up by the Ministry of Agriculture recommended that an islandwide survey be carried out to assess the reasons for land abandonment, to identify measures for their rehabilitation and to prevent further land abandonment. The MSIRI, in collaboration with other agencies servicing planters, reached the conclusion that in addition to technical constraints which were long known to hamper field productivity, a new set of adverse socio-economic factors were emerging. These included a shift to more profitable crops, lack of confidence in cane cultivation, increased difficulties with procurement of credit and other inputs, plot fragmentation due to succession problems and urbanisation pressure. The survey, however indicated that around 1170 ha (about 73 % of the abandoned cane fields in the areas surveyed) could be rehabilitated provided that the planters were given the required support (MSIRI 1996a). Economics of grouping small-planters into Land Area Management Units (LAMUs) Given the small size and fragmented nature of their plots, it is becoming increasingly uneconomical for individual planters to continue cane cultivation. To overcome this size constraint, Government, through the FSC, has since 1986 been encouraging planters to group themselves into larger units called Land Area Management Units (LAMUs); these units are blocks of adjoining plots which can be managed collectively. Under this scheme, planters adhering to a LAMU benefit from a closer and continuous monitoring of all field operations performed up to harvest. This ensures an efficient use of resources and timeliness of operations. To-date, about 114 LAMUs have been created, they cover some 1253 ha and, on aggregate, belong to 1637 adherents (Tonta et al. 1997). Given the wide range of conditions under which the LAMUs operate, a project has recently been implemented in collaboration with the FSC to determine their viability, cost-effectiveness and optimal size.

A review of socio-economic studies undertaken to improve the productivity .of small sugar cane planters V Toory and J A Tonta
AMAS 1997. Food and Agricultural Research Council, Réduit, Mauritius 39
It is expected that the findings of the study will serve as a guideline to decision-makers in formulating future development strategies and will also provide organisational and management guidelines for planters who would like to create their own groupings under their specific circumstances. DISCUSSION During the last decade, there has been consensus among policy-makers and researchers that in addition to traditional technology generation and adaptation by research (e.g. high yielding varieties, improved cultural practices, etc.), the strengthening of the existing research-extension linkage would be a major key to the improvement of the productivity of small-sugar cane planters in Mauritius. The development of a more efficient research-extension network, initially requires, among other things, a thorough understanding of the physical, biological and socio-economic conditions under which the planter operates (the identification process). In that respect, several projects have been implemented by the MSIRI; the discussion that follows analyses their contribution towards the objectives set and the future scope for socio-economic research. The identification process All surveys completed up to now, have with varying emphasis, focussed on the biological, physical and socio-economic factors affecting farmers. Given the coverage of these surveys, it might be tempting to say that the level of understanding achieved so far is sufficient for actions based on their findings to be implemented at any time in the future. This may hold for the removal of technical constraints; but when it comes to socio-economic parameters, a few difficulties may crop up. The most recent survey, the one on rehabilitation of abandoned lands pinpointed the emergence of a set of constraints (problems of succession, land speculation, shift to more profitable crops, etc.) which were not apparent in the early 1990s. These observations clearly suggest that owing to the dynamic nature of the local economy, surveys dealing specifically with identification of emerging socio-economic constraints need to be undertaken prior to the introduction of new measures (technical or non-technical) to improve the productivity of planters. The strengthening of the research-extension linkage Both the Landindex and the Souvenir drip irrigation pilot projects highlighted the inadequacy of the then existing extension network owing to institutional limitations. In those days, very few planters were in close contact with the research scientists. With the coming into operation of the Farmers Service Corporation (a body independent of the MSIRI), a new dimension was given to the organisation of extension work in Mauritius. Findings from the survey on the socio-economic profile of planters and from earlier projects have largely served as guidelines for a proper definition of the operational framework of the Farmers Service Corporation. At present, the FSC is an effective interface between research and planters; it is worth mentioning that through increased interaction with the planters and organisations servicing them, the MSIRI has recently set up a Small Planter’s Desk (SPD) within its premises. The SPD provides small-planters with information and advice on sugar cane and collaborates with the FSC and sugar estates for the follow-up of any problems they may be having at field level. The SPD thus presents a direct communication channel between the small-planter sector and the MSIRI (MSIRI 1996b). It is expected that this innovation, among other complementary measures already undertaken, will not only be a mechanism to accelerate the transfer of technology process but will further help in identifying and prioritising projects relevant to planters’ needs.

A review of socio-economic studies undertaken to improve the productivity .of small sugar cane planters V Toory and J A Tonta
AMAS 1997. Food and Agricultural Research Council, Réduit, Mauritius 40
Productivity improvement In most projects, the emphasis was not directly on productivity improvement. It is only in the Souvenir drip irrigation pilot project, where research was deeply involved in the introduction of the new technology, that measurements related to changes in yields achievable were monitored until project completion. However, these data do not provide sufficient indication for ascertaining the sustainability aspect of productivity improvements resulting from induced changes in the farming system. In general, productivity improvement is a long-term process as sugar cane has a long crop cycle and changes in its management may imply considerable social and agronomic problems. Significant results may not be obtained in the short-term. Given the paucity of information on the small- sugar cane planters operating in the country, it is not possible for the time being to comment on any changes that might have been brought about with the incorporation of the social sciences in the local sugar cane research programme. It is strongly felt that both research and other institutions servicing planters should join their efforts in developing a database which would capture the desired information. FUTURE SCOPE FOR SOCIO-ECONOMIC RESEARCH In the forthcoming R&D programme of the MSIRI, the major thrust will be on the development of strategies which are expected to either reduce cost or improve productivity or do both at the same time. This will imply the evaluation of economic merits and demerits of techniques and technologies that aim at fulfilling these objectives. For example, the use of in-vitro plantlets for sugar cane propagation is likely to raise questions from planters with respect to its cost implications and acceptability compared to the conventional method of using cuttings. No doubt, socio-economic studies will help in elucidating such issues. Another example will be the economic appraisal of different types of contract services mainly developed by sugar estates in Mauritius with a view to assist planters in overcoming difficulties they have to face in carrying out field operations. The contract services are felt to be advantageous to planters in that they help to overcome resource constraints such as labour shortage and transport availability; they allow timeliness of field operations and, furthermore, planters having recourse to such services are in a position to benefit from new technologies and techniques of production. As the development of these types of services are likely to gather momentum in future, it is imperative that their contribution towards improving planter productivity and efficiency be assessed. In a broader perspective, it is felt that the modernisation and the long term viability of the non-corporate sector of the sugar industry will only be possible through the grouping of planters for a more efficient management of their plots. The projects completed so far, showed that this is an area of development which should not be overlooked. For example, at Souvenir, the planters were invited to group themselves into a Water Users Co-operative Society, but in practice it did not prove to be effective as the framework laid down proved to be unacceptable to them. The labour and transport survey suggested the need for planters to organise themselves on a co-operative basis in order to cope with labour and transport constraints during harvest. The on-going project on the economics of grouping planters into LAMUs has shown that LAMU development has not progressed as initially expected due to various constraints of technical and socio-economic nature. These observations suggest that in the coming years socio-economic research should orient itself towards assisting planters in developing appropriate organisational framework which through grouping would help them to benefit from economies of scale and also enable them to express their views in a forceful manner. This will require an effective co-ordination between agencies servicing planters and existing planter organisations and at research level, the development of expertise in the field of sociology and related disciplines.

A review of socio-economic studies undertaken to improve the productivity .of small sugar cane planters V Toory and J A Tonta
AMAS 1997. Food and Agricultural Research Council, Réduit, Mauritius 41
CONCLUSION Socio-economic research was included in the R&D programme of the MSIRI with the major objective of improving the productivity of small sugar cane planters. The studies undertaken so far have covered the identification of small- planters’ characteristics and their technical and socio-economic constraints to higher productivity. Findings from these projects, have in one way or another helped in strengthening the research-extension linkage. They have also shed light on the future orientation of socio-economic research at institutional level. ACKNOWLEDGEMENT The authors would like to thank the Director of the MSIRI for giving them the opportunity to present this paper. REFERENCES BATCHELOR CH and SOOPRAMANIEN GC eds. 1993 . Drip irrigation research. Final report of
the Mauritius Sugar Industry Research Institute and the Institute of Hydrology Drip irrigation research project. Reduit : Mauritius Sugar Industry Research Institute and UK: Institute of Hydrology, 36 p.
BERTHELOT PB and PILLAY KP. 1988 . Small planter studies : Souvenir Farming Systems
Research Project . A report on Phase 1. MSIRI Occasional Report No. 2 . Reduit : Mauritius Sugar Industry Research Institute, 29 p.
DOYLE P. 1991 . A report on the socio-economics of drip irrigation in the Mauritian sugar sector.
Reduit : Mauritius Sugar Industry Research Institute, 55 p. (Internal Report). JULIEN R, D’ARIFAT P, NOEL A, ROY M, RUHEE H, TYACK JC and DEVILLE J. 1995. Report
of the Task Force on supplying the European Union cane sugar refiner’s deficit. 19 p. ( Unpublished ).
LUTCHMEENARAIDOO K, NARAIN TM, BRUNET LR and ZMANAY D. 1973 . Survey of sugar
cane planters and their production pattern. Mauritius : Ministry of Agriculture and Natural Resources, 97 p. ( Technical Report of a Committee appointed in 1972 to conduct a survey among planters of sugar cane cultivating less than 100 arpents.)
MSIRI see under Mauritius Sugar Industry Research Institute MAURITIUS SUGAR INDUSTRY RESEARCH INSTITUTE . 1990 . The small cane planter and the
labour shortage and transport problems. A report on surveys carried out in four factory areas by the MSIRI in collaboration with the Farmers Service Corporation. MSIRI Occasional. Report No. 5 . Reduit: Mauritius Sugar Industry Research Institute, 17 p.
MAURITIUS SUGAR INDUSTRY RESEARCH INSTITUTE. 1994 . A socio-economic study of
small sugar cane planters in Mauritius. A report on surveys carried out in four factory areas by the MSIRI and the Farmers Service Corporation. MSIRI Occasional. Report No. 7. Reduit: Mauritius Sugar Industry Research Institute, 39 p.

A review of socio-economic studies undertaken to improve the productivity .of small sugar cane planters V Toory and J A Tonta
AMAS 1997. Food and Agricultural Research Council, Réduit, Mauritius 42
MAURITIUS SUGAR INDUSTRY RESEARCH INSTITUTE. 1996a . Rehabilitation of abandoned cane lands. A Report on a survey carried out in various factory areas in collaboration with the Farmers Service Corporation and Planters’ Advisers on sugar estates. MSIRI Occasional Report No. 10 . Reduit : Mauritius Sugar Industry Research Institute, 59 p.
MAURITIUS SUGAR INDUSTRY RESEARCH INSTITUTE. 1996b . Small- Planters’ Desk
Planter’s Info Sheet No. 1, Nov. 1996. Reduit : Mauritius Sugar Industry Research Institute, 1p.
RICAUD C. 1990 . MSIRI’s Contribution to improve the efficiency of small-planters. Reduit :
Mauritius Sugar Industry Research Institute, 7 p. (Internal Report) TONTA JA and TOORY V. 1995 . Souvenir Farming Systems Research Project : Report on Phase 2.
MSIRI Occasional Report No. 8 . Reduit : Mauritius Sugar Industry Research Institute, 55 p. TONTA JA, TOORY V, PILLAY KP, AUTREY LJC, JEEHA L, SONIAH RK, OOGARAH P,
MAYER P and D’ARGENT G. 1997 . Economics of grouping planters into Land Area Management Units (LAMUs). Phase 1 : Review of services offered to planters. MSIRI Occasional Report No. 13. Reduit : Mauritius Sugar Industry Research Institute, 35 p.
COMMENTS Remark -The Farmers Service Corporation took an active part in the conduct of surveys and this
shows good collaboration between research and extension. Q. In your future scope, you did not take into consideration, derocking and irrigation? A. In terms of economic appraisal, it comes under resource-economics rather than socio-
economics and we have considered only socio-economic issues in this study.
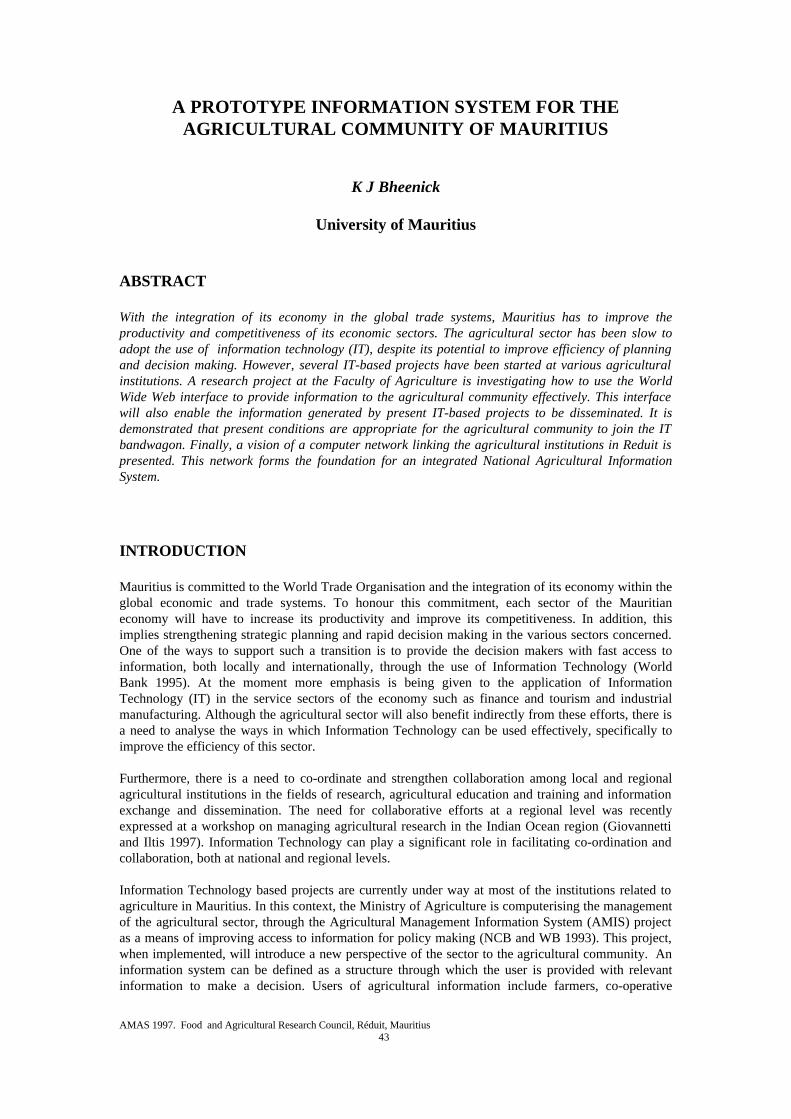
AMAS 1997. Food and Agricultural Research Council, Réduit, Mauritius
43
A PROTOTYPE INFORMATION SYSTEM FOR THE AGRICULTURAL COMMUNITY OF MAURITIUS
K J Bheenick
University of Mauritius
ABSTRACT With the integration of its economy in the global trade systems, Mauritius has to improve the productivity and competitiveness of its economic sectors. The agricultural sector has been slow to adopt the use of information technology (IT), despite its potential to improve efficiency of planning and decision making. However, several IT-based projects have been started at various agricultural institutions. A research project at the Faculty of Agriculture is investigating how to use the World Wide Web interface to provide information to the agricultural community effectively. This interface will also enable the information generated by present IT-based projects to be disseminated. It is demonstrated that present conditions are appropriate for the agricultural community to join the IT bandwagon. Finally, a vision of a computer network linking the agricultural institutions in Reduit is presented. This network forms the foundation for an integrated National Agricultural Information System. INTRODUCTION Mauritius is committed to the World Trade Organisation and the integration of its economy within the global economic and trade systems. To honour this commitment, each sector of the Mauritian economy will have to increase its productivity and improve its competitiveness. In addition, this implies strengthening strategic planning and rapid decision making in the various sectors concerned. One of the ways to support such a transition is to provide the decision makers with fast access to information, both locally and internationally, through the use of Information Technology (World Bank 1995). At the moment more emphasis is being given to the application of Information Technology (IT) in the service sectors of the economy such as finance and tourism and industrial manufacturing. Although the agricultural sector will also benefit indirectly from these efforts, there is a need to analyse the ways in which Information Technology can be used effectively, specifically to improve the efficiency of this sector. Furthermore, there is a need to co-ordinate and strengthen collaboration among local and regional agricultural institutions in the fields of research, agricultural education and training and information exchange and dissemination. The need for collaborative efforts at a regional level was recently expressed at a workshop on managing agricultural research in the Indian Ocean region (Giovannetti and Iltis 1997). Information Technology can play a significant role in facilitating co-ordination and collaboration, both at national and regional levels. Information Technology based projects are currently under way at most of the institutions related to agriculture in Mauritius. In this context, the Ministry of Agriculture is computerising the management of the agricultural sector, through the Agricultural Management Information System (AMIS) project as a means of improving access to information for policy making (NCB and WB 1993). This project, when implemented, will introduce a new perspective of the sector to the agricultural community. An information system can be defined as a structure through which the user is provided with relevant information to make a decision. Users of agricultural information include farmers, co-operative

A prototype agricultural information system for the agricultural community in Mauritius K J Bheenick
AMAS 1997. Food and Agricultural Research Council, Réduit, Mauritius 44
societies, non-governmental organisations, extension officers, researchers, students, educators and policy makers, all using information at different levels of detail. Although the AMIS may contain the information required by most of these users, it relies on private developers and experienced users to provide the front-end or user-interface for various groups of users (NCB and WB 1993). Thus, the issue of the user interface being able to satisfy the different levels of aggregation of information required at each user’s level needs to be further investigated. In fact, prototypes of such user interfaces can be developed independently of the AMIS, whilst awaiting its implementation. This paper presents a research project whereby the concept of the World Wide Web (WWW) is proposed as a means of developing a user interface for national databases and information systems such as the AMIS. The paper then presents arguments why Mauritius is now ready to embark on such a project and finally, introduces the concepts of an integrated agricultural network which will form the basis of a National Agricultural Information System. THE RESEARCH PROJECT A project has been started at the Faculty of Agriculture to develop a user interface for an agricultural information system such as the AMIS and any other national databases or knowledge banks that may be created in the future. The research aspect of this project lies in testing whether there can be a single user-friendly interface that satisfies a majority of users, while remaining flexible enough for advanced users to customise the format of presentation of the information. It is proposed to develop the user interface around the concept of the World Wide Web (WWW) format. The Web is based on a graphical user interface (GUI) i.e. making use of windows, menus, icons and a pointing device such as the mouse to issue commands. Today, this ‘point and click’ concept has also been extended to a lot of our daily activities, including our search for information in a library. Thus, instead of wading through a lot of bookshelves and pages of books, one is given the facility of ‘searching’ for the relevant keywords on the vast virtual information bank called the World Wide Web and consult the exact location of the keyword in an electronic document, all through the click of a mouse button. A fundamental feature of the Web is the ability to link up related information, wherever these are physically located on the Internet. This flexibility, for example, enables a user to ‘browse’ through information on a specific topic, located on various computers around the world effortlessly. This concept can also be applied to our search for agricultural information, whether located locally or overseas. Should such a search still not provide satisfactory results, the Web offers users the opportunity to broadcast their specific request for information to people with similar interests all over the world, through its discussion forums. Another feature of the Web interface is its consistency irrespective of the kind of computer or operating system used to access the information. This consistency and the user-friendliness of the environment are valuable in facilitating the learning process, especially of new computer users as is usually the case in the agricultural community. These users then also have the flexibility to build up on their experience at their own pace. More recently, the Web has started offering the option of providing information in audio-visual form on the computer. This brings the user interface closer to the familiar television format but with the benefit of interaction with the user. Therefore, the World Wide Web interface seems to be turning into the de facto format for communication both with people and other sources of information via the computer. Hence the proposal to design an Agricultural Information System interface around this largely accessible and popular format. Examples of the use of the Web to share information in agriculture have been documented and the methodology used to develop the interface will draw upon the experience of similar projects around the world (Richardson 1996; Mangstl et al. 1997; Batzios et al. 1997). Initially, a study will be carried out on the various sources of data and information that exist locally

A prototype agricultural information system for the agricultural community in Mauritius K J Bheenick
AMAS 1997. Food and Agricultural Research Council, Réduit, Mauritius 45
and the kind of information required at various levels of the agricultural sector in Mauritius. As an intermediate stage of the development process descriptions of the data and information documented will be made available. At a later stage, samples of data will be collected and stored in an electronic format. This will enable prototypes of the interface to be developed and tested in collaboration with groups of users using established procedures (Hautzer et al. 1997). It is expected that the users of the Agricultural Information System will, themselves, be a major source of information. Thus, the development of such a tool necessitates close interaction between developers and users. Therefore, the success of a computerised Agricultural Information System relies on the conviction of the users that this technology can be effective for them. IS MAURITIUS READY FOR A COMPUTER-BASED AGRICULTURAL INFORMATION SYSTEM? Mauritius cannot wait any longer before embarking on a path of increased computerisation and electronic communication, and neither can the agricultural sector afford to be left behind in this process. Furthermore, some of the facts presented below support the argument that Mauritius and more specifically the agricultural community is poised more than ever before to launch itself onto the Information Technology bandwagon. The need for an Agricultural Information System has been recognised The launching of a project such as the AMIS at the Ministry of Agriculture demonstrates the recognition of its importance, especially in the wake of the liberalisation of world trade. Meanwhile, other agricultural institutions have also recognised the benefits of having such a system internally. Generally, the value of an information system is given by assessing the risk associated with making a decision in the absence of all the relevant information at hand. An Agricultural Information System is also required to encourage and facilitate the entry of the younger generation in the agricultural sector. The Information System will provide them with information required to get started, and with the tools they could expect to sustain development in any other sector of the economy. This is especially relevant given the fact that the community of planters is an ageing one (MSIRI 1994). The government is committed to introducing Information Technology The Budget speech 97/98 contains several indications of the government’s commitment, as demonstrated by the following extracts:
We are... formulating a National Information Technology Strategy Plan... to accelerate Mauritius transformation into a nation where IT will be fully exploited to improve business competitiveness, quality of life, and to generally encourage IT diffusion at the national level...
...Internet facilities will be made available to all secondary schools and will thus become a new medium of instruction... ..to enable a wider diffusion of multimedia tool and CD ROM facilities and to improve their affordability the Development Bank of Mauritius will double the maximum loan available under the Micro-Computer Scheme to MUR * 40 000...
* 1 MUR = 0.04545 USD approximately

A prototype agricultural information system for the agricultural community in Mauritius K J Bheenick
AMAS 1997. Food and Agricultural Research Council, Réduit, Mauritius 46
...MUR 300 million will be earmarked for the setting up of a Skills and IT Development Fund...
...in line with the drive towards full computerisation of the Civil Service, Government will implement a project to link all Ministries and Departments to Internet...
...to bring government services much more efficiently and quickly to the public, Digital Information Kiosks will be installed in departments that have much interaction with the public. A Government Electronic Mailbox will also be set up to enable one-stop and round the clock access to public services...
(Quoted from Budget Speech 97/98 by Hon. V. Bunwaree, Minister of Finance, 9 June 1997)
A marked improvement in local telecommunications infrastructure In December 1993, at the National seminar on Information Technology, it was concluded that the local telecommunications infrastructure needed to be improved to support the desired growth in Information Technology applications and communication (NCB and WB 1993; World Bank 1995). Today, Mauritius has the highest number of phone lines per capita in the African continent, having gathered the experience of ‘full connectivity’ to the Internet since August 1995 (Anon 1997). The technology is easier to use than before The fact that there was hardly any mention of the Internet, let alone the World Wide Web at the National Seminar on IT in Mauritius in December 1993, compared to its present widespread use demonstrates the success of this technology locally in such a short time. The World Wide Web which underwent exponential growth as from 1992 is one of the most revolutionary development in recent years. The features that drove such popularity are its ease of use and especially the ease with which any user of the Internet can 'publish' information, accessible to the whole world, thus democratising the flow of information. The technology is widely accessible All that is required to access the world of information on the WWW is a computer, a modem and a phone line. The cost of technology to access information has been considerably lowered in relative terms: the cost of an entry level computer has remained constant while the technology now includes multimedia capabilities on these computers. The cost of accessing the Internet has also recently been reduced almost to the cost of local phone calls. The improved speed of access together with affordable loan facilities at the Development Bank of Mauritius now makes the full range of possibilities of the Web technology accessible to any household. Some local agricultural information is already available on the Internet Examples of local agricultural information already available on the Internet include:
• The Faculty of Agriculture website: http://www.uom.ac.mu/foa/foa.htm

A prototype agricultural information system for the agricultural community in Mauritius K J Bheenick
AMAS 1997. Food and Agricultural Research Council, Réduit, Mauritius 47
As part of the University of Mauritius website, the Faculty of Agriculture website provides information about the various courses offered and research projects under way. A list of all the final year dissertation projects carried out by degree students since 1972 is provided. The site also includes a growing directory of relevant agricultural sites, recommended by the Faculty (Figure 1)
Figure 1 The Faculty of Agriculture site on the World Wide Web
Faculty of Agriculture Home Page
Faculty of Agriculture University of Mauritius Réduit, Mauritius TEL:454-1041 Ext. 1234 (Inquiries) FAX:454-9642
The College of Agriculture Building (A.D. 1923)
• Introduction • History of the Faculty • Academic Information • Department of Agricultural Production and Systems • Department of Agricultural and Food Science • Faculty administration • Ongoing Research • Consultancy and Advisory Services • Our recommended links to Agricultural and other sites • Go back to University of Mauritius Home Page
• The Mauritius Sugar Industry Research Institute (MSIRI) website: http://www.refer.fr/mrice_ct/rec/msiri/accueil.htm The site provides a general introduction to the Institute, the organisation of the departments and staff as well as sample pictures of the Mauritius Herbarium collection.
• The Public Relations Office of the Sugar Industry (PROSI) website: http://prosi.intnet.mu
This site contains information about the sugar industry locally and world-wide, as well as back issues of the PROSI magazine from July 1996. This accumulation of on-line information is becoming an important archive of agricultural information. The latest addition to the site is an on-line version of the publication ‘Sugar in Mauritius’.
• The Faculty of Agriculture Vegetable Guide experimental website This site which is only accessible internally at the Faculty of Agriculture is used as a learning ground and testing site for students to develop documents for the Web. Presently, it contains information relevant to the vegetables grown in Mauritius, based on the publication ‘Le guide du petit exploitant; cultures vivrières et potagères’ of the Ministry of Agriculture (MANR 1995)
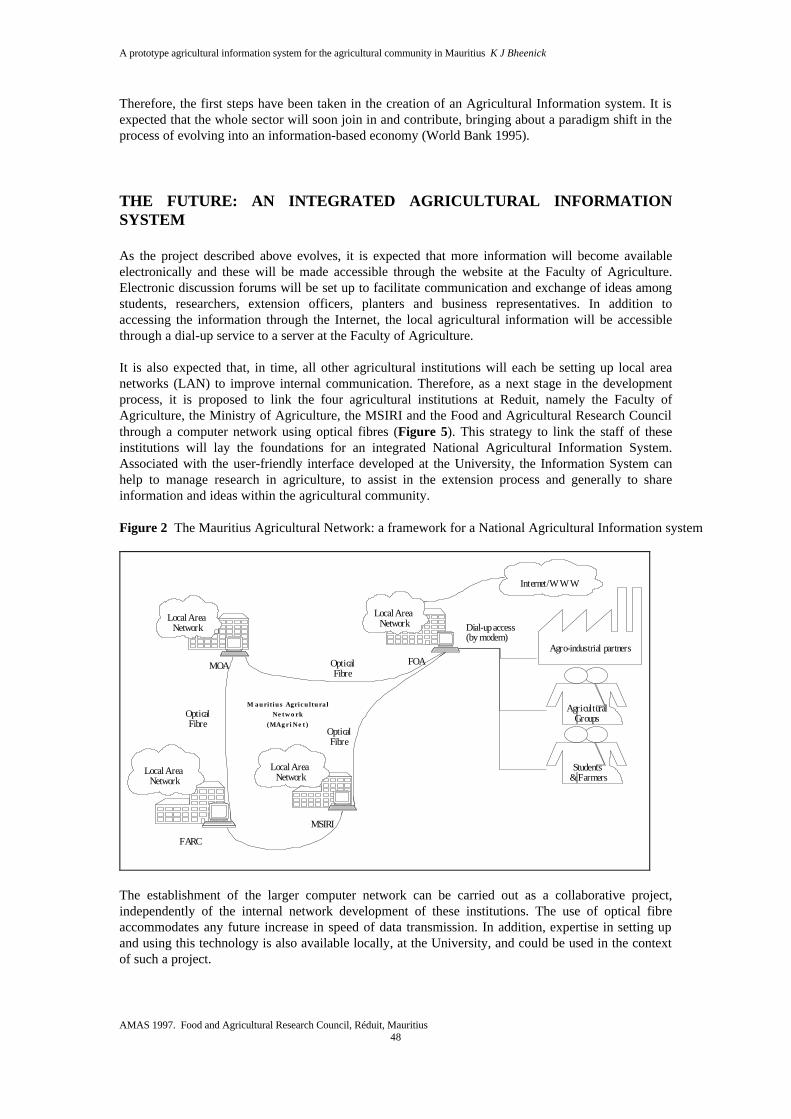
A prototype agricultural information system for the agricultural community in Mauritius K J Bheenick
AMAS 1997. Food and Agricultural Research Council, Réduit, Mauritius 48
Therefore, the first steps have been taken in the creation of an Agricultural Information system. It is expected that the whole sector will soon join in and contribute, bringing about a paradigm shift in the process of evolving into an information-based economy (World Bank 1995). THE FUTURE: AN INTEGRATED AGRICULTURAL INFORMATION SYSTEM As the project described above evolves, it is expected that more information will become available electronically and these will be made accessible through the website at the Faculty of Agriculture. Electronic discussion forums will be set up to facilitate communication and exchange of ideas among students, researchers, extension officers, planters and business representatives. In addition to accessing the information through the Internet, the local agricultural information will be accessible through a dial-up service to a server at the Faculty of Agriculture. It is also expected that, in time, all other agricultural institutions will each be setting up local area networks (LAN) to improve internal communication. Therefore, as a next stage in the development process, it is proposed to link the four agricultural institutions at Reduit, namely the Faculty of Agriculture, the Ministry of Agriculture, the MSIRI and the Food and Agricultural Research Council through a computer network using optical fibres (Figure 5). This strategy to link the staff of these institutions will lay the foundations for an integrated National Agricultural Information System. Associated with the user-friendly interface developed at the University, the Information System can help to manage research in agriculture, to assist in the extension process and generally to share information and ideas within the agricultural community. Figure 2 The Mauritius Agricultural Network: a framework for a National Agricultural Information system
M OAFOA
FARC
M SIRI
Local Area
NetworkLocal Area
Network
Local Area
Network
Local Area
Network
Agro-industrial partners
Agricultural
Groups
Students
& Farmers
Internet/W W W
Optical
Fibre
Optical
Fibre
M auritius AgriculturalNetwork
(M A g r i N e t )
Dial-up access(by m odem)
Optical
Fibre
The establishment of the larger computer network can be carried out as a collaborative project, independently of the internal network development of these institutions. The use of optical fibre accommodates any future increase in speed of data transmission. In addition, expertise in setting up and using this technology is also available locally, at the University, and could be used in the context of such a project.

A prototype agricultural information system for the agricultural community in Mauritius K J Bheenick
AMAS 1997. Food and Agricultural Research Council, Réduit, Mauritius 49
CONCLUSION When asked about the information gap that may exist between people who have access to the Internet and those who do not, Bill Gates, CEO of Microsoft Corporation, commented:-
“Some people are bound to get better information technology than others, just as some inevitably have better access to food, shelter, transportation, medical care, education and entertainment. ...Access to information is fundamental to success nowadays, and everybody should have the opportunity to use PCs and Internet connections...Rural people, minority communities and senior citizens...may need to be encouraged - to be reassured that they are entirely capable of using these new machines and that their efforts will be well rewarded...Forgoing the advantages of information technology won’t promote equal access [to information]” Extract from NEWS ON SUNDAY, 27 July 1997.
This summarises very well the situation facing the agricultural community of Mauritius today. The expansion of the Internet, the widespread use of the World Wide Web as a tool of communication and the liberalisation of world trade are global phenomena which cannot be ignored. Mauritius has to rise to these challenges to sustain development in a dynamic environment as we emerge into an information-based economy. Given that the tools to obtain and share information are already available and accessible in Mauritius, the agricultural community cannot afford to be deprived of information. Mauritius has leapfrogged several stages of development of IT and finds itself in an advantageous situation but it will now have to strive to keep ahead, hence the importance of working towards an integrated Agricultural Information System for the benefit of the agricultural community. REFERENCES ANON. 1997. L’Express 21 Juillet 1997. Port Louis, Ile Maurice : La Sentinelle Ltd. BATZIOS CA, SALAMPASIS M, LIAKOS VD, TAIT J and ANDROULIDAKIS S. 1997 . A
hypermedia digital library for the education and extension of Greek beekeepers. p. 159 - 162. In: KURE H, THYSEN I and KRISTENSEN AR eds. Proceedings first European conference for information technology in agriculture, Copenhagen, 15-18 June 1997. Denmark : The Royal Veterinary and Agricultural University.
GIOVANNETTI JF and ILTIS N. 1997. Etude préparatoire, Volume 1: Synthèse des besoins. Atelier
sur les politiques de gestion de l’information dans les institutions de recherche agricole des pays de l’Ocean Indien, Port Louis, Ile Maurice, 23-25 Juin 1997. Wageningen, Pays Bas : Centre Technique de Cooperation Agricole et Rurale (CTA), 40 p.
HAUTZER HJ, HELBIG R and SCHIEFER GW. 1997. Computer based information and report
system for the support of agricultural extension. Presentation of a prototype. p 23 - 26. In: KURE H, THYSEN I and KRISTENSEN AR eds. Proceedings first European conference for information technology in agriculture, Copenhagen, 15-18 June 1997. Denmark : The Royal Veterinary and Agricultural University.
MANGSTL A, JUDY JR and WARD FLW. 1997. The world agricultural information centre
(WAICENT) : The FAO’s information gateway. p 189 - 198. In: KURE H, THYSEN I and KRISTENSEN AR eds. Proceedings first European conference for information technology in agriculture, Copenhagen, 15-18 June 1997. Denmark : The Royal Veterinary and Agricultural University.
MANR see under Ministry of Agriculture and Natural Resources

A prototype agricultural information system for the agricultural community in Mauritius K J Bheenick
AMAS 1997. Food and Agricultural Research Council, Réduit, Mauritius 50
MAURITIUS SUGAR INDUSTRY RESEARCH INSTITUTE. 1994. A Socio-economic study of small sugar cane planters in Mauritius. MSIRI Occasional Report no. 7. Reduit, Mauritius: Mauritius Sugar Industry Research Institute, 41p.
MINISTRY OF AGRICULTURE and NATURAL RESOURCES. 1995. Le guide du petit exploitant:
Cultures vivrières et potagères. Port Louis, Mauritius : Ministry of Agriculture and Natural Resources, 129 p.
MSIRI see under Mauritius Sugar Industry Research Institute . NATIONAL COMPUTER BOARD and WORLD BANK. 1993. Proceedings of the national seminar
on information technology, organised by the National Computer Board and the World Bank under the aegis of the Ministry of Finance, Mahatma Gandhi Institute, Moka, 8-9 December 1993. Port Louis, Mauritius : National Computer Board, 160 p.
NCB and WB see under National Computer Board and World Bank RICHARDSON D. 1996. The Internet and rural development : Recommendations for strategy and
activity. Final report and executive summary. Rome, Italy : FAO. (Available on WWW at http:/www.fao.org/waicent/faoinfo/sustdev/Cddirect/CDDO/contents.htm).
[WORLD BANK]. 1995. Information technology and the competitive edge. Towards an information
based economy in Mauritius. Mauritius : National Computer Board and Ministry of Finance, 147 p. (A World Bank Study published with the collaboration of the National Computer Board under the aegis of the Ministry of Finance.)
COMMENTS
Remarks: We have been talking about an integrated information system at the FARC for some time. It is high time that we integrate the information on the Réduit Campus.
Remarks were also made on the existing links that the FARC has with the CTA. This was seen as an access to foreign information and more focus should be placed on local information. Communications and links should be improved between local researchers and institutions.
Further remarks were made that the conception of this information will raise a lot of problems, as for example at the MSIRI, there is a lot of existing data bases which is not owned by the institute but by stake holders.
Q. If such an information system is designed, how would farmers get access to it?
A. Initially, it was proposed that there was the need to interprete the information for farmers but it would be best if farmers get direct access to this information. The Geographic Information System (GIS) was cited as an example

AMAS 1997. Food and Agricultural Research Council, Réduit, Mauritius
51
THE IMPORTANCE OF THE FILIERE APPROACH IN MAURITIAN AGRICULTURAL POLICY
K Mundil
University of Mauritius
ABSTRACT
The need to define more sharply and practically our agricultural policy has been increasingly recognised lately. And this, both at the level of producers (e.g with the setting up of various producer associations) and at the level of the State (e.g with the defining of the priority commodities for the Agricultural Research and Extension Unit (AREU’s research programme). This paper argues that the adoption of a filière (or Commodity System) approach is now necessary in order to increase the effectiveness of our agricultural policy. This approach also has the advantage of structuring the relationship between the Ministry and institutional level, and the producer level, and of providing for the setting up of interactive structures involving the various operators in a filière. The experience gained at the Agricultural Marketing Board (AMB) and recent initiatives in other institutions are used as illustrations. It argues for the need for a debate in circles involved with agricultural policy making, so as to generate a consensus about this approach and its eventual adoption.
INTRODUCTION Today the need for agricultural policy to be more responsive to the market is generally accepted. However the traditional interpretation of this orientation has been that governments should allow market signals to operate, so that farmers can receive them and act accordingly. In practice though, just like many other third world countries, our agricultural markets are riddled with various inadequacies; these, affect the operations of the market mechanism, which in practice, have proved inadequate as a mechanism to address the objectives of agricultural policy. This was illustrated by the way the local market responded to the 1994 increase in onion prices, creating surpluses for which there was inadequate storage within less than a year. Improving this situation requires initiatives at two levels (i) at the level of the producers (ii) at the level of the Ministry of Agriculture and its institutions. At the level of the producers, measures are required to generally improve both farm management, and the organisation of farmers within appropriate structures (cooperatives, producer groups and producer associations). We shall deal with this aspect only partly focusing on the role of such structures. This paper proposes to address the level of the Ministry and its associated institutions. In particular it proposes an approach that both complements and supplements the operation of the market mechanism. It addresses its inadequacies by proposing a more focused approach, which at the same time also tackles all the links in a given commodity chain. In so doing, this approach bridges the gap between national agricultural policy and farm level decision making. It can thus help to identify the constraints and policy issues at the intermediate level, and in addressing them help in making agricultural policy more meaningful to producers and other operators in the filière.

The importance of the filière approach in Mauritian agricultural policy K Mundil
AMAS 1997. Food and Agricultural Research Council, Réduit, Mauritius 52
THE HISTORICAL DIMENSION The need to reorientate our agricultural policy away from sugar was put forward formally in the Meade report commissioned prior to our independence (Meade 1968). This was to lead to the setting up of the Agricultural Marketing Board (AMB) as an important step in institutional capacity building to implement the proposed policy of agricultural diversification. The notion of controlled product which was put forward in the AMB act already illustrated the recognition of the need to tackle a number of issues at the commodity level. This was actually done in the first post-independence attempt at developing a white paper in agricultural diversification (NFPC 1974). The various activities which followed the 1979 National Agricultural Production Conference (UOM 1980), such as the National Seminar on Agricultural Diversification (MANRE 1981) and its decision to set up the High Powered Committee on Agricultural Diversification, did touch on the issue. So did the 1983 White Paper on Agricultural Diversification (MANR, 1983). But the dominant orientation then was still on production. It was only during the post 1980’s, and in the 1990’s when the emphasis was placed increasingly on exports, that the other dimensions in the commodity chain started getting attention. THE POLICY MECHANISM
During the 1990’s, as part of the Agricultural Management Services Programme (AMSP), the World Bank helped with the setting-up of an Agricultural Policy Analysis Unit (APAU) at the Ministry of Agriculture, by financing the appointment of a foreign expert as head of the unit. Thus began the process of building the policy generation capacity within the Ministry. However, as yet, there is no clear indication of the stand of the Ministry as to the consolidation of this capacity. No local counterpart has as yet been appointed, and there is still great dependence on World Bank expertise. Nevertheless the usefulness of the policy unit has been amply demonstrated, not least during the process of preparation of a new white paper on agricultural development, which took the form of Initiatives 2000 (MANR 1995). However a major issue has remained as yet unresolved - how much of policy generation initiatives should be taken at the institutional level, and how much of it should be left to the ministry? This grey area in our policy generation mechanism is a major issue which needs to be addressed urgently. It has a bearing on the work of several of our agricultural institutions, e.g the AMB as regards the fresh milk filière, AREU as regards its priorities and resource endowment for commodities falling under its areas of responsibility, the MSIRI as regards its R & D policy in various food crops. This issue of the balance between the ministry and institutional level is obviously related to the personal orientation of individual ministers. However our concern is not this subjective dimension, but rather the objective requirements of the adoption of a filière approach by the ministry. In other words, how much of the management of specific filières should be handled at the ministry level, and how much of it should be devolved at the institutional level. As we shall see when we examine the actual experience gained in this process in Mauritius, there is a further dimension which needs to be addressed once the sharing out of responsibilities has been agreed. This concerns the recognition of the limitations at the institutional level in the policy generation process. Once the issues are clarified technically at the institutional level, there are a series of administrative and legislative issues which can only be addressed at the ministry level. It is thus up to management at the institutional level to recognise these issues, situate them in their policy context and pass them on to the ministry level for decision-making.

The importance of the filière approach in Mauritian agricultural policy K Mundil
AMAS 1997. Food and Agricultural Research Council, Réduit, Mauritius 53
THE THEORETICAL DIMENSION The filière (or commodity system) can refer to either a group of commodities or a single commodity. It involves all the operations (and operators) in the production, processing, distribution and consumption stages of the commodity chain. The filière involves the carrying out of various functions, although these can be regrouped under two sets of functions (i) Physical functions (ii) Commercial functions. Various operators are associated with these functions, and as there is a cost associated with each function, a margin has to be made by each of the operators. The margins made are dependent on the functions, the costs, the risks involved and the “rapport de forces” in favour of the operator within the system. Various stages are involved in a commodity chain, but two main ones can be identified (i) the production period (ii) the distribution period. The length of the chain also varies, and in many developing countries, there are long commodity systems, characterised by a high level of fragmentation within the various stages. As the system develops, the degree of fragmentation is reduced. This process also requires the development of the necessary logistics at both the production and distribution periods. Another characteristic of such systems (especially in developing countries) is the existence of bottlenecks within the chain. Therefore changes to part of the system (e.g at the production end), although useful, are not long lasting. Therefore the system needs to be looked at as a whole, and the overall system has to be improved. Traditionally, the commodity system is looked at from a vertical perspective i.e. from upstream (at the inputs and production end) to downstream (at the distribution/consumption end). Generally though, production issues have had most attention in developing countries, whereas there has been under-estimation of the downstream functions and the socio-economic problems associated with them. The filière approach requires that a horizontal perspective be added to the vertical one, to generate a more global view of the system. Thus the traditional filière needs to be associated with the related public services and the surrounding socio-economy (Figure 1). Development of the filière therefore also involves institutional development in parallel. These two types of development thus need to be addressed together to enhance the effectiveness of the filière approach. In terms of agricultural policy, the filière approach will help to focus attention on the sub-sectoral and filière level issues, which are often neglected. STATE V/S PRIVATE OPERATORS One of the key issues in the filière approach is whether the initiative for structuring the filière and addressing its constraints should come from the state and its institutions or should be an initiative of the private operators within the filière. There is no simple answer to this question. There are conditions which would favour one or the other approach or even a combination of both. However whichever be the alternative concerned, a crucial and necessary condition which would favour the development of the filière is whether there is a dynamic and proactive management, committed to its development and to the encouragement of a dialogue among the various operators in a filière. Such a type of management can exist in either a state or private sector situation, although it more often tends to be associated with the private sector. Another element of the answer has to do with the weight of the institutional set-up in the filière, and whether the institutions concerned would be more responsive to coordination by a state institution or by a private sector one. The obvious answer in this case is that they would favour coordination by a state agency. Yet another element has to do with the degree of organisation of the producers (or more

The importance of the filière approach in Mauritian agricultural policy K Mundil
AMAS 1997. Food and Agricultural Research Council, Réduit, Mauritius 54
widely of the operators) involved in a given filière. This will depend on their numbers and their heterogeneity and also on the conditions for leadership among such producers or operators.
Figure 1 The Filière Approach
Upstream
Downstream
Inputs
Production
Processing
Distribution
Consumption

The importance of the filière approach in Mauritian agricultural policy K Mundil
AMAS 1997. Food and Agricultural Research Council, Réduit, Mauritius 55
It will also depend on the sharpness of the conflict of interests between different operators within the system, such as often happens between producers and processors. The sharper the contradictions, the more difficult it would be for different types of operators to work together, and this may favour coordination by a state agency which would also act as an arbitrator. Unorganised producers/operators would be unable to address certain functions (e.g storage of onions) which require the collective action of producers. This applies also to operators involved in wholesaling or retailing. Thus, the organisation of operators at the marketing stage can contribute significantly to improving the efficiency of the system, such as for example, the handling of produce. The degree of organisation of producers within the filière will be a major factor affecting the balance of forces in their favour, and subsequently the margin that they would obtain. In cases where private operators have succeeded in structuring their filière, we refer to the structure set up as a result, as an “inter-profession”. In several developed countries, especially France, such “inter-professions” have consolidated themselves over time and succeeded in greatly improving the efficiency of the filière, or even in getting a brand name accepted for their produce. The Horticultural Crops Development Authority (HCDA) in Kenya is an example of the filière approach from a state institution perspective. In this case, the large numbers of producers as yet insufficiently organised, and the exigencies in terms of timeliness and quality and environmental standards of the export market favoured the development of a new institutional set-up in the form of the HCDA to take up this developmental challenge. On the other hand, the existence of a bunch of relatively large operators (organised sometimes in the form of private firms) favoured the structuring of the Horticultural Products filière in Mauritius by the private sector. The existence of a strong Mauritius Chamber of Agriculture, which provided the secretarial facilities, and the services of a lawyer, helped in the establishment of APEXHOM (Association des Producteurs et Exportateurs Horticoles de Maurice). It was subsequently able to associate with itself smaller producers in the filière. ILLUSTRATING THE PRACTICAL IMPORTANCE OF THE FILIERE APPROACH As pointed out in the discussion of the issue above, there is now an increasing need to move away from production issues for many of our commodities, and address the processing, distribution and consumption issues. In order not to repeat the mistakes of the earlier phases of agricultural diversification, it is now necessary not only to shift attention from upstream to downstream issues, but to take a more holistic approach to agricultural policy making at the sub-sectoral and intermediate levels generally. The time for the filière approach has thus come, and it is important that this be recognised in our agricultural policy-making. However the practical implications of this approach have yet to be properly understood. Local experience with the filière approach This section will not be exhaustive. Rather it will bring out the more pertinent points of this local experience. The first experience concerns the setting up of APEXHOM. This organisation having been rapidly and efficiently set up was to soon lose its first secretary general to the University. It also brought about a rapid change in its leadership once the inception phase was over. Even though it has gone through a new phase of consolidation with its new secretary general, it still faces contradictions between small and large operators. However the creation of APEXHOM has shown that the private

The importance of the filière approach in Mauritian agricultural policy K Mundil
AMAS 1997. Food and Agricultural Research Council, Réduit, Mauritius 56
sector can succeed in setting up an “inter-profession” and provide it with able managerial and technical capacity. APEXHOM has also organised various seminars, including regional ones with international participation and has done a lot of groundwork through its technical committees to tackle issues related to specific products (e.g lychees, pineapples etc.). But the main problem remains the lack of a clear national policy, and its ensuing institutional arrangements, relating to horticultural products. The Agricultural Exports Guarantee Scheme was transferred from the Mauritius Export Development and Investment Authority (MEDIA) to the AMB. But whereas an Agricultural Export Council was being envisaged, in practice, it is an agency, APEPA (Agricultural Products Export Promotion Agency) which was set up by legislation. As yet, APEPA is not operational, and the relationship between it and APEXHOM has yet to be clarified. It is desirable that the present institutional deadlock be resolved through an appropriate forum with participation from relevant concerned parties, including professionals who have worked on the issue. The second experience occurred at the AMB during 1995. It concerned two commodities : fresh milk and onions. There were also attempts to tackle a third commodity : potatoes. Fresh milk During that time, the AMB tried to adopt a facilitative as opposed to a control perspective to this commodity. With the help of two technicians, one from AFDI (Agriculteurs Français pour le Développement International) and another seconded from the Agricultural Services of the Ministry of Agriculture, the section dealing with this commodity at the AMB was reorganised. A technical Committee was set up, involving initially the technicians associated with this commodity system, primarily from the AMB and the associated services. However this committee soon became a misnomer as it was enlarged to include the producers, and certain other operators within the system. The need was therefore felt to set up a separate management committee for this commodity involving primarily AMB staff, but to which were coopted the key technicians from the other government services. A major achievement of this process of organisation of the filière was that a series of bottlenecks associated with this commodity system was identified, including several which required various policy measures. The various institutions involved, then shared the responsibility of coping with the bottlenecks identified. Those that required policy action, were taken up in a policy letter which was prepared by the AMB and submitted to the Ministry of Agriculture and Natural Resources via the board of the AMB. Onions Another Technical Committee on Onions (TCO) was also set up involving participation from AREU, the Agricultural Services and the Faculty of Agriculture. The TCO identified four areas which it considered as the main bottlenecks for this filière. These were (i) Research (2) Seeds (3) Production (4) Storage. Policy papers were prepared on all these four areas. Upon the recommendation of the TCO, the Board of the AMB agreed to recommend to the Ministry the setting up of a National Onion Committee (NOC) along lines which had similarities with the National Potato Committee. This recommendation was accompanied by a policy letter on onions. It is to be noted that on some occasions, an informal “NOC” had already been convened a few times at the AMB. However the NOC was to have more responsibilities than the National Potato Committee which in practice is concerned with seed production and seed uptake by potato producers.
The third experience occurred during the national tomato planning workshop organised by the Food Crops Division of the MSIRI at the end of 1996. Although the workshop was geared primarily to generate an R & D agenda for tomato, it could not help touching on various other constraints associated with the tomato filière generally. The participants were aware that the workshop had provided an opportunity to address the problems of the filière generally. However the Foodcrops Division had a more limited objective in organising this workshop. This may well result in this first

The importance of the filière approach in Mauritian agricultural policy K Mundil
AMAS 1997. Food and Agricultural Research Council, Réduit, Mauritius 57
exercise to understand the workings of the tomato filière, not being picked up by a “coordinating body for tomato” which would address the issues raised.
This illustrates vividly our point about the need to ascribe institutional responsibility for the filière to a particular institution, even if the mandate of that institution was to be limited to implementing only part of the issues relating to the filière. The other aspects could thus have been passed on to the ministry level in the form of a policy letter on tomato.
The last experience has to do with the recent exercise to establish AREU’s priorities for various commodities. Again although a lot of effort and money was invested in this exercise, it was limited mainly to the research dimension and the other filière constraints inadequately addressed. In addition, the research agenda itself, I understand, has been limited mainly to the technical aspects of production, although in some cases some of the post-harvest aspects have been considered. How and when do we research into the other filière constraints?
To illustrate the point, I understand that in spite of this exercise, research on onions still depends on one scientific officer investigating the agronomic aspects, and this even though this crop is of major importance to our agricultural diversification policy.
Practical Implications
First and foremost, there is need to recognise the pertinence of this approach if we are to be effective in our agricultural policy making. This will not only require the rallying of our main policy makers, including the Minister of Agriculture, to this position, but also the generation of a consensus amongst all major players, including operator organisations, in the agricultural sector. I believe there is need for a national seminar on this issue. Secondly there is need for the Ministry of Agriculture to consolidate its policy making capacity by building up its institutional arrangements. This should go beyond the recruitment of advisers and concern instead institutional capacities on a long-term basis. Practically, this means consolidating APAU.
It also means working out the role of our agricultural institutions (FARC, MSIRI, AREU, AMB, FSC, the Faculty of Agriculture etc) in policy generation and the division of tasks between the institutional level and the Ministry level. Actual devolution of responsibilities at the institutional level will depend on whether there exists a substantial institutional responsibility for a given commodity or group of commodities; and on the managerial and technical capacity within the institution to contribute to policy generation, by preparing policy documents relating to various filières for consideration by the Ministry. Such documents would identify the national policy issues which require clarification and spell out the type of action required to clarify them (e.g administrative or legislative etc.). It would also identify the main constraints to be overcome to increase the effectiveness of the filière, and propose remedial action for them, or the setting up of a process which would generate such remedial action, including the build-up of appropriate logistics. There is need to structure our main filières appropriately, with different weights in terms of state or private sector responsibility depending on the specificity of the filière. There is need to provide the body responsible for the coordination of the filière with appropriate facilities. Wherever and whenever necessary, relevant interfaces will need to be built up between such coordinating bodies and the Ministry of Agriculture.

The importance of the filière approach in Mauritian agricultural policy K Mundil
AMAS 1997. Food and Agricultural Research Council, Réduit, Mauritius 58
CONCLUSION The above analysis amply demonstrates the need for our agricultural policy to adopt the filière approach and thus develop a holistic view of how to tackle the commodity systems of our major agricultural commodities or group of commodities. The fact that our agricultural institutions have specific mandates relating to these commodities (e.g the MSIRI for R & D in tomato) does not preclude the adoption of this approach with the aim of developing the broader policy picture relating to the whole of the filière. The specific institutional task can then be resituated in that broader context, and the ministry would be better able to allocate other tasks relating to other aspects of the filière to other institutions. Such an approach does not diminish the responsibilities of private operators (involved in various filières) to help structure their filières, and this in collaboration with the various institutions concerned. This should enable them to propose to the ministry a plan of how to address and overcome the constraints in their respective filières. ACKNOWLEDGEMENTS The ideas in this paper are the result of a slow maturing process which has involved various people. I am grateful to Kailash Ruhee ex-Minister of Agriculture who responded positively to my initiatives during my term as General Manager of the AMB, to Prem Mohith, then Chairman of the AMB, and to my colleague and friend Dr Saheed Goburdhun, for his help and collaboration. I am also grateful to Dr Noël Govinden (MSIRI) and Mr Krishna Kumar, Head of APAU (Ministry of Agriculture) for enriching my thoughts, and last but not least to the many small producers and their organisations for sharing their experiences and sharpening my insights into our agricultural problems. REFERENCES
MANR see under Ministry of Agriculture and Natural Resources. MANRE see under Ministry of Agriculture, Natural Resources and the Environment. MEADE JE. 1968. The economic and social structure of Mauritius. 246 p. (Report to the Governor of
Mauritius). MINISTRY OF AGRICULTURE and NATURAL RESOURCES 1995. Initiatives 2000. Towards
revitalising Mauritian agriculture. Port Louis, Mauritius : MANR, 37 p. MINISTRY OF AGRICULTURE and NATURAL RESOURCES. 1983. White Paper on agricultural
diversification. Port Louis, Mauritius : [Ministry of Agriculture and Natural Resources], 40 p. MINISTRY OF AGRICULTURE, NATURAL RESOURCES and THE ENVIRONMENT. 1981.
Seminar on agricultural diversification , August 1980 : Plan of action. Port Louis, Mauritius : MANRE, 26 p.
NATIONAL FOOD PRODUCTION COMMITTEE. 1974. Report of the National Food Production
Committee. [Port Louis], Mauritius : [NFPC], 116 p. NFPC see under National Food Production Committee.

The importance of the filière approach in Mauritian agricultural policy K Mundil
AMAS 1997. Food and Agricultural Research Council, Réduit, Mauritius 59
UNIVERSITY OF MAURITIUS . 1980 . Proceedings National Agricultural Production Conference, 10-15 December 1979, University of Mauritius. Edited by A. Peerally. Réduit, University of Mauritius : 521 p.
UOM see under University of Mauritius COMMENTS Q. Would it not be better if the initiative for developing filières came from the private sector rather
than from Government? A. There is no a-priori answer; it depends on the characteristics of filières; in cases where there are a
few large producers, the initiative may be taken by the private sector, but in cases where there are a large number of scattered operators without the capacity to coordinate and manage the filière, it would be better that the initiative be taken by state owned institutions as quoted for onion and milk

60

AMAS 1997. Food and Agricultural Research Council, Réduit, Mauritius
61
EFFECTIVENESS OF IRRIGATION IN MAURITIUS
V Proag
University of Mauritius ABSTRACT It is often said that crop yields in the north of Mauritius are low, and that irrigation needs to be carried out . Official statistics were used to analyse the crop yields over the island. Over a long period, however, small planters over the island do obtain more or less similar yields. This indicates that with the present distribution of water resources and rainfall, the yields in the so called dry regions are not so low as may be imagined. The reasons for this include soil type, underlying geology and inappropriate irrigation methods. There is a need, however, for a proper investigation into the real marginal increase in yield arising from irrigation, both with respect to water added and to incurred costs. INTRODUCTION Mauritius is endowed with a climate that cannot be said to be dry. Occasionally, there are dry spells which bring with it low crop yields. It is (or always has been) said that yields in the north of Mauritius are low and that irrigation needs to be carried out. As a result, many irrigation projects have been developed or imagined, in particular for the north of the island. In a similar context, during the implementation of the Bel Air-St.Félix irrigation scheme, several lava tunnels and cavities were discovered, some of appreciable size. One may wonder whether the irrigation water is effectively used, or does it just go down the drain i.e. the lava tunnel. In case this seems far-fetched, it may be interesting to note the following illustration. People in Solitude (Woventex) noticed that water was running down a drain even when it was dry weather. The mystery was cleared when it was observed that this happened just after sprinkler irrigation had taken place two fields away. ANALYSIS OF CROP YIELDS IN MAURITIUS Different documents issued by the Central Statistical Office, in particular the Annual Digest of Agricultural Statistics, were used to obtain the yields either directly when available, or else by derivation from production figures and their respective areas. This exercise was carried out, both for sugar cane and vegetables, for a number of years. An analysis of cane production with respect to area cultivated has given the following results: Table 1: This table compares the yields of sugar cane in the north as a region with the island average for all planters and for small planters. As can be seen for some years, the yield in the north is above the island average. The 14 year average shows that the yield in the north is quite close to the island average (90% for all categories combined). The figures for small planters are equally surprising, the overall average for the region being only 97% of that for the island.

Effectiveness of irrigation in Mauritius V Proag
AMAS 1997. Food and Agricultural Research Council, Réduit, Mauritius 62
Table 1 Comparison of average sugar cane yields t ha-1 Northern Region v/s Island
Year All Planters Small Planters
Island Region % Island Region % 1981 68 55 82 55 47 85 1982 82 83 101 73 75 103 1983 67 60 89 57 55 98 1984 64 51 80 52 46 87 1985 72 68 94 63 62 99 1986 78 80 103 70 75 108 1987 81 81 100 73 76 105 1988 72 56 79 59 51 87 1989 71 69 97 61 64 105 1990 73 66 90 60 60 101 1991 74 52 70 58 46 80 1992 77 71 92 65 66 102 1993 73 64 88 63 60 95 1994 66 62 95 57 59 103 Mean 73 66 90 62 60 97
Table 2 : A similar analysis has been carried out for other crops grown all over the island. The results are not less surprising. In some cases, the yields are two to three times the average yields elsewhere, which could mean that two or three crops have been produced in that year. Unfortunately, the statistical figures do not provide further information. The theoretical yield is that given by the Ministry of Agriculture. THE NORTHERN PLAINS IRRIGATION PROJECT The Northern Plains Irrigation Project started in the 1970's: More specifically, the Huntings (1974) reports and subsequent reports give the location of the project area as shown in Figure 1. The irrigation project area for Phase II did not change either when the studies for Midlands dam project were initiated in March 1991. However, in the latest reports available, it would seem that the location of the Phase II project area has changed (Figure 2). What are the technical reasons behind such a change? ). A closer examination of Figure 2 shows that the proposed irrigation area lies more within land unit 1.4 as described in the Land Suitability Map (Arlidge and Wong You Cheong 1975). The description:
" The very rocky nature of the soil, the decreased depth, and the frequency of lava bedrock exposures now exert a moderately severe physical soil limitation on the land for crop production, particularly large-scale mechanised cropping. As well, most of land unit 1.4 has a climate with marked seasonal moisture deficiency and this factor, coupled with the comparatively low available moisture capacity of the soil (less than 5 cm water held between 0.1 bar and 2 bar suction in the top 15 cm or less than 13.5 mm over the same suction range held in 45 cm depth where the soil above parent material rocks reaches this depth), places a severe limitation on the land for crop production."
gives some food for thought. Is it worth irrigating in this area?

Effectiveness of irrigation in Mauritius V Proag
AMAS 1997. Food and Agricultural Research Council, Réduit, Mauritius 63
Table 2 Actual yield of vegetables compared to theoretical yield t ha -1
District Yield of Potatoes t ha -1 Yield of Maize t ha -1
1986 1987 1988 1989 1990 Mean 1986 1987 1988 1989 1990 Mean
R du Rempart 18 18 9 24 20 18 3.2 4.0 3.8 4.2 3.6 3.8
Pamplemousses 19 16 17 19 17 17 3.5 3.3 3.2 2.8 1.8 2.9
Moka 19 20 18 20 19 19 3.3 2.7 3.0 2.9 3.4 3.1
Flacq 22 16 19 11 18 17 5.2 3.8 4.3 3.5 3.7 4.1
Black River 17 11 20 19 13 16 4.0 3.1 4.1 4.9 3.6 3.9
Plaines Wilhems 25 22 16 20 17 20 7.7 6.4 7.0
Grand Port 14 22 20 18 15 17 4.4 3.3 2.6 3.6 6.4 4.1
Savanne 22 20 22 26 21 22 4.4 3.1 5.3 4.7 4.7 4.4
Mean 20 20 19 21 18 20 4.4 3.6 3.8 3.7 4.2 3.9
Pure Stand : 19 - 28 t ha -1 Pure Stand : 3 - 7 t ha -1
Theoretical Yield Interline crop: 12 - 17 t ha - 1 for virgin cane Interline crop: 1 - 2 t ha -1
Interline crop: 6 - 8 t ha - 1 for ratoon cane
District Yield of Groundnuts t ha -1 Yield of Onions t ha -1
1986 1987 1988 1989 1990 Mean 1986 1987 1988 1989 1990 Mean
R du Rempart 3.2 3.6 3.1 4.1 3.5 3.5 8 6 7 7 8 7
Pamplemousses 3.5 2.5 2.7 2.5 2.9 2.8 9 14 9 10 11 10
Moka 4.0 3.6 3.1 3.8 5.5 4.0 5 11 14 10 10
Flacq 2.6 3.1 3.0 2.9 3.4 3.0 9 8 8 10 9 9
Black River 3.5 3.5 3.3 2.2 2.8 3.1 25 26 25 24 26 25
Plaines Wilhems 3.7 3.8 3.6 4.1 6.3 4.3 16 19 18 19 12 17
Grand Port 2.7 2.7 2.6 3.3 3.7 3.0 8 6 9 6 10 8
Savanne 3.4 3.8 2.9 3.0 2.0 3.0 10 11 11 10 9 10
Mean 3.1 3.2 3.0 3.3 3.0 3.1 11 11 13 13 12 12
Theoretical Yield Pure Stand: 2.8 - 5.2 t ha -1 Pure Stand : 7 - 36 t ha -1
District Yield of Tomatoes t ha -1
1986 1987 1988 1989 1990 Mean
R du Rempart 11.2 8.2 8.1 9.7 11.8 9.8
Pamplemousses 13.5 11.3 13.5 13.1 13.1 12.9
Moka 25.7 19.0 18.3 17.9 18.6 19.9
Flacq 10.3 9.4 8.5 8.0 9.1 9.0
Black River 21.2 19.2 17.8 19.5 20.1 19.6
Plaines Wilhems 19.6 14.5 1.5 1.4 12.4 9.9
Grand Port 8.3 9.2 7.7 9.3 9.2 8.7
Savanne 14.8 12.4 11.7 10.8 11.1 12.2
Mean 12.3 10.5 10.2 11.0 11.9 11.2
Theoretical Yield Pure Stand: 10 - 28 t ha -1
Both the soil map of Mauritius (scale 1: 100 000) (Parish and Feillafé 1965) and the pedological map (scale 1:50 000) (Williame 1984) confirm the rocky nature of the area. Rocks would need to be removed to a depth of about 50 cm. This means that this land is not very suitable for agriculture. Centre pivot irrigation will be difficult in the north. Thus high capital investment is required for derocking and irrigation to attain economic productivity levels. This should be considered in the economic aspects of the project assessment.

Effectiveness of irrigation in Mauritius V Proag
AMAS 1997. Food and Agricultural Research Council, Réduit, Mauritius 64
IMPACT OF IRRIGATION ON CANE YIELD Table 1 indicates that apparently the north is not deficient in sugar cane production. Tables 3 and 4 confirm this view through the yields of cane and sugar obtained throughout the island. These two tables show the annual yields and standard deviation over the 1980-1994 period. Figure 3 maps the isohyets and the yields of sugarcane in the different parts of the island. Other observations that may be made relate to the choice of location of irrigation projects. Why should areas receiving high rainfall be irrigated ? It is possible that several essential criteria may have been overlooked.
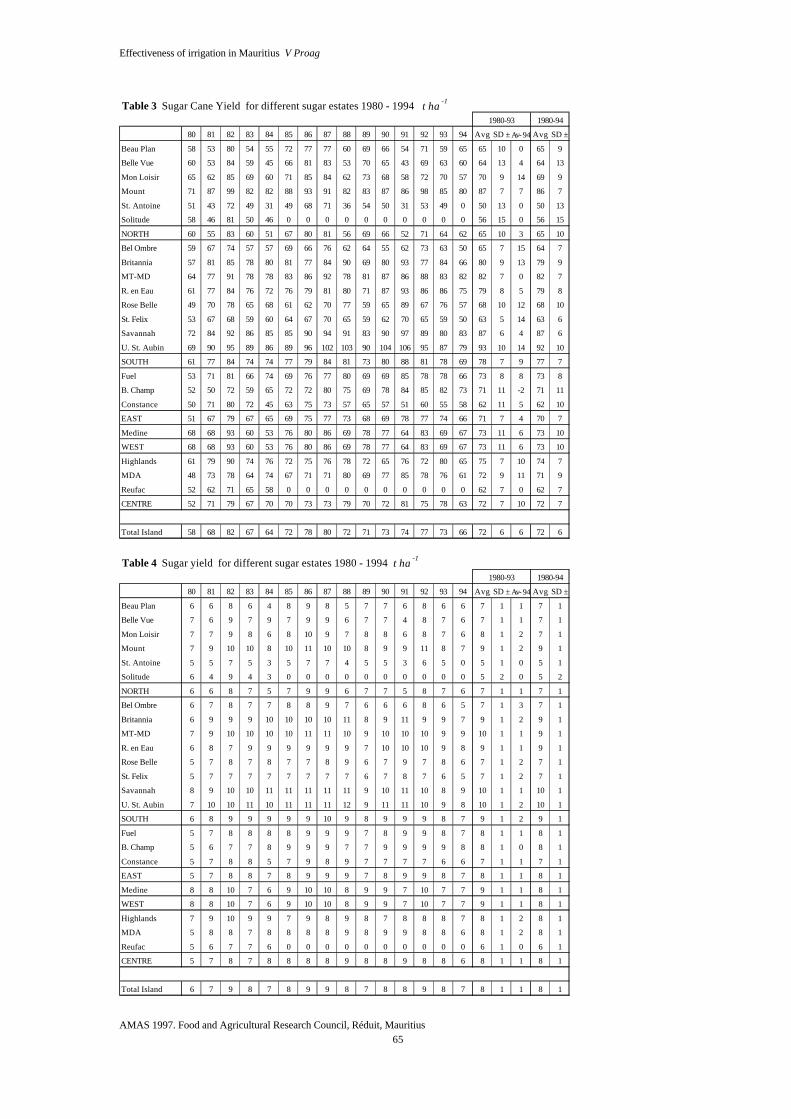
Effectiveness of irrigation in Mauritius V Proag
AMAS 1997. Food and Agricultural Research Council, Réduit, Mauritius 65
Table 3 Sugar Cane Yield for different sugar estates 1980 - 1994 t ha-1
1980-93 1980-94
80 81 82 83 84 85 86 87 88 89 90 91 92 93 94 Avg SD ±Av-94Avg SD ±
Beau Plan 58 53 80 54 55 72 77 77 60 69 66 54 71 59 65 65 10 0 65 9
Belle Vue 60 53 84 59 45 66 81 83 53 70 65 43 69 63 60 64 13 4 64 13
Mon Loisir 65 62 85 69 60 71 85 84 62 73 68 58 72 70 57 70 9 14 69 9
Mount 71 87 99 82 82 88 93 91 82 83 87 86 98 85 80 87 7 7 86 7
St. Antoine 51 43 72 49 31 49 68 71 36 54 50 31 53 49 0 50 13 0 50 13
Solitude 58 46 81 50 46 0 0 0 0 0 0 0 0 0 0 56 15 0 56 15
NORTH 60 55 83 60 51 67 80 81 56 69 66 52 71 64 62 65 10 3 65 10
Bel Ombre 59 67 74 57 57 69 66 76 62 64 55 62 73 63 50 65 7 15 64 7
Britannia 57 81 85 78 80 81 77 84 90 69 80 93 77 84 66 80 9 13 79 9
MT-MD 64 77 91 78 78 83 86 92 78 81 87 86 88 83 82 82 7 0 82 7
R. en Eau 61 77 84 76 72 76 79 81 80 71 87 93 86 86 75 79 8 5 79 8
Rose Belle 49 70 78 65 68 61 62 70 77 59 65 89 67 76 57 68 10 12 68 10
St. Felix 53 67 68 59 60 64 67 70 65 59 62 70 65 59 50 63 5 14 63 6
Savannah 72 84 92 86 85 85 90 94 91 83 90 97 89 80 83 87 6 4 87 6
U. St. Aubin 69 90 95 89 86 89 96 102 103 90 104 106 95 87 79 93 10 14 92 10
SOUTH 61 77 84 74 74 77 79 84 81 73 80 88 81 78 69 78 7 9 77 7
Fuel 53 71 81 66 74 69 76 77 80 69 69 85 78 78 66 73 8 8 73 8
B. Champ 52 50 72 59 65 72 72 80 75 69 78 84 85 82 73 71 11 -2 71 11
Constance 50 71 80 72 45 63 75 73 57 65 57 51 60 55 58 62 11 5 62 10
EAST 51 67 79 67 65 69 75 77 73 68 69 78 77 74 66 71 7 4 70 7
Medine 68 68 93 60 53 76 80 86 69 78 77 64 83 69 67 73 11 6 73 10
WEST 68 68 93 60 53 76 80 86 69 78 77 64 83 69 67 73 11 6 73 10
Highlands 61 79 90 74 76 72 75 76 78 72 65 76 72 80 65 75 7 10 74 7
MDA 48 73 78 64 74 67 71 71 80 69 77 85 78 76 61 72 9 11 71 9
Reufac 52 62 71 65 58 0 0 0 0 0 0 0 0 0 0 62 7 0 62 7
CENTRE 52 71 79 67 70 70 73 73 79 70 72 81 75 78 63 72 7 10 72 7
Total Island 58 68 82 67 64 72 78 80 72 71 73 74 77 73 66 72 6 6 72 6
Table 4 Sugar yield for different sugar estates 1980 - 1994 t ha-1
1980-93 1980-94
80 81 82 83 84 85 86 87 88 89 90 91 92 93 94 Avg SD ±Av-94Avg SD ±
Beau Plan 6 6 8 6 4 8 9 8 5 7 7 6 8 6 6 7 1 1 7 1
Belle Vue 7 6 9 7 9 7 9 9 6 7 7 4 8 7 6 7 1 1 7 1
Mon Loisir 7 7 9 8 6 8 10 9 7 8 8 6 8 7 6 8 1 2 7 1
Mount 7 9 10 10 8 10 11 10 10 8 9 9 11 8 7 9 1 2 9 1
St. Antoine 5 5 7 5 3 5 7 7 4 5 5 3 6 5 0 5 1 0 5 1
Solitude 6 4 9 4 3 0 0 0 0 0 0 0 0 0 0 5 2 0 5 2
NORTH 6 6 8 7 5 7 9 9 6 7 7 5 8 7 6 7 1 1 7 1
Bel Ombre 6 7 8 7 7 8 8 9 7 6 6 6 8 6 5 7 1 3 7 1
Britannia 6 9 9 9 10 10 10 10 11 8 9 11 9 9 7 9 1 2 9 1
MT-MD 7 9 10 10 10 10 11 11 10 9 10 10 10 9 9 10 1 1 9 1
R. en Eau 6 8 7 9 9 9 9 9 9 7 10 10 10 9 8 9 1 1 9 1
Rose Belle 5 7 8 7 8 7 7 8 9 6 7 9 7 8 6 7 1 2 7 1
St. Felix 5 7 7 7 7 7 7 7 7 6 7 8 7 6 5 7 1 2 7 1
Savannah 8 9 10 10 11 11 11 11 11 9 10 11 10 8 9 10 1 1 10 1
U. St. Aubin 7 10 10 11 10 11 11 11 12 9 11 11 10 9 8 10 1 2 10 1
SOUTH 6 8 9 9 9 9 9 10 9 8 9 9 9 8 7 9 1 2 9 1
Fuel 5 7 8 8 8 8 9 9 9 7 8 9 9 8 7 8 1 1 8 1
B. Champ 5 6 7 7 8 9 9 9 7 7 9 9 9 9 8 8 1 0 8 1
Constance 5 7 8 8 5 7 9 8 9 7 7 7 7 6 6 7 1 1 7 1
EAST 5 7 8 8 7 8 9 9 9 7 8 9 9 8 7 8 1 1 8 1
Medine 8 8 10 7 6 9 10 10 8 9 9 7 10 7 7 9 1 1 8 1
WEST 8 8 10 7 6 9 10 10 8 9 9 7 10 7 7 9 1 1 8 1
Highlands 7 9 10 9 9 7 9 8 9 8 7 8 8 8 7 8 1 2 8 1
MDA 5 8 8 7 8 8 8 8 9 8 9 9 8 8 6 8 1 2 8 1
Reufac 5 6 7 7 6 0 0 0 0 0 0 0 0 0 0 6 1 0 6 1
CENTRE 5 7 8 7 8 8 8 8 9 8 8 9 8 8 6 8 1 1 8 1
Total Island 6 7 9 8 7 8 9 9 8 7 8 8 9 8 7 8 1 1 8 1

Effectiveness of irrigation in Mauritius V Proag
AMAS 1997. Food and Agricultural Research Council, Réduit, Mauritius 66
Figure 3 Isohyets and yields of cane and sugar in different parts of Mauritius
These include yield of sugar cane, soil type, etc. In particular, consider the two areas of St. Félix and St. Aubin. They are situated within the same rainfall belts. Yet the sugar cane yields over a 15-year period vary by nearly 30 t ha-1. What is the explanation? Surely not rainfall or irrigation. How do the yields in the north and the west compare? How do the yields in the north and the south compare? Is a higher rainfall ( and by extension - irrigation ) the real solution ? Or should we recall the introduction above? If these conclusions are correct, it raises the question whether there is need for extra irrigation in the north, or should extra irrigation be provided all over the island. Results for vegetables show similar trends. If the conclusions regarding the economic benefits accruing from irrigation are considered once more, serious doubts may be raised about the need for further irrigation over the island. Of course, the question is not to stop irrigation. The problem lies in understanding (1) that the extra water which is being used for irrigation may not be effective at all i.e. it is not increasing the yield at all (2) that there is no possibility of recovering the expenditure incurred. This is the marginal costing exercise. (3) that the extra water might instead be diverted to some other uses like potable water supply.
The question is to use irrigation efficiently and judiciously.

Effectiveness of irrigation in Mauritius V Proag
AMAS 1997. Food and Agricultural Research Council, Réduit, Mauritius 67
CROP YIELDS - WATER ADDED RELATIONSHIP When the water supply is plentiful throughout the growing season, a cropped field can be expected to undergo maximal evapotranspiration rate (MET) and to attain full potential yield - provided, of course that no additional constraining factors such as pest infestations or nutrient deficiencies interfere. When water is limiting, water use may fall below MET. Consequently, crop yield is related functionally to crop water use (dictated by the water supply), but this relation may not be a simple one (Figure 4). Interest in the functional dependence of crop yields on water supply and use has grown in recent years because of the increasing scarcity of water for irrigation. It is useful to note here that beyond a certain amount of water, the yield does not increase, but in fact decreases. How often is water added to the plant when probably none is necessary? The first comprehensive analysis of the relation between transpiration and yield was offered by de Wit (1958). In climates with a large percentage of bright sunshine duration ( i.e. arid regions) a relation such as Y = m(AT/PE) exists between dry matter yield Y and the ratio of actual transpiration AT and potential (free-water) evaporation PE, m being the proportionality coefficient. In climates, with a limited duration of bright sunshine (temperate regions), the relation Y = n(AT) was found. i.e. dry matter production is proportional to transpiration and hence the ratio of yield increment to water increment is constant. The values of the constants m and n are characteristic of each crop. The relation of yield to evapotranspiration is more complicated than that of yield to transpiration, owing to the variable component of evaporation from the soil surface. An empirically based equation to predict yield from known values of evapotranspiration was given by Stewart et al. (1977) for dry matter production: Y/Ym = 1 - b(ETD) = (1-b) + b(AET/MET) where Y = dry matter yield Ym = maximum attainable yield (water not limiting) AET = actual evapotranspiration MET = maximum evapotranspiration b = slope of the relative yield (Y/Ym) to ETD ETD = evapotranspirational deficit = 1 - AET/MET To predict the yield from this equation, one needs to know AET, MET, Ym and b. However, the ratio AET/MET where Y/Ym is zero indicates the portion of ET due to direct evaporation, E, from the soil surface (Figure 4). Determining the fraction of evapotranspiration from the soil is important since evaporation (unlike transpiration) is not related to plant activity and is therefore a loss. Irrigation applied as spray is in part intercepted by the foliage and then evaporates rapidly without entering the transpiration stream, so intercepted water can also be considered a loss. These facts have a bearing on irrigation method and frequency. For systems which wet the entire surface, a high irrigation frequency causes greater evaporation from the repeatedly rewetted soil surface and from the canopy.

Effectiveness of irrigation in Mauritius V Proag
AMAS 1997. Food and Agricultural Research Council, Réduit, Mauritius 68
Yie
ld
Figure 4 Relationship of crop yield to water supply
Linear approximation
Evaporation Maximum evapotranspiration Water applied
On the other hand, too low an irrigation frequency may cause soil desiccation and plant stress. Therefore, the most efficient utilisation of water may result from some intermediate irrigation frequency, even if it produces less than maximum yields. However, irrigation systems like drip that wet only a small fraction of the surface, and also avoid wetting the foliage, can reduce evaporation losses even when applied at high frequency. Doorenbos and Kassam (1979) have proposed the following relationship between yield and amount of applied water: 1 - (Y/Ym) = f [ 1 - (AET/PET) ] where Y = actual yield Ym = maximum attainable yield with full water requirements met f = yield response factor AET = actual evapotranspiration PET = potential evapotranspiration Empirically obtained values of f have been tabulated for different crops and climatic regions. In a statistical study by SIGMA-SOGREAH (1983) working on about 10 000 actual yields obtained on sugar exploitations, after due consideration for estimated evapotranspiration and rainfall data, and using four different cane varieties, it was found that the results could be summarised using the following relationship: Y = 40.34 + 0.0459 x ET where Y = yield in tonnes of cane per hectare ET = actual evapotranspiration during the crop duration. A regression coefficient of r = 0.941 was obtained. This equation is valid for the range 720 < ET < 1450 mm. Broadly, it means that the yield per hectare increases by 4.6 tonnes for every 100 mm of water applied to the crop, if all this irrigation water is really and effectively used by the plant. In many cases, reported relationships between yield and water use pertain to aboveground dry-matter yield. If the yield of interest is grain, fruit or fibre, its relation to water use by the crop can be quite different. Although this cannot be taken for granted in every case, some studies have shown that grain yield bears a more-or-less constant ratio to dry-matter yield. The linear relationships found between

Effectiveness of irrigation in Mauritius V Proag
AMAS 1997. Food and Agricultural Research Council, Réduit, Mauritius 69
yield and water use under limited water supply may not hold as potential evapotranspiration is attained and water ceases to be a limiting factor (Figure 5).
300 400 500 600 700 800 900
Evapotranspiration Et mm
0
2
4
6
8
10
12
Gra
in y
ield
t ha
-1
N 400 kg ha-1
N 200 kg ha-1
N 100 kg ha-1
N 50 kg ha-1
N 0 kg ha-1
Figure 5 Maize yield versus Seasonal Et at 5 levels of N fertilisation ( Source Hizzel and Guron 1973 )
Beyond the point where transpiration reaches its climatic limit, the promise of increasing production lies in identifying and then obviating any other possible environmental constraints, such as pests, soil aeration, or nutrient supplies (Hizzel and Guron 1973). It is important to notice in Figure 5 that for a given dosage of fertiliser, the yield does not change much with evapotranspiration. OPTIMAL USE OF WATER In many areas, irrigated farming fails to achieve its potential. The problem is not inherent in the principle of irrigation per se, but in its frequently careless practice. What is at fault is the unmeasured and generally excessive application of water to land, with little regard either to the real cost of the water or water resource depletion, pollution or soil degradation. It is the universal fallacy of man to assume that if a little of something is good, then more of it must be better. The question of what constitutes a “desirable” level of water use is a matter of some controversy. Three approaches may be defined: (1) Agronomists are frequently interested in attaining maximum yields per unit area of land. (2) An alternative goal is to achieve the maximum “water use efficiency”, i.e. to maximise the yield per unit amount of water applied. (3) Yet another goal is advanced by economists who argue that water, to be used effectively,
should only be applied up to the point where the revenue derived from the last increment of water added still exceeds the price of the incremental application.
This last issue is most relevant when the amount of irrigable land in a region or a project exceeds the area that can be irrigated with the limited amount of water available. This is the typical case for irrigation projects in Mauritius. The problem then becomes how to spread the water over the land so as to achieve the highest returns. Concentrating the water over a limited area of intensive irrigation (where crop water requirements are fully met) is an approach likely to maximise yields per hectare

Effectiveness of irrigation in Mauritius V Proag
AMAS 1997. Food and Agricultural Research Council, Réduit, Mauritius 70
and minimise the investment of equipment, energy and labour, which are often proportional to the area under production. The opposite strategy of spreading water so as to “green up” more land under a reduced per-hectare supply may produce a greater total yield for the project as a whole but involves additional outlays for delivery, tillage, fertiliser, seeds, etc. The problem of determining an optimal allocation of water has no universal solution, since the economic considerations involved (i.e. the relative costs of the inputs of water, energy, machinery, labour, etc., versus the income derivable are specific in each case. The problem is further complicated where rainfall may increase the irrigated water supply. Since the timing and quantity of rainfall are generally uncertain, the conjunctive use of rainfall and irrigation becomes an exercise in statistical probability, and the entire management scheme must be flexible enough to adjust to changing conditions. In principle, applying the water in small increments so as to wet the soil only partially (rather than saturate the entire root zone) is a preferable tactic, as it allows potential storage for possible rainfall during the season. Otherwise, even small rainfalls are likely to cause runoff, erosion, and water-table rise. A flexible irrigation system also permits the irrigator to withhold water during the days immediately following a heavy rain, so as to save on irrigation costs. Returns from water can only be calculated with respect to returns from the land. Without water, the land produces nothing, and vice versa. In rain-fed farming, there is no need to determine the ratio yield/water, because the water used costs nothing. In irrigated farming, however, it is worth knowing the return from the water supplied to the plants. The marginal costing exercise will indicate how much extra yield is being obtained, and at what cost. If the irrigation project has been implemented to cater for droughts which occur only once in 5 or 10 years, is it still economically worthwhile? In some cases, the average long term increase is only of the order of 5 tonnes of cane per hectare annually. This will give rise to an average incremental yield of MUR* 10 000 x ( 5 x 0.1 ) x 0.74 = MUR 3700 annually. Notwithstanding operational costs, this has just to be compared to investment costs which range between MUR 25-45 000 per hectare to get an idea of the feasibility of the scheme. The Midlands dam project has been estimated to the tune of some MUR 2 billion. Most of the water is to be directed towards irrigation. Even assuming that only MUR. 1 billion is allocated to irrigation costs, and that it will irrigate some 5000 hectares, this comes out to a cost of MUR 200 000 per hectare. The above discussion can certainly be applied here, with the use of figures and yields, consistent with Tables 1, 3 and 4. ALTERNATIVE USES OF WATER Some 350 Mm3 of water passes annually through electric turbines and some 280 Mm3 of water goes to the sea annually after having been used only once for electric power generation. What would happen if hydroelectricity production is stopped? Water used for hydroelectricity generation at Champagne, Tamarind Falls, Eau Bleue, and Cascade Cécile are initially at a high elevation and could alternatively be used for water supply under gravity. This totals up to 220 Mm3 annually. This also means that there will be a shortfall of at least 100 GWh in the electricity production. Water rights exist since a long time, and the flow concerned is, again, quite substantial. Most water rights are used for irrigation. Thus water required for irrigation exceeds 20 m3s-1. Even if the maximum water requirements were needed only half of the time, it would appear that water for irrigation comes to above 315 Mm3 annually. What would happen if tomorrow, these water rights had to be scrapped because there is a lack of water in the country to satisfy domestic water supply?
* 1 MUR = 0.04545 USD approximately

Effectiveness of irrigation in Mauritius V Proag
AMAS 1997. Food and Agricultural Research Council, Réduit, Mauritius 71
The present forecasts concerning the long term potable water requirements are estimated to some 160 Mm3 annually over and above our present production. The total annual domestic water requirement would then be about 320 Mm3 . CONCLUSION There are probably some specific areas in the north which may present low yields owing to a number of reasons. Over a long period, however, it would appear that small planters and probably other planters over the island do obtain more or less similar yields. This analysis would therefore indicate that with the present distribution of water resources and rainfall, the yields in the so called dry regions are not so low as may be imagined. There may be a variety of reasons for this, among which soil type, underlying geology and inappropriate irrigation methods. There is a need, however, for a proper investigation into the real marginal increase in yield arising from irrigation, both with respect to water added and to incurred costs. REFERENCES ARLIDGE EZ and WONG YOU CHEONG Y. 1975. Notes on the land resources and agricultural
suitability map of Mauritius 1: 50 000. MSIRI Occasional Report No. 29. Rome, Italy : FAO and Réduit, Mauritius: MSIRI, 138 p.
CENTRAL STATISTICAL OFFICE . Digest of agricultural statistics. Mauritius : Ministry of
Economic Planning and Development, Central Statistical Office. (Various issues up to June 1996).
De WIT CT. 1958. Transpiration and plant yields. Versl. Klandbouwk. Ondez. 646 : 59-84. DOORENBOS J and KASSAM AH. 1979. Yield response to water . Irrig. Drain. Paper 33 . Rome,
Italy : FAO. HIZZEL D and GURON Y. 1973. Evapotranspiration and the yield of maize. Water Resources
Research 9 :. 743-748. HUNTINGS . 1974. Northern Plains Irrigation Project. Feasibility study reports. Volumes 1-3. U.K
: Huntings Technical Services. PARISH DH and FEILLAFE SM. 1965. Notes on the 1 : 100 000 soil map of Mauritius. August
1965; 43 p.; 1 map [ Map D.O.S. (misc.) 317. MSIRI Occasional Paper No. 22. Published by Directorate of Overseas Surveys. 1962. Printed by the Ordinance Survey, UK (2 500/8/62/1374/OS) ].
SIGMA-SOGREAH. 1983. Etude générale de l’irrigation à l’Ile Maurice. Port Louis, Ile Maurice :
SIGMA-SOGREAH, 176 p. STEWART et al. 1977 . Optimising crop production through control of water and salinity levels in
the soil. U.S.A : Utah Water Res. Lab. WILLIAME P. 1984. Carte pédologique de l’Ile Maurice 1: 50 000, accompagnée d’une notice
explicative simplifiée. MSIRI Occasional Paper 33 . Réduit, Ile Maurice : Mauritius Sugar Industry Research Institute and Paris, France : Office de la Recherche Scientifique et Technique Outre- Mer (ORSTOM) , 24 p.

Effectiveness of irrigation in Mauritius V Proag
AMAS 1997. Food and Agricultural Research Council, Réduit, Mauritius 72
COMMENTS Q. Will growers be prepared to pay MUR 1500 or more per hectare for irrigation in a year ? A. Growers will be reluctant to pay for irrigation costs as drought does not occur every year.
Economic considerations should be given to water application through a cost/benefit analysis. Remarks: Installation costs for drip irrigation may be high but recurrent costs for running the system are low. Day to day management of the system is necessary to get the best out of it.

AMAS 1997. Food and Agricultural Research Council, Réduit, Mauritius
73
CLIMATE CHANGE AND AGRICULTURE: MICROCLIMATIC CONSIDERATIONS
S D D V Rughooputh
University of Mauritius
ABSTRACT Despite the small size of Mauritius, at least 27 microclimates have been identified to represent the climate of the island. Mathematical modelling of various weather parameters such as solar radiation, air temperature, wind, and rainfall have been initiated. Some of the models under study are discussed.
INTRODUCTION The study of climate at different scales (regional, meso, local or micro) and its variations with the topography and the nature of soils can play a fundamental role in energy and/or environmental conscious land use planning. For instance, the design of agricultural systems (e.g. greenhouses, irrigation devices, solar dryers, etc.) and the agroclimatic suitability of potential crops in a particular country require a thorough knowledge of the prevailing climatic conditions. The knowledge of the availability of solar radiation and of wind in different locations, for instance, allows a correct evaluation of the performance of devices capturing and transforming renewable energies. Furthermore, the combined knowledge and analysis of different parameters (topography, climate, nature of soils, geological stability, existing land use, etc.) can allow the planner to choose the best sites for each realisation: new settlements of bioclimatic buildings, industries whose polluting effluents have to be kept far from human settlements or fragile natural environment, solar plants, wind farms, etc.. All the agricultural regions of the world are subject to significant temporal and spatial climate variability. The impact of this variability on yield and production of food crops is important in each case. Understanding the links between climate variability and agriculture is a pre-requisite for tailoring the cropping systems and management practices in order to achieve conditions optimum for sustained productivity in specific soil-climate sectors. Without an in-depth understanding of the links, it will also not be possible to assess the impact of climate change; the latter generally considered to be a threat to the green revolution. Mauritius is situated in the southern edge of the tropical belt between latitudes 19o 58.8' and 20o 31.7' S and longitudes 57o 18.0' and 57o 46.5' E, with the main island about 1844 km2 in size. The relief of Mauritius is roughly a main hill with a central plateau. The climate in general can be characterised as a pleasant mild maritime climate with annual mean temperatures of about 22oC, normal annual rainfall of about 2122 mm and a mean annual duration of sunshine per day varying between 7 and 8 hours. Two seasons are observed, namely, Summer from November to April (warm and wet) and Winter from May to October (cool and dry). Despite its small area, there are substantial variations in the climatic characteristics of Mauritius so that at least 27 microclimates have been identified for the island (Padya 1989). Climatic classification is important for a number of reasons: to differentiate the broad climatic types, to evaluate agricultural potential and for technology transfer - to modify and transfer land and water management and cropping systems principles. A number of problems are associated with climatic classification (which

Climate change and agriculture - microclimatic considerations S D D V Rughooputh
AMAS 1997. Food and Agricultural Research Council, Réduit, Mauritius 74
makes it a difficult task indeed) such as spatial and temporal variations, numbers and distributions of stations to represent spatial variations, scaling problems, etc.. The boundaries then should represent transitional zones rather than sharp features since any sub-division will be somewhat arbitrary with a range within each class. Whilst there are incomplete sets of climatological data available in the form of summaries or in the appendices of various institutions' reports, there are hardly any work pertaining to modelling aspects of the Mauritian climate. We have initiated research in climate variability and predictability to gain a better understanding of the climate over the island and its role in various sectors such as agriculture, ecology, hydrology, energy, etc. The initial studies, described in this paper, are aimed at understanding this climate variability and outlining the importance of zonal or microclimatic considerations. Such studies are useful for a number of reasons: it is useful to elucidate the links between climate variability parameters and agricultural productivity, to model applications for selected crops, to model the applications of agricultural systems, to prepare us to confront the expected climate change over the coming decades and to help us to formulate future strategies in agricultural developments. We have not evaluated the role of shadows cast by complex orography, such as valleys and mountains. MICROCLIMATIC CONSIDERATIONS FOR SUGAR CANE For the sake of argument we shall assume that Mauritius can be divided into the five obvious zones: North, South, East, West and Centre. We shall use the sugar cane yield (t ha-1) for 1970 to 1993 region-wise. The deviations of regional sugar cane yields (in tonnes per hectare) from their mean value for 1970 to 1993 is given in Figure 1. One striking feature to note in this figure is that strong negative deviations occur when the crops are seriously affected in all zones by strong cyclones (for example - 1975, 1980, 1984). It is also interesting to observe that different regions can deviate differently in a particular year (for example - 1991) and hence it is obvious that zonal considerations are important since different zones can be affected differently. We can extend this argument to sub-zonal considerations or microclimatic considerations that will suit our purpose. However, the unavailability of data precludes us from making a detailed study of the yields with respect to microclimatic considerations. G.I.S. will be particularly suited to investigate the spatial extent of distinct soil-microclimates for selected crops. SPATIO-TEMPORAL VARIATIONS OF CLIMATIC PARAMETERS As emphasised earlier, there are marked differences in the climatic characteristics across the island principally due to differences in elevation, proximity to the coast, windward-leeward locations. This has led the Mauritius Meteorological Services to classify the climate into 9 zones each with further divisions into 3 sub-zones (coastal, plain and slope) making a total of 27 microclimates to reflect the remarkably diverse climatic conditions. The annual rainfall can change from as low as 750 mm (e.g. Albion, west coast) to well above 4000 mm (e.g. Arnaud, central plateau). There is also more than 6.5oC difference in the mean annual temperatures. Humidity varies from a comfortable 60-70% in the north and west to very humid or damp conditions in the centre. Similarly, the spatial characteristics of other climatic parameters vary across a wide range across the island. If the maps of the annual variations of climatic parameters such as solar radiation, evaporation, rainfall, relative humidity and temperature over Mauritius are compared to the relief map of Mauritius, one would notice the striking dependence of these climate features on the orography. Another representation of the variation of climatic parameters can be depicted from the height dependence of air temperature and rainfall (Padya 1989). The topographic effects clearly induce adiabatic temperature variations. Also associated with the latter are the effects of heating by warmed-up land surfaces during the day, net radiative cooling at night, and cooling by evaporation from the

Climate change and agriculture - microclimatic considerations S D D V Rughooputh
AMAS 1997. Food and Agricultural Research Council, Réduit, Mauritius 75
-30 -25 -20 -15 -10 -5 0 5 10 15 20 25t ha-1
1970
1971
1972
1973
1974
1975
1976
1977
1978
1979
1980
1981
1982
1983
1984
1985
1986
1987
1988
1989
1990
1991
1992
1993
Centre West island North East South
Figure 1 Deviations of sugarcane yields from Regional mean values 1970 - 1993
Cyclone Gervaise Feb 1975
Cyclone Claudette Dec1979
Cyclone Bakoly Dec 1983

Climate change and agriculture - microclimatic considerations S D D V Rughooputh
AMAS 1997. Food and Agricultural Research Council, Réduit, Mauritius 76
soil and vegetation. The cross-section along the Beau Vallon - Mèdine line across Mauritius reveals the striking effect of the relief on the spatial rainfall distribution; this transect roughly lying along the direction of the prevailing south-east trades. An asymmetry in the rainfall distribution is strongly apparent - with a maximum rainfall of over 4000 mm and a coastal rainfall of 1600 mm on the south-east compared to around 750 mm on the west. Global Solar Radiation and Air Temperature - Spectral Analysis We have investigated, using the Fourier method, the global solar radiation and the mean maximum/minimum air temperatures at several zones/stations over Mauritius. The details of this work are published elsewhere (Rughooputh and Heetun 1996). The Fourier method is based on the hypothesis that any wave function can be represented by a set of sine and cosine waves of different frequencies. The application of Fourier analysis to a waveform permits the removal of random phenomena and thus permits the detection and calculation of the amplitude, phase angle of each frequency component and the percentage variance of each harmonic. Furthermore, this technique analyses and reduces a great amount of data, synthesising them into a single expression suitable for direct calculation of meteorological parameters, helping in weather forecasting, design of solar systems and for agricultural and hydrological modelling. Thus, for a given locality or zone, the Typical Annual Time Functions (TATF) of the air temperature and global solar radiation provide us with the most probable values at any time for the given locality. Our data set for air temperature analysis consisted of the mean maximum and mean minimum air temperatures for the five zones of the island, namely the North, South, East, West and Centre for the period of eight years from l984 to l99l (on a fortnight basis). Monthly mean daily global solar radiation data averaged over the years 1961 to 1979 for 15 different stations were also analysed. For both cases, analyses confirm that the annual harmonics (i.e. l cycle/year) dominate and have the highest percentage of the total variance for the respective time series (summarised in Tables 1 and 2).
Table 1 Typical annual time functions for different regions.Coefficients of mean maximum and mean minimum temperatures
Regions Average º C Amplitude º C Phase angle Radians Variance %
Maximum Minimum Maximum Minimum Maximum Minimum Maximum MinimumWest 28.30 20.03 2.45 3.12 0.40 0.15 89 89North 29.05 19.23 2.81 3.24 0.28 0.53 84 86East 26.49 19.56 2.75 2.90 0.45 0.62 87 87South 27.21 20.41 2.85 2.82 0.44 0.57 86 89Centre 25.00 18.02 3.08 3.01 0.46 0.56 89 87
For the zonal air temperature analyses, the TATF curves are shown in Figure 5 for both maximum & minimum temperature variations. Differences in temperatures are highest in the north and west (approximately 10oC) compared to approx. 7oC for the other regions. In general, the phase angle is ca. 0.36 ± 0.09 radians for maximum temperature curves and ca. 0.56 ± 0.06 radians for minimum temperature curves. The phase angles for maximum and minimum temperatures are smaller for the North & West compared to the other regions, indicating that the North & West zones attain their highest and lowest temperatures earlier than the other zones. The earlier response to temperature changes in the latter two zones may be due to the influence of the hot westerlies in summer and of the relief factors of the island. For almost all the stations, the phase angle of global solar radiation is about - (0.42 ± 0.04) radians. The phase angles have negative values for the TATF for the global solar radiation whereas the corresponding values for air temperature are positive. This indicates, as expected, that the global solar radiation reaches its maximum/minimum value before the temperature reaches its maximum/minimum value respectively, showing the temperature dependence on global solar radiation.

Climate change and agriculture - microclimatic considerations S D D V Rughooputh
AMAS 1997. Food and Agricultural Research Council, Réduit, Mauritius 77
Table 2 Typical annual time functions for different stations. Coefficients of global solar radiation
Stations Average Amplitude Phase Angle VarianceMJ m -2 MJ m -2 Radians %
Belle Rive 15.82 3.55 -0.418 94Médine 17.45 3.75 -0.419 87Bois Chéri 14.66 3.92 -0.458 95Plaisance 16.99 5.14 -0.409 99Pamplemousses 17.81 4.20 -0.434 94Union Flacq 16.01 3.96 -0.379 94Vacoas 16.78 3.31 -0.429 86Réduit 17.05 3.73 -0.433 85Tamarin 17.36 3.69 -0.411 82Case Noyale 17.29 3.84 -0.488 83Britannia 15.14 4.97 -0.219 95Union Park 14.29 3.71 -0.348 91Benares 16.51 5.02 -0.483 98Digue Sèche 17.75 4.18 -0.565 94Ferney 15.19 4.82 -0.494 95
1-Jan29-Jan
26-Feb26-Mar
23-Apr21-May
18-Jun16-Jul
13-Aug10-Sep
8-Oct5-Nov
3-Dec31-Dec
10
15
20
25
30
35
Tem
pera
ture
° C
West North East South Centre
Figure 2 Typical annual time functions of maximum and minimum temperature variations for all zones
Rainfall Distribution Pattern - Agglomeration Approach Rainfall (averaged over a 30 year period - 1951-1980) at twenty-two locations over Mauritius are analysed and presented in Table 3. The sites chosen are fairly well spread over the island. It is useful to examine whether the rainfall at anyone site is correlated with the rainfall at any other site. This may not be apparent at first sight but the correlation matrix for simple regressions between every individual pair of stations presented in Table 4, shows the strong correlations existing between each and every pair of stations. This implies that Mauritius can be considered as a single patch; we expect the correlation to improve if the contributions of the cyclones could be eliminated. In particular, for

Climate change and agriculture - microclimatic considerations S D D V Rughooputh
AMAS 1997. Food and Agricultural Research Council, Réduit, Mauritius 78
stations lying orthogonal to the direction of the south-east trades, the correlation is strongest, revealing that there is a preferred direction - the rain-bearing wind direction.
Table 3 Physical characteristics of the 22 stations
Stations Altitude Latitude Longitude Orientation Summary Vectors
Site No m º º V1 V2Bel Ombre 1 8 -20.502 57.407 -1 177 -0.028 -0.260St Antoine 2 30 -20.040 57.652 -1 155 0.147 1.913Labourdonnais 3 73 -20.067 57.608 -1 156 0.001 0.084Tamarin 4 43 -20.322 57.397 -1 166 0.153 1.995Belle Rive MSIRI 5 488 -20.280 57.543 -1 167 0.018 0.057Réduit 6 311 -20.232 57.488 -1 163 0.043 0.482Albion 7 12 -20.212 57.400 -1 160 0.028 0.482FUEL 8 146 -20.212 57.683 -1 166 -0.031 -0.397Fort William 9 6 -20.152 57.478 -1 158 0.090 1.251Sans Souci 10 277 -20.297 57.653 -1 170 0.104 1.203Britannia 11 229 -20.452 57.557 -1 177 0.083 0.965Savinia 12 49 -20.475 57.633 -1 180 0.020 0.248Plaisance 13 58 -20.430 57.668 -1 178 0.075 0.924La Flora 14 360 -20.413 57.557 -1 175 -0.012 -0.271Arnaud 15 576 -20.380 57.492 -1 172 -0.096 -1.399Médine 16 91 -20.258 57.388 -1 163 -0.220 -2.640Vacoas 17 424 -20.293 57.490 -1 167 -0.136 -1.803Pamplemousses 18 79 -20.102 57.577 -1 157 0.165 2.118Olivia 19 101 -20.297 57.735 -1 172 -0.046 -0.593Cap Malheureux 20 3 -19.990 57.623 -1 152 -0.063 -0.660Bois Chéri 21 475 -20.423 57.520 -1 175 -0.081 -1.177Ile d'Ambre 22 9 -20.033 57.680 -1 156 -0.211 -2.520
Table 4 Average rainfall of 22 sites 1951-1980 mm
Bel
Om
bre
St A
ntoi
ne
Lab
ourd
onna
is
Tam
arin
Bel
le R
ive
MSI
RI
Réd
uit
Alb
ion
FU
EL
For
t Will
iam
San
s So
uci
Bri
ttani
a
Sav
inia
Pla
isan
ce
La
Flor
a
Arn
aud
Méd
ine
Vac
oas
Pam
plem
ouss
es
Oliv
ia
Cap
Mal
heur
eux
Boi
s C
héri
Ile
d'A
mbr
e
Ave
rage
1 2 3 4 5 6 7 8 9 10 11 12 13 14 15 16 17 18 19 20 21 22January 200 200 200 207 485 276 120 300 145 478 329 223 249 400 492 159 344 234 297 201 453 221 282February 181 192 202 189 449 278 139 289 127 446 312 204 220 411 433 151 345 215 282 177 458 192 268March 196 225 232 174 467 247 143 370 126 530 357 267 289 455 438 162 304 252 348 205 503 232 296April 170 166 151 106 329 129 73 238 83 375 303 204 208 375 322 83 184 162 252 151 382 166 210May 122 112 113 53 214 81 39 191 40 314 219 152 165 281 246 42 131 112 214 97 331 120 154June 88 103 95 43 206 79 25 164 26 282 178 100 115 246 252 36 131 94 163 77 297 102 132July 93 93 89 28 235 74 18 147 27 289 192 109 130 265 249 19 129 91 162 74 320 82 133August 76 76 72 21 231 70 15 107 22 249 159 80 87 233 241 14 127 86 136 68 287 70 115September 48 50 51 16 149 49 13 82 19 159 100 57 64 148 161 17 80 60 91 43 175 41 76October 39 39 39 25 130 43 15 70 19 142 97 46 57 139 129 20 69 43 92 35 154 37 67November 65 60 78 47 157 74 25 110 32 192 132 87 88 168 144 36 96 82 104 51 186 63 94December 167 123 132 174 289 192 102 226 116 354 249 156 177 298 298 134 228 155 237 93 359 146 200
Average 120 120 121 90 278 133 61 191 65 318 219 140 154 285 284 73 181 132 198 106 325 123 169

Climate change and agriculture - microclimatic considerations S D D V Rughooputh
AMAS 1997. Food and Agricultural Research Council, Réduit, Mauritius 79
Further confirmation of the fact that rainfall depends on certain site characteristics comes from the analysis of the monthly average rainfall data using singular value decomposition (Cheeneebash and Rughooputh 1997). Unlike the usual decisive approach which begin with predetermined ranges in variables, the decomposition technique is an agglomerate approach whereby variations in climatic factors (e.g. monthly values to represent seasonal patterns) are used to obtain groupings of stations showing similar characteristics. Since the method groups similar stations, it is particularly useful in, say, the transfer of technology. Four site characteristics were chosen for this work, namely the geographical location (latitudes and longitudes), the altitudes and a set of dummy parameters representing an orientation with respect to the direction of the South East Trade Winds (Table 5). The decomposition provides two summary vectors which are regressed on variables defining physical site characteristics. This regression model provides a means to relate rainfall with the physical characteristics of the site (altitude, longitude, latitude, wind orientation).
Table 5 Correlation Coefficient Matrix of yearly average rainfall 1951-1980
Sta
tion
nam
e
Sta
tion
num
ber
Bel
Om
bre
St A
ntoi
ne
Lab
ourd
onna
is
Tam
arin
Est
ate
Bel
le R
ive
MSI
RI
Le
Réd
uit
Alb
ion
FU
EL
For
t Will
iam
San
s So
uci
Bri
ttani
a
Sav
inia
Pla
isan
ce
La
Flor
a
Arn
aud
Méd
ine
Vac
oas
Pam
plem
ouss
es
Oliv
ia
Cap
Mal
heur
eux
Boi
s C
héri
Ile
d'A
mbr
e
1 2 3 4 5 6 7 8 9 10 11 12 13 14 15 16 17 18 19 20 21 22Bel Ombre 1 1.00 0.96 0.96 0.93 0.94 0.91 0.93 0.96 0.94 0.97 0.99 0.97 0.97 0.96 0.94 0.93 0.93 0.96 0.98 0.94 0.95 0.98St Antoine 2 1.00 0.99 0.88 0.97 0.91 0.92 0.99 0.90 0.99 0.99 0.98 0.98 0.99 0.96 0.90 0.93 0.98 0.98 0.99 0.97 0.99Labourdonnais 3 1.00 0.91 0.82 0.94 0.95 0.99 0.92 0.98 0.98 0.98 0.98 0.97 0.95 0.93 0.95 0.99 0.98 0.98 0.96 0.99Tamarin 4 1.00 0.91 0.98 0.97 0.90 1.00 0.88 0.88 0.87 0.88 0.85 0.89 0.99 0.96 0.94 0.89 0.87 0.84 0.92Belle Rive MSIRI 5 1.00 0.96 0.93 0.94 0.93 0.96 0.95 0.93 0.94 0.96 0.99 0.92 0.98 0.98 0.94 0.98 0.95 0.96Réduit 6 1.00 0.98 0.91 0.98 0.91 0.89 0.87 0.89 0.88 0.94 0.98 0.99 0.96 0.89 0.91 0.88 0.93Albion 7 1.00 0.94 0.98 0.92 0.91 0.91 0.92 0.90 0.90 0.99 0.96 0.96 0.93 0.91 0.88 0.94FUEL 8 1.00 0.91 0.99 0.98 0.98 0.99 0.97 0.94 0.93 0.92 0.98 0.99 0.96 0.96 0.99Fort William 9 1.00 0.90 0.90 0.89 0.90 0.87 0.91 0.99 0.96 0.95 0.91 0.90 0.86 0.93Sans Souci 10 1.00 0.99 0.97 0.98 0.99 0.97 0.90 0.93 0.98 0.99 0.97 0.99 0.99Brittania 11 1.00 0.99 0.99 0.99 0.95 0.89 0.91 0.97 0.99 0.97 0.98 0.99Savinia 12 1.00 1.00 0.98 0.92 0.89 0.89 0.97 0.99 0.97 0.95 0.98Plaisance 13 1.00 0.98 0.93 0.90 0.90 0.97 0.99 0.97 0.96 0.99La Flora 14 1.00 0.95 0.86 0.91 0.96 0.98 0.97 0.99 0.97Arnaud 15 1.00 0.89 0.97 0.96 0.94 0.97 0.96 0.96Médine 16 1.00 0.96 0.95 0.91 0.89 0.86 0.93Vacoas 17 1.00 0.97 0.91 0.93 0.92 0.94Pamplemousses 18 1.00 0.97 0.98 0.95 0.99Olivia 19 1.00 0.94 0.91 0.91Cap Malheureux 20 1.00 0.95 0.98Bois Chéri 21 1.00 0.96Ile d'Ambre 22 1.00
The monthly-average rainfall data (represented by matrix Y) extends over 12 months at 22 sites within Mauritius (Table 3). The analysis has been carried out on log-transformed data so that the decomposition can be described as log Y = USVT (Cheeneebash and Rughooputh 1997). The decomposition was applied to Y to generate a simple model which accounts for most variability in the data by using the least number of parameters. Then, summary vectors were regressed on variates which describe physical characteristics to make a connection between the local variation of rainfall and the physical characteristics of the sites. We find that 95.3% of the variability in site value V1 is explained by the latitude, the longitude, the altitude and the orientation terms. This result suggests that other variables such as proximity to the coast, relief precipitation, cold fronts, storms and the effect of the Westerlies can be safely ignored. Thus, the difference in rainfall levels between sites can be explained to a first approximation by the differences in the latitude, the longitude, the altitude of the sites and the wind orientation at these sites. The greatest difference in average rainfall is between Albion (leeward, West) and Bois Chéri (windward, south-east). We note that these two sites are located amongst the lowest altitudes (Albion, 12 m) and amongst the highest altitudes (Bois Chéri, 475 m), respectively. Thus, our regression fit seems to show a strong influence of the location to explain differences in rainfall levels between sites.

Climate change and agriculture - microclimatic considerations S D D V Rughooputh
AMAS 1997. Food and Agricultural Research Council, Réduit, Mauritius 80
Finally, a two-dimensional representation of the data matrix related to the site characteristics was obtained. Figure 3 shows a plot of V1 against V2 for this model. Clearly, there is an opportunity to relate the plot to the mean rainfall levels at the sites. Three distinct clusters can be visualised from the two-dimensional plots: Fort William, Albion, Médine and Tamarin Estate receive, on average, similar rainfall levels. The same is true for Bois-Chéri, Sans Souci, La Flora, Arnaud and Belle Rive. A third cluster contains essentially the rest of the sites. The clusters in the model are fairly compact indicating that it is a good model.
2
4
5
6
7
8
9
10
11
1213
1415
16
17
18
19
20
21
22
-0.6 -0.4 -0.2 0.0 0.2 0.4
Summary Vector V2
0.15
0.17
0.19
0.21
0.23
0.25
0.27
0.29
Sum
mar
y V
ecto
r V
1
1,3
Figure 3 Plot of Summary Vector V1 versus Summary Vector V2
CLIMATE CHANGE AND AGRICULTURE Although efforts to diversify the agricultural sector and to grow at least part of the country's food requirements have been successful over the past two decades or so, our agriculture is still largely dominated by sugarcane. Sugar cane still occupies over 90% of the agriculture area and sugar exports contribute about 30% to foreign exchange earnings. Vegetations, whether natural or cultivated, are adapted to specific well-delimited zones, mainly defined by temperature and photoperiod regimes. As conditions become progressively more extreme, the ability of plants to adjust and respond without stress and damage declines. Therefore, impacts of climate change on agriculture are a major concern to the long-term future of our agricultural sector and the national economy. The diverse microclimatic conditions has led researchers at the Mauritius Sugar Industry Research Institute to breed different, high-yielding, sugar cane varieties (resistant to pests and diseases) to suit specific soil-climatic conditions. In a way, the different microclimates can be used to emulate/mitigate climate change scenarios (with some cautions). The new sugar cane breeds will be expected to adapt to the changing climate patterns. On the pessimistic side, increased rainfall, predicted by most Global Circulation Models under the enhanced greenhouse conditions, may occur as extended light rain or as intense storms. Whilst the first leads to a reduced photosynthetic process (due to increased cloud cover), the second leads to severe erosion of fertile soils (as a result of increased run-off). On the other hand, drought conditions directly affect agricultural yields by a reduction in plant growth. We are already familiar with the effects of strong winds. Temperature changes can also influence agriculture: crop development and yield.

Climate change and agriculture - microclimatic considerations S D D V Rughooputh
AMAS 1997. Food and Agricultural Research Council, Réduit, Mauritius 81
Indirect impacts can significantly affect agriculture (as opposed to direct impacts discussed above). For example, changes in the relative humidity and temperature changes will affect the pest-crop relations with the possibility of new associations arising as new clones are introduced. Water stresses will affect plant development and yields. As far as agricultural diversification is concerned, the current selection of crops is based on the present bioclimatic conditions. Since we are sacrificing land currently occupied by sugar cane, our efforts into agricultural diversification can be put at risk with any climatic changes. Technological change is also an important component of yield variability over the long term. This includes inputs such as improvements in seed, use of fertilisers, herbicides, insecticides, improved management practices, irrigation, etc.. In short, to avoid losses from having to abandon new crops before the initial investments are paid off, researchers will have to undertake studies about the agroclimatic suitability of the potential new crops under changing climatic conditions (different scenarios). CONCLUSION The study of climate at local and microscales and its variations are important in agriculture because of the diverse climatic conditions. Zonal considerations have been demonstrated using sugar cane yield as an illustration. It is argued that further sub-division could prove useful; an obvious example being the centre zone divided into leeward and windward. Such information is useful for evaluating the agro-climatic suitability of potential crops, for technology transfer, for planning, for evaluation and optimising yields and productivity of crops and for assessing the climate change scenarios. Although such a study initially requires a large number of stations, it may mean that, in the long term when we may understand our climate sufficiently, a number of existing stations may be made redundant (thereby reducing observational costs). Spatial analysis has been used to further demonstrate the significance of zonal and subzonal divisions taking minimum/maximum air temperatures and global solar radiation as examples. Analysis of monthly-average rainfall data (30 year period 1951-1980) reveal that rainfall data at any two sites within the island are strongly correlated implying that Mauritius can be considered as a single patch. Moreover, the correlation is strongest in a direction coinciding with the rain-bearing winds. Further confirmation comes from the application of an agglomeration technique which groups stations of similar patterns. Four site characteristics were found quite adequate to model the rainfall over Mauritius. Finally, the direct and indirect impacts of climate change on agriculture were explored. There is an urgent need for researchers to test the agro-climatic suitability of existing and potentially new crops under changing climatic conditions. ACKNOWLEDGEMENTS I would like to thank Dr M Bhuruth, Mrs J. Cheeneebash, Mr M A Heetun, Mr N Gooroochurn and the Director of the Mauritius Meteorological Stations for their contributions and fruitful discussions. I also acknowledge the University of Mauritius for providing the necessary facilities.

Climate change and agriculture - microclimatic considerations S D D V Rughooputh
AMAS 1997. Food and Agricultural Research Council, Réduit, Mauritius 82
REFERENCES CHEENEEBASH J and RUGHOOPUTH SDDV. 1997. Analysis of the relationship between rainfall
over Mauritius and physical site characteristics. Revue Agricole et Sucrière de l’Ile Maurice, in press.
PADYA BM. 1989. Weather and climate of Mauritius. Moka, Mauritius : Mahatma Gandhi Institute
Press. RUGHOOPUTH SDDV and HEETUN MA. 1995. Typical annual time functions and global solar
radiation over Mauritius. Revue Agricole et Sucrière de l’Ile Maurice, 74 ( 1&2 ) : 38 - 44. COMMENTS Q. Will likely climate changes affect the adaptability of certain crop varieties? A. Certain varieties have a limited timespan and climate changes are not likely to affect them. In
Mauritius, we have several microclimates. It appears therefore that it will always be possible to find an area suitable for the crop affected by climate change.

AMAS 1997. Food and Agricultural Research Council, Réduit, Mauritius
83
SUBSTANCES NATURELLES ACTIVES: LA FLORE MAURICIENNE,
UNE SOURCE D’APPROVISIONNEMENT POTENTIELLE
T Bahorun
Université de Maurice
RESUME
Les métabolites secondaires font l’objet de nombreuses recherches basées sur les cultures in vivo et in vitro de tissus végétaux Ceci est notamment le cas des polyphénols végétaux qui sont largement utilisés en thérapeutique comme vasculoprotecteurs, anti-inflammatoires, inhibiteurs enzymatiques, antioxydants et antiradicaires, en particulier les flavonoï des et les proanthocyanidines. En se basant sur la méthodologie mise en place pour l’obtention, l’analyse et l’optimisation des composés polyphénoliques dans des cultures de Crataegus monogyna Jacq. (Aubépine), plante inscrite à la Pharmacopée Française et couramment utilisée comme cardio et neuro sédative, nous présentons ici les résultats préliminaires obtenus à partir d’analyses effectuées sur des espèces traditionnelles locales, en particulier Psidium cattleianum Sabine, dont les extraits peuvent potentiellement être utilisés en tant qu’antioxydants naturels. INTRODUCTION Les substances naturelles issues des végétaux ont des intérêts multiples mis à profit dans l’industrie : en alimentation, en cosmétologie et en dermopharmacie. Parmi ces composés on retrouve dans une grande mesure les métabolites secondaires qui se sont surtout illustrés en thérapeutique. La Pharmacie utilise encore une forte proportion de médicaments d’origine végétale et la recherche trouve chez les plantes des molécules actives nouvelles, ou des matières premières pour la semi-synthèse. On a longtemps employé des remèdes traditionnels à base de plantes sans savoir à quoi étaient dues leurs actions bénéfiques. L’isolement de principes actifs datant du XIX
eme siècle, en améliorant la connaissance des structures, a fait progressivement se séparer et parfois s’opposer une phytothérapie traditionnelle souvent empirique avec une thérapeutique officielle incluant les principes chimiques et végétaux dont la pharmacologie était mieux connue. Cette thérapeutique officielle accepte parfois avec une certaine méfiance l’emploi de végétaux ou d’extraits complexes de végétaux dont l’action est confirmée par l’usage sans être attribuée de façon certaine à une molécule type. A Maurice la liste de plantes entrant précisément dans ce cadre est exhaustive et comme elles sont utilisées sous forme de tisanes, extraits ou préparations complexes, il reste difficile de définir les molécules responsables de l’action bien que certains effets pharmacologiques prouvés sur l’animal aient été attribués à des composés tels que les alcaloï des et dérivés, des terpènes et stéroï des et des composés polyphénoliques. Dans ce papier, après un bref rappel sur les polyphénols, nous nous attarderons surtout sur les résultats découlant de nos travaux sur la production de ces composés à partir de cultures in vitro de Crataegus monogyna (Aubépine), plante couramment utilisée en phytothérapie et inscrite à la pharmacopée Française pour ses propriétés sédatives (Bruneton 1993), vasculoprotectrices (Bézanger-Beauquesne et al. 1990) et antioxydantes (Bahorun 1995) entre autres. Se basant sur la méthodologie de recherche utilisée pour Crataegus monogyna nous ferons le point sur l’état actuel de nos études sur des espèces locales productrices de ces polyphénols.

Substances naturelles actives: La flore mauricienne, une source d’approvisionnement potentielle T Bahorun
AMAS 1997. Food and Agricultural Research Council, Réduit, Mauritius 84
LES POLYPHENOLS Les polyphénols possèdent plusieurs groupement phénoliques, avec ou non d’autres fonctions (OH alcoolique, carboxyle,…). Dans cette catégorie, on trouve de nombreuses substances : les noyaux simples en C6-C1 et C6-C3, les noyaux dérivant de l’extension du phényl propane, en C6-C3-C6, comme les chalcones, les flavones, les flavonols ou les dérivés du flavane ou du flavane-3-ol (catéchines et proanthocyanidines). Toutes ces substances ont une voie de biosynthèse commune et sont appelées flavonoï des, au sens large du terme. L’intégration du métabolisme phénolique dans le programme général de développement d’un organe végétal pose en elle-même la question d’un rôle éventuel de ces substances. Des travaux plus anciens (Nitsch et Nitsch 1961; Alibert et al. 1977) ont montré que les phénols seraient associés à de nombreux processus physiologiques : croissance cellulaire, différenciation organogène, dormance des bourgeons, floraison, tubérisation. Les polyphénols interviennent dans la qualité alimentaire des fruits. Les anthocyanes et certains flavonoï des participent à la coloration des fruits mûrs. Les composés phénoliques déterminent également la saveur des fruits : les tanins sont à l’origine de la sensation d’astringence des fruits non mûrs, les flavanones sont responsables de l’amertume des Citrus et peuvent donner naissance, par transformation chimique, à des dihydrochalcones à saveur sucrée (Dubois et al. 1977). Des composés phénoliques sont impliqués lorsque la plante est soumise à des blessures mécaniques. Des phénols simples sont synthétisés et l’activité peroxydasique caractéristique des tissus en voie de lignification est stimulée. Ces réactions aboutissent à la formation au niveau de la blessure d’un tissu cicatriciel résistant aux infections (Fleuriet et Macheix 1977). La capacité d’une espèce végétale à résister à l’attaque des insectes et des micro-organismes est souvent corrélée avec la teneur en composés phénoliques (Rees et Harborne 1985). Les pigments responsables de la coloration des fleurs représentent des signaux visuels qui attirent des animaux pollinisateurs. La plupart de ces pigments sont des anthocyanes, des aurones et des chalcones. D’autres polyphénols incolores tels que des flavonols et flavanones interagissent avec des anthocyanes pour altérer, par co-pigmentation, la couleur des fleurs et fruits (Brouillard et al. 1997). Les polyphénols sont probablement les composés naturels les plus répandus dans la nature et de ce fait sont des éléments faisant partie de l’alimentation animale. A titre d’exemple, l’homme consomme jusqu’à 10g de ces composés par jour. Ces substances sont dotées de certaines activités résumées dans le Tableau 1. Nous mettrons ici l’accent sur l’intérêt grandissant des proanthocyanidines. En effet, les propriétés vasculoprotectrices de ces dérivés sont supérieures à celles de la rutine, utilisée en thérapeutique sous forme de dérivés hémisynthétiques hydrosolubles, et des flavonoï des classiques. Des spécialités pharmaceutiques contiennent soit uniquement des oligomères procyanidoliques (notamment extraits de pépins de raisin) soit des extraits totaux contenant ces composés en proportion importante (extrait de Ginkgo biloba). Des crèmes “anti-vieillissement” contenant des proanthocyanidines sont proposées en cosmétologie. La littérature montre également pour ces substances un intérêt renouvelé lié aux propriétés antioxydantes et antiradicalaires. MATERIEL ET METHODES Des résultats précédents sur l’analyse des polyphénols dans la plante entière d’Aubépine (Bahorun et al. 1994) ont montré que les organes foliaires et reproducteurs, notamment les jeunes feuilles et les boutons floraux, étaient les plus riches en polyphénols. Il paraissait alors intéressant de développer des cultures cellulaires à partir de ces tissus. Le but était de tenter d’obtenir in vitro, de meilleurs rendements, et/ou une production sélective de polyphénols à propriétés bioactives.
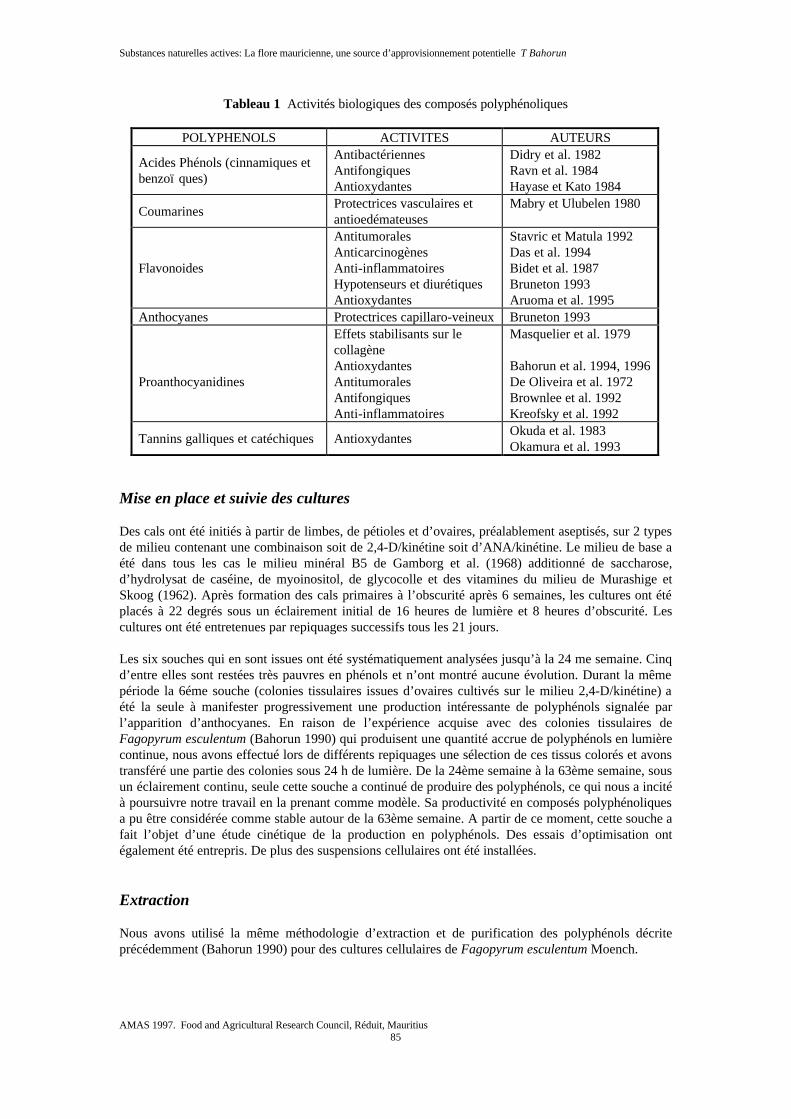
Substances naturelles actives: La flore mauricienne, une source d’approvisionnement potentielle T Bahorun
AMAS 1997. Food and Agricultural Research Council, Réduit, Mauritius 85
Tableau 1 Activités biologiques des composés polyphénoliques
POLYPHENOLS ACTIVITES AUTEURS
Acides Phénols (cinnamiques et benzoï ques)
Antibactériennes Antifongiques Antioxydantes
Didry et al. 1982 Ravn et al. 1984 Hayase et Kato 1984
Coumarines Protectrices vasculaires et antioedémateuses
Mabry et Ulubelen 1980
Flavonoides
Antitumorales Anticarcinogènes Anti-inflammatoires Hypotenseurs et diurétiques Antioxydantes
Stavric et Matula 1992 Das et al. 1994 Bidet et al. 1987 Bruneton 1993 Aruoma et al. 1995
Anthocyanes Protectrices capillaro-veineux Bruneton 1993 Proanthocyanidines
Effets stabilisants sur le collagène Antioxydantes Antitumorales Antifongiques Anti-inflammatoires
Masquelier et al. 1979 Bahorun et al. 1994, 1996 De Oliveira et al. 1972 Brownlee et al. 1992 Kreofsky et al. 1992
Tannins galliques et catéchiques Antioxydantes Okuda et al. 1983 Okamura et al. 1993
Mise en place et suivie des cultures Des cals ont été initiés à partir de limbes, de pétioles et d’ovaires, préalablement aseptisés, sur 2 types de milieu contenant une combinaison soit de 2,4-D/kinétine soit d’ANA/kinétine. Le milieu de base a été dans tous les cas le milieu minéral B5 de Gamborg et al. (1968) additionné de saccharose, d’hydrolysat de caséine, de myoinositol, de glycocolle et des vitamines du milieu de Murashige et Skoog (1962). Après formation des cals primaires à l’obscurité après 6 semaines, les cultures ont été placés à 22 degrés sous un éclairement initial de 16 heures de lumière et 8 heures d’obscurité. Les cultures ont été entretenues par repiquages successifs tous les 21 jours. Les six souches qui en sont issues ont été systématiquement analysées jusqu’à la 24 me semaine. Cinq d’entre elles sont restées très pauvres en phénols et n’ont montré aucune évolution. Durant la même période la 6éme souche (colonies tissulaires issues d’ovaires cultivés sur le milieu 2,4-D/kinétine) a été la seule à manifester progressivement une production intéressante de polyphénols signalée par l’apparition d’anthocyanes. En raison de l’expérience acquise avec des colonies tissulaires de Fagopyrum esculentum (Bahorun 1990) qui produisent une quantité accrue de polyphénols en lumière continue, nous avons effectué lors de différents repiquages une sélection de ces tissus colorés et avons transféré une partie des colonies sous 24 h de lumière. De la 24ème semaine à la 63ème semaine, sous un éclairement continu, seule cette souche a continué de produire des polyphénols, ce qui nous a incité à poursuivre notre travail en la prenant comme modèle. Sa productivité en composés polyphénoliques a pu être considérée comme stable autour de la 63ème semaine. A partir de ce moment, cette souche a fait l’objet d’une étude cinétique de la production en polyphénols. Des essais d’optimisation ont également été entrepris. De plus des suspensions cellulaires ont été installées. Extraction Nous avons utilisé la même méthodologie d’extraction et de purification des polyphénols décrite précédemment (Bahorun 1990) pour des cultures cellulaires de Fagopyrum esculentum Moench.

Substances naturelles actives: La flore mauricienne, une source d’approvisionnement potentielle T Bahorun
AMAS 1997. Food and Agricultural Research Council, Réduit, Mauritius 86
Séparation Chromatographie sur couche mince Les extraits végétaux ont été analysés en chromatographie sur couche mince de cellulose et sur gel de silice. Les systèmes utilisés ont été choisis dans la littérature et adaptés en fonction des composés à séparer : flavones/flavonols (Lamaison et Carnat 1991), proanthocyanidines (Thompson et al. 1972), acides phénols (Das et Weaver 1972). Chromatographie liquide haute pression Dans ce travail nous avons utilisé une technique déjà décrite pour séparer les polyphénols de Fagopyrum esculentum (Moumou et al. 1992) et qui nécessite l’utilisation d’une colonne Ultrasphère RP18 et un gradient d’élution composé d’un mélange acétonitrile/eau. Dosage Le dosage des phénols totaux a été effectué par une méthode adaptée de Singleton et Ross (1965) avec le réactif de Folin-Ciocalteu. Les anthocyanes et proanthocyanidines ont été quantifiés en utilisant la méthode de Porter et al. (1986) tandis que les flavonoï des ont été mesurés par dosage direct par le trichlorure d’aluminium d’après une méthode adaptée de Lamaison et Carnat (1991). RESULTATS ET DISCUSSIONS La co-chromatographie sur couche mince, puis la confirmation d’identification de certaines substances isolées par leur temps de rétention par Chromatographie Liquide Haute Pression ont montré la présence de 4 catégories de composés phénoliques : 1) des proanthocyanidines (dimère B2, oligomères et polymères) et catéchines, 2) l’hypéroside (flavonoï de dominant), 3) l’acide chlorogénique (acide phénol dominant), 4) des anthocyanes. Après stabilisation des cultures, la souche productrice a fait l’objet d’une étude cinétique de la production de polyphénols. Les données recueillies durant une subculture de 40 jours a permis de dégager dans l’évolution des colonies tissulaires une période optimale de production se situant entre le 24ème et le 32ème jour de culture pour pratiquement tous les composés et catégories étudiés (Figures 1-4). Elle correspond à la fin de la phase exponentielle de croissance, donc à une biomasse importante. La plupart des valeurs maximales ont été mesurées à cette période (phénols totaux : 5089 g/100 g MS, proanthocyanidines totales : 2.95 g/100 g MS, (-) épicatéchine : 0.830 g/100 g MS, hypéroside : 1.143 g/100 g MS, acide chlorogénique : 0.769 g/100 g MS, anthocyanes : 0.163 g/100 g MS). Par ailleurs, des suspensions cellulaires initiées à partir de ces colonies tissulaires se sont avérées beaucoup plus riches en (-) épicatéchine (1.641g/100 g MS) en proanthocyanidine dimère B2 (0.523 g/100 g MS) et en oligomères de proanthocyanidines (1.982 g/100 g MS). Ces suspensions cellulaires constitueraient donc une source privilégiée de composés bioactifs. En effet les teneurs en dérivés de flavane-3-ols (catéchines, proanthocyanidines) de ces suspensions cellulaires les placent à un niveau de rendement in vitro relativement élevé parmi ceux qui sont cités dans la littérature (Kartnig et al. 1993). Par comparaison au bouton floral in vivo les productions de certains composés sont supérieures dans les suspensions cellulaires. C’est notamment le cas pour les oligomères de proanthocyanidines (suspensions cellulaires : 1.98 g/100 g MS, bouton floral: 1.49 g/100g MS et pour la proanthocyanidine dimère B2 (suspensions cellulaires : 0.52 g/100 g MS, bouton floral: 0.34 g/100g MS).

Substances naturelles actives: La flore mauricienne, une source d’approvisionnement potentielle T Bahorun
AMAS 1997. Food and Agricultural Research Council, Réduit, Mauritius 87
Figures 1,2 Teneurs en composés phénoliques au cours de la croissance de colonies tissulaires cultivées en lumière continue à 22 oC
0 4 8 12 16 20 24 28 32 36 40
Jours de culture
0
1
2
3
4
5
6
g /
100
g
M
asse
sèc
he
0.00
0.04
0.08
0.12
0.16
0.20
0.24
Masse sèche g
Phénols totaux Masse Sèche
0 4 8 12 16 20 24 28 32 36 40
Jours de culture
0
1
2
3
4
5
6
g /
100
g
M
asse
sèc
he
0.00
0.04
0.08
0.12
0.16
0.20
0.24
Masse S
èche g
Proanthocyanidines totalesOligomères
PolymèresDimère B2
Masse Sèche
En comparant les teneurs des cultures issues d’autres plantes classiquement connues comme riches en polyphénols, nos résultats sur Crataegus monogyna ne montrent pas toujours des productions aussi élevées. Un exemple est celui de cultures de Marchaeranthera gracilis qui produisent jusqu’à 3% de la matière sèche en anthocyanes (Harborne 1980). A Lille une série de travaux portant sur l’optimisation des conditions de culture de colonies tissulaires de Fagopyrum esculentum a permis d’obtenir des quantités intéressantes de (-) épicatéchine (0.5 à 2 mg/g de MS), d’épicatéchine-3-O-gallate (1,5 à 6 mg/g de MS) de proanthocyanidines dont les dimères B2 (0.6 à 1.8 mg/g MS) et B2-3’-O-gallate (3,5 à 6 mg/g de MS) (Moumou et al. 1992). Des suspensions cellulaires et des cals de Cryptomeria japonica produisent jusqu’à 26% de proanthocyanidines par rapport à la masse sèche (Ishikura et Teramoto 1983). Des résultats impressionnants ont été obtenus à partir de suspensions cellulaires de Pseudotsuga
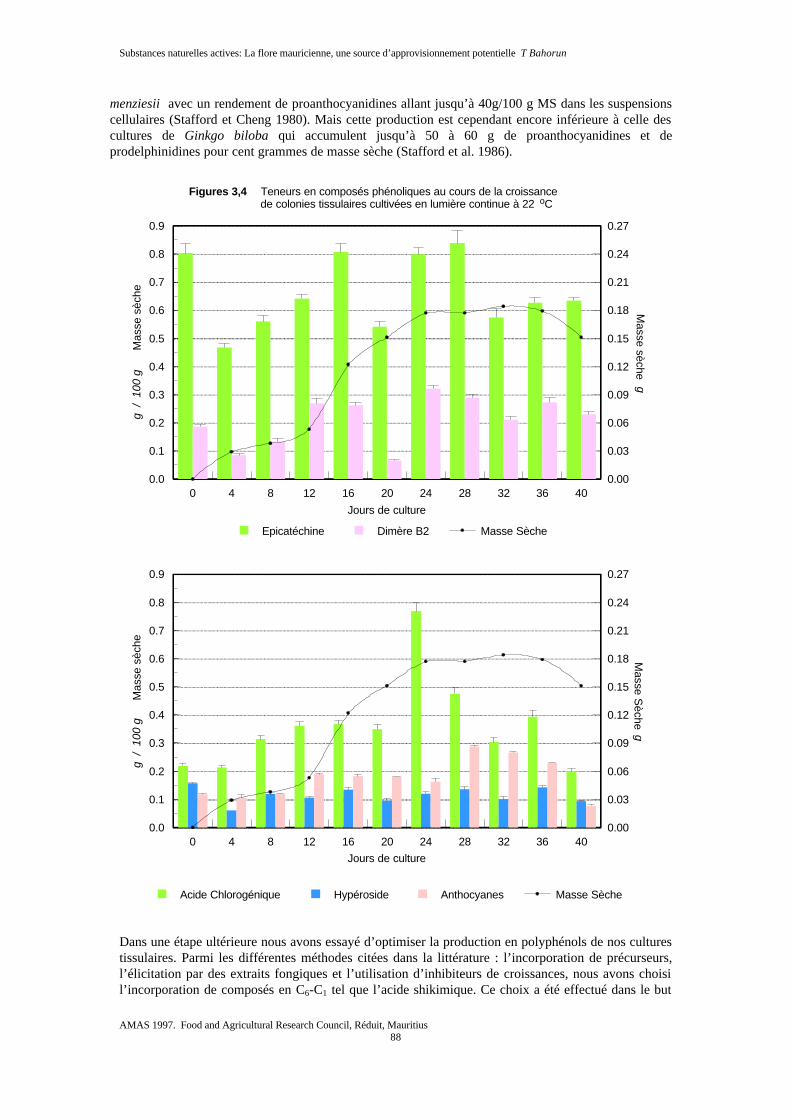
Substances naturelles actives: La flore mauricienne, une source d’approvisionnement potentielle T Bahorun
AMAS 1997. Food and Agricultural Research Council, Réduit, Mauritius 88
menziesii avec un rendement de proanthocyanidines allant jusqu’à 40g/100 g MS dans les suspensions cellulaires (Stafford et Cheng 1980). Mais cette production est cependant encore inférieure à celle des cultures de Ginkgo biloba qui accumulent jusqu’à 50 à 60 g de proanthocyanidines et de prodelphinidines pour cent grammes de masse sèche (Stafford et al. 1986).
Figures 3,4 Teneurs en composés phénoliques au cours de la croissance de colonies tissulaires cultivées en lumière continue à 22 oC
0 4 8 12 16 20 24 28 32 36 40
Jours de culture
0.0
0.1
0.2
0.3
0.4
0.5
0.6
0.7
0.8
0.9
g /
100
g
M
asse
sèc
he
0.00
0.03
0.06
0.09
0.12
0.15
0.18
0.21
0.24
0.27
Masse sèche g
Epicatéchine Dimère B2 Masse Sèche
0 4 8 12 16 20 24 28 32 36 40
Jours de culture
0.0
0.1
0.2
0.3
0.4
0.5
0.6
0.7
0.8
0.9
g /
100
g
M
asse
sèc
he
0.00
0.03
0.06
0.09
0.12
0.15
0.18
0.21
0.24
0.27
Masse S
èche g
Acide Chlorogénique Hypéroside Anthocyanes Masse Sèche
Dans une étape ultérieure nous avons essayé d’optimiser la production en polyphénols de nos cultures tissulaires. Parmi les différentes méthodes citées dans la littérature : l’incorporation de précurseurs, l’élicitation par des extraits fongiques et l’utilisation d’inhibiteurs de croissances, nous avons choisi l’incorporation de composés en C6-C1 tel que l’acide shikimique. Ce choix a été effectué dans le but

Substances naturelles actives: La flore mauricienne, une source d’approvisionnement potentielle T Bahorun
AMAS 1997. Food and Agricultural Research Council, Réduit, Mauritius 89
d’obtenir des polyphénols galloylés car ces dérivés sont connus pour être des composés pharmacologiquement plus actifs que leurs homologues non estérifiés (Hatano et al. 1989). Ces observations sont par ailleurs confirmés après par Saijo (1983) qui a obtenu de l’épigallocatéchine après avoir incorporé de l’acide shikimique dans les milieux de cultures de thé (Camellia sinensis). Notre but, sans viser des études poussées du métabolisme, était de tenter d’obtenir des dérivés galloylés de catéchines ou de dimères. Nos colonies tissulaires cultivées en présence d’acide shikimique, montrent une augmentation de leur croissance pour toutes les concentrations utilisées y compris les plus faibles (10 à 250 mg 1-1). La concentration la plus faible (10 mg l-1) combine bien les effets stimulants sur la croissance et sur la production de polyphénols. Toutes les catégories de composés phénoliques : les proanthocyanidines totales, oligomères, le dimère B2, la (-) épicatéchine ainsi que l’hypéroside, l’acide chlorogénique et les anthocyanes sont stimulés en présence d’acide shikimique (Figures 5, 6, 7). Les bons rendements en polyphénols que nous avons obtenus en présence d’acide shikimique rejoignent les observations faites par Shah et Mehta (1978) qui ont amélioré la production des colonies tissulaires de Crotalaria en présence de différents acides phénols.
0 10 50 100 250
Acide shikimique mg l -1
0
1
2
3
4
5
6
7
8
9
10
g /
100
g
Mas
se s
èche
Phénols totaux 12 joursPhénols totaux 20 jours
Proanthocyanidines totales 12 joursProanthocyanidines totales 20 jours
Figure 5 Effet de l'acide shikimique sur les composés phénoliques produits par des colonies tissulaires cultivées en lumière continue à 22 oC
Par ailleurs notre souhait d’obtenir une galloylation de composés polyphénoliques ne s’est pas réalisé dans cet essai. Aucun ester gallique n’a été décelé. Soulignons que des travaux précédents ont mis en évidence des dérivés galloylés à partir de plantes contenant déjà in vivo ces types d’esters. Par contre l’Aubépine in vivo ne contient aucun de ces dérivés. On pourrait alors comprendre l’absence de gallates dans nos cultures, celles-ci ne possédant vraisemblablement pas les équipements enzymatiques nécessaires à la formation de ces substances. A l’image des travaux effectués sur Crataegus monogyna in vivo et in vitro et en tenant compte des propriétés biologiques intéressantes des polyphénols, des études similaires ont été initiées sur des plantes locales répertoriées comme productrices de ces composés. Sur 5 plantes sélectionnées (Ayapana triplinervis, Cassia fistula, Psidium cattleianum, Amaranthus hybridus et Schinus terebinthifolius) et décrites pour leur production de polyphénols (Gurib-Fakim et al. 1995), notre

Substances naturelles actives: La flore mauricienne, une source d’approvisionnement potentielle T Bahorun
AMAS 1997. Food and Agricultural Research Council, Réduit, Mauritius 90
choix s’est porté sur Psidium cattleianum Sabine car un premier “screening” effectué a montré une distribution plus importante des composés recherchés dans ses tissus.
Figure 6 Effet de l'acide shikimique sur les composés phénoliques produits par des colonies tissulaires cultivées en lumière continue à 22 oC
0 10 50 100 250
Acide shikimique mg l -1
0.0
0.2
0.4
0.6
0.8
1.0
1.2
1.4
1.6
1.8
2.0
g /
100
g
M
asse
sèc
he
Epicatéchine 12 joursEpicatéchine 20 jours
Hypérosides 12 joursHypérosides 20 jours
L’espèce est très commune en régions élevées et les fruits sont utilisés dans la région en décoction pour lutter contre la diarrhée et la dysenterie. D’après la littérature, la plante renfermerait des alcaloï des, des phénols, des flavonoï des, des tanins, des stérols et des terpènes. Les résultats préliminaires développés ici sont issus d’analyses qualitatives des racines, des tiges, des organes foliaires et reproducteurs de la plante à une période donnée de leur développement. Nous avons étudié les différentes catégories de polyphénols en insistant sur les proanthocyanidines. Parmi celles-ci et parallèlement aux substances isolées, des fractions ont été définies par leur mode d’extraction (extraits totaux, extraits acétate d’éthyle ou extraits aqueux). Ceci nous conduira dans l’expression des résultats à indiquer dans les fractions extraites des proportions respectives entre telle ou telle catégorie (flavonoï des, catéchines, proanthocyanidines, acides phénols) ou même entre des sous-catégories comme les proanthocyanidines oligomères, polymères ou leur globalité. Les proanthocyanidines et catéchines ont été mises en évidence par chromatographie sur couche mince dans tous les organes analysés sauf les tiges à l’aide du système toluène/acétone/acide formique, (3:3:1). Ce système, très reproductible, possède l’avantage d’étager ces composés selon leurs masses moléculaires. Nous avons analysé : l’extrait total ainsi que, après fractionnement, la phase acétate d’éthyle et la phase aqueuse résiduelle. Par comparaison avec les Rf des témoins, nous avons noté dans la phase totale la présence de catéchines (Rf=0.68), et une zone correspondant aux dimères (Rf=0.44). Viennent ensuite des proanthocyanidines de poids moléculaires plus élevés et d’autre oligomères. Les polymères ne migrent pratiquement pas dans ce système. Les phases acétate d’éthyle contiennent principalement des oligomères de proanthocyanidines et des catéchines, les polymères restant majoritairement dans la phase aqueuse résiduelle. Des flavonoï des et acides phénols ont également été décelés dans les extraits. Une étude plus poussée est actuellement en cours pour leur identification.
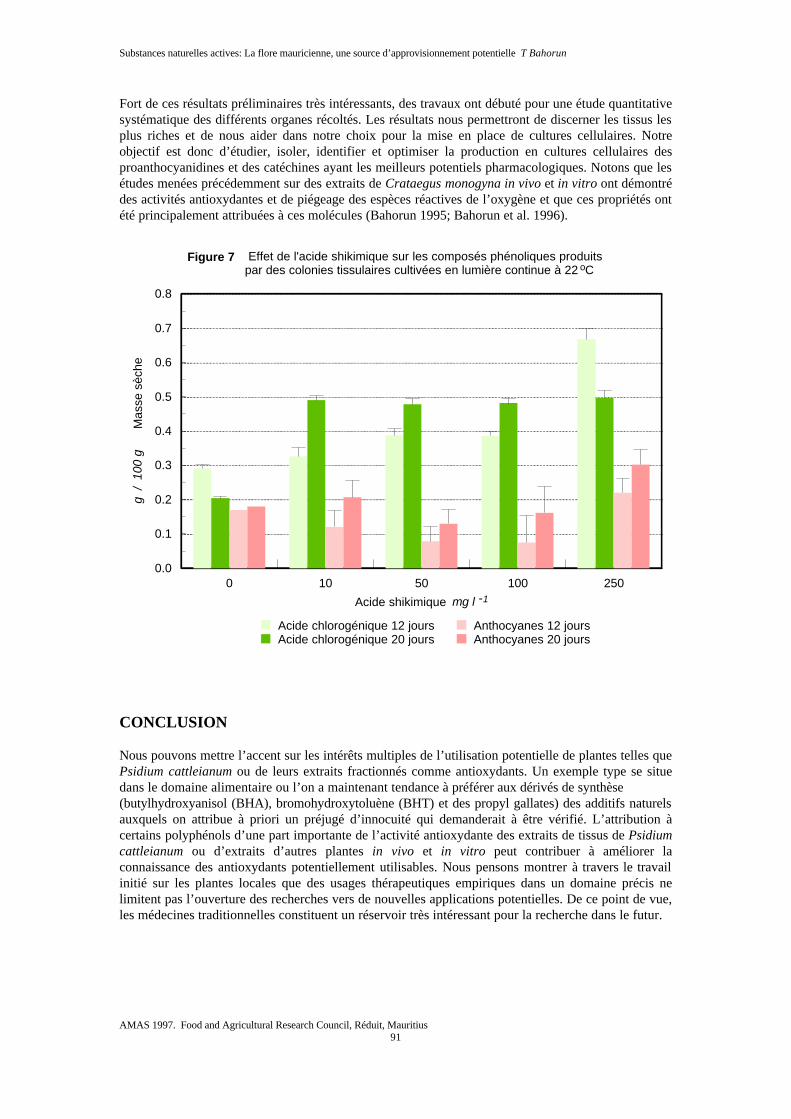
Substances naturelles actives: La flore mauricienne, une source d’approvisionnement potentielle T Bahorun
AMAS 1997. Food and Agricultural Research Council, Réduit, Mauritius 91
Fort de ces résultats préliminaires très intéressants, des travaux ont débuté pour une étude quantitative systématique des différents organes récoltés. Les résultats nous permettront de discerner les tissus les plus riches et de nous aider dans notre choix pour la mise en place de cultures cellulaires. Notre objectif est donc d’étudier, isoler, identifier et optimiser la production en cultures cellulaires des proanthocyanidines et des catéchines ayant les meilleurs potentiels pharmacologiques. Notons que les études menées précédemment sur des extraits de Crataegus monogyna in vivo et in vitro ont démontré des activités antioxydantes et de piégeage des espèces réactives de l’oxygène et que ces propriétés ont été principalement attribuées à ces molécules (Bahorun 1995; Bahorun et al. 1996).
Figure 7 Effet de l'acide shikimique sur les composés phénoliques produits par des colonies tissulaires cultivées en lumière continue à 22 oC
0 10 50 100 250
Acide shikimique mg l -1
0.0
0.1
0.2
0.3
0.4
0.5
0.6
0.7
0.8
g /
100
g
M
asse
sèc
he
Acide chlorogénique 12 joursAcide chlorogénique 20 jours
Anthocyanes 12 joursAnthocyanes 20 jours
CONCLUSION Nous pouvons mettre l’accent sur les intérêts multiples de l’utilisation potentielle de plantes telles que Psidium cattleianum ou de leurs extraits fractionnés comme antioxydants. Un exemple type se situe dans le domaine alimentaire ou l’on a maintenant tendance à préférer aux dérivés de synthèse (butylhydroxyanisol (BHA), bromohydroxytoluène (BHT) et des propyl gallates) des additifs naturels auxquels on attribue à priori un préjugé d’innocuité qui demanderait à être vérifié. L’attribution à certains polyphénols d’une part importante de l’activité antioxydante des extraits de tissus de Psidium cattleianum ou d’extraits d’autres plantes in vivo et in vitro peut contribuer à améliorer la connaissance des antioxydants potentiellement utilisables. Nous pensons montrer à travers le travail initié sur les plantes locales que des usages thérapeutiques empiriques dans un domaine précis ne limitent pas l’ouverture des recherches vers de nouvelles applications potentielles. De ce point de vue, les médecines traditionnelles constituent un réservoir très intéressant pour la recherche dans le futur.

Substances naturelles actives: La flore mauricienne, une source d’approvisionnement potentielle T Bahorun
AMAS 1997. Food and Agricultural Research Council, Réduit, Mauritius 92
REFERENCES ALIBERT G, RANJEVA R et BOUDET MA. 1977. Organisation subcellulaire des voies de synthèse
des composés phénoliques. Physiol. Veg. 15 : 279 - 301. ARUOMA OI, SPENCER JPE, BUTLER J and HALLIWELL B. 1995. Commentary reaction of
plant-derived and synthetic antioxidants with trichloromethylperoxyl radicals. Free Rad. Res. 22 : 187 - 190.
BAHORUN T. 1990. Etude des proanthocyanidines des tissus de sarrasin (Fagopyrum esculentum
Moench). France : Université de Compiègne, 50 p. (Mémoire de Diplôme d’ Etudes Approfondies (DEA)) .
BAHORUN T. 1995. Les polyphénols de Crataegus monogyna Jacq. in vivo et in vitro : analyses et
activités antioxydantes.. France : Université de Lille I, 150 p. (Thèse de Doctorat). BAHORUN T, GRESSIER B, TROTIN F, BRUNET C, DINE T, LUYCKX M, VASSEUR J, CAZIN
M, CAZIN JC and PINKAS M. 1996. Oxygen species scavenging activity of phenolic extracts from hawthorn fresh plant organs and pharmaceutical preparations. Arzneiminittel-forschung/Drug Research 46 II (11) : 1086 - 1089.
BAHORUN T, TROTIN F, POMMERY J, VASSEUR J and PINKAS M. 1994. Antioxidant activities
of Crataegus monogyna extracts. Planta Med. 60 : 323 - 328. BEZANGER-BEAUQUESNE L, PINKAS M, TORCK M et TROTIN F. 1990. Plantes médicinales
des régions tempérées. 2ème édition. France : Edition Maloine, p. 172 - 173. BIDET D, GAIGNAULT JC, GIRARD P et TROTIN F. 1987. Inflammation, allergie, douleur et
acide arachidonique: du jardin des Hespérides à la cascade de l’ acide arachidonique : Les flavonoï des. L’ actualité chimique , p. 89 - 97.
BROUILLARD R, FIGUEIREDO P, ELHABIRI M and DANGLES O. 1997. Molecular interactions
of phenolic compounds in relation to the colour of fruits and vegetables. p. 30 - 49. In :.. Phytochemistry of fruit and vegetables Proceedings of the Phytochemical Society of Europe. Oxford, UK : Clarendon Press.
BROWNLEE HE, HEDGER J and SCOTT IM. 1992. Effects of a range of procyanidins on the cocoa
pathogen Crinipallis perniciosa. Phys. Mol. Plant Pathol. 40 : 227 - 232. BRUNETON J. 1993. Pharmacognosie et phytochimie. Plantes médicinales . Paris, France :
Lavoisier. DAS HC, WANG JH and LIEN EJ. 1994. Carcinogenicity and cancer preventing activities of
flavonoids : A structure-system-activity relationship ( SSAR ) analysis. p. 133 - 136. In : JUCKER E ed. Progress in Drug Research . Basel : Birkhauser Verlag.
DAS HC and WEAVER GM. 1972. Cellulose thin-layer chromatography of phenolic substances. J.
Chromatogr. 67 : 105 - 111. De OLIVEIRA MM, SAMPAIO MRP, SIMON F, GIBERT B and MORS WB. 1972. Antitumor
activity of condensed flavenols. An. Acad. Brasil 44 : 41 - 44. DIDRY N, PINKAS M et TORCK M. 1982. Sur la composition chimique et l'activité antibacteriènne
des feuilles de divers espèces de grindelia. Pl. Med. Phytother. XVI : 7 - 15.

Substances naturelles actives: La flore mauricienne, une source d’approvisionnement potentielle T Bahorun
AMAS 1997. Food and Agricultural Research Council, Réduit, Mauritius 93
DUBOIS GE, GROSBY GA and SAFFRON P. 1977. Non nutritive Sweeteners : Taste structure relationships with for some new simple dihydrochalcones. Science 195 : 397 - 399.
FLEURIET A et MACHEIX JJ. 1977. Effet des blessures sur les composés phénoliques des fruits de
tomates “ cerises ” ( Lycopersicon esculentum var cerasiforme ). Phys. Veg. 15 : 239 - 250. GAMBORG UL, MILLER RA and OJIMA K. 1968. Nutrient requirements suspension cultures of
soybean root cells. Exp. Cell. Res. 50 : 151 - 158. GURIB-FAKIM A, GUEHO J and BOSSONDOYAL MD. 1995. Plantes médicinales de Maurice.
Tome 1 et 2. Rose Hill, Maurice : Editions de l’Ocean Indien. HARBORNE JB. 1980. Plant phenolics.p. 330 - 402. In : BELL EA and CHARLWOOD BV eds.
Encyclopaedia of Plant Physiology. New Series. Berlin, Germany : Springer-Verlag. HATANO T, EDAMATSU R, HIRAMATSU M, MOTI A, FUJITA Y, YASUHARA T, YOSHIDA T
and OKUDA T. 1989. Effects of the interaction of tannins with co-existing substances. VI. Effects of tannins and related polyphenols on superoxide anion radical, and on 1, 1-diphenyl-2-picrylhydrazyl radical. Chem. Pharm. Bull. 37 : 2016 - 2021.
HAYASE F and KATO M. 1984. Antioxidant compounds of sweet potatoes. J. Nutri. Sci. Vitaminol.
30 : 37 - 46. ISHIKURA N and TERAMOTO S. 1983. Procyanidins and catechins from callus and cell suspension
cultures of Cryptomeria japonica. Agric. Biol. Chem. 47 : 421 - 423. KARTNIG T, KOGL G and HEYDEL B. 1993. Production of flavonoids in cell cultures of Crataegus
monogyna. Planta Medica 59 : 537. KREOFSKY T, SCHLAGER JW, VUK-PAVLOVIC Z, ABRAHAM RT and ROHRBACH MS. 1992.
Condensed tannin promotes the release of arachidonic acid from rabbit resident alveolar macrophages. Am. J. Resir. Cell. Mol. Biol. 7 : 172 - 181.
LAMAISON JL and CARNAT A. 1991. Teneurs en principaux flavonoides des fleurs et des feuilles
de Crataegus monogyna Jacq. et de Crataegus laevigata ( Poiret ) DC. en fonction de la végétation. Pl. Med. Phytother. XXV : 12 - 16.
MABRY TJ and ULUBELEN A. 1980. Chemistry and utilization of phenylpropanoids including
flavonoids, coumarins and lignans. J. Agric. Food Chem. 28 : 188 - 196. MASQUELIER J, DUMON MC and DUMAS J. 1979. Stabilisation des collagènes par des oligomères
procyanidoliques. Acta therapeutique 1 : 101 - 104. MOUMOU Y, TROTIN F, VASSEUR J, VERMEERSCH G, GUYON R, DUBOIS J and PINKAS M.
1992. Procyanidin production by Fagopyrum esculentum callus tissue cultures. Physiol. Plant. 15 : 516 - 519.
MURASHIGE T and SKOOG F. 1962. A revised medium for rapid growth and bioassays with
tobacco tissue cultures. Physiol. Plant. 15 : 473 - 497. NITSCH JP and NITSCH C. 1961. Synergistes naturels des auxines et des giberellines. Bull. Soc. Fr.
26 : 2237 - 2240 OKAMURA H, MIMURA A, YAKOU Y, NIWANO M and TAKAHARA Y. 1993. Antioxidant
activity of tannins and flavonoids in Eucalyptus rostrata Phytochem. 33 : 557 - 561
Substances naturelles actives: La flore mauricienne, une source d’approvisionnement potentielle T Bahorun
AMAS 1997. Food and Agricultural Research Council, Réduit, Mauritius 94
OKUDA T, KIMURA Y, YOSHIDA T, HATANO T, OKUDA H and ARICHI S. 1983. Studies on the activities of tannins and related compounds from medicinal plants and drugs. I. Inhibitory effects of lipid peroxidation in mitochondria and microsome of liver. Chem. Pharm. Bull. 31 : 1625 - 1631.
PORTER LJ, HRSTICH LN and CHAN BG. 1986. The conversion of procyanidins and
prodelphinidins to cyanidins and delphinidins. Phytochem. 25 : 225 - 230. RAVN H, ANDARY C, KOVACS G and MOLGAARD P. 1984. Caffeic acid esters as in vitro
inhibitors of plant pathogenic bacteria and fungi. Biochem. Syst. Ecol. 17 : 175 - 184. REES SB and HARBORNE JB. 1985. The role of sesquiterpene lactones and phenolics in the
chemical defence of the chicory plant. Phytochem. 24 : 2225 - 2231 SAIJO R. 1983. Pathway of gallic acid biosynthesis and its esterification with catechins in young tea
shoots. Agric. Biol. Chem. 47 : 455 - 461. SHAH RR and MEHTA AR. 1978. Influence of phenolic acids on growth and production of phenolic
compounds in Crotalaria callus cultures. Bangladesh J. Bot. 7 : 51 - 57. SINGLETON VL and ROSS JA Jr. 1965. Colorimetry of total phenolics with phosphomolybdic-
phosphotungstic acid reagents. Amer. J. Enol. Vitic. 16 : 144 - 153. STAFFORD HA and CHENG TY. 1980. The procyanidins of douglas fir seedlings, callus and cell
suspension cultures derived from cotyledons. Phytochem. 19 : 131 - 135. STAFFORD HA, KREITLOW KS and LESTER HH. 1986. Comparison of proanthocyanidins and
related compounds in leaves and leaf-derived cell cultures of Ginko biloba L., Pseudotsuga menziesii F. and Ribes sanguineum P. Plant Physiol. 82 : 1132 - 1138.
STAVRIC B and MATULA TI. 1992. Flavonoids in food. Their significance for nutrition and health.
p. 274 - 294. In : ONG ASH and PACKER L eds. Lipid soluble and antioxidants: Biochemistry and clinical applications. Basel : Birkhauser Verlag.
THOMPSON RS, JACQUES D, HASLAM E and TANNER RJM. 1972. Plant proanthocyanidins.
Part I. Introduction : The isolation, structure and distribution in nature of plant procyanidins. J. Chem. Soc. Perkin Trans I : 1387 - 1399
AMAS 1997. Food and Agricultural Research Council, Réduit, Mauritius
95
RECENT ADVANCES IN AQUACULTURE IN MAURITIUS
M Bhikajee
University of Mauritius
ABSTRACT Aquaculture in Mauritius started in the 1800’s but formal aquaculture research dates back to 1950 with the introduction of the tilapia. Presently aquaculture is based on a variety of species, namely, Macrobrachium rosenbergii, Penaeus monodon, Rhabdosargus sarba, Siganus sutor, Oreochromis spp and the recently introduced fresh water lobster Cherax quadricarinatus. Research in aquaculture is carried out at the Albion Fisheries Research Centre and at La Ferme Fish Farm by the Ministry of Fisheries and Marine Resources, at the University of Mauritius and by some of the larger aquaculture companies attached to the sugar industry. Recent research and consultancy projects of the Ministry of Fisheries and Marine Resources and the University of Mauritius are listed and details are discussed. Aquaculture in barachois and the various problems associated with it are discussed. Recent production ,based on official figures of the Ministry of Fisheries and Marine Resources, are given. INTRODUCTION Historical Background Formal aquaculture research in Mauritius started in the 1950's with the introduction of the tilapia. In 1971, an F.A.O expert, Mr. Fujimora studied the possibilities of aquaculture development in Mauritius (SCET 1975). Following this study, the fresh water prawn Macrobrachium rosenbergii was introduced in 1972. After an initial trial period, a pilot hatchery was set up at Trou d'Eau Douce as a UNDP/FAO project with the aim of producing post larvae for sale to commercial enterprises. In the first year of its operation, the hatchery produced 43 000 juveniles and in 1973/74, the production was 1 million juveniles (SCET 1975). In 1982, a new hatchery was constructed at Albion and all research on Macrobrachium rosenbergii was transferred there. In the same year, a ten hectare farm with a total water spread area of 4 hectares was constructed at La Ferme. In 1975-76, six species of major Indian and Chinese carps were introduced in Mauritius and were cultured at the Curepipe Livestock Breeding Station. These cultures were subsequently transferred to the La Ferme Fish Farm Experimental Station. Induced breeding of the carps in captivity were successful using hormone injection. However, because carps were not easily accepted by consumers, production was stopped and research efforts were concentrated on the fresh water prawn. With the production of Macrobrachium by the private sector, La Ferme discontinued further development in this field so as to allocate more resources to the diversification of other species for aquaculture development. In 1988, the Marine Shrimp Culture Experimental Station was constructed at Albion and its activities included: Penaeus monodon culture, breeding and culture of a few marine fishes, fresh water fish culture and plankton culture as live feed for hatchery use. In November 1990, a triple cross hybrid of three species of tilapia (Oreochromis niloticus, O. mosambicus and O. aureus) was introduced from Malaysia. These were bred in fresh water at La Ferme and in sea water at Albion Fisheries Research Centre. PRESENT WORK

Recent advances in aquaculture in Mauritius M Bhikajee
AMAS 1997. Food and Agricultural Research Council, Réduit, Mauritius 96
Marine shrimp culture In order to prevent the contamination of local stocks of marine shrimps from infections from abroad, the Ministry of Fisheries and Marine Resources uses locally available spawners for its broodstock. The broodstock obtained from the wild are kept in maturation tanks and are fed on special diets. When fully mature, they are induced to spawn by eye stalk ablation. Production of post larvae was started in 1989 with a small output of 19 972 units. Production in subsequent years increased to reach a peak of 806195 individuals in 1993 due to the timely availability of good spawners from the wild. In 1995, eighty two adult Penaeus monodon (34 of which were females) were obtained from the wild by Albion Fisheries Research Centre and the production of post larvae reached 303 189. Out of this, 295 228 were stocked in the nursery ponds and later transferred to grow-out ponds for culture trials. In the same year, 3 tonnes of Penaeus monodon were harvested with a survival rate of nearly 70% (Ministry of Fisheries & Marine Resources 1996). The reduced production in 1994/95 was attributed to the fact that pond-reared females developed a high percentage of resorbed ovaries and poor quality of eggs; persistent fungal and bacterial infections also gave low overall survival rates of the larvae. Table 1 lists the production of post larvae from 1989 to 1995.
Table 1 Annual production of Penaeus monodon
Year Number of Post Larvae 1989 19 972 1990 308 375 1991 350 743 1992 437 876 1993 806 195 1994 167 781 1995 303 189
In December 1995, 7961 post larvae were also stocked in cages in the following barachois: Bocambous (Bambous virieux), Beau Rivage (FUEL), Choisy (Constance La Gaiete) and Montagu (FUEL) for experimental purposes. Marine fish breeding Rhabdosargus sarba In 1989, the marine fish Rhabdosargus sarba, locally called “Gueule Pavé”, was induced to spawn in captivity by hormone injection and 5000 juveniles were produced in that year. In 1995, Rhabdosargus sarba broodstock were collected from 3 barachois, namely, Melville, Montagu and Beau Rivage and were kept under controlled conditions. Spontaneous spawning took place in captivity and 8575 fingerlings were produced and these were stocked in floating net cages in barachois for culture trials. Table 2 shows the production of Rhabdosargus sarba fingerlings from 1989 to 1995. The drop in fingerling production is attributed to recurrent fungal and protozoan infections. Polyculture of Siganus sutor and Rhabdosargus sarba. An experimental culture of hatchery produced fingerlings of Rhabdosargus sarba and Siganus sutor fingerlings from a wild stock were reared together. The experiment lasted 16 months and the average weight attained was 450 g for Rhabdosargus sarba and 635 g for Siganus sutor. The Rhabdosargus sarba reached maturity at the age of 12 months with an average weight of 275 g. During the experiment, 3640 kg of supplemental feed were applied which gave a Feed Conversion Ratio of 6.5:1 and a fish production of 2.24 kg m-3. Table 3 summarises the results of the experimental culture.

Recent advances in aquaculture in Mauritius M Bhikajee
AMAS 1997. Food and Agricultural Research Council, Réduit, Mauritius 97
Table 2 Rhabdosargus sarba fingerlings production from 1989 to 1995
Year Number of Fingerlings produced
1989 5 000 1990 16 829 1991 10 200 1992 8 100 1993 6 500 1994 8 000 1995 8 575
Source: Ministry of Fisheries and Marine Resources 1996
Table 3 Results of polyculture experiment
Particulars Units Siganus sutor Rhabdosargus sarba Number stocked n 1 000 825 Mean Weight at Stocking g 0.72 0.01 Number harvested n 575 433 Mean Weight at Harvest g 635 450 Period of Growth month 16 16 Survival Rate % 57.5 52.4 Biomass Harvested kg 365 195
Source: Ministry of Fisheries and Marine Resources 1996
Tilapia culture The triple cross hybrid of three species of tilapia (Oreochromis niloticus, O. mosambicus and O .aureus) was introduced from Malaysia in 1990 and experimental culture started at La Ferme Fish Farm in 1991. In order to benefit from the high growth rate of males compared to females, fry were collected from broodstock ponds and were sex-reversed by feeding them on a diet containing methyl testosterone for four weeks. In 1995 a total of 440 684 tilapia fingerlings were produced, most of which were distributed free to 330 fish farmers at sixty three different sites. The total area under land-based tilapia culture in Mauritius is 110 585 m2. Tilapia are also acclimated to sea water and are cultured in barachois. Table 4 gives the annual production of tilapia fingerlings by the Ministry of Fisheries and Marine Resources. In addition to these figures, fingerlings were also produced by the private sector for sale to entrepreneurs.
Table 4 Annual production of tilapia fingerlings by the Ministry of Fisheries.
Year Tilapia fingerlings
1992 193 789 1993 483 808 1994 476 685 1995 440 684

Recent advances in aquaculture in Mauritius M Bhikajee
AMAS 1997. Food and Agricultural Research Council, Réduit, Mauritius 98
Fresh water lobster The Red Claw fresh water lobster, Cherax quadricarinatus, has recently been introduced in Mauritius from Australia. These lobsters are highly adaptable and both males and females attain maturity within 9 months after hatching. Their growth is relatively fast over a wide range of temperature (from 23oC to 31oC) and they can reach 60 to 120 g in a year They are detrivores and can be cultured on simple diets. Pre-release experiments are still in progress on this species. Other productions at La Ferme Fish Farm La Ferme Fish Farm has been phasing out the culture of Macrobrachium rosenbergii and carps in order to allow more space for the introduction of new species. The production of these 2 species are given in Table 5.
Table 5 Production of La Ferme Fish Farm kg
Year Macrobrachium rosenbergii Carps 1986 1 252 2 417 1987 2 587 2 708 1988 1 484 2 298 1989 1 927 1 200 1990 675 6 416 1991 1 404 4 824 1992 598 366 1993 194 582 1994 - 746 1995 - 300
Barachois Culture Barachois culture dates back to 1800’s with the impounding of several bays, creeks and estuaries to form pens. A barachois is a coastal indentation cut off from the sea by an artificial embankments, several sluice openings closed by gratings, enable the water within to be renewed twice daily by tidal action, but prevent the fish from escaping. The barachois are therefore partly enclosed water bodies that retain a free communication with the open sea. There are 33 barachois in Mauritius, out of which 24 are operational. The areas of the barachois vary from 0.5 to 45 ha (mean area 13.4 ha; total area 268 ha). The tidal range being quite small (less than 0.6 m) there is only limited water exchange between the enclosed area and the open sea. Fresh water seepage into the sea occurs in most of the wide lagoons. In some of the areas, springs and small streams further reduce the salinity. With few exceptions, the water in the barachois is brackish and salinity varies from 0 to 35 parts per thousand depending on the amount of fresh water run-off from the land or from streams. Barachois are used for the culture of finfish, crabs and oysters. Traditional management practice is restricted to stocking, some control on predation and harvesting. Table 6 gives the official production figures for barachois culture Problems of culture in Barachois The major problem derives from the fact that the barachois are natural water bodies which are lined by mangroves . As a result, all the stocked fish seek refuge in the Acropora roots and cannot be approached for monitoring or harvesting. In addition the irregular bottom of the barachois does not allow the use of any seine net for sampling or harvesting. Predators such as Barracuda (Sphyraena barracuda) and Carangids (Caranx spp) enter the barachois through the gridded walls as larvae and greatly reduce the number of stocked fish.

Recent advances in aquaculture in Mauritius M Bhikajee
AMAS 1997. Food and Agricultural Research Council, Réduit, Mauritius 99
Table 6 Barachois production from 1991 to 1995
Year Crabs Oysters Tilapia Other Finfish 1991 2.0 80 - 16 1992 2.5 100 5 16 1993 2.5 115 7 21 1994 5.0 95 5 30 1995 5.0 185 7 32
Source: Ministry of Fisheries & Marine Resources 1996
Historically, barachois owners practised extensive culture and relied entirely on primary productivity for feeding their fish. With the introduction of the red tilapia, they started using supplemental feed in the form of commercial pellets. However the dispersion of the fish in the wide barachois casts doubts on the availability of the pellets to the entire stock being given that locally produced commercial pellets sink and crumble very fast in water. In the absence of any local cereal industry, low cost by-products for feed manufacture like rice-husk or wheat bran are not available, and have to be imported adding considerably to the cost of the feed and hence to the cost of production.. Although the land surrounding a barachois can belong to the entrepreneur exploiting the barachois, the water body itself is legally considered as public domain. Any intruder found fishing inside a barachois can only be sued for trespassing over the land belonging to the owner. The fine is minimal and does not discourage poaching. Introduction of cages Rearing fish in cages solves most of the problems encountered in open barachois culture. The cages are placed in the barachois itself because of the protection it offers and the advantages are multi-fold. The fish do not disperse in the barachois or hide in the mangroves; this solves the problem of feeding as all the fish are aggregated in one place; it also greatly facilitates harvesting. The usual way to harvest is to tow the cage ashore or to a shallow region and to scoop out the fish by means of nets. Once the tilapia are reared in cages, they are not accessible to the predators which already exist in the barachois. Persistent Problems Rearing fish in cages solved several problems linked to the Mauritian aquaculture industry; however, there are still some problems which await a solution. The non-availability of a proper floating extruded feed still hinders the development of aquaculture; locally produced feed sink and crumble within a minute; if not eaten immediately, it passes through the mesh of the cages and is lost to the fish. Accumulation of uneaten feed under the cages gives rise to water quality problems. The low tidal range prevents adequate water exchange in the barachois; this is not improved by the small mesh of the gridded gates which also impede water circulation; the result is a lowering of the salinity of the water in the barachois during heavy rains or an increase in salinity in case of drought. Furthermore, accumulation of detrital matter increases the oxygen consumption by organic matter. Moving from open culture in the barachois to cage culture has been an important step in improving management of the cultured stock. However, a number of measures need to be taken to ensure survival of the industry, formulation and manufacture of extruded floating pellets and engineering of proper water flow systems, require immediate attention. Several problems hinder the proper development of aquaculture in Mauritius. As a result the total aquaculture production has been increasing only slowly in the recent years. Table 7 shows aquaculture production figures from 1991 to 1995 (excluding oysters).

Recent advances in aquaculture in Mauritius M Bhikajee
AMAS 1997. Food and Agricultural Research Council, Réduit, Mauritius 100
Table 7 Aquaculture production in Mauritius tons
Year Marine Shrimp
Fresh water fish
Fresh water prawn
Barachois Production
Total
1991 3.2 10.0 37 18.0 68.2 1992 1.6 9.4 55 23.5 89.2 1993 1.3 15.0 53 30.5 99.8 1994 1.8 17.9 63 40.0 122.8 1995 3.0 55.0 53 44.0 155.0
Aquaculture research at the University of Mauritius At the University of Mauritius, because of the distance from the sea, most of the research projects have been on fresh water aquaculture. The involvement of the University of Mauritius in aquaculture research started in 1991 with very limited resources and it gained momentum only after 1994 with the addition of a wet laboratory. Research activity in aquaculture at the University of Mauritius can be broadly divided into 2 types:
Research projects initiated at the University
Consultancy projects
Research Projects initiated at the University of Mauritius. The following is a list of completed research projects in aquaculture.
& 1991. A comparative study of two culture media for the culture of Skeletonema costatum, a live prawn feed at different temperatures.
& 1994. Food selection and feeding behaviour of an Oreochromis hybrid.
& 1994. Gastric emptying and the return of appetite in an Oreochromis hybrid.
& 1995. Influence of increase in food fibre on cellulolytic microflora and growth performance of an Oreochromis hybrid.
& 1996. Effect of temperature on the ingestion rate and growth of an Oreochromis hybrid. & 1997. Change in water parameters following a power failure simulation in a closed aquaculture system.
& 1997. Digestibility of commercial feeds by an Oreochromis hybrid.
& 1997. Studies on an experimental fouling-resistant floating cage for mariculture.
& 1997. The aquaculture industry in Mauritius- a diagnostic study. All these projects were planned after consultation with the Ministry of Fisheries or with other people who are actively involved in commercial aquaculture. The reports of all these research projects are available in the library of the University of Mauritius.

Recent advances in aquaculture in Mauritius M Bhikajee
AMAS 1997. Food and Agricultural Research Council, Réduit, Mauritius 101
Consultancy Projects
Consultancy work in aquaculture by the University was initiated in 1994 through the Mauritius Chamber of Agriculture and the Mauritius Meat Producers' Association. The Association groups a number of barachois owners; problems encountered in the management of water bodies are due to the absence of baseline data concerning the depth of barachois, water quality and potential for fish and shell fish production.
1 1994. Belle Vue Mauricia/Beau Plan Sugar Estate Mauritius. (Bassin Saint François, Cap Malheureux).
1 1994 & 1996. Constance Sugar Estate, Mauritius.(Barachois Choisy and Bassin Nozaic).
1 1995. Flacq United Estate Ltd., Mauritius (Barachois Beau Rivage and Bassin Poulailler).
1 1995. Les Beaux Multipliants Ltd, Mauritius (Bassin Montagu, Trou d'eau Douce).
The University surveyed six barachois, listed above to establish their potential for aquaculture. CONCLUSION Aquaculture development in Mauritius is progressing quite slowly due to several problems linked to production costs and to natural conditions. However, it is expected that some of these problems will be solved in the coming years and with the increase in the expertise available, aquaculture research will no doubt progress at a faster pace. REFERENCES MINISTRY OF FISHERIES & MARINE RESOURCES. 1996. Annual Report 1995. Albion Fisheries
Research Centre., Mauritius, 57 p. SCET see under Sociéte Centrale pour l’Equipement du Territoire . SOCIETE CENTRALE POUR L’EQUIPEMENT DU TERRITOIRE. 1975. Problèmes posés par le
développement et l’organisation des pêches mauriciennes. France : Societé Centrale pour l’ Equipement du Territoire International, 268 p.

Recent advances in aquaculture in Mauritius M Bhikajee
AMAS 1997. Food and Agricultural Research Council, Réduit, Mauritius 102
COMMENTS Q. In one of your graphs you have shown a decrease in the production of fingerlings for marine
shrimps. Any particular reason for that? A. In 1993, the Fisheries Department was lucky to get females with eggs from fishermen; this is why
there has been an increase in this year as compared to other years. Q. Is there any interest in the rearing of tilapia? A. Tilapia can be reared easily but the only problem is that of marketing and consumer acceptance.

AMAS 1997. Food and Agricultural Research Council, Réduit, Mauritius
103
INTEGRATED PEST MANAGEMENT OF Plutella xylostella AN IMPORTANT PEST OF CRUCIFERS IN MAURITIUS
S Facknath
University of Mauritius
ABSTRACT The IPM approach is being studied for the control of Plutella xylostella (the diamondback moth DBM), a serious pest of cruciferous crops, and various methods are being investigated at the University of Mauritius (UOM) and the Ministry of Agriculture. At the UOM, methods have so far concentrated on the development of botanical pesticides, cultural practices such as intercropping and use of a trap crop, as well as combinations of botanicals and intercropping. Plutella research at the University has also included use of a bacterial pathogen, namely Bacillus thuringiensis, as well as host-preference studies. In association with the indigenous and introduced biocontrol agents affecting DBM, and the normal practice of using overhead sprinkler irrigation, which is known to have a reducing effect on Plutella populations, the combination of experiments actually represent an IPM strategy, which can serve as a basis for a more structured and comprehensive package for the integrated management of Plutella xylostella in Mauritius. INTRODUCTION Integrated Pest Management (IPM) is an approach to keeping pest populations below a level causing economic loss, through the judicious and compatible use of two or more of several possible control measures: biological, cultural, biology-based, genetic, physical/mechanical and chemical. IPM projects are being developed throughout the world for the control of serious pests of agricultural, veterinary and medical importance. Selection of the control measures adopted as part of an IPM package is based on many factors : available resources, such as money, manpower, technical know-how, skills; the agroecosystem; geographical location; socio-economic situations, etc. However, the general trend appears to incorporate three main components: Chemical control using botanical pesticides or selected synthetic pesticides; biological control using parasitoids and cultural control using resistant varieties of crops. Plutella xylostella (L.) (Lepidoptera:Yponomeutidae), commonly known as the Diamond Back Moth (DBM), is one of the most important pests of cruciferous crops throughout the world, and can cause serious economic losses if not checked. In the warm, humid tropics this insect breeds throughout the year, and can have more than ten generations annually. The destructiveness of DBM, coupled with the fact that it has the capacity to develop resistance very rapidly to any control measure used singly, has made this pest the focus of IPM research in many parts of the tropical world. Practically all the available methods and pest control technologies have been tried at some time or another for the management of DBM. In Mauritius, development of pesticide resistance by DBM has progressed rapidly from Lannate (methomyl) to Rogor (dimethoate) to Tamaron (methamidophos) to Decis (deltamethrin) to Selecron (profenofos) to Tokuthion( prothiofos). At present the use of Suntap (cartap hydrochloride), Vertimec (avermectin), Cascade (flufenoxuron) and Selecron (profenofos) is recommended, based on the severity of the pest attack (MANR 1995). Considerable research effort is being devoted to developing an IPM strategy for DBM control. Studies are being conducted at the University of Mauritius and the Ministry of Agriculture involving various approaches (Table 1).

Integrated pest management of Plutella xylostella, an important pest of crucifers in Mauritius S Facknath
AMAS 1997. Food and Agricultural Research Council, Réduit, Mauritius
104
Table 1 Research strategies presently being explored for the control of Plutella xylostella in Mauritius
Control Approach Research Strategy
At the University of Mauritius Allelochemicals Botanical pesticides Microbial control Pathogens (Bacillus thuringiensis) Cultural control Intercropping and use of trap crops Combinations of above Botanicals and cultural control
At the Ministry of Agriculture Chemical control Synthetic pesticides and growth regulators Biological control Parasitoids Microbial control Bacillus thuringiensis Physical control Traps Genetic control F 1 sterility
BOTANICAL PESTICIDES At the University, a large number of local plant groups have been investigated for their pesticidal properties against a range of agricultural pests. Table 2 lists a few of the plant species which exhibited strong pesticidal potential against DBM (Facknath 1997). Their effects were varied :
Table 2 Plant species exhibiting pesticidal potential against Plutella xylostella
Vernacular name Plant species Biological Activity Ayapana Ayapana triplinervis AF, GR Botrys Chenopodium spp AF Corrosol Annona murricata CSI, GR L’herbe bouc, goat weed Ageratum conyzoides GR Indian privet Ligustrum robustum IN, GR Lemon grass Cymbopogon citratus AF, GR, IN Melia, bakain, lila perse Melia azederach IN, AF, GR, RP Neem Azadirachta indica AF,IN,GR,RP,OVDT Vetiver Vetivera zizanoides AF, GR Vieille fille Lantana camara AF, GR
AF : antifeedant IN : insecticidal CSI : chitin synthesis inhibitor OVDT : oviposition deterrent GR : growth regulating activity RP : repellent Neem, melia,lemon grass, ayapana, lantana, vetiver and botrys affected feeding adversely by making the treated host plant unpalatable to the pest larvae. The larvae, although remaining on the host plant, starved to death within a few days. Goat weed, neem, corrosol, lemon grass, ayapana, vetivera, lantana,indian privet and melia affected the growth and development in different ways, resulting in distorted pupae, pupal death, partial emergence of adults and deformed adults. Melia, lemon grass and indian privet were toxic to the larvae and caused significant mortality. Melia, however, is known to be toxic to higher animals as well, and hence its application in pest control is as yet limited. Corrosol inhibited the synthesis of chitin, an amino-polysaccharide, which together with proteins and lipids, forms the insect cuticle.Lack of chitin causes death of the insect at the time of moulting and metamorphosis. Neem also repelled the adult females from laying eggs, thereby reducing the DBM population in the next generation. Moreover, extracts of neem seed kernels, applied to Plutella-infested cabbage plots had no adverse effects on the development and emergence of the introduced

Integrated pest management of Plutella xylostella, an important pest of crucifers in Mauritius S Facknath
AMAS 1997. Food and Agricultural Research Council, Réduit, Mauritius
105
larval parasitoid of DBM, namely Cotesia plutellae (Hymenoptera : Braconidae). The advantages of botanical pesticides over synthetic chemicals are by now very well-documented and well-known. Most of them are safe to prepare and apply; safe to humans, to non-target organisms, to beneficial insects, and to the environment in general; they leave no residues, hence cause no contamination nor pollution; they are often cheaper and just as effective as the synthetics. In most cases their bioactive compounds are fairly complex groups, thereby making it more difficult for the pest to develop resistance. All the plant species listed in Table 2 are easily available in Mauritius and simple extracts of the same can be prepared by the farmer himself. Commercial formulations of A. indica (neem) are manufactured in India, Canada and the US (Table 3), and are being marketed and used in many parts of the world. Interest in these preparations is gaining ground in Mauritius and it is hoped that soon such botanical formulations will be available on the local market.
Table 3 Commercial formulations of neem available on the world market
Trade Name of Formulation India USA
Achook Azatin EC Dimilin Margosan -0 Jawan Neemix -45 Neem Guard NEEMA-S 1 Neemark NeemAzal Neempest Nimbecidine Nimbicilin Nimbitor Nimin (neem-coated urea) Pra Neem Repelin
Bacillus thuringiensis Bacillus thuringiensis (B.t.) was investigated way back in 1976 at the University of Mauritius, for the control of another lepidopteran pest, Crocidolomia binotalis (Ramgoolam 1976), and recently in 1995 for the control of DBM (Goolaub 1995). Turex, a formulation consisting of the B.t. strain GC 91, derived by conjugation of two distinct B.t. strains showing different spectra of insecticidal properties, was studied in laboratory bioassays as well as in field trials, and was found to provide protection comparable to that of the recommended thiocarbamate insecticide - Suntap (cartap hydrochloride). However, contrary to earlier expectations, there are reports of Plutella having developed resistance to B.t. in certain parts of the world (Tabashnik et al. 1990). INTERCROPPING AND TRAP CROPS Intercropping is an ancient and traditional agronomic practice which, if utilised correctly, can contribute significantly to reduce pest problems. Several field trials have been conducted using different intercrops such as tomato, garlic, coriander and carrot. The intercrops were grown in alternate rows with cabbage, and their influence on Plutella population was estimated. It was observed that the intercropped plots had significantly lower numbers of Plutella larvae and pupae, and a higher yield of good quality cabbage heads, as compared to the control (pure stand) cabbage plots. Tomato exhibited the greatest deleterious effect on pest populations. The reducing action of tomato plants on Plutella when grown in interrows with cabbage, corroborated the reports by Buranday and Raros (1973), and Sivapragasam et al. (1982). Similarly, garlic in interrows of cabbage also has been

Integrated pest management of Plutella xylostella, an important pest of crucifers in Mauritius S Facknath
AMAS 1997. Food and Agricultural Research Council, Réduit, Mauritius
106
reported to decrease Plutella numbers (Talekar et al. 1986). The confusing olfactory and visual cues received from host and non-host plants, leading to disruption of mating, are believed to be partly responsible for the reduction in larval numbers, while tomato is known to release certain volatile chemicals which have a repellent action on the adults. Mustard was tested for its role as a ‘trap crop’. Alternate rows of mustard and cabbage had lower numbers of Plutella larvae and pupae on the cabbages as compared to those on the pure stand cabbage. Mustard attracts Plutella and other crucifer pests, thereby drawing them away from the main crop. Plutella has been reported as showing a distinct preference for mustard for oviposition. This attractance and oviposition stimulant property of mustard has been attributed to the effect of volatile compounds such as isothiocyanates released by the mustard plants (Srinivasan and Krishna Moorthy 1991). Host preference studies at the University have shown that Plutella prefers cabbage over both cauliflower and broccoli, and cauliflower over broccoli. Apart from lowering infestation, the intercrops can also provide additional revenue to the grower.
COMBINATION OF INTERCROPPING AND USE OF BOTANICALS The effect of intercropping with plants of either tomato, coriander or garlic, combined with the application of neem seed kernel extract was found to be even more efficient in protecting cabbage plants in the field. In fact, the cabbage-tomato-neem combination treatment was observed to be comparable to that of the recommended insecticide, Suntap (cartap hydrochloride), with respect to the number of Plutella larvae and pupae, number of infested cabbage plants per plot, and the quality of harvested heads (Facknath 1996). IPM The above-described studies were conducted to compare the effects of specific treatments (botanical pesticides, B.t., intercropping, trap crops, botanical pesticides in addition intercropping ) with their respective controls, and with each other. However, it must be remembered that these trials were carried out both in the laboratory and on farm; in the open field the natural enemies such as predators, parasites and pathogens of Plutella xylostella exist; these are the indigenous species as well as those deliberately introduced into Mauritius for the biocontrol of Plutella, for instance the larval parasitoids, Cotesia plutellae and Diadegma semiclausum. Although the role of these natural enemies was not quantified in the above-mentioned studies, they definitely must have contributed to the overall results obtained, in the control of DBM in the experimental plots. Furthermore, in all the field trials, overhead sprinkler irrigation was used, as is the normal practice on the University farm. In case of Plutella, this type of irrigation has been shown to have a significantly negative effect on Plutella populations by causing the eggs and larvae to be dislodged and washed off the plant and to drown. Overhead sprinkler irrigation also disrupts adult flight, mating and oviposition (Nakahara et al. 1986; Talekar et al. 1986). Thus, in the experiments designed to study the combined effects of intercropping and botanical pesticides, in actual fact, the IPM strategy comprised of the application of botanicals, biological control, and cultural practices such as mixed cropping (intercropping or use of trap crops) and overhead sprinkler irrigation. The satisfactory results obtained with this combination suggest that this IPM strategy could be used as a base on which to develop an improved and more comprehensive IPM package through the incorporation of some selected measures. A few species of Plutella egg parasitoids of the genera Trichogramma and Trichogrammatoidea and pupal parasitoids such as Diadromus spp have been reported in the literature, as also other parasitoids such as Brachymeria spp, Eriborus spp and Agathis spp (Waterhouse 1992). A granulosis virus (Wakisaka et al. 1992) and fungal pathogens, for example Paecylomyces spp (Alam 1992), Pandora blunckii and Zoophthora radicans (Riethmacher et al. 1992) have been documented as infecting DBM larvae under conditions of high humidity. Some of these could be tried in Mauritius. Use of resistant varieties, crop rotation, use of trap crops in

Integrated pest management of Plutella xylostella, an important pest of crucifers in Mauritius S Facknath
AMAS 1997. Food and Agricultural Research Council, Réduit, Mauritius
107
appropriate planting patterns could be included as part of the cultural practices, while the use of yellow, sticky traps would be a simple, effective mechanical method. CONCLUSION Studies conducted at the University of Mauritius and the Ministry of Agriculture indicate that we are more than halfway towards developing the desired IPM strategy for the control of the diamondback moth in Mauritius. A few parasitoids have already been established, among them the one that has been most successful in similar situations in many other countries, namely Cotesia plutellae. B.t. is being tried on an experimental basis, and has shown promise, although it will have to be used very carefully in order to prevent build up of resistance in the pest. Appropriate botanical pesticides, for example commercial formulations of neem, are available and could be used in the first instance, as an excellent replacement to the synthetic chemicals being used presently by our farmers. Apart from all the advantages and safety aspects of botanicals as compared to synthetics, it will also give farmers the necessary psychological satisfaction of having sprayed at least some product to protect their crucifers. This will have the important benefit of helping to reduce the present excessive use of synthetic insecticides which has been causing concern for sometime now, and which is not compatible with the biological and microbial components of an IPM package. Introduction of specific egg and pupal parasitoid(s), pathogen(s), incorporation of suitable cultural practices such as intercropping, trap crops, crop rotation, physical traps, would complete the package for the integrated management of Plutella xylostella in Mauritius. REFERENCES ALAM M. 1992. Diamondback moth and its normal enemies in Jamaica and some other Caribbean
islands. p. 419 - 426. In : Talekar NS ed. Proceedings Second International Workshop, Management of diamondback moth and other crucifer pests. Tainan, Taiwan : AVRDC. 1990.
BURANDAY RP and RAROS RS. 1973. Effects of cabbage-tomato intercropping on the incidence
and oviposition of the diamondback moth Plutella xylostella (L.). Phillipines Entomologist 2 : 369 - 374.
FACKNATH S. 1996. Application of Neem extract and intercropping for the control of some cabbage
pests in Mauritius. Proc. International Neem Conference, Queensland, Australia, Feb. 1996 In Press.
FACKNATH S. 1997. Study of botanical pesticides in Mauritius. Proc. Expert Group Meeting on risk
reduction in agrochemical development in the Afr0-Arab region. Dec. 1996, Mauritius. GOOLAUB A. 1995. Study of a Bacillus thuringiensis formulation for the control of some important
lepidopteran pests of agriculture.BSc Thesis. Reduit : University of Mauritius. MANR see under Ministry of Agriculture and Natural Resources MINISTRY OF AGRICULTURE AND NATURAL RESOURCES. 1995. Le guide du petit
exploitant. Mauritius : Ministry of Agriculture and Natural Resources. 128 p. NAKAHARA LM, McHUGH J, OTSUKA CK, FUNUSAKI GY and LAI PY. 1986. Integrated
control of diamondback moth and other insect pests using an overhead sprinkler system, an insecticide and biological control agents on watercress farm in Hawaii. p. 403 - 413. In : TALEKAR NS and GRIGGS TD eds. Proceedings First International Workshop, Diamondback moth management. Shanhua, Taiwan : AVRDC,. 1985.

Integrated pest management of Plutella xylostella, an important pest of crucifers in Mauritius S Facknath
AMAS 1997. Food and Agricultural Research Council, Réduit, Mauritius
108
RAMGOOLAM P. 1976. A preliminary investigation to assess the potential of Bacillus thuringiensis for control of Crocidolomia binotalis Zell. BSc Thesis. Reduit, University of Mauritius.
RIETHMACHER, ROMBACH and KRANZ. 1992. Epizootics of Pandora blunkii and Zoophtora
radicans in diamondback moth population in the Phillipines. p. 193 - 202. In : Talekar NS ed. Proceedings Second International Workshop, Management of diamondback moth and other crucifer pests. Tainan, Taiwan : AVRDC. 1990
SIVAPRAGASAM A, TEES SP and RUWAIDA M. 1982. Effects of intercropping cabbage with
tomato on the incidence of Plutella xylostella. MAPPS Newsletter 6 (2) : 6 -7 . SRINIVASAN K and KRISHNAMOORTHY PN. 1991. Indian mustard as a trap crop for major
lepidopterous pests on cabbage. Tropical Pest Management 37 (1) : 26 - 32. SRINIVASAN K and KRISHNAMOORTHY PN. 1992. Development and adoption of integrated pest
management for major pests of cabbage using indian mustard as a trap crop. p. 511 - 521. In : Talekar NS ed. Proceedings Second International Workshop, Management of diamondback moth and other crucifer pests. Tainan, Taiwan : AVRDC. 1990.
TABASHNIK BE, CUSHING NL, FINSON, JOHNSON MW. 1990. Field development of resistance
to Bacillus thuringiensis in diamondback moth (Lepidoptera : Yponomeutidae). Journal of Economic Entomology 83 : 1671 - 1676.
TALEKAR NS, LEE ST and HUANG SW. 1986. Intercropping and modification of irrigation method
for the control of diamondback moth. p. 145 - 152. In : TALEKAR NS and GRIGGS TD eds. Proceedings First International Workshop, Diamondback moth management. Shanhua, Taiwan : AVRDC,. 1985.
WAKISAKA S, TSUKUDA R and NAKASUJI F. 1992. Effects of natural enemies, rainfall,
temperature and host plants on the survival and reproduction of diamondback moth. p. 15 - 26. In : Talekar NS ed. Proceedings Second International Workshop, Management of diamondback moth and other crucifer pests. Tainan, Taiwan : AVRDC. 1990
WATERHOUSE DF. 1992. Biological control of diamondback moth in the Pacific. p. 213 - 222.. In :
Talekar NS ed. Proceedings Second International Workshop, Management of diamondback moth and other crucifer pests. Tainan, Taiwan : AVRDC. 1990.
COMMENTS
Q. What is the recommended method of control of Plutella xylostella?
A. The Ministry recommends the use of chemicals depending on the severity of the attack. In case where parasitoids have been released, botanical pesticides can be used, but these have a short life period owing to their sensitivity to light.
Q. Can Plutella be controlled by overhead irrigation?
A. Plutella has been known to have low populations in cold regions, tolerant varieties plus irrigation should give control in these regions.
Q. What is the Brassica spp that is used as trap plant?
A. Indian mustard is used but there is a strong influence of variety.
AMAS 1997. Food and Agricultural Research Council, Réduit, Mauritius
109
AGRICULTURAL POLYMERS
D Jhurry
University of Mauritius
ABSTRACT The need for improving the physical properties of soils to increase productivity in the agricultural sector was felt already in the 1950s. This led to the development of water-soluble polymeric soil conditioners. The latter had quite a short life-span and were rapidly withdrawn from the market mainly for economic reasons. Other polymers such as polyacrylamide which proved to be more efficient at lower application rates revived interest in the field. In the early 1980’s, water-absorbing polymers or hydrogels were introduced for agricultural use. In this paper, both types of polymers and their benefits to soils are reviewed. INTRODUCTION Polymeric soil conditioners, were known since the 1950s (Hedrick and Mowry 1952). However, their wide commercial application failed even though the scientific basis for their use was quite well established. These polymers were developed to improve the physical properties of soil in view of:
- increasing their water-holding capacity - increasing water use efficiency - enhancing soil permeability and infiltration rates - reducing irrigation frequency - reducing compaction tendency - stopping erosion and water run-off - increasing plant performance (especially in structureless soils in areas subject to drought).
Among the products which initially appeared on the market, there was a copolymer consisting of vinyl acetate and maleic anhydride units (VAMA) known under the trade name Krilium. It was withdrawn from the market for the following reasons: - high cost exceeding the value of many crops - complexity of application and poor distribution in the soil. Most of the studies with polymers were performed in the laboratory or greenhouse without consideration for the economics at the production level in large-scale agriculture. When the polymer is mixed into the soil at rates of about 0.1% by mass, it translates into amounts of 1000 to 4000 kg ha-1. Such rates are obviously not economical for most uses. The need for more arable land in view of increasing agricultural production has renewed interest in the development of novel soil conditioner materials with new methods and lower rates of application.

Agricultural polymers D Jhurry
AMAS 1997. Food and Agricultural Research Council, Réduit, Mauritius
110
TYPES OF POLYMERS Two distinct types of polymers have been studied and marketed for agricultural use. They are either soluble or insoluble in water. Water-soluble Polymers They were the first ones to be developed, primarily to aggregate and stabilise soils, combat erosion and improve percolation. Examples include both homopolymers and copolymers such as poly(ethylene glycol), poly(vinyl alcohol), polyacrylates, polyacrylamide, poly(vinyl acetate-alt-maleic anhydride). These possess linear chain structures as shown below. A list of some other soil conditioners is given in an excellent review on the subject in Azzam (1980). Poly(ethylene glycol) Poly(vinyl alcohol) Polyacrylates Polyacrylamide Poly(vinyl acetate- alt-maleic anhydride)
OHn n
CONH2
n
COORO n
PolyCH
O O OOCH3CO
H2Cm n
All the polymers, except poly(ethylene glycol), are synthesised by free-radical polymerisation of the corresponding monomers. The latter are derived from the petroleum industry and are therefore easily accessible at low cost. One of the necessary characteristics of these polymers is a high molar mass. Polyacrylamide (PAM) is one of the most widely employed soil conditioner. More recently, polyelectrolytes such as acrylamide/acrylate copolymers have attracted much attention as they have been shown to be most effective in improving the physico-chemical properties of soils. Anionic character is imparted to polyacrylamide which is basically non ionic, either by copolymerisation with an unsaturated acid such as acrylic acid or by partial hydrolysis of amide groups. Polyacrylamide has also been used in combination with natural polysaccharides for soil-conditioning purposes. For example, Wallace et al. (1986a) showed that a mixture of a galactomannan, extracted from guar bean, and polyacrylamide resulted in an additive response when applied to certain soils. We have developed at the University of Mauritius, linear vinyl polymers containing sucrose in the side chain. The synthesis of high molar mass hydrosoluble poly(O-methacryloylsucrose) has thus been achieved (Jhurry et al. 1992). The use of the latter as soil conditioner is currently under investigation. Benefits of water-soluble polymeric soil conditioners The success of PAM in modifying the calcareous nonfertile land near Dijon in France is a well-known example of its application. Tropical soils in intense high rainfall regions suffer from decrease in aggregate stability and increase in bulk density. Consequently, water intake and storage are reduced while surface drainage increases. PAM has proved to be effective against soil erosion. Indeed, treatment of the soil of Lambang (Indonesia) with PAM has made it possible to reduce soil losses under rainfall from 17 000 to 4000 kg ha-1. The permeable layer of soil produced by the conditioner stabilises the soil, thus preventing runoff (for example, when 300 kg ha-1 PAM was applied to soil, the water runoff decreased by 177%). Another important point is that the penetrability of water in a PAM treated soil increases by a factor of 2.5 while its mean diffusivity increases four fold. The effect of the polymeric soil conditioners on plant growth and crop yield has also been extensively

Agricultural polymers D Jhurry
AMAS 1997. Food and Agricultural Research Council, Réduit, Mauritius
111
studied. The rates of germination and emergence of a number of plants such as tomato, lettuce or maize increased markedly in the presence of the conditioner (Wallace and Wallace 1986a). Other studies (Batyuk et al. 1973) have shown that the yield of (sugar beets) is increased while the requirements for irrigation decreased by the use of the conditioners. A number of reasons have been put forward to explain these observations: better soil aeration, thereby enhancing microbial activity ; delaying dissolution of fertilisers ; increasing sorption capacity or favouring the uptake of some nutrient elements by the plants. Wallace and Wallace (1986b) showed that very low concentrations of a mixture of PAM and a polysaccharide (below 0.001% or 22 kg ha-1) have a favourable effect on the physical properties of soils, particularly regarding percolation and infiltration rates as well as the sizes of soil particles. Poly(vinyl acetate-maleic anhydride) formerly used, was also tested for comparison. It is interesting to note that improvements were recorded with VAMA only when the concentrations of polymer exceeded 0.01%, that is an order of magnitude higher. The possible application of very low rates of soil conditioners makes their use economically feasible. Some researchers (Wallace and Wallace 1986b) have developed soil tests for predicting the effective quantities of soil conditioners required to achieve desirable physical properties of soils. These tests relate to application of polymers in irrigation water and are as follows (1) determining rates of polymers to achieve flocculation of the soil in test tubes, (2) filtering and air-drying the aggregates to evaluate water stability, (3) testing a range of concentrations of polymers to determine the rate that preserves existing soil aggregates (4) treating small samples of soils with polymers for water penetration tests, (5) wet-sieving control soils and soils treated with polymers while in suspension. More industrial applications are being developed for the polymeric soil conditioners. For instance, wastes such as fly ash can be stabilised. Farm roads may also be sprayed with solutions of polymers to control dust. Gel-forming polymers This second class of polymers referred to as gel-forming polymers or insoluble water-absorbing polymers were first introduced for agricultural use in the early 1980’s. These polymers do not possess linear chain structures as described previously but the chains are rather cross-linked to form a three-dimensional network. Cross-linking occurs when polymerisation is carried out in the presence of a small amount of a divinyl compound. Depending on synthetic conditions, type and density of covalent bonds that form cross-links, these polymers can absorb up to 1000 times their weight in pure water and form gels. Three main types of hydrogels (water absorbing) have so far been developed as agricultural polymers: (1) starch-graft copolymers obtained by graft polymerisation of polyacrylonitrile onto starch followed by saponification of the acrylonitrile units (2) cross-linked polyacrylates (3) cross-linked polyacrylamides and cross-linked acrylamide-acrylate copolymers containing a major percentage of acrylamide units. Most of the hydrogels marketed for agriculture come from the latter group as they are claimed to remain active for a much longer time. Benefits of hydrogels Researchers (Flannery and Busscher 1982; Johnson 1984a) have reported that the use of hydrogels increases the amount of available moisture in the root zone, thus implying longer intervals between irrigations. It must be pointed out that the polymers do not reduce the amount of water used by plants. The water-holding capacity depends on the texture of the soil, the type of hydrogel and particle size (powder or granules), the salinity of the soil solution and the presence of ions. Cross-linked polyacrylamides hold up to 400 times their weight in water and release 95% of the water retained within the granule to growing plants. In general, a high degree of cross-linkage results in the material having a relatively low water-retention capacity. However, the water-holding capacity drops significantly at sites where the source of irrigation water contains high levels of dissolved salts (e.g effluent water) or in the presence of fertilizer salts (Wang and Gregg 1989). The amount of water retained is also adversely affected by chemicals or ions (Mg2+, Ca2+, Fe2+) present in the water (Johnson

Agricultural polymers D Jhurry
AMAS 1997. Food and Agricultural Research Council, Réduit, Mauritius
112
1984b). James and Richards (1986) suggested that these divalent cations develop strong interactions with the polymer gels and are able to displace water molecules trapped within the polymer. Even though monovalent cations (Na+) can also replace water molecules, the effect is not as pronounced as with the divalent counterparts as the process is fully reversible by repeated soaking with deionised water. Moreover, the use of hydrogels leads to increased water use efficiency since water that would have otherwise leached beyond the root zone is captured. During hot days, the hair root system of a plant pulls out and depletes most of the water from the area close to the root system, thus causing the plant to go into stress. While increasing the amount of available moisture, hydrogels help reduce water stress of plants resulting in increased growth and plant performance (El-Hady et al. 1981; Pill and Jacono 1984; Baker 1991). The performance of the gel on plant growth depends on the method of application as well. It was shown that spraying the hydrogels as dry granules or mixing them with the entire root zone is not effective (Flannery and Busscher 1982). Better results seem to be obtained when the hydrogels are layered, preferably a few inches below soil surface. However, generalisations should be avoided when interpreting results as a number of factors such as type of hydrogel, particle size, rate of application and type of plant has to be taken into consideration. Hydrogels are also claimed to reduce fertilizer (NPK) leaching. This seems to occur through interaction of the fertilizer with the polymer. The loading of NPK fertilisers directly into cross-linked polyacrylamide gels is now receiving more and more attention at research level. Cross-linked polyacrylamide is also being considered as a potential carrier for insecticides, fungicides and herbicides. CONCLUSION The beneficial effects of both water-soluble soil conditioners and hydrogels on soil physical properties is a well-established fact. Numerous publications describe the increase in yield of various plants as a result of better soil conditions. A lot of research effort has also been geared towards lowering the rate of application of polymer. However, in most cases these studies have not been extended to large scale agriculture and application rates for most economical yields are not as yet defined. This implies still more research work on a crop by crop basis for only area. REFERENCES AZZAM RAI. 1980. Agricultural polymers. Polyacrylamide preparation, application and prospects in
soil conditioning. Communications in Soil Science and Plant Analysis 11 (8) : 767 - 834. BAKER SW. 1991. The effect of polyacrylamide copolymer on the performance of Lolium perenne L.
turf grown a sand rootzone. Journal of Sports Turf Research Institute 67 : 66 - 82. BATYUK VP, MALAKHOVA Zh V and FENENKO LM. 1973. Use of polymers to maintain soil
fertility I, p. 75 - 84. In : OROSHAEMYKH P, EGOROV V and KRUSKII NK.. eds. Probl. Genezisa Melior. Moscow : Pochv. Inst.
EL HADY OA, TAYEL MY and LOFTY AA. 1981. Super gel as a soil conditioner. II. Its effects on
plant growth, enzyme activity, water use efficiency and nutrient uptake. Acta Horticulturae 19 : 257 - 265.
FLANNERY RL and BUSSCHER WJ. 1982. Use of a synthetic polymer in potting soils to improve
water holding capacity. Communications in Soil Science and Plant Analysis 13 (2) : 103 -
Agricultural polymers D Jhurry
AMAS 1997. Food and Agricultural Research Council, Réduit, Mauritius
113
111. HEDRICK RM and MOWRY DT. 1952. Effect of synthetic polyelectrolytes on aggregation, aeration
and water relationships of soil. Soil Science 73 : 427 - 441. JAMES EA and RICHARDS D. 1986. The influence of iron source on the water holding properties of
potting media amended with water-absorbing polymers. Scientia Horticulturae 28 : 201 - 208.
JHURRY D, DEFIEUX A and FONTANILLE M. 1992. Sucrose-based polymers. I. Linear polymers
with sucrose side-chains. Makromol. Chem. 193 : 2997 - 3007. JOHNSON MS. 1984a. The effects of gel-forming polyacrylamides on moisture storage in sandy soils.
J. Sci. Food Agric. 35 : 1063 - 1066. JOHNSON MS. 1984b. Effects of soluble salts on water absorption by gel-forming soil conditioners. J.
Sci. Food Agric. 35 : 1196 - 1200. PILL WG and JACONO CC. 1984. Effects of hydrogel incorporation in peat-lite on tomato growth
and water relations. Communications in Soil Science and Plant Analysis 15 : 799 - 810. WALLACE A and WALLACE GA. 1986a. Effects of soil conditioners on emergence and growth of
tomato, cotton and lettuce seedlings. Soil Science 141 (5) : 313 - 316. WALLACE A and WALLACE GA. 1986b. Effects of very low rates of synthetic soil conditioners on
soils. Soil Science 141 (5) : 324 - 327. WANG YT and GREGG LL. 1989. Hydrophilic polymers- their response to soil amendments and
effect on properties of a soilless potting mix. J. Amer. Soc. Hort. Sci. 115 (6) : 943 - 948. COMMENTS Q. What is the stability of polymers used for water conservation? A. They have a life time of about seven years. Q. How much should be applied and to what depth? A. Recommendations have to be made on a crop to crop basis. Q. Will polymers derived from sugar molecules have a short life time? A. The degradability will depend on linkages type.

114

AMAS 1997. Food and Agricultural Research Council, Réduit, Mauritius
115
PHOSPHOROUS FIXATION AS INFLUENCED BY SOIL CHARACTERISTICS OF SOME MAURITIAN SOILS
B Lalljee
University of Mauritius
ABSTRACT Phosphorus fixing capacity of some soils from Mauritius was determined. Simple regression studies showed that amorphous Mn, amorphous Fe, organic matter, pH and clay content were dominant factors affecting P fixing capacity. Cation exchange capacity, exchangeable Na, K, Ca, B, Fe, Mn did not show any significant correlation. Liming, use of rock phosphate and calcium ammonium nitrate are recommended for acid soils of Mauritius to control P fixation. INTRODUCTION Without phosphorus in the environment, no living organism could exist. Phosphorus is present in all plant and animal tissues. It is now well understood that P-nutrition of crop plants is more of a soil problem and a higher dose of P is necessary for soils having high P -fixing capacities. In view of the economic desirability of having single fertiliser applications, the P-fixation capacity of our soils are of considerable importance in determining the requirement for applied P and may be indicative of possible adverse environmental effects. The P fixation in soils depends upon many factors, namely the pH of the soil, organic matter content, type of clay and sesquioxides. Owusu - Bennoah and Acquaye (1989) studied the phosphate sorption characteristics of some Ghanaian soils and found that the phosphate sorption maxima were highly correlated with the soil properties in the order : Al2O3, clay content, free Fe2O3 and organic carbon. Morel et al. (1989) evaluated the phosphate fixing capacity of soils by the isotopic exchange techniques in north-east France and reported that there was a significant correlation between amount of phosphorus fixed, pH, exchangeable cations, clay content and soluble phosphate. Soon (1991) studied the solubility and retention of phosphates in soils of north western Canada prairies and found that correlations showed between P sorption capacity and clay content, Al-organic matter complexes and amorphous iron oxides were significant. Soils around Beemanique near Rose-Belle, were found to have a maximum P-fixation of 95.7% (MAFNR 1987). MATERIALS AND METHODS Twenty four representative top soil samples (0-20cm) under different types of cultivation (Table I) were collected around the island. The samples were air dried and analysed as follows: pH was determined on a 1 : 2.5 soil : water suspension using a pH meter. The international pipette method was used for particle size determination. Organic matter was determined by the Walkley and Black method as outlined by Jackson (1973). Exchangeable cations were extracted and estimated by flame emission and atomic absorption spectrophotometry as described by Cottenie (1980). Hot water soluble boron was estimated by the method of Sillanpa (1990). Amorphous Fe (Oxalate extractable ) and Mn were extracted by 0.2 M ammonium oxalate (pH 3) at a soil:extracting solution ratio of 1:50 (0.2 g soil extracted by 10 ml of extractant).

Phosphorus fixation as influenced by soil characteristics of some Mauritian soils B Lalljee
AMAS 1997. Food and Agricultural Research Council, Réduit, Mauritius 116
Table 1 Soil type and location
Soil location Region Soil Types
Mauritius USDA Sugar cane fields
Balaclava Balaclava Bon Accueil Cluny Medine Tamarin TerreRouge
LHL Regosols
LBF HFL LRP DMC LHL
Tropeptic Haplustox Tipic Ustipsamment Gibbsioxic Humitropept Dystropetic Gibbsiaquox Ustic Eurropept Tropetic Torret Tropeptic Haplustox
Tea fields
Bois Cheri La Pipe Midlands Wootun
HFL HFL HFL LBF
Dystropetic Gibbsiaquox Dystropetic Gibbsiaquox Dystropetic Gibbsiaquox Gibbsioxic Humitropept
Experimental Station
Abercrombie Barkly Curepipe Plaisance Richelieu
LHL LRP LBF LRP LHL
Tropeptic Halustox Ustic Eutropept Gibbsioxic Humitropept Ustic Eutropept Tropeptic Haplustox
Grass cultivation Grand Gorges Baie du Cap
Lithosols Regosols
Lithic Ustropept Tipic Ustipsamment
Vegetable production University Farm LHL Tropeptic Haplustox Bare land Riviere Champagne HL Oxic Humitropept
DMC : Dark Magnesium Clay LBF : Latosolic Brown Forest HFL : Humic Ferruginous Latosol LHL : Low Humic Latosol HL : Humic Latosol LRP : Latosolic Reddish Prarie Available P was determined by the modified Truog method, using 0.1 M H2SO4; the soil : extracting solution ratio was 1:50; and the shaking time 1 hr; estimation was done using the molybdenum blue colour method. The phosphorus fixing capacity was evaluated by adding 25 ml aliquots of sodium dihydrogen phosphate (NaH2PO4) containing 100 micrograms P to 1 g of soil. The mixture was incubated for 1 week at room temperature and then centrifuged. The supernatant solution was carefully decanted and residues washed with distilled water and recentrifuged. The process was continued until the clear supernatant liquid showed no trace of phosphorus. The soil was then extracted as above with 0.1 M H2SO4. Amount of P fixed was obtained by subtracting the original P concentration from the value of P obtained after fixation (incubation). RESULTS AND DISCUSSION The physicochemical properties and phosphorus fixing capacity of the soils are given in Table 2. The P fixing capacity varied from 143 ppm to 549 ppm, with a mean of 339 ppm. The pH values were in the range of 3.8 to 8.1 with a mean of 6.3. Values of organic matter were in the range 2.5% to 6.5% with a mean of 4.3% Clay content varied from 15% to 38%, with a mean of 23.5%. Amorphous Fe was found to be in the range of 0.50% to 1.50%, with a mean of 0.72%, while amorphous Mn was in the range of 100 ppm to 1121 ppm, with a mean of 602 ppm.

Phosphorus fixation as influenced by soil characteristics of some Mauritian soils B Lalljee
AMAS 1997. Food and Agricultural Research Council, Réduit, Mauritius 117
Table 2 Physicochemical properties and Phosphorus fixing capacity of the soils
Location P Fixed
ppm pH
Clay %
Amorphous Fe %
Amorphous Mn ppm
Abercrombie 433 5.0 38 1.30 1050 Alma 383 6.2 20 0.75 625 Baie du Cap 433 5.3 32 0.92 950 Balaclava 283 8.1 20 0.64 370 Barkly 366 6.7 21 0.85 650 Belle Mare 350 6.5 23 0.78 670 Bois Cheri 258 6.7 25 0.50 350 Bon Accueil 143 7.5 18 0.51 100 Chamarel 416 5.6 34 0.87 870 Cluny 325 6.0 25 0.69 642 Curepipe 500 4.1 25 1.50 1121 G. Gorges 241 7.4 18 0.59 328 La Pipe 275 6.2 15 0.62 250 M.Aux Vacoas 257 6.3 20 0.64 350 M. Longue 350 6.1 15 0.83 510 Medine 175 7.1 18 0.54 350 Midlands 466 6.4 35 0.79 925 Plaisance 400 5.7 30 0.84 940 R.Champagne 258 7.3 15 0.39 390 Richelieu 241 7.0 20 0.45 420 Tamarin 274 7.2 18 0.52 410 Terre Rouge 391 7.0 24 0.75 544 U. Farm 366 6.5 25 0.77 525 Wooton 549 3.8 30 1.20 1115 Mean 339 6.3 23.5 0.76 603 SD ± 101 1.0 6.6 0.27 294
Figure. 1 shows a significant relationship (r = 0.78) between pH and P-fixation. The lower the pH, the more available are the metallic ions, especially Mn, Fe and Al. These elements then combine with soluble P and form insoluble compounds. Similar results have been reported by Kanwar and Grewal (1990). Naidu et al. (1990) explained the increase in P- fixation with decrease in pH through interactions between added P, negative charge and the electrostatic potential in the plain of sorption. The correlation coefficient between organic matter and P-fixation was also quite high (r = 0.83) (Figure 5).This may be due to the formation of phosphohumic compounds (Dolui and Gangopadhyay 1984). However other workers ( Awad and Al-Obaidy 1989) have found that addition of organic matter to soils increases the availability of the element (Dhargawe et al. 1991). The results show that P-fixation is quite a complex phenomenon depending upon many interacting factors The relationship between P-fixation and clay content is shown in Figure 3. Our soils are mostly old soils (Oxisols and Ultisols). Most of them are rich in iron oxides and gibbsites. In oxide or oxide-coated layer silicate systems, P-fixation increases with increase in clay content. Woodruff and Kamprath (1965) found that sandy Ultisols retain much less phosphorus than clayey Ultisols of similar mineralogy

Phosphorus fixation as influenced by soil characteristics of some Mauritian soils B Lalljee
AMAS 1997. Food and Agricultural Research Council, Réduit, Mauritius 118
3.5 4.0 4.5 5.0 5.5 6.0 6.5 7.0 7.5 8.0 8.5
pH
100
200
300
400
500
600P
hosp
horu
s F
ixat
ion
ppm
Figure 1 Phosphorus Fixation versus pH
Phosphorus Fixation ppm = -- 75 pH + 815 R = 0.78
.
2 3 4 5 6 7 8
Organic Matter %
100
200
300
400
500
600
Pho
spho
rus
Fix
atio
n pp
m
Figure 2 Phosphorus Fixation versus Organic Matter %
Phosphorus Fixation ppm = 112 Organic % + 54 R = 0.83
There was a significant correlation between amorphous Mn and P-fixation (r = 0.88), and between amorphous Fe and P-fixation (r = 0.86) (Figures 4 and 5). From Table 2 it can be seen that the levels of these two elements are quite high in our soils. The high correlation between them and phosphate fixation are due to the formation of insoluble Mn and Fe phosphates, especially in acidic soils. In similar studies, Thomazi et al. (1990) found that iron oxides and clay were the main factors contributing to P-fixation in some Brazilian soils. The other properties of the soils studied, namely exchangeable Na, K, Mg, Zn, Cu, B, Fe and Mn did not show any significant correlation with P-fixation.

Phosphorus fixation as influenced by soil characteristics of some Mauritian soils B Lalljee
AMAS 1997. Food and Agricultural Research Council, Réduit, Mauritius 119
10 15 20 25 30 35 40
Clay %
100
200
300
400
500
600P
hosp
horu
s F
ixat
ion
ppm
Figure 3 Phosphorus Fixation versus Clay %
Phosphorus Fixation ppm = 116 Clay % + 9.52 R = 0.64
Figure 4 Phosphorous Fixation versus Amorphous Fe
0.0 0.2 0.4 0.6 0.8 1.0 1.2 1.4 1.6
Amorphous Fe %
100
200
300
400
500
600
Pho
spho
rus
Fix
atio
n pp
m Phosphorus Fixation ppm = 118 Amorphous Fe % + 297 R = 0.86
0 200 400 600 800 1000 1200
Amorphous Mn ppm
100
200
300
400
500
600
Pho
spho
rus
Fix
atio
n p
pm
Figure 5 Phosphorous Fixation versus Amorphous Manganese
Phosphorus Fixation ppm = 169 Amorphous Mn ppm + 0.3 R = 0.88

Phosphorus fixation as influenced by soil characteristics of some Mauritian soils B Lalljee
AMAS 1997. Food and Agricultural Research Council, Réduit, Mauritius 120
CONCLUSION The results suggest that P-fixation depends upon many factors and is a quite complex phenomenon. In this study P-fixation was found to be significantly correlated with amorphous Mn, amorphous Fe, organic matter, pH and clay content. Considering the economic and environmental impact of phosphorus fertilisation, it would be desirable to control the process of P-fixation. Using lime or coral sand on acidic soils raises the pH and reduces Fe, Mn and Al responsible for P-fixation. Since ammonium sulphate has a soil-acidifying effect, CAN should be applied wherever possible. Rock phosphate is preferable to TSP in acid soils in order to minimise P-fixation. REFERENCES AWAD KM and AL-OBAIDY KS. 1989. Effect of organic residues on phosphate adsorption by some
calcareous soils. Mesopotamia Journal of Agriculture 21 (4) : 53 - 67. COTTENIE A. 1980. Soil and plant testing as a basis of fertilizer recommendation. FAO Soils
Bulletin No. 38. Rome, Italy : FAO. DHARGAWE GN, MATTUR DB, BABULKA PS, KENE DR and BORKAR DK. 1991. Availability
of soil phosphorus as affected by organic matter. Journal of Soils and Crops 1 (2) : 142 - 146. DOLUI AK and GANGOPADHYAY SK. 1984. Fixation of phosphate in relation to properties of
some red and lateritic soils of West Bengal. Indian Journal of Agricultural Chemistry XVII (2) : 177 - 182.
JACKSON ML. 1973. Soil chemical analysis. India : Prentice - Hall. KANWAR JS and GREWAL J. 1990. Phosphorus fixation in Indian soils. 2nd edition. New Delhi,
India : Indian Council of Agricultural Research. MAFNR see under Ministry of Agriculture, Fisheries and Natural Resources MINISTRY OF AGRICULTURE, FISHERIES and NATURAL RESOURCES:1987. Annual Report
of the Agricultural Services for the year 1984. MOREL JL, FARDEAU JC, BERUFF MA and GUCKERT A. 1989. Phosphate fixing capacity of
soils : a survey using the isotopic exchange technique of soils from north-eastern France. Fertiliser Research 19 (2) : 103 - 111.
NAIDU R, SYERS JK, TILLMAN RW, and KIRKMAN JH. 1990. Effect of liming on phosphate
soption by acid soils. Journal of soil science 41 (1) : 163 - 175. OWUSU-BENNOAH E and ACQUAYE DK. 1989. Phosphate sorption characteristics of selected
major Ghanaian soils. Soil Science 148 (2) : 114 - 123. SILLANPA M. 1990. Micronutrient assessment at the country level : an international study. FAO
Soils Bulletin No. 63. Rome, Italy : FAO. SOON YK. 1990. Solubility and retention of phosphate in soils of north western Canada prairie.
Canadian Journal of Soil Science 70 ( 2 ) : 227 - 237. THOMAZI MD, MELLO FAF, ARZOLLA S and MELLO FA. 1990. Phosphate fixation in soils of
the Piracicaba Municipality. Revista de Agricultura 65 : (1) : 45 - 53.

Phosphorus fixation as influenced by soil characteristics of some Mauritian soils B Lalljee
AMAS 1997. Food and Agricultural Research Council, Réduit, Mauritius 121
WOODRUFF JR and KAMPRATH EJ. 1965. Phosphorus adsorption maximum as measured by Langmuir Isotherm and its relationship to phosphorus availability. Soil Science Society of America Proceedings 29,.p.148 - 280.
COMMENTS Q. Why is Calcium Ammonium Nitrate (CAN) used in acid soils as compared to ammonium
sulphate? A. The lowering of pH with the application of ammonium sulphate is due to ammonium ions.
The presence of calcium ion in CAN helps to prevent acidification.

122

AMAS 1997. Food and Agricultural Research Council, Réduit, Mauritius
123
PASTURE PRODUCTION PROFILE OF THREE GRASS SPECIES: IMPLICATIONS FOR SUPPLEMENTARY FEEDING OF THE MAURITIAN DEER (Cervus timorensis russa)
H Bheekhee, R K Ramnauth, P Dobee and A A Boodoo
Agricultural Research and Extension Unit ABSTRACT Pasture growth profiles of three species of grass were established in 4 different regions where deer are ranched or farmed, namely at Medine Sugar Estate, Bel Air Sugar Estate, Constance Sugar Estate and Curepipe Experimental Station during a 52-week period (September 1994 to September 1995). Two marked seasons were observed. The period January to May constituted the rainy season while June to December constituted the dry season for Constance Sugar Estate and Curepipe E.S. For Bel Air Sugar Estate and Medine Sugar Estate, the rainy season was erratic and it lasted from February to September. A positive relationship between productivity and rainfall was noted. In all the regions, the pasture species followed the same seasonal pattern of growth but at different levels of production. The effect of nitrogen fertiliser was very pronounced soon after application in September and February. The stocking rate in the 4 regions has been calculated and any increase will depend on the supply of supplements during periods of pasture deficits. INTRODUCTION In their natural habitat Rusa deer are migratory animals depending entirely on green tender forage and wild fruits to meet their nutritional requirements. Production from the animal depends largely on the amount, quality and seasonal pattern of plant growth and on conversion efficiency. The industry in Mauritius is geared towards the production of high quality venison. Optimum production from deer will be achieved on high quality improved pastures with supplementary feeding during periods of pasture shortage. Land being a limited resource, deer farming will need to improve existing pasture lands by fertiliser applications and irrigation in order to maximise production. Intensification of deer farming justifies research and implementation of grazing strategies to limit expensive feed supplementation. In such systems of production the margin between cost of supplementation and gain in production is an important parameter to consider. No published data are available regarding pasture production in Mauritius. Domingue and Rajkomar (1992) suggested that research be carried out to establish a growth profile of standing pasture on deer farms over successive years taking into account conditions of soil fertility, rainfall and stocking rate. The present study was therefore undertaken to establish the production profiles of 3 species of grass over a 52-week period in 4 different regions where deer are farmed or ranched.

Pasture production profile of three grass species ….. H Bheekee et al.
AMAS 1997. Food and Agricutural Research Council, Réduit, Mauritius
124
MATERIALS AND METHODS Location Four pasture sites in three climatic zones of the island were identified (Table 1). The sites were selected from commonly exploited deer ranches or farms where the fodder species under study occupy more than 80% of the site area.
Table 1 Experimental sites
Zone Rainfall mm Location Fodder species
Dry < 750 Magenta, Médine S.E
Cynodon plectostachyus ( K. Schum.) Pilger ( star grass )
Humid 750 - 3 000
Providence, Constance S.E
Senneville, Bel Air S.E
Cynodon plectostachyus ( K. Schum.) Pilger ( star grass )
Stenotaphrum dimidiatum ( Walt. ) Kuntze (herbe bourrique)
Super humid > 3 000 La Brasserie, Curepipe E.S
Ischaemum aristatum ( Houtt.) Merrill ( herbe d’argent )
Experimental plots On each site two large plots (36m2), representative of the pasture grown were identified. The selected plots were fenced to avoid grazing or trampling by animals; each plot was subsequently divided into four sub-plots 3m × 3m each. The sub-plots were then labelled randomly for harvesting sequence. Plot 1 was untreated. Plot 2 received 2 split applications of calcium ammonium nitrate fertiliser
(120 kg ha-1 per application). The first application was made in September and the other in February. Pasture on the sub-plots was harvested manually to ground level using a pair of garden shears or a sickle; as far as possible harvesting was done by the same person on each sub-plot, starting in the first week of September 1994. The sub-plots of a group of 4 were harvested at 1 week interval; thereafter every subplot was harvested every 4 weeks over a period of 52 weeks. Collection of data Bulk weight of fresh pasture harvested from each sub-plot was recorded on site. Fresh samples of about 200g were sent to the Agricultural Chemistry laboratory for analysis. Meteorological data (rainfall, temperature and sunshine hours) were collected from the Meteorological Services (Vacoas) for time series analysis. RESULTS The average composition of the pasture samples is shown in Table 2. The mean DM yields for successive 4-week cycles over a period of 52 weeks are presented in Table 3 together with the 4-week seasonal productivity. For Cynodon plectostachyus (Constance S.E) and Ischaemum aristatum (Curepipe E.S) higher yields were recorded during the period January-May and lower yields during June-December. For Stenotaphrum dimidiatum (Bel Air S.E) high yields were obtained during March-September and low yields during October-February. However, for Cynodon plectostachyus at Médine Sugar Estate high yields were obtained in February and in March; then gradually declined till the beginning of May when the experiment had to be stopped due to the invasion of the plots by weeds (mainly Dichantium aristatum).

Pasture production profile of three grass species ….. H Bheekee et al.
AMAS 1997. Food and Agricutural Research Council, Réduit, Mauritius
125
Table 2 Average percentage of pasture samples and their standard deviations
Grass species Dry Matter Crude Protein Crude Fibre Ash
Cynodon plectostachyus ( Constance S.E )
31.0 ± 8.3 12.3 ± 2.9 30.2 ± 3.2 11.6 ± 1.8
Cynodon plectostachyus ( Médine S.E )
40.5 ± 11.2 9.1 ± 2.8 30.6 ± 2.2 10.1 ± 2.0
Ischaemum aristatum ( Curepipe E.S )
31.1 ± 8.7 9.7 ± 3.4 30.3 ± 2.7 15.0 ± 2.0
Stenotaphrum dimidiatum ( Bel Air S.E )
30.5 ± 11.2 10.2 ± 2.5 28.3 ± 1.8 13.5 ± 1.8
Table 3 Mean DM yields and standard deviations for 4-week cycles on unfertilised plots
52 week period Seasonal yields Dry Matter kg ha-1 Jan-May June-Dec
Cynodon plectostachyus (Constance S.E)
775 ± 428 1 097 ± 425 548 ± 297
Cynodon plectostachyus* ( Médine S.E )
617 ± 284
Ischaemum aristatum ( Curepipe E.S )
237 ± 108 307 ± 92 188 ± 80
Mar-Sept. Oct - Feb Stenotaphrum dimidiatum
( Bel Air S.E ) 379 ± 160 466 ± 147 256 ± 76
* Mean value calculated over a period of 36 weeks only Figure 1 shows the pattern of pasture production for the 3 different grass species.
Oct Nov Dec Jan Feb Mar Apr May Jun Jul Aug Sep Oct0
200
400
600
800
1000
1200
1400
Yie
ld /
4 w
eek
cycl
e k
gha-
1
S. dimidiatum ( Bel Air S.E )C. plectostachyus ( Constance S.E )
I. aristatum ( Curepipe E.S )C. plectostachyus ( Medine S.E )
Figure 1 Dry matter yield per 4 week cycle on unfertilised plots 1994 - 1995
Figure 2 shows DM content over the twelve month period. All 3 species showed a lower DM content from February to June as compared to the other months of the year.

Pasture production profile of three grass species ….. H Bheekee et al.
AMAS 1997. Food and Agricutural Research Council, Réduit, Mauritius
126
Oct Nov Dec Jan Feb Mar Apr May Jun Jul Aug Sep Oct0
10
20
30
40
50
60C
onte
nt
%
S. dimidiatum ( Bel Air S.E )C. plectostachyus ( Constance S.E )
I. aristatum ( Curepipe E.S )C. plectostachyus ( Medine S.E )
Figure 2 % Dry matter content on unfertilised plots 1994 - 1995
Figures 3.1 to 3.4 show DM yield and total rainfall for the 4 weeks preceding harvest. Table 4 shows the effect of fertiliser application (Calcium ammonium nitrate at 240 kg ha-1) on DM yield for the 3 grass species. All three fodder species show a positive response to the application of a nitrogen fertiliser. The highest response was obtained for Cynodon plectostachyus at Médine S.E.
Table 4 Mean DM yields and standard deviations per 4-week cycle for unfertilised and fertilised plots
Grass species Unfertilised Fertilised
DM kg ha-1 % DM kg ha-1 %
Cynodon plectostachyus (Constance S.E)
775 ± 428 100 843 ± 622 109
Cynodon plectostachyus* (Médine S.E)
617 ± 284 100 1,081 ± 771 175
Ischaemum aristatum (Curepipe E.S)
237 ± 108 100 313 ± 177 132
Stenotaphrum dimidiatum (Bel Air S.E)
379 ± 160 100 436 ± 219 115
* Mean values calculated over a period of 36 weeks only DISCUSSION Tropical grasses are predominantly summer-active. However, they may grow during winter if there is sufficient rainfall. Even a small amount of moisture will induce the pasture species to respond positively and rapidly. The productivity of the three grass species studied in the 4 different regions is somewhat irregular. The dry matter yields vary according to the time of harvest. There is, however, a general tendency for the pasture to follow a seasonal pattern of growth with increased productivity during the wet summer months and a relatively lower yield during the dry winter.

Pasture production profile of three grass species ….. H Bheekee et al.
AMAS 1997. Food and Agricutural Research Council, Réduit, Mauritius
127
Figure 3 Rainfall and dry matter yield per 4 week cycle on unfertilised plots 1994 - 1995
Oct Nov Dec Jan Feb Mar Apr May Jun Jul Aug Sep Oct0
500
1000
1500
2000
2500
3000
3500
Rai
nfal
l m
m
0
200
400
600
800
1000
1200
1400
kg ha-1
Oct Nov Dec Jan Feb Mar Apr May Jun Jul Aug Sep Oct0
500
1000
1500
2000
2500
3000
3500
Rai
nfal
l m
m
0
200
400
600
800
1000
1200
1400
kg ha-1
Oct Nov Dec Jan Feb Mar Apr May Jun Jul Aug Sep Oct0
500
1000
1500
2000
2500
3000
3500
Rai
nfal
l m
m
0
200
400
600
800
1000
1200
1400
kg ha-1
Rainfall Dry matter yield
Oct Nov Dec Jan Feb Mar Apr May Jun Jul Aug Sep Oct0
500
1000
1500
2000
2500
3000
3500R
ainf
all
mm
0
200
400
600
800
1000
1200
1400kg ha -1
Figure 3.1 Bel Air SE
Figure 3.2 Constance SE
Figure 3.3 Curepipe ES
Figure 3.4 Médine SE

Pasture production profile of three grass species ….. H Bheekee et al.
AMAS 1997. Food and Agricutural Research Council, Réduit, Mauritius
128
Calculating stocking density Rusa deer can be adapted into a system of “Stock Unit” management as in New Zealand or “Deer Unit” management as in New Caledonia (Chardonnet 1988) whereby a male between 4 and 16 months of age, equivalent to 1.2 units is assumed to consume 653 kg DM. A hind, equivalent to 0.8 unit is assumed to consume 434 kg DM. Taking the case of Constance S.E for hinds as an example, an estimate of the stocking density can then be made either for a whole year or for a particular period as follows : Pasture species: Cynodon plectostachyus Period of active fodder production: January to May (151 days)
Annual dry matter yield: 10 104 kg ha-1
Dry matter intake: 1.2 kg head-1 day-1
Studies on pasture management carried out in U.S.A have shown that only 40 to 60% of the available pasture is utilised by cattle (Boudet 1984). Therefore, number of days at pasture per Stock Unit can be estimated as: (10 104 / 1.2) × 50 % = 4210 animal days. This is equivalent to a stocking density of 12 heads per hectare per year ( 4210 / 365 = 12) Stocking density per hectare per period of pasture abundance Jan-May
= 151 (1097 x 0.5) / (28 x 1.2) = 16
Stocking density per hectare per period of pasture shortage from June-Dec.
= 214 (548 x 0.5) / (28 x 1.2) = 8
In other words the pasture production at Constance S.E could support a hind population of 12 head all year round, or 16 heads during the period of active pasture growth (January to May), or 8 head during the period of slow growth (June to December). It follows that a stocking density higher than 12 will require supplementation. Stocking densities for the three other localities have been calculated in the same way and are shown below (Table 5).
Table 5 Stocking density for the 4 different localities
Locality Stocking density head ha-1 Whole year Period of pasture
abundance Period of
pasture deficit Constance S.E 12 16 8 Bel Air S.E 6 7 4 Curepipe E.S 4 5 3 Médine S.E 9
CONCLUSION Two marked seasons were observed with a high pasture production during the wet summer months and a low production for the rest of the year. The nutritive value of the pasture species in terms of crude protein and crude fibre varied throughout the year and no pattern could be established. It has been theoretically calculated that without fertiliser application, the farms under study could support a deer population per hectare of 12 hinds at Constance S.E, 9 at Medine S.E, 6 at Bel Air S.E and 4 at Curepipe E.S all year round. The stocking rate could be safely doubled if provision is made for the supply of supplements only during the period of pasture deficit. A still higher stocking density would mean a much higher demand for feed supplementation. Use of nitrogen fertiliser had a positive effect on dry matter yield and was more pronounced just after the time of application. It therefore appears

Pasture production profile of three grass species ….. H Bheekee et al.
AMAS 1997. Food and Agricutural Research Council, Réduit, Mauritius
129
that frequent applications of nitrogen fertilisers are justified at times when increased yields are needed. Further investigations need to be carried out as regards the type of fertiliser to be used in the respective regions, the proper timing and the application rate. ACKNOWLEDGEMENTS We would like to thank the following persons for providing the necessary facilities to undertake and complete the study:
Busgeeth D, Officer in Charge of Curepipe E.S., Fayolle JG, Farm Manager, Bel Air S.E., Koenig M, Farm Manager, Medine S.E., Nicolin JR, Farm Manager, Constance S.E., Ramnauth RK (Biometry), AREU for advice regarding data analysis, Sauzier J (Mrs), Manager, Mauritius Deer Farming Co-operative Society Limited, the Principal Research and Development Officer, Agricultural Chemistry Division (Ministry of Agriculture and Natural.Resources) for analysis of fodder samples, the Director, Meteorological Services (Vacoas) for providing climatic data.
REFERENCES BOUDET G. 1984. Manuel sur les pâturages tropicaux et les cultures fouragères. 4eme édition.
Paris, France : IEMVT; Ministère des Relations Exterieures, Co-operation et Developpement. CHARDONNET P. 1988 cited by GRIMAUD P and CHARDONNET P. 1989. Comportement
alimentaire de cerf rusa en croissance recevant une ration à base de graminée (Brachiaria mutica). p. 1281 - 1282. In : IEMVT. XVI Congrès Internationale des herbages.. Nice, France : IEMVT.
DOMINGUE BF and RAJKOMAR B. 1992. Research and development guidelines for intensive deer
production in Mauritius. Revue Agricole et Sucrière de L’Ile Maurice 71 : 164-170 COMMENTS Q. There was a fall in dry matter content at Constance during the month of March. Can you
explain why? A. 1994/95 was an abnormal year in terms of rainfall and the month of March was relatively
dry, drier than the average for the country. When we had the next rainfall, there was an important increase in yield.
Q. What type of fertiliser was used in the experiments? A. 240 kg CAN per hectare was applied. Studies need to be carried out on timing, type and rate
of fertiliser application.

130

AMAS 1997. Food and Agricultural Research Council, Réduit, Mauritius
131
AN ASSESSMENT OF THE REPRODUCTIVE PERFORMANCE OF SMALL HOLDERS’ DAIRY COWS USING THE MILK PROGESTERONE RADIOIMMUNOASSAY TECHNIQUE
K Boodhoo, P Toolsee, M Rangasamy, M Mooneeramsing and A A Boodoo
Agricultural Research and Extension Unit
ABSTRACT An assessment of the reproductive performance of dairy cows kept by the small holders was made in three climatic regions. The milk progesterone radioimmunoassay analysis (RIA) was used to study the duration of the post partum ovarian activity, efficiency of oestrous detection by the cowkeeper and conception rate following artificial insemination. The regions were Bambous and Petite Rivière (Subhumid), Rivière du Rempart and Plaines des Roches(Humid) and Henrietta and Nouvelle Decouverte (Superhumid).The results show that a low percentage of cows resumed ovarian activity within 30 days after calving in all three regions. The proportion of cows resuming ovarian activity by 90 days was 62.5% in the sub-humid and humid regions and 80% in the superhumid region. The overall mean interval from calving to first ovulation was 86 ± 38 days. All cows showed normal oestrous cycles after resumption of ovarian activity till diagnosed pregnant. Out of 450 ovulations as inferred from the progesterone profiles only 139 were detected by the farmers as periods of oestrus, giving an efficiency of oestrous detection of only 31%. However, out of 164 cases when the farmers called the AI service (i.e farmer had detected the heat), 142 were associated with low progesterone levels, giving an accuracy of detection of 87%. The highest accuracy (94%) occurred in the superhumid zone The overall conception rate was 36% and number of services per conception is high, viz. 2.5. The factors which influence the duration of the post partum ovarian activity, the efficiency and accuracy of heat detection and conception rates are discussed. INTRODUCTION At present, there are about 12 000 head of cattle in Mauritius, 75% of which are owned by small holders commonly known as cowkeepers (MANR 1993) who are predominantly women and own on average one or two head. On the other hand, there are also a few progressive farmers who own about 10-15 animals. Together, they produce the bulk of the fresh milk (95% of the total fresh milk in the country). However, we still need to import most of our milk requirements. The level of inputs and management vary greatly among the farmers. The cattle breeds are local Creoles, Friesians and Friesian Creole crosses. Milk production is about 2300 litres per 300 days of lactation. It is government policy to increase the self sufficiency ratio in fresh milk. In this context, a wide range of incentives is provided to cowkeepers to improve the productivity of their cows. For example, concentrates are subsidised, free veterinary and extension services are provided and there is a guaranteed price for milk. Collection of milk on the farms is also free. Reproductive performance is one of the major factors influencing the efficiency of milk production, the number of calves produced per cow and life time milk production (Esselmont 1992). During the past few years many smallholder dairy farmers have increasingly complained of repeated unsuccessful artificial inseminations. In a survey it was shown that conception rates ranged between 35 and 40% (Toolsee et al. 1996). In a more recent preliminary study it was reported that only 47% of farmers had their cows inseminated by 120 days post calving. About 35% missed at least two heats after insemination, leading to an increase in calving interval (Boodhoo et al. 1996). With such suboptimal reproductive performance, national milk production will decline gradually over the years. Hence, there is a need to optimize the reproductive performance of the dairy cow especially as the cattle population has dropped drastically over the past two decades. However, before any corrective

An assessment of the reproductive performance of small holders’ dairy cows ….. K Boodhoo et al.
AMAS 1997. Food and Agricultural Research Council, Réduit, Mauritius
132
measures are envisaged the true causes of the problem need to be diagnosed. It is in this context that a research project was designed to evaluate the reproductive performance objectively. Milk progesterone radioimmunoassay analysis (RIA) offers a convenient method of monitoring reproductive performance (Dargie and Perera 1994). It was therefore used to study the duration of the post partum ovarian activity, the efficiency of oestrous detection by the cowkeeper and the conception rate following artificial insemination. This paper outlines the results and discusses the possible factors affecting the reproductive performance of dairy cows of small holders. MATERIALS AND METHODS Location The study was undertaken in six different regions of the island representing the three climatic zones. The areas covered were Bambous and Petite Riviere in the subhumid zone (<1250 mm of annual rainfall), Riviere du Rempart and Plaines des Roches in the humid zone (1500 mm of annual rainfall) and Henrietta and Nouvelle Decouverte in the superhumid zone (>2500 mm of annual rainfall). There were two distinct seasons - summer (November-April) and winter (May-October). In summer, the mean temperature is 26º C while in winter it ranges between 17º-22º C. Animals and Feeds The study was carried out between June 94 and December 95 using 150 cows that calved during this period. Among these 150 cows, there were 30 imported pregnant Friesian dairy cows which were sold to the smallholders. The other cows were Friesian, local Creole and crossbreeds (Friesian x Creole). They were tethered in a shed in the backyard and fed with fodder cut from roadsides or nearby fields. During the sugarcane harvesting season (June to November) the diet consisted mainly of sugarcane tops and some fodder grasses. In addition to the basal diet, a dairy concentrate was also fed. Data and Sample Collection Strippings of milk samples were collected twice weekly (every Tuesday and Friday), in the morning, starting 2-3 weeks after parturition. This continued until each cow was diagnosed pregnant by the milk progesterone level and confirmed by rectal palpation. Each milk sample was preserved with two sodium azide tablets and stored at 4ºC. The whole milk sample was centrifuged at 3000 rpm for 15 minutes within 1 week after collection. The skim milk was stored at -20ºC until assayed. The date on which heat was detected by the farmer and the dates first and subsequent AIs were performed by the Veterinary Service Division of the Ministry of Agriculture were recorded. These data were collated with the progesterone profiles of each cow to determine intervals from calving to the resumption of ovarian activity and conception rate. The efficiency of oestrous detection was calculated as the percentage of oestrous periods detected by farmers out of the total number of ovulations as determined from progesterone profiles. The accuracy of oestrous detection was calculated as the percentage of occasions when the progesterone was low at the time of oestrous detection by the farmers. The body condition score of the animals (on a scale of 1 to 5) was also recorded. Determination of Milk Progesterone Levels The milk progesterone concentration was determined by RIA using the solid phase coated tube system using 125 I progesterone as tracer supplied in kit form by the Joint FAO / IAEA Agriculture Laboratory Divisions, in Seibersdorf, Austria (Plaizier 1993).

An assessment of the reproductive performance of small holders’ dairy cows ….. K Boodhoo et al.
AMAS 1997. Food and Agricultural Research Council, Réduit, Mauritius
133
RESULTS Resumption of Ovarian Activity and Ovarian Cycles Ovarian activity was identified when the first progesterone rise persisted for two weeks and was followed by a week of basal values. The results of the sequential progesterone determinations for each cow were plotted. The cumulative percentage of cows resuming ovarian activity after different periods is shown in Table 1.
Table 1 Cumulative Percentage of cows resuming ovarian activity by different periods
Days Post calving Subhumid Zone Humid Zone Superhumid Zone
30 18 3 0
60 40 16 47
90 62 62 80
120 88 84 97
Total Animals 40 32 30
A few cows resumed ovarian activity within 30 days after calving in the subhumid and humid regions and none in the superhumid region. The proportion of cows resuming ovarian activity by 90 days was 62% in the sub-humid and humid zones and 80% in the superhumid region. The overall mean interval from calving to first ovulation was 86 ± 38 days (Table 2). The values ranged from 30 to 150 days indicating a very wide variation in resumption of ovarian activity. This interval was longer in the imported cows than in the locally reared animals (158 ± 66 cf 86 ± 38 days). All cows showed normal oestrous cycles after resumption of ovarian activity until they were diagnosed pregnant. Conception Rates The conception rates for the three climatic zones are shown in Table 2. It shows that the conception rate is 36% and the number of services per conception is high, viz. 2.5. In the humid and superhumid zones the number of services was 2.2 while it was 2.9 in the subhumid zone. For the imported cows, the conception rate was13% and the number of services per conception was 3.6.
Table 2 Summary of the main reproductive parameters of the cows in the three climatic zones
Reproductive Parameters Sub-Humid Humid Super-Humid Imported Averages
First Service Conception Rate (%) 31 45 42 13 36 Services per Conception 2.9 2.2 2.2 3.6 2.5 Calving to first progesterone elevation (days)
74±36 84±25 70±25 158±66 86±38
Calving Interval (months) 15.5±3.0 14.5±1.5 15.0±3.0 17.0±4.0 15.5±3
Accuracy and Efficiency of Heat Detection The individual progesterone profiles for all the cows were examined in relation to the dates of heat reported by the cowkeepers. Table 3 shows the accuracy and efficiency of heat detection by farmers as revealed by progesterone profiles. Out of 450 ovulations as inferred from the progesterone profiles only 139 were detected by the farmers as periods of oestrous, giving an efficiency of oestrous detection of only 31%. However, out of 164 cases when the farmers called the AI service (i.e farmer had detected the heat), 142 were associated with low progesterone levels, giving an accuracy of detection of 87%. The highest accuracy (94%) occurred in the superhumid zone. Furthermore, there was no difference in the efficiency of detection of heat in the three zones.

An assessment of the reproductive performance of small holders’ dairy cows ….. K Boodhoo et al.
AMAS 1997. Food and Agricultural Research Council, Réduit, Mauritius
134
Table 3 Accuracy and Efficiency of Heat Detection by Farmers as Revealed by
Progesterone Profiles in the three climatic zones
Subhumid Humid Superhumid Total
No. of AI 60 52 52 164
No. of Low P4 48 45 49 142 Accuracy % 80 87 94 87
No of Ovulations 177 137 136 450
No. of heats detected 51 47 41 139
Efficiency % 29 34 30 31
DISCUSSION Resumption of Ovarian Activity, Ovarian Cycles and Accuracy and Effficiency of Heat Detection The results of the study have shown that the time taken for resumption of ovarian activity after calving (86 ± 38 days) is long. It is in sharp contrast with other studies elsewhere which have reported a range of 25-30 days (Bulman and Lamming 1978; McLeod and Williams 1991). Ovarian activity in Holstein cattle raised in the tropics was found to be as early as 20 days post partum (Sharpe and King 1981). On the other hand, our data tend to agree with many other studies carried out under African conditions ( Mukasa-Mugerwa et al. 1991; Kassa and Tegegne 1993; Kanuya et al. 1993). It is difficult to explain the considerable delay in resumption of ovarian activity in our study; the two main contributory factors could be (1) suckling and (2) nutrition. It is well known that suckling of the cow (Peters and Lamming 1990; Sharifuddin et al. 1990; Williams 1990) and poor nutrition during the 2-3 months before calving and early post-calving periods would delay resumption of ovarian activity (Peters 1984; Sharpe and King 1981; Butler and Smith 1989). In our study, most of the cows were suckled twice daily and the calves were tied close to the dam. It can be surmised that this management practice has an influence on the resumption of ovarian activity. The body condition score of most of the cows was in the range of 3-4 at calving, indicating that the cows were probably adequately supplemented during the last 2-3 months before calving. Butler et al. (1981) reported that energy balance during the first 20 days of lactation is important in determining the onset of ovarian activity. It is therefore postulated that the cows in the study were not in a favourable energy balance during the postpartum period to allow them to resume ovarian activity. Hence it is suggested that these two factors alone or in combination may have caused the long delay in resumption of ovarian activity. The general patterns of progesterone levels determined throughout the oestrous cycle, and the oestrous cycle length (21± 3 days) are in accordance with data available for cattle in the tropics (Galina and Arthur 1990). Once the cows started to cycle they continued to show a normal oestrous cycle until conception. These observations also suggest that there were no major factors inhibiting cycling once the cows had resumed ovarian activity. The results revealed that many ovulations are missed both before and after service. However, the problem is more acute after the cow has been inseminated, because missing one or more heats will increase the calving interval by a multiple of 21 days for every heat. This problem might be related to the following misconceptions of the cowkeeper who has been made to understand that he should wait for three months after calving or unsuccessful insemination before inseminating his/her animal again; this is why cowbreeders pay less attention to the detection of returns to heat after calving or first insemination; some heats are undetected because they occur when the farmer is not at home, or busy with household activities; others are missed because the farmer is not able to call the AI service in time.

An assessment of the reproductive performance of small holders’ dairy cows ….. K Boodhoo et al.
AMAS 1997. Food and Agricultural Research Council, Réduit, Mauritius
135
Although the cowkeepers miss a number of ovulations, the results show that the farmers are accurate when heat detection is reported. In 87% of the cases, AI was done when the progesterone levels were low indicating that the cow was most likely to be on oestrous. Conception Rates The conception rate registered in the study was 36%, whereas elsewhere in the tropics rates in the range of 63- 71% have been reported (Galina and Arthur 1990). The reasons for this low fertility rate in Mauritius are not clear. It is widely known that conception rates are influenced by a combination of several factors such as heat detection accuracy, cow fertility, timing of insemination, semen quality and inseminator technique (Esselmont 1992). Although the study has shown that in 87% of the cases AI was done when progesterone level was low, it is not possible by this technique of milk progesterone assay to know exactly whether the cow was inseminated at the optimum time of the heat. Since the study has shown that the farmer was accurate in detecting heat when the AI service was called and the cows were fertile, it is inferred that an incorrect timing of insemination may have contributed to this low conception rate. However, other factors namely semen quality, inseminator skills and unfavourable environmental conditions such as high ambient temperature or humidity in the cow sheds (Galina and Navarro-Fierro 1991) could also have been involved. PRACTICAL IMPLICATIONS Based on the results, several possible interventions are possible in the short term: 1. A greater educational effort to make the farmer aware of the importance of improving the efficiency of heat detection especially in the post service period. 2. Improving the handling and quality of semen and monitoring the performance of the AI technicians 3. Better nutritional management of cows during the precalving and post calving periods. 4. Developing an appropriate recording system for data related to reproduction for proper monitoring and evaluation. CONCLUSION This technique of milk progesterone RIA has provided a better understanding of the fertility status of the cows reared under the small holder production system in the Republic of Mauritius. The data reported here clearly show that the reproductive efficiency of the dairy cows of the smallholder is sub-optimal. Improvement is imperative for the continued survival of the cowkeepers. Additional research is warranted to clarify resumption of ovarian activity under our present local milk production system, and to investigate the best time of insemination in relation to the onset of oestrous as reported by the small holders who do so on the basis of secondary signs namely vaginal discharge and bellowing. This should enable appropriate strategies to be developed to optimize reproductive efficiencies.

An assessment of the reproductive performance of small holders’ dairy cows ….. K Boodhoo et al.
AMAS 1997. Food and Agricultural Research Council, Réduit, Mauritius
136
ACKNOWLEDGEMENTS We thank the FAO / IAEA for their technical support and funding for this study. We are grateful to the cowkeepers in the regions of Bambous, Petite Rivière, Plaine des Roches, Rivière du Rempart, Henrietta and Nouvelle-Découverte for having provided the relevant samples, data and information. REFERENCES BOODHOO K, RANGASAMY M, TOOLSEE P and BOODOO AA. 1996. A preliminary assessment
of the reproductive performance of smallholders’ dairy cows in Mauritius. Revue Agricole et Sucrière de l’ Ile Maurice (in press).
BULMAN DC and LAMMING GE. 1978. Milk progesterone levels in relation to conception, repeat
breeding and factors affecting acyclicity in dairy cows. Journal of Reproduction and Fertility 54: 447-458.
BUTLER WR, EVERETT RW and COPPOCK CE. 1981 The relationships between energy balance,
milk production and ovulation in postpartum Holstein cows. Journal of Animal Science 53: 742-752.
BUTLER WR and SMITH RD. 1989. Interrelationships between energy balance and post partum
reproductive function. Journal of Dairy Science 72: 767-787. DARGIE JD and PERERA BMAO. 1994. Training and transfer of technology related to immunoassay
use in livestock production and health. World Animal Review 80/81 : 46-52. ESSELMONT RJ. 1992. Measuring dairy herd fertility. Veterinary Record 131: 209-212. GALINA CS and ARTHUR GH. 1990. Review of cattle reproduction in the tropics Part 4: Oestrous
cycles. Animal Breeding Abstracts 58: 899-925. GALINA CS and NAVARRO-FIERRO R. 1991. Genotype and Environment interactions in cattle in
the tropics. In : IAEA. Isotope and related techniques in animal production and health. Proceedings of a Symposium, 15-19 April 1991, IAEA, Vienna.
KANUYA NL, NKYAR and KESSY BM. 1993. Reproductive performance of tanzanian mpwapwa
cattle at puberty and post partum. In :IAEA. Studies on reproductive performance of cattle in african regions. IAEA TECDOC-708. Vienna : IAEA.
KASSA T and TEGEGNE A. 1993. Reproductive performance of the indigenous Zebu and Friesian ×
Zebu crossbred cows under smallholder management conditions in Ethiopia. In : :IAEA. Studies on reproductive performance of cattle in african regions. IAEA TECDOC-708. Vienna : IAEA.
MANR see under Ministry of Agriculture and Natural Resources McCLEOD BJ and WILLIAMS BE. 1991. Incidence of ovarian dysfunction in post partum dairy
cows. Veterinary Record 9:121-124. MINISTRY OF AGRICULTURE and NATURAL RESOURCES. 1993. Livestock Census. Reduit,
Mauritius : Division of the Veterinary Services, MANR . MUKASA-MUGERWA E, TEGEGNE A and KETEMA H. 1991. Patterns of post partum oestrus
onset and associated plasma progesterone profiles of cows in Ethiopia. Animal Reproduction Science 24:73-84

An assessment of the reproductive performance of small holders’ dairy cows ….. K Boodhoo et al.
AMAS 1997. Food and Agricultural Research Council, Réduit, Mauritius
137
PETERS AR. 1984. Reproductive activity of the cow in the post partum period. I Factors affecting the length of the post partum acyclic period. British Veterinary Journal 140:74-84
PETERS AR and LAMMING GE. 1990. Lactational anoestrous in farm animals. Oxford Review of
Reproductive Biology 12 : 245-288. PLAIZIER JCB. 1993. Validation of the FAO/IAEA RIA kit for the measurement of progesterone in
skim milk and blood plasma. In : IAEA. Studies on reproductive performance of cattle in african regions. IAEA TECDOC-708. Vienna : IAEA.
SHARIFUDDIN W, JAINUDEEN MR and AZIAZUDDIN K. 1990. Monitoring reproductive
performance of cross bred dairy cattle on smallholder farms in Malaysia. In : IAEA. Studies on the reproductive efficiency of cattle using radioimmunoassay techniques. IAEA, Vienna.
SHARPE PH and KING G J. 1981. Postpartum ovarian function of dairy cows in a tropical
environment. Journal of Dairy Science 64: 672-677. TOOLSEE P, BACHRAZ V, HULMAN B and RAJKOMAR B. 1996. A study of the problems and
prospects of small holder dairy production in Mauritius. Revue Agricole et Sucrière de l’Ile Maurice 75: 31-36
WILLIAMS, G.L. 1990. Suckling as a regulator of postpartum rebreeding in cattle: A review.
Journal of Animal Science 68: 831-852.

An assessment of the reproductive performance of small holders’ dairy cows ….. K Boodhoo et al.
AMAS 1997. Food and Agricultural Research Council, Réduit, Mauritius
138
COMMENTS Q. Is it possible to use the radioimmunoassay technique for the detection of heat for the small
cow keepers? A. It is feasible but in other countries, it is not being used to detect heat in cows but rather to
detect pregnancy. Q. Did you have the genetic composition of cows? Will this not introduce an element of
variability in the assay? A. There was an element of variation between the regions but I do not think this was due to the
genetic composition of cows. Q. Were the cows used in this study of the same age? A 54% were of parity I, 25% of parity II, and the rest of parity III. It is known that there is no
effect of age on the resumption of heat.

AMAS 1997. Food and Agricultural Research Council, Réduit, Mauritius
139
LITTER MANAGEMENT: USE OF BAGASSE AS A POTENTIAL SOURCE OF LITTER
MATERIAL FOR BROILER PRODUCTION
M M Davasgaium and A A Boodoo
Agricultural Research and Extension Unit ABSTRACT Bird performance, carcass quality and profitability is affected by the litter management programme used. Among the different types of litter materials used in poultry production, woodshavings is most commonly used in Mauritius. The effect of different types of litter material depends on the physical and chemical characteristics of the materials used. Bagasse was investigated as a potential source of litter materials due to its availability at a low cost; it was compared to woodshavings and sawdust. Assessment of the materials was based on live-weight gain, feed efficiency, carcass quality and litter condition. It is concluded that bagasse is potentially as useful as the other materials and would be cheaper than either. INTRODUCTION The rapid development of the poultry industry in Mauritius has resulted in an increase in the demand for poultry litter material. It is becoming increasingly difficult to secure enough good quality litter that can help to control economic losses related to poor litter management. Such losses can be due indirectly to poor performance and mortality or as a result of condemnation due to downgrading at the slaughter house. Cost of litter is therefore becoming an increasingly important item in the cost of chicken production. When planning a total management programme for the production and marketing of chicken, all aspects of management such as ventilation, house temperature and bird density interrelate with litter management. However, farmers tend to pay little attention to litter management, and concentrate on nutrition and disease control. The adoption of an appropriate strategy for litter management aiming at optimising both bird performance and cost of production largely depends on the availability and cost of good quality bedding material. Present Situation Mauritius imports about 90 000 day-old parent-stock out of which 90% are of the broiler type. Parent stock and broilers are raised exclusively in a deep litter system. In most cases, commercial layers are also raised on deep litter during the rearing period. This means that the annual requirement in terms of litter material is around 8000 tonnes. Woodshavings is the most common and effective litter material used by the poultry industry though sawdust is also used to some extent by small poultry producers. These materials are supplied mainly by the woodwork industry and furniture enterprises. However with the rapid development of the poultry industry, there are periodic shortages of woodshavings resulting in price increases. Indeed small poultry producers find it difficult to get woodshavings in sufficient amount and very often use less than the required amount. To solve the problem of periodic shortages, private companies have embarked on the manufacture and sale of woodshavings and wood chips. However because of its high

Litter management: Use of bagasse as a potential source of litter material for broiler production M M Davasgaium and A A Boodoo
AMAS 1997. Food and Agricultural Research Council, Réduit, Mauritius
140
price (about MUR* 2600 t-1) and offer for sale on bulk basis only, woodshavings is accessible mainly to big producers. What is litter ? A good litter material must satisfy the following criteria:
· Insulate the bird from a cold and damp floor
· Help to conserve heat by insulation and provide supplemental heat through fermentation by feacal microorganisms.
· Receive droppings and absorb moisture from faeces and respiratory processes.
· Provide a warm, soft and spongy surface for optimum comfort of the birds. Therefore to be able to play its role efficiently the litter material should be dry, friable, absorbent, supple, dust free, homogeneous, disease free, difficult to consume, non-toxic and inexpensive. Types of litter materials Litter will differ according to the nature of the materials and their constituents. In general any material that satisfies the criteria mentioned above can be used. Possible candidates include woodshavings, straw, sawdust, cane bagasse, recycled paper (shredded paper and paper chips), rocks (pea and volcanic), hulls (rice and groundnut), maize cobs, grape pith, etc. These materials have been used successfully throughout the world though their ability to hold moisture, pH status and microbial count can vary dramatically. Apart from woodshavings and sawdust, the only material that is relatively easily available locally is sugar-cane bagasse. It is widely used as floor litter in Barbados (Griffith 1993). OBJECTIVE The experiment described here was set up in particular to investigate the value of bagasse as a potential source of poultry litter material to be used for broiler production. MATERIALS AND METHODS Woodshavings obtained from Livestock Feed Limited, sawdust from Grewals and dried bagasse from Curepipe Experimental Station were first analysed to determine their moisture content, bulk density, moisture holding capacity and pH using the methods described below. Measurements Moisture content
Litter samples were dried at 100oC for 18 hours to determine moisture content which is expressed on
a fresh matter basis. Bulk density
* 1 MUR = 0.04545 USD approximately

Litter management: Use of bagasse as a potential source of litter material for broiler production M M Davasgaium and A A Boodoo
AMAS 1997. Food and Agricultural Research Council, Réduit, Mauritius
141
Bulk Density was determined according to the procedure described by Brake et al. (1992). pH 10 gm of litter samples were suspended in 100 ml deionised water for 30 minutes. pH was recorded until constant values were obtained. Water Absorbing Capacity Dried samples were weighed and placed in pans. Moisture holding capacity was determined by filling the pan with water and letting it stand for 30 minutes. Excess water was then drained for 3 minutes and the sample was then weighed again. The percentage of water absorbed was then calculated on dry matter basis. Performance monitoring Performance of the birds was assessed from the following measurements :
1. Liveweight gain 2. Feed consumption 3. Feed conversion efficiency
Birds were weighed weekly and food consumption was recorded on a weekly basis. Evolution of moisture content and pH of litter Samples of litter were taken from each pen four weeks after the start of the experiment. Samples within the same treatment were bulked together to determine the moisture content and pH. The same exercise was repeated during the 7th week. Litter Caking Score and Carcass Quality A score of 0 to 3 was used to assess the litter condition at the end of the trial. The assessment was based on degree of caking, dryness and friability. Visual assessment of carcass quality was made and criteria used were presence and frequency of red spots, breast blisters and haemorrhaged spots. Experimental Design Eight hundred day old broiler chicks of the Ross 208 breed obtained from the Poultry Breeding Centre
were allocated to 8 pens of 5 m2 each and 8 pens of 7.5 m
2 each so that each pen contained 50 as-hatch
chicks. A completely randomised design was used with 4 treatments replicated 4 times. The treatments were as follows: woodshavings, bagasse, mixture of woodshavings and bagasse (1:1), and sawdust. The litter was placed on the floor to a thickness of 8 cm except for sawdust which was used to a thickness of 5 cm. Husbandry practices Feeding

Litter management: Use of bagasse as a potential source of litter material for broiler production M M Davasgaium and A A Boodoo
AMAS 1997. Food and Agricultural Research Council, Réduit, Mauritius
142
Crumbled and pelleted feeds bought from Meaders Feeds Limited were used. Broiler starter was given from day 1 to day 28 and broiler finisher was given from day 29 onwards, until the completion of the experiment in 51 days. Vaccination and Medication Vaccination and vitamins were administered as recommended by the Division of the Veterinary Services. Diseased birds were sent to the Veterinary Laboratory for Post-Mortem analysis and sick birds were treated according to veterinary recommendations. RESULTS AND DISCUSSION Physical and chemical analysis of litter material The physical and chemical characteristics of woodshavings, bagasse and sawdust are shown in Table 1 below.
Table 1 Chemical and physical characteristics of different litter materials on fresh matter basis
Litter Material Moisture Content %
Water Absorbing Capacity %
Bulk Density kg m-3
pH
Bagasse 10.8 ± 0.2 173 ± 19 86.9 ± 4.9 5.9 ± 0.18 Woodshavings 17.9 ± 3.0 189 ± 8 87.5 ± 13 4.0 ± 0.70 Sawdust 17.5 ± 4.0 251 ± 21 276.0 ± 10 6.3 ± 0.02
Different sources and kinds of litter have different moisture holding capacities. Andrew and McPherson (1963) recorded the following percentages of litter moisture after an 8-week grown-out period:
Materials Moisture content (%) Straw 40.9 Rice Hulls 34.1 Bagasse 32.4 Woodshavings 30.6 Ground Flax 27.2 Clay 22.8
The bagasse used in the present experiment having been stored in a closed shed for 12 months prior to utilisation, it had a much lower moisture content (10.8 %) than bagasse ex-factory (about 48 %). Sawdust absorbed much more water than woodshavings or bagasse (Table 1). This is in contrast to the observation of Ruszler and Carson (1968) who reported that litter of smaller particle size absorbed less moisture than that with larger particle size. Moisture release however was considered to be the most important factor in litter evaluation by Ruszler and Carson (1974). Concerning water holding capacity, Shanaway (1992) demonstrated that increased water holding capacity in litter increases the carcass quality score and decreases the incidence of breast blisters. Evolution of moisture content and pH Table 2 shows that there was a significant increase in moisture content from week 4 to week 7. This is the result of increased waste deposition and increased respiration of the growing broilers as

Litter management: Use of bagasse as a potential source of litter material for broiler production M M Davasgaium and A A Boodoo
AMAS 1997. Food and Agricultural Research Council, Réduit, Mauritius
143
explained by Huff et al. (1984). Similarly litter pH increased significantly at the end of the trial due to faecal accumulation.
Table 2 Moisture content and pH of litter materials at 4 and 7 weeks after start of experiment.
Materials Moisture Content % pH 4 weeks 7 weeks 4 weeks 7 weeks
Bagasse 33.8 ± 3.1 43.9 ± 1.3 8.7 ± 0.10 9.3 ± 0.14
Woodshavings 32.5 ± 4.9 43.4 ± 4.1 8.6 ± 0.17 9.4 ± 0.01
Mixture 35.5 ± 4.4 45.5 ± 2.1 8.4 ± 0.05 9.4 ± 0.13
Sawdust 29.8 ± 2.5 44.3 ± 3.0 7.9 ± 0.08 9.3 ± 0.07
Effect of litter on zootechnical parameters The average final live-weight, feed conversion ratio (FCR) and mortality of the birds in the different treatments are shown in Table 3.
Table 3 Effect of different litter types on the performance and mortality of broilers at 51 days Average of four replicates and standard errors
Final live-weight
grams Feed Consumption
per bird grams FCR
Mortality %
Bagasse 2 178 ± 20 4 846 ± 200 2.22 ± 0.19 12 ± 6.7 Woodshavings 2 262 ± 20 4 809 ± 90 2.12 ± 0.06 10 ± 4.3 Mixture 2 261 ± 50 4 872 ± 200 2.15 ± 0.11 10 ± 3.8 Sawdust 2 193 ± 60 4 696 ± 300 2.14 ± 0.11 7 ± 3.4
There was no significant difference between the different treatments on the final live-weight and FCR. Hence litter did not have any significant effect on live-weight and feed conversion efficiency. This is in agreement with the findings of Peacock at al. (1984); however, it was observed that birds reared on sawdust were more likely to eat the litter. Therefore this could compromise the weight gain and the F C R values, thus explaining the lower total feed consumed. The relatively high mortality rates obtained (4.5%) were attributed to an outbreak of Gumboro disease which occurred in the sixth week and was evenly distributed among the treatments. Litter Caking and Carcass Quality Results for litter caking and breast blisters are shown in Table 4. It is easier to maintain the quality of sawdust than that of the mixture of woodshavings and bagasse as detected in the litter caking scores; however, the very low level of breast blisters in both treatments, does not enable a correlation to be established between litter caking scores and number and frequency of breast blisters. In general litter type had little or no effect on carcass grade except in pens where there was a high degree of caking and very humid litter. In most cases deterioration of the litter was attributed to spillage of water from the drinkers causing surface caking. The relatively high frequency of breast blisters on woodshavings (0.32 / bird) was due to the high incidence in only one of the four pens where there were 1.1 blisters/bird.
Table 4 Litter caking score and breast blister assessment

Litter management: Use of bagasse as a potential source of litter material for broiler production M M Davasgaium and A A Boodoo
AMAS 1997. Food and Agricultural Research Council, Réduit, Mauritius
144
Materials Litter Caking Score Average number of
breast blisters / bird Birds with breast
blisters % Bagasse 1.25 0 0 Woodshavings 1.25 0.32 0.15 Mixture 1.75 0.02 0.02 Sawdust 0.5 0.07 0.07
CONCLUSION Since only a few cases of breast blisters were observed except in one replicate of one of the treatments, it is concluded that litter type did not influence carcass quality. Bagasse appears to represent a potentially useful source of litter material for poultry growing as the physical and chemical differences between the three types of litter did not influence the performance of the birds significantly, nor was the carcass quality affected. Furthermore, bagasse is cheap and in plentiful supply; however, more trials need to be conducted using more replicates at higher densities to enable a better assessment of carcass quality. ACKNOWLEDGEMENT We would like to thank the Poultry Breeding Centre, Animal Production Division, Agricultural Services, for providing the facilities to conduct the experiment. REFERENCES ANDREWS LD and McPHERSON BN. 1963. Comparison of different types of materials for broiler
litter. Poultry Science 41 : 249 - 254. BRAKE JD, BOYLE CR, CHAMBLEE TN, SCHULTZ CD and PEEBLES ED. 1992. Evaluation of
the chemical and physical properties of hardwood bark used as broiler litter material. Poultry Science 71: 467 - 472.
GRIFFITH DLV. 1993. Shredded paper for litter. Broiler growers in Barbados are trying shredded
paper as litter instead of sugar-cane bagasse. Poultry Science 32 (1) : 70,72. HUFF WE, MALONE GW and CHALOUPKA JL. 1984. Effect of litter treatment on broiler
performance and certain quality parameters. Poultry Science 63 : 2167 - 2171. PEACOCK GG, BREWER RN, FLOOD CA and KOON JL. 1984. Effect of litter on broiler
performance. Poultry Science 63:(suppl 1.): 163 . ( Abst.) RUSZLER PL and CARSON JR. 1968. Physical and biological evaluation of five litter materials.
Poultry Science 41 : 249 - 254. (Abst.) RUSZLER PL and CARSON JR. 1974. Methods of evaluating the potential usefulness of selected
litter materials. Poultry Science 53 : 1420 - 1427 (Abst.) SHANNAWAY MM. 1992. Influence of litter water-holding capacity on broiler weight and carcass
quality. Archiv-fur-Geflugelkunde 56 ( 6 ) : 177 - 179. (Abst.)

Litter management: Use of bagasse as a potential source of litter material for broiler production M M Davasgaium and A A Boodoo
AMAS 1997. Food and Agricultural Research Council, Réduit, Mauritius
145
COMMENTS Q. Remarks were made on the cheap cost of bagasse as stated by the speaker and also on its
availability. Prices of bagasse may go up with increased demand; but it was reiterated that only a small amount will be used by small poultry keepers.
Q. At the start of the experiment, bagasse was drier than wood shavings but both had the same
moisture content at the end. A. The capacity to absorb moisture and capacity to release moisture was equivalent for both
materials. Q. Death in bagasse was twice that in sawdust, was Gumboro only in the bagasse ? A. Deaths were spread evenly in all replicates.

146

AMAS 1997. Food and Agricultural Research Council, Réduit, Mauritius
147
THE PIG INDUSTRY IN MAURITIUS AND THE ROLE OF GOVERNMENT IN ITS DEVELOPMENT: A PROPOSED GENETIC IMPROVEMENT PROGRAMME
K L Yee Tong Wah
Ministry of Agriculture, Fisheries and Co-operatives ABSTRACT The rapid change in the socio-economic environment of Mauritius is driving traditional farmers to close down their pigsties in the vicinity of populated areas due to complaints from neighbouring households. However, Government policies for their resettlement in new agricultural areas should provide for a system approach to prevent wastage of limited resources. This paper aims at working out the pig population and production targets for the country in order to set the pig industry on a sound and stable footing. The role and function of the Government pig farm is equally re-defined in the context of a proposed genetic improvement program. INTRODUCTION The production chain in the pig industry of Mauritius is made up of about 200 primary producers, some 25 butchers, the centralised slaughter house at Roche-Bois, 4 to 5 processing plants that also import choice cuts from abroad and the consumers including the tourists (Figure 1). The primary producers consist of about 200 back-yard and part-time pig producers scattered in the rural/coastal regions and 9 or 10 large-scale commercial farms which account for about half of the total production in Mauritius. Table 1 shows the total pig production and consumption during 1994, 1995 and 1996. Presently Mauritius is about self-sufficient in fresh pig meat, and prices obtained by the small producers reflect the relative market saturation of second quality product. The actual production system of these small farmers does not yield the quality lean meat expected by top market clients such as (hotels, supermarkets, etc). In the actual programme of pig transfer from Roche-Bois to Saint-Martin, the opportunity is being seized to encourage small farmers to become professionals in the field within the scope of a co-operative in order to meet the demand for quality meat. Model pig houses will be built to optimise the use of available land with due consideration for the minimum safe distance to be kept between any two rows of buildings for prevention of disease spread, hygiene, dung disposal facilities and odour management.
Table 1 Local Pig Production and Consumption 1994 - 1996
Year 1994 1995 1996 Number of heads slaughtered Carcass weight tons
15 776 1 058
15 419 1 038
15 925 1 112
Frozen Imports tons 2 160 102 196 Total Consumption tons 1 218 1 140 1 308
1 Source: Mauritius Meat Authority, Roche-Bois 2 Source: Customs and Excise, Ministry of Economic Planning and Development

The pig industry in Mauritius and the role of Government in its development.. K L Yee Tong Wah
AMAS 1997. Food and Agricultural Research Council, Réduit, Mauritius
148
Figure 1 Pig Production Chain in Mauritius
Consumers including tourists
MarketsButchers' Stalls
Shops & Supermarkets Meat Stall Retailers
Wholesalers
Processors
Cold Room
Importers
Slaughter House
Swill / Hotel waste / Agricultural by-productsFattening Farms
Feed Companies
Multiplier Farms
Breeders
Commercialisation of raw feeds
Importers
Building / Equipment
Veterinary Services / Drugs
PIG POPULATION TARGET The classic pyramidal breeding structure seen in the pig populations of developed countries, made up of nucleus, multiplier and commercial herds, is generally not found in developing countries, where nucleus-like institutional farms multiply the available stock, mostly exotic breeds, and supply breeding material to the producers depending on availability. Private farmers do not specialise in the multiplication of exotic stock because the high cost of production does not encourage development of a ready market for weaners. Producers have to depend on institutional farms to obtain exotic genotypes at subsidised rates. However, indigenous genotypes produced by small-scale farmers can be purchased at reasonable costs. It thus appears that for large-scale cross-breeding programmes, multiplier units will have to be organised, possibly at institutional level, in order to supply breeding material to producers.
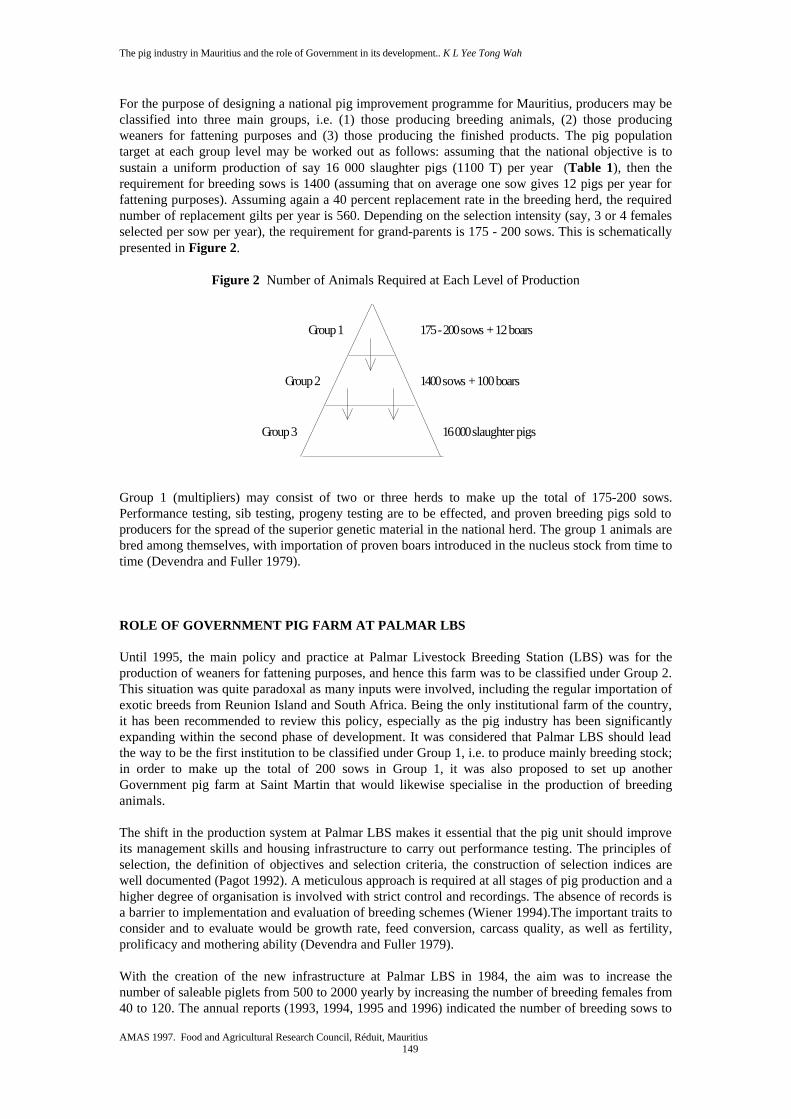
The pig industry in Mauritius and the role of Government in its development.. K L Yee Tong Wah
AMAS 1997. Food and Agricultural Research Council, Réduit, Mauritius
149
For the purpose of designing a national pig improvement programme for Mauritius, producers may be classified into three main groups, i.e. (1) those producing breeding animals, (2) those producing weaners for fattening purposes and (3) those producing the finished products. The pig population target at each group level may be worked out as follows: assuming that the national objective is to sustain a uniform production of say 16 000 slaughter pigs (1100 T) per year (Table 1), then the requirement for breeding sows is 1400 (assuming that on average one sow gives 12 pigs per year for fattening purposes). Assuming again a 40 percent replacement rate in the breeding herd, the required number of replacement gilts per year is 560. Depending on the selection intensity (say, 3 or 4 females selected per sow per year), the requirement for grand-parents is 175 - 200 sows. This is schematically presented in Figure 2.
Figure 2 Number of Animals Required at Each Level of Production
Group 1 175 - 200 sows + 12 boars
Group 2 1400 sows + 100 boars
Group 3 16 000 slaughter pigs
Group 1 (multipliers) may consist of two or three herds to make up the total of 175-200 sows. Performance testing, sib testing, progeny testing are to be effected, and proven breeding pigs sold to producers for the spread of the superior genetic material in the national herd. The group 1 animals are bred among themselves, with importation of proven boars introduced in the nucleus stock from time to time (Devendra and Fuller 1979). ROLE OF GOVERNMENT PIG FARM AT PALMAR LBS Until 1995, the main policy and practice at Palmar Livestock Breeding Station (LBS) was for the production of weaners for fattening purposes, and hence this farm was to be classified under Group 2. This situation was quite paradoxal as many inputs were involved, including the regular importation of exotic breeds from Reunion Island and South Africa. Being the only institutional farm of the country, it has been recommended to review this policy, especially as the pig industry has been significantly expanding within the second phase of development. It was considered that Palmar LBS should lead the way to be the first institution to be classified under Group 1, i.e. to produce mainly breeding stock; in order to make up the total of 200 sows in Group 1, it was also proposed to set up another Government pig farm at Saint Martin that would likewise specialise in the production of breeding animals. The shift in the production system at Palmar LBS makes it essential that the pig unit should improve its management skills and housing infrastructure to carry out performance testing. The principles of selection, the definition of objectives and selection criteria, the construction of selection indices are well documented (Pagot 1992). A meticulous approach is required at all stages of pig production and a higher degree of organisation is involved with strict control and recordings. The absence of records is a barrier to implementation and evaluation of breeding schemes (Wiener 1994).The important traits to consider and to evaluate would be growth rate, feed conversion, carcass quality, as well as fertility, prolificacy and mothering ability (Devendra and Fuller 1979). With the creation of the new infrastructure at Palmar LBS in 1984, the aim was to increase the number of saleable piglets from 500 to 2000 yearly by increasing the number of breeding females from 40 to 120. The annual reports (1993, 1994, 1995 and 1996) indicated the number of breeding sows to
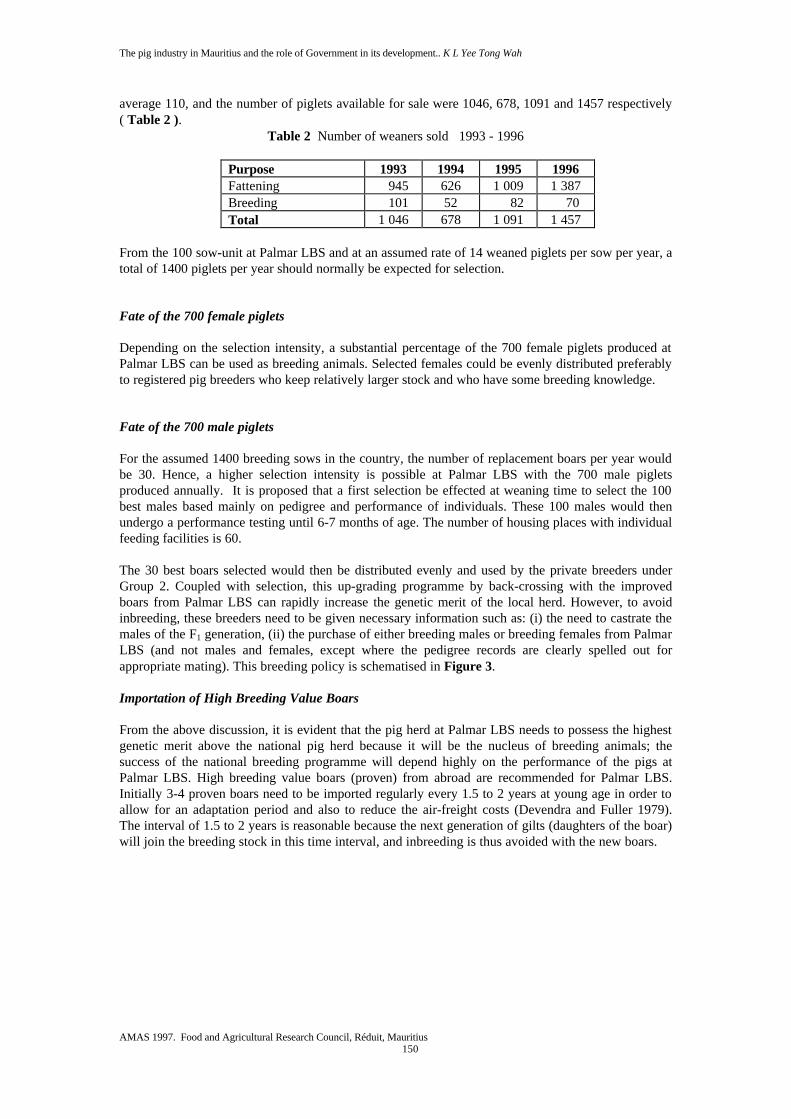
The pig industry in Mauritius and the role of Government in its development.. K L Yee Tong Wah
AMAS 1997. Food and Agricultural Research Council, Réduit, Mauritius
150
average 110, and the number of piglets available for sale were 1046, 678, 1091 and 1457 respectively ( Table 2 ).
Table 2 Number of weaners sold 1993 - 1996
Purpose 1993 1994 1995 1996 Fattening 945 626 1 009 1 387 Breeding 101 52 82 70 Total 1 046 678 1 091 1 457
From the 100 sow-unit at Palmar LBS and at an assumed rate of 14 weaned piglets per sow per year, a total of 1400 piglets per year should normally be expected for selection. Fate of the 700 female piglets Depending on the selection intensity, a substantial percentage of the 700 female piglets produced at Palmar LBS can be used as breeding animals. Selected females could be evenly distributed preferably to registered pig breeders who keep relatively larger stock and who have some breeding knowledge. Fate of the 700 male piglets For the assumed 1400 breeding sows in the country, the number of replacement boars per year would be 30. Hence, a higher selection intensity is possible at Palmar LBS with the 700 male piglets produced annually. It is proposed that a first selection be effected at weaning time to select the 100 best males based mainly on pedigree and performance of individuals. These 100 males would then undergo a performance testing until 6-7 months of age. The number of housing places with individual feeding facilities is 60. The 30 best boars selected would then be distributed evenly and used by the private breeders under Group 2. Coupled with selection, this up-grading programme by back-crossing with the improved boars from Palmar LBS can rapidly increase the genetic merit of the local herd. However, to avoid inbreeding, these breeders need to be given necessary information such as: (i) the need to castrate the males of the F1 generation, (ii) the purchase of either breeding males or breeding females from Palmar LBS (and not males and females, except where the pedigree records are clearly spelled out for appropriate mating). This breeding policy is schematised in Figure 3. Importation of High Breeding Value Boars From the above discussion, it is evident that the pig herd at Palmar LBS needs to possess the highest genetic merit above the national pig herd because it will be the nucleus of breeding animals; the success of the national breeding programme will depend highly on the performance of the pigs at Palmar LBS. High breeding value boars (proven) from abroad are recommended for Palmar LBS. Initially 3-4 proven boars need to be imported regularly every 1.5 to 2 years at young age in order to allow for an adaptation period and also to reduce the air-freight costs (Devendra and Fuller 1979). The interval of 1.5 to 2 years is reasonable because the next generation of gilts (daughters of the boar) will join the breeding stock in this time interval, and inbreeding is thus avoided with the new boars.

The pig industry in Mauritius and the role of Government in its development.. K L Yee Tong Wah
AMAS 1997. Food and Agricultural Research Council, Réduit, Mauritius
151
Palmar Livestock Breeding Station100 Sows
Figure 3 Scheme for Pig Improvement in Mauritius
Best 50 Females Imported Proven Boars
700 Females 700 Males
650 Females 100 Males
600 males for fattening
30 males for upgrading programme
Performance testings6 months
Best Females selected for breeding
To Slaughter
High Breeding Value Boars
Weaners for fattening
1 400 Sows in Country
Weaners for fattening
This programme which combines selection from within the “indigenous” population with progressive importation and selection is likely to give the best results (Devendra and Fuller 1979). CONCLUSION Animal breeding programmes on a national scale depend for their success on the ability to multiply and transmit the genetic improvement across the largest possible number of herds. With the relocation of pig farmers, there is need to consider the production and breeding population targets of Mauritius in order to avoid piece-meal, quick and short-term solutions which might be costlier in the long-term. The economies of scale (limited land resources, costs of housing, equipment, etc.) and the independent temperament and spirit of farmers call for a judicious compromise on the part of all concerned in this national rehabilitation project. ACKNOWLEDGEMENTS

The pig industry in Mauritius and the role of Government in its development.. K L Yee Tong Wah
AMAS 1997. Food and Agricultural Research Council, Réduit, Mauritius
152
I would like to thank the Permanent Secretary of the Ministry of Agriculture, Fisheries and Co-operatives for permission to publish this article. REFERENCES DEVENDRA C and FULLER MF. 1979. Pig production in the tropics. UK : Oxford University
Press . 172 p. PAGOT J. 1992. Animal production in the tropics and subtropics. UK : Macmillan Press Ltd. 517 p. WIENER G. 1994. Animal breeding. UK : Macmillan Press Ltd. 208 p. COMMENTS Q. Do you think that there is a future for the pig industry in Mauritius? A. In terms of the agricultural sector, it would be minimal. Remark was made on the poor carcass quality resulting from swill feeding and these findings have already been published in a student project.
AMAS 1997. Food and Agricultural Research Council, Réduit, Mauritius
153
SELECTION OF ONION CULTIVARS FOR YIELD, EARLY MATURITY AND STORAGE POTENTIAL IN MAURITIUS
R Rajcumar
Agricultural Research and Extension Unit
ABSTRACT In trials conducted in 1994-96 on the experimental stations at Richelieu and Réduit, cultivars Linda Vista and Star 5504 produced the highest bulb yields. Other cultivars namely Savannah Sweet, Chula Vista, Ha 950, Bronco and Red Bandana were not significantly different from the standard Yellow Dessex. Earliness in production was noted in cultivars HA 944 and Savannah Sweet. Storage losses from most of the high yielding cultivars were very high, reaching 80 - 90% within a sixteen week period under ambient conditions. Cultivars with good storage potential namely Rouge de Tana and Véronique produced lower bulb yields. Total soluble solids content in onion bulbs varies significantly and is negatively correlated with bulb yields and storage losses. INTRODUCTION Onion is an important crop in Mauritius and is grown as a cash crop for the local market and for storage. Area under onion production in Mauritius in 1995 was 324 ha with total production of 5974 tonnes (CSO 1995). Onion is grown mainly by traditional growers on a small scale. The crop is grown just after the cyclonic season from March to May and harvested from August to November. The Local Red onion cultivar is highly appreciated by consumers for its colour, size, pungency and good storage, but its yield is low. Consequently more and more producers are turning to the cultivation of hybrid cultivars with higher yield potential. Cultivar Yellow Dessex is grown extensively because of its high bulb yields; other cultivars being grown are Red Creole and Véronique. As onion is harvested over a short period, it has to be supplied during the rest of the year from storage and imports. Local onion production meets around 50% of the demand in Mauritius. Refractometer readings are taken on expressed onion juice to measure total soluble solids as a guide to the dry matter content. Low levels (4 to 6%) are found in soft textured onions with low keeping qualities and high levels (15 to 18%) in onion cultivars especially bred for dehydration. The latter have longer growing seasons and tend to be long storing types (Currah and Proctor 1990). A negative correlation between bulb size and dry matter content has been noted ( Brewster 1977). The total solids content of the Local Red onion cultivar is 16.3% and it has a good storage potential. The total soluble solids of the cultivars under trial, have been determined to establish comparisons and to investigate associations with storability and yield. MATERIALS AND METHODS Trials have been conducted over the last three years 1994-96 to evaluate new short day onion cultivars for bulb yields early maturity, and storage potential. 60 cultivars including controls have been tested in separate trials both at Reduit and Richelieu Experimental Stations and on farm. The trials were
Selection of onion cultivars for yield, early maturity and storage potential in Mauritius R Rajcumar
AMAS 1997. Food and Agricultural Research Council, Réduit, Mauritius
154
run with seeds made available through the International Onion trials under the Natural Resources Institute and Horticultural Research International, Wellesbourne (UK) and other seed companies.
Site Richelieu Experiment Station is at an altitude of 66 m above sea level. Day length ranges from 10.9 to 13.2 hours. Rainfall averages 1250 mm per year, distributed mainly during the warm season while the cool season is dry. Temperature mean maxima vary from 25.2°C ( Aug ) to 29.9°C ( Jan ) and temperature mean minima from 18.7°C ( June ) to 23.1°C ( Jan ). The soil is a low humic latosol, Richelieu family (Parish and Feillafé 1965). Experimental Details Yield Trial Onion seeds of forty cultivars were sown in a nursery for raising seedlings to be transplanted between 6-7 weeks age. Farm yard manure 20 t ha-1 was incorporated in the soil together with compound fertiliser 13:13:20:2 at 600 kg ha-1. A top dressing of Calcium Ammonium Nitrate (26% N) was applied at 200 kg ha-1 two weeks after transplanting. Seedlings spacing was 15 cm between rows and 10 cm within, on raised seed beds. Sprinkler irrigation was applied on a schedule from nursery to 3 weeks before harvest. Weed control was effected by selective herbicides and manual weeding. The cultivars were replicated three times in a randomised block design with a plot size of 3.0 m x 1.0 m. The crop was harvested when 80% of the tops had fallen over and dried. The harvested bulbs were transferred to a well ventilated shed to dry. After one week, dried tops were removed by cutting. Bulbs were left for another week to complete curing. The yield data were subjected to analysis of variance and the Duncan Multiple Range Test. Storage Trial A storage trial was conducted with the onion bulbs obtained from the cultivars. Sixty bulb samples were placed in polypropylene mesh bags and kept on shallow wire mesh racks. The weight of each sample was recorded initially. Records of bulb weight, number of rotten , sprouted bulbs, were taken regularly at two week intervals. The trial involved thirty five cultivars with three replicates. The storage was carried out under ambient conditions over a period of sixteen weeks in a simple building structure with adequate natural ventilation and shelter. Results All the cultivars except one produced good vegetative growth and bulbed satisfactorily. Highly significant differences in bulb yields were obtained between cultivars (Table 1). The marketable bulb yield ranged from 8.4 - 38.7 t ha-1. Cultivars Linda Vista and Star 5504 produced the highest bulb yields in the trial. Cultivars Yellow Dessex, Savannah sweet, Chula Vista, HA 950, Bronco and Red Bandana produced high bulb yields which were not significantly different from each other.

Selection of onion cultivars for yield, early maturity and storage potential in Mauritius R Rajcumar
AMAS 1997. Food and Agricultural Research Council, Réduit, Mauritius
155
Table 1 Yield, Source, and Colour of Onion Cultivars
Cultivars Source Colour** Yield t ha-1 Significance Linda Vista PS YB 38.7 a Star 5504 SA YB 37.2 b Chula Vista PS YB 37.0 c HA 950 HZ YB 36.4 c Bronco HM Y 34.7 c Red Bandana HM DR 34.6 c Savannah Sweet PS Y 34.4 c Yellow Dessex PS Y 34.0 c Gold Rush HT Y 33.5 d Ram 710 HZ YB 33.5 d Rio Solo RC Y 33.5 d HA 95 HZ Y 33.4 d HA 944 HZ Y 33.2 d Star 5501 SA Y 33.0 d RAM 735 HZ Y 32.9 e Star 5502 SA Y 32.3 f Centrex SH Y 31.8 f BGS 71 F1 BJ R 31.7 f Grano 2000 HZ Y 31.4 f HA 870 HZ Y 31.2 f Sivan HZ PB 31.0 f Early Premium HT Y 30.0 g Primavera PS Y 28.9 h Mercedes PS Y 28.2 h Jaguar HT Y 27.4 h H 675 HZ YB 27.0 h Houston AS Y 26.7 h HA 891 HZ YB 26.7 h Granex Yellow TK Y 26.2 h Texas Grano 502 PRR AS Y 25.9 h Agrifound Light Red AF LR 25.8 h Agrifound Dark Red AF R 25.3 h Véronique L PY 22.2 h BGS -82 BJ R & W 21.1 h Rouge de Tana TS R 19.2 h HA 2000 HZ Y 18.6 h Rio Ringo RC Y 18.4 h HA 9 HZ YB 17.9 h Local Red L P 8.4 i Bawku N R 0
Coefficient of Variation - 15.1% Means followed by the same letter are not significantly different at P=0.05 Source: AF National Horticultural Research and Development Foundation Rc Rio colorado AS Asgrow seed HZ Hazera SA Starke Ayres Bj Bejo seeds L Local SS Sun Seeds HM Harris Moran N NRI TK Taki seeds HT Hygrotech seeds PS Peto seed TS Technisem Colour: DR Dark Red PB Pinkish Brown W White LR Light Red PY Pinkish Yellow Y Yellow P Pink R Red YB Yellowish brown Earliness

Selection of onion cultivars for yield, early maturity and storage potential in Mauritius R Rajcumar
AMAS 1997. Food and Agricultural Research Council, Réduit, Mauritius
156
Table 2 depicts the intervals in weeks between sowing and harvest.
Table 2 Earliness of onion cultivars from trials at Richelieu and Reduit
Interval between Sowing and harvest weeks
Cultivars
21 HA 944, Savannah Sweet, Star 5501
23 ChulaVista, HA 950, Linda Vista, Mercedes, Ram 735, Star 5504, Yellow Dessex,
25
Early Premium, Gold Rush, Red Bandana, Sivan, Véronique
26
Agrifound light Red, Agrifound Dark Red, Local Red, Rouge de Tana
A high incidence of bolting was noted in five cultivars including the Local Red. A high percentage of splits was noted in the Local Red Cultivar, and tendency to split within the bulb scale was evident in some cultivars. Total soluble solids Table 3 depicts total soluble solids of the different cultivars.
Table 3 Average % total soluble solids in onion cultivars
Cultivars Total soluble solids Significance Local Red 16.3 k Rouge de Tana 12.7 j Véronique 12.0 i Agrifound Dark Red 12.0 i Agrifound Light Red 10.0 h Chula Vista 9.0 g Sivan 8.3 f Star 5504 7.0 e Granex Yellow 6.3 cd Mercedes 6.3 cd Yellow Dessex 6.0 c Gold Rush 6.0 c Early Premium 6.0 c Savannah Sweet 6.0 c Ram 735 5.2 b Bronco 5.0 b Linda Vista 4.8 b Red Bandana 4.7 b HA 944 4.7 b HA 950 4.0 a
Means followed by the same letters are not significantly different at P=0.05 Cultivars with high bulb yields (Star 5504 - 6.0) have lower total soluble solids content as compared to the cultivars with lowest yields(Local Red - 16.3). A negative correlation (r = - 0.85) between bulb yield and soluble solids content was found, suggestive of a strong association between these two characters. Regression analysis showed a linear relationship between yield and total soluble solids. The regression line with equation Yield = 44.60 - 1.89 ( total soluble solids) is shown in Figure 1.
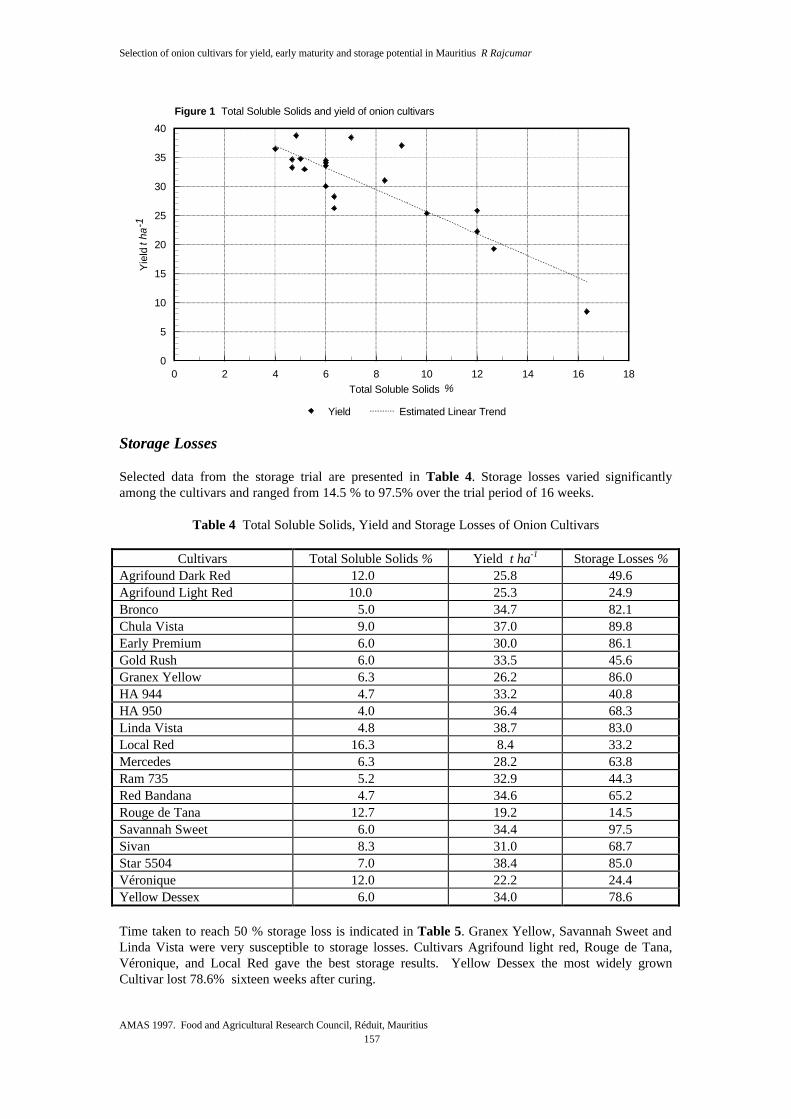
Selection of onion cultivars for yield, early maturity and storage potential in Mauritius R Rajcumar
AMAS 1997. Food and Agricultural Research Council, Réduit, Mauritius
157
0 2 4 6 8 10 12 14 16 18
Total Soluble Solids %
0
5
10
15
20
25
30
35
40Y
ield
t ha
-1
Yield Estimated Linear Trend
Figure 1 Total Soluble Solids and yield of onion cultivars
Storage Losses Selected data from the storage trial are presented in Table 4. Storage losses varied significantly among the cultivars and ranged from 14.5 % to 97.5% over the trial period of 16 weeks.
Table 4 Total Soluble Solids, Yield and Storage Losses of Onion Cultivars
Cultivars Total Soluble Solids % Yield t ha-1 Storage Losses % Agrifound Dark Red 12.0 25.8 49.6 Agrifound Light Red 10.0 25.3 24.9 Bronco 5.0 34.7 82.1 Chula Vista 9.0 37.0 89.8 Early Premium 6.0 30.0 86.1 Gold Rush 6.0 33.5 45.6 Granex Yellow 6.3 26.2 86.0 HA 944 4.7 33.2 40.8 HA 950 4.0 36.4 68.3 Linda Vista 4.8 38.7 83.0 Local Red 16.3 8.4 33.2 Mercedes 6.3 28.2 63.8 Ram 735 5.2 32.9 44.3 Red Bandana 4.7 34.6 65.2 Rouge de Tana 12.7 19.2 14.5 Savannah Sweet 6.0 34.4 97.5 Sivan 8.3 31.0 68.7 Star 5504 7.0 38.4 85.0 Véronique 12.0 22.2 24.4 Yellow Dessex 6.0 34.0 78.6 Time taken to reach 50 % storage loss is indicated in Table 5. Granex Yellow, Savannah Sweet and Linda Vista were very susceptible to storage losses. Cultivars Agrifound light red, Rouge de Tana, Véronique, and Local Red gave the best storage results. Yellow Dessex the most widely grown Cultivar lost 78.6% sixteen weeks after curing.
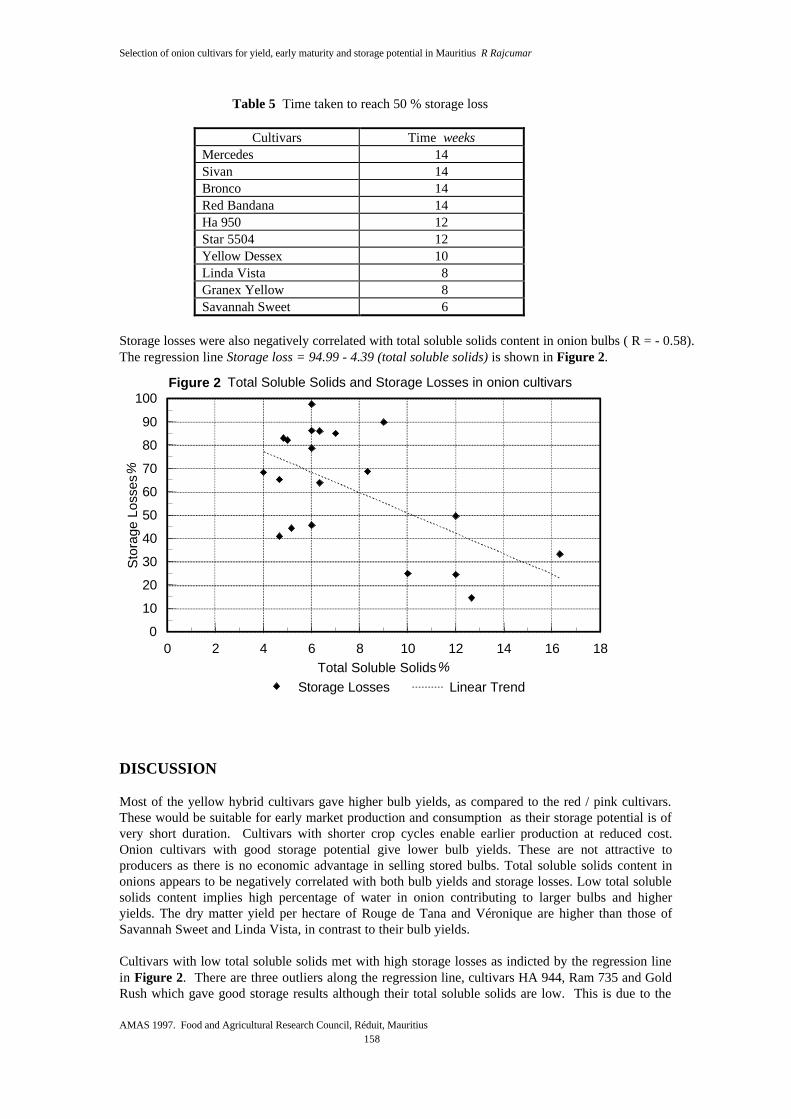
Selection of onion cultivars for yield, early maturity and storage potential in Mauritius R Rajcumar
AMAS 1997. Food and Agricultural Research Council, Réduit, Mauritius
158
Table 5 Time taken to reach 50 % storage loss
Cultivars Time weeks Mercedes 14 Sivan 14 Bronco 14 Red Bandana 14 Ha 950 12 Star 5504 12 Yellow Dessex 10 Linda Vista 8 Granex Yellow 8 Savannah Sweet 6
Storage losses were also negatively correlated with total soluble solids content in onion bulbs ( R = - 0.58). The regression line Storage loss = 94.99 - 4.39 (total soluble solids) is shown in Figure 2.
0 2 4 6 8 10 12 14 16 18Total Soluble Solids %
0
10
20
30
40
50
60
70
80
90
100
Sto
rage
Los
ses %
Storage Losses Linear Trend
Figure 2 Total Soluble Solids and Storage Losses in onion cultivars
DISCUSSION Most of the yellow hybrid cultivars gave higher bulb yields, as compared to the red / pink cultivars. These would be suitable for early market production and consumption as their storage potential is of very short duration. Cultivars with shorter crop cycles enable earlier production at reduced cost. Onion cultivars with good storage potential give lower bulb yields. These are not attractive to producers as there is no economic advantage in selling stored bulbs. Total soluble solids content in onions appears to be negatively correlated with both bulb yields and storage losses. Low total soluble solids content implies high percentage of water in onion contributing to larger bulbs and higher yields. The dry matter yield per hectare of Rouge de Tana and Véronique are higher than those of Savannah Sweet and Linda Vista, in contrast to their bulb yields. Cultivars with low total soluble solids met with high storage losses as indicted by the regression line in Figure 2. There are three outliers along the regression line, cultivars HA 944, Ram 735 and Gold Rush which gave good storage results although their total soluble solids are low. This is due to the

Selection of onion cultivars for yield, early maturity and storage potential in Mauritius R Rajcumar
AMAS 1997. Food and Agricultural Research Council, Réduit, Mauritius
159
high genetic progress towards improving storability in the high yielding yellow / brown cultivars (Currah 1993). ACKNOWLEDGEMENTS I would like to thank Dr.L. Currah, Co-ordinator of International Onion Trials of the Natural Resources Institute, Dr. D. Astley of the Genetic Resources Unit of the Horticulture Research International, Wellesbourne, U.K and all the seed companies for the interest in the trial. I extend my gratitude to Mr R.K. Ramnauth (Jr), Mr K. Boodhoo and other colleagues, to all the field staff involved in the trials, to the planters for their interest, to Prof. Eric Roberts for useful comments in reviewing and to the Director, AREU for permission to publish this paper. REFERENCES BREWSTER JL. 1977. The physiology of the onion. Horticultural Abstracts 47 (1 & 2 ) : 22. CENTRAL STATISTICAL OFFICE. 1995. Digest of agricultural statistics. Mauritius : Central
Statistical Office, Ministry of Economic Planning and Development. CSO see under Central Statistical Office CURRAH L and PROCTOR FJ. 1990. Onions in tropical regions. Bulletin No 35. Chatham, UK :
Natural Resources Institute. p. 75. CURRAH L. 1993. A network approach to onion varietal evaluation in the tropics. Acta Horticulturae
( 358 ) : 195. PARISH DH and FEILLAFE SH. 1965. Notes on the 1:100 000 Soil map of Mauritius Mtius. Sug.
Ind. Res. Inst. Occasional paper no.22. Réduit, Mauritius: MSIRI. COMMENTS Q. Have you been working with hybrid varieties?
Have you have found important variety / environment interaction? A. Both hybrid and open pollinated varieties are being tested but more emphasis has been placed
on hybrids as growers are more interested in them. Test plots have been set up in Réduit, Richelieu and in farmers’ plantations. This factor has been taken care of.

160

AMAS 1997. Food and Agricultural Research Council, Réduit, Mauritius
161
PERFORMANCE TESTING OF SOME FLUE-CURED TOBACCO VARIETIES IN RECENT YEARS
P Hanoomanjee
Agricultural Research and Extension Unit
ABSTRACT After release from a seed-to-seed quarantine , flue-cured tobacco varieties (Nicotiana tabaccum) are tested mainly for the agronomic performance and resistance or tolerance to pests and diseases. This paper deals mainly with the performance of 8 flue-cured tobacco varieties , namely RG 11, RG 13, K 326, K 346 , K394, Coker 176, NC 567 and SPG 126, released from quarantine in 1995 and 1996 as reflected by trials conducted at Richelieu Experiment Station and on-farm testing in the district of Flacq and Rivière du Rempart . Results show that RG 13 was promising both in terms of yield and quality and is comparable to the control varieties NC 95 and RES 8. The yield of variety RG 11 was not consistent in all trials as it was highly susceptible to ‘weather fleck’. Varieties K 326, Coker 176 and Speight G 126 were also promising, but require further testing for conclusive results. INTRODUCTION Although tobacco was introduced in Mauritius in 1639 by the Dutch governor Adriaan Van Der Stel, it was only in 1917 that the Department of Agriculture started experiments with “Tabac Bleu”, a variety which was extensively grown in Réunion Island The objective was to replace the large imports of this black shag tobacco from Réunion. With the promising results obtained, the crop started to be grown on a commercial scale and acquired industrial importance in the 1920’s. Consequently, the British American Tobacco Co. Ltd. became established in Mauritius in 1926, followed by the Tobacco Board in 1932. Later in 1939, the government created a Tobacco Research Station at Richelieu which is now known as the Richelieu Experiment Station. From then on, about 100 flue-cured tobacco varieties have been introduced, tried and tested at the research station. However , the release of tobacco varieties has always been kept under strict control given the strong economic importance of the tobacco crop. Tobacco being a controlled commodity restricted to the local market, even the released varieties which become subsequently low performing are ultimately removed from production. The main commercial flue-cured tobacco varieties released during this century are shown in Table 1. To date, only two flue-cured tobacco varieties namely SPG 28 and NC 95 are being commercially grown by the tobacco producers. RES 85 has been removed from production as it no longer meets the standards established by the cigarette manufacturer, because it loses leaf quality during the post-harvest fermentation period. It is felt that there is a need to strengthen the varietal introduction programme in order to reduce our dependence on the most widely grown variety NC 95. At the same time an attempt will be made to reduce the cost of production of the local tobacco through introduction of high yielding varieties with good cigarette manufacturing quality.

Performance testing of some flue-cured tobacco varieties in the recent years P Hanoomanjee
AMAS 1997. Food and Agricultural Research Council, Réduit, Mauritius
162
Table 1 Main commercial flue-cured tobacco varieties released during this century
Variety Origin Year of Introduction
Remarks
Tabac Bleu Réunion Prior to 1920
Introduced sometimes before 1920 to replace the local varieties. Abandoned about 1931
Virginia Bright Canada 1936 Released in 1941
White Mammoth 61 Canada 1936 Underwent single plant selection and screening. Released in 1951
Yellow Mammoth 58 Canada 1936 Underwent selection for resistance to Black Shank. Released in 1951. Was the most widely grown variety from 1955 to 1974
Jamaica Wrapper Rhodesia 1950 Released in 1955. Cultivation was stopped by 1964 because of low yield
Vesta 30 US 1958 Released in 1961 because of its good yields and good leaf quality. Showed resistance to Black Shank but was later displaced by NC 95
NC 95 Republic of Panama
1962 Released in 1966. Very popular and still most widely grown
SC 66 US 1970 Released in 1973
Speight G 28 US 1974 Underwent selection. Released in 1984. Not so popular
NC 95 Costa Rica 1980 Re-introduction of the variety
RES 85 Local Selection from Coker 347
Released in 1989. Production was discontinued in 1996
NC 95 US 1992 Re-introduction of the variety Source: Ministry of Agriculture, Fisheries and Natural Resources, Mauritius VARIETAL INTRODUCTION UNDER THE CURRENT PROGRAMME From 1981 to 1991, with the legislations existing in many countries , the Ministry of Agriculture was not sucessful in obtaining authorisation from the United States Department of Agriculture to import american tobacco varieties in Mauritius. These varieties are traditionally known to have a better performing potential in the local conditions as compared to varieties from Zimbabwe or India. However in 1992, with the co-operation of the British American Tobacco Co. Ltd., the introduction of eight American flue-cured tobacco varieties was possible. Consequently, a varietal introduction programme was established as shown in Table 2 . PERFORMANCE OF THE NEWLY INTRODUCED FLUE-CURED TOBACCO VARIETIES UNDER TRIAL DURING 1995 AND 1996 The performance of two flue-cured tobacco varieties namely RG 11 and RG 13, both released from quarantine in 1995, were compared with that of the three commercially grown varieties namely NC 95, RES 85 and Speight G 28. The experiment was set up in a Randomised Complete Block Design with four replicates. A plot size of 25.98 m² was used with 48 plants per plot. The trial was laid out at the Richelieu Experiment Station in both the first and second season of 1995. Apart from susceptibility to the major pests and diseases, observations were based mainly on the following criteria: plant height, number of curable leaves per plant, yield of green leaves, yield of cured leaves, grade index and estimated gross revenue. These observations are tabulated as shown in Tables 3 and 4.

Performance testing of some flue-cured tobacco varieties in the recent years P Hanoomanjee
AMAS 1997. Food and Agricultural Research Council, Réduit, Mauritius
163
Table 2 Varietal introductions under the current programme
Variety Origin Parental Source Potential
Yield kg ha-1
Underlying Characteristics Status
NC 95 US (C 139 x Bel1 4.30) x (C 139 x Hicks)
2 600 (SC)
Disease Resistant - high quality - LR to BS - HR to GW and RK
Released in 1995
RG 11 US NC 50 x K 399 2 900 (SC)
HR to BS and GW - R to RK High yield (21-20 leaves per plant) - Good quality cured leaf
) ) Under ) trial
RG 13 US NC 60 x NC 82 3 000 (SC)
MR to BS and GW - R to RK - high yields and quality
) since ) Jan 95
Hema India A cross between 2 vigorous plants
1 560 Tall - Medium maturity - 21 curable leaves per plant - Nic 2.6% - RS 16.7% - F.V 3.5
) )Still )
Jayasri India Jayasri x TMVRR3 1 503
Tall and vigorous - med. bodied - 26-28 curable leaves per plant R to TMV -Nic 2.2% - RS 21.7% - FV 3.3cc/g
) in ) ) quaran
GodavariSpecial
India TMVRR 1 x SP. Cross
1 524 Tall - fast maturing - 22-24 leaves per plant - good quality - R to TMV - Nic 1.7% - RS 12% - FV 3.0 cc/g
)tine ) )
Coker 176
US NA 2 560 (SC)
LR to BS and GW - R to RK and TMV - T to WF - Mod No. of leaves on a medium height stalk (18-20 curable leaves)
) ) Under )
K 326 US Mc Nair 225 x ( Mc Nair 30 x NC 95 )
3 000 SC LR to BS and GW - R to RK - high quality and curability - 20/22 leaves per plant - T to Brown spot
) ) trial )
K 346 US Mc Nair x 80241 (breeding line)
3 000 SC HR to BS and GW - R to RK - high yields and quality - 20/22 curable leaves
) ) since )
K 394 US SPG 28 x Mc Nair 944 3 000 SC HR to BS and GW - High yielding and
average quality - 20/22 leaves/ plant
) ) January )
NC 567 US NA NA LR to BS - MR to GW - R to RK and TMV ) ) 1996
Speight G 126
US K 326 x G 96 2 800 MR to BS and GW - high yield and quality - 20/22 curable leaves per plant - late flowering
) ) )
Source: North Carolina State University, North Carolina Extension Service Key: BS Black Shank MR Moderately Resistant SC South Carolina US Count Country NA Not Available T Tolerant FV Filling Value Nic Nicotine TMV Tobacco Mosaic Virus GW Granville Wilt R Resistant WF Weather Fleck
HR Highly Resistant RK Root Knot LR Low Resistance RS Reducing Sugars
In Table 3, differences in the values measured were not significant at the 5% level except for plant height. In Table 4, with the exception of the grade index and the number of leaves per plant,values were significantly different at the 5% level. In the latter cases, figures followed by common letters indicate Duncan Multiple Range groupings which do not differ significantly at the 5% level. Yields of cured leaves were of the order of 1816 to 2723 kg ha-1 for RG 11 and RG 13 and in the range of 1881 to 2350 kg ha-1 for the commercial varieties. The grade index of variety RG 13 was among the second best. This variety also proved to be very tolerant to "weather fleck" compared to the variety RG 11 which is highly susceptible. The high yield of RG 13 is due mainly to its heavy leaf body which is very desirable for the manufacture of cigarettes. With the introduction of 6 additional flue-cured tobacco varieties namely K 326, K 346, K394, Coker 176, NC 567 and Speight G 126, all released from quarantine in 1996, another variety trial was set up in the first season of 1996 including both varieties RG 11 and RG 13 and the commercial varieties NC 95 and RES 85 (Table 5).

Performance testing of some flue-cured tobacco varieties in the recent years P Hanoomanjee
AMAS 1997. Food and Agricultural Research Council, Réduit, Mauritius
164
Table 3 Comparative and performance of flue-cured varieties under trial in the first season of 1995
Variety Plant height
Leaves per plant Yield of Leaves Grade Index Gross Revenue
Green Cured
cm kg ha-1 MUR∗ kg-1 000’MUR ha-1
SPG 28 95.75a 21.30 19 750 2 286 47.86 111.82 NC 95 (RI) 106.00 b 22.50 16 908 2 119 52.52 115.28 RG 13 95.50a 21.97 21 121 2 493 57.48 144.69 RG 11 106.65 b 22.15 20 072 2 631 56.47 149.75 RES 85 107.53 b 22.95 19 107 2 350 56.68 133.48 NC 95 104.70 b 22.10 19 602 1 954 55.72 106.53 SE + 3.27 0.90 1 356 3 22 3.18 20.69
Table 4 Comparative performance of flue-cured varieties under trial in the second season of 1995
Variety Plant height
Leaves per plant
Yield of Leaves Grade Index Gross Revenue
Green Cured
cm kg ha-1 MUR kg-1 000’MUR ha-1
SPG 28 85.8a 19.88 21 856a 1 881ab 56.25 103.95ab NC 95 106.0 b 19.85 16 532 b 2 063ab 54.87 113.94ab RG 13 99.5ab 19.22 23 322a 2 723a 56.22 153.51 b RG 11 100.6ab 19.88 20 679a 1 816 b 52.09 92.76a RES 85 107.5 b 19.57 23 033a 2 075ab 52.59 111.80ab S.E + 1.4 0.18 766 127 1.22 34.74
Table 5 Comparative performance of flue-cured varieties under trial in the first season of 1996
Variety Plant height
Leaves per plant Yield of leaves Grade Index Gross Revenue
Green Cured
cm kg ha-1 MUR kg-1 ‘000'MUR ha-1 K 326 110.0 21.35 17 558 cd 2 094 bc 59.68 124.79a c Coker 176 102.0 20.15 16 470 bcd 1 769ab 57.83 101.54 b RG 11 108.0 20.80 15 127abc 1 776ab 60.20 106.00 bc NC 95 115.5 20.30 13 912ab 1 749ab 56.69 99.18 b K 346 99.5 19.35 13 438ab 1 622a 61.48 99.03 b SPG 126 112.5 21.35 15 428abc 2 063 bc 58.93 121.26a c RG 13 107.0 20.75 14 119abc 1 786ab 59.25 105.68 bc RES 85 118.5 21.42 15 672abc 1 941abc 59.08 114.65 bc NC 567 117.0 21.05 12 570a 1 649a 60.06 99.28 b K394 108.5 20.40 19 595 d 2 298 c 60.15 136.49a S.E + 4.0 0.24 467.6 46. 0.58 2.74
∗1 MUR = 0.4545 USD approximately

Performance testing of some flue-cured tobacco varieties in the recent years P Hanoomanjee
AMAS 1997. Food and Agricultural Research Council, Réduit, Mauritius
165
Observations showed that varieties RG 11, RG 13, RES 85 and NC 95 reached 50 % flowering 58 days after transplanting ;varieties NC 567 and K 326 after 67 days; varieties SPG 126 ,K 394 and K 346 after 70 days and variety Coker 176 after 74 days. Varieties RG 11 and K394 were severely affected by weather fleck compared to NC 95 which was moderately attacked. The other varieties RG 13, Coker 176, RES 85, NC 567, K326 and SP G126 were all slightly affected by weather fleck. Variety K346 showed poor adaptation as reflected by its retarded growth and variety Coker 176 proved to be a particularly late variety. Significant differences for yields of both green and cured leaves and gross revenue were shown at the 5% level and figures followed by common letters indicate Duncan Mutiple Range groupings which do not differ significantly at the 5% level. Variety K 394 produced the highest yield of cured leaves ( 2298 kg ha-1 ) followed by K 326 ( 2094 kg ha-1 ), RES 85 ( 1941 kg ha-1 ) and RG 13 ( 1786 kg ha-1 ). Variety K 346 scored the highest grade index ( 61.48 MUR kg-1 ) followed by RG 11 and K 326. RESULTS OF ON-FARM TESTING OF FLUE CURED TOBACCO VARIETY RG 13 In order to assess the performance of variety RG 13 under different agro-climatic conditions compared to the control varieties NC 95 and RES 85, two on-farm observational trials were carried out in the first and second season of 1996 in the district of Rivière du Rempart and Flacq respectively. In the former case, yield of cured leaves of the variety RG 13 was 1920 kg ha-1 compared to 1680 kg ha-1 for NC 95. In Flacq, RG 13 yielded 1455 kg of cured leaves per hectare compared to 1473 kg ha-1 for RES 85 taking into account that the crop was damaged by cylone ‘Christelle’ in December 1996. Also, RG 13 scored a grade index of 69.08 compared to 70.10 MUR kg-1 for RES 85. CONCLUSION Based on records and observations made with varieties RG 11 and RG 13 from trials conducted in three growing seasons at the Richelieu Experiment Station and on-farm trials with variety RG 13 under two growing seasons, the latter variety has shown to be promising both in terms of yield and quality and is comparable to the control varieties NC 95 and RES 85. A limited release of this variety will be recommended to twenty flue-cured tobacco growers for further assessment. As regards the other varieties, additional testing and observations are required to ensure the repeatability of the results. REFERENCES MINISTRY OF AGRICULTURE, FISHERIES & NATURAL RESOURCES. Notes on the
performance of tobacco varieties introduced into Mauritius. Reduit, Mauritius : Ministry of Agriculture, Fisheries and Natural Resources. ( Internal report )
NORTH CAROLINA STATE UNIVERSITY. Flue-cured tobacco information. US : North Carolina
State University, North Carolina Cooperative Extension Service.

166

AMAS 1997. Food and Agricultural Research Council, Réduit, Mauritius
167
THE CURRENT STATUS OF RESEARCH ON LITCHI
(Litchi chinensis Sonn.) IN MAURITIUS
N Ramburn
Agricultural Research and Extension Unit
ABSTRACT
Litchi production in Mauritius has for several years been a backyard activity. During the last six years, there has been increasing interest in setting up commercial orchards due to remunerative prices on the local market and an attractive export market. Research is therefore focusing on: (i) identification and evaluation of local clones and introduced cultivars which are regular, early bearers and which produce fruits with small seeds, (ii) physical (root pruning and girdling) and chemical (foliar spray of 1000 ppm daminozide + 1000 ppm ethephon or 1500 ppm chlormequat chloride + 1000 ppm ethephon) manipulative techniques in order to restrict vegetative flushing and promote vegetative dormancy and floral initiation and (iii) Improvement of nutrition by establishing a relationship between yield and leaf nitrogen, phosphorus, potassium, calcium, magnesium, zinc, boron, copper, iron and manganese. INTRODUCTION Litchi (Litchi chinensis) was introduced in Mauritius in 1763. To-day, commercial litchi orchards cover a surface of around 50 hectares comprising some 5500 trees. Of these, 3500 were planted after 1990. The most widespread variety is the Tai So, covering 98 % of litchi plantations. The majority of trees are found in backyards (estimated at around 40 000 in 1986) and the fruits supply both home consumption and commercial markets. It is very difficult to estimate local production. Individual trees more than 75 years old, in backyards and in orchards, have been reported to yield up to 500 kg of fruits per tree annually. Because of lack of irrigation, inadequate cultural practices (fertiliser application, pruning and pest control) and adverse climatic factors (cyclones, anti-cyclones and drought ), most of the trees are erratic bearers. During the last five years, export of litchi to Europe has varied between 33 and 245 tonnes. The local market is as attractive as the export one and has at times proved as remunerative on account of a flourishing tourist industry. However, it is imperative that Mauritius exports to Europe as early as end of October to first week of November to benefit from high prices. The regular and early export of litchi fruits to foreign markets needs to be supported by a research programme which will help growers improve their management practices. Research focus is therefore on: Evaluation of local clones and imported cultivars for (i) early fruit bearing (end of October and beginning of November) (ii) regular bearing and high yield,
(iii) fruits of quality superior or equal to Tai So (i.e. large, colourful, sweet and flavoured fruits, and high percentage of "chicken-tongue" seeds.
Use of tree manipulation (root pruning, cincturing and chemical growth regulation) to
promote flowering through restriction of vegetative growth.

The current status of research on litchi in Mauritius N Ramburn
AMAS 1997. Food and Agricultural Research Council, Réduit, Mauritius
168
Development of a fertilisation programme through foliar diagnosis of regular bearers and correlation of leaf nutrient levels with yield.
VARIETY EVALUATION Local clones Producers and exporters claim that there are trees in backyards and in orchards which are regular bearers and early maturing. These trees have been identified and will be observed during a period of five years. These trees will be propagated by layers for observation at different experimental sites. In 1995, fruits were harvested from the 17th of October. In 1996, first harvest started only on the 30th of October. It has been noted that fruits mature earlier in the East and North East of Mauritius than in other districts. During 1996, phenological observations were started on different sites in order to determine whether earliness is site specific or related to clones. Table 1 shows the timing of the different phenological stages in 1996 at two sites, Beau Plan in the north and Réduit in the centre, where litchi matures early and late respectively.
Table 1 Timing of different phenological stages at Beau Plan and Réduit in 1996
Stage Date Beau Plan Réduit Panicle Emergence 27 June 4 July Fruit set 29 August 5 September Fruit 10 mm, diameter 12 September 27 September Fruit 15 mm, diameter 8 October 27 October Harvest 5 November After November
Minimum and maximum temperatures have been noted on a weekly basis from April to November at the two sites. Figure 1 illustrates the minimum and maximum temperatures at Beau Plan and Réduit. During the early winter months, from April to mid-August, the minimum temperatures were lower at Réduit than at Beau Plan. After mid-August, the minimum temperatures at Beau Plan were lower than those at Réduit. In the case of maximum temperatures, it was consistently warmer at Beau Plan than at Réduit and the difference became larger as from mid-August. At Réduit, panicle emergence and fruit set occurred about one week later than at Beau Plan. After fruit set, fruit development was faster at Beau Plan compared to Réduit. Since day temperatures were 1 to 3oC higher at Beau Plan than at Réduit, this may have caused a more rapid fruit development and might therefore explain early maturity at Beau Plan. Menzel and Simpson (1994) reported that in Australia, in cooler subtropical areas such as Nambour (Latitude, 27oS), panicles emerge in May, in early cultivars such as Tai So, and fruits are harvested in December, while in warmer tropical areas such as Cairns (Latitude 17oS), fruits are harvested in November, although panicles do not appear until July. Further collection of climatic data and phenological observations will enable recommendations on appropriate areas where commercial orchards should be set up in order to benefit from earliness in maturity.

The current status of research on litchi in Mauritius N Ramburn
AMAS 1997. Food and Agricultural Research Council, Réduit, Mauritius
169
Apr 1 May 1 Jun 1 Jul 1 Aug 1 Sep 1 Oct 1 Nov 110
15
20
25
30
35T
empe
ratu
re o
C
Réduit MinB Plan Min
Réduit MaxB Plan Max
R Mov Aver 3 weeksBP Mov Aver 3 weeks
Figure 1 Weekly minimum and maximum temperatures at Beau Plan and Réduit in 1996
Imported cultivars Nine litchi cultivars were imported from Australia in 1991 and planted at Barkly Experiment Station at Beau Bassin. These are Bengal, Fay-Si-Shu, Bosworth 3 (B3), Casino, Wai Chee, Jensen, Kwai May Pink, Heong Lai and Yook Ho Pow. In 1996, flowering and fruiting were as shown in Table 2. Table 2 Flowering and fruit development of imported cultivars in 1996
Cultivar
Panicle Emergence
Fruit set
Fruit Diameter at the end of November
mm Bosworth 3 Mid-July 1st week of Sep. 17 Casino 3rd week of July 2nd week of Sep. 18 Jensen
3rd week of July (Leafy panicles turning vegetative by 1st week of August
Yook Ho Pow 3rd week of July 1st week of Sep. 31 Fay-Si-Shu
1st week of July (Leafy panicles turning vegetative by 3rd week of July)
Kwai May Pink No flowering Wai Chee No flowering Heong Lai No flowering Bengal No flowering B3 and Casino are the only two varieties which produced a significant number of panicles for a first flowering. By the end of November, neither of the two cultivars had reached maturity. However, at the experimental site Tai So usually matures late in December. Assessment of their future potential will be made both in the North and in the East. In the case of Kwai May Pink, Wai Chee, Heong Lai and Bengal, the winter temperatures prevailing at Barkly Experiment Station may not be cool enough for floral initiation (Figure 2). In Australia, floral initiation in late winter (June-July) is promoted by cool temperatures (daily maximum below 23oC) and moisture stress (less than 50 mm rainfall per month) which induce vegetative dormancy (Menzel 1983).

The current status of research on litchi in Mauritius N Ramburn
AMAS 1997. Food and Agricultural Research Council, Réduit, Mauritius
170
Apr 1 May 1 Jun 1 Jul 1 Aug 1 Sep 1 Oct 1 Nov 110
15
20
25
30
35T
empe
ratu
re o
C
Maximum oCMinimum oC
Moving Average 3 weeksMoving Average 3 weeks
Figure 2 Weekly minimum and maximum temperatures at Barkly experiment Station in 1996
Menzel and Simpson (1995) reported that temperatures of 15oC for 10 weeks favour flowering in litchi while periods above 20oC lasting 8 h or more per 24 h are detrimental. In the case of Wai Chee, in glasshouse experiments, plants subjected to a temperature of 15oC for four weeks flowered after their transfer to warmer temperatures (Menzel and Simpson 1995). Under these circumstances, it is very unlikely that Wai Chee will flower successfully under the climate of Mauritius. This will be similarly the case for Heong Lai and Bengal if ever their low temperature requirements are similar to Wai Chee under our conditions. The rainfall (less than 10 mm during May, June and July) was low enough to cause a water stress. Therefore moisture could not have been the reason for lack of floral initiation. In the case of Fay Si Shu and Jensen, it would seem that the cool temperature was not long enough for promotion of flowering, which may explain why the leafy panicles turned vegetative. Short periods above 20oC during the day (Figure 2) can be inhibitory to floral development. Consequently, if all the above-mentioned cultivars have low temperature requirements exceeding that of Tai So, they should be tried on the coolest sites for litchi in Mauritius, for example Vacoas, in the centre of the island. TREE MANIPULATION Cincturing For this preliminary trial, five year old layers (all of Tai So cultivar) and found at three different sites (Labourdonnais, Beau Plan and Réduit) were cinctured by twisting a wire 3 mm in diameter around the branches using a pair of pliers and removing the wire one week later. The cincturing was carried out on branches of diameter between 15 and 25 mm and after hardening of the vegetative flush between March and May 1996. The effect of cincturing on these branches was compared to non-cinctured branches on the same tree and to control trees where no cincturing was carried out. Table 3 shows the different treatments at the three sites. .

The current status of research on litchi in Mauritius N Ramburn
AMAS 1997. Food and Agricultural Research Council, Réduit, Mauritius
171
Table 3 Cincturing treatments and their effect on flowering in 1996.
Site No of Trees Branches cinctured Branches non cinctured Control Treated Number Date Flowering
% Number Flowering
% Labourdonnais
4 2 2
8 4
14 Mar 3 May
100 100
All 8 4
0 0 0
Beau Plan
4
4 4 1
16 16 7
15March 19 April 26 April
100 100 100
All 16 16 7
5 50 25 20
Réduit
2 1 1
4 6
22April 22 April
100 100
All 4 6
0 0 0
On two sites, namely Labourdonnais and Réduit, the effect of cincturing on flowering was obvious. Only branches which had been cinctured in March, April or May flowered. Non-cinctured branches as well as control trees did not flower and flushed vegetatively until the end of June. On the third site, at Beau Plan, all cinctured branches flowered. Some natural flowering did take place on non-cinctured branches (20 to 50%) and on control trees (5 to 10%), but there was a significant advantage to cincturing. The trees tend to develop vegetative flushes continuously during April, May and June because of excessive rainfall. Although on the three sites, the temperatures during May and June are conducive to floral initiation, the excessive moisture favouring vegetative flush precludes flowering. This is because there has been no growth check in the terminal branches before flower induction (Menzel & Simpson 1994). The cincturing of the branches provides such a check on vegetative growth that once the temperature becomes favourable, flowering is initiated. Observations made in 1996 are preliminary, cincturing will be carried out during three consecutive years in order to confirm initial observations and at the same time to assess long-term effects on tree health and yield. Root Pruning Twelve uniform five-year old Tai So layers were selected in the orchard at Beau Plan and a furrow 10 cm deep dug at the edge of the canopy of four trees on 29.3.96 and of four others on 10.5.96, after hardening of the vegetative flush. The effect of root pruning was assessed by comparison with four control trees where no root pruning was carried out. A visual rating of flowering showed no difference between root-pruned and control trees. In both cases, trees flushed vegetatively till June with 5 to 10% of the terminal branches flowering. Uptake of water did not seem to have been hindered by the root pruning, either because April and May were too wet or the root pruning was not drastic enough. Instead of a furrow, a complete ploughing of the soil under the whole canopy could have been more effective. This needs further investigation. Growth Regulators Two growth retardants, namely Alar (Daminozide, B9) and Cycocel (Chlormequat chloride, CCC) were sprayed (in combination with Ethrel at 1000 ppm) at a concentration of 1000 ppm and 1500 ppm respectively, on vegetative flush or on mixed panicles turning vegetative during May and June. Details of the treatments are given in Table 4; controls were sprayed with water. The shoots and trees which did not receive any growth regulator continued their vegetative development without any flowering, except the shoots on the Kwai May Pink Layer which were removed by hand (tipped). By the third week of June, panicles had emerged from all the shoots which had been tipped

The current status of research on litchi in Mauritius N Ramburn
AMAS 1997. Food and Agricultural Research Council, Réduit, Mauritius
172
Table 4 Treatments with Growth Regulators B9 and CCC in 1996
Site Cultivar Tree Target of foliar spray Date of application
Control
Type AgeYrs
Barkly E.S.
Kwai May Pink
layer
5
A branch with terminal shoots on which vegetative flush 1 to 5 cm long has been hand removed.
21 May
1. A branch with terminal shoots on which vegetative flush 1 to 5 cm long has been removed. 2. A branch with terminal flush bearing vegetative shoots 1 to 5 cm long.
Barkly E.S. Kwai May Pink
graft 4 A branch with vegetative shoots 10-15 cm long 21 May A branch with vegetative shoots
10-15 cm long. Cressonville Orchard
Tai So
layer
15
2 trees with mixed panicles 10-23 cm long turning vegetative (4-6 compound leaves reddish to reddish green)
21 June
2 trees with mixed panicles 10-23 cm long turning vegetative (4-6 compound leaves reddish to reddish green)
Similarly, the shoots which had been tipped and sprayed with either B9 or CCC had also flowered. In the case of B9, panicles emerged from the terminal buds down to the tenth bud on the shoot,. while in the case of CCC, all buds from the terminal down to the fifth node had flowered. In case of the Kwai May Pink graft with vegetative flush 10-15 cm long, young leaves withered as from one week after treatment with B9 and CCC, and were shed while the shoot tip dried down to about 5 cm. Below the dried tips, the shoots remained green and during the 3rd week after treatment, panicles emerged from the buds on the remaining vegetative shoot. Fruit set took place during the 1st week of September. At Barkly Experiment Station, severe water shortage occurred as from September and all fruits set on treated trees were shed by the end of October. At Cressonville, all the four treated trees had shed their young leaves by the 2nd week of July and the shoot tips had restarted flowering. By the end of July, fruits had set and during the first week of August, new panicles started emerging at the base of a few of the shoots which had already set fruit during the first week of September. In general, all the panicles on the treated trees were shorter than normal panicles and fruit bunches were more compact. This is a preliminary indication that if the temperature is favourable for floral initiation, panicles will develop if the vegetative shoot is removed. However, removing vegetative shoots by hand is not practical for tall trees. Therefore, removing them with Ethrel could be a better solution. Furthermore, the use of a growth retardant in combination with Ethrel, permits restriction of further vegetative growth after removal of young shoots and allows flower development as soon as temperature is favourable.
At Cressonville, night temperatures fell below 20oC as from the 3rd week of April, and by the 2nd week of June, panicles started emerging. However due to relatively high day temperatures prevailing, the panicles were leafy and turned vegetative. Menzel et al. (1989) showed that temperatures after
induction can influence the direction of floral bud development. High temperatures of 25-30oC, after the emergence of the panicle bud cause floral buds to revert to vegetative growth. Under such circumstances, it is possible to stop reversion of floral buds to complete vegetation by application of either B9 or CCC in combination with Ethrel. Ethrel causes the withering of the young leaves without affecting the young floral buds. The growth retardant prevents further vegetative growth and thus promotes flowering. These preliminary results will have to be confirmed and extended by further experimentation.

The current status of research on litchi in Mauritius N Ramburn
AMAS 1997. Food and Agricultural Research Council, Réduit, Mauritius
173
IMPROVEMENT OF NUTRITION One factor which may influence flowering and yield in litchi is the nutrient status of the trees. Eighty percent of the trees on which the litchi export industry is based, are found in backyards and seldom receive a rational fertilizer application. Moreover, there is no fertiliser programme which has been established for Tai So under our local conditions. The aim of this study is to observe the leaf nutrient status in litchi orchards for three years and correlate these data with the yield of the trees. An attempt will be made at establishing a leaf nutrient standard for litchi in Mauritius. Leaf sampling was carried out in July 1996 from 2 orchards on trees about 35 years old, which had flowered profusely and were known to be high-yielding. The most recently matured leaf was collected from behind the flower panicle. Eight leaves equally distributed around the tree were collected and eight samples were taken from each orchard. Nitrogen, Phosphorus, Potassium, Calcium, Magnesium, Zinc, Boron, Copper , Iron and Manganese will be determined. The yield from the sampled trees will be recorded and a correlation established with the concentration of the different leaf nutrients. Menzel et al. (1992) developed nutrient standards for litchi trees in Australia from high-yielding trees surveyed from orchards over 3 years. CONCLUSION Research with the ultimate aim of producing high quality fruits regularly for the local and export markets is recent in Mauritius. Preliminary observations have started on promising local clones and imported cultivars from Australia. Similarly, there has been a first attempt at finding the effect of cincturing on flowering with positive indications. On the other hand, root pruning has not produced positive results. The encouraging first observations on the effect of CCC + Ethrel or B9 + Ethrel on restriction of vegetative growth for promotion of flowering justify further investigations. A leaf nutrient survey has started on high yielding trees in order to establish nutrient standards for Tai So so as to improve the nutritional management of litchi trees in Mauritius. ACKNOWLEDGEMENTS I would like to thank Mr. A. Hurdowar, Technical Assisstant for his valuable assistance during the trials. My gratitude is extended to Mr. S.Naidu, Director , Agricultural Research and Extension Unit and Dr. Roberts for reviewing the manuscript.

The current status of research on litchi in Mauritius N Ramburn
AMAS 1997. Food and Agricultural Research Council, Réduit, Mauritius
174
REFERENCES MENZEL C.M. 1983. The control of floral initiation in lychee: a review. Scientia Horticulturae 21:
201-215. MENZEL CM, CARSELDINE ML, HAYDON GF and SIMPSON DR. 1992. A review of existing
and proposed new leaf nutrient standards for lychee. Scientia Horticulturae 49: 33-55. MENZEL CM, RASMUSSEN TS and SIMPSON DR. 1989. Effects of temperature.and leaf water
stress on growth and flowering of litchi (Litchi chinensis Sonn.). Journal of Horticultural Science 66: 335.
MENZEL CM and SIMPSON DR. 1994. Lychee. In : SCHAFFER B and ANDERSEN PC eds.
Handbook of environmental physiology of fruit crops, vol.2, Subtropical and tropical crops. US : CRC Press Inc.
MENZEL CM and SIMPSON DR. 1995. Temperatures above 20o C reduce flowering in lychee
(Litchi chinensis Sonn.). Journal of Horticultural Science 70 : 981-987.

AMAS 1997. Food and Agricultural Research Council, Réduit, Mauritius
175
COMPARISON OF PRODUCTION SYSTEMS AND VARIETAL EVALUATION OF STRAWBERRY
S Lutchoomun and C L Cangy
Agricultural Research and Extension Unit
ABSTRACT Two varieties of strawberry, Mara des Bois and Selva, were evaluated under high plastic tunnel and open production systems in the superhumid zone of Mauritius. The marketable yields of both varieties were much higher under the high tunnel system when compared to production in the open. Only a small number of varieties of strawberry had been introduced in Mauritius; new varieties namely Chandler, Gariguette, Marquise, Seascape, and Sunset were imported from France in 1995 and evaluated under high tunnel. The varieties Mara des Bois and Marquise performed best. Further work is needed to evaluate more varieties and test the feasibility and economics of alternative systems of production.
INTRODUCTION The first record of the local cultivation of strawberry dates back to 1915 when 2 diseases of this crop were identified in a private garden (Anon 1915). Production took off with introduction of 5 new varieties yielding 1.3 t ha-1 from Kenya in 1959 (Anon 1961) and fruits were found on sale on the local market during the sixties (Julien 1970). Seventeen other varieties were introduced between 1970 and 1985 and two of them, Tioga and Tiobelle recording yields of 7-8 t ha-1, were released for commercial production (Anon 1976, 1981, 1984, 1985). The importation of fresh strawberry fruits rose from 15 tonnes in 1993 to 30 t ha-1 in 1995 (Anon 1996) indicating that there is a demand for fresh strawberries. A rapid rural appraisal carried out in 1995 by the Agricultural Research and Extension Unit indicated that constraints at producer level were namely limited varieties and high fruit loss (Anon 1995). Therefore research was initiated to devise improved production systems to reduce fruit loss, diversify the germplasm and screen high yielding varieties. MATERIALS AND METHODS An experiment was carried out at Curepipe Experiment Station which is representative of strawberry growing areas in the superhumid zone. Seven varieties namely Chandler, Gariguette, Mara des Bois, Marquise, Seascape, Selva and Sunset were obtained as cold stored runners, from the nursery J. Marionnet, Soings en Sologne, France; they were planted in a tunnel on 24th of August 1995 and evaluated from 24th May to 6th of December 1996. A randomised block design was used with 5 replicates; plot size was 2.7 m2 with 30 plants in each plot. The tunnel measured 4.5 m wide, 2.1 m high and 30 m long; it consisted of a metal framework covered with transparent plastic 180 microns thick, placed permanently on top during the whole crop cycle. The two sides were covered completely only in time of rainfall to protect the fruits. This system is widely used in strawberry producing countries to protect fruits from climatic hazards. The maximum temperature was 39°C in February 1996, and the minimum was 12oC in August 1996. The mean maximum temperature was 29.5°C while the mean minimum temperature was 17.6°C.
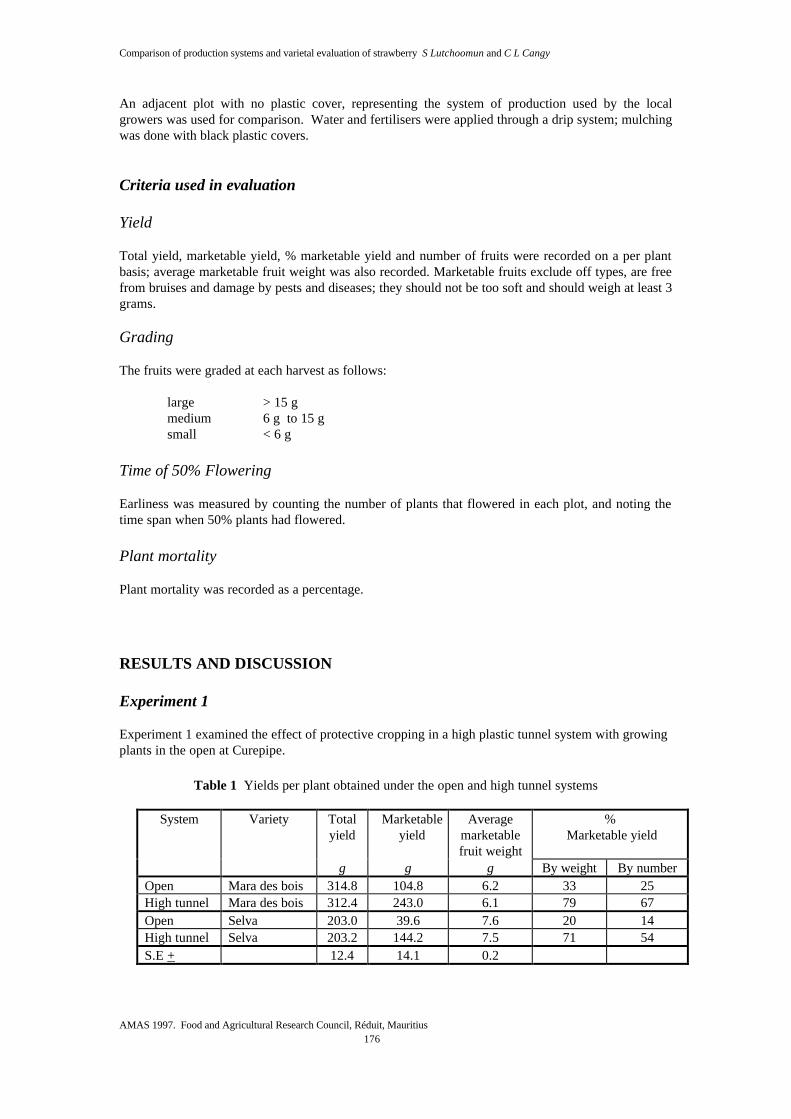
Comparison of production systems and varietal evaluation of strawberry S Lutchoomun and C L Cangy
AMAS 1997. Food and Agricultural Research Council, Réduit, Mauritius
176
An adjacent plot with no plastic cover, representing the system of production used by the local growers was used for comparison. Water and fertilisers were applied through a drip system; mulching was done with black plastic covers. Criteria used in evaluation Yield Total yield, marketable yield, % marketable yield and number of fruits were recorded on a per plant basis; average marketable fruit weight was also recorded. Marketable fruits exclude off types, are free from bruises and damage by pests and diseases; they should not be too soft and should weigh at least 3 grams. Grading
The fruits were graded at each harvest as follows:
large > 15 g medium 6 g to 15 g small < 6 g
Time of 50% Flowering Earliness was measured by counting the number of plants that flowered in each plot, and noting the time span when 50% plants had flowered. Plant mortality Plant mortality was recorded as a percentage. RESULTS AND DISCUSSION Experiment 1 Experiment 1 examined the effect of protective cropping in a high plastic tunnel system with growing plants in the open at Curepipe.
Table 1 Yields per plant obtained under the open and high tunnel systems
System Variety Total
yield Marketable
yield Average
marketable fruit weight
% Marketable yield
g g g By weight By number Open Mara des bois 314.8 104.8 6.2 33 25 High tunnel Mara des bois 312.4 243.0 6.1 79 67 Open Selva 203.0 39.6 7.6 20 14 High tunnel Selva 203.2 144.2 7.5 71 54 S.E + 12.4 14.1 0.2

Comparison of production systems and varietal evaluation of strawberry S Lutchoomun and C L Cangy
AMAS 1997. Food and Agricultural Research Council, Réduit, Mauritius
177
The results showed that there was no difference in total yield per plant between both systems (Table 1, Figure 1). However the tunnel protection led to an increase in marketable yield (Roudeillac and
0
50
100
150
200
250
300
350
gram
s pe
r pl
ant
Marketable Discarded
Mara des Bois Selva
Open Tunnel Open Tunnel
Figure 1 Yield of two strawberry cultivars in the open and under tunnel cultivation
Veschambre 1987) by 48% in terms of fruit weight and by 43% in terms of fruit number. Mara des Bois performed better than Selva in both conditions. There was no significant difference in average marketable fruit weight between the 2 systems but Selva produced bigger fruits than Mara des Bois (Table 1) In both systems, 50% of plants had flowered in each variety by the same date (24th of May) in both varieties. Hence there was no difference in earliness between these two varieties and the type of system did not influence earliness either. Experiment 2 Experiment 2 compared the performance of the 6 recently introduced cultivars from France when grown under tunnels. Yield Mara des Bois and Marquise were the highest yielders of fruits in terms of total yield and marketable yield. Chandler was the next best whereas yield was significantly low in Gariguette, Selva and Seascape (Table 2). No yield was obtained in Sunset because all the plants had died by April. The proportion of marketable fruits was between 60 to 80% in terms of weight and 50 to 70% in terms of number in all cultivars. It was highest in Mara des Bois and Seascape and lowest in Gariguette and Selva. Mara des Bois and Marquise had the highest fruit set. Chandler and Gariguette were the next best whereas Selva and Seascape produced the least number of fruits. The average fruit weight was highest in Chandler, Gariguette, and Selva (Roux and Parisot 1989; Simpson 1993). This may be attributed to the higher proportion of large size fruits in these varieties (Figure2).

Comparison of production systems and varietal evaluation of strawberry S Lutchoomun and C L Cangy
AMAS 1997. Food and Agricultural Research Council, Réduit, Mauritius
178
Table 2 Yield of the six cultivars tested
Variety
Total yield
Marketable
yield
Total fruit
number
Average marketable fruit weight
% Marketable yield
g g g By weight By number Chandler 265.3b 195.9b 45b 8.1a 74 60 Gariguette 242.3c 155.4c 49b 7.1abc 64 55 Mara des bois 312.4a 243.0a 62a 6.1c 78 67 Marquise 305.9ab 220.4ab 69a 6.5c 72 58 Seascape 179.0d 140.9cd 33c 6.7bc 79 66 Selva 208.0cd 144.2cd 31c 7.5ab 71 54 S.E + 18.4 15.8 2.8 0.2 - -
Figures followed by common letters indicate Duncan multiple range groupings i.e. they are no significant differences at P = 0.05% within groups.
Chandler Gariguette Mara des Bois Marquise Seascape Selva0
102030405060708090
100
Per
cent
by
wei
ght
Large > 15 g Medium 6 - 15 g Small < 6 g
Figure 2 % of large, medium and small fruits for six strawberry cultivars
Grading In general, the varieties produced mostly medium and small size fruits (Figure 2). More than 5% of large size fruits were produced by Chandler, Gariguette and Selva. More than 60% of medium size fruits were produced by Chandler, Seascape and Selva. More than 40% of the fruits were small in varieties Gariguette, Mara des bois and Marquise; Selva had the lowest percentage of small fruits.
Table 3 Flowering
Variety Date of 50 % flowering
Chandler 20 June Gariguette 15 July Mara des bois 24 May Marquise 1 June Seascape 1 June Selva 24 May
Dates on which 50% of plants had flowered are presented in Table 3 and % plant mortality in Table 4.

Comparison of production systems and varietal evaluation of strawberry S Lutchoomun and C L Cangy
AMAS 1997. Food and Agricultural Research Council, Réduit, Mauritius
179
Table 4 Plant mortality
Variety % Chandler 24 Gariguette 6 Mara des bois 11 Marquise 15 Seascape 11 Selva 10 Sunset 100
CONCLUSION The use of high tunnel improved marketable yield significantly thus indicating that strawberry can be successfully cultivated in the super humid zones. However the commercial feasibility of the high tunnel production system will depend on an investigation of alternative systems of protection and the comparison of the economics of protected and open system of production. Mara des Bois and Marquise proved to be the most promising varieties. They gave high yields and more than 70% of their fruits were marketable. They also showed promising characteristics in terms of earliness and low plant mortality, but have a low proportion of large fruits. Chandler was the next best after Mara des Bois and Marquise in terms of yield; it also has a higher average fruit weight, but also a high plant mortality (24%). Gariguette,on the other hand, had a high fruit set and showed the lowest plant mortality (6%). Its weaknesses were its lateness to bear fruits, poor yields and high proportion of small fruits. Seascape and Selva performed poorly both in terms of yield and fruit set. Their advantage resides in earliness, low plant mortality and large fruit size. Further trials are warranted on varieties from a wider geographical range of sources, and taking flavour into account. ACKNOWLEDGEMENTS I would like to thank Mr. R. K. Ramnauth, biometrician for his help in designing the experiment and in the analysis and interpretation of the results. REFERENCES ANON. 1915. Annual Report Department Agriculture of Mauritius, p. 15.. ANON. 1961. Annual Report Department Agriculture of Mauritius, p. 37. ANON. 1976. Annual Report Agricultural Services of the Ministry of Agriculture and Natural
Resources, Mauritius, p. 28. ANON. 1981. Annual Report. Agricultural Services of the Ministry of Agriculture and Natural
Resources, Mauritius, p. 75. ANON. 1984. Annual Report Agricultural Services of the Ministry of Agriculture and Natural
Resources, Mauritius, p. 78.

Comparison of production systems and varietal evaluation of strawberry S Lutchoomun and C L Cangy
AMAS 1997. Food and Agricultural Research Council, Réduit, Mauritius
180
ANON. 1985. Annual Report Agricultural Services of the Ministry of Agriculture and Natural Resources, Mauritius, p. 28.
ROUDEILLAC P and VESCHAMBRE D. 1987. La Fraise. Paris, France : CTIFL-CIREF, 307 p. ROUX JM and PARISOT E. 1989. Behaviour of Californian strawberry varieties in Réunion. Fruits
(4): 215 - 220. SIMPSON DW. 1993. The performance of North American day-neutral cultivars and the use of this
germplasm for breeding in the United Kingdom. Acta Horticulturae: 11 : 348

AMAS 1997. Food and Agricultural Research Council, Réduit, Mauritius
181
INTEGRATED CONTROL OF Plutella xylostella (L.) (LEPIDOPTERA: YPONOMEUTIDAE) IN MAURITIUS
C Dunhawoor and D Abeeluck
Agricultural Research and Extension Unit
ABSTRACT The diamondback moth (DBM), Plutella xylostella, is one of the most important pests of cruciferous crops in Mauritius. It is particularly damaging to cabbage and cauliflower. Development of resistance to insecticides was suspected in the early 1980’s when growers failed to obtain satisfactory control of the pest. Great efforts were made on screening of insecticides so as to provide growers with effective products. Recently, studies have been geared towards the development of an integrated pest management (IPM) programme. Natural enemies were introduced and parasitism up to 96% has been recorded in the field. Action-thresholds have been worked out to treat on a need basis. Observations on the seasonal occurrence in insecticide-free cabbage plots have shown that larval populations are relatively low in certain areas and periods of the year. Bacillus thuringiensis (Turex, Xentari and Dipel) has proved to be effective and eventually F1 sterility will be included in the IPM programme on DBM. INTRODUCTION Crucifers, particularly cabbage (Brassica olearacea var. capitata L.) and cauliflower (Brassica olearacea var. botrytis L.) are important vegetables grown in Mauritius; they are cultivated on about 400 hectares of land which produce about 9000 tons annually (Anon 1984). The cropping system varies from backyard gardens to large-scale farms. Among the pest complex of crucifers, Plutella xylostella, commonly known as the diamondback moth (DBM) is the most destructive. DBM was first recorded in Mauritius in 1945. Until 1980, this pest was controlled successfully by synthetic insecticides (Seewooruthun et al. 1984). In 1985, most insecticides were ineffective against DBM (Table 1) and the crucifer growers incurred heavy crop losses, especially in Moka and Plaines Wilhelms districts where cabbage and cauliflower are mostly grown.This led the growers to increase dosages of pesticides, frequencies of applications and even to use mixtures of insecticides to achieve synergistic effects. The DBM project was thus initiated in 1994 with the support of International Atomic Energy Agency (IAEA) to develop environmentally safe control measures that could be integrated and recommended as an integrated pest management (IPM)programme package to growers to reduce the pesticide load on these crops. BIONOMICS OF DBM DBM is a greyish microlepidopteran, 10 to 15 mm long, with pale triangular markings on the inner edge of each forewing, forming a diamond pattern when wings are folded at the back. The life history of DBM has been studied under laboratory conditions ( 19°C to 25°C ) and relative humidity 90 to 95 % (Seewooruthun et al. 1984). Under these conditions, females lay about 125 eggs in their lifetime. The eggs are yellow and laid on the main vein, on the upper and lower surfaces of leaves. The incubation period is 3 to 5 days. The four larval instars last for 1, 3-4, 2-3, and 1-3 days respectively

Integrated control of Plutella xylostella (L) (Lepidoptera:Yponomeutidae) C Dunhawoor and D Abeeluck
AMAS 1997. Food and Agricultural Research Council, Réduit, Mauritius
182
and feed on leaves. The third and fourth instars are voracious feeders. The pupal period is 4 to 6 days. Adults fed on honey, live up to 31 days.
Table 1 Effectiveness of Insecticides 1984 - 1997
Insecticides * 84 85 86 87 88 89 90 91 92 93 94 95 96 97Methidathion ++ ++ ++ ++Phentoate ++ +Metamidophos a ++ +Trichlorfon ++ + + +Methomyl ++ +Lambda-cyhalothrin +++ +++ +++ +++ +Methiocarp +++ ++ ++ +Chlorfluazuron b +++ +++ +++ +++ +++Alystin b ++ ++Prothiofos +++ +++ +++ ++Profenophos ++Vamidathion b ++Bifenthrin b ++Diflubenzuron + +Abamectin +++ +++ + + +++ +++Neemhit b ++ +++ +++Cartap +++ +++Turex ( Bacillus thuringiensis ) +++ +++Dipel +++Xentari +++
*a Recommended at higher dosages + Slightly effectiveb not commercialised ++ Moderately effective
+++ Highly effective DISTRIBUTION AND SEASONAL ABUNDANCE OF DBM Mauritius has a variable climate with four distinct climatic zones,and two seasons, summer (October–March) and winter (April–September). Crucifer production is principally concentrated in two regions within the super humid zones, namely Vacoas and Nouvelle Decouverte at altitudes of 428 and 520 meters respectively. But DBM occurs in all localities where crucifers are grown. Dry weather (summer) favours DBM build-up whereas during winter the population is reduced. Rainfall causes high mortality in all stages of DBM and thus decreases the pest population during the year. The young leaves of the host plants also influence the DBM population on the crop. DBM is most abundant forty five days after transplanting when many young leaves are present. The DBM population was evaluated on untreated plots in 2 localities, Plaisance and Curepipe during 1995 and 1996. Ten plants were chosen at random from a plot of 50 cabbage plants from each locality. The number of larvae per plant was recorded every 7 days. Monthly average results are summarised in Figure 1. ACTION THRESHOLD As a first step to reduce the frequency of insecticide applications, an action-threshold was worked out. Two types of thresholds were defined: presence of 0.5 larva per plant and 30 per cent of plants infested. Results were compared with weekly and fortnightly treatments and untreated control. The trials were arranged in a randomised block design with 40 plants per plot. Larval counts were recorded weekly on 20 plants per plot. When thresholds were reached, Abamectrin (Vertimec 1.8 EC)

Integrated control of Plutella xylostella (L) (Lepidoptera:Yponomeutidae) C Dunhawoor and D Abeeluck
AMAS 1997. Food and Agricultural Research Council, Réduit, Mauritius
183
was applied at the rate of 4.5 g active ingredient per hectare. Assessment of the damage at harvest, modified from Beck and Cameron (1992) was as follows: wrapper leaves score 1-3, head score 1-6. A perfect undamaged cabbage with no feeding holes had a score of 2. Head scores of 2-3 gave reasonably good cabbages, scores of 4-5 were acceptable and scores of 6 were unmarketable. Heads were also weighed. Two trials were performed at Plaisance and Reduit in October 1995. Results show that the number of sprays could be reduced. No significant difference was observed in the total damage index between weekly spraying and spraying at 30 % infestation (Table 2) and between weekly spraying and spraying at 0.5 larva per plant in one case. For scouting purposes, the percentage infestation method would be more practical for growers.
Table 2 Comparison of Action thresholds with standard treatments and control
* ** Marketable %
Treatment
No
of p
lant
s
Tot
al d
amag
e A
vera
ge s
core
Sign
ific
ance
at P
= 0
.05
Hea
d w
eigh
t kg
No
of s
pray
s
Ver
y G
ood
Goo
d
Acc
epta
ble
Tot
al
Plaisance October 1995Fortnightly Spray 131 2.64 c 0.89 3 66.0 31.2 0 97.2Weekly Spray 136 2.68 c 0.76 6 65.2 32.5 2.3 100.0Spray at 30% infestation 136 4.16 b 0.72 2 43.5 55.2 1.3 100.0Spray when 0.5 larva per plant 124 3.19 bc 0.74 1 20.8 64.1 0 84.9Control 85 4.96 a 0.71 0 17.5 58.5 4.2 80.2
Réduit October 1995Fortnightly Spray 158 4.02 b 1.80 4 44.2 49.5 5.2 98.2Weekly Spray 158 3.00 b 1.87 6 70.5 25.4 4.0 99.9Spray at 30% infestation 155 5.14 ab 1.72 2 3.1 80.2 6.2 89.5Spray when 0.5 larva per plant 145 5.34 a 1.68 2 3.1 76.4 4.5 84.0Control 134 5.68 a 1.66 0 21.0 70.5 4.8 77.4
* Damage score ( wrapper leaves : 1 - 3 , Heads : 1 - 6 )** a b c : Means followed by the same letter are not significantly different at P = 0.05
Integrated pest management programme of DBM As a first step towards a biological programme, the search for endemic natural enemies of DBM was started in 1985. One species of parasitoid, Diadegma sp (Hymenoptera: Ichneumonidae) was found. However, the incidence of this species on the pest in cabbage and cauliflower was very low (Anon 1985). Successful cases of biological control of DBM have been reported in other countries (Imam et al.1986; Sastrosiswojo and Sastrodidhardjo 1986). Two exotic parasitoid species, Cotesia plutellae, Kurdjumov (Hymenoptera: Braconidae) and Diadegma semiclausum Hellen ((Hymenoptera: Ichneumonidae) were introduced from the Asian Vegetable Research and Development Centre, Taiwan in 1991. These parasitoids were reared in the laboratory and released in selected crucifer
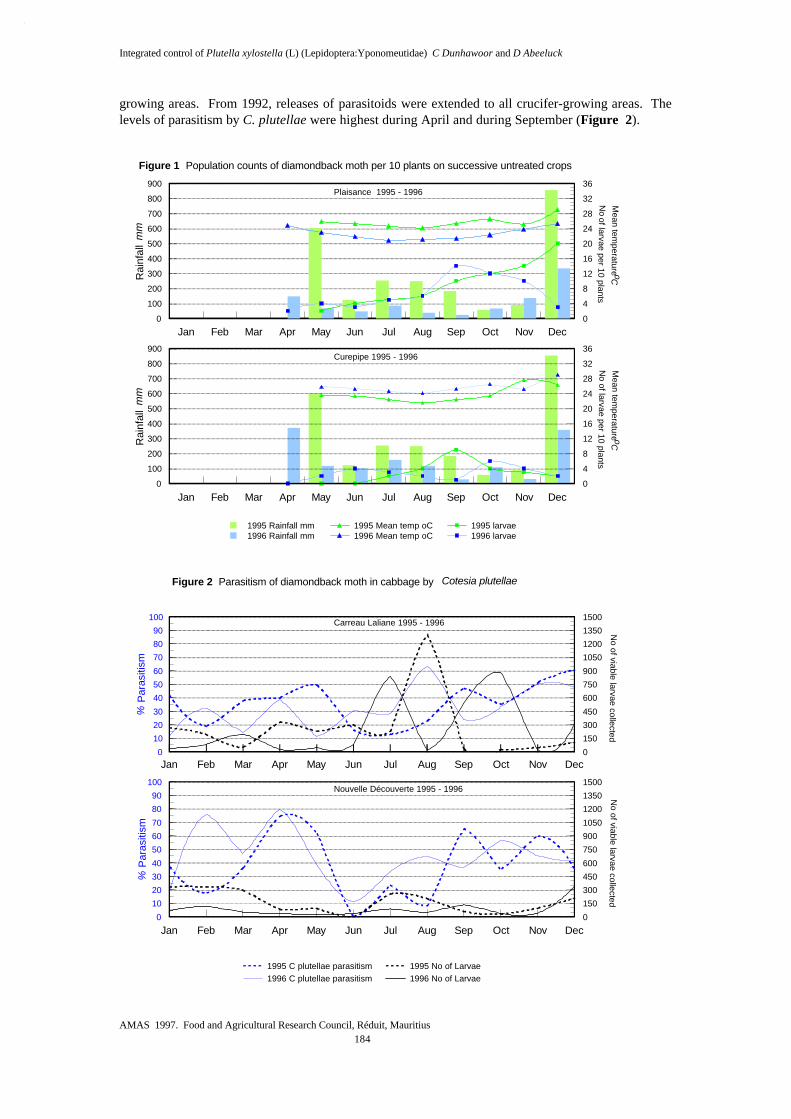
Integrated control of Plutella xylostella (L) (Lepidoptera:Yponomeutidae) C Dunhawoor and D Abeeluck
AMAS 1997. Food and Agricultural Research Council, Réduit, Mauritius
184
growing areas. From 1992, releases of parasitoids were extended to all crucifer-growing areas. The levels of parasitism by C. plutellae were highest during April and during September (Figure 2).
Figure 1 Population counts of diamondback moth per 10 plants on successive untreated crops
Jan Feb Mar Apr May Jun Jul Aug Sep Oct Nov Dec0
100
200
300
400
500
600
700
800
900
Rai
nfal
l m
m
0
4
8
12
16
20
24
28
32
36M
ean temperature oC
No of larvae per 10 plants
1995 Rainfall mm1996 Rainfall mm
1995 Mean temp oC1996 Mean temp oC
1995 larvae1996 larvae
Jan Feb Mar Apr May Jun Jul Aug Sep Oct Nov Dec0
100
200
300
400
500
600
700
800
900
Rai
nfal
l m
m
0
4
8
12
16
20
24
28
32
36
Mean tem
perature oCN
o of larvae per 10 plants
Curepipe 1995 - 1996
Plaisance 1995 - 1996
Figure 2 Parasitism of diamondback moth in cabbage by Cotesia plutellae
Jan Feb Mar Apr May Jun Jul Aug Sep Oct Nov Dec0
10
20
30
40
50
60
70
80
90
100
% P
aras
itism
0
150
300
450
600
750
900
1050
1200
1350
1500
No of viable larvae collected
1995 C plutellae parasitism1996 C plutellae parasitism
1995 No of Larvae1996 No of Larvae
Nouvelle Découverte 1995 - 1996
Jan Feb Mar Apr May Jun Jul Aug Sep Oct Nov Dec0
10
20
30
40
50
60
70
80
90
100
% P
aras
itism
0
150
300
450
600
750
900
1050
1200
1350
1500
No of viable larvae collected
Carreau Laliane 1995 - 1996
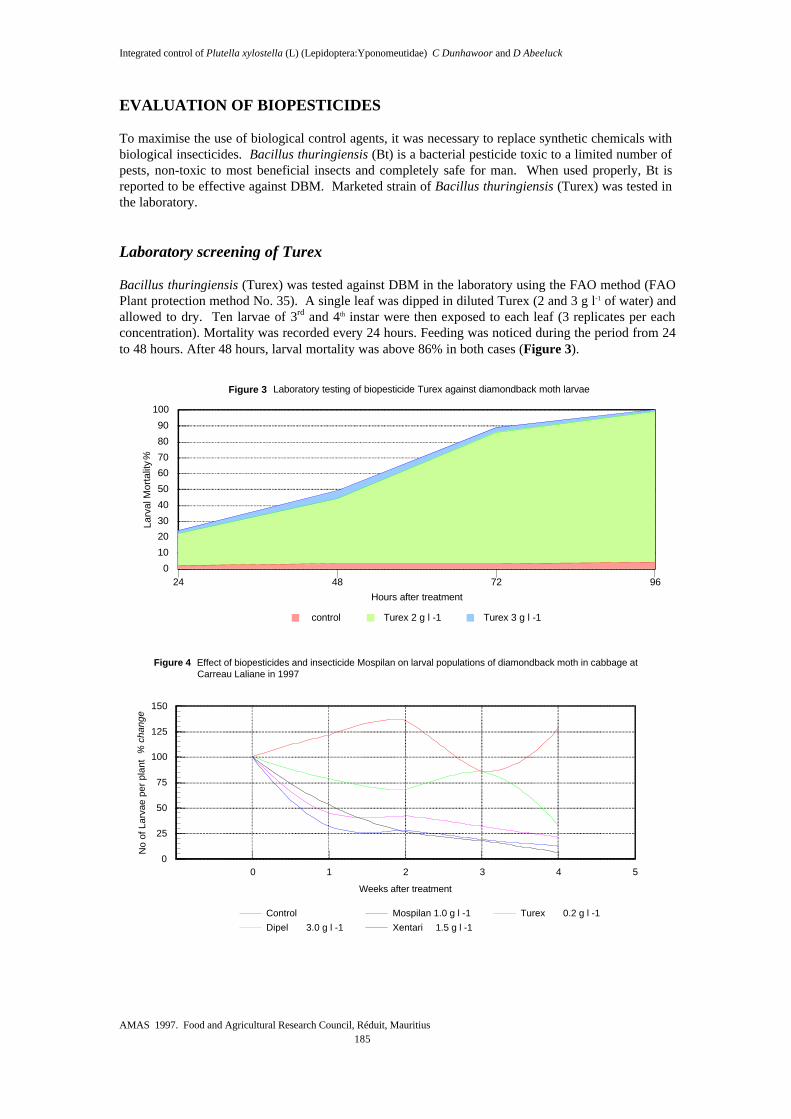
Integrated control of Plutella xylostella (L) (Lepidoptera:Yponomeutidae) C Dunhawoor and D Abeeluck
AMAS 1997. Food and Agricultural Research Council, Réduit, Mauritius
185
EVALUATION OF BIOPESTICIDES To maximise the use of biological control agents, it was necessary to replace synthetic chemicals with biological insecticides. Bacillus thuringiensis (Bt) is a bacterial pesticide toxic to a limited number of pests, non-toxic to most beneficial insects and completely safe for man. When used properly, Bt is reported to be effective against DBM. Marketed strain of Bacillus thuringiensis (Turex) was tested in the laboratory.
Laboratory screening of Turex Bacillus thuringiensis (Turex) was tested against DBM in the laboratory using the FAO method (FAO Plant protection method No. 35). A single leaf was dipped in diluted Turex (2 and 3 g l-1 of water) and allowed to dry. Ten larvae of 3rd and 4th instar were then exposed to each leaf (3 replicates per each concentration). Mortality was recorded every 24 hours. Feeding was noticed during the period from 24 to 48 hours. After 48 hours, larval mortality was above 86% in both cases (Figure 3).
24 48 72 96
Hours after treatment
0
10
20
30
40
50
60
70
80
90
100
Larv
al M
orta
lity
%
control Turex 2 g l -1 Turex 3 g l -1
Figure 3 Laboratory testing of biopesticide Turex against diamondback moth larvae
0 1 2 3 4 5
Weeks after treatment
0
25
50
75
100
125
150
No
of L
arva
e pe
r pl
ant
% c
hang
e
Control
Dipel 3.0 g l -1
Mospilan 1.0 g l -1
Xentari 1.5 g l -1
Turex 0.2 g l -1
Figure 4 Effect of biopesticides and insecticide Mospilan on larval populations of diamondback moth in cabbage at Carreau Laliane in 1997

Integrated control of Plutella xylostella (L) (Lepidoptera:Yponomeutidae) C Dunhawoor and D Abeeluck
AMAS 1997. Food and Agricultural Research Council, Réduit, Mauritius
186
On-farm trial of biopesticides and insecticides Three strains of Bacillus thuringiensis (Turex, Xentari and Dipel) and one synthetic insecticide (Mospilan 20 W/W ) were tested against DBM. A field was selected at Carreau Laliane and divided randomly into 4 replicates, each containing 50 plants. Ten plants were randomly selected from each plot and examined. There were about 5 larvae per plant on the 3rd week after transplanting. Treatments were applied on the 3rd and 5th weeks after transplanting as follows: Turex 2 g l-1, Xentari 2 g l-1, Dipel 2 g l-1, Mospilan 1 g l-1 of water, and a control (untreated). Larval counts showed that Xentari and Mospilan were most effective (Figure 4). DISCUSSION The exotic parasitoid, C. plutellae, is well established in Mauritius and the level of parasitism has reached up to 96 % in 1994. But the farming community still relies on synthetic chemicals that have deleterious effects on natural enemies. The concept of treating only when the threshold level is exceeded is fundamental to IPM. Growers’ education in the implementation of a biopesticides-IPM system would no doubt help in maximising the use of biological control agents. Research on new technologies such as the use of F1 sterility technique in conjunction with a biological control programme and a trap crop is being carried out. ACKNOWLEDGEMENTS The authors are most grateful to Professor E L. Roberts. His criticism on the manuscript is greatly appreciated. They also extend their gratitude to Mr R. Ramnauth who willingly provided statistical advice. They also acknowledge the assistance of Mr R. Padaruth and Mr Y. Mungroo in the preparation of the manuscript. REFERENCES ANON. 1984. Digest of Agricultural Statistics. Statistical Office, Ministry of Agriculture and Natural
Resources, Mauritius, p 55. ANON. 1995. Plutella xylostella. Annual Report Ministry of Agriculture and Natural Resources,
Mauritius. (internal / unpublished) BECK NG and CAMERON PJ. 1992. Developing a reduced spray program for Brassicas in New
Zealand. p. 341 - 350. In: TALEKAR NS ed. 1992. Diamondback moth and other crucifer pests. Proceedings of the second international workshop, Tainan, Taiwan, 10 - 14 December 1990. AVRDC. AVRDC Publication no. 92-368.
IMAN M, SOEKARMA D, SITUMORANG J, ADIPUTRA IMG, and MANTI I. 1986. Effects of
insecticides on various field strains of Diamondback moth and its parasitoids in Indonesia. p 315-323. In: AVRDC. Diamondback Moth Management- Proc First International. Workshop, Taiwan, Asian Vegetable Research and Development Center.
SASTROSISWOJO N and SASTRODIDHARDJO S. 1986. Status of biological control of
diamondback moth by introduction of parasitoid, Diadegma eurocephaga in Indonesia. p 185-194. In : AVRDC. Diamondback Moth Management- Proc First International Workshop, Taiwan, Asian Vegetable Research and Development Center.

Integrated control of Plutella xylostella (L) (Lepidoptera:Yponomeutidae) C Dunhawoor and D Abeeluck
AMAS 1997. Food and Agricultural Research Council, Réduit, Mauritius
187
SEEWOORUTHUN SI, DUNHAWOOR C and LI TIN WAI M. 1984. Plutella xylostella. Annual Report of the Ministry of Agriculture and Natural Resources, Mauritius. (internal/ unpublished ).
COMMENTS Q. Is there anything that the farmer need to do to increase the level of parasitism? A. At the Ministry, we are raising parasites at our own costs for release. We intend to ask
farmers not to use insecticides but use B. thuringiensis instead. Q. In your studies have you seen any preference shown by Cotesia plutellae for 3rd and 4th larval
stages? A. 3rd and 4th larval stages appear to be preferred as these have enough food material to support
the development of the parasite.

188

AMAS 1997. Food and Agricultural Research Council, Réduit, Mauritius
189
THE MYCOSPHAERELLA LEAF DISEASE COMPLEX (MLDC) OF BANANA IN MAURITIUS
S D Soomary and S P Benimadhu
Agricultural Research and Extension Unit
ABSTRACT This paper highlights the possible occurrence of a disease of complex aetiology involving an undescribed Mycosphaerella sp , identified by CIRAD-FLHOR and / or Mycosphaerella fijiensis (Black Sigatoka Disease) confirmed by NRI. The new disease of banana, tentatively named Mycosphaerella Leaf Disease Complex (MLDC) is reported for the first time in Mauritius. The predominant symptoms of the disease and its development are described. Management strategies for the control of Mycosphaerella Leaf Disease Complex are proposed together with an action plan.
INTRODUCTION A disorder of unknown cause was encountered for the first time on banana cultivar dwarf cavendish in April 1995 during a Rapid Rural Appraisal (RRA) exercise conducted by the Agricultural Research and Extension Unit (AREU) at Camp de Masque, in the district of Flacq. According to reports from the Extension Unit, visible symptoms of the disorder started at about the same time in all the major banana growing areas of the island in February 1995, with a higher incidence in the superhumid regions. DISEASE SYMPTOMS The overall symptom picture of the disorder observed during disease surveys at Camp de Masque and other localities in 1995, consisted mainly in poor development, rapid withering of older leaves, reduced number of functional leaves at bearing stage, poor bunch emergence, incomplete fruit filling, and premature ripening of fruits. In addition to the above symptoms, other characteristics observed for the first time in Mauritius were as follows: Accelerated drying of leaves, starting from the oldest leaves, and progressing towards the heart (unfurled) leaf was noted in all cases. Leaf necrosis usually started from the apex of a leaf and progressed towards the base thus killing the entire tissue. Leaf spotting on other parts of the leaf blade was also noted, though this type of infection was less common. Dark brown to reddish brown necrotic streaks developed along the leaf veins on young leaves which became visible to the naked eye when they reached about 1mm. With progression of the disease,these streaks developed into dark spindle-shaped lesions 10-20 mm long , often surrounded by a yellow halo. Lesions coalesced under climatic conditions favorable to disease development and killed the entire leaf tissue rapidly. The centers of all lesions turned whitish in colour. In the superhumid zone affected plants often had less than four functional leaves which ultimately lead to emergence of small distorted bunches and prematurely ripening fruits.

The Mycosphaerella Leaf Disease Complex (MLDC) of banana in Mauritius S D Soomary and S P Benimadhu
AMAS 1997. Food and Agricultural Research Council, Réduit, Mauritius
190
DISEASE DEVELOPMENT Disease symptoms persisted on banana plants until August 1995. Thereafter, plants displayed less severe symptoms, infected senescing leaves being replaced by healthy emerging leaves. By the end of December of the same year, banana plantations appeared healthy once more. Leaf scorching appeared again in banana plant as from February 1996 after a prolonged a rainy period accompanied by strong winds. Symptoms persisted on plants until the months of July/August 1996 depending on climatic conditions prevailing in the different agroclimatic zones. Disease incidence was less acute during the months of August to December 1996 when weather conditions were less favorable to disease spread. LABORATORY INVESTIGATIONS Direct examinations of both abaxial and adaxial surface of diseased leaf samples under a Stereo Binocular revealed the absence of perithecia, conidiophores or conidia. Subsequently, labelled leaf samples were incubated using basic moist chamber techniques and kept under the near ultra-violet (n -UV) light for a period of one week in order to induce sporulation. Upon examination a relatively low number of conidiophores or conidia of Mycosphaerella sp were observed per lesions. In light of the above, it could not be ascertained whether the rate at which banana leaves were drying during certain period of the year was attributable solely to the presence of the detected fungal pathogen.
DIAGNOSTIC WORK UNDER AREU/NRI/CIRAD-FLHOR LINK PROGRAMME Collaboration was sought with the Natural Resources Institute (NRI), UK, and Centre de Coopération Internationale en Recherche Agronomique pour le Développement et Département de productions Fruitières et Horticoles (CIRAD-FLHOR), France, in connection with the identity of the causative agent. Labelled samples of diseased leaf tissue (15 cm x 15 cm) were collected, packed in a prescribed manner and dispatched simultaneously to the above institutions in August 1996. As a follow-up, Dr Andrea Johanson of NRI and Dr Xavier Mourichon of CIRAD-FLHOR visited Mauritius in March and April 1997 respectively, with a view to evaluate the status of the disease. In situ observations were carried out by the consultants in various banana plantations and fresh leaf samples were thereby collected and brought to their respective institutions for further investigations. Consequently, this has led to two schools of thought:
• The disease was identified and confirmed as the Black Leaf Streak (Black Sigatoka) disease, caused by Mycosphaerella fijiensis (Paracercospora fijiensis) by Dr Andrea Johanson based on Polymerase Chain Reaction (PCR).
• According to Dr Xavier Mourichon, monoascosporic cultures / single spore isolation of
the Mycosphaerella sp under investigation consistently yielded Septoria-like conidia which were distinguishable from both M. fijiensis and M. musicola. Based on the observed conidial morphology, he confirmed the detection of an undescribed species of Mycosphaerella, similar to the one recently reported from India and South East Asia on banana.

The Mycosphaerella Leaf Disease Complex (MLDC) of banana in Mauritius S D Soomary and S P Benimadhu
AMAS 1997. Food and Agricultural Research Council, Réduit, Mauritius
191
In this paper, we have therefore adopted the term “Mycosphaerella Leaf Disease Complex” (MLDC), to describe the present malady on banana because of the following reasons :
• a leaf spot disease of banana caused by Mycosphaerella musicola is known to occur in Mauritius since 1959 (Orieux and Félix1968)
• no consensus has emerged so far from NRI and CIRAD-FLHOR regarding the identity of the
species of the causal organism(s). • the possibility of co-existence of at least two Mycosphaerella spp in our ecological niche
cannot be excluded. MANAGEMENT OF MLDC OF BANANA Under the present circumstances, it is established with certainty that the primary cause of the disease is of fungal origin, involving Mycosphaerella spp. We are adopting interim control measures as follows: Control of humidity High humidity favours development of the disease complex and can be controlled by modification of the canopy environment through the following: The recommended planting density of 2000 plants per hectare with spacing of 2.5 m x 2 m should not be exceeded as this allows sun rays to reach the soil within the plantation. Maintaining sucker density at a low level (2 - 3 suckers per plant). This allows good ventilation within the plantations enabling the banana plant to thrive better in a well aerated environment. Ensuring a good drainage system, and effecting regular weed control. A dense weed population increases the humidity through transpiration. Sanitation The aim is to reduce the level of inoculum potential through: (i) Removal of plants under stress (e.g. stunted plants or plants infested by banana weevils) (ii) Removal and destruction of hanging leaves (infected or dried up) (iii) Cutting down bearing plants which are severely affected. Fertilizer practice In addition to the recommended fertiliser practice (Appendix 1) a booster dose of Calcium Ammo-nium Nitrate (CAN) at the rate of 60 g per hole, should be applied immediately after clipping of diseased leaves in order to promote rapid leaf emergence. Results of surveys have revealed that more than 50% of banana growers do not regularly apply any fertiliser.

The Mycosphaerella Leaf Disease Complex (MLDC) of banana in Mauritius S D Soomary and S P Benimadhu
AMAS 1997. Food and Agricultural Research Council, Réduit, Mauritius
192
ACTION PLAN In the light of preliminary findings, the MLDC poses a potential threat to the presently expanding banana industry. Therefore, there is an urgent need to develop sound and cost effective control strategies which will consist of the following research modules:
• Establishment of the identity of the causal organism(s).
• Determination of Economic Threshold Levels (ETL).
• Other control options including chemical control strategies with a view to minimize non-target effects.
• Development of treatments through the use of granular application (slow-release)and soil
drenches with emulsifiable concentrate and wettable powder formulations.
• Development of rapid screening techniques for resistance / tolerance to newly introduced germplasm against the disease.
• Epidemiological studies Studies of the life cycle of the pathogen under local environmental conditions Determination of the mode and spread of infection, whether through airborne ascospores or conidia or both, under different agro-climatic situations. Collection of meteorological data for development of an early warning system.
ACKNOWLEDGEMENT The authors express their sincere thanks to Mr S.N.Naidu, Director AREU, Prof. E. Roberts and Mr N.Sobun, RDO, Ministry of Agriculture for their help and encouragement in the preparation of this paper. REFERENCES ORIEUX L and FELIX S. 1968. List of plant diseases in Mauritius. Phytopathological paper No. 7,
C.M.I, Kew, Surrey, England

The Mycosphaerella Leaf Disease Complex (MLDC) of banana in Mauritius S D Soomary and S P Benimadhu
AMAS 1997. Food and Agricultural Research Council, Réduit, Mauritius
193
APPENDIX 1 FERTILISER PRACTICE Basal application At plantation, apply 20 kg of farmyard manure + 500 g of 13:13:20:2 per hole. Top dressing (per hole) 1. Two weeks after plantation, apply 25 g Calcium Ammonium Nitrate (CAN) , every week for 4 consecutive weeks. 2. Eight weeks after plantation: 100 g of 13:13:20:2 every month until flowering. 3. From flowering to harvest: 60 g of Potassium Sulphate + 40 g of Urea or 60 g of CAN every month
COMMENTS Q. Have you contacted the International Mycological Institute for identification of the causal
organism? A. We have not yet isolated the causal organism, as soon as it is done, we will send it to this
organisation. Remark was made that the institution accepts leaf tissue. Q. Have you seen the disease in backyard plants? A. It is not yet at the epidemic stage, it is at the spreading stage. Q. Did you observe the susceptibility of other varieties to this disease? A. We need to carry out studies for existing resistance in other germplasm.

194
195
STUDIES ON BACTERIAL WILT CAUSED BY Ralstonia solanacearum Syn. Burkholderia solanacearum Syn.
Pseudomonas solanacearum on Anthurium andreanum : An Overview
Kiran Banymandhub - Munbodh
Agricultural Research and Extension Unit ABSTRACT The main thrusts of the research work carried out within the framework of an M. Phil. thesis on bacterial wilt caused by Pseudomonas solanacearum on Anthurium andreanum are highlighted in the paper. One hundred and forty isolates from Anthurium andreanum and from other hosts were compared in their cultural, physiological, biochemical and serological properties. The tests confirmed the presence of race 1, biovar 3 of P. solanacearum and showed the homogenous nature of the isolates. Amongst the detection tests carried out, namely enzyme linked immunosorbent assay in microtitre plates (ELISA), immunofluorescence microscopy (IF), latex agglutination test (LAT), nitro-cellulose membrane (NCM-ELISA) and semi-selective plating, the optimal technique combining rapidity, sensitivity and reliability was found to be the NCM-ELISA, detecting over 65 % of latent infection in symptomless plants. It is considered to be the most practical when large numbers of plant samples are to be screened. A soil bioassay involving the 13 soil types of the island identified two types - the Regosols and the Grey Hydromorphic soils - as being highly suppressive to the soil population of P. solanacearum. A sound and practical in-vitro leaf bioassay for evaluating varietal resistance of anthurium germplasm to P. solanacearum, race 1, biovar 3, was developed for the first time. It is considered to be a reliable method for the mass screening of anthurium cultivars. Future avenues of research on the management and control strategies of the bacterial wilt disease are also mentioned. INTRODUCTION In Mauritius bacterial wilt is known to be endemic all over the island, including forest soils and sugar-cane fields (Ricaud and Félix 1971). The first record dates as far back as 1918 on potato and tobacco (Anon 1918). The disease is known to affect about 35 host species in the island (Orieux and Félix 1968) and is of economic importance on potato, tomato, eggplant and anthurium. Oxalis spp, Amaranthus spp, and Phyllanthus spp are among the recorded weed hosts. The disease was first reported on anthurium in 1973 (Anon 1973) but the very first serious onset of bacterial wilt occurred in a shadehouse at Henrietta in 1975 after the severe tropical cyclone “Gervaise” (Autrey, pers. comm.). Subsequently, further work on the bacterial organism, P. solanacearum was initiated at the Mauritius Sugar Industry Research Institute (Ricaud, pers. comm.). Later, Lallmahomed (1978) classified the isolates present on the island as belonging to race1, biovar 3. A decade ago, entire shadehouses were destroyed by the attack of bacterial wilt. Presently, losses encountered cannot be quantified as no reliable data are available, nonetheless grower’s reports emphasise that bacterial wilt is a major problem. Different aspects of the disease have been looked

Studies on bacterial wilt….. K Banymandhub-Munbodh
AMAS 1997. Food and Agricultural Research Council, Réduit, Mauritius
196
into (Autrey et al. 1985; Félix and Ricaud 1978; Lallmahomed 1978) but no detailed studies pertaining to the disease, with particular emphasis on developing rapid detection and control methods, have so far been conducted for anthurium. This study was felt necessary in view of the increasing importance of the anthurium industry which is at present the second most important in the world after the Netherlands. It forms part of the investigations carried out in the framework of a thesis, encompassing various aspects of the bacterial wilt disease on A. andreanum caused by P. solanacearum. AIMS OF THE STUDY Broad objectives were to characterise the pathogen on anthurium with respect to other hosts using biochemical and serological methods whereas the main one was to develop a rapid and sensitive immuno-diagnostic technique for identification and detection of the pathogen. The technique could eventually be applicable to the screening of large numbers of plant samples carrying latent infection, or to soil samples. Concurrently, stringent testing of selected imported germplasm for determination of resistance to the disease was performed. Detection of existing suppressive soils amongst all the soil types of the island was also investigated and epidemiological studies on the disease were undertaken. Lastly, attempts were made to define control measures through the use of certain cultural practices. EXPERIMENTAL INVESTIGATIONS Cultural, Morphological, Biochemical and Physiological Properties of Isolates One hundred and forty isolates from anthurium, potato, tomato and bean were collected from the different agro-climatic zones of the island. Semi-selective and selective media were used for isolation of the pathogen from plant tissues and roots. Investigations on the variability of the pathogen in-vitro by the cultural, physiological, and biochemical studies revealed that all isolates were uniform in their characteristics, irrespective of their hosts or of localities from which they originated. Colony characteristics could not discriminate at the sub-species level and biochemical and physiological tests were used for this purpose. Hayward’s biovar classification (1964); i.e the oxidation and utilization of sugars (lactose and maltose) and hexose alcohols (sorbitol and mannitol) demonstrated that all isolates belonged to biovar 3. Metabolic profile of the bacterial isolates were determined on 95 carbon substrates using the Biolog Identification System (BI System) (Black and Lum 1994). This consisted in recording the percentage of isolates showing positive reactions expressed by the development of a purple colour in microtitre plates pre-coated with the substrates. As identified by Black (pers. comm.) the physiological profiles of the local strains of P. solanacearum corroborated the biovar 3, race 1, standard profiles of the Gram Negative (GN) database. The sensitivity tests endorsed the finding of Hayward (1976) with respect to the homogeneity of the biovar 3 grouping. The biolog test proved to be a powerful and rapid tool for the identification and classification of P. solanacearum by comparison with the lengthy conventional biochemical test lasting for over 28 days. It should be particularly valuable in poorly equipped laboratories in third world countries where bacterial wilt is a major problem.
Diagnosis and Detection The diagnostic and detection techniques have improved in sensitivity and specificity developing from the conventional methods of plating over a medium to the more reliable and potent immuno-enzymatic assays. The use of serology for diagnosing P. solanacearum has been used since a long

Studies on bacterial wilt….. K Banymandhub-Munbodh
AMAS 1997. Food and Agricultural Research Council, Réduit, Mauritius
197
time and has been performed using plant and soil samples (Morton et al. 1966; Digat and Cambra 1976). The emphasis of this study was placed on defining a reliable, rapid and sensitive technique using polyclonal antisera which could be put to practical use for the accurate detection of P. solanacearum. The pathogen is known to give rise to latent infection (Kelman 1953; Ciampi and Sequeira 1980), thus contributing to its massive spread across the globe. Accordingly the following immuno-assays - Immunofluorescence (IF), Latex agglutination (LA), Enzyme linked immunosorbent assays (ELISA) i.e. double antibody sandwich (DAS-ELISA); indirect ELISA, and nitro-cellulose membrane (NCM-ELISA), as well as plating on semi-selective and selective media were screened. The aim was to determine not only the most sensitive method but at the same time, the most practical technique in terms of rapidity and reliability for screening a large number of plant samples carrying latent infection of P. solanacearum. Certain modifications were brought about to the ELISA technique (Clark and Adams 1977) such as decreasing the incubation period as well as the use of an anti-oxidant (Na2SO3) with plant tissues. Pure cultures and diseased as well as asymptomatic plant samples were screened against all the techniques mentioned. The serological studies did not differentiate P. solanacearum into different serovars, again establishing the homogenous nature of the isolates present over the island. The two serological assays namely immunofluorescence staining and nitro-cellulose membrane (NCM-ELISA) were shown to be the most sensitive amongst the immuno assays with detection levels of about 104 cells ml-1 when screening pure cultures. The sensitivity of these two methods corroborated findings reported by Janse (1988) and Lazarovits et al. (1987). Among the immuno assays, DAS-ELISA was found to be less sensitive to IF and NCM-ELISA with a detection threshold varying from 105 to 106 cells ml-1. The DAS-ELISA was considered to be more reliable than the indirect test. Latex agglutination was found to be the least sensitive, the lowest detection threshold limit was 107 cells ml-1. When plant samples were screened, detection of the pathogen varied only with respect to asymptomatic plants. In fact, when the experiments were conducted separately, detection by the nitrocellulose membrane gave a negligibly higher percentage (83%) as compared to the semi-selective plating (80%) and IF (80%). When the techniques were assayed using the same batch of plants, the semi-selective plating was found to be more efficient detecting up to 83.3% of latent infection followed by both IF and NCM-ELISA (66.7%) and lastly by DAS-ELISA. The variability noted between the assays whether conducted separately or in combination may be due to the lower pathogen population sizes in symptomless plants and also to differences in the lower detection threshold amongst the assays. Despite the fact that semi-selective plating was found to be the most sensitive, the technique still entailed culturing the organism followed by testing either culturally or bio-chemically. Clearly, this procedure takes longer than the other techniques. Furthermore, the use of selective media for performing counts of culturable organisms has been reported to give under-estimates of viable cells as not all bacteria are recoverable (Seal and Elphinstone 1994). Moreover, it was found that considerable replication was required in order to obtain reliable counts (Seal and Elphinstone 1994). Notwithstanding the importance of selective plating, the development of a more rapid and practical technique for the detection of P. solanacearum was needed. This requirement was found to rest with the highly applicable and relatively low cost immuno-assays. Latent infection, which remains a crucial issue in the control of P. solanacearum, could be detected successfully by most of the assays but with varying degrees of success. Amongst the immunoassays that have been performed, IF and NCM-ELISA were the most sensitive and detected the highest percentage (66.7%) of latent infection in plant samples. In IF, direct counting of bacterial cells was involved as opposed to the culturing of the bacteria; and the time needed for the test was about 2-3 hours. NCM-ELISA was also a very effective assay, as efficient as IF, and with a slightly higher efficiency than semi-selective plating when performed with independent plant samples.

Studies on bacterial wilt….. K Banymandhub-Munbodh
AMAS 1997. Food and Agricultural Research Council, Réduit, Mauritius
198
The modifications developed for the ELISA assays are valuable. The reduction from a 4h to a 2h incubation period for all the steps involved in the DAS-ELISA assay, as well as a reduction from an overnight to a 3 h incubation for NCM-ELISA, may be safely recommended together with the addition of 0.5 % of Na2SO3 in the extraction buffer to reduce false positives due to the oxidation of plant tissues. DAS-ELISA test could therefore be effected in one day only. With a consequent reduction in the time taken for conducting the NCM-ELISA assay to about 4-5 h, the relative merit of this technique matches that of the IF immunoassay in terms of reliability and rapidity. However, although the IF technique has been categorised as highly sensitive, no discrimination between live and dead cells can be made. Generally, the promising double antibody sandwich ELISA assays namely, IF and NCM- ELISA offer a versatile choice of options. Both are specific and sufficiently sensitive to replace time-consuming and expensive assays especially in poorly supplied laboratories where the workload may prove to be very heavy. Amongst the various detection techniques, the optimal one was unquestionably the NCM-ELISA. Although plating and immunofluorescent microscopy proved to be the most sensitive, the NCM-ELISA was unequalled with respect to the ease-of-use for screening large numbers of plant samples especially for those carrying latent infection. Prospects for the detection of P. solanacearum in soil samples by ELISA are quite promising. But further investigations using all the recommended chemicals as well as polyclonals with inherently high titres should be conducted.
Epidemiology Identification of suppressive soils among the 13 soil types on the island P. solanacearum is known to be one of the most important and lethal soil-borne bacterial pathogens. Conflicting reports have been made, on the longevity of P. solanacearum strains in soil especially in the absence of protected sites (Graham and Lloyd 1979) and on its resistance to desiccation. Soil types have been differentiated as being either conducive or suppressive to bacterial wilt (Hayward 1991); their indirect influence on soil moisture determines the population size of antagonistic micro-organisms which affect, in turn, the persistence of P. solanacearum. The purpose of the research described here was to measure any suppressive activity exerted by the 13 soil types over the island under two different soil moisture regimes (mist-spraying of sterile distilled water weekly or on alternate days) on the survival of P. solanacearum. The general trend observed with all the soil types was towards a decline in the density of P. solanacearum, regardless of moisture conditions supplied. The difference was demonstrated mainly by the rate of decline of the population size of the pathogen. Undoubtedly the pathogen survived much longer under the drier regime. The soils cannot be said to be conducive to the multiplication of P. solanacearum as, at no point in time, was the recrudescence of the bacteria noted. Nonetheless, the persistence of the pathogen in the soil was demonstrated. In fact, two soil types were shown to be strongly suppressive to the pathogen - the Regosols and the Grey Hydromophic soils. The other soils were considered to be tolerant to P. solanacearum as the disease reappeared in the soil bioassay effected at the end of the trial. The effect of dry conditions on pathogen population size was reported by Sequeira (1963). Dry regimes favour the persistence of P. solanacearum as reported by Nesmith and Jenkins (1985) who found that soil moisture promoted the development of micro-organisms lethal to the P. solanacearum. Different soil types have different soil moisture retention capacities; these determine the size of the antagonistic populations which affect the survival of P. solanacearum. These findings are compatible with observations made on the hydromorphic soils. The Grey Hydromorphic soils or bog soils have been formed as a result of periodical water-logging and get sticky and plastic when wet (Parish and Féillafé 1965). The hydromorphic characteristics of these soils coupled with a high organic matter content result in high water retention capacity which supplies ideal conditions for antagonistic micro-

Studies on bacterial wilt….. K Banymandhub-Munbodh
AMAS 1997. Food and Agricultural Research Council, Réduit, Mauritius
199
organisms to multiply. Consequently this contributes to the decline in the population size of the pathogen. Regosols are azonal soils with wind-blown coral as the parent material; they are highly alkaline soils with a pH of 8.5; they were found to be strongly suppressive to the pathogen as reported by Power (1983) who observed that bacterial wilt was absent on sea-shell ridges containing soils having a high level of calcium resulting in an alkaline pH. Soil types plausibly play a much more important role, as they undoubtedly influence soil moisture. As suggested by Moffet et al. (1983), the slower decline in soils high in clay particles may be explained from the fact that P. solanacearum may get adsorbed on these clay particles conferring protection to the pathogen from microbiostasis which would favour its survival. This suggestion is compatible with our findings as most of our soils consist of silty clays.
In vitro leaf bioassay for the evaluation and screening of A. andreanum germplasm Recent workshops have emphasised the need for improved screening techniques to evaluate promising and resistant germplasm (Hayward 1991). The rationale underlying the leaf bioassay and the scaling system was to develop and devise a rapid and reliable technique for the varietal screening of newly introduced anthurium germplasm. Several cultivars were evaluated by dip-inoculating the leaves of the plants in standard solutions of P. solanacearum obtained from different hosts; disease ratings were attributed as the disease progressed. The results showed that the system was quite sound and reliable. Consequently, this could form the basis of a sound and simple screening technique for anthurium cultivars against the bacterial wilt disease. CONCLUSION The soil bioassay has established certain soil types as being inherently suppressive to the persistence of P. solanacearum in the soil rhizosphere. Hence, investigations should be pursued on the effect of mixing these soil types, either alone or in combination, in different ratios with the components of the planting media; this could help in managing and checking the progress of bacterial wilt as total control appears unlikely. The biolog identification system has proved to be a reliable tool for the rapid identification of P. solanacearum especially in poorly equipped laboratories. The production of polyclonals with a higher antiserum titre and with the necessary chemicals will make soil detection a realistic objective to attain via the immunodiagnostic techniques mentioned. Further investigations should be carried out to understand the host-pathogen interaction so as to enable safer and larger production of the popular cut flower and to safeguard a crop which is the front banner of horticulture in Mauritius. ACKNOWLEDGEMENTS I would like to extend my thanks to my supervisors, Late Professor Robert Antoine, Dr J.C. Autrey and Mr S. Saumtally for their advice and guidance throughout the period of my study. My thanks also to the Food and Agricultural Research Council and the Tertiary Education Commission for the research grants as well as the Mauritius Sugar Industry Research Institute for the honorary attachment which enabled me to pursue my studies for an M.Phil. degree. I would like to express my thanks to Mr S.N. Naidu, Director, Agricultural Research and Extension Unit for granting me the opportunity to present this paper and to Mr. S. Benimadhu, Head, Plant Pathology Division, for reviewing the manuscript.

Studies on bacterial wilt….. K Banymandhub-Munbodh
AMAS 1997. Food and Agricultural Research Council, Réduit, Mauritius
200
REFERENCES ANON . 1918. Annual Report, Department of Agriculture, Mauritius, p. 2. ANON. 1973. Annual Report, Department of Agriculture and Natural Resources, Mauritius, p. 14. AUTREY LJC, FERRE P and RICAUD C. 1985. Prospects of increasing potato production in
Mauritius with clones introduced through the International Potato Centre. Acta Horticulture 153. 295-302.
BLACK R and LUM KY. 1994. An integrated system for identification and characterisation of plant
pathogenic bacteria with special reference to Pseudomonas solanacearum. In: MEHAN VK and MC
DONALD D ed. Bacterial Wilt in Asia. Proc. 3rd Working gp. meeting, 4-5 July 1994, ICRISAT. CIAMPI LP and SEQUEIRA L. 1980. Multiplication of Pseudomonas solanacearum in resistant
potato plants; establishment of latent infections. American Potato Journal. 57: 319 -329. CLARK MF and ADAMS AN. 1977. Characteristics of the microplate method of enzyme linked
immunosorbent assay for the detection of plant viruses. J. Gen. Virol. 34 : 475-483. DIGAT B and CAMBRA M. 1976. Specificity of antigens in Pseudomonas solanacearum (E.F.
Smith) and application of serology for studying bacterial wilt. p. 38-57. In: SEQUEIRA L and KELMAN A eds. Proc. 1st Int. Plann. Conf. Workshop Ecol. Control Bact. Wilt. Raleigh, North Carolina State University, U.S.A. 18-24 July 1976.
FELIX S and RICAUD C. 1978. A practical method for the assessment of bacterial wilt potential of
soils in Mauritius. p. 139-159. In : CIP. Pathogen and pests of the potato in the tropics. Proceedings 2nd Reg. Symposium on pathogen and pests of the potato in the tropics. Los Banos Philippines, CIP.
GRAHAM J and LLOYD AB. 1979. Survival of potato strain (race 3) of Pseudomonas solanacearum
in the deeper soil layers. Aust. J. Agric. Res. 30 : 489-496. HAYWARD AC. 1964. Characteristics of Pseudomonas solanacearum. J. Appli. Bacteriol. 27 :265-
277. HAYWARD AC. 1976. Some techniques of importance in the identification of Pseudomonas
solanacearum. p. 137 - 142. In : SEQUEIRA L and KELMAN A eds. Proc. 1st Int Plann. Conf. Workshop. Ecol. Control Bact. Wilt, Raleigh, North Carolina State University U.S.A, 18 - 24 July 1976.
HAYWARD AC. 1991. Biology and epidemiology of bacterial wilt caused by Pseudomonas
solanacearum. Ann. Rev. Phytopathol. 29: 65 - 87. JANSE JD. 1988. A detection method for Pseudomonas solanacearum in symptomless potato tubers
and some data on its sensitivity and specificity. Bulletin OEPP 18 : 343 - 351. KELMAN A. 1953. The bacterial wilt caused by Pseudomonas solanacearum. NC Agric. Exp. Sta.
Tech. Bull. 99 : 194 LALLMAHOMED GM. 1978. Strain variation of Pseudomonas solanacearum (E.F. Smith) in
relation to the epidemiology of bacterial wilt in Mauritius. PhD Thesis. University of Ibadan, 230p.

Studies on bacterial wilt….. K Banymandhub-Munbodh
AMAS 1997. Food and Agricultural Research Council, Réduit, Mauritius
201
LAZAROVITS G, ZUTRA D and BAR-JOSEPH M. 1987. Enzyme linked immunosorbent assay on nitrocellulose membranes (dot-ELISA) in the serodiagnosis of plant pathogenic bacteria. Can. J. Microbiol. 33 : 98-103.
MOFFET ML, GILES JE and WOOD BA. 1983. Survival of Pseudomonas solanacearum biovar 2
and 3 in soil : effect of moisture and soil type. Soil Biol. Biochem. 15 : 587 - 91. MORTON DJ, DUKES PD and JENKINS SF. 1966. Serological relationships of races 1, 2 and 3 of
Pseudomonas solanacearum. Pl. Dis. Rep. 50 : 275-277. NESMITH WC. and JENKINS SF. Jr. 1985. Influence of antagonists and controlled matric potential
on the survival of Pseudomonas solanacearum in 4 North Carolina soils. Phytopathol. 75 (11) : 1182-1187.
ORIEUX L and FELIX S. 1968. List of plant diseases in Mauritius. Phytopathological papers No 7,
CMI, Kew, Surrey, England. PARISH DH and FEILLAFE SM. 1965. Notes on the 1:100 000 soil map of Mauritius . MSIRI
Occasional paper No. 22. Reduit : Mauritius Sugar Industry Research Institute. POWER RH. 1983. Relationship between the soil environment and tomato resistance to bacterial wilt
(Pseudomonas solanacearum): 4. Control Methods. De Surinaamse landbouw 31: 39-47. RICAUD C and FELIX S. 1971. Priv. Circ. Rep. Sug. Ind. Res. Inst. Mauritius Réduit : Mauritius
Sugar Industry Research Institute. 29p. SEAL SE and ELPHINSTONE JG. 1994. Advances in identification and detection of Pseudomonas
solanacearum. p. 35-57. In: HAYWARD AC and HARTMAN GL eds. Bacterial Wilt :The disease and its causative agent, Pseudomonas solanacearum. . Wallingford, U.K. : CAB. International.
SEQUEIRA L. 1963. Growth regulators in plant disease. Ann. Rev. Phytopathol. 1 : 5-25.

202

AMAS 1997. Food and Agricultural Research Council, Réduit, Mauritius
203
AN AREA WIDE CONTROL OF FRUIT FLIES IN MAURITIUS
S Permalloo, S I Seewooruthun, A Joomye, A R Soonnoo,
B Gungah, L Unmole and R Boodram
Ministry of Agriculture, Fisheries and Cooperatives ABSTRACT A pilot programme to control 5 species of fruit flies started in April 1994 targeted over an area of 600 km2 in the North and East of Mauritius. The programme included monitoring, experimentation, quarantine, extension .and control operations. It has proved to give effective control using Bait Application Techniques, followed by Male Annihilation Techniques as demonstrated by the reduced adult catches in traps and lower fruit infestations. However, it had to be temporarily disrupted by the accidental introduction of the Oriental fruit fly, Bactrocera dorsalis in June 1996. INTRODUCTION Fruit flies (Diptera, Tephritidae) cause large losses to fruits throughout the world, and are recognised today as major insect pests of the horticultural industries (Permalloo 1989). Their significance is further increased by a growing international trade (Drew and Allwood 1997). Fruit fly problems in Mauritius date back to the beginning of this century (Orian and Moutia 1960). Fruit flies have been the subject of experimentation and control for many years (Hammes 1980; Anon 1983, Anon 1996; Landell Mills 1991). Despite an intensive programme of biological control (Hammes 1980), a long term method of control: the Sterile Insect Release Method (Hammes 1980) and the use of insecticides on backyard gardens (Anon 1985), the high fly populations and the abundance of fruits throughout the year combined to maintain the status of the fruit flies as the major pests of cultivated fruits. Fruit flies of fleshy fruits of economic importance to mauritian agriculture are, in order of importance, the Peach fruit fly, Bactrocera zonata (Saunders), the Natal fly, Ceratitis (Pterandrus) rosa Karsch, the Medfly, Ceratitis capitata (Wiedemann) and the Ber fruit fly, Carpomya vesuviana Costa. The first three species attack a long list of fruits; the preferred cultivated hosts are peach, sweet guava, loquat and bullock’s heart while the most heavily attacked wild fruits are Indian almond and Chinese guava. Finally, the last mentioned species, C. vesuviana is specific to jujube. Fruit flies can be controlled effectively by regular applications of cover sprays using insecticides (Anon 1986); however, this method of control may be detrimental to beneficial insects such as bees, other pollinators, and could also cause environmental pollution. Moreover, the Sterile Insect Release Method would not then be appropriate (Hooper 1986; Lindquist 1988). A team of consultants in the context of the Agricultural Diversification Programme for increased fruit production conducted a feasibility study and recommended the implementation of The National Fruit Fly Control Programme (NFFCP). The programme aims at controlling fruit fly infestations over a large area by the use of Bait Application Technique (BAT), followed by Male Annihilation Technique (MAT). The first phase (BAT) would bring down the fruit fly populations to very low levels and the second phase (MAT) would maintain the populations at these low levels. The NFFCP which is jointly funded by the European Union and the Government of Mauritius, started operations in April 1994 and was due to run for three years. However, as the programme was

An area wide control of fruit flies in Mauritius S Permalloo et al.
AMAS 1997. Food and Agricultural Research Council, Réduit, Mauritius
204
disrupted by the accidental introduction of the Oriental fruit fly, Bactrocera dorsalis (Hendel), the programme is now scheduled to end in December 1997. The main fruit fly pest of vegetables, the Melon fly, Bactrocera (Dacus) cucurbitae (Coquillett) was not originally included in the programme; however, following the insistence of cucurbit growers, it had to be included. The substantial reduction of B. cucurbitae populations by BAT enabled record harvests of cucurbits to be achieved. The programme has a major experimentation component to back up control operations and also includes monitoring, quarantine and extension. CONTROL OPERATIONS BAT and MAT are being used for suppression of populations of fruit flies in the districts of Flacq, Pamplemousses and Rivière du Rempart. These two methods were selected because they are safe, cheap, and require very simple equipment for their application. Selection of the geographical area of application was motivated by several factors; the main ones being cost and logistics; this area covers 600 km2 and represents about one third of the country's total area; it accounts for 40 % of National fruit production by about 54000 planters, and it has a good road network; it also divides the country by a clean demarcation line into treated and untreated areas. Each district was divided into 3 zones and each zone was visited by a team; the team was composed of a supervisor and 10 men for spraying; each team was allotted a van for its movements . Thirteen vehicles are attached to the Programme and around 150 persons are involved full time in its implementation (Soonnoo et al. 1995). Bait Application Technique Bait sprays using Malathion 57% Emulsifiable Concentrate (EC) provide a high degree of fruit fly control and provide an advantageous substitute for traditional insecticide cover sprays which are rather costly and hazardous to the environment (Jenkins and Sheldy 1959, Allwood 1989, CDFA 1994). A mixture of water (carrier), protein hydrolysate (a food attractant), and Malathion 57 EC (insecticide) in the ratio of 98.6 : 0.7 : 0.7 is used, at a rate of less than 2 l mixture per hectare (including < 8 gm of Malathion). This method is relatively safe to non-target insects and is also less polluting to the environment than cover sprays, as it produces very little spray drift and very little chemical residue. The solution is applied at the rate of 40 ml as a coarse spot spray to the undersides of foliage. The first phase of the project started in April 1994 and all the regions within the targeted area were systematically sprayed. Male Annihilation Technique After reducing the fly populations to very low levels using the area-wide protein bait spray, the second phase (MAT), was implemented. MAT uses parapheromones in lure blocks to mass-trap males, thereby reducing the mating success of females. It is hoped that MAT, which kills only males, as opposed to BAT which kills both sexes, will maintain the fly populations at these very low levels. In the MAT phase, 12 mm thick plywood blocks 50 mm x 50 mm were impregnated with Methyl eugenol (67 %), Trimedlure (62 %), Cuelure (67 %) and Malathion 57 EC and these blocks were nailed on fruit trees. Methyl eugenol attracts males of Peach fruit fly; trimedlure targets the Natal fly and Medfly while Cuelure attracts the Melon fly. These killer blocks are placed at 50 m intervals in isolated areas and at 33 m in built-up areas; this is equivalent to 4 blocks per hectare and 9 blocks per hectare respectively. After MAT was completed in the Flacq district, it was extended to Moka district and the other two districts but had to be temporarily discontinued following the accidental introduction of the Oriental fruit fly in June 1996. For control of the Ber fly for which no pheromones are known, BAT is carried out during the jujube fruiting season.

An area wide control of fruit flies in Mauritius S Permalloo et al.
AMAS 1997. Food and Agricultural Research Council, Réduit, Mauritius
205
Accidental introduction of Bactrocera dorsalis When the oriental fruit fly Bactrocera dorsalis Hendel was detected, 50% of the personnel of the NFFCP was shifted to the South for intensive bait spraying and placement of killer blocks. All the personnel have returned gradually when additional workers were provided by the Ministry. MONITORING Continuous monitoring of larval and adult fly numbers are carried out to assess the effectiveness of the programme. The main methods used are : collection of fruit samples to determine fruit infestation and collection of adult male fruit flies from a trap monitoring grid for population studies (Hammes 1980; Jang et al. 1994; Permalloo 1989). Two years prior to the beginning of the programme a series of traps using each of the three main lures was placed around the country. To date, over 1100 traps are serviced at fortnightly intervals. EXTENSION Extension work was carried out to publicise the programme. Letters to householders, display boards, talks in schools, posters, stickers, and a video film, have been used to create public awareness. QUARANTINE Quarantine procedures are necessary to ensure that exotic pests do not enter a geographic location where they do not currently exist. A trap grid, using all available lures, has been placed at the port and airport for the detection of any new fruit fly pest. The division also works in close collaboration with the quarantine section of the Ministry to prevent the entry of new pests. Pantry refuse which include raw fruits and vegetables are collected and incinerated. Moreover a quarantine bin has been placed at the airport to allow unaware incoming passengers to discard fresh fruits and vegetables, following an announcement on the plane. EXPERIMENTATION The NFFCP incorporates a major experimentation component to develop, test and refine the control techniques used in field operations. The exhaustive list of experimentation trials carried out would be difficult to enumerate here. The following are mentioned briefly: Dosage of Protein hydrolysate (pH) for BAT sprays Several dosages were tested both in the field and as bioassay trials. It was found that 0.7 % can be used for area wide control as opposed to 3 % in individual backyards. For example, 3 % pH gives up to 90% control in jujube, when carried out regularly.

An area wide control of fruit flies in Mauritius S Permalloo et al.
AMAS 1997. Food and Agricultural Research Council, Réduit, Mauritius
206
Dosage of Malathion 57 EC for BAT After several trials 0.7% was recommended for area-wide control and 1% for small scale situations. Side effect of BAT sprays
A BAT catcher, 1m x 1m x 1 m with a funnel at the bottom was manufactured locally for this trial (Landell Mills 1995). BAT specifically attracts fruit flies; unfortunately some non-target insects are also sometimes killed, e.g. a few parasitic hymenoptera and some ladybird beetles. Alternate sources of protein hydrolysate Brewery waste (obtained by courtesy of the Mauritius Breweries Limited) was tested as a replacement for the expensive and imported Protein hydrolysate. Neutralised brewery waste (NBW) gave the best catch at 12.5%. In fact, this material is being extensively used in the current B. dorsalis eradication campaign. Ammonium Chloride (AC) at 2% gives positive results and also attracts all species of fruit flies present. Trials on MAT blocks Several types and sizes of locally available products for MAT blocks (courtesy of Grewals Limited) were tested. Plywood proved to be the best available and was therefore selected. When soaked for a minimum of 7 days, plywood blocks 50 mm x 50 mm x 12 mm absorb 6 gms of commercial lures and 1 gm of poison. MAT blocks continue to attract flies after 1 year but are at their maximum efficiency during the first four months. MAT catchers are placed under lure blocks to collect dead flies for assessment of efficiency; these are made of inverted plastic drink bottles with their tops cut off and fitted with a bag attached at the neck level (Landell Mills 1995).Initial trials also showed that results were improved when two separate Mat blocks were used : one with Methyl eugenol alone and the other incorporating both Trimedlure and Cuelure. Trials using McPhail traps McPhail traps, containing 200 ml of mixture solution using 5 % Protein Hydrolysate,12.5 % neutralised brewery waste and 2 % ammonium chloride respectively were used to control fruit flies in a village trial in Camp Carol. In fact, the first B. dorsalis was detected in one of those traps. McPhail traps are also being used to monitor the Ber fly population. RESULTS AND CONCLUSION The effectiveness of control in the targeted area has been demonstrated by a reduction of larval infestation in both wild and cultivated fruits, and by a simultaneous decrease in both fruit fly populations and fruit infestation levels (Table 1). It was possible to harvest uninfested fruits like peach, loquat and jujube which are known to be highly susceptible to fruit flies.

An area wide control of fruit flies in Mauritius S Permalloo et al.
AMAS 1997. Food and Agricultural Research Council, Réduit, Mauritius
207
Table 1 % Fruit Infestation Figures for the Districts of Pamplemousses, Rivière du Rempart and Flacq
Indian Almond GuavaPeriod 1993 1994 1995 1996 1997 1993 1994 1995 1996 1997 1993 1994 1995 1996 1997 1993 1994 1995 1996 1997
Flacq Pamp & R du Rempart Flacq Pamp & R du RempartJan - 9 13 - - 3 21 44 - - - - - - - 33Feb - 13 27 30 - 1 14 36 - 23 33 50 - 7 64 27Mar - 11 20 26 - 28 18 31 - 5 29 39 - 14 56 44Apr - 30 22 30 - 13 20 34 - - 17 28 - 22 17 39May 34 30 17 24 34 13 13 22 0 4 25 39 0 11 12 37Jun 4 40 33 39 4 15 13 26 - 2 0 20 11 - 2 0 0 47Jul 100 11 35 52 100 11 23 1 - 0 - - - 0 0 -
Aug 100 13 37 - 100 13 11 39 - 4 0 - - 4 0 -Sep - 14 - 9 - 14 42 35 - 2 - - - 2 - -Oct - 0 - - - 0 89 38 - 0 - - - 0 100 -Nov - 43 - 22 - 43 - 63 - - - - - - - -Dec - 0 - - - 0 - - - - 0 - - - 0 -
Mango MassonPeriod 1994 1995 1996 1997 1994 1995 1996 1997 1994 1995 1996 1997 1994 1995 1996 1997
Flacq Pamp & R du Rempart Flacq Pamp & R du RempartJan 50 2 41 0 50 2 8 33 - - - - - - - -Feb - 7 12 29 - 7 6 31 - - - - - - - -Mar - 15 13 - 15 5 20 - - - - - - - -Apr - - - - - - - - - - 13 - - - -May - - - - - - - - - 25 0 - - 25 7 -Jun - - - - - - - - 5 3 1 - 5 3 17 -Jul - - - - 0 - 1 1 2 1 1 11
Aug - - - - - - 0 2 - 0 2 -Sep - - - 0 14 0 1 - 0 1 -Oct 6 - 39 6 0 31 0 - - 0 - -Nov 0 2 17 0 6 20 - - - - - -Dec 1 3 29 1 5 14 - - - - - -
During the period July 1994 - July 1996 trap captures in the treated zones were lower for B. zonata indicating the good level of control achieved for this species which is known to be the most prevalent on the island (Figure 1).
Jan-93 Jul-93 Jan-94 Jul-94 Jan-95 Jul-95 Jan-96 Jul-96 Mar-97 Dec-970.00
0.01
0.10
1.00
10.00
100.00
Flie
s /
trap
/ da
y
Untreated Treated as from April 1994
Figure 1 Captures of Bactrocera zonata in Methyl eugenol traps in untreated and treated zones
The population of Ceratitis capitata and Ceratitis rosa were already at a low level at the start of treatment and trap catches did not show marked differences in treated and untreated zones (Figures 2, 3). The accidental introduction of the oriental fruit fly, B. dorsalis in June 1996 caused a disruption in the programme as resources and logistics had to be used to eradicate this new pest. Larval infestations and adult populations rose slightly during the period November 1996 and June 1997. After the resumption of normal operations, the fruit fly populations in targeted regions gradually decreased and there was no difference in fruit infestation levels in the three districts (Flacq, Pamplemousses and Rivière du Rempart Table 1). This has been confirmed by a recent study (Burn 1997).
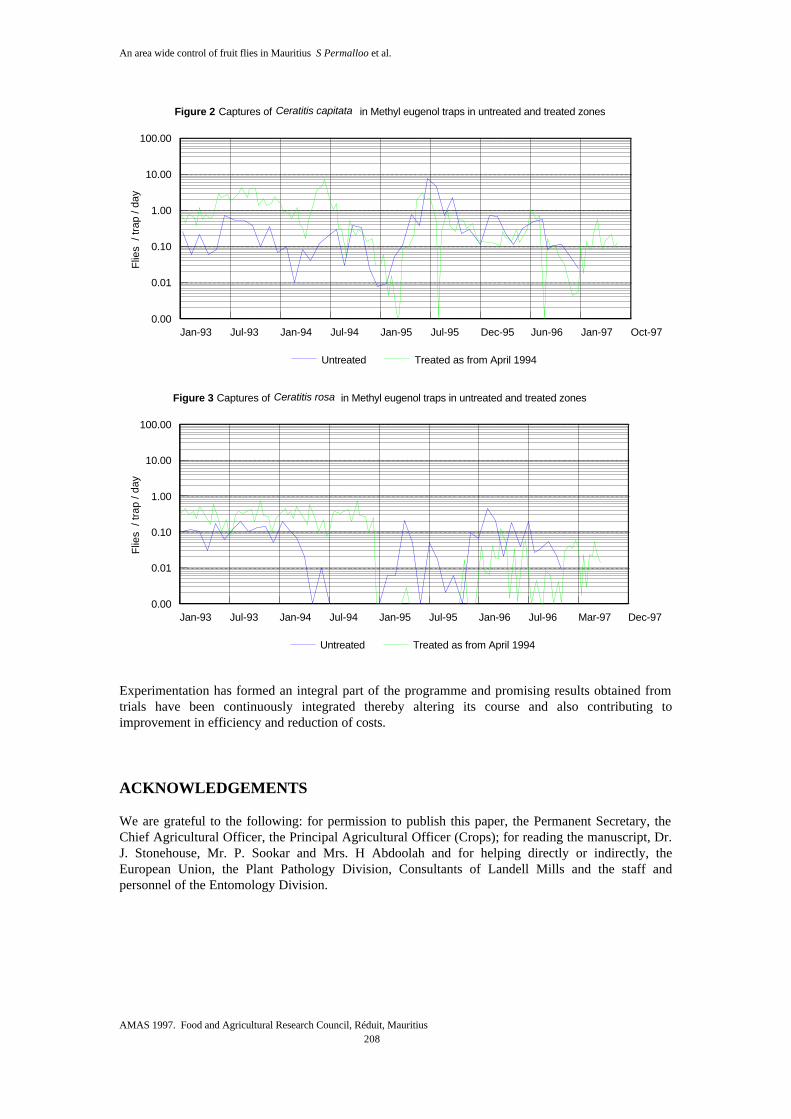
An area wide control of fruit flies in Mauritius S Permalloo et al.
AMAS 1997. Food and Agricultural Research Council, Réduit, Mauritius
208
Jan-93 Jul-93 Jan-94 Jul-94 Jan-95 Jul-95 Dec-95 Jun-96 Jan-97 Oct-970.00
0.01
0.10
1.00
10.00
100.00F
lies
/ tr
ap /
day
Untreated Treated as from April 1994
Figure 2 Captures of Ceratitis capitata in Methyl eugenol traps in untreated and treated zones
Jan-93 Jul-93 Jan-94 Jul-94 Jan-95 Jul-95 Jan-96 Jul-96 Mar-97 Dec-970.00
0.01
0.10
1.00
10.00
100.00
Flie
s /
trap
/ da
y
Untreated Treated as from April 1994
Figure 3 Captures of Ceratitis rosa in Methyl eugenol traps in untreated and treated zones
Experimentation has formed an integral part of the programme and promising results obtained from trials have been continuously integrated thereby altering its course and also contributing to improvement in efficiency and reduction of costs. ACKNOWLEDGEMENTS We are grateful to the following: for permission to publish this paper, the Permanent Secretary, the Chief Agricultural Officer, the Principal Agricultural Officer (Crops); for reading the manuscript, Dr. J. Stonehouse, Mr. P. Sookar and Mrs. H Abdoolah and for helping directly or indirectly, the European Union, the Plant Pathology Division, Consultants of Landell Mills and the staff and personnel of the Entomology Division.

An area wide control of fruit flies in Mauritius S Permalloo et al.
AMAS 1997. Food and Agricultural Research Council, Réduit, Mauritius
209
REFERENCES ALLWOOD A. 1989. Use of protein bait for fruit fly control. Agnote, 2 p. ANON. 1983. The Natal fruit fly project. Annual Report, Entomology Division, Ministry of
Agriculture, Fisheries and Natural Resources, Reduit, Mauritius.( unpublished ) ANON. 1985. Control of fruit flies. Annual Report of the Ministry of Agriculture, Fisheries and
Natural Resources for the year 1982, Reduit, Mauritius, p. 51. ANON. 1986. Chemical control of fruit flies. Annual Report, Entomology Division, Ministry of
Agriculture, Fisheries and Natural Resources, Reduit, Mauritius.( unpublished ) ANON. 1996. National fruit fly control programme : Experimentation. Annual Report, Entomology
Division, Ministry of Agriculture, Fisheries and Natural Resources, Reduit, Mauritius. (Unpublished )
BURN RW. 1997. National Fruit Fly Control Programme. Report on data collection and analysis.
Technical Assistance to the Entomology Division of the Ministry of Agriculture and Natural Resources.
CALIFORNIA DEPARTMENT OF FOOD AND AGRICULTURE 1994. The exotic fruit fly
eradication program using aerial application of malathion and bait. Final Environmental Impact Report. State Clearinghouse Number 1043018. US : California Department of Food and Agriculture.
CDFA see under California Department of Food and Agriculture DREW D and ALLWOOD A. 1997. Fruit fly control: Arrest of a new pest. Partners (10). HAMMES C. 1980. Projet de lutte contre la mouche du Natal Pterandrus rosa (Karsch), Diptera,
Trypetidae à l’Ile Maurice. France : CIRAD. HOOPER GHS. 1986. A review of the fruit fly problem in Mauritius. International Atomic Energy
Agency. ( IAEA / Government of Mauritius SIT Project Report ). JANG EB, LIGHT DM, BIDER RG, FLATH RA and CARVALHO LA. 1994. Attraction of female
Mediterranean fruit flies to the major components of male-produced pheromone in a laboratory flight tunnel. Journal of Chemical Ecology 20 ( 1 ) .
JENKINS CFH and SHELDY DG. 1959. The Mediterranean fruit fly. The Journal of Agnote of
Western Australia 8 (5) (Third series). LANDELL MILLS. 1991. Fruit fly control in Mauritius. Bath, UK : Landell Mills Ltd. for
Government of Mauritius. LANDELL MILLS. 1995. Experimentation consultancy report. Bath, UK : Landell Mills Ltd. for
Government of Mauritius. LINDQUIST DA. 1988. Mission report. International Atomic Energy Agency. ORIAN AJE and MOUTIA LA. 1960. Fruit flies (Trypetidae) of economic importance in Mauritius.
Revue Agricole et Sucrière de L’Ile Maurice 38. PERMALLOO S. 1989. Biological and taxonomic studies on parasitoids associated with some
Tephritidae (Diptera). PhD Thesis. University of Wales, UK.

An area wide control of fruit flies in Mauritius S Permalloo et al.
AMAS 1997. Food and Agricultural Research Council, Réduit, Mauritius
210
SOONNOO AR, SMITH ESC, JOOMAYE A, PERMALLOO S. and GUNGAH B. 1995. A large scale fruit fly control programme in Mauritius. p. 52 - 60. In : CHUA TH and KHOO SG eds. Problems and Management of Tropical Fruit Flies, Proceedings of Workshop, University of Malaysia.
COMMENTS Q. Given that the oriental fly is of quarantine importance, did you consider restricting the
movement of fruits from the South to other regions? A. This question was raised but it was difficult to put into practice. To counteract, cover sprays
were carried out in the south for mangoes, to prevent reinfestation.

AMAS 1997. Food and Agricultural Research Council, Réduit, Mauritius
211
AN ATTEMPT AT THE ERADICATION OF THE ORIENTAL FRUIT FLY, Bactrocera dorsalis (HENDEL) FROM MAURITIUS
S I Seewooruthun, P Sookar, S Permalloo, A Joomaye, M Alleck, B Gungah and A R Soonnoo
Ministry of Agriculture, Fisheries and Co-operatives
ABSTRACT The Oriental Fruit Fly, Bactrocera dorsalis was detected for the first time in Mauritius in June 1996. It is recognised as one of the most destructive fruit fly pests in the world. Timely detection of this serious pest prompted the adoption and application of measures to contain B. dorsalis with a view to its eradication. The main methods of control used are the Bait Application and Male Annihilation Techniques. B. dorsalis is presently contained within an area of about 150 km2 in the south of Mauritius. Measures are being continued in order to achieve eradication.
INTRODUCTION A few species of fruit fly (Diptera, Tephritidae) pests of fleshy fruits and vegetables have existed in Mauritius for several decades. Other species have been accidentally introduced since the early 1950's. The Natal Fly, Ceratitis rosa, was recorded in 1953 and displaced the existing Ceratitis capitata (Orian and Moutia 1960). Bactrocera zonata was detected in 1987 (MAFNR 1987), and in turn, displaced C. rosa, to become the most economically important fruit fly of fleshy fruits (MAFNR 1990).This phenomenon has been observed in other countries where introduced species have displaced existing ones. In India, B. dorsalis and B. zonata have reduced Ceratitis capitata to insignificant levels (Kapoor and Grewal 1986). Another exotic species, Carpomya vesuviana, which is specific to jujube, was recorded in Mauritius in 1986 (MAFNR 1986). All the introduced species are now part of the Mauritian fruit fly complex. The Oriental Fruit Fly, Bactrocera dorsalis, was detected for the first time in Mauritius, on 5 June 1996 (MAFNR 1996). A single female fly was collected at Camp Carol, a village about one kilometre from the airport, in a McPhail trap baited with ammonium chloride. This early detection was due to the fact that traps have been placed throughout the island, in the context of an area wide programme for the control of fruit flies (Soonnoo et al. 1995; Permalloo et al. 1997). The control programme, funded jointly by the European Union and the Government of Mauritius, is operational in the North and North East of the island, and also includes research and quarantine. Traps have thus been set to cover the island for monitoring of adult populations, at port and airport for surveillance and at different sites for experimentation. After the first detection, the fly was sent to the International Institute of Entomology for confirmation. A series of actions were applied in the village of Camp Carol, the main ones being the Bait Application Technique (BAT) and the Male Annihilation Technique (MAT). Subsequently, B. dorsalis was again recorded in low numbers as from 18 July 1996 in other regions in the Southern districts of Mauritius.

An attempt at the eradication of the oriental fruit fly, Bactrocera dorsalis ( Hendel) S I Seewooruthun et al.
AMAS 1997. Food and Agricultural Research Council, Réduit, Mauritius
212
Rationale for Attempting Eradication B. dorsalis is recognised as one of the most damaging fruit fly pests in the world, especially due to its very wide host range, high reproductive potential, high mobility and adaptability to climate. Its presence in Mauritius is the first record from the African region and its establishment in Mauritius would be a serious threat to nearby countries. The occurrence of B. dorsalis in Mauritius is an obstacle for the promotion of export of fruits and vegetables. In fact, a ban was imposed on the exportation of small green chillies to Réunion Island. This ban has very recently been lifted because the chilly production areas have been considered pest free due to the quarantine measures taken to contain B. dorsalis in a restricted area in the south of the island, a reasonable distance away. MATERIALS AND METHODS The two Southern districts, Grand Port and Savanne, comprise an area of about 420 km2. As detection of B. dorsalis progressed to other villages of the South, the eradication area was extended to about 300 km2,out of which about 10% was calculated to harbour probable host plants. Measures taken for the containment of B. dorsalis The main methods being used for the control and containment of B. dorsalis are the Bait Application and Male Annihilation techniques. BAT is directed at killing both male and female flies whereas MAT attracts and kills male flies through the use of parapheromones. Both methods are at present being used in the area wide programme to control fruit flies in the North and North East (Soonnoo et al. 1995; Permalloo et al. 1997). MAT has been successfully used for control (Cunnigham and Suda 1986) and eradication of B. dorsalis in a number of cases. Eradication with MAT was first achieved on Rota Island in 1963 (Steiner et al. 1965), and later in the Okinawa Islands in 1982 (Koyama et al. 1984). MAT has also been applied successfully together with sterile insect releases in the Mariana Islands (Steiner et al. 1970). Presently, BAT and MAT are being used in Australia in the eradication programme of the Papaya Fruit Fly, Bactrocera papayae from North Queensland (Jang et al. 1996). BAT has also been used in eradication programmes, on its own, or, in combination with other methods. BAT is frequently used to eradicate exotic species entering California, and bait applications are used with sterile releases for eradication of the Mexican Fruit Fly from California and the Medfly from Florida (CFDA 1994). BAT and sterile releases have also been used for the eradication of Queensland fruit fly, Bactrocera tryoni, from Adelaide, Australia ( Reynolds et al. 1995). For the present eradication programme of B. dorsalis, BAT and MAT are reinforced with other measures. BAT consists of applying spot sprays of 40 ml of a mixture of 2% protein hydrolysate and 0.7% malathion 57 EC in water, at the rate of 200 spots per hectare. Neutralised brewers waste is also being used instead of commercial protein hydrolysate (Permalloo et al. 1997). Each round of BAT is completed in seven days except in detection areas where it is reinforced and effected every four days for a period of one month. For the Male Annihilation Technique, plywood blocks (50mm x 50mm x 12mm) incorporated with about 6 g of 67% methyl eugenol and 1 g of malathion 57 EC are fixed onto the trunk of fruit or other trees at the rate of 10 to 14 per hectare. These blocks are being placed since July 1996, each round taking two to two and a half months. The frequency of both BAT and MAT has been increased in the eradication programme, as compared to the wide area control programme, for maximum efficacy and to keep the fly population under constant pressure. Other measures included in the eradication programme are: cover spray on, and soil drenching under, bearing fruit trees; fruit clean up which comprises collection of fallen fruits and their disposal in trenches - these are drenched with an insecticide and covered with soil. The help of the public, Sugar Estates and District Council was enlisted for intensive fruit collection and disposal. Fruit stripping, especially in the case of mangoes, was also carried out in certain public places.

An attempt at the eradication of the oriental fruit fly, Bactrocera dorsalis ( Hendel) S I Seewooruthun et al.
AMAS 1997. Food and Agricultural Research Council, Réduit, Mauritius
213
The eradication area also includes certain regions which are inaccessible by road, such as along river banks and cliffs. These areas harbour large numbers of Indian almond trees which escape treatment. Following the detection of certain hot spots in May, aerial treatment with the bait/insecticide mixture was resorted to in the inaccessible areas in June 1997. A ULM aircraft was used for this purpose, and the bait mixture was disposed by two Micronair AU 7000, utilising only the variable restrictor unit and the anti droplet of the atomiser. Aerial disposal of MAT blocks was also effected. Evaluation Two methods are used for evaluation of the control measures, namely detection from traps, and rearing from samples of collected fruits. The traps used are a local version of the Steiner type and are baited with methyl eugenol. These were initially placed around detection points, according to the Australian Protocol (D Agric. 1992). A total of 367 traps have been set in the eradication area. Traps were checked daily for a period of five months since the first detection. They are now monitored twice a week except at detection points where checking is done daily for a month. In addition, about 95 McPhail traps baited with protein hydrolysate or ammonium chloride are also monitored in this area. Samples are taken daily from collected fruits in the eradication area and kept in the laboratory in the South, for determination of infestation by different species. The identification of the species is done at the adult stage. RESULTS Actual trap catches of B. dorsalis in the different regions of the eradication area are given in Table 1. Out of a total of 143 adult flies trapped, the majority were caught during period July to September 1996. The figures when converted to weekly catches, show a gradual decrease in numbers trapped between July and September 1996 , and only two adults during period 27 September to date (Figure 1). The population of B. zonata has also been reduced to insignificant levels (Figure 2). Emergence of B. dorsalis from collected fruits was recorded from six samples of Indian almond and three samples of mangoes (Table 2). Over 20 species of host fruits have been collected, totalling about two million fruits (Table 3).

An attempt at the eradication of the oriental fruit fly, Bactrocera dorsalis ( Hendel) S I Seewooruthun et al.
AMAS 1997. Food and Agricultural Research Council, Réduit, Mauritius
214
Table 1 Trap catches of adult Bactrocera dorsalis
Date No of flies collected
Bea
u V
allo
n
Blu
e B
ay
Cam
p ca
rol
Che
min
Gre
nier
Deu
x B
ras
Gra
nd B
el A
ir
Gro
s B
illot
Gro
s B
ois
La
Ros
a
l'Esc
alie
r
Mah
ebou
rg
Mar
e d'
Alb
ert
Mar
e T
abac
Mon
t Fer
tile
Plai
ne M
agni
en
Ric
he e
n E
au
Ros
e B
elle
Sauv
eter
re
St H
uber
t
Suri
nam
Tro
is B
outiq
ues
Uni
on V
ale
Tot
al
5-Jun-96 1 118-Jul-96 8 820-Jul-96 32 3221-Jul-96 7 1 1 922-Jul-96 1 3 423-Jul-96 2 224-Jul-96 2 1 1 4 825-Jul-96 4 3 726-Jul-96 1 127-Jul-96 1 130-Jul-96 1 11-Aug-96 1 2 1 42-Aug-96 1 1 1 2 53-Aug-96 1 14-Aug-96 2 2 45-Aug-96 1 2 1 1 56-Aug-96 1 1
13-Aug-96 3 1 1 514-Aug-96 3 315-Aug-96 1 1 3 516-Aug-96 1 1 217-Aug-96 020-Aug-96 1 121-Aug-96 1 1 1 322-Aug-96 6 623-Aug-96 1 125-Aug-96 1 1 227-Aug-96 1 129-Aug-96 1 1
1-Sep-96 1 14-Sep-96 1 1 26-Sep-96 1 2 2 57-Sep-96 1 18-Sep-96 1 1
11-Sep-96 2 1 312-Sep-96 1 115-Sep-96 2 222-Sep-96 1 126-Mar-97 1 16-May-97 1 1
Total 1 1 1 1 1 1 20 1 7 6 1 8 6 2 61 4 6 1 1 1 11 1 143 Table 2 Emergence of Bactrocera dorsalis from collected fruits
Fruit Locality Fruits collected Pupæ Species emerged
Dat
e
Num
bers
Sam
ple
Tot
al n
umbe
r
Sta
rt o
f em
erge
nce
Bac
troc
era
dor
sali
s
Bac
troc
era
zon
ata
Indian Almond Trois Boutiques 23-Jul-96 6 6 26 18-Aug-96 5 16Indian Almond Plaine Magnien 25-Aug-96 17 17 15 9-Oct-96 3 4Indian Almond Sauveterre 4-Apr-97 200 50 31 16-Apr-97 22 0Indian Almond Trois Boutiques 4-Apr-97 100 50 5 15-Apr-97 5 0Indian Almond Sauveterre 16-Apr-97 17 17 8 5-May-97 4 0Indian Almond Sauveterre 22-Apr-97 4 000 125 97 5-May-97 27 30Mango Plaine Magnien 16-Oct-96 22 22 75 31-Oct-96 12 45Mango Savinia 22-Nov-96 162 10 21 12-Dec-96 3 9Mango L'Escalier 30-Nov-96 12 2 26 16-Dec-96 7 18

An attempt at the eradication of the oriental fruit fly, Bactrocera dorsalis ( Hendel) S I Seewooruthun et al.
AMAS 1997. Food and Agricultural Research Council, Réduit, Mauritius
215
Table 3. Emergence of different fruit fly species from collected fruits
Fruit variety Number of fruits Pupae
col
lect
ed
Sa
mpl
ed
Bac
troc
era
cuc
urbi
tae
Bac
troc
era
dor
sali
s
Bac
troc
era
zon
ata
Cer
atit
is c
apit
ata
Cer
atit
is
rosa
Dac
us c
ilia
tus
Tri
rhit
hrom
yia
cyan
esce
ns
August 1996 to December 1996Chilly (long) 1 004 1 004 23 17Chinese Guava (red) 80 80 80 11 42Cucurbits 969 911 8 661 6 387 153Guava 93 93 88 11 38Indian Almond 10 670 6 507 23 455 11 529 167 5 435Mango 206 223 2 997 2 387 22 1 655 43 32Papaya 400 187 445 6 138 124Peach 336 223 2Tomato 1 153 1 011 330 220
January 1997 to May 1997Carambole 902 33 1Chilly (long) 850 850 51 40Chilly (small) 66 66Chinese Guava (red) 1 511 1 483 30 11 1 2Chinese guava (yellow) 619 619 29 2 3Citrus 716 297Coeur de Boeuf 1 1Cucurbits 714 744 6 767 5 279 23 110Fruit de Cythere 153 32Goyave de L'Inde 245 65Grenade 10 2Guava 14 510 3 242 1 167 551 72 47Indian Almond 1 541 398 52 486 26 139 61 8 954 3 298 5 751Mango 6 066 1 797 1 329 992 71 7Massons 44 44 8 3Papaya 180 63 1Peach 154 154 11 2Pocpoc 10 10 5 4Pomme Jacquot 95 95Prune 115 115Tabac marron 250 250 18 16Tomato 509 486 115 84

An attempt at the eradication of the oriental fruit fly, Bactrocera dorsalis ( Hendel) S I Seewooruthun et al.
AMAS 1997. Food and Agricultural Research Council, Réduit, Mauritius
216
9-Jan-961-Apr-96
13-Jun-9625-Jul-96
5-Sep-9617-Oct-96
28-Nov-969-Jan-97
20-Feb-973-Apr-97
15-May-9726-Jun-97
0
5
10
15
20
25
30
35
40
45
50N
umbe
r of
flie
s ca
ught
Figure 1 Weekly trap catches of Bactrocera dorsalis in the eradication area
9-Jan-961-Apr-96
10-Jun-968-Jul-96
1-Aug-9623-Sep-96
4-Nov-9612-Dec-96
28-Jan-9710-Mar-97
23-Apr-9723-Jun-97
0
5
10
15
20
25
30
35
40
45
50
Num
ber
of fl
ies
caug
ht p
er tr
ap
Figure 2 Weekly trap catches of Bactrocera zonata in Southern Region
DISCUSSION The methods used for the containment of B. dorsalis are giving positive results. The eradication area which covered about 300 km2 initially, has been reduced to about 175 km2, taking into consideration detection from traps and fruits for the last ten months. B. dorsalis has not, at any moment, dispersed outside the Southern districts. Both evaluation methods, i.e. trapping and breeding from fruit samples are used in the context of the area wide control programme mentioned earlier. A total of 657 traps are monitored fortnightly, and fruit samples are collected regularly. B. dorsalis has not been recorded from either traps or fruits outside the outbreak area. Certain hot spots have been noted in the

An attempt at the eradication of the oriental fruit fly, Bactrocera dorsalis ( Hendel) S I Seewooruthun et al.
AMAS 1997. Food and Agricultural Research Council, Réduit, Mauritius
217
eradication area from time to time. However, this is a normal occurrence in eradication programmes due to the presence of very small populations, before the actual eradication is achieved. A Regional Fruit Fly Programme which includes research, extension and quarantine to back up national fruit fly programmes is operational in Mauritius, Réunion and Seychelles. It is funded by the European Union and the Government of each participating country. In the context of this programme, an action plan is being prepared so as to be ready to meet the challenge of any future incursions, in terms of material, technical and scientific resources. Quarantine procedures are also being harmonised so as to minimise risks of entry of exotic pests. ACKNOWLEDGEMENTS We are grateful to the Permanent Secretary, Chief Agricultural Officer and Principal Agricultural Officer (Crop), for permission to publish this paper; gratitude is expressed to the European Union, for co-funding the eradication programme. We are indebted to the staff and personnel of the Entomology Division, who have been involved in the eradication programme. We acknowledge the International Institute of Entomology for confirming the identity of B. dorsalis; the help of Sugar Estates, the District Council of Grand port/Savanne, and the Securiclean Ltd. for fruit clean up. REFERENCES CALIFORNIA DEPARTMENT OF FOOD AND AGRICULTURE 1994. The exotic fruit fly
eradication program using aerial application of malathion and bait. Final Programmatic Environmental Impact Report. State Clearinghouse Number 91043018. US : California Department of Food and Agriculture, p. 5 - 13.
CFDA see under California Department of Food and Agriculture CUNNINGHAM RT and SUDA DY. 1986. Male Annihilation through mass-trapping of male flies
with methyl eugenol to reduce infestation of Oriental Fruit Fly (Diptera:Tephritidae) larvae in papaya. Journal of Economic Entomology 79:131-135.
D. Agric see under Department of Agriculture DEPARTMENT OF AGRICULTURE, SOUTH AUSTRALIA. 1992. Pest Eradication Unit Manual,
52pp. JANG E, SMITH S and ARMSTRONG J. 1996. Assessment of the Papaya Fruit Fly eradication
program in North Queensland. Report of visit by scientific panel, 04-08 November 1996, 14pp.
KAPOOR VC and GREWAL JS. 1986. Fruit flies and their host preference in India. Proceedings of
the second International Symposium on Fruit Flies, Crete. KOYAMA J, TERUYA T and TANAKA K. 1984. Eradication of the Oriental fruit fly (Diptera:
Tephritadae) from the Okinawa Islands by a Male Annihilation method. Journal of Economic Entomology 77:468-472.
MAFNR see under Ministry of Agriculture, Fisheries and Natural Resources

An attempt at the eradication of the oriental fruit fly, Bactrocera dorsalis ( Hendel) S I Seewooruthun et al.
AMAS 1997. Food and Agricultural Research Council, Réduit, Mauritius
218
MINISTRY OF AGRICULTURE, FISHERIES AND NATURAL RESOURCES. 1986. Annual Report of the Agricultural Services of the Ministry of Agriculture, Fisheries and Natural Resources.
MINISTRY OF AGRICULTURE, FISHERIES AND NATURAL RESOURCES. 1987. Annual
Report of the Agricultural Services of the Ministry of Agriculture, Fisheries and Natural Resources.
MINISTRY OF AGRICULTURE, FISHERIES AND NATURAL RESOURCES. 1990. Annual
Report of the Agricultural Services of the Ministry of Agriculture, Fisheries and Natural Resources.
MINISTRY OF AGRICULTURE, FISHERIES AND NATURAL RESOURCES. 1996. Annual
Report of the Agricultural Services of the Ministry of Agriculture, Fisheries and Natural Resources
ORIAN AJE and MOUTIA LA. 1960. Fruit flies (Trypetidae) of economic importance in Mauritius.
Revue Agricole et Sucrière de l' Ile Maurice 38:142-150. PERMALLOO S, SEEWOORUTHUN SI, SOONNOO AR, GUNGAH B, UNMOLE L and
BOODRAM R. 1997. An area wide control of fruit flies in Mauritius. ( In press . Paper presented at second annual meeting of agricultural scientists, Food and Agricultural Research Council, Mauritius).
REYNOLDS T, BAILEY P, PEREPELICIA N and JESSOP A. 1995. Integrated chemical and sterile
fly release trial no.3 to eradicate Queensland fruit fly at Clarence Gardens. Adelaide , South Australia : Pest Eradication Unit, Primary Industries, 37pp.
SOONNOO AR, SMITH ESC, JOOMAYE A, PERMALLOO S and GUNGAH B. 1995. A large
scale fruit fly control programme in Mauritius. p. 52-60. In : CHUA TH and KHOO SG eds. Problems and Management of Tropical Fruit Flies. Proceedings of a Workshop, University of Malaysia..
STEINER LF, HART WG, HARRIS EJ, CUNNINGHAM RT, OHINATA K and KAMAKAHI DC.
1970. Eradication of the Oriental fruit fly from the Mariana Islands by the methods of Male Annihilation and Sterile Insect Release. Journal of Economic Entomology 63:131-135.
STEINER LF, MITCHELL WC, HARRIS EJ, KOZUMA TT and FUJIMOTO MS. 1965. Oriental
fruit fly eradication by male annihilation. Journal of Economic Entomology 58 : 961-964. COMMENTS Q. Given that the oriental fruit fly is of quarantine importance, did you consider restricting the
movement of fruits from the South to other regions. A. This question was raised but it was difficult to put into practice. To counteract, cover
sprays were carried out in the south for mangoes, to prevent reinfestation.

AMAS 1997. Food and Agricultural Research Council, Réduit, Mauritius
219
ESTIMATION OF SOIL ERODIBILITY AND EROSIVITY OF RAINFALL PATTERNS IN MAURITIUS
M A Atawoo and J M Heerasing
Agricultural Research and Extension Unit
ABSTRACT Empirical studies on the erosivity (R) of 3 rainfall patterns in Mauritius were conducted to test two models for predicting R. The erodibility factor (K) of soils from five erosion-prone areas was calculated in parallel using the nomograph developed by Wischmeier et al (1971). Results in the first case showed that the model developed by Arnoldus (1977) gives a close approximation to calculated R. In the other case there were indications that the soils tested are relatively resistant to soil erosion. INTRODUCTION Soil degradation is indicated by a lowering of the fertility status, by a reduction of the nutrient level or by physical loss of topsoil; the latter mostly occurs in regions prone to soil erosion where, during heavy rainfall, considerable amounts of soil and, in certain cases, rock debris and organic matter, are transported downslope to rivers and eventually to the sea. A survey carried out in 1992 throughout the erosion-susceptible areas of Mauritius revealed moderate to severe loss of topsoil in land under pineapple, banana and mixed cropping systems (Anon 1992). Moderate sheet erosion occurred in sugar cane fields and grazing lands. Soil erosion control can be attained if one knows what soils are susceptible and what are the factors which determine their susceptibility. Soil erosion depends on many factors among which are:
• Erosivity of the rain • Erodibility of the soil • Slope length and steepness • Crop practice • Conservation practice
The objective of the study was to investigate two of these factors namely the erodibility of the soils and erosivity of the rain occurring in Mauritius. MATERIALS AND METHODS Erosivity Determination The rainfall erosivity factor R assesses the capacity of rain to erode unprotected soils. The best rainfall parameter to characterise R in the tropic is the EI 30 value computed as follows:
EI 30 = KE x I 30 [1] Where KE is rainfall kinetic energy, and I 30 is rainfall intensity for a 30-minute period.

Estimation of soil erodibility and erosivity of rainfall patterns in Mauritius M A Atawoo and J M Heerasing
AMAS 1997. Food and Agricultural Research Council, Réduit, Mauritius
220
KE of each storm is computed as follows:
KE = 210.3 + 89 x log10 (I 30) [2]
On a yearly basis the overall R factor is a cumulative value of individual R values for rainstorms of intensity greater than 12.5 mm per 30 mins. (Wischmeier et al. 1971). To compute R using the above method an automatic raingauge is required, the data from which can be used to analyse intensities of individual rainstorms. For this study a rainfall monitor that records rainfall intensities was acquired and placed at Curepipe Experiment Station. Data on rainfall intensities were collected for 1996. Data for Vacoas and Plaisance for the same year were obtained from the Meteorological Services. Estimating R Several procedures have been developed to estimate R in areas with limited rainfall records. Two widely used equations are given below: (i) Arnoldus (1997)
EI 30 = 0.0302 x (RI) 1.9 [3]
Where RI = Σ (MR)² / AR , MR = Monthly rainfall, AR = Annual rainfall (ii) Lo et al. (1985) EI 30 = 38.46 + 3.48 x AR [4] Both equations were used to estimate R in this study. Erodibility Determination Erodibility is defined as the resistance of the soil to both detachment and transport. It varies with soil texture, aggregate stability, shear strength, infiltration capacity and organic and chemical content. Erodibility of a soil is designated by the soil erodibility factor K. There are several approaches to determine K and the 3 main ones are: (i) Use of in situ erosion plots (ii) Measuring K under a simulated rainstorm (iii) Predicting K using regression equations describing the relationship between K and soil
physical and chemical properties. In Situ Erosion Plots Erosion plots enable measurement of K under field conditions. They make use of a standard condition of bare soil, no conservation practice and 7° slope of 22m length. This approach is costly and time consuming and was not used in this study.

Estimation of soil erodibility and erosivity of rainfall patterns in Mauritius M A Atawoo and J M Heerasing
AMAS 1997. Food and Agricultural Research Council, Réduit, Mauritius
221
Measuring K under a simulated rainstorm This approach is less time consuming but relatively costly. The main drawback is that none of the rainfall simulators built to date can recreate all the properties of natural rain. Nevertheless this method is being used more extensively in erosion studies The rainfall simulator used in this study was built at Wooton Experiment Station. It was made of Duction bars and measures 1.80m by 1.80m and 3.80 m high. Several kinds of nozzle were tested and the one that produced water droplets close to natural rain was chosen. Water is released at low pressure. A wooden tray of dimension 1m by 2m and 15 cm deep is placed under the simulator with the slope adjusted to 7°. A collecting structure is placed at the downslope end to gather runoff and sediment. Soil samples collected from the following erosion-sensitive regions were placed in the wooden tray: Wooton, Ferney, Les Mariannes and Grande Chartreuse. The soil was then subjected to simulated rainstorm of different intensities. Since, it was difficult to set a predetermined rain intensity the nozzle was adjusted to low and high levels and the depth of water reaching the wooden tray measured with a beaker throughout the experiment. All runoff and sediment were collected and measured. Predicting K K may be predicted using regression equations describing relationships between K and soil chemical and physical properties. The nomograph developed by Wischmeier et al. (1971) expressing the relationship between K and soil properties is based on the following equation: 100 K = 2.1 x 104 x (2 - OM) x m1.14 + 3.25 x (St-2) + 2.5 x (Pt - 3) [5] Where OM = Organic matter content (%), M = Silt plus fine sand content (%), St = Soil structure code (very fine granular = 1, fine granular = 2, coarse granular = 3, blocky, platy or massive = 4), Pt = Permeability class (rapid = 1, moderate to rapid = 2, moderate = 3, slow to moderate = 4, slow = 5, very slow = 6 ). Soil samples from Ferney, Wooton, Plaine Sophie, Grande Chartreuse and Les Mariannes were collected and analysed for organic matter content and granulometry. Permeability class and structure were obtained from the Land Suitability Map, (Arlidge and Wong You Cheong 1975). K was predicted using the nomograph devised by Wischmeier et al. (1971). RESULTS AND DISCUSSION Erosivity ( R ) R values were computed using rainfall intensity data obtained from the rainfall monitor at Curepipe Experiment Station and data from Meteorological Services for Plaisance and Vacoas for the year 1996, and are given as follows:-
Locality R Value Curepipe 1 016.93 Vacoas 1 289.54 Plaisance 412.68
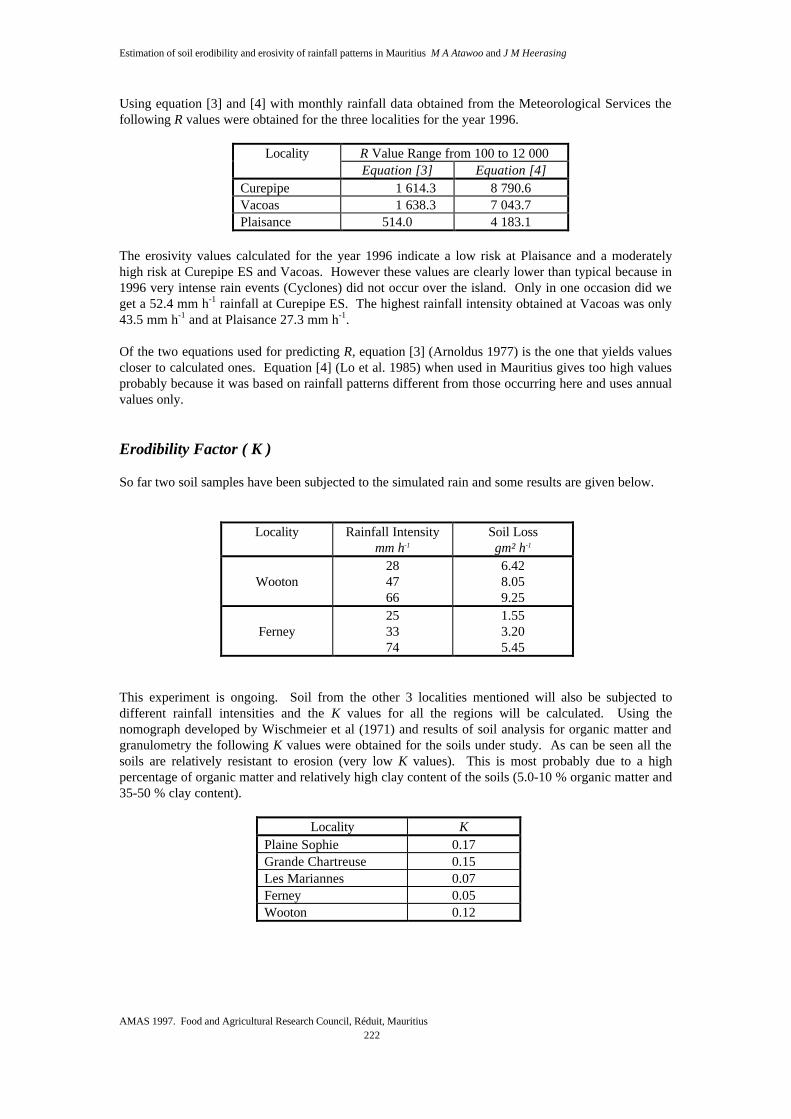
Estimation of soil erodibility and erosivity of rainfall patterns in Mauritius M A Atawoo and J M Heerasing
AMAS 1997. Food and Agricultural Research Council, Réduit, Mauritius
222
Using equation [3] and [4] with monthly rainfall data obtained from the Meteorological Services the following R values were obtained for the three localities for the year 1996.
Locality R Value Range from 100 to 12 000 Equation [3] Equation [4] Curepipe 1 614.3 8 790.6 Vacoas 1 638.3 7 043.7 Plaisance 514.0 4 183.1
The erosivity values calculated for the year 1996 indicate a low risk at Plaisance and a moderately high risk at Curepipe ES and Vacoas. However these values are clearly lower than typical because in 1996 very intense rain events (Cyclones) did not occur over the island. Only in one occasion did we get a 52.4 mm h-1 rainfall at Curepipe ES. The highest rainfall intensity obtained at Vacoas was only 43.5 mm h-1 and at Plaisance 27.3 mm h-1. Of the two equations used for predicting R, equation [3] (Arnoldus 1977) is the one that yields values closer to calculated ones. Equation [4] (Lo et al. 1985) when used in Mauritius gives too high values probably because it was based on rainfall patterns different from those occurring here and uses annual values only. Erodibility Factor ( K ) So far two soil samples have been subjected to the simulated rain and some results are given below.
Locality Rainfall Intensity mm h-1
Soil Loss gm² h-1
Wooton
28 47 66
6.42 8.05 9.25
Ferney
25 33 74
1.55 3.20 5.45
This experiment is ongoing. Soil from the other 3 localities mentioned will also be subjected to different rainfall intensities and the K values for all the regions will be calculated. Using the nomograph developed by Wischmeier et al (1971) and results of soil analysis for organic matter and granulometry the following K values were obtained for the soils under study. As can be seen all the soils are relatively resistant to erosion (very low K values). This is most probably due to a high percentage of organic matter and relatively high clay content of the soils (5.0-10 % organic matter and 35-50 % clay content).
Locality K Plaine Sophie 0.17 Grande Chartreuse 0.15 Les Mariannes 0.07 Ferney 0.05 Wooton 0.12
Estimation of soil erodibility and erosivity of rainfall patterns in Mauritius M A Atawoo and J M Heerasing
AMAS 1997. Food and Agricultural Research Council, Réduit, Mauritius
223
CONCLUSION The results of erosivity ( R ) studies of rainfall patterns at Curepipe, Vacoas and Plaisance in 1996 indicate as expected a low erosivity for Plaisance and a moderately high erosivity for Curepipe and Vacoas. Moreover it is interesting to note that the calculated R in each case tended to agree with the R values estimated from Arnoldus model. This model could be used to predict R across both Mauritius and Rodrigues should confirmation of these findings be obtained from ongoing work. The low soil erodibility factors ( K ) estimated from Wischmeier nomograph can be accounted for by the relatively high organic matter and clay content of all the soils tested. So far only two soil samples have been subjected to simulated rainstorms and ensuing soil loss monitored. Further studies will be needed to determine whether the nomograph could be used to estimate K for Mauritian and Rodriguan soils. Estimated R and K values on a national scale would make it possible to generate an erosion hazard map for Mauritius and Rodrigues. REFERENCES ANON. 1992. Annual Report Agricultural Services, Ministry of Agriculture and Natural Resources,
Mauritius, p. 412 - 415. (internal / unpublished). ARLIDGE EZ and WONG YOU CHEONG Y. 1975 . Notes on the land resources and agricultural
suitability map of Mauritius 1: 50 000. MSIRI Occasional Report No. 29. Rome, Italy : FAO and Reduit, Mauritius: MSIRI, 138 p.
ARNOLDUS 1977 cited by MANRIQUE LA. 1993, p. 1036 LO et al. 1985 cited by MANRIQUE LA. 1993, p. 1036. MANRIQUE LA. 1993. Technology for soil erosion assessment in the tropics: a review.
Communication in soil science and plant analysis 24 (9 &10) : 1033-1064. WISCHMEIER WH, JOHNSON CB and CROSS BV. 1971. A soil erodibility nomograph for
farmland and construction sites. Journal of soil and water conservation 26 : 189-192. COMMENTS Q. In Australia, there is assessment of soil loss every year. Is this being done in Mauritius? A. I am trying to assess some coefficient of erodibility in Mauritius. After these coefficients are
confirmed, we shall be able to estimate yearly soil loss.

224

AMAS 1997. Food and Agricultural Research Council, Réduit, Mauritius
225
THE EFFECT OF TEMPERATURE ON CURD INITIATION OF CAULIFLOWER
R D Nowbuth
Agricultural Research and Extension Unit
ABSTRACT Cauliflower plants of temperate variety Revito and of the local Mauritian variety were grown at a mean temperature of 13.6ºC for 5 weeks and then transferred to six different mean temperature compartments at 11ººC, 13.5ºC, 19.5ºC, 22.5ºC, 25ººC and 29ººC respectively. The two varieties differed in their adaptability to high temperatures in terms of curd initiation, apex diameter and leaf number. In both the local variety and in Revito, a summer variety bred for the temperate countries, curd initiation occurred earliest at 13.5ºC, 21-28 days after transfer to experimental temperatures. Curd initiation was completely inhibited at 25ºC in the local variety and at 22.5ºC in variety Revito. Apex diameter increased at a similar rate at both 19.5ºC and 13.5ºC in the local variety, whereas in Revito no increase was observed at 19.5ºC . Number of leaves produced was maximum at 25ºC in the local variety and at 22.5ºC in Revito. These results suggest that there are genetic differences in the developmental responses of cauliflower varieties to temperature. Consequently it may be possible to select genotypes even better adapted to the Mauritian climate. But in any case care ought to be exercised in importing seeds of temperate varieties for growing in Mauritius; these should be screened for adaptation to warm temperatures. INTRODUCTION Cauliflower is a popular crop grown in Mauritius; the recent years have registered an increase both in area under cultivation and in total production. However the main concern is that cauliflower cultivation is restricted to the cooler months (Figure 1). There is a need to lengthen the cropping season and in this context it is important to understand the responses of curd initiation to temperature.
Figure 1 Monthly Production of Cauliflower 1994 - 1996
Jan Feb April June Aug Oct Dec0
100
200
300
400
500
600
700
800
900
Pro
duct
ion
tons
1994 1995 1996
Source: Central Statistical Office, Mauritius

The effect of temperature on curd initiation of cauliflower R D Nowbuth
AMAS 1997. Food and Agricultural Research Council, Réduit, Mauritius
226
The flowering process of cauliflower is different from that of other brassicas. This is because cauliflower has an intermediate stage of curding (immature inflorescence) between the vegetative and the generative phases. Curd initiation involves the widening and flattening of the apex and the formation of bracts and first order branch initials. Factors Influencing Curd Initiation:
Genotype Different genotypes make the cultivation of cauliflower possible over a range of climatic condition (Nieuwhof 1969; Wurr et al. 1981). Growers at the same location can be growing different varieties with respect to soil type, to water regime and to method of raising the seedlings (Nieuwhof 1969). Nitrogen Level Starving the plants from nitrogen can prevent curd initiation (Atherton et al. 1987). This is because the leaf area development is restricted and the plant cannot support generative growth. In plants growing in nitrogen deficient conditions physiological disorders like “ buttons” can occur. (Carew and Thompson 1948). Photoperiod Workers have reported a variation in cauliflower responses to photoperiod; thus varieties have been reported as sensitive (Hand 1988) and insensitive (Sadik 1967) to photoperiod. Irradiance Hand (1988) found that a reduction in total irradiance received delayed curd initiation in plants grown under warm conditions. He also observed that increased irradiance would act as a partial substitute for low temperature in accelerating curd initiation. Temperature Temperature is considered to be the major factor influencing curd initiation (Atherton et al. 1987; Salter 1960; Sadik 1967). Some varieties of cauliflower stay vegetative when grown under high temperature (Haine 1959; Booij 1987). Optimum temperatures for curd initiation have been proposed to be at 14ºC for variety Revito (Pearson et al. 1994), 15.5ºC for variety Plana (Wheeler et al. 1995) and 13ºC for cv. White Fox (Hand 1988). The aim of this experimentation was to investigate the effects of temperature on curd initiation and leaf development of the local Mauritian cauliflower variety and the temperate variety Revito.

The effect of temperature on curd initiation of cauliflower R D Nowbuth
AMAS 1997. Food and Agricultural Research Council, Réduit, Mauritius
227
MATERIALS AND METHODS Planting Materials Revito was obtained from A.L.Tozer Ltd, Plant Breeders and Seed Growers, Surrey, UK and B24/94, was obtained from the Ministry of Agriculture and Natural Resources of Mauritius. Temperature Regime The experiment was carried out in a temperature controlled greenhouse where six different temperature compartments were set at 6ºC , 10ºC, 14ºC, 18ºC, 22ºC and 26ºC respectively. However ventilation caused an increase in the set point and the actual mean temperatures recorded for each compartment using an aspirated PT100 sensor with a Data Taker series 500 data logger were as follows: 11.0ºC, 13.5ºC, 19.5ºC , 22.5ºC , 25ºC and 29ºC . Cultural Practices The seeds of Revito and local variety (B24/94) were sown on 12 April 1996 in “Four Oaks” plug raising compost. The seed trays were placed in a greenhouse at a mean temperature of 13.6ºC. Thirty-five day old plants were then transplanted to 9cm pots containing a mixture of 75% peat and 25% perlite. These potted plants were transferred to the different temperature compartments on 15 May 1996. The plants were watered daily using Sangral soluble fertiliser solution of pH 5.8 and electrical conductivity 1500 µS. Dimensions recorded Three plants were sampled for analysis from each variety in each temperature compartment seven days after their transfer and thereafter on a weekly basis. The plants were then cut off at the cotyledon scars and the number of leaves were counted. The apex was scored for morphological state and its diameter was measured after dissection under a stereomicroscope. When curd initiation was observed in any treatment, data were recorded from this treatment for another two weeks before the treatment was terminated. RESULTS The effect of temperature on curd initiation In this study curd initiation was recorded when the shoot apex changed into a dome shape and the first order branch primordium became visible under the microscope. Table 1 shows the effect of the treatments on each variety.
Table 1 Curd initiation after treatment (days)
Temperature ºC Local variety Revito 11.0 28 28 13.5 21 28 19.5 28 35 22.5 35 - 25.0 - - 29.0 - -

The effect of temperature on curd initiation of cauliflower R D Nowbuth
AMAS 1997. Food and Agricultural Research Council, Réduit, Mauritius
228
0 10 20 30 40 50 60Days after start of treatment
0.1
1
10
100
Ape
x di
amet
er m
m
The effect of temperature on the development of the apex diameter and number of leaves in cauliflower
Figure 2 Apex diameter Variety Local
0 10 20 30 40 50 600.1
1
10
100
Ape
x di
amet
er m
m
11ºC 13.5ºC 19.5ºC 22.5ºC 25ºC 29ºC
Figure 3 Apex diameter Variety Revito
10 12.5 15 17.5 20 22.5 25 27.5 30
Temperature oC
0
10
20
30
40
50
60
Num
ber
of le
aves
Local Revito
Figure 4 Number of leaves
Days after start of treatment
In the local variety, first curd initiation occurred in the 13.5ºC compartment 21 days after transfer to the experimental temperatures. However with either increase or decrease in temperature curd initiation was delayed. No curd was initiated at 25.0ºC or above. The temperate variety Revito initiated curd later than the local tropical variety. Initiation was first noted 28 days after transfer to experimental temperatures at 11.0ºC and 13.5ºC. Fifty six days after transfer to experimental temperatures, no curd initiation had occurred at temperature 22.5ºC or above

The effect of temperature on curd initiation of cauliflower R D Nowbuth
AMAS 1997. Food and Agricultural Research Council, Réduit, Mauritius
229
The effect of temperature on apex diameter expansion The logarithm of apex diameter was plotted against time as shown in Figures 2 and 3 for local varietyand Revito respectively. For the tropical local variety, the diameter of the apex decreased with time when subjected to temperatures equal to or greater than 25ºC (Figure 2). This inhibitory effect was also observed at temperatures equal to or greater than 22.5ºC in the case of the temperate variety Revito (Figure 3). Warm temperatures were therefore more inhibitory to curd development in the temperate variety. The most rapid increase in apex diameter generally occurred at 13.5ºC in both varieties. In the case of local variety, however,the rate of expansion at 19.5ºC was initially delayed, it soon caught up with the treatment at 13.5ºC. In Revito, although curd initiation occurred at 19.5ºC, rate of apex expansion was slow as compared with treatment at 13.5ºC. Again, then, the local variety showed evidence of better adaptation to warmer conditions. The effect of temperature on leaf production Figure 4 shows the effects of the treatments on leaf production in both varieties. Leaf production peaked at 22.5ºC for Revito and 25ºC for the local variety. Warmer temperatures seem to favour leaf production. Variety Revito produces about 19% more leaves than the local variety. DISCUSSION The temperate Variety Revito initiated curd at the temperatures varying between 11oC and 19.5oC as compared with the tropical local variety which initiated curd at temperatures between 11oC and 22.5ºC. Both varieties initiated curd earliest at 13.5oC with Revito initiating curd one week later than the local variety. No curd was initiated at temperatures of 25ºC and above for local variety and of 22.5oC and above for variety Revito. These results confirm the findings of Atherton et al. (1987), Booij (1987) and Sadik (1967) who found that low temperatures (12-15oC) favoured curd initiation. and those of Booij (1987), Sadik and Ozbun (1968) and Nieuwhof (1969) who reported that high temperatures do not favour curd formation. The first indication of curd initiation was the increase of the apex diameter. High temperatures caused a decrease in apex diameter. For local variety, this occurred at temperatures 25ºC and above and for Revito at temperatures 22.5oC and above. This decrease in size at high temperatures has not been previously noted, but the morphological response suggests that local variety is better adapted to warmer conditions. Leaf number is a “marker” used by many workers to predict curd initiation (Atherton et al. 1987; Booij 1987; Booij and Stuick 1990; Salter 1960,1969). In this study it was evident that for both varieties warmer temperatures favoured leaf production up to a maximum after which a decrease in leaf production was noted. These observations were in accordance with findings of Hand (1988) who obtained an increase in the number of leaves produced when temperature increased from 2ºC to 20ºC and a decrease in the final leaf number with further increase in temperature to 25ºC and 30ºC. Variety Revito produced more leaves than the local variety which could be the reason for delay in time to curd initiation for this temperate variety.

The effect of temperature on curd initiation of cauliflower R D Nowbuth
AMAS 1997. Food and Agricultural Research Council, Réduit, Mauritius
230
CONCLUSION The Mauritian variety has shown that it is better adapted to warmer conditions for curd initiation. This observation is important since it shows that there are genotypic differences with respect to temperature responses. It is therefore possible to select cauliflower varieties especially adapted to the tropics. Although inferior in terms of its genetic purity, poor yields and low resistance to pests and diseases, the local variety is commonly grown in Mauritius. The preference for this variety could derive from its demonstrable ability to initiate curd up to a mean temperature of 22.5ºC. Increments of apical expansion showed that the local variety was better at tolerating warm temperatures than the temperate summer variety Revito. Further work should now be undertaken in Mauritius to select varieties which can initiate curd at higher temperatures so as to extend the production period. ACKNOWLEDGEMENTS This investigation was carried out at the University of Reading, UK as part fulfilment of the MSc. in Horticulture. I wish to thank Dr. S. Pearson and Dr. P. M. Hadley for their critical comments and Pr. E. H. Roberts for his constructive guidance. REFERENCES ATHERTON JC, HAND DJ and WILLIAMS CA. 1987. Curd initiation in cauliflower (Brassica
oleracea var. botrytis L.). p133-145. In : ATHERTON JC ed. Manipulation of flowering. London, UK : Butterworth.
BOOIJ R. 1987. Environmental factors in curd initiation and curd growth of cauliflower in the field.
Netherlands Journal of Agricultural Science 35 : 435-445. BOOIJ R and STUICK PC. 1990. Effects of temperature on leaf and curd initiation in relation to
juvenility of cauliflower. Scientia Horticulturae 44 : 201-214. CAREW J and THOMPSON HC. 1948. A study of certain factors affecting “buttoning of
cauliflower”. Proceedings of American Society of Horticultural Science 51 : 406-414. HAINE KE 1959. Time of heading and quality of curd in winter cauliflower. Journal of National
Institute of Agricultural Botany 8 : 667-674. HAND DJ. 1988. Regulation of curd initiation in the summer cauliflower. PhD thesis.
Longhborough, University of Nottingham. NIEUWHOF. 1969. Cole crops. London, UK : Leonard Hill. PEARSON S, HADLEY P and WHELDON AE. 1994. A model of the effects of temperature on the
growth and development of cauliflower, Brassica oleracea L botrytis). Scientia Horticulturae 59 : 91-106
SADIK S. 1967. Factors involved in curd and flower formation in cauliflower. Proceedings of the
American Society Horticultural Science 90 : 252-259 SADIK S and OZBUN JL. 1968. Development of the vegetative and reproductive apices of
cauliflower, Brassica oleracea var botrytis. Botanical Gazette 129 : 365-370.

The effect of temperature on curd initiation of cauliflower R D Nowbuth
AMAS 1997. Food and Agricultural Research Council, Réduit, Mauritius
231
SALTER PJ. 1960. The growth and development of early summer cauliflower in relation to environmental factors. Journal of Horticultural Science 35 : 21-33.
SALTER PJ. 1969. Studies on crop maturity in cauliflower: 1. Relationship between the times of curd
initiation and curd maturity of plants within a cauliflower crop. Journal of Horticultural Science 44 : 129-140.
WHEELER TR, ELLIS RH, HADLEY P and MORISON JIL. 1995. Effects of CO2 , temperature and
their interaction on growth, development and yield of cauliflower (Brassica oleracea L botrytis). Scientia Horticulturae 60 : 181-197
WURR DCE, AKEHURST JM and THOMAS TH. 1981. A hypothesis to explain the relationship
between low temperature treatment, gibberellin activity, curd initiation and maturity of cauliflower. Scientia Horticulturae 15: 321-330.

AMAS 1997. Food and Agricultural Research Council, Réduit, Mauritius
232

AMAS 1997. Food and Agricultural Research Council, Réduit, Mauritius
233
AUTHOR*AND SUBJECT INDEX
A A. indica 105 Azatin EC 105 Achook 105 Acridotheres tristis 15 B Acropora 98 B. brongniarti 15,19 Adelaide 212,218 B. cucurbitae 204 Adoretus mauritianus 16 B. densa 16 AFDl 56 B. dorsalis 206-207, 211-213, 216-217 Agathis spp 106 B. laxa 16 Ageratum conyzoides 104 B. zonata 207,211,213 Agricultural Export Council 56 Bacillus thuringiensis 103-105,107-108, Agricultural Exports Guarantee Scheme 56 181, 185-186 Agricultural Information System 43-45, 48-49 Bacterial Contamination 17 Agricultural Management Services Bacterial Septicaemia 16
Programme 52 Bacterial Wilt 195-196, 198-201 Agricultural Marketing Board 51-52 Bactrocera dorsalis 203-205, 211 Agricultural Policy 51-53, 55, 57-58 Bactrocera papayae 212 Agricultural Polymers III Bactrocera zonata 203,211 Agricultural Products Export Promotion Bahorun T 83-85,91 Agency 56 Bait Application Technique 203,204,211 Agricultural Services 56, 120, 144, 179-180, Bakain 104 218,223 Banana 189-192,219 Agricultural Systems 73,74 Banymundhub-Munbodh K 195 Agrifound Dark Red 155-157 Barachois 95-99, 101 Agrifound Light Red 155-157 Baracuda, 98 Alar 171 Barbados 140, 144 Albion Fisheries Research Centre 95, 96, 101 Bawku 155 Alissonotum piceum 15 Beetles 16, 18-20, 206 Alleck M 211 Behary Paray N 15 Allelochernicals 104 Bengal 120,169,170 Amaranthus hybridus 89 Benimadhu SP 199 American Soc. of Agricultural Engineers 9,13 Ber Fruit Fly 203 AMIS 43-45 BETEL 19 Animal Breeding 151,152 BGS 71 FI 155 Annona murricata 104 Bheekee M 123 Anthocyanes 84-87,89 Bbeenick J 43 Anthurium andreanum 195 Bhikajee M 95 APEPA 56 Bholah MA I APEXHOM 55 Biolog Test 196 Aquaculture 95,99-101 Biological Control 15-16, 20, 23, 103-104,106, ARC/Info 32 108,183, 185-186,203 Arnoldus Model 223 Biotechnology 19 Asian Vegetable Research And Development Black Shank 162,163
Center 186 Blight 1 23 Atawoo MA 219 Boodhoo K 131 Australia 1, 13, 98, 107, 168-169, 173, 209, Boodoo AA 123,139 212, 217-218, 223 Boobram R 203 Austria 33 Bosworth 3 169 Avermectin 103 Botanical Pesticides 103, 105-108 Ayapana 104 Botrys 104 Ayapana triplinervis 89, 104 Brachymeria spp 106 Azadirachta indica 104 Brassica olearacea var. botrytis 181

AMAS 1997. Food and Agricultural Research Council, Réduit, Mauritius
234
Brassicas 226 Corn 21-25 Breast Blisters 141-144 Corrosol 104 Breeding Schemes 149 Cotesia plutellae 105-107, 183, 187 Broccoli 106 Cow Fertility 135 Broilers 139, 142, 143 Cowkeepers 131, 133, 135-136 Bronco 153-158 Crabs 98 Bulk Density 141 Crataegus monogyna 83, 87, 89, 91-93 Bullock's Heart 203 Crocidolomia binotalis 105,108 Burkholderia solanacearum 195 Crotalaria 89,94 Crucifers 107, 181-182 C Cryptomeria japonica 87,93 C. vesuviana 203 Cultural Control 103-104 Cabbage 104-108, 181-183 Cultures In Vivo 83 California 209,212,217 Curd Initiation 225-231 Camellia sinensis 89 Curepipe Experimental Station 123,140 Canada 15,105,115,120,162 Curepipe Livestock Breeding Station 95 Cane Bagasse 140,144 Cycocel 171 Cangy C L 175 Cymbopogon citratus 104 Carangids 98 Cynodon plectostachyus 124-126 Caranx Spp 98 Carcass Quality 139, 141-142, 144, 149, 152 D Carpomya vesuviana 203,211 Dairy Farmers 131 Carps 95,98 Dark Magnesium Clay 12,116 Carrot 105 Data Bank 9 Cartap Hydrochloride 103, 105-106 Database 28-30, 37, 40, 196 Cascade 92 Davasgaium N 139 Casino 169 Denitrification 1,4-5 Cassia Fistula 89 Densovirus 15 Cattle Breeds 131 Department of Agriculture 161-162, 200, 217 Cauliflower 106, 181, 183, 225-226, 230-231 Developed Countries 55, 148 CD ROM 45 Developing Countries 53, 148 Centre Pivot 8-14 Development Bank of Mauritius 45-46 Centrex 155 Diadegma semiclausum 106,183 Chandler 175, 177-179 Diadegma sp 183 Chemical Control 15,192 Diamondback Moth 107-108, 186 Chenopodium Spp 104 Dichantium aristatum 124 Cherax quadricarinatus 95,98 Digital Data Publishing 30 Chilo sacchariphagus 15,17 Digital Information Kiosks 46 Chinese Guava 203 Dimilin 105 Chlorpyrifos 17,19 Dipel 181,186 Christiansen's Coefficient of Uniformity 9 Dobee P 123 Chromatographie 86,90 Domaingue R 27 Chula Vista 153-157 Dragline 7,10,11,12 Chung M 27,30 Drip Irrigation 37, 38, 39, 40, 41, 72 Cincturing 167,170-171, 173 Drip Irrigation Schemes 37 Climate 10, 61-62, 73-74, 80-82, 170, 182 Dunhawoor C 181 212,225 Coker 176 161, 163-165 E Commodity Chain 51,52,53 Ear Worm 21,23 Commodity System 53,56,58 Early Premium 155,156,157 Computer Network 43,48 Eggplant 195 Conception Rate 131-133, 135 Electron Capture Detector 2 Contract Services 40 ELISA 195,197,198,201 Controlled Product 52 Entomopathogens 15,19,20 Copolymers 110-111 Erodibility 219,2201222 Coriander 105-106

AMAS 1997. Food and Agricultural Research Council, Réduit, Mauritius
235
Erosion 70, 80, 109-110, 219, 220-223 HA 2000 155 Ethrel 171-173 HA 870 155 Europe 22,92, 167 HA 891 155 European Union 38,41,203,208,211,217 HA 9 153-158 Evapotranspiration 9,67-69 HA 944 153-158 Extension Services 36,131 HA 95 154-157 HA 950 154-157 F Hanoomanjee P 161 Heat Detection 131,133, 135 Facknath S 103 Factory Area Maps 28 Heerasing JM 219 Faculty of Agriculture 43, 44, 46-48, 56, 57 Helicoverpa armigera 23 Fagopyrum esculentum 85-87, 92, 93 Helminthosporium maydis 23 Farmers Service Corporation 38-39, 41-42 Hema 163 Farming Systems Research 36,41,42 Heong Lai 169,170 Feed Supplementation 123, 128 Herbe Bourrique 124 Fertiliser 1, 2, 4, 69, 70, 11.5, 123, 124, 126, Heteronychus ficas 15 128,129,154,167,173,191,227 High Powered Committee On Agricultural Filiere 51-53, 55-59 Diversification 52 Flavonoides 93 Homopolymers 110 Florida 24,212 Honeysweet 23 Flufenoxuron 103 Hoplochelus marginalis 15 Food And Agricultural Research Council Horticultural Crops Development Authority 5 48, 199,218 Horticultural Research International 154 Forage 123 Houston 155 France 55, 72, 92,101,110,115 Hydroelectricity 70 120,129,175,177,180,190,209 Hydrogels 109,111-112 Fresh Milk 52,56,131 I Fresh Water Fish 95 Fresh Water Lobster 95,98 Immunofluorescence 197 Fresh Water Prawn 95 In vitro 83-84, 86, 89, 91-92, 94 Friesian Creole Crosses 131 Inbreeding 150 Friesians 131 India 15, 105, 120, 162-163, 190, 211,217 Fruit Flies 203-206, 207, 209-212, 217-218 Indian Almond 203,213 Information Technology 30, 43, 45-46 G Inhibiteurs Enzymatiques 83 Gariguette 175, 177-179 Initiatives 2000 52,58 Garlic 105,106 Inseminator Technique 135 Gas Chromatograph 2 Intercropping 22, 24, 103,106-108 Ginkgo biloba 84,88 International Institute of Entomology 211,217 GIS 27,28,30,31,34 International Mycological Institute 16,193 GISCANE 30 IPM 103, 106-107, 181,186 Global Warming 1,4 Irrigation 8-13, 37-42, 61-64, 66-73, 81, 103, Goat Weed 104 106,108-109, 111, 123, 154, 167 Gold Rush 155,156,157,158 IRRIPIVO 71,9 Government Electronic Mailbox 46 Ischaemum aristatum 124-126 Govinden N 21,58 Granex Yellow 155-158 J Grano 2000 155 Jaguar 155 Granville Wilt 163 Jamaica Wrapper 162 Greenhouse 11, 4, 80, 109, 227 Jawan 105 Grey Hydromorphic Soils 12,195,198 Jayasri 163 Gungah B 203,211 Jensen 169-170 Jhoty 1 27 H Jhurry D 109-110 H 675 155 Joomye A 203

AMAS 1997. Food and Agricultural Research Council, Réduit, Mauritius
236
Jujube 203-206, 211 69,71-74,76-77, 79-82, 95, 97-101, 103 -110, 115-116, 123, 129, 131, 135-137, 139, 147, K 149, 151-153, 159, 161-162, 165, 167-168, 170, 173, 175, 179-182, 186-187, 189-192, K 326 161, 163-165 195,199-201, 203, 206, 209-212,217-219,222, K 346 161, 163-165 223,225,227,230 K 394 163, 165 Mauritius Breweries Limited 206 Kenya 55,175 Knowledge Banks 44 Mauritius Chamber of Agriculture 55,101 Kwai May Pink 169, 171-172 Mauritius Meteorological Services 74
Mauritius Sugar Industry Research Institute L 1, 7, 13, 15, 19, 21, 22, 24, 27, 31, 35,
36,41,42,47,50,72,80,195,199,201 L'herbe Bouc 104 Maya's Disease 15 La Ferme Fish Farm Experimental Station 95 Mcphail. Traps 206,213 Labour Shortage 8,37,40-41 Meaders Feeds Limited 142 Lalljee B 115 Medfly 203,204,212 Lambert Conformal Orthomorphic 28 MEDIA 56 LAMU 38,40,42 Melia 104 LAN 30,48 Melia azederach 104 Landindex 37,39 Melon Fly 204 Lantana camara 104 Mercedes 155,156,157,158 Large-Planters 7,35,37 Metarhizium anisopliae 15,17,18 Latex Agglutination 197 Metarhizium flavoviride 15 Latosolic Reddish Prairie 12 Meteorological Services 74, 124, 129, 220-222 Lemon Grass 104 Mexican Fruit Fly 212 Lettuce 110,113 Microclimates 73,74,80,82 Ligustrum robustum 104 Midlands Dam Project 62,70 Lila Perse 104 Miller-Planters 7,35-37 Lime 120 Ministry of Agriculture Linda Vista 153-158 36, 38, 41, 43, 45, 47-52, 56-58, 62, 103 Litchi chinensis 167,174 104,107,120,129,132,136,147,152, Litter 139-140, 142-144 162, 165, 179-180, 186-187, 192, 203, 209, Livestock Feed Limited 140 211,218,223,227 Local Red 153, 155-157 Ministry of Fisheries And Marine Resources 95-97 Loquat 203,206 MLDC 189,191-192 Lutchoomun S 175 Modelling 73-74,76 LUBILOSA 15 Models 8,73,219 Lychees 56 Mooneeramsing M 131 Lycopersicon esculentum 93 MSIRI
7, 9, 12, 15, 19, 22, 23, 27-28, 30-31, 35 M 36, 38-42, 45, 47, 48, 50, 52, 56-58, 71-72, M fijiensis 190 159,201,223 M musicola 190 MSIRI 18 23 Maize 21-24,71, 111, 140 Mundil K 51 Malaysia 95,97,137,210,218 Mustard 106 Male Annihilation Technique Mycosphaerella fijiensis 189-190
203-204, 211-212 Mycosphaerella Leaf Disease Complex189-191 Mangoes 210, 212-213, 218 Mycosphaerella musicola -191 Mangroves 98-99 Mycosphaerella sp 189-191 Mara Des Bois 175,177,179 Mynah 15 Marchaeranthera gracilis 87 Mythimna spp 17-18 Marine Shrimps 96,102 N Marine Shrimp Culture Experimental Station 95 Marquise 175, 177-179 Natal Fly 211 Mauritius 1, 4, 7, 8, 11-16, 19, 21, 22, 24, 27-28, National Agric Information System 43-44, 48
AMAS 1997. Food and Agricultural Research Council, Réduit, Mauritius
237
31-32, 35-36, 39-51, 52,55-56, 58-59, 61, 63, 66, National Agricultural Policy 51 National Agric Production Conference 52, 59 Pasture 123-126, 128 National Fruit Fly Control Programme 209 PCR 190 National Info Technology Strategy Plan 45 Peach 203,206 National Onion Committee 56 Peach Fruit Fly 203-204 National Pig Improvement Programme 149 Penaeus monodon 95,96 National Seminar on Agric Diversification 52 Permalloo SP 203, 205, 211-212 Natural Resources Institute 154,159,190 Pest Management 15,19,108,181, 183 NC 567 161, 163-165 Phyllaphaga smithi 15,18 NC 95 161-165 Pig Industry 147,149,152 Neem 104-107 Pillay G 27,37 Neem Guard 105 Pineapples 56 Neemark 105 Plana 226 Neemazal 105 Plastic Tunnel 175,176 Neempest 105 Plutella xylostella 103-104,106-108,181, 186-187 Netherlands 15,196,230 Polyacrylamide 109,110,112 New Zealand 128,186 Polyclonal Antisera 197 Ng Kee Kwong KF 1 Polymerase Chain Reaction 190 Nicotiana tabaccum 161 Polymers 109-113 Nimbecidine 105 Polyphenols 93 Nimbicilin 105 Potato 56, 195, 196,200 Nimbitor 105 Poultry 21, 139-140, 144-145 Nimin 1 105 Poultry Breeding Centre141,144 Nitrification 1 Pra Neem 105 Nomadacris septemfasciata 15 Primavera 155 Nomograph 219, 221-223 Proag V 61 Northern Plains Irrigation Project 62,71 Proanthocyanidines 83, 84, 86, 87-92 Nowbuth D 225 Producer Associations 51 NPK Fertilizers 112 Profenofos 103 NRI 155,189,190,191 Progesterone 131-137 Protein Hydrolysate 204, 206, 212-213 0 Pseudomonas solanacearum 195, 200-201 0. aureus 95 Pseudotsuga menziesii 88,94 Psidium cattleianum 83,89,91 0. mosambicus 95,97 Puceinia polysora 23 Oestrous Detection 131-132,134 Pure Stand 21,22, 105 Onion 51, 56, 59, 153-159 Oreochromis niloticus 95,97 Organic Matter 99, 115-117, 120, 198, 219, Q 221-223 Quarantine 161-163,203-205,210-212,217 Oriental Fruit Fly 203,204,211,217,218 Overhead System 8,10,11 R Oxalis Spp 195 Radioimmunoassay 131-132,137 Oysters 98,99 Rain Guns 7,10 P Rajabalee A 15 Rajcumar R 153 P Soils 12 Ralstonia solanacearum 195 P sorghi 23 Ram 710 155 P. solanacearum 195-199 Ram 735 156-158 Paecilomyces fumosoroseus 15 Ramburn N 167

AMAS 1997. Food and Agricultural Research Council, Réduit, Mauritius
238
Paecylomyces 106 Ramnauth RK 123 Palmar Livestock Breeding Station 149 Rangasamy M 131 Pandora blunckii 106 Rapid Rural Appraisal 175 Papaya Fruit Fly 212,217 Recommendation Sheets 27,29 Paracercospora fijiensis 190 Recycled Paper 140 Parapheromones 204,212 Red Bandana 153, 155-158 Parasitism 181, 184,186 Red Locust 15
Regosols 116, 195, 198-199 35,36,37,39,40,41,50,61,62,64,66,74 Repelin 105 80,81,219 Reproductive Performance 131,136 Sunset 175,177,179 RES 85 161-165 Supplementary Feeding 123 Reunion 15,19,149 Surface Irrigation 11 Revito 225-230 Suscon 19 RG 11 161-165 Suxon 19 RG 13 161-165 Sweet Guava 203 Rhabdosargus sarba 95-97 Sweetcorn 21-24 Richelieu Experimental Station 153 Sweetie 82 23 Rio Ringo 155 Switzerland 15 Rio Solo 155 Synthetic Pesticides 103 Root Knot 163 Rosella 23 T Rouge De Tana 153, 155-158 Tabac Bleu 161-162 Rughooputh SDDV 73,76,79 Tai So 167-173 Rummun K 21 Target Masters 7 S Technical Committee On Onions 56 Technology Transfer 38,73,81 Sabouraud Dextrose Agar 16 Teeluck M 11-12 Savannah Sweet 153, 155-158 Terrific 23 Sawdust 139-143, 145 Texas Grano 502 PRR 155 SC 66 162 Tilapia 95,97,99,102 Schinus terebinthifolius 89 Tiobelle 175 Seascape 175, 177,178, 179 Tioga 175 Seewooruthun S1 181,203,211 Tobacco 93, 161-163, 165, 195 Selva 175-179 Tobacco Board 161 Semen Quality 135 Tobacco Mosaic Virus 163 Septoria 190 Tobacco Research Station 161 Seychelles 217 Tomato56-58, 105-108, 110, 113, 195-196, 201 Sivan 155-158 Tonta JA 35,37-38 Skim Milk 132,137 Toolsee P 131 Small Cane Growers 27 Toory V 35,37 Small Planter's Desk 39 Trap Crop 103, 104, 106-108,186 Soil Conditioners 109-113 Trichogramma 106 Soil Moisture Content 2,5 Truog Method 116 Soil Properties 115,221 Turex 105, 181, 185-186 Sookar P 211 Soomary S 189 U Soonnoo AR 203-204, 211-212 UK 4, 15, 20, 41, 71, 92, 152, 154, 159, 190, South Africa 31,149 209,227,230 Souvenir Drip Irrigation Pilot Project37, 39-40 Ultisols 117 Spectrophotometry 115 United States Department of Agriculture 162 Speight G 126 161,163 University of Mauritius 43, 47, 51, 59, 61, 73, Sphyraena barracuda 98 81, 95, 100, 103-105, 107-110, 115 Spotted Borer 15 Unmole L 203

AMAS 1997. Food and Agricultural Research Council, Réduit, Mauritius
239
Sprinkler Irrigation 13,61, 103,106 us 105, 162-163, 165, 174, 209, 217 Star 5501 155-156 Star 5502 155 Star 5504 15 3-158 V Star Grass 124 VAMA 109,111 Stenotaphrum dimidiatum 124-126 Vegetable Corn 21 Sterile Insect Release Method 203 Venison 123 Stocking Density 128 Vesta 30 162 Strawberry 175, 179-180 Veterinary Laboratory 142 Sugar Cane 1,2,4, 7, 11, 13, 15, 19, 21-22, 24 Veterinary Services 137, 142
Vetivera zizanoides` 104 Vieille Fille 104 Vinyl Polymers 110 W Wai Chee 169-170 Walkley And Black Method 115 Water Use Efficiency 12,13, 69,109,112 Weather Fleck 161,163,165 Website 46-48 White Grub 15-17,19 White Mammoth 61 162 Wischmeier Nomograph 223 Wood Chips 139 Woodshavings 139-140, 142-144 World Bank 13,43,46,48,50,52 X Xenia 22
Y Yee Tong Wah KL 147 Yellow Dessex 153-158 Yellow Mammoth 58 162 Yook Ho Pow 169 Z Zea mays 21 Zoophthora radicans 106