Food & Agribusiness Research and Advisory · • The unemployment rate fell slightly, to 4.7% in...
26
February 2017 Food & Agribusiness Research and Advisory North American Agribusiness Review
Transcript of Food & Agribusiness Research and Advisory · • The unemployment rate fell slightly, to 4.7% in...

1Agribusiness Review February 2017February 2017
Food & Agribusiness Research and Advisory
North American Agribusiness Review

2Agribusiness Review February 2017
Economy
Climate
Consumer
Beer & Barley
Cattle
Corn
Dairy
Feed
Fruits
Pork
Poultry
Soy Complex
California Citrus Working around the Weather
Unbalanced Supplies
Prices Feeling the Pressure of Competition
More Soybeans in 2017
Exports are Driving the MarketTree Nuts
The Double-Edged Sword of WinterVegetables
Trump Dependency
Mild Winter across the Board
Craft Growth, The Trump Trade
Q4 Rally Leaves Market In Much Better Position
Looking to Brazil crop
Changing Horizons
Prices Eroding from Abundant Grain Alternatives
Mixed Messages Heading into 2017
Prices Remain Under PressureWheat
Premiumization, U.S. Bulk Wine Pricing, Chile, BrexitWine
Fertilizer Prices Reaching a Short-Term Peak/ Accelerating Demand in 2017Farm Inputs/Forestry
Mexico Update/Production up in FloridaSweeteners/Juice 20
Demand Remains Key Question/ Growing 2017 carryoutCotton/Rice
Energy Prices ReboundingInput Costs
Grain Prices Remain under PressureForward Price Curves
3
5
4
6
7
8
9
10
11
12
13
14
15
16
17
18
19
21
22
23
Report Summary

3Agribusiness Review February 2017
U.S.• With a Republican Congress on his side, President Trump should be able to forge a
substantial fiscal stimulus package in the coming months. However, it could take considerably more time before that stimulus accelerates GDP growth. Meanwhile, there are considerable downside risks to Trump’s trade policies. First of all, raising trade barriers hurts U.S. importers and erodes the purchasing power of U.S. consumers who will face higher prices. Secondly, if targeted trading partners decide to retaliate, U.S. exporters will be in the line of fire.
• The Fed’s rate projections made in December imply three hikes this year. However, the minutes of the December meeting revealed considerable uncertainty regarding the timing, size, and composition of any future fiscal and other economic policy initiatives as well as about how those polices might affect the economy. All in all, the Fed’s rate trajectory has become as much Trump-dependent as it is data-dependent. Since we expect the positive impact of fiscal policy to hit the economy rather later than earlier in 2017, and mostly in 2018, while the negative impact of trade policy could hit us much sooner, we expect only 1 hike, in December. Therefore, we expect EUR/USD to rise to 1.10 in the next 12 months.
Mexico• Mexico has become the main target of President Trump’s trade policies. He wants to
renegotiate NAFTA, impose a border tax on imports from Mexico, and let Mexico pay for a wall on the border. Given that more than 25% of Mexico’s GDP is reliant on exports to the U.S. and that income from remittances outpaced income from oil both last year and the year before, the sensitivity of MXN to Trump’s rhetoric and actions is of no surprise. In fact, we expect USD/MXN to rise to 23.00 in the coming months.
Canada • President Trump’s renegotiation of NAFTA will also affect Canada, but Mexico and
Canada are unlikely to be viewed similarly by Trump given that the U.S.’s deficit with Mexico is nearly double that of its deficit with Canada in USD terms. Nevertheless, Canadian exports to the U.S. are more than 15 times that of exports to its next largest destination, China. So while Canada is not Trump’s main target, Canada is heavily dependent on the U.S. economy. On balance, we expect USD/CAD to rise to 1.36 at the 12-month horizon.
Economy: Trump Dependency
Source: Federal Reserve of St. Louis 2017
Interest Rates
Currencies
0
1
2
3
4
5
6
Jan 06 Aug 07 Mar 09 Oct 10 May 12 Dec 13 Jul 15 Feb 17
% Y
ield
30-Year 10-Year 2-Year
Source: Bloomberg 2017; Note: Rebased at 100 as of 1 January 2013
55
75
95
115
135
Jan 13 Jul 13 Jan 14 Jul 14 Jan 15 Jul 15 Jan 16 Jul 16 Jan 17
Inde
x
CAD MXN USD

4Agribusiness Review February 2017
• After reaching a 15-year high at the end of last year, the Conference Board’s consumer confidence index declined to 111.8 in January—compared to 113.3 in December—as consumers became less optimistic about the future path of the economy in 2017. However in contrast, and probably due to timing, the University of Michigan’s consumer sentiment index remained at a 13-year high following the recent presidential election.
• The unemployment rate fell slightly, to 4.7% in December 2016, but higher inflation caused the misery index to rise to 6.8.
• Over the last 12 months to December 2016, the rate of inflation as measured by the Consumer Price Index (CPI) rose to 2.1%, the first time the index has been above 2% since 2015. The rise was largely on the back of higher energy and shelters prices. Over the same period, food prices remained unchanged as higher restaurant (food away from home) prices offset retail (food at home) prices.
• In the U.S., about half of every dollar spent on food goes towards food prepared away from home, mainly at restaurants and other food service establishments. For the 12 months prior to November 2016, consumer expenditure on food away from home rose by 8.4% and on food at home by 2.9%.
Consumer: Mixed Messages Heading into 2017
Food Sales
Source: USDA ERS, Rabobank 2017
Food Sales (USD bn)Annual YTD Cumulative
2013 2014 2015 Sept 16 Oct 16 Nov 16
Food at home 742 765 771 584 650 718
YOY change 3.7% 3.0% 0.8% 3.4% 3.3% 2.9%
Food away from home 668 697 741 598 666 731
YOY change 4.6% 4.5% 6.2% 8.2% 8.5% 8.4%
Total 1,410 1,462 1,512 1,183 1,317 1,449
Consumer Confidence Index
Food Price Inflation
Source: U.S. Bureau of Labor Statistics, Rabobank 2017
Source: U.S. Bureau of Labor Statistics, Rabobank 2017
0
2
4
6
8
10
12
14
0
20
40
60
80
100
120
Jan 08 Jan 09 Jan 10 Jan 11 Jan 12 Jan 13 Jan 14 Jan 15 Jan 16 Jan 17
mis
ery
inde
x
cons
umer
con
fiden
ce
Consumer confidence Misery index
-10%
-5%
0%
5%
10%
15%
Dec 07 Dec 08 Dec 09 Dec 10 Dec 11 Dec 12 Dec 13 Dec 14 Dec 15 Dec 16
chan
ge Y
OY
CPI Food at home Food away from home Manufacturer

5Agribusiness Review February 2017
Climate: Mild Winter across the Board• Aside from persistently cold weather across the northern
Plains and Northwest, the nation experienced unusual January warmth.
• Conditions were especially mild across the eastern half of the country, where cold outbreaks were short-lived.
• In the northern Plains and Northwest, where the weather was colder, periods of wintry precipitation provided ample moisture and insulation for winter wheat, but resulted in hardship for livestock.
• Much of the Midwest received widespread rain and snow, leading to muddy fields and feedlots.
• In the past few days, a series of Pacific storms brought significant rain to coastal areas of central and northern California, as well as Oregon and Washington, and continued snowfall across the Sierra is making a positive impact on the overall drought situation. Most of the major reservoirs in California are currently above historical averages.
• There are persistently dry conditions in the southern Plains and portions of the south, especially across Arkansas and Oklahoma. Dry conditions across the Deep South Texas and Florida’s peninsula maintained irrigation demands for citrus and vegetable crops.
U.S. Drought MonitorFebruary 7, 2017

6Agribusiness Review February 2017
Beer: Hop & Barley updates, Craft Growth, The Trump Trade
Source: USAhops, Beverage Industry Insider, Brewbound, Beer Institute, Montana Wheat and Barley Commission 2017
Source: Beer Marketer’s Insights 2016
Four of the Top 10 U.S. Craft Breweries Saw Market Penetration Shrink in 2016
• While acreage and hop production increased in the U.S. in 2016, yield per acre fell, mostly due to increasing demand for lower-yielding hop varieties. Still, harvests increased to nearly 89 million pounds, an 11% increase YOY.
• Lower yielding varieties require greater acreage to maintain output equity with higher yielding varieties, which has led to higher prices and production costs.
• Heavy rain in 2014 led to substantial harvest damage and ensuing supply shortages in domestic barley markets. Over-contracting in 2015 and 2016, on the other hand, caused a production spike in the same regions. Supply surpluses have resulted in reductions of acreage contracts by brewers ranging from 20% to 60% in Montana, North Dakota and Idaho. The state of Montana alone is estimating revenue losses of up to USD 65 million.
• On the craft brewing side, 2016 marked the first year that the sector had a CAGR in the single digits since 2010, forcing brewers to continually innovate to keep their brand image fresh. New craft offerings include nitrogen-, fruit- and spice-infused beers, which are trending in the marketplace.
• Imports from Mexico continued to hover around a 14% gain YTD coming into December 2016, with over 630m gallons imported as of November. The Trump administration’s talk of a 20% tariff on Mexican imports could weigh on this trend, if enacted.
5-year Historic Hop Market Chart
1,500
1,600
1,700
1,800
1,900
2,000
2,100
0
10,000
20,000
30,000
40,000
50,000
60,000
70,000
2012 2013 2014 2015 2016
Poun
ds
Acr
es
Acres Harvested Gross $ per Acre Yield
Source: USAhops 2017
-300
-200
-100
0
100
200
Bbls 2015-2016 Y-O-Y Avg Bbls 2010-2016YOY Bbls 2015-2016
Gross USD/Acre
YOY Avg. Bbls 2010-2016

7Agribusiness Review February 2017
Sources CME, Rabobank 2017
Fed Steer Prices (Five Market Average)
CME Feeder Index
Sources USDA, Rabobank 2017
U.S.• From the October low of USD 97.5, a January peak on top of USD 122 provided a 25%
improvement in prices, leaving the market in a much stronger position for 2017 price projections. The price recovery was driven by producers becoming more current on fed cattle marketings, excellent beef exports through the second half of the year and consumers responding to lower retail beef prices.
• Our current fed steer price forecasts for the coming year are: Q1 USD 110 to USD 120, Q2 USD 108 to USD 118, Q3 USD 90 to USD 105, and Q4 USD 98 to USD 110.
• Monthly beef exports for the second half of 2016 averaged a 23% increase over the second half of 2015. U.S. exports as an annual percentage of beef production have never exceeded 10%. Indications are that 2017 will be the year U.S. exports exceed 10% of production. The increased export pace was driven by the combination of lower wholesale beef prices, a moderate to strong US dollar and by sharply curtailed exports from Australia due to drought liquidation.
• USDA’s 1 January Cattle Inventory numbers showed a stronger than expected growth rate in 2016. All Cattle and Calves, at 93.6m head, was up 2%, All Cows and Calved Heifers at 40.6 head, was up 3%. Beef Replacement Heifers are up 1%, Dairy Replacement Heifers at 4.8 m head, are down 1% and Other Heifers at 8.9 m head, are up 1%. Steers 500 lbs and Over at 16.4m head, are up 1%, Calves under 500 lbs at 14.4 m head, are up 2% and the 2016 Calf Crop at 35.1 m head, are up 3%. While at a slower pace, herd expansion continues and supplies of cattle outside feed yards are building. There is a growing risk of hitting capacity limitations on fed beef slaughter.
Mexico• Mexican cattle demand is on the rise, as exports to the U.S. are increasing, pushed mainly
by a weakened peso. In January of 2017, Mexico exported a total of 74.800 head to the U.S., 2.5 times more than the same month last year. Steers continue to be the majority of exports, however, heifer exports are higher by 8,000 head than the same month in 2016.
120
150
180
210
240
Jan Feb Mar Apr May Jun Jul Aug Sep Oct Nov Dec
Pric
e Pe
r cw
t
5 Yr Avg 2015 2016 2017
95
115
135
155
175
Jan Feb Mar Apr May Jun Jul Aug Sep Oct Nov Dec
Pric
e Pe
r cw
t
5 Yr Avg 2015 2016 2017
Cattle: Q4 Rally Leaves Market In Much Better Position

8Agribusiness Review February 2017
• It is February, the dead of winter and commodity markets are relatively quiet. While is doesn’t seem that way, corn futures have made a nice rebound from their harvest lows of nearly USD 3.00 at the first of September to nearly USD 3.70 which is currently acting as the market’s ceiling. Currently, futures are trading between USD 3.55 and USD 3.70. According to our model, futures are trading fairly, based on the current supply/demand situation.
• The first milestones for the corn market will be the harvest of the first Brazilian corn crop and the Prospective Planting report at the end of the March. The Brazilian summer crop is developing favorably. We are looking for a 28 million metric ton (MMT) crop by the end of March, up 6.5% versus last year’s crop. The developing La Niña raises some concerns about the second crop (safrinha) which will be planted in February and March. Assuming normal weather, the safrinha crop is projected to be 56 MMT, bringing the total 2017 Brazilian corn crop to 84 MMT, up a whopping 26% from 2016. This could very well pressure prices lower and increase Brazil’s exports for 2017.
• The second milestone mentioned above will be the Prospective Plantings report out at the end of the March. We are projecting U.S. planted corn acres at 92.9 million acres, down 1.2 million acres from last year. As a result, stocks are expected to contract in the 2017/18 crop year, but will still be over 2.0 billion bushels and keep farmer received price in the USD 3.50-USD 3.75 range.
• U.S. corn exports have been a pleasant surprise this year. Through 2 February, U.S. corn export inspections were running 78% ahead of last year’s pace. U.S. corn exports have benefited from low prices, USD weakness last fall and of course Brazil’s lack of exportable corn. It is going to be difficult for this pace to continue for much longer as Brazil will return to the export market in 2017/18.
• 2016 was the first year the Chinese government exited the state stockpiling program and switched to more market-oriented sourcing. This changed the high prices, high stocks and high import environment. Corn acreage, and therefore production, has decreased in the first year and more is expected this year.
• Despite China’s decreasing production and increasing corn consumption, imports of corn, feed barley, sorghum and DDGs are expected to stay low in 2017. Chinese corn stocks in state reserves remain over 230 MMT and will fill the gap between supply and demand. Corn stocks are expected to decline just 5-10 MMT in 2017/18.
Source: USDA, Rabobank 2017
Source: Rabobank 2017
Declining Corn and Wheat Acres and Increasing Soybean Acres
Brazilian Corn Production Rebounds in 2017
40
60
80
100
1990 1992 1994 1996 1998 2000 2002 2004 2006 2008 2010 2012 2014 2016
Mill
ion
Acr
es
Corn Soybeans All Wheat
0
20,000
40,000
60,000
80,000
100,000
Met
ric T
ons
Feed & Residual FSI Exports Production
Corn: Looking to Brazil crop

9Agribusiness Review February 2017
• U.S. all milk prices have continued their steady climb through December 2016, with December prices landing at USD 18.80/cwt. The increase in U.S. prices looks modest compared to the ardent climb in world prices, which have left milk prices for most producers in the EU and Oceania back in the breakeven range.
• International prices continued to rise though the 4th quarter of 2016. World dairy prices finally converged with the U.S. in Q4 2016. Cheese and butter stocks continue looming over the market (1,213mln lbs of cheese and 220mln lbs of butter). Current, EU intervention stocks remain at 4.5 MMT LME, which is the equivalent of a month of world dairy trade.
• The U.S. is the only country out of the ‘Big 7’ currently expanding milk supply. Total ‘Big 7’ production contracted by 13% in November 2016, which removed 4.2 MMT of milk from the market. Meanwhile the U.S. has continued expanding at a continual rate of around 2% vs. previous year.
• Rabobank maintains the view that milk supply from the big 7 will remain in a contraction phase through 1H and keep some pressure on prices in the short term. However, as we enter 2H, NZ, EU, Argentina and Brazil should slowly resume expansion of production, placing some pressure on prices.
• Uncertainty is abound in the markets in which dairy is included and higher levels of volatility remain a challenge as significant upside and downside potential exists. With the new administration taking action, withdrawing from TPP, potentially disrupting trade with Mexico and planning on NAFTA renegotiation, there are increasing short-term challenges for U.S. exports as EU intervention stocks look increasingly attractive to a frustrated Mexico from a political and affordability perspective.
• The strong U.S. dollar, slowing down of China’s economic growth, continuing high global milk inventories and potential disruption in the U.S. trade with Mexico will continue to pose challenges for U.S. dairy exports in the near term. However, the current situation could likely open up other markets – specifically Russia, which is the second-largest dairy importer in the world. Trade opportunities with Russia can give the U.S. comparative advantage over other large dairy exporters, especially the EU, which does not have access to the Russian market.
‘Big 7’ keeps contracting the milk supply, while U.S. continues to grow
Source: USDA, Rabobank 2016
Global Dairy Prices Increased 36% in the 3rd quarter of 2016 (US/Ton)
Source: Rabobank. USDA, GDT 2016
-8.0%
-4.0%
0.0%
4.0%
8.0%
Jan
Apr Ju
lO
ctJa
nA
pr Jul
Oct
Jan
Apr Ju
lO
ctJa
nA
pr Jul
Oct
Jan
Apr Ju
lO
ctJa
nA
pr Jul
Oct
2011 2012 2013 2014 2015 2016
perc
enta
ge c
hang
e Y
OY
Big 6 USA
‘Big 6’ are all the ‘Big 7’ countries w/o the U.S.
Dairy: Changing Horizons

10Agribusiness Review February 2017
DDGs• DDG prices continue to move downward as a result of bearish news from Asia and low
prices of competing feed ingredients.
• China's full-year 2016 DDG imports were down 55 percent YOY to 3.07 million tons due to recently-imposed high tariffs on animal feed. We expect 2017 Chinese DDG import demand to continue declining.
• Some ethanol producers are trying to accelerate sales of DDGs to Mexico because they are uncertain about the risk of new tariffs disrupting trade. Any disruption to DDG exports would continue eroding prices for a commodity already nearing historic lows—not seen since 2009.
Hay• The USDA December hay stocks report indicated that there was a 1% surplus of hay in the
U.S. and a 4% surplus of hay in the Western states. However, an unusually wet and cold January has increased the demand for supplemental hay for beef cattle operations, as many have received deeper than average snow. The snow has helped move old (up to two years) feeder cattle hay out of the stack and onto the cattle ranch. This has tightened the market somewhat, pushing prices higher for lower grade feed.
• In the southern parts of the U.S., recent rainy weather has hampered shipments, as conditions have been too muddy to load and move hay. In much of the region there seems to be a slight surplus, keeping prices relatively low.
• In California, hay prices—particularly premium and supreme grades—have not seen the relatively steep decline that other regions saw, primarily because of continued export demand. Dairy producers have reduced rations to less than 8lbs of alfalfa per cow per day compared to over 8.35lbs in 2015. While reducing hay inputs they have been using alternative feeds, whether by-products or rolled corn, to supplement as more economical feed alternatives.
Source: USDA-AMS, LMIC 2017; Note: 10% Moisture, 28% to 30% Protein
Iowa DDG Price
Alfalfa Hay Price
Source: USDA-AMS, LMIC 2017
60
110
160
210
Jan Feb Mar Apr May Jun Jul Aug Sep Oct Nov Dec
USD
/ to
n
Five-year Avg. 2016 2017
120
140
160
180
200
220
240
Jan 12 Sep 12 May 13 Jan 14 Sep 14 May 15 Jan 16 Sep 16
USD
/ to
n
Feed: Prices Eroding from Abundant Grain Alternatives
11Agribusiness Review February 2017
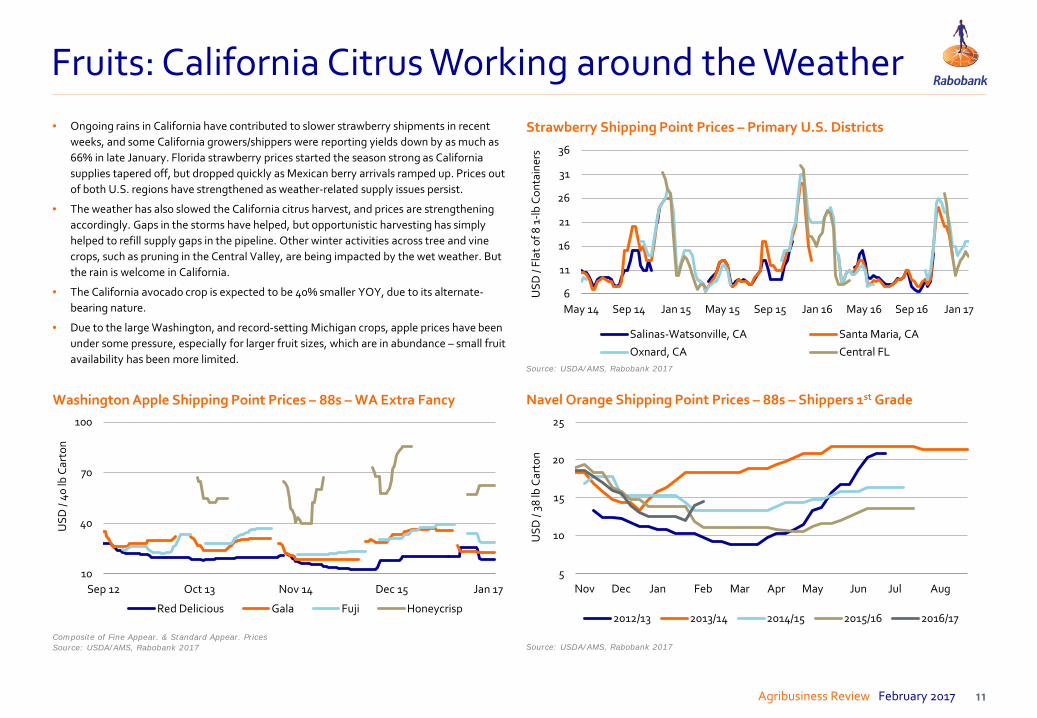
• Ongoing rains in California have contributed to slower strawberry shipments in recent weeks, and some California growers/shippers were reporting yields down by as much as 66% in late January. Florida strawberry prices started the season strong as California supplies tapered off, but dropped quickly as Mexican berry arrivals ramped up. Prices out of both U.S. regions have strengthened as weather-related supply issues persist.
• The weather has also slowed the California citrus harvest, and prices are strengthening accordingly. Gaps in the storms have helped, but opportunistic harvesting has simply helped to refill supply gaps in the pipeline. Other winter activities across tree and vine crops, such as pruning in the Central Valley, are being impacted by the wet weather. But the rain is welcome in California.
• The California avocado crop is expected to be 40% smaller YOY, due to its alternate-bearing nature.
• Due to the large Washington, and record-setting Michigan crops, apple prices have been under some pressure, especially for larger fruit sizes, which are in abundance – small fruit availability has been more limited.
Composite of Fine Appear. & Standard Appear. PricesSource: USDA/AMS, Rabobank 2017
Washington Apple Shipping Point Prices – 88s – WA Extra Fancy
Strawberry Shipping Point Prices – Primary U.S. Districts
Source: USDA/AMS, Rabobank 2017
Source: USDA/AMS, Rabobank 2017
Navel Orange Shipping Point Prices – 88s – Shippers 1st Grade
10
40
70
100
Sep 12 Oct 13 Nov 14 Dec 15 Jan 17
USD
/ 40
lb C
arto
n
Red Delicious Gala Fuji Honeycrisp
5
10
15
20
25
Nov Dec Jan Feb Mar Apr May Jun Jul Aug
USD
/ 38
lb C
arto
n
2012/13 2013/14 2014/15 2015/16 2016/17
6
11
16
21
26
31
36
May 14 Sep 14 Jan 15 May 15 Sep 15 Jan 16 May 16 Sep 16 Jan 17
USD
/ Fl
at o
f 8 1
-lb C
onta
iner
s
Salinas-Watsonville, CA Santa Maria, CAOxnard, CA Central FL
Fruits: California Citrus Working around the Weather

12Agribusiness Review February 2017
U.S.• U.S. hog prices have improved significantly since the precipitous drop in prices that
happened from last June through the end of November. As hog slaughter rates raced ahead during the late summer, the market became increasingly concerned over the availability of processing capacity come November and December when hog supplies are at their peak. Thankfully, hog slaughter plateaued in October easing the market’s concerns.
• Despite the weak Q4 in U.S. hog prices, we estimate thatbthe average US hog producer made about USD 7 per head during 2016 on an unhedged basis. Thankfully, most in the industry were hedged into year-end, aiding their bottom lines. As we look to 2017, current hog and grain futures indicate another year of profitability to the tune of USD 7 to USD 10 per head. In light of the uncertainty of both domestic and export markets we see this as a favorable opportunity for producers to lock in margins in positive territory.
Mexico• Due to a lower pig crop towards the end of 2016, prices in some regions of the country
increased in December, reaching 34 pesos/kilo. However, the national average for December 2016 was 31.93 pesos/kilo, this is an increase of 37% compared to December 2015. As sow herd continues to expand, adding 53,000 head to a total of 928,000 head, we expect a recovery in production in the second half of 2017. Pork production is expected to increase by 4.5% this year to 1.4m tons.
• As demand continues to outpace supply, imports are expected to increase by 2.4% in 2017 compared to last year. However, NAFTA is currently under review and negotiations could change any trade volumes between Mexico and the U.S. In addition, a weakened peso could have an effect on imports. Domestic consumption is expected to slightly increase due to higher domestic prices. Consumption is expected to reach 94,000 metric tons (CWE) in 2017, a 2.3% increase when compared to last year.
Source: StatCan, USDA, Bloomberg 2016
Hog Net Margin (six month lag)
17
21
25
29
33
Jan Feb Mar Apr May Jun Jul Aug Sep Oct Nov Dec
Peso
s /
kilo
Average 2009-13 2014 2015 2016
-80
-40
0
40
80
120
160
Jan 11 Dec 11 Nov 12 Oct 13 Sep 14 Aug 15 Jul 16
USD
/ he
ad
Canada Hog Prod margin US Hog Prod margin
Pork: Unbalanced Supplies
Source: Confepor, Bloomberg 2016
Mexico hog prices, pesos/kilo

13Agribusiness Review February 2017
U.S.• U.S. chicken prices had another weak start to the year, matching the challenging
beginning to 2016. The weakness in prices is evident in the contraction in profit margins of U.S. chicken producers during fourth quarter of 2016 which have averaged 7.7%; slightly below the same quarter of 2015.
• The situation in chicken pricing is really twofold, where some improvement in U.S. chicken exports is being offset by a difficult domestic market due to increased competition from expanding supplies and lower prices of beef and pork. 2016 was the first year in some time that all three major proteins increased production and at a material amount. We expect a similar increase in production of U.S. protein supply in 2017, which will again pressure white meat chicken prices.
• U.S. chicken production increased by 1.6% in 2016 and we expect a similar level of supply growth in 2017—to the tune of 1.5% to 2.0%. The major question is exports, where “high path” avian influenza has spread across other major Northern Hemisphere poultry markets over the last two months. The U.S. and Canada have not had any incidents in commercial poultry production but we see this as a major wild card through the spring.
Mexico• Chicken production is expected to increase by 2.5% in 2017 compared to the previous
year, an increase of 65,000 metric tons. This increase in production is mainly driven by higher margins experienced in 2016, which averaged 7.5%.
• Imports of chicken will account for 20% of Mexican poultry supply as demand continues to outpace supply. If trade policies continue as they are, for 2017, imports are expected to reach 850,000 metric tons, a 3.7% increase from 2016.
• As pork and beef prices continue in the upside, poultry prices have remained relatively stable and at the beginning of 2017, it is showing signs of a decrease to 32.5 pesos/kilo compared to 35.5 pesos/kilo at the end of December. This will continue to make poultry the protein of choice for consumers, supporting domestic consumption for 2017. Poultry consumption is expected to increase to 4.2 MMT in 2017, 2.5% increase YOY.
Source: USDA, Rabobank 2016
Source: USDA 2016
Chicken Prices, Composite Basis Based on Part Values
U.S. Chicken Public Company Operating Profit Margins
-12%
-8%
-4%
0%
4%
8%
12%
16%
2005 2006 2007 2008 2009 2010 2011 2012 2013 2014 2015 2016
65
75
85
95
105
115
Jan Feb Mar Apr May Jun Jul Aug Sep Oct Nov Dec
USc
/lb
5-Year Average 2015 2016 2017
Poultry: Prices Feeling the Pressure of Competition

14Agribusiness Review February 2017
• It has been an interesting winter for the soybean market, which has given producers an opportunity to lock in positive margins for both old crop and new crop soybeans. Despite the largest ending stocks in a decade, futures prices have remained about USD 10.00. Year-to-date export inspections are record due to strong Chinese demand and a relatively low USD last fall when prices were low. We don’t expect prices to remain at this level for much longer as a record Brazilian soybean crop is being harvested and becomes available to the export market, plus expectations of record U.S. soybean acres in 2017. As a result, the world is projected to have record stocks in 2016/17.
• A mentioned above, relatively high soybean prices, potential for positive margins and low input costs are expected to attract record U.S. planted soybean acres in 2017. Our current forecast places 2017 U.S. planted soybean acres at nearly 85 million acres. The expansion of soybean acres is likely in states that lost wheat acres and in the Delta. Acreage changes in the heart of the corn belt are likely to be minimal as producers maintain crop rotations.
• Much of the market’s current attention is focused on Brazil. While the USDA is forecasting a 102 MMT soybean crop in 2017, we project a slightly higher output of 104 MMT. This would be record production which is due to excellent growing weather—quite a contrast to last year’s drought-reduced crop of 95 MMT.
• As the crop year began, the outlook for U.S. exports of soybean products looked dismal, particularly for meal. Just four months into the crop year, cumulative exports for both soybean oil and meal are running 7.7 % and 5.8% respectively, behind last year. However, outstanding commitments are running ahead by 79% for soybean oil and 5.8% ahead of last year’s pace for soybean meal. Earlier in the year, this didn’t look possible, when both products were running double digit percentages behind last year. The Argentina situation has certainly helped all exporters of both vegetable oils and protein meals as end users try to ensure supply. Also, we have seen the appreciation of the US dollar versus the real and peso slow significantly and in the case of the real the trend has reversed. This development has seen export business come back to the U.S.
U.S. Soybean Export Inspections running 17% of Last Year’s Pace
Source: Rabobank 2017
Source: AMS, Rabobank 2017
Record 2017 Brazilian Soybean Production
0
50
100
150
200
250
300
350
Mill
ion
Met
ric T
ons
Argentina Brazil U.S. ROW
0
40,000
80,000
120,000
1* 3 5 7 9 11 13 15 17 19 21 23 25 27 29 31 33 35 37 39 41 43 45 47 49 51 53
1,00
0 bu
shel
s
Week #
2013/'14 2014/'15 2015/'16 2016/'17
Soy Complex: More Soybeans in 2017

15Agribusiness Review February 2017
• Almond crop receipts are 2.06 billion pounds—10% above 2015/16. Lower prices have also driven exports, they are 45% higher than this time last year. The bloom period for early pollinators is slated to start late February or early March. Late winter and early spring rains could negatively impact pollination and subsequently nut set for the 2017/18 crop.
• The 2016/17 hazelnut crop was 43,340 metric tons. This has put some downward pressure on prices. Over 90% of U.S. hazelnut in-shell exports went to Hong Kong, China, and Vietnam—during the same period, 87% of shelled shipments were delivered to Canada. As of December 2016, 59% of the U.S. crop has shipped.
• Total U.S. pecan available supply will likely be very similar to the 2015/16 crop at approximately 590 million in-shell pounds, given the 130 million in-shell pound carry-in and the likely 200 million in-shell pounds imported from Mexico. The late crop out of Georgia, and China’s immediate need for pecans increased exports and prices early in the shipping season. They have likely met a majority of their annual needs and could withhold buying near-term shipments given the current high market price. Prices will adjust accordingly.
• The 2016/17 U.S. pistachio crop was the largest ever, totaling over 900 million pounds. The Iranian crop was lighter than initially expected, helping to keep prices from declining more steeply. Shipments increased more than 230% over last year given the unusually short crop in 2015/16, and Iran’s shorter crop this season.
• Walnut domestic and export shipments are respectively 24% and 32% higher than the same period last year. Prices have increased slightly over the 2015/16 crop—a significant increase in pecan prices has convinced some buyers to switch to walnuts for their confectionery needs.
Source: Administrative Commission for Pistachios, Almond Board, California Walnut Board, Hazelnut Marketing Board, FAS 2017*through Dec. 2016**meat pound equivalent
0
50
100
150
Oct Nov Dec Jan Feb Mar Apr May Jun Jul Aug Sep
13/14 14/15 15/16 16/17
39%
36%
31%38%
-
300
600
900
1,200
1,500
13/14 14/15 15/16 16/17
Almonds**
62%
51%
69%
58%
0%
33%
66%
99%
-
10
20
30
40
50
13/14 14/15 15/16 16/17
Hazelnuts
48%41% 40%
47%
0%
33%
67%
100%
-
200
400
600
800
13/14 14/15 15/16 16/17
Walnuts
35%27%
24% 27%
0%
33%
67%
100%
-
100
200
300
400
500
13/14 14/15 15/16 16/17
Pistachios
Tree Nuts: Exports are Driving the MarketCumulative U.S. Tree Nut Shipments*(thousands of in-shell equivalent tons)
YTD Total Shipments Est. Delivered Crop + Carry In % Sold
Cumulative Pecan Exports(thousands of in-shell eq. tons)

16Agribusiness Review February 2017
• As of early February, West Coast storms continue to negatively impact supplies, and prices are responding accordingly. Additionally, ongoing planting delays will likely lead to supply gaps this spring. While the rains in California have created some short-term challenges, the industry welcomes the water, and snow, and is overwhelmingly positive about the potential for drought relief, higher reservoir levels, and greater water availability this summer.
• Broccoli prices began to rise earlier in the season than lettuce, as Santa Maria endured heavy rains, and there were supply gaps in both Yuma and Mexico.
• Heavy January snow caused the collapse of some onion packing and storage facilities in Eastern Oregon and Idaho, causing a doubling of yellow and white onion prices. The industry is managing supply carefully.
• Ideal growing conditions in Florida last fall led to high vegetable yields and very low prices earlier this winter, leaving many fields unharvested. Strong Mexican volumes of some crops, i.e. tomatoes, contributed to the glut.
Source: USDA/AMS, Rabobank 2017Source: USDA/AMS, Rabobank 2017
Wrapped Iceberg Lettuce – U.S. Daily Shipping Point Price Romaine Lettuce – U.S. Daily Shipping Point Price
Broccoli – U.S. Daily Shipping Point Price
Source: USDA/AMS, Rabobank 2017
5
10
15
20
25
30
35
40
Oct 15 Dec 15 Feb 16 Apr 16 Jun 16 Aug 16 Oct 16 Dec 16 Feb 17
USD
/ 24
cou
nt c
arto
n
5
10
15
20
25
30
35
Oct 15 Dec 15 Feb 16 Apr 16 Jun 16 Aug 16 Oct 16 Dec 16 Feb 17
USD
/ ca
rton
24s Hearts (12x3)
0
10
20
30
40
Oct 15 Dec 15 Feb 16 Apr 16 Jun 16 Aug 16 Oct 16 Dec 16 Feb 17
USD
/ ca
rton
Bunched 14s Crowns 20 lb Crowns 20 lb - Short Trim
Vegetables: The Double-Edged Sword of Winter

17Agribusiness Review February 2017
• All three wheat futures markets have been trading sideways since last year’s winter wheat harvest. The domestic and global wheat market continues to suffer from record stocks. Looking ahead, we are projecting that Chicago wheat futures will rally modestly into 2018. Currently Chicago wheat futures are trading around USD 4.40 and are expected to average USD 4.70 in the fourth quarter.
• One factor supportive to prices will be the nearly 4.0 million acres decline in planted winter wheat this year. The 32.4 million acres is the lowest on record. With such a low acreage figure, there is very little cushion for production issues and, if realized, expect price volatility.
• It is too early to draw conclusions about this year’s winter wheat crop. However, it did enter dormancy with a good or excellent crop rating of 58%. This matches the 2015 crop and is nine points above the five-year average.
• One of the bright spots of the U.S. wheat market has been exports during the 2016/17 crop year. Through 2 February, weekly U.S. export inspections are running nearly 25% ahead of last year’s pace. This is happening despite strong foreign competition and a relatively strong dollar. Wheat exporters globally have benefited from rising demand for high quality wheat in China and South-East Asia.
• Cash markets are still indicating that there is a strong demand for protein. The current 12% protein premium in Kansas City is running about USD 1.10 per bushel. While it is near the five-year average, it is nearly USD 0.20 per bushel greater than the protein premium of the last two years. In addition, the Minneapolis premium over Kansas City futures is running USD 1.25 per bushel, which is running well above the five-year average and the premium of the past several years.
Lowest Winter Wheat Acres on Record Leaves Little Cushion for Production Issues
Winter Wheat Conditions Best Since 2015
Source: NAS, Rabobank 2017
Source: NASS, Rabobank 2017
0
10
20
30
40
50
60
1990 1993 1996 1999 2002 2005 2008 2011 2014 2017
Mill
ion
acre
s
Winter Wheat Other Spring Wheat Durum
45
49
53
57
61
10/23/16 10/30/16 11/06/16 11/13/16 11/20/16 11/27/16 12/04/16
% G
ood
or E
xcel
lent
2015 2016 2017 5-Year Avg.
Wheat: Prices Remain Under Pressure

18Agribusiness Review February 2017
Source: Gomberg-Fredrikson Report, Rabobank 2016
Source: USAhops, Beverage Industry Insider, Brewbound, Nielsen, The Ciatti Company 2016
Source: Rabobank 2016
• US wine imports are continuing to grow with higher-priced cases demonstrating the largest gains. This reflects the premiumization trend in the market as consumers are increasingly trading up. We expect this trend to continue as long as stable markets and savvy consumers remain.
• Premiumization trends continue to drive the US wine market, with most of the growth coming from price points above USD 10 per bottle, though the segment below USD 10 per bottle continues to represent the majority of the volume sold.
• Rabobank forecasts point to depreciation of the Chilean peso against the dollar to 680 USD/CLP over the coming six months. As U.S. imports of Chilean bulk wine continue to rise, Chilean peso depreciations could further increase the competitiveness of Chilean cabernets relative to production from the San Joaquin Valley.
• The long term implications of Brexit are unclear, but in the short term, the resulting FX fluctuations have made EU exports to the UK far less profitable, particularly compared to exports to the U.S., given the strength of the US dollar.
• Aside from the immediate currency shifts, a change in trade policies resulting from Brexit may shake-up the current import/export relationship the UK has with the rest of the world. Given that the UK is the second-largest wine importer in the world, the industry may experience shifts to the current UK import model for wine.
Wine: Premiumization, US Bulk Wine Pricing, Chile, Brexit
0
20
40
60
80
100
-15%
-10%
-5%
0%
5%
10%
15%
France NewZealand
Italy Spain Argentina Chile Australia
Aug
201
6 Y
TD g
row
th
Growth (%) Price/case (RHA)
0.0
0.5
1.0
1.5
2.0
EUR-USD EUR-GBPJun-14 Jan-17
Average price per case and growth rate of U.S. imports from selected countries, YTD Aug 2016
FX Fluctuations
GBP depreciation
USD appreciation

19Agribusiness Review February 2017
Forestry• Last year’s housing starts were estimated to be 1.166 million units. 2017 is estimated to be
nearly 10% higher, which could increase the demand and bolster prices for OSB. Strong demand and consistent production supported rising OSB prices in 2016 and moving into 2017 prices are anticipated to continue moving in a similar fashion as new-home construction is the biggest market for OSB.
• Canadian producers shipped lumber, duty- and quota- free, to the U.S. throughout 2016. This, along with a stronger US dollar and increasing demand in the housing market, bolstered returns to Canadian producers. Potential changes to U.S. trade policy could reduce Canadian shipments moving forward.
• Total demand in China was stronger than anticipated in 2016, given the country’s slowing GDP. Despite strong Chinese demand, North American exports lost significant market share as Russia, Scandinavia, and other Eastern European suppliers were more cost competitive.
• The recent storms have relieved much of the drought in California, which will potentially increase the demand from crop producers/processors for low-end plywood and boards for pallets to build new or to refurbish old crates and pallets.
• NBSK pulp producers are raising prices, effective 1 Feb. The price hike is in response to rising domestic spot prices and increasing demand from China, and will increase NBSK prices by USD 20 per mt. 2016 marked the second year in which BHK shipments surpassed BSK shipments, the strong demand growth is being driven by new tissue machines around the world—especially in China.
FertilizerPrices Reachinga Short Term Peak• Fertilizer prices, as measured by the composite Green Markets Weekly U.S. Fertilizer
Price Index, have gained +15% since our October report, continuing the trend that began last Summer. Looking out for the next three months, we see the seasonal upward lift in nutrient prices dissipating, with the next likely major move to the downside. Following are the key variables across the NPK complex underpinning our conclusion:
• Nitrogen (N)—an oversupplied global market is poised to see new capacity come online in the U.S. during 2017 due to, among other things, planned expansions by CF Industries, OCI and Yara.
• Phosphate (P)—recent comments by PotashCorp point to a challenging environment for manufacturers. Record Chinese exports and phosphate plant capacity additions in excess of demand are both likely to pressure prices during 2017.
• Potash (K)—Although the world’s major suppliers are ‘talking up’ prices against a backdrop of stable demand, the important price negotiations for the Chinese and Indian markets will likely place a ceiling on current price levels.
Source: Random Lengths, Forest2Market, RISI 2017Source: Bloomberg, Green Markets, Rabobank 2017
Nutrient Price Change Index
Industry HighlightsJan. or most
recentLast month Last year
Southern Yellow PineStud lumber, USD/mbf
365 365 338
Oriented Strand Board 15/32” Shipped to Los Angeles, USD/mbf
350 335 284
NBSK from North America to China, USD/mt
762 735 697
U.S. Housing Starts(thousands of units)
1,226 1,102 1,149
Farm Inputs & Forestry
313.77
277.71
336.80
314.89
294.70
257.82 254.37
256.88
277.24
293.31
311.76 319.29
225
250
275
300
325
350
375
Dec 15 Feb 16 Apr 16 Jun 16 Aug 16 Oct 16 Dec 16 Feb 17
Inde
x
Green Markets Weekly US Fertilizer Index
Farm Inputs
20Agribusiness Review February 2017
Sweeteners & Orange Juice Orange JuiceSweeteners• Uncertainty continues to hang over the domestic sugar market. The Suspension
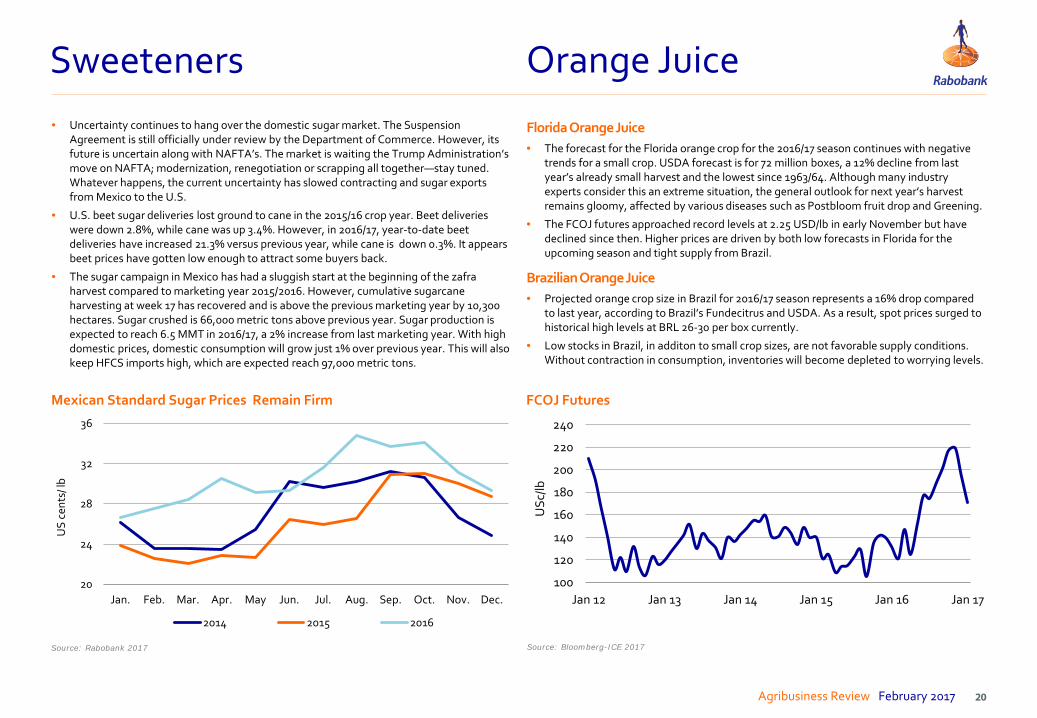
Agreement is still officially under review by the Department of Commerce. However, its future is uncertain along with NAFTA’s. The market is waiting the Trump Administration’s move on NAFTA; modernization, renegotiation or scrapping all together—stay tuned. Whatever happens, the current uncertainty has slowed contracting and sugar exports from Mexico to the U.S.
• U.S. beet sugar deliveries lost ground to cane in the 2015/16 crop year. Beet deliveries were down 2.8%, while cane was up 3.4%. However, in 2016/17, year-to-date beet deliveries have increased 21.3% versus previous year, while cane is down 0.3%. It appears beet prices have gotten low enough to attract some buyers back.
• The sugar campaign in Mexico has had a sluggish start at the beginning of the zafraharvest compared to marketing year 2015/2016. However, cumulative sugarcane harvesting at week 17 has recovered and is above the previous marketing year by 10,300 hectares. Sugar crushed is 66,000 metric tons above previous year. Sugar production is expected to reach 6.5 MMT in 2016/17, a 2% increase from last marketing year. With high domestic prices, domestic consumption will grow just 1% over previous year. This will also keep HFCS imports high, which are expected reach 97,000 metric tons.
Source: Bloomberg-ICE 2017
FCOJ Futures
Florida Orange Juice• The forecast for the Florida orange crop for the 2016/17 season continues with negative
trends for a small crop. USDA forecast is for 72 million boxes, a 12% decline from last year’s already small harvest and the lowest since 1963/64. Although many industry experts consider this an extreme situation, the general outlook for next year’s harvest remains gloomy, affected by various diseases such as Postbloom fruit drop and Greening.
• The FCOJ futures approached record levels at 2.25 USD/lb in early November but have declined since then. Higher prices are driven by both low forecasts in Florida for the upcoming season and tight supply from Brazil.
Brazilian Orange Juice• Projected orange crop size in Brazil for 2016/17 season represents a 16% drop compared
to last year, according to Brazil’s Fundecitrus and USDA. As a result, spot prices surged to historical high levels at BRL 26-30 per box currently.
• Low stocks in Brazil, in additon to small crop sizes, are not favorable supply conditions. Without contraction in consumption, inventories will become depleted to worrying levels.
100
120
140
160
180
200
220
240
Jan 12 Jan 13 Jan 14 Jan 15 Jan 16 Jan 17
USc
/lb
Mexican Standard Sugar Prices Remain Firm
Source: Rabobank 2017
20
24
28
32
36
Jan. Feb. Mar. Apr. May Jun. Jul. Aug. Sep. Oct. Nov. Dec.
US
cent
s/ lb
2014 2015 2016

21Agribusiness Review February 2017
Cotton & Rice RiceCotton• Total 2016/17 U.S. rice production is estimated to be 224 million cwt. The USDA estimates
that the long grain crop accounted for 75% of total production. Yields per acre in 2016/17 were lower than previous years—especially in the south—due to adverse weather.
• The USDA projects prices for long grain to be between USD 9.20 per cwt. and USD 10.20 per cwt in 2017. Poor growing conditions during the summer have significantly reduced the quality of rice produced. Industry experts suggest the quality is as bad or worse than it was in 2010.
• The USDA estimates total stocks for long and medium grain to be be 106 million cwt and 50 million cwt respectively. Total stocks are the second highest they’ve been in the last decade, second only to the peak in 2010. The increased stocks will likely put added downward pressure on already low prices moving into 2017.
• Southern medium grain will likely continue trading in parity with long grain, while California medium grain is projected to sell between USD 13 per cwt-USD 14 per cwt during 2017.
• The ICE #2 had an explosive start to 2017, reaching levels of +77 USc/lb and rallying over 6% YTD—the largest move across major global agri markets. The move follows persistent speculator optimism (Managed Money holds the highest net long on record) and a large imbalance in the net on-call position. As of 27 January, -28,576 unfixed net contracts were reported on March 2017—all requiring fixing with long futures prior to contract expiry.
• Expectations of expanding 2017 US acreage appear commonplace. Early US acreage expansion estimates vary from 5% to 6% YOY, at near 10.5m acres, following recent encouraging farmer returns. Assuming a 820 lb/acre yield and the absence of production shocks, this suggests another near-17m bale 2017/18 harvest—bringing a further increase in US stocks. Demand for US exports remains very strong, with total commitments currently running at 9.7m bales for the year—a 5-year high.
• As far as fundamentals are concerned, global supplies (excluding China) are expected to add 2% in 2017/18. Once the above short-term factors play out, our expectations are for the ICE #2 to trade at more modest levels in the coming months, falling back to the low 70 USc/lb region by year’s end.
12-Month Historic U.S. Short/Medium and Long Grain Prices
Source: USDA, Rabobank 2017
Old crop U.S. cotton is being exported at pace, with U.S. upland total commitments on track to surpass the USDA’s 12.2m bale forecast
2
4
6
8
10
12
14
1 4 7 10 13 16 19 22 25 28 31 34 37 40 43 46 49 52
Mill
ion
bale
s
Week2015/16 2014/15 2013/14
2016/17 5-Year average January 16/17 forecast
9
11
13
15
17
19
21
23
USD
/cw
t
U.S. Long Grain Jupiter Calrose
Source: USDA/NASS, Rabobank 2017 Note: Average rough rice basis

22Agribusiness Review February 2017
250
350
450
550
650
Jan Feb Mar Apr May Jun Jul Aug Sep Oct Nov Dec
USD
/sho
rt to
n
Ammonia (3-Yr Avg.) DAP (3-Yr Avg.)Potash (3-Yr Avg.) Ammonia (2017)DAP (2017) Potash (2017)
Source: O'Neil Commodity Consulting, AMS-USDA 2017
Source: NYMEX 2017
Corn Belt Input Prices*
Diesel — Midwest Natural Gas Spot
Ocean Freight
Source: Bloomberg 2017* Note: granular potash
Source: EIA 2017
As of 9 February 2017
1.8
2.0
2.2
2.4
2.6
2.8
3.0
3.2
Jan Feb Mar Apr May Jun Jul Aug Sep Oct Nov Dec
USD
/gal
Three-year Avg. 2016 2017
1.5
2.0
2.5
3.0
3.5
4.0
Jan Feb Mar Apr May Jun Jul Aug Sep Oct Nov Dec
USD
/mill
ion
BTU
Three-year Avg. 2016 2017
0
20
40
60
80
Jan 09 Jan 10 Jan 11 Jan 12 Jan 13 Jan 14 Jan 15 Jan 16 Jan 17
USD
/ton
Gulf to Japan PNW to Japan
Input Costs

23Agribusiness Review February 2017
Source: CBOT, Rabobank 2017
Source: CBOT, Rabobank 2017
Source: CBOT, Rabobank 2017
Sources: CBOT, Rabobank, 2014
Source: CBOT, Rabobank 2017
CBOT – Soymeal CBOT – Soy Oil
CBOT – Corn CBOT – Soybeans
3.0
3.5
4.0
4.5
5.0
5.5
6.0
USD
/bu
8
9
10
11
12
13
14
15
16
USD
/bu
250
300
350
400
450
500
550
USD
/sho
rt to
n
25
29
33
37
41
45
USc/
lb
Forward Curve
Forward Curve
Forward Curve
Forward Curve
Forward Price CurvesAs of 9 February 2017

24Agribusiness Review February 2017
Source: CBOT, Rabobank 2017
Source: CBOT, Rabobank 2017
Source: CBOT, Rabobank 2017
Source: CBOT, Rabobank 2017
CBOT – Lean Hogs CBOT – Live Cattle
CBOT – Wheat CBOT – Feeder Cattle
105
125
145
165
185
205
225
245
265
USc
/lb
405060708090
100110120130140
USc/
lb
8595
105115125135145155165175
USc/
lb
3.5
4.5
5.5
6.5
7.5
USD
/bu
Forward Curve ForwardCurve
Forward Curve Forward Curve
Forward Price CurvesAs of 9 February 2017

25Agribusiness Review February 2017
Source: ICE, Rabobank 2017
Source: ICE, Rabobank 2017
Source: ICE, Rabobank 2017
Source: ICE, Rabobank 2017
ICE – FCOJ ICE – #11 Sugar
ICE – #2 Cotton ICE – Cocoa
1800
2000
2200
2400
2600
2800
3000
3200
3400
USD
/ton
105
125
145
165
185
205
225
245
USc
/lb
10
12
14
16
18
20
22
24
USc
/lb
55
60
65
70
75
80
85
90
95
USc
/bal
e
Forward Curve ForwardCurve
Forward Curve Forward Curve
Forward Price CurvesAs of 9 February 2017

26Agribusiness Review February 2017
Sterling LiddellSenior Analyst — G&O
This document has been prepared by Rabobank and is intended for discussion purposes only. Neither this document nor any other statement (oral or otherwise) made at any time in connection herewith is an offer, invitation or recommendation to acquire or dispose of any securities or to enter into any transaction. Potential counterparties are advised to independently review and/or obtain independent professional advice and draw their own conclusions regarding the economic benefit and risks of this transaction and legal, regulatory, credit, tax and accounting aspects in relation to their particular circumstances. Distribution of this document does not oblige Rabobank Nederland to enter into any transaction. Any offer would be made at a later date and subject to contract, satisfactory documentation and market conditions. Rabobank Nederland may have positions in or options on the securities mentioned in this document or any related investments or may buy, sell or offer to buy or sell such securities or any related investments as principal or agent on the open market or otherwise. Rabobank Nederland makes no representations as to any matter or as to the accuracy or completeness of any statements made herein or made at anytime orally or otherwise in connection herewith and all liability (in negligence or otherwise) in respect of any such matters or statements is expressly excluded, except only in the case of fraud or willful default. In this notice "Rabobank " means Coöperatieve Centrale Raiffeisen-Boerenleenbank BA (whether or not acting by its New York Branch) and any of its associated or affiliated companies and directors, representatives or employees. With respect to this notice, in the US, any banking services are provided by Coöperatieve Centrale Raiffeisen-Boerenleenbank BA Rabobank Nederland, New York Branch and any securities related business is provided by Rabo Securities USA, Inc., a US registered broker dealer.
Philip MareySenior U.S. Strategist — Financial Markets Research
E-mail [email protected]
Will SawyerSenior Analyst – Animal Protein
E-mail [email protected]
Andrick PayenAssociate Analyst
E-mail [email protected]
Nick FeredaySenior Analyst — Consumer Foods
E-mail [email protected]
Stephen RannekleivGlobal Strategist – Beverages
E-mail [email protected]
E-mail [email protected]
Don CloseSenior Analyst — Beef
E-mail [email protected]
Steve NicholsonSenior Analyst — G&O
E-mail [email protected]
Al GriffinData Analyst
Coordinator of the Agribusiness Review
E-mail [email protected]
Paula SavantiSenior Analyst — Consumer Foods
Charlie ClackJr. Commodities Analyst — ACMR
E-mail [email protected]
Roland FumasiSenior Analyst — Fresh Fruits and Vegetables
E-mail [email protected]
James WilliamsonAnalyst
E-mail [email protected]
Kenneth S. ZuckerbergSenior Analyst — Farm Inputs
E-mail [email protected]
Pablo SherwellHead of Food and Agribusiness Research and Advisory, North America
E-mail [email protected] [email protected]
Xinnan LiAssociate Analyst
E-mail [email protected]
Jim WatsonSenior Analyst — Beverages
E-mail [email protected]
Buddy GatesAssociate Analyst
E-mail [email protected]
Aga Dobrowolska-PerryAnalyst - Dairy
E-mail [email protected]
Thomas BaileySenior Analyst — Dairy
E-mail [email protected]
Food & Agribusiness Research and Advisory