Fomc 19990518 g Bpt 119990513
47
Prefatory Note The attached document represents the most complete and accurate version available based on original copies culled from the files of the FOMC Secretariat at the Board of Governors of the Federal Reserve System. This electronic document was created through a comprehensive digitization process which included identifying the best- preserved paper copies, scanning those copies, 1 and then making the scanned versions text-searchable. 2 Though a stringent quality assurance process was employed, some imperfections may remain. Please note that this document may contain occasional gaps in the text. These gaps are the result of a redaction process that removed information obtained on a confidential basis. All redacted passages are exempt from disclosure under applicable provisions of the Freedom of Information Act. 1 In some cases, original copies needed to be photocopied before being scanned into electronic format. All scanned images were deskewed (to remove the effects of printer- and scanner-introduced tilting) and lightly cleaned (to remove dark spots caused by staple holes, hole punches, and other blemishes caused after initial printing). 2 A two-step process was used. An advanced optimal character recognition computer program (OCR) first created electronic text from the document image. Where the OCR results were inconclusive, staff checked and corrected the text as necessary. Please note that the numbers and text in charts and tables were not reliably recognized by the OCR process and were not checked or corrected by staff.
-
Upload
fraser-federal-reserve-archive -
Category
Documents
-
view
224 -
download
0
Transcript of Fomc 19990518 g Bpt 119990513

Prefatory Note
The attached document represents the most complete and accurate version available based on original copies culled from the files of the FOMC Secretariat at the Board of Governors of the Federal Reserve System. This electronic document was created through a comprehensive digitization process which included identifying the best-preserved paper copies, scanning those copies,1 and then making the scanned versions text-searchable.2 Though a stringent quality assurance process was employed, some imperfections may remain.
Please note that this document may contain occasional gaps in the text. These gaps are the result of a redaction process that removed information obtained on a confidential basis. All redacted passages are exempt from disclosure under applicable provisions of the Freedom of Information Act.
1 In some cases, original copies needed to be photocopied before being scanned into electronic format. All scanned images were deskewed (to remove the effects of printer- and scanner-introduced tilting) and lightly cleaned (to remove dark spots caused by staple holes, hole punches, and other blemishes caused after initial printing). 2 A two-step process was used. An advanced optimal character recognition computer program (OCR) first created electronic text from the document image. Where the OCR results were inconclusive, staff checked and corrected the text as necessary. Please note that the numbers and text in charts and tables were not reliably recognized by the OCR process and were not checked or corrected by staff.

Strictly Confidential (FR) Class II FOMC
Part 1 May 13, 1999
CURRENT ECONOMICAND FINANCIAL CONDITIONS
Summary and Outlook
Prepared for the Federal Open Market Committeeby the staff of the Board of Governors of the Federal Reserve System

Strictly Confidential (FR) Class II FOMC
May 13, 1999
SUMMARY AND OUTLOOK
Prepared for the Federal Open Market Committeeby the staff of the Board of Governors of the Federal Reserve System

Domestic Developments
The U.S. economy continued to enjoy a combination of brisk growth and lowinflation during the first quarter of 1999. A further huge increase in domesticspending more than offset a sharp drop in net exports, propelling real GDPupward at a somewhat faster pace than we projected in the last Greenbook. Thisgain came at no immediate inflation cost, however, because wages wereremarkably subdued and, moreover, labor productivity registered anotherstriking advance. All this added up to a surprisingly strong performance forcorporate profits, and share prices responded accordingly.
The prospects for demand seem more positive at this stage than we anticipatedin our previous forecast, but the same is true of the supply side of the equation.The recent good news on productivity reinforces the view that high levels ofinvestment are paying off in greater efficiency, and we have become moresanguine about the outlook for output per worker hour. Additionally, wageincreases appear to be on a lower track than we previously had thought:Although the extraordinarily small first-quarter rise in the employment costindex was partly a reflection of declines in commissions and bonuses that couldbe reversed to some degree in coming quarters, a low inflation rate appears to bedamping the underlying wage trend even more than we previously had allowedfor in our forecast. All told, we have ended up in this Greenbook with anoticeably more favorable combination of unemployment and inflation thanbefore.
That said, our economic forecast retains some familiar features--in particular, amoderation in the pace of economic expansion and an eventual firming of wagesand prices. Although the latest rise in the stock market creates some additionalmomentum in consumption and other components of domestic demand goingforward, we have resisted the temptation to throw in the towel and extrapolatethe steep uptrend in share prices in the face of earnings that seem likely todisappoint the market. The abatement of wealth gains, along with negativeaccelerator effects on the demand for houses, autos, and business equipment,should curb the growth of domestic spending and more than offset a lesser dragfrom the external sector. Real GDP, after rising 4-1/4 percent in 1998, isprojected to increase 3-1/2 percent in 1999 and a bit more than 2-1/2 percent in2000. The figures for both this year and next are approximately 1/2 percentagepoint higher than they were in the March Greenbook.
Growth of the magnitude that we anticipate for 1999 is likely to lead to a slightfurther tightening of the labor market, and the subpar growth of output next yearonly returns the unemployment rate to its recent 4-1/4 percent level; thus, realwages are expected to remain under considerable upward pressure. Andalthough we see factory capacity remaining ample, an upturn in non-oil import

I-2 Part 1: Summary and Outlook, May 13, 1999
prices is likely to afford goods producers a tad more pricing leverage. Therecent run-up in crude oil prices will leave a major mark on headline inflation inthe near term, and the indirect effects will also add modestly to production anddistribution costs. All told, we are forecasting that the CPI excluding food andenergy, after rising only 2 percent this year, will register an increase of about2-1/4 percent next year. If oil prices fall back somewhat, as we are expecting,total CPI inflation should follow a pattern opposite to that of the core CPI,moving up to 2-1/4 percent this year and then dropping back to about 2 percentin 2000.
We obviously have had to deal with many significant uncertainties inassembling the forecast. Some of them are explored through model-basedsimulations of alternative scenarios in this and the international section. Thebaseline forecast attempts to balance what may in fact be sizable risks: We canenvision a future in which the "virtuous cycle" of exceptionally favorable realand financial (at least equity market) performance continues for a while longer,but we can also see possibilities that either an unwinding of the high equityvaluations or a deteriorating external position could lead to financial andeconomic disruptions.
Even setting such risks aside, our baseline forecast suggests that monetary policyultimately may have some work to do to maintain the progress that has beenmade toward price stability. We believe that the current level of unemploymentis unsustainable. Were we to extend our projections beyond 2000, this would beclearer, as prices would be on an accelerating trend in the absence of either anexogenous disinflationary shock or a substantial policy tightening.
Key Background FactorsThe "bond market vigilantes" appear to have been reacting to just such concerns--but only mildly. Indeed, the backup of Treasury yields in recent weeksseemingly has been, to an important degree, an unwinding of the earlier flight tosafety, as investors have shown a greater preference of late for equities andrelatively risky private debt obligations. The result has been that financingconditions have remained distinctly attractive for households and businesses.Under the circumstances, we have altered our monetary policy assumptions toincorporate a rise in the federal funds rate over the next year or so, though only amodest one that merely validates current market expectations and that would dolittle more than maintain a rough stability of real short rates in the context of anadverse inflation trend.
Under this funds rate assumption, we are projecting that longer-term Treasuryyields will fluctuate mainly in their recent range, probably tending a bit to thehigh side next year. With the economy slowing, however, the risk spreads on

Domestic Developments I-3
corporate debt are likely to widen somewhat. Banks may also become lessaccommodative in other ways, tightening lending standards and adjusting non-rate terms of credit.
Especially important for the economic outlook, however, is the path of the stockmarket. Share prices are well above the level contemplated in the last forecast--seemingly on a trajectory steeper than that in the most extreme upside alternativesimulated in the March Greenbook (the one putting the Wilshire 5000 at 15,000by the end of next year). The internal momentum of the market may well keepprices rising, but with valuations already so far beyond the historical range, wefind it difficult to buy comfortably into the thought that investors are going toshrug off completely the earnings disappointments implied by our essentiallyflat profit forecast. Moreover, Y2K jitters are likely to afflict the corporatesecurities markets to some degree later this year, and monetary policy isassumed to tighten slightly next year. Consequently, we are projecting thatequity prices will advance only a bit further in the coming months and then slipback some in 2000.
We are anticipating that the inflation-adjusted value of the dollar against a broadindex of currencies will be essentially unchanged on balance over the nextseveral quarters, following a somewhat lower path than was projected in theMarch Greenbook. The dollar is expected to be supported by the greaterstrength of the U.S. economy relative to foreign economies and by theexpectation that returns on financial investments will remain higher in theUnited States than in the still relatively sluggish economies of Japan and Europe.Nonetheless, upside potential for the dollar may be limited by the currentaccount deficit, which will widen considerably further over the projectionperiod.
Foreign economic prospects have generally improved somewhat in recentweeks, although negative risks in the outlook may not have diminished quite somuch as upbeat traders in foreign stock markets seem to have assumed. Overall,we now are predicting that foreign real GDP will rise 2-1/4 percent in 1999 and2-1/2 percent in 2000--larger gains than we had forecast in the last Greenbook.The Brazilian economy is expected to pull out of recession sooner than wepreviously predicted, and the growth rates for Mexico and Korea have beenraised appreciably. Japan, however, still is expected to contract slightly, on net,both this year and next, and growth in Europe is expected to remain modest, onbalance.
Crude oil prices have been pushed higher since late March by a combination ofOPEC production cutbacks and a slight firming of world demand. We now arepredicting that the price of West Texas intermediate will average more than $18
I-4 Part 1 Summary and Outlook, May 13; 1999
per barrel in the second quarter of this year--nearly $3 above what we wereforecasting in March. The forecast has the WTI price dropping back to $17.25a barrel by the second quarter of 2000 and holding out at that level through theend of next year. Although this ending price is only a little higher than in thelast forecast, oil prices average a good bit higher than we previously wereanticipating.
We still regard our fiscal policy assumptions as being essentially neutral interms of their impact on aggregate demand, even though they have been altereda little this month to allow for increased outlays in support of the operation inthe Balkans. In the unified budget, that add-on to spending is far more thanoffset by a higher level of revenues, the result of a combination of the higherGDP path and some technical adjustments that translate into a higher effectivetax rate on individuals. Thus, our projections of the budget surpluses for FY1999 and FY 2000 have been raised further, to $135 billion and $188 billion,respectively. The current-year forecast is about $13 billion higher than in thelast Greenbook, and the forecast for next year has been boosted $19 billion.
Recent Developments and the Outlook for the Current QuarterThe BEA's advance estimate showed the economy growing at an annual rate of4-1/2 percent in the first quarter. Data that have come in since the report wasreleased suggest, all else equal, a rate closer to 4 percent--with the bulk of thedownward revision occurring in wholesale inventories. But with March data onretail inventories and international trade yet to come, there is still considerableroom for further revision.
We expect that real GDP growth will post another solid gain in the currentquarter, our projection being about 3-1/2 percent. Although aggregateproduction worker hours in April were just marginally above the first-quarteraverage, the 226,000 increase in private payrolls last month and low initialclaims for unemployment benefits into early May suggest that hiring hascontinued apace. Thus, we are inclined to think that hours this quarter will yetshow a significant gain. Of course, that still leaves open the question of howlarge a productivity gain we shall see; we are looking for something close to the2-3/4 percent average of the past year. In the industrial sector, productionappears to be headed for a sizable increase, given the substantial jump we areestimating for April.
On the expenditure side, we are predicting that real consumer spending willgrow at an annual rate of about 4-1/4 percent in the current quarter, after havingrisen 6-3/4 percent at an annual rate in the first quarter. Spending on motorvehicles is expected to record only a small gain this quarter, and based partly onretail sales data through April, we are predicting that real outlays for goods other

Domestic Developments 1-5
than vehicles probably will rise at less than half the phenomenal 12 percentannual rate of the first quarter.
Summary of the Near-Term Outlook(Percent change at annual rate except as noted)
1999:Q1 1999:Q2Measure Mar. May Mar. May
GB GB GB GB
Real GDP 3.4 4.1 3.2 3.4Private domestic final purchases 6.7 7.5 4.1 4.7
Personal consumption expenditures 6.0 6.8 4.1 4.2Residential investment 11.6 15.6 -1.3 1.3Business fixed investment 9.1 8.2 6.7 9.2
Government outlays forconsumption and investment 1.4 4.7 2.0 .3
Change, billions ofchained (1992) dollars
Inventory investment -7.7 -7.4 13.6 16.7Net exports -45.7 -58.3 -31.3 -35.1
Indicators of housing activity are hinting at a pullback from the torrid pace seenthrough the winter. Permits for new construction fell in March, and we arepredicting that starts, too, will be turning down--partly because of capacityconstraints that are likely to become more evident with the seasonal pickup inconstruction. Residential investment expenditures are expected to increase littlein the current quarter after having risen at an annual rate of more than 15 percentlast period.
Real business fixed investment increased at an annual rate of about 8 percent inthe first quarter--a large advance but considerably slower than the 12 percentgain in 1998. We are forecasting a second-quarter rise of about 9 percent.Based partly on positive trends in orders at domestic manufacturers of capitalgoods, we expect investment in equipment to pick up a little this quarter; outlaysfor structures may soften, however, after having received a boost from mildweather this winter.
Government purchases rose 4-3/4 percent at an annual rate in the first quarter, asa steep increase in state and local expenditures more than offset a small drop infederal purchases. Growth of state and local construction outlays probably willbe slow in the near term, with good weather having permitted a speedup of road

I-6 Part 1: Summary and Outlook, May 13, 1999
building and other construction earlier in the year. Federal purchases areprojected to decline a little further this quarter despite some added spending onNATO activity in the Balkans.
Following a surprising advance at the end of 1998, net exports weakenedconsiderably in the first quarter, subtracting 2-1/2 percentage points from realGDP growth; seasonal adjustment problems and other transitory factorsprobably contributed substantially to this sharp up-and-down pattern. Thisquarter, we expect net exports to trim about 1-1/2 percentage points from GDPgrowth: Imports are projected to rise nearly as fast as in the first quarter, butexports are expected to essentially level out after a big swing over the past twoquarters.
Nonfarm inventories have risen less rapidly than business final sales over thepast couple of quarters, and stocks may have been a little to the lean side at theend of the first quarter--assuming that the March report on retail sales does notalter the picture materially. We are positing that some restocking will take placein the current quarter and that inventories will be making a contribution of about3/4 percentage point to the growth of real GDP.
Rising crude oil prices--together with a series of refinery shutdowns--havecaused the retail price of gasoline to surge in recent weeks. The increase inenergy prices in the April CPI, which will be released tomorrow morning,should be a multiple of the 1-1/2 percent rise in March. The surge in energyprices likely will cause the rate of increase in the total CPI to pick upsubstantially this quarter, to an annual rate of about 3-1/2 percent. Increases inthe core CPI over the near term are expected to be small but not quite so small asthe 0.1 percent monthly increases that we saw in the first quarter, whendeceleration of the core index likely was exaggerated by seasonal adjustmentproblems related to the introduction of geometric means. The incoming data onwages and hourly compensation have remained quite favorable: The April risein average hourly earnings was the third straight 0.2 percent monthly increaseand gave greater credence to the first-quarter ECI's signal of subdued payinflation.
The Outlook for Economic Activity beyond the Current QuarterIn the current Greenbook forecast, the growth of domestic demand isappreciably stronger than in the March Greenbook, in large part because of theimpetus from a higher stock market. Some of the increment to domestic demandis met by imports, and although exports have been revised up as well, thedeterioration in net exports is somewhat greater than in the last forecast. RealGDP at the end of 2000 is 0.9 percent higher than in the March Greenbook.

Domestic Developments I-7
On the supply side, productivity growth that is faster than we previously wereprojecting helps firms to meet the bigger gain in aggregate demand without acommensurate addition to their workforces. Consequently, the unemploymentrate runs only slightly lower, on average, in this forecast. This additional
Summary of Staff Projections(Percent change, Q4 to Q4, except as noted)
Measure 1997 1998 1999 2000
Real GDP 3.8 4.3 3.5 2.6Previous 3.8 4.2 3.0 2.2
Final sales 3.4 4.6 3.2 2.8Previous 3.4 4.5 2.9 2.3
PCE 3.7 5.3 5.0 3.3Previous 3.7 5.2 4.6 2.7
Residential investment 4.2 12.6 2.4 -2.3Previous 4.2 12.7 .3 -3.0
BFI 9.8 11.9 6.1 7.4Previous 9.8 12.2 6.1 6.5
Government purchases 1.4 1.6 1.9 2.2Previous 1.4 1.6 1.6 2.0
Exports 9.6 1.1 .4 4.3Previous 9.6 .9 -.5 4.0
Imports 14.0 9.7 10.5 8.1Previous 14.0 9.7 8.4 6.9
Change, billions of chained (1992) dollars
Inventory change 34.4 -22.3 25.6 -15.1Previous 34.4 -18.7 5.6 -13.8
Net exports -53.1 -101.0 -127.8 -68.5Previous -53.1 -102.4 -111.0 -54.5
tightness of the labor market normally would add a little to the projected rate ofinflation, but the new productivity pattern and recent favorable wage and pricenews have more than offset that consideration.

I-8 Part 1 Summary and Outlook, May 13, 1999
Y2K effects in this forecast are larger than we had allowed for in the previousGreenbook. Survey evidence and anecdotal reports that we have been hearingabout precautionary planning by households and businesses seemed to warrantthe more significant allowance. The forecast has the precautionary expendituresadding around 1/3 percentage point to real GDP growth in 1999 and theirreversal subtracting the same amount in 2000. Because, as a practical matter,monetary policy cannot smooth out these fluctuations in demand, we have beentempted to ignore the phenomenon entirely in our forecast; however, even on theassumptions we have made--which we regard as far from extreme--the forecastmay usefully highlight the distinct possibility that Y2K effects could producesignificant pressures in some sectors and certainly enough noise to make itdifficult to read the underlying trends of demand.
Consumer spending. The first-half rate of growth in consumption expenditureshas been raised about 1/2 percentage point in this forecast, and we also haveboosted the second-half forecast by a small amount. Growth over the year as awhole now is expected to be 5 percent, a gain that would nearly match lastyear's advance. Consumer spending still is expected to slow considerably in2000 but--because of the higher stock market--not so much as we previouslywere predicting. We are putting the increase next year at about 3-1/4 percent.
A variety of factors help to explain why consumer spending should decelerate.One part of the explanation is that the investment cycles for various types ofconsumer durables probably will have moved past their stimulative phases. Realexpenditures on vehicles, which rose about 15 percent in 1998, have flattenedout in recent months and are projected to edge down, on net, in 1999 and 2000.Household spending on computer and other electronic gear is expected tocontinue growing very rapidly in real terms, but the outlays for other householddurables probably will start to cool as housing construction and home sales ebb.By 2000, slower growth of disposable income and wealth is likely to havebrought about smaller gains in the outlays for nondurables and services as well.
Potential Y2K effects are at least a minor wild card in the outlook for consumerspending. Our guess is that precautionary buying in advance of the millenniumwill pull forward into 1999 some of the purchases that otherwise would havebeen made in 2000--if ever. Wood-burning stoves and home electricalgenerators reportedly have been in heavy demand, and many householdsprobably will be stocking up more heavily on food, prescription drugs, and othernecessities as the end of the year approaches. The forecast allows for a fewservice interruptions early in 2000, but these are assumed to be of short durationand not highly disruptive.

Domestic Developments I-9
A more significant question mark in the consumption forecast overall relates tothe prospects for asset prices and the influence of household wealth on spending.The important uncertainty about the future path of share prices was discussedabove. But, setting that aside, the dimension and timing of wealth effects for agiven stock market movement are impossible to nail down; this uncertainty isperhaps magnified by the fact that the wealth-income ratio has soared intouncharted territory, and we cannot be sure how such a degree of affluence willaffect consumer behavior. Our forecasts of spending have been running too lowin recent quarters--suggesting the possibility that the wealth effects from thestock market have been larger than we have been assuming. Alternatively, it isquite conceivable that the wave of mortgage refinancings and real estatetransactions unleashed by the decline in interest rates last fall has given atransitory boost to spending growth; other boosts might have been provided bymild winter weather or auto purchase incentives. We have, in effect, struck acompromise in this forecast, assuming that some, but not all, of the recent upsidesurprises reflect transitory influences.
Wealth effects contribute importantly this year to a further sharp decline in thepersonal saving rate, which falls to an annual average of -0.9 percent. Owing tothe lags in the response of spending to changes in wealth and income, the savingrate maintains a downward course in 2000 despite the assumed downturn in thestock market and slowing of income growth next year. However, next year'sdrop in the saving rate is much smaller than those of the past few years andwould represent a marked shift from the major demand stimulus that consumershave been providing.
Residential investment. We have also raised our forecast of housing activityin conjunction with the upward revision to the stock market assumptions and inresponse to the faster gains in income and employment in the current projection.Nonetheless, we continue to think that residential investment is peaking.Although sales have remained strong in recent months, their upward momentumseems to have dissipated, and the market assessments of both consumers andhome builders have cooled a bit.
In our judgment, the recent levels of starts are probably adding to the stock ofhousing at a faster pace than is sustainable over the long run--unless a continuedboom in stock prices moves people to substantially higher levels of affluence.Our forecast of starts therefore trends lower over time, but from the currentquarter on, the decline is quite gradual. Current backlogs should hold up thelevel of building activity for a while. Over the longer term, the anticipatedslowing of income and employment, especially in 2000, will be reducing thestimulus from those sources to some degree, but mortgage interest rates are

expected to remain in a range that will keep home purchase quite affordable andsupport relatively high levels of new construction and home improvement.
Business fixed investment. The changes to our forecast of business fixedinvestment are relatively small this month. We still expect the gains in realoutlays this year and next to be roughly half as large as the huge gain recorded in1998. Technological advances will continue to drive a good deal of investment,but waning accelerator effects, sluggish profits growth, and less favorableexternal financing terms are likely to temper capital spending.
Actually, evidence of some moderation in equipment demand already exists.Increases in real PDE spending have averaged about 9 percent (annual rate) inthe most recent three quarters--hardly a paltry number but one that is well belowthe earlier pace. Outlays for office and computing machines have been animportant element in the deceleration, having risen at an 80 percent rate in thefirst half of last year, 50 percent in the second half, and "only" 26 percent in thefirst quarter of this year.
We are predicting that growth of computer spending will remain comparativelysubdued, on average, into early 2000 and then pick up appreciably, but we donot feel particularly confident about this forecast. On the one hand, many largefirms accelerated their replacement cycles to deal with Y2K problems and willwant to stabilize their systems in the latter part of this year. On the other hand,some firms that did not focus on the Y2K problem earlier may be makingreplacement purchases in coming months--and others simply will feel compelledto make further investments for other business reasons, such as implementingtheir "Internet strategies." How these forces will balance out is highly uncertain--as the recent stock price volatility of the computer companies has reflected.
The other big high-tech category, communications equipment, has been verystrong of late. Rapid changes in the sector should continue to drive largeincreases in investment--though not so large as the estimated 37 percent (annualrate) burst in the first quarter.
We continue to think that investment cycles in the transportation area aretopping out. Boeing's production plans suggest that the deliveries of aircraftwill be declining substantially from recent highs, and we think that part of thedecline will show up as reduced investment by the domestic airlines. Businessinvestment in motor vehicles also has risen to high levels, and fleets have beenexpanding rapidly; as the economy decelerates, we expect investment to dropback a little and the growth of the vehicle stock to slow.
I-10 Part 1: Summary and Outlook, May 13, 1999

Domestic Developments I-11
Although orders for other types of equipment have been strong of late, the trendover the next few quarters is expected to be one of deceleration. Investment inindustrial equipment--the largest of these other equipment categories--likely willbe damped by the excess capacity in a number of manufacturing sectors.Demand for agricultural machinery will likely be held down by continuingpressures on the profitability of farming.
Real outlays for nonresidential structures are projected to grow only a little overthe next two years, as contractions in some components are about offset byexpansion in other areas. For the foreseeable future, office construction stillappears likely to be the strongest major segment of nonresidential building.Office vacancy rates have declined a great deal, and space-rents and prices havebeen climbing briskly; finance appears to be in good supply, with the REIT andmortgage-backed securities sectors looking healthier of late and other lendersand investors still showing considerable interest. On the other hand, industrialconstruction is likely to remain weak, given the aforementioned excess factorycapacity.
Government. The expanded NATO military operation in the Balkansrepresents only a modest innovation to our economic forecast. So long asAmerican participation does not involve a major commitment of ground forces,expenditures are likely to be raised just moderately within the projection period.Working from that assumption, expenditures in the unified budget will likely beboosted only a little relative to our previous forecast--which already anticipatedpassage of a significant "emergency" supplemental for military and otherpurposes. Although defense procurement runs a little higher in this forecast thanin the last, we are still projecting declines in total real purchases both this yearand next, of 1-1/2 percent and 1/2 percent respectively.
State and local expenditures are projected to rise about 3-3/4 percent in both1999 and 2000. These are larger increases than we have been seeing in recentyears, but we do not regard them as being excessively bullish. State and localgovernments have seen budgetary surpluses mount quite rapidly over the pastfew years and seemingly are positioned to start boosting spending at a fasterpace. The biggest gains are likely to come in construction. School buildingshould be strong in many locales, and spending on road construction will receivean ongoing boost from the federal highway bill passed last year.
Business inventories. Basically, the nonfarm inventory forecast shows twoyears of sustained accumulation, with a couple of quarterly bumps that deservespecial mention. One of these, already noted, is the anticipated step-up instockbuilding in the near-term, which reflects the efforts of businesses to rebuildinventories after having been surprised by the strength of sales late last year and

early this year. The second bump in the inventory forecast stems from ourassumption that businesses will be doing some precautionary stockpiling in thelatter half of this year in preparation for potential Y2K supply disruptions. Thataccumulation adds to the growth of stocks this year but creates a dip inaccumulation in the first half of 2000. Nonfarm inventory accumulationcontributes about 0.4 percentage point to real GDP growth in 1999 and subtractsa couple of tenths from growth in 2000.
Farm inventory accumulation has slowed over the past half-year, and we thinkthat the rate of stockpiling probably will fall off further in coming quarters.Producers appear likely to reduce plantings a little this year, and that shouldrestrain farm output to some degree. Nonetheless, the further increases instocks, though smaller than those of last year, will be adding to inventories thatalready are excessive. Arithmetically, this year's slowdown takes 0.1 percentagepoint off GDP growth; the effect of next year's deceleration rounds to zero.
Net exports. With the forecast of domestic demand having been boosted furtherin this Greenbook, the growth of imports has been raised as well. Thatincrement to imports more than offsets a modest upward revision to our forecastof export growth, leaving us with a bigger drop in net exports than we wereshowing in the March Greenbook. All told, we now think that this year'sdecline in net exports will subtract about 1-1/4 percentage points from GDPgrowth, a slightly more negative effect than in 1998. The downward pull on realGDP from net exports still is expected to diminish considerably in 2000, whenexports should strengthen and imports are expected to slow. (A more detaileddiscussion of the outlook for net exports is contained in the internationaldevelopments section.)
Labor markets. As evidence of a pickup in productivity has accumulated overthe past few years, we have on numerous occasions upped our estimate of theproductivity gains that might be achievable moving forward, only to berepeatedly outflanked by incoming data that were even more favorable than wehad anticipated. In this round, we once again have been confronted with aproductivity rise--the estimated first-quarter gain of 3-1/2 percent (annual rate)in the nonfarm business sector--that not only outstripped our prediction but didso by more than can be readily explained by the upside surprise to outputgrowth. It appears that structural improvements in productive efficiency havebeen considerable.
Elevated levels of investment in new equipment in recent years--especially inequipment embodying the new information technologies--have led to fastergrowth of the capital stock and in the amount of capital services per worker.This is something we have largely anticipated in recent forecasts. But, in
1-12 Part 1: Summary and Outlook, May 13, 1999

Domestic Developments I-13
addition to, or perhaps in conjunction with, the contribution of this capitaldeepening, gains in multifactor productivity (MFP) have increased substantially,by our estimate. Given that MFP is the unexplained residual in the growthaccounting framework, its behavior is difficult to forecast with great conviction,but we believe that the evidence of ongoing changes in business organizationand operations argues for a somewhat more positive view of the prospects forstructural improvements in efficiency than was implicit in our previousprojections.
In response, we have raised our forecast of the labor-productivity gains this yearand next to about 2-1/4 percent, up about 1/2 percentage point in both casesfrom the previous forecast. Y2K developments could introduce a considerableamount of volatility into the productivity data in coming quarters, and we havetried to anticipate those effects to some degree; the effects should mainly betransitory. Y2K effects aside, the projected increases in productivity this yearand next are less than was achieved in recent quarters because, as demandgrowth slows, firms do not scale back their hiring efforts commensurately in theshort run.
The Outlook for the Labor Market(Percent change, Q4 to Q4, except as noted)
Measure 1997 1998 1999 2000
Output per hour, nonfarm business 1.5 2.7 2.2 2.2Previous 1.5 2.7 1.8 1.7
Nonfarm payroll employment 2.7 2.3 2.1 1.1Previous 2.7 2.3 2.0 1.0
Employment, household survey 2.1 1.3 1.7 .8Previous 2.1 1.3 1.7 .6
Labor force participation rate' 67.1 67.1 67.2 67.2Previous 67.1 67.1 67.2 67.2
Civilian unemployment rate' 4.7 4.4 4.0 4.2Previous 4.7 4.4 4.2 4.5
1. Percent, average for the fourth quarter.
Indeed, we think that employment will continue to expand briskly for a whilelonger. Many businesses undoubtedly have been operating with fewer workersthan they would like, and that should keep hiring rolling ahead until aweakening in the growth of sales and profitability has become clearlydiscernible. We are predicting that the monthly growth of payrolls will remain

around 200,000 for several more months. In 2000, when the economy isgrowing more slowly and firms have caught up to some degree in their hiring,job growth should be slower; our forecast allows for average monthly gains inpayrolls of about 125,000 next year. Government hiring for the completion ofthe decennial Census is expected to cause a temporary blip in payrollemployment growth next spring, but the added jobs will probably be picked upmainly by individuals who already are employed; consequently, theunemployment rate should be little affected.
We are assuming that the labor force participation rate will be fluctuatingaround 67.2 percent over the next several quarters--a touch higher than in Aprilbut in line with the average of the past couple of quarters. The unemploymentrate thus should move down to about 4 percent by this fall and then return to itsrecent level by the latter part of 2000.
Wages and prices. We think that inflation will remain fairly low through nextyear; however, the underlying trend probably will be turning up mildly. Thisforecast hinges on two key factors: the continued extreme tautness of the labormarket and an end of the heretofore favorable effects of declines in the prices ofoil and non-oil imports.
On the latter score, crude oil prices have now fully reversed the decline of 1998and early 1999, and we are anticipating that prices will drop back onlymoderately from their recent levels. The earlier plunge in feedstock and energycosts may still be having favorable effects on a range of goods and servicesprices, but that will end soon. Meanwhile, prices also seem to be turning up forsome industrial commodities, and we would not be surprised if a more broadlybased upturn in these prices gets under way in coming months; indeed theincreases might be sharp in some cases, given the tendency of primary materialsprices to react quickly to changes in market conditions. More generally, withthe world economy firming and the appreciation in the exchange value of thedollar expected to abate, core non-oil import prices (which exclude the prices ofcomputers and semiconductors) seem likely to cease declining and may rise alittle. But, we would not expect the upturn to have much force initially, giventhe amount of excess capacity that is present in manufacturing here and abroad.
In the domestic economy, a focus on cost restraint has become widespread and isnot likely to lessen abruptly--especially not in the goods sector, wherecompetitive pressures are intensified by ample plant capacity. Productivitygrowth is helping businesses keep unit labor costs down, and nominal wagegains are being restrained by the good price performance. By next year, though,the restraints on domestic wages and prices may start to loosen a little. With afirming in import prices, the pressures on U.S. businesses to hold the prices of
1-14 Part 1: Summary and Outlook, May 13; 1999

tradable goods in check will diminish somewhat, and lagged effects of the rise inoil prices will have worked their way into both the business cost structure andworkers' perceptions of the cost of living. The labor market will be slightlytighter than it is at present if our forecast is correct. In these circumstances, thetrends in price and wage increases will likely begin to tilt up.
The forecast has the ECI for hourly compensation in private industry moving up3.4 percent in 2000 after rising just 3.0 percent in 1999. The ECI compensationforecast for the remainder of this year allows for a partial reversal of the declinesin commissions and nonproduction bonuses that helped keep last quarter's ECIadvance so exceptionally small. The ECI forecast also allows for a hike in theminimum wage. Congressional discussions have centered on a $1 hike thatwould occur in two or three steps; some GOP legislators have indicated that theywould swap support for such a bill for some tax breaks for businesses--especially smaller businesses. We have assumed a $1 rise that takes effect inthree equal steps, the first on October 1 of this year, the second next October,and the third in October of 2001. The contribution to the ECI from the assumedminimum wage increases this year and next rounds to 0.1 percentage point ayear.
The core CPI is predicted to increase 2.0 percent in 1999 and 2.3 percent in2000, down slightly from what we were forecasting previously. The core CPIshows a small deceleration in 1999 even when allowance is made for the BLStechnical adjustments. The forecast for 2000 would still show some accelerationon that basis, however.1
Measured in product-price terms, real compensation gains are expected to besizable in 1999 and 2000, but increases in productivity will be offsetting aconsiderable part of those pay increases. The rise in unit labor costs picks uponly slightly in our forecast, moving from 1-1/2 percent in 1998 to about 1-3/4percent in 1999 and 2000. As in the last Greenbook, the profit share declines, onnet, over the balance of 1999 and in 2000, but not so much as in the MarchGreenbook because of the upward revision to the forecast of productivitygrowth.
1. The quarterly changes in the core CPI (and the core PCE) have been adjusted to takeaccount of seasonal adjustment problems that seem to have arisen with the introduction ofgeometric means.
Domestic Developments I-15

I-16 Part 1: Summary and Outlook, May 13, 1999
Staff Inflation Projections(Percent change, Q4 to Q4, except as noted)
Measure 1997 1998 1999 2000
Consumer price index 1.9 1.5 2.3 2.1Previous 1.9 1.5 2.2 2.4
Food 1.7 2.2 1.6 1.8Previous 1.7 2.2 1.9 2.0
Energy -1.2 -9.2 7.1 .4Previous -1.2 -9.2 5.2 1.5
Excluding food and energy 2.2 2.4 2.0 2.3Previous 2.2 2.4 2.1 2.5
PCE chain-weighted price index 1.5 .7 1.6 1.5Previous 1.5 .7 1.6 1.8
Excluding food and energy 1.6 1.2 1.3 1.6Previous 1.6 1.2 1.4 1.8
GDP chain-weighted price index 1.7 .9 1.5 1.7Previous 1.7 .9 1.5 1.9
ECI for compensation of privateindustry workers' 3.4 3.5 3.0 3.4
Previous 3.4 3.5 3.4 3.5
Prices of core non-oilmerchandise imports -.7 -2.1 .1 .9
Previous -.7 -2.0 .5 1.0
Percentage pointsMEMO: Adjustments for technical
changes to the CPI2
Core CPI .2 .4 .6 .6
1. December to December.2. Adjustments are calculated relative to the methodological structure of the CPI
in 1994.
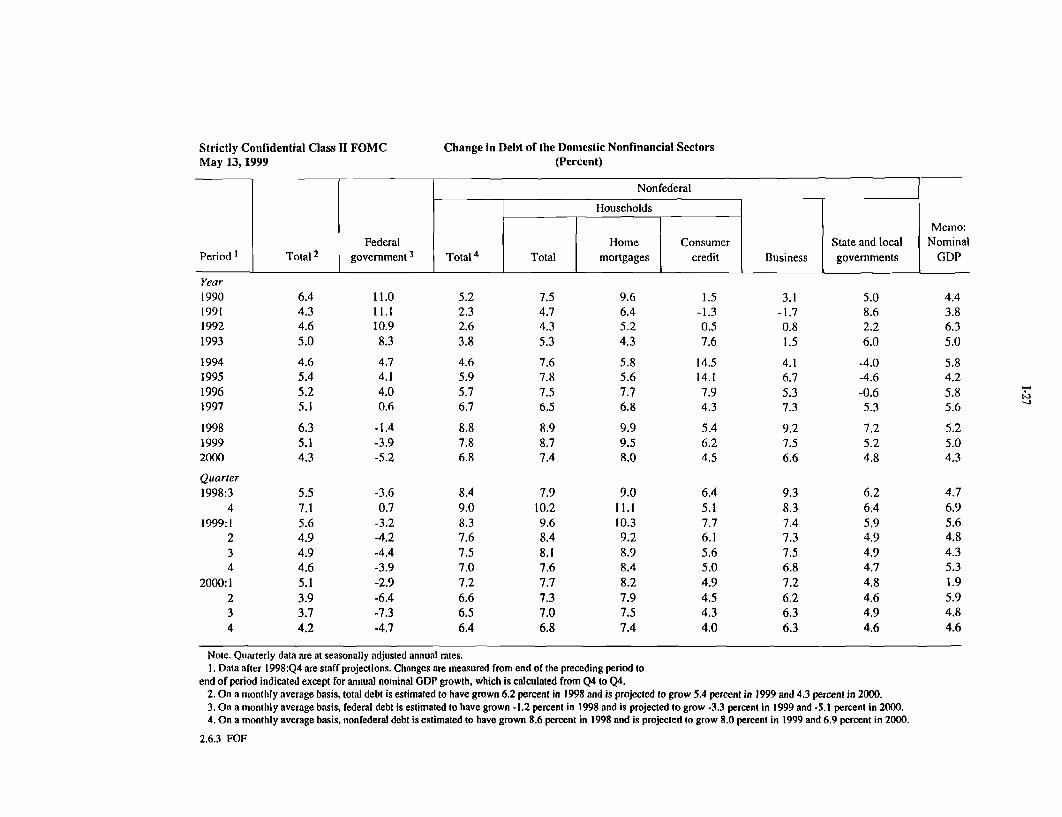
Money and Credit FlowsDomestic nonfinancial debt expanded at a 5-1/2 percent annual rate in the firstquarter, down from the average 6-1/4 percent pace in 1998. Federal debt ran offlast quarter, but business and household borrowing, despite some moderation,remained quite robust. We expect that the growth of credit demands fromhouseholds and businesses will subside somewhat over the projection period,while the contraction in federal debt should intensify.

Domestic Developments I-17
After a substantial first-quarter bounceback, profits in the nonfinancial corporatesector are expected to hold roughly level over the remainder of 1999 and to growslightly in 2000. Even with this more positive outlook for profits--comparedwith previous forecasts--the expected gap between capital spending and internalfunds widens appreciably over the forecast period. Nonetheless, we arepredicting a slowdown in business borrowing because a decline in cash-financedmergers and a reduced pace of share buy-backs is expected to offset the rise inthe financing gap. Growth in business debt, which was a very strong 9-1/4percent last year, is expected to drop about 2 percentage points in 1999 and toslow a bit more in 2000. The default rate on junk bonds has picked up of late,and we expect to see some further deterioration in business credit quality aseconomic growth moderates. However, as evidenced by the narrowing of junkspreads and the rally in "cyclical" stocks, the market has taken in stride therecent spate of defaults, and we anticipate only a moderate tightening in businesscredit supply.
Household debt is likely to continue rising faster than income in 1999 and 2000.But we expect the gap in growth rates to diminish as borrowing graduallyslackens with the deceleration in consumer spending and moderation in housingactivity. Despite the hefty buildup of household debt in recent quarters, theburden of servicing debt has risen little because of declining interest rates andthe lengthening of maturities. Mortgage refinancings have in many casesfacilitated this movement, a pattern that is unlikely to continue. We anticipatethe slackening in the pace of economic expansion will be accompanied by somedeterioration in credit quality in consumer and mortgage loan portfolios.However, lenders likely will respond by tightening up mainly on their creditextensions to riskier borrowers, leaving the bulk of consumers little affected.
Further upward revisions to the federal budget surplus presage a substantialretirement of federal debt over the projection period. Federal debt fell 1-1/2percent in 1998, and the pace of the run-off is seen increasing to about 4 percentin 1999 and 5-1/4 percent in 2000. The Treasury has yet to settle on a debt-management strategy in this era of budget surpluses, but we expect that thereductions in publicly held marketable securities will be spread across thematurity spectrum.
The sound budgetary condition of most states and localities should keep creditquality concerns in the municipal securities markets to a minimum.Consequently, funding should remain readily available for the increased volumeof investment projects anticipated in our GDP forecast. The pace of advancerefunding has recently slowed, and we expect the lower volume to continuebecause rates have been low enough that much of the eligible stock of bonds hasalready been refunded. We anticipate debt growth of state and local

governments to be moderate--a little under 5 percent--over the rest of 1999 and2000.
Smoothing through tax effects, the slower pace of M2 growth likely reflects anabatement of the effects of last fall's policy easings and an unwinding of lastfall's buildup of liquid balances during the flight to safety. As this unwindinglargely ceases to be a significant factor for money growth during the currentquarter, M2 growth is seen picking up somewhat over the remainder of 1999.M3 also accelerates over the second half of 1999 with faster expansion ofdepository credit. In 2000, the growth rates of M2 and M3 soften with theslowdown in growth of nominal spending and the assumed increase in short-term interest rates, which has a quicker effect on money demand than onspending.
Alternative SimulationsWe have developed three alternative, model-based simulations for this forecast.The first presents the implications of a quicker and more substantial monetarytightening than we are assuming in the baseline forecast. The other twosimulations are developed from alternative stock market scenarios, one that hasshare prices moving up substantially further from recent levels and another thathas them falling back substantially.
The simulation with the alternative monetary policy assumption would have theFOMC move preemptively to address the upturn in inflation that we seebeginning in 2000. In this simulation the interest rate on fed funds would beraised 25 basis points at the meeting next week and lifted further, in a series ofsteps, over the next several quarters, reaching a level of 6 percent in the secondquarter of 2000. This quicker tightening would have little effect on real GDP,unemployment or inflation in 1999. In 2000, however, the growth of real GDPwould be substantially lower than in the baseline forecast, and theunemployment rate in the fourth quarter of next year would be about 1/2percentage point higher. Inflation would edge down in 2000, rather than pickingup.
The simulation with the bullish view of the stock market assumes that theWilshire 5000 rises to a level of 15,000 by the fourth quarter of next year--a gainof roughly 25 percent from the recent average. The increase is assumed to comeabout as a result of a further reduction in the equity risk premium. GDP growthin 2000 is considerably stronger under this alternative than in the baseline, andthe unemployment rate ends up about 1/4 percentage point lower. Inflation nextyear would not be perceptibly higher than in the baseline; as noted in previousGreenbooks, expectations of inflation in the FRB/US model are relatively slowto respond to fluctuations in resource utilization that are not accompanied by
I-18 Part 1: Summary and Outlook, May 13; 1999

changes in monetary policy. The inflationary implications of the stronger stockmarket would start to become more evident in 2001, however.
The third alternative has the Wilshire index falling 25 percent in the next coupleof months and flattening out thereafter. The decline is assumed to be promptedby an abrupt upward shift in the equity premium. In this scenario, GDP growthis considerably lower than in the baseline forecast both this year and next, andthe unemployment rate reaches a level of 4-3/4 percent in the fourth quarter ofnext year. Inflation next year is lower than in the baseline but only slightly--again because of lagging expectation adjustments. We have not, in thissimulation, made allowance for financial repercussions of a stock market declinebeyond what the model would generate endogenously. However, theinternational developments section contains a simulation in which the drop instock prices is part of a broader retreat of investors from U.S. markets.
Alternative Federal Funds Rateand Stock Market Assumptions
(Percent change, Q4 to Q4, except as noted)
Measure 1999 2000
Real GDPBaseline 3.5 2.6Tighter monetary policy 3.3 1.515,000 Wilshire 3.6 3.725 percent stock price decline 2.7 1.3
Civilian unemployment rate'Baseline 4.0 4.2Tighter monetary policy 4.0 4.715,000 Wilshire 4.0 3.925 percent stock price decline 4.2 4.8
CPI excluding food and energyBaseline 2.0 2.3Tighter monetary policy 2.0 1.915,000 Wilshire 2.0 2.325 percent stock price decline 2.0 2.1
1. Average for the fourth quarter.
Domestic Developments 1-19

Strictly Confidential <FR>Class II FOMC
LNNUAL
19961997199819992000
QUARTERLY
1997 Q1Q2Q3Q4
1998 0102Q3Q4
1999 Q1Q2Q3Q4
2000 Q1Q2Q304
TWO-QUARTER3
1997 Q2Q4
1998 Q204
1999 Q2Q4
2000 Q2Q4
POUR-QUARTER4
1996 Q41997 Q41998 041999 Q42000 Q4
May 13, 1999STAFF PROJECTIONS OF CHANGES IN GDP, PRICES, AND UNEMPLOYMENT
(Percent, annual rate)
2.8 1.9 0.7 0.1 2.1 1.8 2.3 1.7 4.3 4.15.4 5.9 3.6 4.2 1.7 1.6 2.4 2.2 4.3 4.14.0 4.8 2.2 3.1 1.8 1.6 2.4 2.3 4.4 4.24.1 4.6 2.2 3.0 1.8 1.6 2.4 2.3 4.5 4.2
6.4 6.4 4.1 4.1 2.2 2.2 1.9 1.9 -0.3 -0.34.8 4.8 3.6 3.6 1.2 1.2 1.9 1.9 -0.3 -0.3
4.6 4.6 3.7 3.7 0.9 0.9 1.4 1.4 -0.3 -0.35.7 5.8 4.8 4.8 0.9 0.9 1.7 1.7 0.0 0.0
4.9 5.2 3.3 3.7 1.5 1.4 2.2 2.5 -0.2 -0.24.2 4.8 2.7 3.3 1.5 1.5 2.3 2.2 -0.0 -0.2
4.1 3.9 2.1 2.1 1.9 1.7 2.3 1.9 0.1 0.14.0 4.7 2.2 3.0 1.8 1.6 2.4 2.3 0.2 0.1
5.8 5.8 3.9 3.9 1.8 1.8 3.1 3.1 -0.3 -0.35.6 5.6 3.8 3.8 1.7 1.7 1.9 1.9 -0.6 -0.65.1 5.2 4.2 4.3 0.9 0.9 1.5 1.5 -0.3 -0.34.5 5.0 3.0 3.5 1.5 1.5 2.2 2.3 -0.2 -0.44.1 4.3 2.2 2.6 1.9 1.7 2.4 2.1 0.3 0.2
1. For all urban consumers.2. Level, except as noted.3. Percent change from two quarters earlier; for unemployment rate, change in percentage points.4. Percent change from four quarters earlier; for unemployment rate, change in percentage points.

I-21
Strictly Confidential <FR> REAL GROSS DOMESTIC PRODUCT AND RELATED ITEMS, ANNUAL VALUESClass II FOMC (Seasonally adjusted 'annual rate)
May 13, 1999
- Projected -
Item Unital 1992 1993 1994 1995 1996 1997 1998 1999 2000
EXPENDITURES
Nominal GDPReal GDP
Real GDPGross domestic purchasesFinal salesPriv. dom. final purchases
Personal cons. expendituresDurablesNondurablesServices
Business fixed investmentProducers' dur. equipmentNonres. structures
Residential structures
ExportsImports
Gov't. cons. & investmentFederalDefense
State a local
Change in bus. inventoriesNonfarm
Net exports
Nominal GDP
EMPLOYMENT AND PRODUCTION
Nonfarm payroll employmentUnemployment rate
Industrial prod. indexCapacity util. rate - mfg.
Housing startsLight motor vehicle salesNorth Amer. producedOther
INCOME AND SAVING
Nominal GNPNominal GNPNominal personal incomeReal disposable incomePersonal saving rate
Corp. profits, IVA a CCAdj.Profit share of GNPExcluding FR Banks
Federal surpl./deficitState & local surpl./def.Ex. social ins. funds
Gross natl. saving rateNet natl. saving rate
PRICES AND COSTS
GDP chn.-wt. price indexGross Domestic Purchases
chn.-wt. price indexCPIEx. food and energy
ECI, hourly compensation2
Nonfarm business sectorOutput per hourCompensation per HourUnit labor cost
Bill. $Bill. Ch. $
9 change
Bill. Ch. $
% change
Millions
% change
Millions
Bill. $% change
% change
Bill. $
% change
6244.4 6558.1 6947.0 7269.6 7661.6 8110.9 8511.0 8953.7 9336.86244.4 6389.6 6610.7 6761.7 6994.8 7269.8 7551.9 7849.0 8055.0
3.6 2.4 3.3 2.1 3.9 3.8 4.3 3.5 2.64.0 3.0 3.6 1.6 4.2 4.4 5.3 4.7 3.13.9 2.1 2.7 2.7 3.7 3.4 4.6 3.2 2.84.9 3.7 3.7 2.9 4.3 4.6 6.5 5.0 3.5
4.2 2.7 3.1 2.6 3.3 3.7 5.3 5.0 3.39.4 7.4 6.3 4.5 5.8 7.4 13.2 8.1 4.53.4 1.6 3.0 1.7 2.8 2.0 4.7 5.7 2.93.6 2.3 2.5 2.6 3.0 3.8 4.0 4.0 3.3
5.5 9.9 7.6 7.3 11.7 9.8 11.9 6.1 7.49.6 12.2 10.2 9.1 11.8 12.7 16.8 8.0 9.7
-3.4 4.5 1.1 2.7 11.6 2.5 -0.3 0.8 0.816.9 7.8 4.2 -1.4 5.4 4.2 12.6 2.4 -2.3
4.1 4.6 10.0 10.5 10.3 9.6 1.1 0.4 4.37.4 10.2 12.3 5.6 11.8 14.0 9.7 10.5 8.1
1.7 -1.4 0.1 -0.9 2.1 1.4 1.6 1.9 2.21.3 -6.1 -3.9 -5.6 1.1 -0.6 0.9 -1.5 -0.5
-1.3 -6.9 -6.0 -5.0 -0.1 -1.4 -1.3 -2.1 -0.62.0 2.0 2.7 2.1 2.8 2.6 2.1 3.8 3.7
7.0 22.1 60.6 27.7 30.0 63.2 57.4 54.4 46.22.0 29.5 49.0 37.7 23.2 58.8 50.1 50.9 44.9
-29.5 -70.2 -104.6 -96.5 -111.2 -136.1 -238.2 -349.7 -425.6
6.3 5.0 5.8 4.2 5.8 5.6 5.2 5.0 4.3
108.6 110.7 114.1 117.2 119.6 122.7 125.8 128.5 130.47.5 6.9 6.1 5.6 5.4 4.9 4.5 4.2 4.2
3.6 3.3 6.5 3.5 5.3 6.6 1.9 3.9 2.379.5 80.5 82.5 82.7 81.4 82.0 80.8 80.0 79.9
1.20 1.29 1.46 1.35 1.48 1.47 1.62 1.69 1.6012.85 13.86 15.01 14.72 15.05 15.02 15.50 15.85 15.2910.51 11.71 12.88 12.82 13.35 13.09 13.47 13.63 13.252.34 2.15 2.13 1.90 1.70 1.92 2.04 2.22 2.04
6255.5 6576.8 6955.2 7287.1 7674.0 8102.9 8490.5 8916.5 9282.66.2 5.1 5.7 4.4 5.6 5.2 5.2 4.7 4.17.2 4.0 5.2 4.6 5.9 5.4 5.1 5.2 4.84.0 1.2 2.5 2.1 2.7 2.9 3.5 3.5 3.25.7 4.4 3.5 3.4 2.9 2.1 0.5 -0.9 -1.2
11.3 19.0 14.1 14.6 7.7 7.7 0.1 4.5 0.16.8 7.5 8.2 9.2 9.8 10.1 9.7 9.6 9.06.6 7.2 7.9 8.9 9.5 9.8 9.4 9.4 8.8
-280.9 -250.7 -186.7 -174.4 -110.3 -21.1 72.8 145.1 182.586.3 87.4 96.8 111.7 122.6 134.1 150.2 167.5 174.518.3 19.7 27.9 37.0 52.2 66.0 82.5 99.6 106.6
14.5 14.4 15.5 16.3 16.6 17.4 17.3 17.0 16.53.7 3.7 4.7 5.8 6.3 7.3 7.3 7.1 6.7
2.6 2.6 2.5 2.1 1.8 1.7 0.9
2.7 2.3 2.5 2.0 1.8 1.3 0.43.1 2.7 2.6 2.7 3.1 1.9 1.53.5 3.1 2.8 3.1 2.6 2.2 2.4
3.5 3.6 3.1 2.6 3.1 3.4 3.5
3.5 -0.4 0.1 1.3 2.0 1.5 2.74.5 1.6 2.1 2.9 3.6 3.7 4.21.0 2.0 2.0 1.6 1.6 2.1 1.5
1.5 1.7
1.4 1.52.3 2.12.0 2.3
3.0 3.4
2.2 2.23.8 4.01.6 1.8
1. Changes are from fourth quarter to fourth quarter.2. Private-industry workers.

Strictly Confidential <FR> REAL GROSS DOMESTIC PRODUCT AND RELATED ITEMS, QUARTERLY VALUESClass II FOMC (Seasonally adjusted, annual rate except as noted)
1996 1996 1996 1996 1997 1997 1997 1997 1998 1998Item Units Ql Q2 Q3 Q4 Q1 Q2 Q3 Q4 Q1 Q2
EXPENDITURES
Nominal GDPReal GDP
Real GDPGross domestic purchasesFinal salesPriv. dom. final purchases
Personal cons. expendituresDurablesNondurablesServices
Business fixed investmentProducers' dur. equipmentNonres. structures
Residential structures
ExportsImports
Gov't. cons. & investmentFederalDefense
State a local
Change in bus. inventoriesNonfarm
Net exports
Nominal GDP
EMPLOYMENT AND PRODUCTION
Nonfarm payroll employmentUnemployment rate
Industrial prod. indexCapacity util. rate - mfg.
Housing startsLight motor vehicle salesNorth Amer. producedOther
INCOME AND SAVING
Nominal GNPNominal GNPNominal personal incomeReal disposable incomePersonal saving rate
Corp. profits, IVA & CCAdj.Profit share of GNPExcluding FR Banks
Federal surpl./deficitState & local surpl./def.Ex. social ins. funds
Gross natl. saving rateNet natl. saving rate
PRICES AND COSTS
GDP chn.-wt. price indexGross Domestic Purchases
chn.-wt. price indexCPI
Ex. food and energy
ECI, hourly compensation1
Nonfarm business sectorOutput per hourCompensation per hourUnit labor cost
Bill. $Bill. Ch. $
% change
Bill. Ch. $
% change
Millions
% change
Millions
Bill. $% change
% change
Bill. $
% change
7495.3 7629.2 7703.4 7818.4 7955.0 8063.4 8170.8 8254.5 8384.2 8440.66882.0 6983.9 7020.0 7093.1 7166.7 7236.5 7311.2 7364.6 7464.7 7498.6
3.3 6.1 2.1 4.2 4.2 4.0 4.2 3.0 5.5 1.84.5 7.0 3.4 1.8 5.5 4.4 4.6 3.2 7.8 3.93.6 5.4 0.9 5.1 2.9 2.7 5.8 2.1 4.3 4.65.1 6.2 2.8 3.3 4.6 3.3 7.5 2.9 8.5 7.4
3.7 4.7 1.8 2.9 4.3 1.6 6.2 2.8 6.1 6.15.8 12.7 -1.9 7.2 12.3 -1.5 16.8 3.1 15.8 11.22.2 4.8 1.2 2.9 3.6 -0.2 5.1 -0.4 7.4 5.34.0 3.0 3.0 2.0 3.1 3.2 4.7 4.3 3.5 5.4
13.1 11.0 14.2 8.8 7.0 14.0 17.0 1.8 22.2 12.815.7 12.3 16.2 3.2 8.3 22.8 18.8 2.2 34.3 18.86.4 7.4 8.9 24.5 3.9 -6.2 12.4 0.9 -4.9 -2.39.3 19.5 -1.7 -3.9 3.1 6.1 -0.4 8.2 15.6 15.0
3.7 5.8 2.1 32.0 8.3 15.5 10.6 4.4 -2.8 -7.713.1 13.5 13.6 7.0 18.6 17.9 13.5 6.3 15.7 9.3
3.2 7.1 -1.6 0.0 2.1 2.1 1.4 0.1 -1.9 3.78.0 8.1 -4.7 -6.3 -2.7 3.6 -1.2 -2.1 -8.8 7.37.2 8.1 -6.3 -8.3 -9.9 9.1 -1.8 -2.0 -18.5 9.90.5 6.5 0.3 3.8 4.9 1.3 2.9 1.3 2.1 1.8
14.4 26.1 47.5 32.1 56.3 79.0 51.0 66.5 91.4 38.210.4 15.2 38.6 28.7 56.2 72.1 44.0 62.7 85.9 29.9
-95.5 -113.5 -140.1 -95.9 -121.5 -131.6 -142.4 -149.0 -198.5 -245.2
5.7 7.3 3.9 6.1 7.2 5.6 5.4 4.2 6.4 2.7
118.5 119.3 120.0 120.7 121.5 122.3 123.0 123.9 124.8 125.55.5 5.5 5.3 5.3 5.2 5.0 4.9 4.7 4.6 4.4
2.8 9.6 5.5 3.5 6.6 6.0 7.2 6.6 1.6 2.880.9 81.6 81.8 81.3 81.6 81.7 82.1 82.5 81.8 81.2
1.46 1.50 1.50 1.42 1.46 1.47 1.46 1.52 1.59 1.5715.10 15.18 15.00 14.91 15.32 14.54 15.19 15.02 15.08 16.0713.44 13.46 13.33 13.16 13.41 12.68 13.20 13.08 13.13 14.071.66 1.72 1.68 1.76 1.92 1.86 1.99 1.94 1.95 1.99
7515.0 7643.3 7708.6 7829.0 7952.4 8062.3 8162.0 8234.9 8369.4 8421.85.6 7.0 3.5 6.4 6.5 5.6 5.0 3.6 6.7 2.56.6 6.9 5.5 4.6 7.3 4.7 4.7 5.0 5.9 4.52.9 2.1 4.4 1.3 3.3 2.9 2.4 2.9 4.0 2.63.2 2.6 3.1 2.6 2.4 2.6 1.7 1.7 1.2 0.4
16.9 6.9 3.8 3.5 18.1 11.1 13.1 -9.2 4.2 -4.19.8 9.8 9.8 9.7 10.0 10.1 10.3 10.0 9.9 9.79.5 9.5 9.5 9.5 9.7 9.8 10.0 9.7 9.6 9.5
-150.1 -112.6 -100.1 -78.3 -51.2 -34.8 -0.3 2.2 58.8 74.4117.3 129.1 122.3 121.7 128.4 130.1 136.6 141.4 140.2 141.345.3 58.2 52.5 52.9 59.8 61.6 68.7 73.8 72.7 73.6
16.4 16.4 16.8 16.7 17.0 17.6 17.5 17.3 17.7 17.26.0 6.2 6.6 6.5 7.0 7.6 7.5 7.3 7.8 7.2
1.1 0.9
1.0 -0.22.3 0.52.1 2.4
4.3 3.0
4.2 3.0 -0.1 1.02.7 5.2 3.6 3.1
-1.5 2.2 3.7 2.1
3.6 0.34.7 4.11.1 3.7
1. Private-industry workers.
May 13, 1999

I-23
Strictly Confidential <FR> REAL GROSS DOMESTIC PRODUCT AND RELATED ITEMS, QUARTERLY VALUESClass II FOMC (Seasonally adjusted, annual rate except as noted)
May 13, 1999
- - - - - - - - - - - -- Projected - - - - - - ---- - - - -
1998 1998 1999 1999 1999 1999 2000 2000 2000 2000Item Units Q3 Q4 Q1 Q2 Q3 Q4 Q1 Q2 Q3 Q4
rPENDI TURES
Nominal GDPReal GDP
Real GDPGross domestic purchasesFinal salesPriv. dom. final purchases
Personal cons. expendituresDurablesNondurablesServices
Business fixed investmentProducers' dur. equipmentNonres. structures
Residential structures
ExportsImports
Gov't. cons. & investmentFederal
DefenseState & local
Change in bus. inventoriesNonfarm
Net exports
Nominal GDP
EMPLOYMENT AND PRODUCTION
Nonfarm payroll employmentTnemployment rate
Industrial prod. indexCapacity util. rate - mfg.
Housing startsLight motor vehicle salesNorth Amer. producedOther
INCOME AND SAVING
Nominal GNPNominal GNPNominal personal incomeReal disposable incomePersonal saving rate
Corp. profits, IVA & CCAdj.Profit share of GNPExcluding FR Banks
Federal surpl./deficitState a local surpl./def.Ex. social ins. funds
Gross natl. saving rateNet natl. saving rate
PRICES AND COSTS
GDP chn.-wt. price indexGross Domestic Purchases
chn.-wt. price indexCPIEx. food and energy
ECI, hourly compensation1
Nonfarm business sectorOutput per hourCompensation per hourUnit labor cost
Bill. $Bill. Ch. $
% change
Bill. Ch. $
% change
Millions
% change
Millions
Bill. $% change
% change
Bill. $
% change
8537.9 8681.2 8800.4 8903.2 8996.9 9114.3 9157.0 9288.8 9397.2 9504.27566.5 7677.7 7755.7 7819.9 7873.9 7946.5 7947.6 8030.1 8091.2 8150.9
3.7 6.0 4.1 3.4 2.8 3.7 0.1 4.2 3.1 3.04.2 5.4 6.6 4.7 3.7 3.9 0.7 5.1 3.7 3.02.8 6.6 4.5 2.6 2.6 3.2 1.9 3.4 2.8 2.93.7 6.5 7.5 4.7 4.0 3.9 2.5 4.6 3.7 3.3
4.1 5.0 6.8 4.2 4.4 4.5 2.6 4.4 3.4 3.02.4 24.5 12.5 7.6 5.7 6.7 4.8 4.6 4.5 4.12.1 4.2 9.2 3.0 5.2 5.6 1.0 4.8 3.4 2.45.4 1.7 4.5 4.1 3.7 3.5 2.9 4.1 3.1 3.0
-0.7 14.6 8.2 9.2 5.1 2.1 4.0 8.7 8.6 8.2-1.0 17.8 9.8 13.2 7.1 2.4 5.4 11.5 11.4 10.80.2 6.0 3.7 -1.4 -0.4 1.3 0.0 1.3 0.7 1.09.9 10.0 15.6 1.3 -4.9 -1.3 -2.1 -2.1 -2.4 -2.7
-2.8 19.7 -7.7 0.5 2.9 6.6 -1.6 5.1 5.5 8.52.3 12.0 12.7 11.7 10.2 7.4 3.6 11.9 9.5 7.5
1.5 3.3 4.7 0.3 1.8 1.1 2.7 3.0 2.0 1.3-1.4 7.3 -0.7 -0.8 -1.1 -3.2 0.7 1.8 -1.3 -3.34.3 1.3 -4.2 1.5 -1.7 -4.0 -1.7 -0.9 0.0 0.43.1 1.3 7.7 1.1 3.3 3.4 3.7 3.6 3.7 3.7
55.7 44.2 36.9 53.6 57.6 69.8 29.4 47.4 53.2 54.747.0 37.5 32.0 49.3 54.5 67.8 28.2 46.0 51.8 53.4
-259.0 -250.0 -308.3 -343.5 -369.3 -377.9 -394.1 -421.3 -440.7 -446.3
4.7 6.9 5.6 4.8 4.3 5.3 1.9 5.9 4.8 4.6
126.1 126.8 127.6 128.1 128.7 129.4 129.8 130.5 130.6 130.94.5 4.4 4.3 4.2 4.1 4.0 4.1 4.1 4.2 4.2
0.9 2.2 0.7 5.2 4.5 5.1 -2.3 4.1 3.9 3.780.2 80.1 79.5 79.8 80.1 80.5 79.5 79.8 80.0 80.3
1.64 1.70 1.79 1.66 1.66 1.64 1.63 1.61 1.60 1.5714.55 16.31 16.22 15.99 15.67 15.52 15.40 15.30 15.25 15.2112.54 14.11 13.95 13.70 13.47 13.39 13.32 13.25 13.23 13.212.01 2.20 2.27 2.29 2.20 2.13 2.08 2.05 2.02 2.00
8510.9 8660.0 8770.4 8868.4 8957.4 9069.8 9108.5 9237.0 9341.5 9443.64.3 7.2 5.2 4.5 4.1 5.1 1.7 5.8 4.6 4.44.5 5.5 5.2 5.6 4.7 5.4 4.7 5.1 4.6 4.63.2 4.3 4.4 3.5 2.6 3.4 4.2 3.2 2.6 2.70.2 0.0 -0.6 -0.7 -1.1 -1.3 -0.9 -1.2 -1.3 -1.3
3.2 -2.5 22.9 -2.2 -2.3 1.5 -20.4 12.4 6.4 5.39.7 9.5 9.9 9.7 9.6 9.5 8.9 9.0 9.1 9.19.4 9.2 9.6 9.4 9.3 9.2 8.6 8.8 8.8 8.8
92.0 65.8 114.5 134.8 157.8 173.4 152.8 175.2 195.4 206.6148.7 170.5 169.0 163.5 164.6 173.0 172.4 174.7 175.6 175.581.3 102.6 101.1 95.6 96.7 105.1 104.5 106.8 107.7 107.6
17.3 16.9 17.2 17.0 16.8 16.7 16.4 16.5 16.6 16.67.3 7.0 7.3 7.1 7.0 6.9 6.5 6.7 6.8 6.9
1.0 0.8 1.5 1.4 1.5 1.5 1.8 1.6 1.6 1.6
0.7 0.9 1.0 1.8 1.4 1.4 1.6 1.4 1.4 1.41.7 2.0 1.5 3.5 2.3 2.1 1.7 2.2 2.3 2.32.3 2.3 1.6 1.8 2.3 2.3 1.9 2.5 2.5 2.5
4.1 2.9 1.4 3.6 3.3 3.6 3.4 3.4 3.4 3.6
2.5 4.3 3.5 2.4 1.3 1.6 0.1 3.4 2.7 2.53.9 4.0 4.3 3.4 3.7 4.0 4.1 3.9 3.9 4.11.4 -0.4 0.8 1.0 2.4 2.4 4.0 0.5 1.2 1.6
1. Private-industry workers.I. Private-industryworkers.

Strictly Confidential <FR>Class II FOMC
CONTRIBUTIONS TO GROWTH IN REAL GROSS DOMESTIC PRODUCT AND RELATED ITEMS
Item
Real GDPGross dom. purchases
Final salesPriv. dom. final purchases
Personal cons. expendituresDurablesNondurablesServices
Business fixed investmentProducers' dur. equip.Nonres. structures
Residential structures
Net exportsExportsImports
Government cons. & invest.FederalDefenseNondefense
State and local
Change in bus. inventoriesNonfarmFarm
1996 1996 1997 1997 1997 1997 1998 1998 1998 96Q4/ 97Q4/ 98Q4/Q3 Q4 Ql Q2 Q3 Q4 Q1 Q2 Q3 95Q4 96Q4 9704
2.1 4.2 4.2 4.0 4.2 3.0 5.5 1.8 3.7 3.9 3.8 4.33.5 1.9 5.5 4.4 4.7 3.2 7.9 4.0 4.3 4.2 4.4 5.4
0.9 5.1 2.9 2.7 5.7 2.1 4.3 4.6 2.8 3.7 3.3 4.52.3 2.7 3.8 2.7 6.1 2.4 7.0 6.1 3.1 3.6 3.8 5.4
1.3 2.0-0.2 0.60.2 0.61.2 0.8
1.4 0.91.1 0.20.2 0.6
-0.1 -0.2
2.9 1.11.0 -0.10.7 -0.01.2 1.3
0.7 1.4 1.70.6 1.6 1.30.1 -0.2 0.40.1 0.2 -0.0
4.2 1.91.3 0.31.0 -0.11.9 1.7
0.2 2.2 1.4 -0.10.1 2.4 1.4 -0.10.0 -0.2 -0.1 0.00.3 0.6 0.6 0.4
-1.3 2.4 -1.2 -0.5 -0.5 -0.3 -2.2 -2.1 -0.60.2 3.2 1.0 1.8 1.2 0.5 -0.3 -0.9 -0.3
-1.6 -0.9 -2.2 -2.2 -1.7 -0.8 -1.9 -1.2 -0.3
-0.3 0.0 0.4 0.4 0.3 0.0 -0.3-0.3 -0.4 -0.2 0.2 -0.1 -0.1 -0.6-0.3 -0.4 -0.5 0.4 -0.1 -0.1 -0.80.0 0.0 0.3 -0.2 0.0 -0.1 0.30.0 0.4 0.6 0.2 0.3 0.2 0.2
1.2 -0.8 1.31.3 -0.5 1.5
-0.1 -0.3 -0.2
1.3 -1.4 0.90.9 -1.5 1.00.4 0.1 -0.1
0.6 0.30.4 -0.10.4 0.20.1 -0.30.2 0.4
1.2 -2.71.2 -2.80.0 0.1
2.20.50.61.2
1.20.80.30.2
-0.31.2
-1.4
0.40.1
-0.00.10.3
0.20.10.0
Note. Components may not sum to totals because of rounding.
May 13, 1999
I
Strictly Confidential <FR>Class II FOMC
Item
Real GDPGross dom. purchases
Final salesPriv. dom. final purchases
Personal cons. expendituresDurablesNondurablesServices
Business fixed investmentProducers' dur. equip.Nonres. structures
Residential structures
Net exportsExportsImports
Government cons. & invest.FederalDefenseNondefense
State and local
Change in bus. inventoriesNonfarmF-rm
CONTRIBUTIONS TO GROWTH IN REAL GROSS DOMESTIC PRODUCT AND RELATED ITEMS
1998 1999 1999 1999 1999 2000 2000 2000 2000 98Q4/ 99Q4/ OQ4/04 Q1 Q2 Q3 Q4 Q1 Q2 Q3 Q4 97Q4 98Q4 99Q4
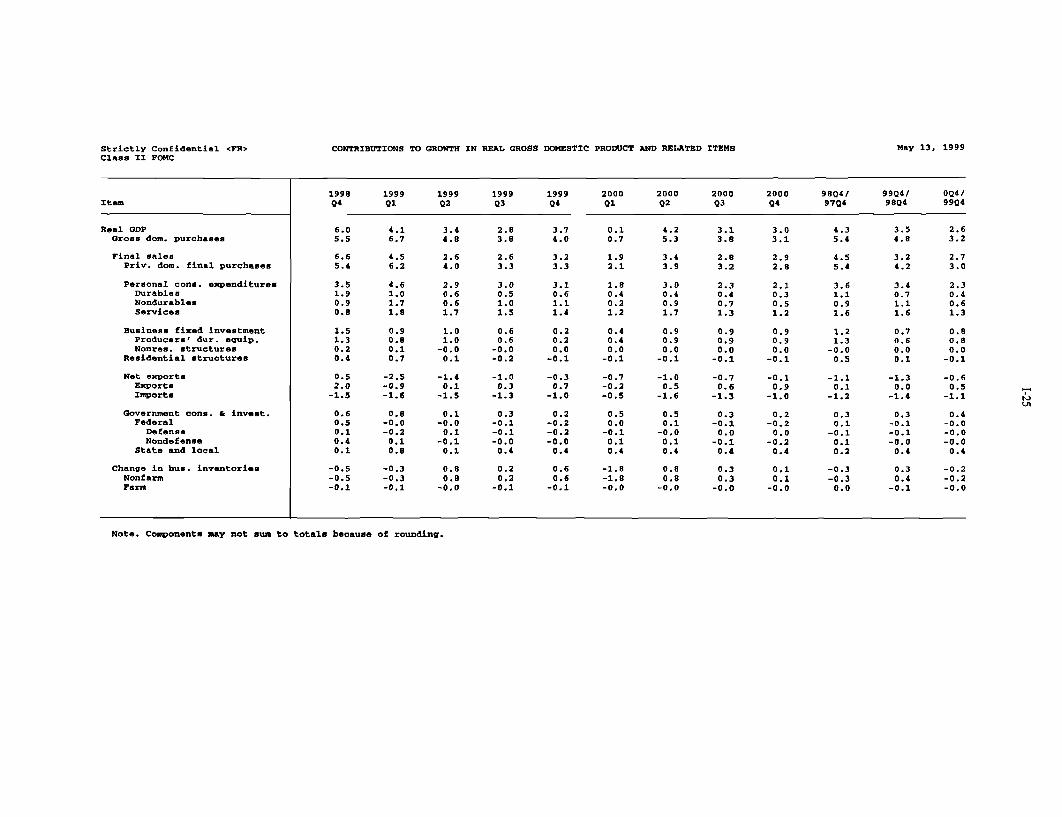
6.0 4.1 3.4 2.8 3.7 0.1 4.2 3.1 3.0 4.3 3.5 2.65.5 6.7 4.8 3.8 4.0 0.7 5.3 3.8 3.1 5.4 4.8 3.2
6.6 4.5 2.6 2.6 3.2 1.9 3.4 2.8 2.9 4.5 3.2 2.75.4 6.2 4.0 3.3 3.3 2.1 3.9 3.2 2.8 5.4 4.2 3.0
1.5 0.9 1.0 0.6 0.2 0.4 0.9 0.9 0.91.3 0.8 1.0 0.6 0.2 0.4 0.9 0.9 0.90.2 0.1 -0.0 -0.0 0.0 0.0 0.0 0.0 0.00.4 0.7 0.1 -0.2 -0.1 -0.1 -0.1 -0.1 -0.1
0.5 -2.5 -1.4 -1.0 -0.3 -0.7 -1.0 -0.7 -0.12.0 -0.9 0.1 0.3 0.7 -0.2 0.5 0.6 0.9
-1.5 -1.6 -1.5 -1.3 -1.0 -0.5 -1.6 -1.3 -1.0
0.6 0.8 0.1 0.3 0.2 0.5 0.5 0.3 0.20.5 -0.0 -0.0 -0.1 -0.2 0.0 0.1 -0.1 -0.20.1 -0.2 0.1 -0.1 -0.2 -0.1 -0.0 0.0 0.00.4 0.1 -0.1 -0.0 -0.0 0.1 0.1 -0.1 -0.20.1 0.8 0.1 0.4 0.4 0.4 0.4 0.4 0.4
-0.5 -0.3 0.8 0.2 0.6 -1.8 0.8 0.3 0.1-0.5 -0.3 0.8 0.2 0.6 -1.8 0.8 0.3 0.1-0.1 -0.1 -0.0 -0.1 -0.1 -0.0 -0.0 -0.0 -0.0
0.7 0.80.6 0.80.0 0.00.1 -0.1
-1.3 -0.60.0 0.5
-1.4 -1.1
0.3 0.4-0.1 -0.0-0.1 -0.0-0.0 -0.00.4 0.4
0.3 -0.20.4 -0.2
-0.1 -0.0
Note. Components may not sum to totals because of rounding.
May 13, 1999

Strictly Confidential (FR)Class II FOMC
May 13, 1999
STAFF PROJECTIONS OF FEDERAL SECTOR ACCOUNTS AND RELATED ITEMS(Billions of dollars except as noted)
Fiscal Year 5 1998 1999 2000
Item 1997a 1998a 1999 2000 Qla Q2a Q3a Q4a Qlb Q2 Q3 Q4 Q1 Q2 Q3 Q4
UNIFIED BUDGET ------------------------ Not seasonally adjusted ------------------------
Receipts1 1579 1722 1840 1924 378 544 412 413 401 582 444 433 428 600 464 451OutlaysI 1601 1653 1705 1736 409 407 409 468 396 422 419 440 444 432 420 451Surplus/Deficit 1 -22 69 135 188 -30 137 3 -55 5 161 25 -8 -17 168 44 0
On-budget -103 -30 6 43 -53 87 3 -58 -50 105 9 -47 -41 106 25 -42Off-budget 81 99 129 145 22 50 -0 3 55 55 16 40 25 62 19 42
Surplus excludingdeposit insurance2 -36 65 130 184 -31 136 2 -57 4 159 24 -9 -18 167 43 -1
Means of financingBorrowing 38 -51 -105 -183 26 -82 -29 32 7 -117 -27 -8 11 -136 -51 -13Cash decrease 1 5 -7 6 4 -45 33 21 -4 -35 11 16 10 -25 5 20Other 3 -17 -23 -24 -10 0 -10 -8 1 -8 -8 -8 -0 -4 -7 2 -7
Cash operating balance,end of period 44 39 46 40 28 72 39 18 22 57 46 30 20 45 40 20
NIPA FEDERAL SECTOR --------- -------- Seasonally adjusted annual rates --------------------
Receipts 1687 1818 1922 2020 1809 1838 1859 1870 1911 1941 1965 1998 1996 2029 2056 2082Expenditures 1728 1761 1803 1846 1750 1764 1767 1805 1794 1806 1808 1825 1844 1854 1861 1876Consumption expend. 458 458 475 487 451 464 459 471 475 478 478 476 488 492 492 488
Defense 306 301 309 313 293 303 303 307 307 310 310 308 314 314 315 316Nondefense 152 157 167 174 158 161 156 164 168 168 168 168 174 179 177 173
Other expenditures 1270 1303 1328 1359 1299 1300 1308 1334 1319 1328 1329 1349 1356 1362 1369 1387Current account surplus -41 57 119 174 -59 -74 -92 -66 -117 -135 -158 -173 -153 -175 -195 -207Gross investment 61 60 61 59 61 57 61 60 64 60 60 59 59 58 59 59Current and capital
account surplus -102 -3 58 115 2 -18 -31 -6 -53 -75 -98 -114 -93 -117 -137 -148
FISCAL INDICATORS 4
High-employment (HEB)surplus/deficit -163 -99 -70 -15 -101 -81 -70 -112 -74 -58 -37 -27 -30 -12 10 22
Change in HEB, percentof potential GDP -0.9 -0.9 -0.4 -0.7 -0.5 -0.3 -0.1 0.5 -0.5 -0.2 -0.3 -0.1 0.0 -0.2 -0.2 -0.1
Fiscal impetus (FI)percent, cal. year -2.1 -1.7 2.4 -0.7 -2.1 1.1 0.4 0.9 1.7 -0.1 -0.5 -0.7 0.1 0.4 -0.3 -0.7
1. OMB's February 1999 surplus estimates (assuming the enactment of the President's proposals) are $79 billion in FY99 and $103billion in FY2000. CBO's March 1999 baseline surplus estimates are $111 billion in FY99 and $133 billion in FY2000. Budget receipts,outlays, and surplus/deficit include corresponding social security (OASDI) categories. The OASDI surplus is excluded from theon-budget deficit and shown separately as off-budget, as classified under current law. The Postal Service deficit is included inoff-budget outlays beginning in FY90.2. Other means of financing are checks issued less checks paid, accrued items, and changes in other financial assets and liabilities.3. HEB is the NIPA current and capital account surplus in current dollars, with cyclically sensitive receipts and outlays adjusted to
the level of potential output associated with an unemployment rate of 6 percent. Real potential GDP growth is assumed to be 3.3percent beginning 1998:Q1. Quarterly figures for change in HEB and FI are not at annual rates. Change in HEB, as a percent of nominalpotential GDP, is reversed in sign. FI is the weighted difference of discretionary changes in federal spending and taxes in chained(1992) dollars, scaled by real federal consumption plus investment. For change in HEB and FI, negative values indicate restraint.4. Fiscal year data for the unified budget come from OMB; quarterly data come from the Monthly Treasury Statement and may not sum to
OMB fiscal year totals.
a--Actual b--Preliminary
Strictly Confidential Class II FOMCMay 13, 1999
Change in Debt of the Domestic Nonfinancial Sectors(Percent)
Year1990 6.4 11.0 5.2 7.5 9.6 1.5 3.1 5.0 4.41991 4.3 11.1 2.3 4.7 6.4 -1.3 -1.7 8.6 3.81992 4.6 10.9 2.6 4.3 5.2 0.5 0.8 2.2 6.31993 5.0 8.3 3.8 5.3 4.3 7.6 1.5 6.0 5.0
1994 4.6 4.7 4.6 7.6 5.8 14.5 4.1 -4.0 5.81995 5.4 4.1 5.9 7.8 5.6 14.1 6.7 -4.6 4.21996 5.2 4.0 5.7 7.5 7.7 7.9 5.3 -0.6 5.81997 5.1 0.6 6.7 6.5 6.8 4.3 7.3 5.3 5.6
1998 6.3 -1.4 8.8 8.9 9.9 5.4 9.2 7.2 5.21999 5.1 -3.9 7.8 8.7 9.5 6.2 7.5 5.2 5.02000 4.3 -5.2 6.8 7.4 8.0 4.5 6.6 4.8 4.3
Quarter1998:3 5.5 -3.6 8.4 7.9 9.0 6.4 9.3 6.2 4.7
4 7.1 0.7 9.0 10.2 11.1 5.1 8.3 6.4 6.91999:1 5.6 -3.2 8.3 9.6 10.3 7.7 7.4 5.9 5.6
2 4.9 -4.2 7.6 8.4 9.2 6.1 7.3 4.9 4.83 4.9 -4.4 7.5 8.1 8.9 5.6 7.5 4.9 4.34 4.6 -3.9 7.0 7.6 8.4 5.0 6.8 4.7 5.3
2000:1 5.1 -2.9 7.2 7.7 8.2 4.9 7.2 4.8 1.92 3.9 -6.4 6.6 7.3 7.9 4.5 6.2 4.6 5.93 3.7 -7.3 6.5 7.0 7.5 4.3 6.3 4.9 4.84 4.2 -4.7 6.4 6.8 7.4 4.0 6.3 4.6 4.6
Note. Quarterly data are at seasonally adjusted annual rates.1. Data after 1998:Q4 are staff projections. Changes are measured from end of the preceding period to
end of period indicated except for annual nominal GDP growth, which is calculated from Q4 to Q4.2. On a monthly average basis, total debt is estimated to have grown 6.2 percent in 1998 and is projected to grow 5.4 percent in 1999 and 4.3 percent in 2000.3. On a monthly average basis, federal debt is estimated to have grown -1.2 percent in 1998 and is projected to grow -3.3 percent in 1999 and -5.1 percent in 2000.4. On a monthly average basis, nonfederal debt is estimated to have grown 8.6 percent in 1998 and is projected to grow 8.0 percent in 1999 and 6.9 percent in 2000.
2.6.3 FOF

Strictly Confidential Class II FOMCMay 13, 1999
Flow of Funds Projections: Highlights(Billions of dollars except as noted)
Net funds raised by domesticnonfinancial sectors
1 Total2 Net equity issuance3 Net debt issuance
Borrowing sectorsNonfinancial business
4 Financing gap5 Net equity issuance6 Credit market borrowing
Households7 Net borrowing 2
8 Home mortgages9 Consumer credit
10 Debt/DPI (percent) 3
State and local governments11 Net borrowing12 Current surplus 4
Federal government13 Net borrowing14 Net borrowing (quarterly, n.s.a.)15 Unified deficit (quarterly, n.s.a.)
Depository institutions16 Funds supplied
Memo (percentage of GDP)17 Domestic nonfinancial debt 5
18 Domestic nonfinancial borrowing19 Federal government 620 Nonfederal
622.4 688.2 696.0 625.0 547.1 643.9 863.8 764.3 594.5 561.4 690.9 570.8 570.4 668.0-114.4 -262.8 -129.8 -99.0 -308.4 -474.4 -47.3 -44.0 -212.0 -216.0 -166.0 -98.0 -70.0 -62.0736.9 950.9 825.8 724.0 855.5 1118.3 911.1 808.3 806.5 777.4 856.9 668.8 640.4 730.0
62.7 85.9 117.7 154.4 67.5 95.0 71.2 114.0 135.3 150.2 133.0 151.3 162.2 170.9-114.4 -262.8 -129.8 -99.0 -308.4 -474.4 -47.3 -44.0 -212.0 -216.0 -166.0 -98.0 -70.0 -62.0324.1 438.2 389.0 372.6 466.6 423.3 385.0 390.7 403.7 376.7 403.1 355.1 364.1 368.1
333.6 485.0 519.2 479.3 452.7 592.7 574.1 515.3 504.0 483.7 498.4 484.8 469.8 464.2236.7 368.9 391.9 359.6 353.2 444.6 423.1 387.4 384.9 372.2 368.9 363.3 353.3 352.7
52.5 67.9 83.2 63.8 83.4 66.6 102.9 83.0 77.0 70.0 69.0 65.0 62.0 59.091.5 94.8 98.2 101.1 95.0 95.9 97.0 97.9 98.9 99.6 100.2 100.8 101.6 102.2
56.1 80.3 62.6 60.8 72.6 75.4 71.3 59.5 60.5 59.0 60.8 58.8 62.8 60.8135.6 182.4 199.1 207.4 182.7 198.2 200.3 189.3 199.0 207.9 205.8 207.7 207.8 208.4
23.1 -52.6 -144.9 -188.6 -136.523.1 -52.6 -144.9 -188.6 -28.8
2.4 -54.7 -182.7 -195.6 -3.0
26.9 -119.2 -157.1 -161.6 -141.9 -105.4 -229.8 -256.2 -163.132.1 7.5 -117.4 -27.1 -8.0 11.0 -135.5 -50.7 -13.355.0 -5.1 -160.6 -24.7 7.8 16.6 -167.9 -44.2 -0.1
336.3 364.3 236.4 286.1 296.9 683.9 162.6 235.6 276.2 270.9 282.4 289.4 285.4 287.4
182.6 183.9 184.7 185.5 184.4 184.2 184.6 184.8 185.2 185.0 186.3 185.7 185.3 185.09.1 11.2 9.2 7.8 10.0 12.9 10.4 9.1 9.0 8.5 9.4 7.2 6.8 7.70.3 -0.6 -1.6 -2.0 -1.6 0.3 -1.4 -1.8 -1.8 -1.6 -1.2 -2.5 -2.7 -1.78.8 11.8 10.8 9.8 11.6 12.6 11.7 10.8 10.8 10.1 10.5 9.7 9.5 9.4
Note. Data after 1998:Q4 are staff projections.1. For corporations: Excess of capital expenditures over U.S. internal funds.2. Includes change in liabilities not shown in lines 8 and 9.3. Average debt levels in the period (computed as the average of period-end debt positions)
divided by disposable personal income.
2.6.4 FOF
4. NIPA surplus less changes in retirement fund assets plus consumption of fixed capital.5. Average debt levels in the period (computed as the average of period-end debt positions) divided by nominal GDP6. Excludes government-insured mortgage pool securities.

International Developments
Developments since the March FOMC meeting point to somewhat brighterprospects for economic growth in Asia and Latin America, and our outlook forforeign growth has been adjusted upward to reflect them. Recovery in Korea isproceeding more quickly than had been expected, and other Asian economiesmay be on the rebound. While economic activity in Brazil has slowedconsiderably in recent quarters, the downturn is now seen to be less severe, withinterest rates declining and inflationary pressures surprisingly moderate. InMexico, there are tentative signs that growth may be resuming. Global investorsare also exhibiting greater confidence in emerging markets, absorbing new debtissues, bidding up the prices of existing debt and equity, and showing a greaterwillingness to hold emerging market currencies.
Faster foreign activity boosts real exports relative to our March projection.Nonetheless, the stronger outlook for U.S. domestic demand is expected to pushreal net exports of goods and services further into deficit over the forecastperiod.
Recent DevelopmentsInternational financial markets. The weighted average foreign exchangevalue of the dollar, as measured by the staffs broad index, declined 1 percentduring the period following the March FOMC meeting. An increase incommodity prices and an apparent reduction in investors' concerns about riskweighed against the dollar vis-a-vis the currencies of several key U.S. tradingpartners. The U.S. dollar declined about 3-1/2 percent against the Canadiandollar and 4-1/4 percent against the Australian dollar, as the prices of metals, oil,and lumber moved higher. The dollar also declined 12 percent against theIndonesian rupiah, about 7 percent against the Brazilian real, and 2-1/2 percentagainst the Mexican peso.
On balance, the dollar firmed nearly 1 percent against the euro and more than1-1/2 percent against the yen during the period. Market perceptions of weakgrowth in the euro area and a reduction of 50 basis points in the refinancing rateof the Eurosystem weighed on the new European currency. The euro alsoseemed to fluctuate during the period with market views about the prospects fora near-term resolution of hostilities in the Balkans. The yen traded in a narrowrange against the dollar through much of the period even as the yield spreadbetween long-term U.S. and Japanese government bonds widened 65 basispoints.
Markets for higher-risk assets generally rallied during the period. Equity pricesin major foreign industrial countries, including Japan, moved up 5 percent ormore. With a few exceptions, share prices in the emerging markets of Asia andLatin America were up between 20 and 50 percent over the intermeeting period.

Part 1: Summary and Outlook, May 13, 1999
Yield spreads over U.S. Treasuries on longer-term emerging market debtinstruments moved lower as well. In addition, only three months after theabandonment of its crawling-peg exchange rate system and the collapse of thereal, the Brazilian government was able to issue a five-year global bond at ayield spread of 675 basis points over U.S. Treasuries.
Monetary policy in foreign countries eased on average. In addition to theofficial rate cut in the euro area, monetary authorities in Canada, the UnitedKingdom, and Brazil also reduced policy rates. Movements in yields of long-term government bonds were mixed during the period. The yield on the ten-yearbellwether security in Canada was up nearly l5 basis points, matching the runupin the yield on the U.S. ten-year Treasury. Comparable yields edged lower inthe euro area. In Japan, the yield on the bellwether government bond droppedmore than 50 basis points, a move consistent with the current accommodativemonetary stance and few signs that economic activity is set to recover.
Economic activity abroad. Recent evidence on growth in many of the majorindustrial countries indicates continued sluggishness. Japanese consumerspending plunged in the first quarter, and Japan's unemployment rate reached apost-war high in March, despite evidence that government measures to stimulateeconomic activity are coming on line. In the euro area, industrial productiondeclined further in February, and German industrial production moved downagain in March. Euro-area consumer confidence fell in March and April from itshistorically high levels in January and February, while industrial confidenceimproved somewhat in April from its depressed levels in recent months.
In contrast, while U.K. real GDP growth in the first quarter was barely positiveand industrial output is estimated to have declined in the quarter, businesssurveys released in March and April indicate somewhat brighter prospects foractivity in the months ahead. Economic growth in Canada appears to have beenstrong in the first quarter, albeit somewhat reduced from the post-strike surge inactivity late last year.
The latest price data provide no significant indication yet of inflationarypressures in foreign industrial countries. Japan shows further evidence of pricedeflation with a 0.2 percent decline in consumer prices in April from a yearearlier. Euro-area consumer prices rose 1.0 percent in the year to March, as didconsumer prices in Canada. U.K. retail price inflation in the twelve months toMarch remained close to 2-1/2 percent, the official target of the Bank ofEngland.
Signs emerged during the intermeeting period that the slowdown in Mexico maybe ending and that the contraction of activity in Brazil may be diminishing.
1-30

International Developments 1-31
Mexican industrial production grew in March, after virtually no growth in GDPin the fourth quarter and declines in industrial production in January andFebruary. In addition, the rate of unemployment in Mexico moved lower inMarch. Industrial production in Brazil, which had been trending lower sinceMay of last year, also rose in March. Data for Argentina, however, show noevidence of a break in the recent downward trend. Argentine industrialproduction declined 4 percent in the first quarter.
Economic activity in Korea grew vigorously in the first quarter, with industrialproduction rising substantially in March to a level higher than before the onsetof the financial crisis in mid-1997. Recent indicators of industrial productionand GDP for the ASEAN countries suggest that activity in the region hadprobably bottomed out by the first quarter, and for some countries recovery mayhave begun.
Inflation rates in much of Latin America moved lower in recent months.Mexican consumer price inflation was at an eleven-month low in March.Despite the 40 percent devaluation of the real early this year, consumer priceinflation in Brazil was running at about a 14 percent annual rate in the firstquarter (not seasonally adjusted) and appears to have slowed significantly byApril. Deflation has emerged in Argentina, with first-quarter data showing adecline in consumer prices of 0.7 percent from a year earlier. In contrast,consumer price inflation in Venezuela remained high, at 25 percent in Aprilfrom a year earlier, but the month-to-month price rise in April was the lowest inten years. Consumer price inflation in most Asian economies moved lower inthe first quarter, with prices in Korea and Thailand rising less than 1/2 percent inApril from a year earlier. In the Philippines, inflation moved down to 8 percentin the year to April, while in Indonesia it dropped to 38 percent.
U.S. net exports and prices. In February, the nominal U.S. trade deficit ingoods and services was $19.4 billion, a deficit much larger than in any of thepreceding months. The value of imports rose sharply, and the value of exportsdeclined to its lowest level since last August.
For January and February combined, the deficit at an annual rate wassubstantially larger than that in any quarter of last year. Imports for the two-month period rose strongly, led by large increases in consumer goods,automotive products, computers, and semiconductors. Exports during January-February declined 2-3/4 percent, partly reversing the surge recorded in the fourthquarter. The largest declines were in aircraft, machinery, industrial supplies, andagricultural products. Exports to Asia generally turned down in January-February from the peak levels in the fourth quarter, which had been boosted byrecord deliveries of aircraft.
Part 1: Summary and Outlook, May 13, 1999
The quantity of imported oil increased slightly in January-February, largely inresponse to low oil prices, declines in domestic production, and strong U.S.economic activity. Preliminary data from the Department of Energy indicatethat imports in March and April remained near January and February rates.
After decreasing in January, the price of imported oil rose modestly in February.Along with the $6 increase in the spot price of WTI crude since February, theprice of imported oil rose sharply in March and April. The March agreement ofOPEC and non-OPEC producers to restrict production by two million barrels perday triggered this rapid run-up in price. Weaker-than-expected inventories inthe United States and temporary supply disruptions also pushed the price higherover the intermeeting period.
For the first quarter, prices of non-oil imports decreased about 1-3/4 percent atan annual rate. Monthly data on imported goods prices indicate that prices fellfurther in April. Prices of "core" imports (which exclude oil, computers, andsemiconductors) were about flat in the first quarter and April. Export pricesdeclined 3/4 percent at an annual rate in the first quarter. Prices for exportedgoods rose slightly in April.
OutlookForeign real GDP (weighted by U.S. nonagricultural export shares) is projectedto average a bit less than 2-1/4 percent in 1999 and to rise to 2-1/2 percent in2000. Compared with the March Greenbook, this path for foreign growth issignificantly higher in 1999, particularly in the second half of the year. Upwardrevisions to our outlook for developing economies in Latin America and Asiaboosted growth in both years. We also assumed more substantial Y2K effects inthis forecast. These have the effect of shifting growth to the second half of 1999from the first half of 2000, making the upward revision to 1999 growth largerand masking some of the stronger underlying activity forecast for 2000. Weproject the dollar to remain essentially unchanged in real terms over the forecastperiod, with the path about 1 percent lower than in the March Greenbook.
We project that declines in U.S. real net exports will subtract 1-1/4 percentagepoints from U.S. real GDP growth in 1999 and about 1/2 percentage point in2000. Import growth is higher than in the previous Greenbook because of theupward revision to projected U.S. growth. Export growth is also a bit higher onbalance over the forecast period, in response to stronger foreign activity and aslightly weaker dollar.

Summary of Staff Projections(Percent change, annual rate)
Projection
Measure 1998 19992000
Q1 Q2 H2 2
Foreign output 0.6 1.4 1.7 2.8 2.5March GB 0.5 0.8 1.1 1.7 2.4
Real exports 1.1 -7.7 0.5 4.7 4.3March GB 0.9 -7.6 -0.1 3.0 4.0
Real imports 9.7 12.7 11.7 8.8 8.1March GB 9.7 8.6 10.0 7.5 6.9
NOTE. Changes for years are measured as Q4/Q4; for half-years, Q2/Q4 or Q4/Q2; and for quarters, from previous quarter.
The dollar. We project that during the forecast period the nominal exchangevalue of the dollar against the major international currencies will declinemoderately from its current level. In part, this decline reflects our view,unchanged from previous Greenbooks, that growing current account imbalancesamong the major currency regions will eventually begin to exert somedownward pressure on the dollar. In keeping with this view, the dollar isforecast to decline moderately against the euro.' Against the yen, the dollar isexpected to change little on balance, as current account pressures arecounterbalanced by easy monetary policy in Japan and our expectations thatmarket participants are likely to be disappointed by the pace of recovery andrestructuring in Japan. Rising commodity prices are expected to provide a bitmore support to the Canadian dollar. On balance, the path forecast for the dollar
1. While concern over the conflict in the Balkans appears to have buffeted the euro in recentweeks, we view these developments as having only temporary effects on the value of thecurrency. The assumption underlying our baseline forecast is an outcome in which the aircampaign gives way to a peacekeeping operation sometime later this year. The fiscal andeconomic effects of this scenario are not significant. There is a possibility, however, that theconflict will widen into a ground war, entailing the introduction of a significant number of U.S.and European ground troops in an operation lasting well into next year. Although we perceivethis risk to be relatively small at this juncture, and have not conducted a separate simulationexercise to calibrate the effects of such an outcome, the Congressional Budget Office estimatesthat the cost of a ground campaign (with 27,000 soldiers on the ground) would be about $300million per month. There might also be effects on consumer and business confidence thatwould influence economic activity in Europe and possibly the United States, but these effectsare even more difficult to calibrate.
International Developments I-33

Part 1: Summary and Outlook, May 13, 1999
relative to other major currencies is little changed from that in the MarchGreenbook.
The real exchange value of the dollar against the currencies of a wider group ofU.S. trading partners, as measured by the staff's broad index, is projected toremain essentially unchanged over the forecast period. U.S. consumer priceinflation, which is expected to outstrip inflation in most of the foreign industrialcountries, offsets some of the dollar's nominal decline against the major foreigncurrencies. As before, the dollar is expected to appreciate in real terms againstall major Latin American currencies except the Brazilian real. We continue toproject that Chinese authorities will begin to allow modest depreciation of therenminbi at some point during the forecast period, and we continue to assumethat the Argentine and Hong Kong currency pegs will hold.
Activity in foreign industrial countries. Real export-weighted GDP in theforeign industrial countries is projected to grow 2-1/4 percent in 1999 and 2percent in 2000. We have revised up slightly our forecast for Canadian GDPgrowth this year and next. The revised forecast incorporates the effects of recentand expected further interest rate reductions by the Bank of Canada, highercommodity prices, and the stronger outlook for the United States. CanadianGDP is now expected to rise 3 percent this year and 2-3/4 percent in 2000.
We are projecting that euro-area GDP growth will be about 2-1/4 percent thisyear and a little less in 2000. The decline in the exchange value of the euro andthe recent monetary easing are expected to help support activity going forward.We are maintaining our view that economic activity in Japan will decline untilmid-2000, although the mix of spending components is expected to change. Inresponse to recent data, projected consumption spending has been revised down.The effect of this revision on growth is offset by evidence suggesting strongerfiscal stimulus in the near term and our assumption that another supplementarybudget package will be implemented later this year.
U.K. GDP is projected to grow 1-3/4 percent in 1999 and slightly more than 2percent in 2000. A slightly tighter monetary policy stance is expected toconstrain GDP growth somewhat.
Inflation. Average consumer price inflation in the foreign industrial countries,weighted by U.S. non-oil import shares, is projected to decline to 3/4 percent in1999 before returning to about 1 percent in 2000. That pattern is driven mainlyby continued Japanese deflation: Consumer prices in Japan are expected to fallmore than 1-1/2 percent in 1999 and to decline about 1 percent in 2000. Thisoutlook for inflation in the industrial countries incorporates our revised oil price
I-34

International Developments 1-35
assumption and, as a consequence, is a bit higher than the inflation outlook inthe March Greenbook.
Interest rates. Short-term interest rates in Japan are assumed to remain nearzero throughout the forecast period. The Eurosystem rate reduction on April 8was somewhat larger than assumed in our previous forecast, and no furtherofficial actions are assumed in this forecast. With Canadian inflation expectedto remain near the bottom of the official target range and some continuingupward pressure on the Canadian dollar, we project that the Bank of Canada willreduce its Bank rate once more this year. After that, we assume the Bank ofCanada will match the assumed U.S. monetary policy actions. Recent U.K. dataindicating that the growth slowdown there will be less severe than had beenanticipated has prompted us to remove our assumption of a further reduction inthe Bank of England's repo rate. In addition, we now expect that in mid-2000the Bank of England will begin to tighten monetary policy to prevent a pickup ininflation.
Other countries. The outlook for growth in the major developing-countrytrading partners of the United States has been revised up substantially from theMarch Greenbook, largely because of favorable developments in Brazil andgrowing evidence of recovery in the developing Asian economies. We nowproject that real GDP in the major developing countries will increase 2 percentin 1999, compared with only 1/2 percent in the March Greenbook. In 2000,growth in the developing countries is expected to be slightly stronger than in ourprevious Greenbook forecast, moving to 3-1/4 percent.
The improvement in our outlook for growth in Brazil is due to several positivedevelopments, especially the strength of the real and lower-than-expectedinflation pressures, which allowed the central bank to reduce short-term interestrates. While we still expect that the high real interest rates and fiscal constraintneeded to contain inflation and restore confidence in the financial system willcause real GDP in Brazil to decline in 1999, a contraction of only 1-1/2 percentis now projected, compared with the drop of more than 7 percent forecast inMarch. Largely because of these favorable developments in Brazil and theupward revision to our projection for U.S. growth, the outlook for other LatinAmerican countries has also improved. We now project that growth in Mexicowill be 3 percent in 1999, up from the 1-1/2 percent forecast in the MarchGreenbook. In Latin America as a whole, real GDP is projected to increase1-1/2 percent in 1999, compared with a decline of 3/4 percent in the MarchGreenbook. In 2000, average growth in Latin America is expected to rise to 3percent.

The developing Asian economies that experienced sharp declines in output lastyear appear to have hit bottom or, in the case of Korea, to be recovering morebriskly than previously anticipated. Korea is now projected to grow 5 percent in1999, double the growth rate forecast in the last Greenbook. On average, realGDP growth in the Asian developing countries is expected to be 2-1/2 percent in1999, twice the pace in the last Greenbook. In 2000, average growth indeveloping Asia is expected to rise to 3-1/2 percent.
Century date change. Our forecast assumes that Y2K effects will disrupt thequarterly pattern of GDP growth abroad in the second half of 1999 and the firsthalf of 2000, much the same effects we assume for the United States. While weknow very little about the likely magnitude of these effects across countries,many countries are less prepared than the United States to deal with theseproblems, but at the same time are also less dependent on computers than theU.S. economy.
Real exports and imports of goods and services. We project that, after fallingin the first quarter, real exports of goods and services will increase slightly in thesecond quarter and rise at an annual rate of about 4-1/2 percent thereafter. Coreexports (goods other than agricultural products, computers, and semiconductors)are projected to be little changed in the second quarter and to grow at a 2-3/4percent pace over the remainder of the forecast period, reflecting in part ourassumption of a pickup in the growth of foreign economic activity and also thewaning of the depressing effects of past increases in the foreign exchange valueof the dollar. Agricultural shipments this year are expected to fall short of lastyear's relatively high level and to remain little changed in 2000.
Growth of real imports of goods and services is projected to be about 12 percentat an annual rate in the first half of 1999 and to slow to an 8 percent pace overthe rest of the forecast period, as the growth of U.S. economic activity moderatesfrom its recent torrid pace. Core imports also slow, growing 9 percent in 1999and 6 percent in 2000.
We expect the quantity of oil imports to increase more than 5 percent in 1999, asdomestic production, which was cut in response to low oil prices in 1998 andearlier this year, fails to keep pace with the growth in domestic consumption.Relative to our previous forecast, oil imports in 1999 are somewhat lower, as theimpact of a higher projected path for oil prices more than offsets the effect ofstronger U.S. growth.
Oil prices. Over the rest of the year, the price of imported oil is expected to risefrom its first-quarter levels in response to the supply restrictions agreed to byOPEC and non-OPEC producers. Stronger economic growth and lower
I-36 Part 1: Summary and Outlook, May 13, 1999

International Developments 1-37
inventories will also add support to oil prices over the next two years. Theforecast assumes that OPEC will make about half of its pledged cuts during thesecond half of 1999. The price of imported oil is now expected to increase fromaround $10.30 per barrel in the first quarter of 1999 to a high of more than$15.00 per barrel in the third quarter. Thereafter, the price of imported oilshould move down toward $14.75 per barrel as production from non-OPEC andOPEC countries increases more rapidly than consumption.
Selected Trade Prices(Percent change except as noted; seasonally adjusted annual rate)
Projection
Trade category 1998 19992000
Q1 Q2 H2
ExportsNonagricultural (core) -1.9 -0.2 2.1 0.9 1.1Agricultural -9.8 -7.9 -2.1 1.1 2.0
ImportsNon-oil (core) -2.0 0.0 -0.9 0.6 0.9Oil (level, dollars per barrel) 11.38 10.32 14.44 15.13 14.75
NOTE. Prices for exports and non-oil imports of goods, excluding computersand semiconductors, are on a NIPA chain-weighted basis.
Changes for years are measured as Q4/Q4; for half-years, Q2/Q4 or Q4/Q2;and for quarters, from previous quarter.
The price of imported oil for multi-quarter periods is the price for the finalquarter of the period.
Prices of non-oil imports and exports. Core import prices are projected todecline slightly in the second quarter before turning up in the second half of theyear, as commodity prices pick up with the rebound in foreign activity and thelagged effects of earlier dollar gains dissipate. Core export prices are forecast torise moderately over the forecast period.
Nominal trade and current account balances. The nominal trade deficit forgoods and services is projected to widen substantially during the forecast period,from $173 billion in the fourth quarter of 1998 to more than $330 billion in thefourth quarter of 2000. The deficit for net investment income is also expected towiden this year and next. Accordingly, the current account deficit, which was$234 billion in 1998, is projected to rise to about $425 billion in 2000, morethan 4-1/2 percent of projected GDP.

Part 1: Summary and Outlook, May 13, 1999
Risks to the Foreign OutlookStronger recovery of activity abroad. The downside risks to the outlook foremerging market economies appear to have diminished further since the time ofthe March FOMC meeting. Brazil is not yet out of the woods, but the scenarioin which Brazil enters onto a path of explosive debt dynamics seems a bit moreremote. In light of these developments, we revised up our forecast significantly,but our baseline for Brazil remains on the negative end of the spectrum ofoutside forecasts. We have also been surprised by the strength of the recovery inKorea and the buoyancy of Asian financial markets more generally. If businessand consumer confidence gains strength from progress on structural reforms andupturns in financial markets, economic activity in these countries and theirregions more broadly could recover a good deal more sharply than our baselineforecast envisions.
To analyze the effect of a stronger path for foreign GDP, we constructed analternative scenario. In this scenario, we assume that foreign GDPs grow 1 to 2percentage points faster, at an annual rate, relative to our baseline forecasts forindividual countries over the next six quarters. With economic activity abroadon the mend, foreign interest rates will likely rise, and it is possible that moreattention will be focused on the still burgeoning U.S. current account deficit. Toaccount for these effects, we assume that the dollar depreciates 10 percent nextquarter from our baseline path and is held at that lower level through theremainder of the forecast period. The impact of these alternative assumptions onour forecast for the U.S. economy is presented in the table below. Under theassumption that U.S. monetary policy does not respond to these changes inassumptions, U.S. GDP and inflation rise noticeably, particularly in 2000.
U.S. stock market correction triggers dollar depreciation. A substantialdecline in U.S. equity prices might make investment opportunities in the UnitedStates seem less attractive and trigger a significant dollar depreciation. Oncesuch a depreciation is started, concerns about the U.S. current account deficitmight reinforce the decline. With this in mind, we assume a path for U.S. equityprices that declines 25 percent from baseline by the end of this quarter andremains at that lower level in subsequent quarters. This alternative assumptionmatches the one described earlier in the Domestic Developments section of thisGreenbook. In addition, we assume that the exchange value of the dollar relativeto baseline follows a pattern similar to stock prices but drops by half themagnitude of the stock market decline. In this scenario, U.S. growth is weakerthan baseline in 1999, as the contractionary effect of the decline in stock pricesdominates the stimulative effect of the dollar depreciation in the near term. In2000, after the lagged effects of the dollar decline take hold, growth is higherthan baseline. Inflation is higher in both years.
I-38

Impact of Alternative Assumptions(Percent change, Q4 to Q4)
Measure 1999 2000
U.S. real GDPBaseline 3.5 2.6Stronger foreign recovery and weaker dollar' 3.7 4.0U.S. stock market correction and weaker dollar 2 3.1 2.8
U.S. CPI excluding food and energyBaseline 2.0 2.3Stronger foreign recovery and weaker dollar' 2.2 3.0U.S. stock market correction and weaker dollar2 2.4 2.9
NOTE. All simulations assume federal funds rate unchanged frombaseline.
1. Assumes dollar path 10 percent below baseline.2. Assumes dollar path 12-1/2 percent below baseline.
International Developments 1-39
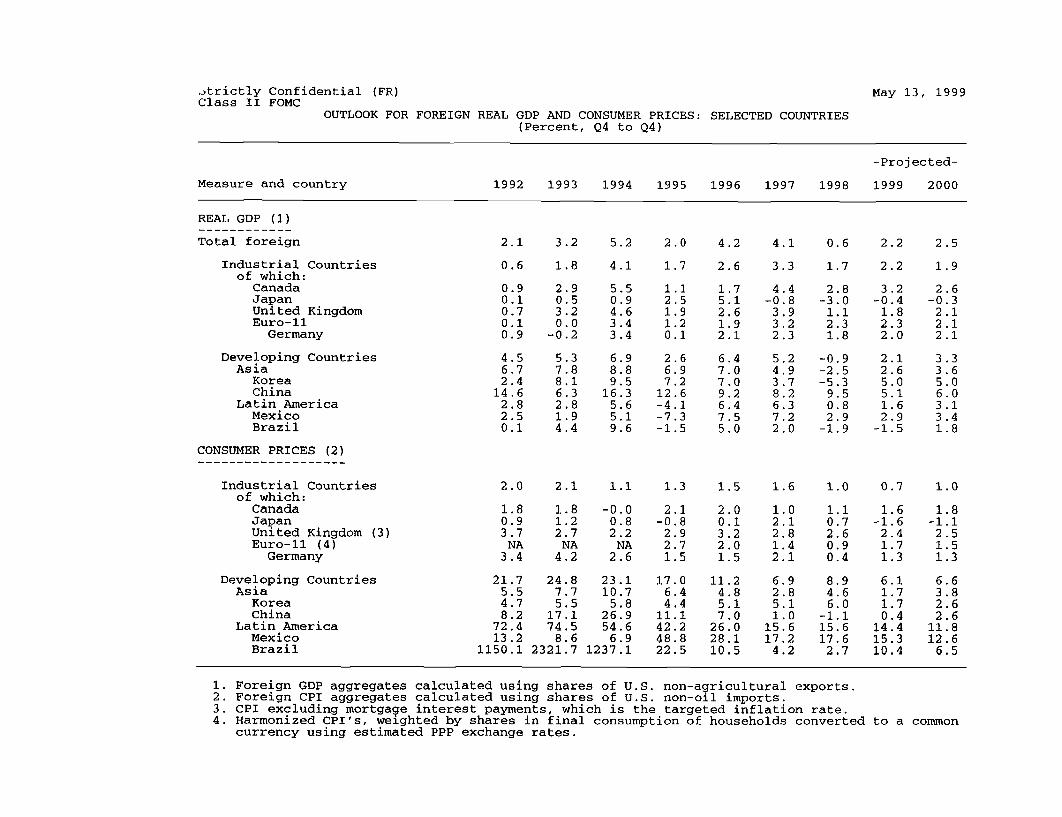
Strictly Confidential (FR)Class II FOMC
OUTLOOK FOR FOREIGN REAL GDP AND CONSUMER PRICES:(Percent, Q4 to Q4)
May 13, 1999
SELECTED COUNTRIES
-Projected-
Measure and country 1992 1993 1994 1995 1996 1997 1998 1999 2000
REAL GDP (1)
Total foreign 2.1 3.2 5.2 2.0 4.2 4.1 0.6 2.2 2.5
Industrial Countriesof which:
CanadaJapanUnited KingdomEuro-11
Germany
Developing CountriesAsia
KoreaChina
Latin AmericaMexicoBrazil
CONSUMER PRICES (2)
Industrial Countriesof which:
CanadaJapanUnited Kingdom (3)Euro-11 (4)Germany
Developing CountriesAsia
KoreaChina
Latin AmericaMexicoBrazil
0.6 1.8 4.1 1.7 2.6 3.3 1.7 2.2 1.9
4.56.72.4
14.62.82.50.1
2.90.53.20.0
-0.2
5.37.88.16.32.81.94.4
5.50.94.63.43.4
6.98.89.5
16.35.65.19.6
1.12.51.91.20.1
2.66.97.2
12.6-4.1-7.3-1.5
4.4-0.8
3.93.22.3
5.24.93.78.26.37.22.0
2.8-3.0
1.12.31.8
-0.9-2.5-5.3
9.50.82.9
-1.9
3.2-0.4
1.82.32.0
2.12.65.05.11.62.9
-1.5
2.6-0.3
2.12.12.1
3.33.65.06.03.13.41.8
2.0 2.1 1.1 1.3 1.5 1.6 1.0 0.7 1.0
21.75.54.78.2
72.413.2
1150.1
1.81.22.7NA
4.2
24.87.75.5
17.174.5
8.62321.7
-0.00.82.2NA
2.6
23.110.7
5.826.954.6
6.91237.1
2.1-0.8
2.92.71.5
17.06.44.4
11.142.248.822.5
11.24.85.17.0
26.028.110.5
6.92.85.11.0
15.617.2
4.2
1.10.72.60.90.4
8.94.66.0
-1.115.617.6
2.7
1.6-1.6
2.41.71.3
6.11.71.70.4
14.415.310.4
1.8-1.1
2.51.51.3
6.63.82.62.6
11.812.6
6.5
Foreign GDP aggregates calculated using shares of U.S. non-agricultural exports.Foreign CPI aggregates calculated using shares of U.S. non-oil imports.CPI excluding mortgage interest payments, which is the targeted inflation rate.Harmonized CPI's, weighted by shares in final consumption of households convertedcurrency using estimated PPP exchange rates.
to a common

Strictly Confidential (FR)Class II FOMC
May 13, 1999
OUTLOOK FOR FOREIGN REAL GDP AND CONSUMER PRICES: SELECTED COUNTRIES(Percent changes)
-------------------- Projected ------------------1998 1999 2000
Measure and country Q1 Q2 Q3 Q4 Q1 Q2 Q3 Q4 01 Q2 Q3 Q4Measure and country Ql Q2 Q3 Q4 Ql Q2 Q3 Q4 Ql Q2 Q3 Q4
REAL GDP (1)
Total foreign
Industrial Countriesof which:CanadaJapanUnited KingdomEuro-11
Germany
Developing CountriesAsia
KoreaChina
Latin AmericaMexicoBrazil
CONSUMER PRICES (2)-------------------
Industrial Countriesof which:
CanadaJapanUnited Kingdom (3)Euro-11 (4)Germany
Developing CountriesAsia
KoreaChina
Latin AmericaMexicoBrazil
-------------------- Quarterly changes at an annual rate ------------------
-0.4 0.4
2.0 1.1
3.2-4.8
1.73.05.3
-3.7-10.3-22.1
7.04.25.10.0
1.5-2.9
1.22.5
-0.1
-0.5-3.2-3.5
6.52.32.65.4
1.0 1.3
1.6 2.1
1.7-1.2
1.12.63.6
0.30.71.6
11.00.13.8-6.1
4.6-3.2
0.31.1
-1.5
0.33.35.3
13.8-3.4
0.1-6.4
1.4 1.7 2.3 3.3
1.8 2.0 2.1 3.0
3.3-1.5
0.41.81.1
0.91.94.52.2
-0.81.2
-4.0
3.0-0.4
1.51.91.5
1.41.94.56.81.02.4-4.0
2.8-0.2
2.12.32.3
0.2 3.7 3.2 3.0
-0.6 3.4 2.6 2.3
-0.1-2.8-0.2-0.20.2
3.74.05.86.53.84.42.3
4.21.23.13.53.3
4.14.15.86.04.34.53.0
--------------------------- Four-quarter changes --------------------------
1.5 1.1
7.44.28.90.4
14.115.34.4
7.64.78.2
-0.914.215.14.5
0.8 1.0
0.9-0.1
2.61.20.7
8.04.67.0
-1.414.315.63.6
8.94.66.0
-1.115.617.62.7
0.6 0.8 0.9
0.8-0.22.60.90.3
7.92.60.7
-1.416.418.63.0
1.3-0.7
2.41.51.0
7.01.41.0
-1.215.818.1
4.5
1.5-0.8
2.41.61.3
6.51.31.5-0.315.316.97.5
0.7
1.6-1.6
2.41.71.3
6.11.71.70.4
14.415.310.4
0.9 0.9 0.9 1.0
1.6-1.32.51.71.3
6.22.52.31.0
12.813.310.0
1.6-1.3
2.41.61.3
6.73.32.31.6
12.813.58.5
1.6-1.22.51.51.3
6.73.62.52.1
12.613.57.4
1.8-1.1
2.51.51.3
6.63.82.62.6
11.812.66.5
Foreign GDP aggregates calculated using shares of U.S. non-agricultural exports.Foreign CPI aggregates calculated using shares of U.S. non-oil imports.CPI excluding mortgage interest payments, which is the targeted inflation rate.Harmonized CPI's, weighted by shares in final consumption of households convertedcurrency using estimated PPP exchange rates.
to a common

Strictly Confidential (FR)Class II FOMC
May 13, 1999
OUTLOOK FOR U.S. INTERNATIONAL TRANSACTIONS
Projected1992 1993 1994 1995 1996 1997 1998 1999 2000
NIPA REAL EXPORTS and IMPORTSPercentage point contribution to GDP growth, Q4/Q4
Net Goods & Services -0.4 -0.6 -0.4 0.5 -0.3 -0.6 -1.1 -1.3 -0.6Exports of G&S 0.4 0.5 1.0 1.1 1.2 1.1 0.1 0.0 0.5Imports of G&S -0.8 -1.1 -1.4 -0.7 -1.4 -1.7 -1.2 -1.4 -1.1
Percentage change, Q4/Q4
Exports of G&S 4.1 4.6 10.0 10.5 10.3 9.6 1.1 0.4 4.3Services -0.9 4.1 6.0 9.8 7.5 1.5 -0.6 1.0 1.7Agricultural Goods 10.4 -5.5 16.6 -4.3 4.8 2.8 -1.2 -11.6 0.3Computers 25.2 23.7 32.0 55.5 35.9 40.7 6.4 19.5 29.6Semiconductors 64.8 32.9 66.9 79.6 46.2 21.0 9.4 23.8 23.6Other Goods 1/ 2.3 3.6 7.0 5.8 8.0 11.6 1.2 -1.8 2.4
Imports of G&S 7.4 10.2 12.3 5.6 11.8 14.0 9.7 10.5 8.1Services 1.4 3.2 1.4 6.1 5.5 12.4 2.4 5.5 3.8Oil 12.1 10.1 -0.2 2.4 7.9 4.0 5.9 6.2 5.8Computers 45.1 39.3 44.8 48.1 24.4 30.3 28.3 36.9 34.8Semiconductors 42.0 34.2 54.5 92.4 57.6 32.7 -7.6 29.3 27.4Other Goods 2/ 5.4 9.5 12.2 -1.1 10.4 13.0 10.9 9.0 6.0
Billions of chained 1992 dollars
Net Goods & Services -29.5 -70.2 -104.6 -96.5 -111.2 -136.1 -238.2 -349.7 -425.6Exports of G&S 639.4 658.2 712.4 792.6 860.0 970.0 984.7 998.0 1031.7Imports of G&S 669.0 728.4 817.0 889.0 971.2 1106.1 1222.9 1347.8 1457.3
Billions of dollars
US CURRENT ACCOUNT BALANCE -51.4 -86.1 -123.8 -115.3 -134.9 -155.2 -233.6 -353.4 -427.5
Net Goods & Services (BOP) -38.7 -71.9 -100.9 -99.9 -108.6 -110.2 -169.3 -263.6 -320.8Exports of G&S (BOP) 617.3 643.2 703.8 795.6 850.8 937.6 931.0 934.0 969.5Imports of G&S (BOP) 656.0 715.2 804.7 895.5 959.3 1047.8 1100.3 1197.6 1290.3
Net Investment Income 22.5 23.9 16.5 19.3 14.2 -5.3 -22.5 -47.0 -64.0Direct, Net 51.6 55.7 51.8 63.0 66.2 63.7 54.6 41.8 42.9Portfolio, Net -29.1 -31.7 -35.3 -43.7 -51.9 -69.1 -77.1 -88.8 -106.9
Net Transfers -35.2 -38.1 -39.4 -34.6 -40.6 -39.7 -41.9 -42.8 -42.8
1. Merchandise exports excluding agricultural products, computers, and semiconductors.2. Merchandise imports excluding oil, computers, and semiconductors.

Strictly Confidential (FR)Class II FOMC
May 13, 1999
OUTLOOK FOR U.S. INTERNATIONAL TRANSACTIONS
1995 1996 1997---------------------------- ---------------------------- ---------------------------
Q1 Q2 Q3 Q4 Q1 Q2 Q3 Q4 Q1 Q2 Q3 Q4
NIPA REAL EXPORTS and IMPORTSPercentage point contribution to GDP growth
Net Goods & Services -0.2 -0.3 1.6 0.7 -1.1 -1.0 -1.4 2.4 -1.3 -0.4 -0.5 -0.3Exports of G&S 1.0 0.6 1.9 1.1 0.4 0.6 0.2 3.2 0.9 1.7 1.2 0.5Imports of G&S -1.2 -0.9 -0.3 -0.4 -1.5 -1.6 -1.6 -0.9 -2.2 -2.2 -1.7 -0.8
Percentage change from previous period, SAAR
Exports of G&S 9.2 5.4 17.8 10.2 3.7 5.8 2.1 32.0 8.3 15.5 10.6 4.4Services 9.1 2.9 21.7 6.4 -4.0 10.3 -9.9 39.8 -6.7 11.8 5.9 -4.0Agricultural Goods 1.8 -13.4 5.0 -9.4 22.6 -32.8 -1.6 48.7 -16.1 -7.8 8.7 32.8Computers 36.4 33.8 86.6 71.6 57.6 24.7 27.7 35.9 70.2 78.7 41.9 -9.2Semiconductors 72.0 100.8 96.2 53.6 23.8 29.7 30.2 118.6 41.3 17.3 32.3 -2.2Other Goods 1/ 4.3 1.4 9.4 8.1 0.1 6.0 5.7 21.3 13.8 15.6 9.2 8.0
Imports of G&S 9.8 7.2 2.0 3.5 13.1 13.5 13.6 7.0 18.6 17.9 13.5 6.3Services 20.5 -3.3 3.1 5.5 9.2 4.3 9.9 -1.1 17.8 10.6 15.8 5.8Oil -11.4 15.4 31.4 -18.2 -9.8 68.9 3.5 -14.0 -8.2 37.0 6.0 -12.2Computers 15.4 51.6 62.7 69.3 22.5 22.9 18.8 33.8 54.5 39.0 30.6 2.9Semiconductors 37.1 105.5 128.2 113.3 38.7 8.9 50.1 172.1 89.0 16.0 20.3 17.6Other Goods 2/ 7.2 1.5 -8.8 -3.8 13.9 10.5 13.4 4.1 16.2 16.1 11.8 8.1
Billions of chained 1992 dollars, SAAR
Net Goods & Services -109.5 -114.7 -86.8 -74.8 -95.5 -113.5 -140.1 -95.9 -121.5 -131.6 -142.4 -149.0Exports of G&S 763.9 774.0 806.3 826.1 833.6 845.5 849.9 911.1 929.4 963.6 988.1 998.8Imports of G&S 873.4 888.7 893.1 900.9 929.1 958.9 990.0 1007.0 1050.9 1095.2 1130.5 1147.8
Billions of dollars, SAAR
US CURRENT ACCOUNT BALANCE -123.7 -134.2 -115.5 -87.7 -112.9 -132.0 -161.6 -133.2 -148.0 -140.4 -152.4 -180.2
Net Goods & Services (BOP) -109.3 -125.8 -90.0 -74.5 -92.4 -112.8 -132.3 -96.8 -112.5 -106.1 -108.4 -113.8Exports of G&S (BOP) 765.4 782.0 809.7 825.6 833.6 845.3 837.5 886.7 904.7 936.1 951.7 957.8Imports of G&S (BOP) 874.7 907.7 899.7 900.1 926.0 958.2 969.8 983.5 1017.3 1042.1 1060.1 1071.7
Net Investment Income 20.1 24.0 10.2 22.7 21.4 15.9 6.9 12.7 0.1 1.8 -6.2 -17.0Direct, Net 59.9 67.2 56.5 68.3 64.8 64.4 61.9 73.6 64.2 69.6 65.5 55.6Portfolio, Net -39.8 -43.2 -46.2 -45.5 -43.3 -48.5 -55.0 -60.9 -64.2 -67.8 -71.7 -72.6
Net Transfers -34.5 -32.4 -35.8 -35.9 -41.9 -35.1 -36.2 -49.1 -35.5 -36.1 -37.8 -49.3
1. Merchandise exports excluding agricultural products, computers, and semiconductors.2. Merchandise imports excluding oil, computers, and semiconductors.

Strictly Confidential (FR)Class II FOMC
May 13, 1999
OUTLOOK FOR U.S. INTERNATIONAL TRANSACTIONS
------------------------ Projected ------------------------1998 1999 2000
---------------------------- ---------------------------- ---------------------------
Q1 Q2 Q3 Q4 Q1 Q2 Q3 Q4 Q1 Q2 Q3 Q4
NIPA REAL EXPORTS and IMPORTSPercentage point contribution to GDP growth
Net Goods & Services -2.3 -2.1 -0.6 0.5 -2.5 -1.4 -1.0 -0.3 -0.7 -1.0 -0.7 -0.1Exports of G&S -0.3 -0.9 -0.3 2.0 -0.9 0.1 0.3 0.7 -0.2 0.5 0.6 0.9Imports of G&S -1.9 -1.2 -0.3 -1.5 -1.6 -1.5 -1.3 -1.0 -0.5 -1.6 -1.3 -1.0
Percentage change from previous period, SAAR
Exports of G&S -2.8 -7.7 -2.8 19.7 -7.7 0.5 2.9 6.6 -1.6 5.1 5.5 8.5Services -1.2 1.7 -10.4 8.3 1.8 -0.1 0.5 1.6 -0.7 3.1 2.3 2.3Agricultural Goods -9.9 -23.4 -14.5 61.3 -31.1 -21.7 11.3 1.8 -6.8 -2.6 8.4 2.8Computers -15.5 8.7 20.6 15.7 2.2 26.2 26.2 25.1 27.4 29.9 29.9 31.1Semiconductors -2.0 -19.7 29.7 40.3 30.6 21.6 21.6 21.6 22.7 23.9 23.9 23.9Other Goods 1/ -1.6 -11.0 -1.2 21.4 -12.9 -0.5 0.3 7.1 -5.7 3.4 3.5 9.1
Imports of G&S 15.7 9.3 2.3 12.0 12.7 11.7 10.2 7.4 3.6 11.9 9.5 7.5Services 9.3 -0.6 -0.6 2.0 5.8 6.1 4.9 5.1 0.8 5.6 4.5 4.2Oil 8.8 41.4 -5.7 -13.2 10.1 24.7 18.8 -22.2 2.3 26.4 11.9 -13.5Computers 38.8 22.4 9.8 45.3 62.0 38.6 31.1 19.3 26.3 38.6 38.6 36.1Semiconductors 9.9 -28.8 -10.5 3.8 33.6 31.1 26.2 26.2 26.7 27.2 27.7 28.2Other Goods 2/ 16.1 10.8 3.5 13.8 9.9 9.1 8.3 8.8 1.4 9.3 7.1 6.5
Billions of chained 1992 dollars, SAAR
Net Goods & Services -198.5 -245.2 -259.0 -250.1 -308.3 -343.5 -369.3 -377.9 -394.1 -421.3 -440.7 -446.3Exports of G&S 991.9 972.1 965.3 1009.6 989.6 990.8 997.8 1013.9 1009.9 1022.7 1036.5 1057.8Imports of G&S 1190.4 1217.3 1224.3 1259.6 1297.9 1334.3 1367.2 1391.8 1404.0 1444.0 1477.2 1504.1
Billions of dollars, SAAR
US CURRENT ACCOUNT BALANCE -188.1 -227.9 -262.8 -255.7 -300.2 -346.2 -374.0 -393.3 -396.9 -421.0 -437.9 -454.3
Net Goods & Services (BOP) -141.5 -176.9 -186.0 -172.7 -220.4 -261.6 -284.7 -287.9 -298.6 -319.3 -332.4 -332.9Exports of G&S (BOP) 944.8 921.0 909.4 948.9 923.5 927.1 934.8 950.6 947.1 960.3 974.5 996.2Imports of G&S (BOP) 1086.3 1097.9 1095.4 1121.6 1143.9 1188.6 1219.4 1238.5 1245.7 1279.6 1306.9 1329.0
Net Investment Income -8.9 -13.4 -36.7 -31.0 -39.8 -44.6 -49.3 -54.3 -58.3 -61.7 -65.6 -70.5Direct, Net 62.5 60.9 44.5 50.7 43.4 42.0 41.9 39.9 39.7 41.4 44.3 46.2Portfolio, Net -71.4 -74.2 -81.1 -81.8 -83.2 -86.7 -91.3 -94.3 -97.9 -103.1 -109.9 -116.6
Net Transfers -37.7 -37.6 -40.1 -52.0 -40.0 -40.0 -40.0 -51.0 -40.0 -40.0 -40.0 -51.0
1. Merchandise exports excluding agricultural products, computers, and semiconductors.2. Merchandise imports excluding oil, computers, and semiconductors.