Fomc 19781219 Blue Book 19781215
44
Prefatory Note The attached document represents the most complete and accurate version available based on original copies culled from the files of the FOMC Secretariat at the Board of Governors of the Federal Reserve System. This electronic document was created through a comprehensive digitization process which included identifying the best- preserved paper copies, scanning those copies, 1 and then making the scanned versions text-searchable. 2 Though a stringent quality assurance process was employed, some imperfections may remain. Please note that this document may contain occasional gaps in the text. These gaps are the result of a redaction process that removed information obtained on a confidential basis. All redacted passages are exempt from disclosure under applicable provisions of the Freedom of Information Act. 1 In some cases, original copies needed to be photocopied before being scanned into electronic format. All scanned images were deskewed (to remove the effects of printer- and scanner-introduced tilting) and lightly cleaned (to remove dark spots caused by staple holes, hole punches, and other blemishes caused after initial printing). 2 A two-step process was used. An advanced optimal character recognition computer program (OCR) first created electronic text from the document image. Where the OCR results were inconclusive, staff checked and corrected the text as necessary. Please note that the numbers and text in charts and tables were not reliably recognized by the OCR process and were not checked or corrected by staff.
-
Upload
fraser-federal-reserve-archive -
Category
Documents
-
view
216 -
download
0
Transcript of Fomc 19781219 Blue Book 19781215

Prefatory Note
The attached document represents the most complete and accurate version available based on original copies culled from the files of the FOMC Secretariat at the Board of Governors of the Federal Reserve System. This electronic document was created through a comprehensive digitization process which included identifying the best-preserved paper copies, scanning those copies,1 and then making the scanned versions text-searchable.2 Though a stringent quality assurance process was employed, some imperfections may remain.
Please note that this document may contain occasional gaps in the text. These gaps are the result of a redaction process that removed information obtained on a confidential basis. All redacted passages are exempt from disclosure under applicable provisions of the Freedom of Information Act.
1 In some cases, original copies needed to be photocopied before being scanned into electronic format. All scanned images were deskewed (to remove the effects of printer- and scanner-introduced tilting) and lightly cleaned (to remove dark spots caused by staple holes, hole punches, and other blemishes caused after initial printing). 2 A two-step process was used. An advanced optimal character recognition computer program (OCR) first created electronic text from the document image. Where the OCR results were inconclusive, staff checked and corrected the text as necessary. Please note that the numbers and text in charts and tables were not reliably recognized by the OCR process and were not checked or corrected by staff.

December 15, 1978Strictly Confidential (FR) Class I FOMC
MONETARY AGGREGATES ANDMONEY MARKET CONDITIONS
Prepared for the Federal Open Market Committee
By the staff Board of Governors of the Federal Reserve System

STRICTLY CONFIDENTIAL (FR) December 15 1978CLASS I - FOMC
MONETARY AGGREGATES ANDMONEY MARKET CONDITIONS
Recent developments
(1) M-1 contracted in November at a 4.6 per cent annual
rate and appears to be growing at only about a 2 per cent annual
rate in December. Thus, over the two months, M-1 is projected to
decline at a 1¼ per cent annual rate. Demand for M-1 has been
tempered by the recent substantial increases in market interest
rates, as well as by the introduction of automatic transfer services
(ATS), but the recent weakness appears greater than can be explained
by these factors. Shifts to ATS accounts are estimated to be reducing
M-1 growth by about 3 percentage points at an annual rate over November
and December. M-2 growth is projected to slow to about a 5 per
cent rate over November and December, below the low end of the FOMC's
range. The interest-bearing component of M-2 grew slightly more
rapidly in November than in October, reflecting growth of money market
certificates and the large time deposits in this aggregate. Small
time deposits subject to fixed rate ceilings declined in November, as
did savings deposits despite the introduction of ATS. Given the
Comparison of FOMC Policy Ranges forNovember-December
to Latest Staff Estimates
Ranges Latest Estimates
M-1 Upper limit of 5 -1.3
M-2 6 to 9½ 5.0
Federal funds rate Avg. for statement(per cent per annum) 9¾ to 10 week ending
Nov. 22 9.6829 9.85
Dec. 6 9.8713 9.79

weakness in savings deposits, M-l+ is projected to decline at a 4 per
cent annual rate over November and December. Inflow of deposits to
thrift institutions in November slowed somewhat, even though sales
of money market certificates continued to be robust.
(2) Following the November FOMC meeting, the Account
Management raised its Federal funds rate target to the 9-7/8 per cent
midpoint of the 9 3/4 to 10 per cent range set by the Committee. As the
weakness in the monetary aggregates developed, the FOMC voted on
December 8 to maintain the 9-7/8 per cent Federal funds target until
the next meeting, unless the monetary aggregates weakened significantly
further. Member bank borrowing has varied between $600 and $800 million
in recent weeks, a normal level for the prevailing spread between the
discount and Federal funds rate.
(3) The trade-weighted exchange value of the dollar has
declined by 1 per cent since the November FOMC meeting, but is currently
about 9 per cent above its October 31 low. The dollar's declines
against the German mark and Swiss franc have more than offset a small
rise against the Japanese yen.
1/
(4) Despite further increases in the Federal funds rate,
private short-term interest rates have changed little, on balance,
1/ Operations on behalf of Treasury and System accounts resulted innet purchases of about $2 billion

-3-
from peak levels reached in the week preceding the November FOMC
meeting. However, CD rates, as indicated by the highest offering
quotes, are currently below their mid-November peaks, when banks
were issuing CD's in large volume, partly to finance credit exten-
sions to their own foreign branches and to foreign banks. The 3-
month Treasury bill has risen substantially since the period just
prior to the November meeting, and as a result the unusually wide
spread of private short-term rates over the bill rate has narrowed.
The market supply of these bills for private investors has been
enlarged by the Treasury's decision to shift part of its weekly
bill offerings from the 6-month to the 3-month area, while demand
for bills by foreign institutions has been lower as a result of their
reduced exchange market intervention. The bank prime rate has
increased 50 basis points since the last FOMC meeting in response
to earlier advances in market rates.
(5) Bond yields rose 10 to 30 basis points in the inter-
meeting period as a bearish tone developed in capital markets when
published data suggested that economic activity has continued at
a stronger than anticipated pace and inflationary pressures have
remained intense. Agency and municipal bond new issue volume rose
in November, while the corporate calendar remained moderate. With
its dollar balances augmented by earlier sales of obligations directly

-4-
to foreign official accounts, the Treasury raised no new money from
private investors in domestic markets in the intermeeting period.1/
(6) Loan demands at commercial banks appear to have
remained relatively strong in November. Business loans expanded at
about their October pace, while real estate and probably consumer
loans increased more rapidly. To finance loan expansion, banks
issued a substantial volume of large negotiable and nonnegotiable
CD's, and in addition, liquidated security holdings. The increase
in use of managed liabilities was particularly sharp earlier in the
month when private demands for dollar credits seem to have been
augmented by borrowing in anticipation of possible dollar depreciation.
(7) The demand for residential mortgage credit apparently
has remained quite strong, as indicated by a further rise in mortgage
commitments at S&L's to a record level in October and an estimated
vigorous expansion of mortgage credit in November at both banks and
thrift institutions. In the face of this continued strong demand,
and with deposit flows slowing, the average rates on new commitments
for conventional mortgages at S&L's have risen 15 basis points to 10.35
per cent since the FOMC meeting.
1/ The Treasury did raise around $550 million of new money fromforeign official accounts through sale of nonmarketable issuesand add-ons to regular auctions. The Treasury also sold $1.6billion equivalent of M1-denominated securities on December 12.The proceeds of this issue are being warehoused with the FederalReserve with the Treasury's dollar proceeds being added to itsgeneral balance. As the Treasury balance at the Federal Reserveis reduced, the Desk will, all other things equal, sell Treasurysecurities to the public to neutralize the reserve impacts--ineffect substituting Federal Reserve sales of securities forTreasury issuance of securities in U.S. markets.

-5-
(8) The table on the next page shows percentage annual
rates of change in related monetary and financial flows over various
time periods.

Past Past PastTwelve Six Three PastMonths Months Months Months
1976 & Nov. '78 Nov. '78 Nov. '78 Nov. '781977 over over over over
Average Nov. '77 May '78 Aug. '78 Oct. '78
Nonborrowed reserves 2.0 7.1 8.2 8.3 12.8
Total reserves 3.0 6.6 5.4 3.8 -4.2
Monetary base 7.5 9.1 8.7 9.3 6.1
Concepts of Money
M-1 (Currency plus demanddeposits) 1/ 6.9 7.3 5.7 4.4 -4.6
M-1+ (M-l plus savingsdeposits at commercialbanks, NOW accounts atbanks and thrift insti-tutions, credit unionshare draft accounts,and demand deposits atmutual savings banks). 11.0 4.9 3.5 2.3 -7.1
M-2 (M-l plus time depositsat commercial banksother than large CD's) 10.4 8.1 8.5 8.0 4.3
M-3 (M-2 plus deposits atthrift institutions) 12.3 9.2 10.3 10.4 6.8
M-4 (M-2 plus CD's) 8.6 10.2 9.5 11.1 12.9
M-5 (M-3 plus CD's) 11.1 10.4 10.8 12.1 12.0
Bank Credit
Loans and investments ofall commercial banks 2/
Month-end basis 9.7 11.4 9.5 8.7 6.5
Monthly average 9.5 11.5 11.1 11.6 14.0
Short-term Market Paper(Monthly average changein billions)
Large CD's -0.4 2.0 1.4 3.0 7.2
Nonbank commercial paper 0.2 0.3 0.5 0.5 0.8
1/ Other than interbank and U.S. Government.2/ Includes loans sold to affiliates and branches.NOTE: All items are based on averages of daily figures, except for data on totalloans and investments of commercial banks, commercial paper, and thrift institu-tions--which are derived from either end-of-month or Wednesday statement datefigures. Growth rates for reserve measures in this and subsequent tables areadjusted to remove the effect of discontinuities from breaks in the series whenreserve requirements are changed.

-7-
Prospective developments
(9) Shown below for Committee consideration are two alternative
specifications for the monetary aggregates and the Federal funds rate for
the December-January period. Alternative A calls for no near-term change
in the Federal funds rate, while alternative B increases policy restraint
marginally in coming weeks. (More details and longer-term data are
contained in the tables on pp. 8 and 9.)
Alt. A Alt. B
Ranges for Dec.-Jan.1/
M-1 2½ to 7½ 2 to 7
M-2 6 to 10 5½ to 9½
Addenda
M-1+ 1 to 5 ½ to 4½
Federal funds rate(Intermeeting period) 9½ to 10¼ 9¾ to 10½
(10) Alternative A presumes a Federal funds rate between
now and the January meeting centered in the prevailing 9¾ to 10 per
cent range. The staff projects that M-1 will increase only some-
what in December, on a daily average basis, but the evident growth of
income and expenditures suggests that a substantial increase in M-1 is
likely in January. Consequently, growth in this aggregate over the
1/ Ranges for the forthcoming short-run policy period expressedin the form recommended by the subcommittee on the directive inits report distributed to the FOMC are shown in appendix IV forcomparison purposes.
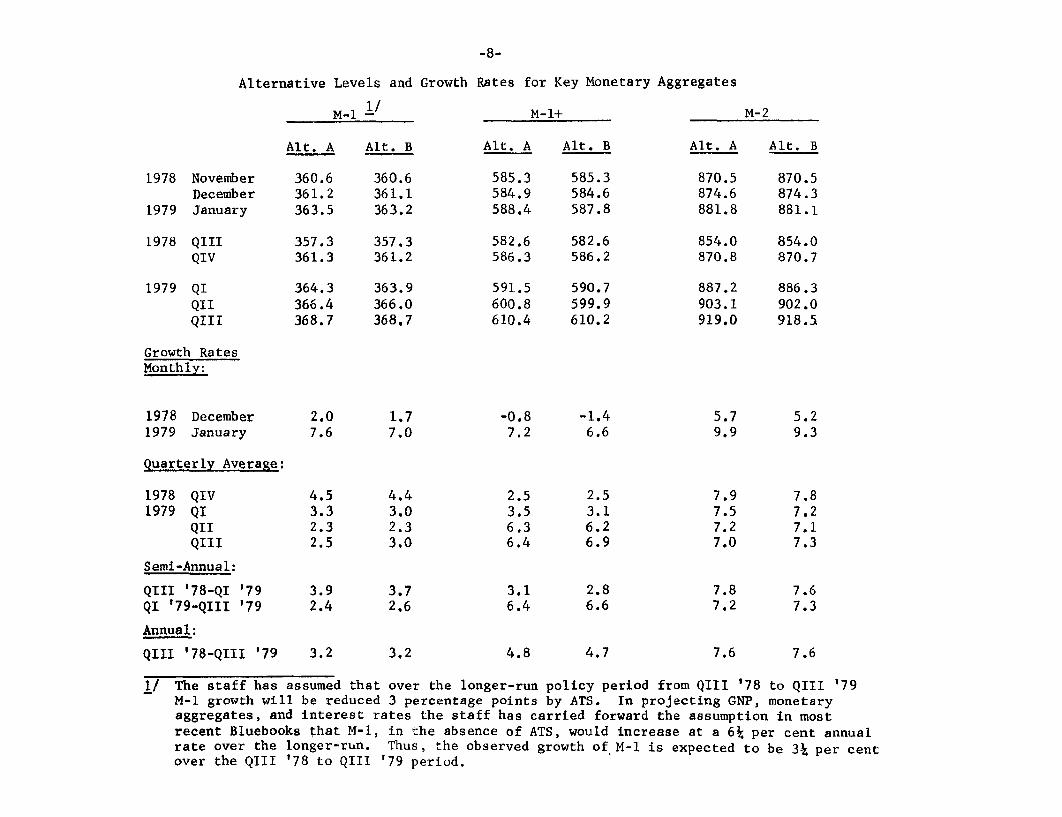
Alternative Levels and Growth Rates for Key Monetary Aggregates
M-1 1/ M-1+ M-2
Alt. A Alt. B Alt. A Alt. B Alt. A Alt. B
1978 November 360.6 360.6 585.3 585.3 870.5 870.5December 361.2 361.1 584.9 584.6 874.6 874.3
1979 January 363.5 363.2 588.4 587.8 881.8 881.1
1978 QIII 357.3 357.3 582.6 582.6 854.0 854.0QIV 361.3 361.2 586.3 586.2 870.8 870.7
1979 QI 364.3 363.9 591.5 590.7 887.2 886.3QII 366.4 366.0 600.8 599.9 903.1 902.0QIII 368.7 368.7 610.4 610.2 919.0 918.5
Growth RatesMonthly:
1978 December 2.0 1.7 -0.8 -1.4 5.7 5.21979 January 7.6 7.0 7.2 6.6 9.9 9.3
Quarterly Average:
1978 QIV 4.5 4.4 2.5 2.5 7.9 7.81979 QI 3.3 3.0 3.5 3.1 7.5 7.2
QII 2.3 2.3 6.3 6.2 7.2 7.1QIII 2.5 3.0 6.4 6.9 7.0 7.3
Semi-Annual:
QIII '78-QI '79 3.9 3.7 3.1 2.8 7.8 7.6QI '79-QIII '79 2.4 2.6 6.4 6.6 7.2 7.3
Annual:
QIII '78-QIII '79 3.2 3.2 4.8 4.7 7.6 7.6
1/ The staff has assumed that over the longer-run policy period from QIII '78 to QIII '79M-l growth will be reduced 3 percentage points by ATS. In projecting GNP, monetaryaggregates, and interest rates the staff has carried forward the assumption in mostrecent Bluebooks that M-l, in the absence of ATS, would increase at a 6k per cent annualrate over the longer-run. Thus, the observed growth of M-l is expected to be 3k per centover the QIII '78 to QIII '79 period.

Alternative Levels and Growth Rates for Key Monetary Aggregates (cont'd)
M-3 Bank Credit
Alt. A Alt. B Alt. A Alt. B
1978 November 1492.8 1492.8 971.6 971.6December 1501.9 1501.5 977.3 977.3
1979 January 1514.5 1513.5 985.4 984.8
1978 QIII 1456.1 1456.1 944.9 944.9QIV 1493.0 1492.9 969.8 969.6
1979 QI 1525.2 1523.9 993.6 992.4QII 1556.6 1554.8 1016.0 1014.2QIII 1587.7 1586.8 1038.9 1037.5
Growth RatesMonthly:
1978 December 7.3 7.0 7.0 7.01979 January 10.1 9.6 9.9 9.2
Quarterly Average:
1978 QIV 10.1 10.1 10.5 10.5
1979 QI 8.6 8.3 9.8 9.4QII 8.2 8.1 9.0 8.8QIII 8.0 8.2 9.0 9.2
Semi-Annual:
QIII '78-QI '79 9.5 9.3 10.3 10.1QI '79-QIII '79 8.2 8.3 9.1 9.1
Annual:
QIII '78-QIII '79 9.9 9.89.0 9.0

-10-
December-January period is projected to be in a 2½ to 7½ per cent
annual rate range. Transfers from demand to ATS accounts are expected
to depress M-1 growth over the two-month period by 2 to 4 percentage
points, a bit less than previously assumed.
(11) If December projections materialize, M-1 growth in
the current quarter will be only about 4 per cent, with ATS effects
reducing growth by about one percentage point. Thus, even adding
back the effects of ATS, M-1 growth will be the slowest for a quarter
in over two years.1/ The staff's econometric model suggests that,
given the estimated almost 13 per cent rate of increase in nominal
GNP in the fourth quarter, interest rates can explain only part of the
slowdown in M-1. It is too early to be certain if this shortfall is
transitory or represents the onset of another downward drift in
money demand associated with more aggressive adoption of cash
management techniques. The staff's projection for the near term
assumes that underlying money demand will lead to a strengthening of
M-1 growth, but that over the longer run policy period there will
be some continued downward drift in money demand.
(12) The supplementary aggregate M-1+ is expected to
expand in a 1 to 5 per cent range over December-January, noticeably
less than M-1, as weakness in non-ATS savings continues to limit
growth in this aggregate. While the staff is projecting that regular
1/ With the exception of the second quarter of 1978--when nominal GNP
accelerated to over a 20 per cent annual rate as the economy
rebounded from the adverse weather and coal strike during last
winter--the implied V-1 for the current quarter will increase at
its most rapid rate in almost three years. Appendix II displays
projected rates of growth of velocity.

-11-
passbook accounts at commercial banks will begin to rise in December,
following their unusually large recent contraction, the average level
of such accounts is expected to grow only modestly, if at all, over the
period.
(13) Under alternative A, M-2 is projected to expand in a
6 to 10 per cent annual rate range in December-January, a somewhat
more rapid pace than in recent weeks. This acceleration reflects
mainly the expected strengthening of M-1 and the anticipated end of
the recent decline in outstanding savings deposits. Growth in the
interest-bearing component of M-2 is expected to be at about a 9 to
10 per cent annual rate, with growth almost wholly attributable to
expansion in large time deposits that are not subject to interest
rate ceilings.
(14) Projected credit demands suggest that banks will be
forced to continue to rely on managed liabilities to supplement their
lendable funds. Further issuance of large CD's, though at a reduced
rate, is in prospect, as is a resumption of growth in domestic non-
deposit liabilities and net Eurodollar borrowing. Banks thus will
experience mounting balance sheet pressures as borrowing ratios
continue to rise and as further run-offs of bank holdings of
Treasury securities cause liquidity ratios to decline further.

-12-
(15) At thrift institutions some further moderation in the
rate of deposit inflows from the pace of the late summer and early fall
is probable in light of higher market yields and the completion of the
stock adjustment of financial assets that accompanied the introduction
of the new 6-month certificates. Nevertheless, virtually all of the
growth of deposits at S&L's and MSB's is expected to continue to
come from sales of MMC's. Sample data for early December indicate
that S&L's are not only rolling over their maturing 6-month certificates,
but continuing to issue a substantial net volume of these instruments.
Aggressive marketing of MMC's is being induced by competitive pressures,
by a need for funds to meet mortgage loan commitments, and by FHLB
advances policies.1/
(16) If the Federal funds rate remains within the 9¾ to 10
per cent range over the intermeeting period, as envisioned under
alternative A, interest rates on short-term market instruments will
likely fluctuate within a narrow range. Private short-term rates
appear to have fully adjusted to the current funds rate level, and
no significant change in private short-term credit demands appears in
prospect for the weeks immediately ahead. The relative movement of
Treasury bill rates will, of course, be influenced by the level of
foreign exchange market intervention and the portfolio policies of
foreign official institutions.
1/ The FHLBB has indicated that advances will not be liberally availableto institutions that do not make reasonable efforts to roll overmaturing 6-month certificates.
-13-
(17) Yields on longer-term bonds are likely to remain
basically stable into the early weeks of January, barring unexpected
strength in the monetary aggregates or in current economic indicators.
The financing activity of corporations and municipalities is expected
to be seasonally light over the holiday period. In December, Treasury
financing activities will be confined to roll-overs of maturing 2-
and 4-year notes. Net borrowing by the Treasury in the domestic
market over the next several weeks is expected to be limited to a
$1¼ to $1¾ billion auction of 15-year bonds to be conducted around the
turn of the year; since participants are anticipating this offering,
they have presumably already discounted it.1/ With deposit flows
slowing somewhat, yields on commitments for new conventional mortgages
may continue to edge higher.
(18) Under alternative B, the Federal funds rate would
rise by mid-January to the midpoint of a 9¾ to 10½ per cent range.
M-1 growth would likely be in a 2 to 7 per cent annual rate range over
December-January, and M-1+ and M-2, respectively, in a ½ to 4½ and
5½ to 9½ per cent range. The resulting increase in short-term market
rates of interest would further slow the growth of deposits subject
to fixed rate ceilings, induce more aggressive offerings of MMC's
and large denomination time deposits, and a tightening of bank lending
terms--with the prime loan rate moving up to 11¾ or 12 per cent.
1/ The Treasury is also expected to issue Swiss franc denominatednotes, amounting to about $1.2 billion equivalent, in the firstpart of January.

-14-
Long-term yields would also probably move up, but the light financing
calendar and further evidence of the System's determination to con-
strain monetary growth would tend to limit such movement.
(19) If M-1, as expected, expands at a 4 per cent annual
rate in the fourth quarter, the longer-run growth range for this
aggregate implies an M-1 growth over the first three quarters of 1979
at a 2¾ per cent annual rate.1/ Assuming the staff's current GNP
projections and some downward shift in money demand, the staff believes
that such growth in M-1 is generally consistent with the Federal funds
rate ranges shown in Appendix I. Reflecting monetary restraint already
in train, the midpoint of alternative A would call for no further rise
in the funds rate over the longer-run policy period. The alternative
B pattern contemplates that an increase in the funds rate to a little
over 10 per cent in the intermeeting period would be maintained through
the first quarter of 1979. This additional restraint on monetary
expansion would imply that the funds rate could be lower than the
alternative A path by next summer, while still achieving the same
growth in the aggregates over the QIII '78 to QIII '79 period.
However, if the expected downward drift in money demand does not occur,
higher interest rates than indicated by either Federal funds path would
be required to achieve the desired growth in the aggregates.
1/ This assumes, as did previous Bluebooks, that, in the absence ofATS, the Committee would desire M-1 growth of 6¼ per cent over theQIII '78 to QIII '79 policy period. The staff has assumed ATSwill reduce M-1 by 3 percentage points over this period and thattherefore observed M-1 growth is expected to be 3¼ per cent overthis QIII '78 to QIII '79 policy period.

-15-
Directive language
(20) Given below are suggested operational paragraphs
for the directive. The language added last month "giving due
regard ... to the program for supporting the foreign exchange value
of the dollar" has been retained along with the reference, added in
October, "to uncertainties associated with the introduction of ATS."
Alternative language consistent with the short-run specifications of
the alternatives discussed in the preceding section is shown for the
Committee's objective for the Federal funds rate early in the period.
At a later point, alternative language is also provided for placing main
emphasis either on monetary aggregates or, as was agreed at the
November meeting, on money market conditions. The specifications
adopted last month are shown in strike-through form.
In the short-run, the Committee seeks to achieve
bank reserve and money market conditions that are broadly con-
sistent with the longer-run ranges for monetary aggregates
cited above, while giving due regard to the program for
supporting the foreign exchange value of the dollar, to
developing conditions in domestic financial markets, and to
uncertainties associated with the introduction of ATS. Early
in the period before the next regular meeting, System open
market operations are to be directed at attaining a weekly
average Federal funds rate
(A) AT ABOUT THE CURRENT LEVEL.(B) slightly above the current level.

-16-
Subsequently, operations shall be directed at maintaining the
weekly average Federal funds rate within the range of {DEL: 9¾-to-10]
____ TO ____ per cent. In deciding on the specific objective
for the Federal funds rate, the Manager is to be guided mainly
by a range of tolerance for the annual rate of growth over the
[DEL: November-December] DECEMBER-JANUARY period of [DEL: 6-to-9½] ____ TO
____ per cent in M-2, provided that the rate of growth in M-1
does not appear to exceed [DEL: 5] ____ per cent.
Money market emphasis
The objective for the funds rate is to be raised or
lowered within its range if the rate of growth of M-2 appears
to be close to or beyond the upper or lower limit of its range.
Weight is to be given to M-1 if it appears to be growing at
a rate close to or above its limit.
If the rates of growth in the aggregates appear to be
falling outside the limits of the indicated ranges at a time
when the objective for the funds rate has already been moved
to the corresponding limit of its range, the Manager will
promptly notify the Chairman, who wil then decide whether the
situation calls for supplementary instructions from the
Committee.
Monetary aggregates emphasis
The objective for the funds rate is to be raised or
lowered in an orderly fashion within its range if the rate

-17-
of growth of M-2 appears to be significantly above or below
the midpoint of the indicated range. Weight is to be given
to M-1 if it appears to be growing at a rate close to or above
its limit.
If the rates of growth in the aggregates appear to be
falling outside the limits of the indicated ranges at a time
when the objective for the funds rate has already been moved
to the corresponding limit of its range, the Manager will
promptly notify the Chairman, who will then decide whether the
situation calls for supplementary instructions from the
Committee.

CHART 1Recently Established M-1 Growth Ranges and Actual M-1
Billions of dollars6 %
Projection- -
- 375
Q3 '78-Q3 '79
- - 2 - 365-- 2
% -3 6 5
S355
SQ2 '78-02 '79
0 s 0 d 4,'% 365
335 1- %% 365
SQ1 '78-Q1 '79
325 _ / 355
335 365
325_ / 355Q4 '77-Q4 '78
335 --
-2 - 345
325
335 - 335
325 I I I I I I I I I I 3251977 1978 1979

CHART 2
Recently Established M-2 Growth Ranges and Actual M-2
Projection --
Q3'78-Q3
S9%
01 '78-Q1 '79
e .%%
Q4'77-Q4/2'78
04 '77-Q4 '78
1978
Billions of dollars945
s g - 930
-915
- 900
- 885
- 870
855'79
885
870
855
885
870
855
885
-870
-855
-840
-825
S810
795
.I I I 7801977 1979

Chart 3
Recently Established M-3 Growth Ranges And Actual M-3
Projection --
Q3 '78-Q3 '79- # #
7 %%
'79
7%%
4 '77-% 4 704 '77-04 '78
Billions of dollars1640
io - 1610
- 1580
" - 1550
- 1520
1490
1520
S1490
- 1550
-1520
-1490
1550
1520
S1490
-1460
- 1430
_ 4 nn
'I I I I I I I I I I I I I I I I I I i I I I I I1977 1978 1979
1370
1340
1310
1370
1340
1310
1370
1340
1310
1370
1340
1310
1370
1340
1310

Chart 4
Recently Established Bank Credit Growth Ranges and Actual Bank Credit
Billions of dollars11 % 1055
Projection -Q3 '78-Q3 '79 - 1035
-
S - 1015
X-C- S' 995
- 975
11A%
- 955
0/ 2 '78-02 '79
40 1 %u l 9 3 5
X - 1975
- s- 955
875- 10- J 935S---10 %
855 - 97580 4 ' Q1 '78-Q1 '79
835- e 7/ .% - 955
8 - 935875
855 ~ 975
835 1 0 % - 955
. 04 '77-04 '788 7 5 935
855- - 915
8 35 - 895
875 - 875
855 - - 855
835 I I I I I I I I I I I I I I I I I I I I 8351978 1979

CHART 5
Recently Established M-1+Growth Range and Actual M-1+
Projection---
Billions of dollars
7
7%%
Q3 '78-Q3 '79
-.- 5%
I I i I I I I 1 1 I iI I I I I I I I I
640
620
600
580
560
1977 1978 1979

Appendix I
1978--QIV
1979--QI
QII
QIII
Projected Federal Funds Rate
Alt. A Alt. B
94 to 9-5/8 94 to 9-5/8
9k to 10 9-7/8 to 10-3/8
9k to 10 9k to 10
9k to 10 9 to 9%

Appendix II
Implied Velocity Growth Rate
Alt. A
V-1 (GNP/M-1)
1978--III 2.6IV 7.8 (6.7)
1979--1II
III
V-1+ (GNP/M-1+)
1978--111IV
1979--IIIIII
V-2 (GNP/M-2)
1978--IIIIV
1979--IIIIII
8.1 (4.4)6.7 (2.8)5.7 (2.4)
1.34.5
8.5 (4.9)6.7 (2.8)5.3 (2.1)
1.34.5
4.32.00.9
Note: Figures in parentheses reflect V-i velocity without ATS.
Alt. B
(6.7)

Appendix Table III-1
MONEY STOCK--M-1(Annual rates of growth, compounded quarter
Base Period76II 76III 76IV 771
EndingPeriod
1975 I
II
III
IV
1976 I
II
III
IV
1977 I
II
III
IV
1978 I
II
III
IV
1979 III
Alt.
Alt.
74IV
2.1
4.3
5.2
4.6
4.6
5.0
4.9
5.2
5.4
5.7
6.0
6.1
6.1
6.4
6.5
6.4
* *
7.0
5.4
6.2
6.4
6.9
7.1
7.2
7.1
7.4
7.5
7.2
6.5
6.7
5.4
5.3
5.6
5.3
5.7
5.8
6.1
6.4
6.5
6.5
6.8
6.8
6.7
* * *
7.4
7.8
7.9
7.9
7.6
8.0
8.0
7.6
7.2
7.9
8.0
7.9
7.6
8.1
8.0
7.6
8.6
8.4
8.2
7.7
8.2
8.2
7.6
5.8 6.0 6.0 5.9 6.1 6.2 6.2 6.4 6.2 6.1
5.8 6.0 6.0 5.9 6.1 6.2 6.2 6.4 6.2 6.1
7711 77111 77IV 781
7.0
4.9
4.8
5.4
5.1
5.5
5.8
6.1
6.3
6.5
6.5
6.8
6.9
6.7
* * *
7.7
7.0
8.1
8.0
7.3
6.3
8.3
8.2
7.2
10.3
9.1
7.6
7811 78111
2.9
3.8
4.9
4.6
5.2
5.6
6.0
6.3
6.4
6.4
6.8
6.9
6.7
* ***
5.9 5.6 5.3 5.1 4.1 3.2
5.9 5.6 5.3 5.1 4.1 3.2
I/ Based on quarterly average data.
ly)/
7.9
6.2
4.7
5.9
5.2
5.8
6.1
6.5
6.8
6.9
6.8
7.2
7.2
7.0
5.8
6.2
6.8
7.1
7.2
7.1
7.5
7.5
7.2
8.3
8.0
7.4
8.1
8.1
7.5
_____751 7511 75III 75IV 761

(Annual rates
Appendix Table III-2
MONEY STOCK--M-1+of growth, compounded quarterly)1/
EndingPeriod
1975 I
II
III
IV
1976 I
II
III
IV
1977 I
II
III
IV
1978 I
II
III
IV
1979 III
Alt.
Alt.
Base Period
751 7511 75I11 75IV 761 7611 7611 76IV 771741V
5.3
8.5
9.4
8.8
9.8
10.5
10.1
10.7
11.0
10.8
10.5
10.2
9.8
9.6
9.3
8.9
* *
11.3
9.1
10.7
11.5
10.7
11.4
11.7
11.3
11.0
10.6
10.1
9.8
9.5
9.0
* * *
6.9
10.4
11.5
10.6
11.5
11.8
11.3
10.9
10.5
9.9
9.7
9.3
8.8
* * * *
14.1
13.9
11.8
12.6
12.8
12.1
11.5
11.0
10.3
9.9
9.5
8.9
13.8
10.7
12.2
12.4
11.7
11.1
10.5
9.8
9.5
9.1
8.5
7.7
11.3
12.0
11.2
10.6
10.0
9.2
9.0
8.6
7.9
11.9
11.6
10.0
11.0
11.6
10.9
11.5
11.7
11.4
11.1
10.7
10.2
10.0
9.6
9.1
* * *
13.2
11.1
10.1
9.3
8.4
8.2
7.8
7.1
8.4 8.5 8.3 8.1 8.2 7.8 7.4 7.4 6.7
8.3 8.5 8.3 8.1 8.2 7.8 7.4 7.3 6.7
8.9
8.6
8.0
7.3
7.2
6.9
6.3
6.0
6.0
7711 7711 77IV
8.2
7.6
6.7
6.8
6.5
5.8
7.0
6.0
6.3
6.1
5.4
5.0
6.0
5.8
5.0
781 7811 78111
7.0
6.2
5.0
5.4
4.0
5.7 5.4 5.2 5.3 4.9 4.8
5.7 5.4 5.2 5.2 4.9 4.7
l/ Based on quarterly average data.
15.1
14.1
12.4
11.3
10.4
9.5
9.1
8.7
8.0

(Annual rates
Appendix Table III-3
MONEY STOCK--M-2of growth, compounded quarterly)1/
Base Period76I 7611 76111 76IV
EndingPeriod
1975 I
II
III
IV
1976 I
II
III
IV
1977 I
II
III
IV
1978 I
II
III
IV
1979 III
Alt.
Alt.
6.4
8.3
8.9
8.4
8.9
9.2
9.2
9.7
9.8
9.8
9.9
9.7
9.5
9.4
9.4
9.3
**
10.2
10.2
9.1
9.6
9.7
9.6
10.2
10.2
10.2
10.2
10.0
9.8
9.7
9.6
9,5
* **
11.2
10.4
10.3
9.8
9.3
9.1
9.1
9.0
771 7711 7711 77IV
9.5
9.9
9.4
8.8
8.6
8.7
8.6
10.3
8.6
9.4
9.6
9.5
10.1
10.3
10.2
10.2
10.0
9.7
9.6
9.6
9.5
* * *
8.3
7.7
7.8
8.2
8.2
781 78II
7.0
7.6
8.1
8.1
78111
6.9
9.0
9.4
9,3
10.1
10.3
10.2
10.2
10.0
9.7
9.5
9.5
9.4
* *
9.1 9.0 9.2 9.0 8.9 8.9 8.5 8.3 8.1 7.9 7.8 8.0 7.9 7.6
9.1 9.0 9.2 9.0 8.9 8.9 8.5 8.3 8.1 7.9 7.8 7.9 7.9 7.6
1/ Based on quarterly average data.
10.3
9.7
10.9
11.0
10.7
10.6
10.3
9.9
9.7
9.6
9.5
9.0
11.2
11.2
10.8
10.7
10.3
9.8
9.6
9.6
9.4
13.3
12.3
11.4
11.1
10.5
9.9
9.7
9.6
9.4
10.2
9.3
8.5
8.4
8.6
8.5
9.2
8.7
11.1
10.7
10.2
10.9
11.0
10.8
10.7
10.4
10.0
9.8
9.8
9.6
9.0 9.2
9.0 9.2
4IJ 751 LZK 75111 75V

(Annual rates
EndingPeriod
1975 1
II
III
IV
1976 1
II
III
IV
1977 I
IV
1978 I
II
III
IV
1979 III
Alt.
Alt.
8.3
10.6
11.6
11.1
11.4
11.6
11.5
12.0
12.1
11.9
12.0
11.9
11.6
11.3
11.3
11.2
10.8
10.8
Appendix Table III-4
MONEY STOCK--M-3
of growth, compounded quarterly)-
Base Period
771 7711 77111 771v 781 7811 711I
12.3
11.8
12.9
12.8
12.4
12.4
12.2
11.7
11.3
11.2
11. 1
13.0
13.2
12.1
12.2
12.2
12.1
12.5
12.5
12.3
12.3
12.2
11.9
11.6
11.5
11.4
10.9
10.9
11.3
13.2
13.0
12.4
12.4
12.2
11.6
11.1
11.1
11.0
9.8
11.2
11.6
11.5
12.2
12.3
12.1
12.1
12.0
11.6
11.3
11.2
11. 1
10.6
10.6
15.0
13.9
12.8
12.7
12.4
11.6
11.1
11.0
11.0
13.5
11.6
12.0
12.0
11.9
12.4
12.5
12.2
12.3
12.1
11,8
11.4
11.4
11.3
10.8
10.8
12.8
11.7
12.0
11.7
11.0
10.5
10.5
10.5
10.7
11.6
11.4
10.5
10.0
10.1
10.1
12.5
11.8
10.5
9.9
10.0
10.1
11.1
9.5
9.0
9.4
9.6
7.9
8.0
8.8
9.2
8.0
9.2
9.7
10.4
10.5 10.5
9.9 9.7 9.6 9.2 8.9 9.1 9.3 9.0
9.9 9.6 9.5 9.2 8.9 9.1 9.3 9.0
1/ Based on quarterly average data.
74V 251 75I1I 2IV
10.7 10.6
10.7 10.5
12.7
12.5
12.1
12.8
12.8
12.4
12.4
12.3
11.8
11.4
11.3
11.2
10.4
10.4
10.4
10.3
Ill I m II____~_~_761 7611 76III 7

APPENDIX IV
Alternative Short-run Growth Rates and Federal FundsRate Ranges
The table below shows growth rate ranges for M-1 and M-2
expressed as the growth from the average of the three months ending
in October to the average of the three-months ending in January.
These ranges are based on the same staff projections of December and
January as appear in the present two month ranges shown in paragraph 9
of the text. This three-month averaging procedure is proposed by the
Subcommittee on the Directive, in its December 13 memorandum to the
FOMC
Alt. A Alt. B
Ranges for average of three-months ending in Januaryover three-months endingin October
M-l 1-1/4 to 3-1/4 1 to 3
M-2 6 to 7-1/2 6 to 7-1/2
Addendum
M-1+ -3/4 to 3/4 -1 to 1/2
Federal funds rate(Intermeeting period) 9-1/2 to 10-1/4 9-3/4 to 10-1/2
As may be seen in the table, the difference in method of
specifying growthrates in aggregates for the short-run operating period
changes these growth rates, narrows the ranges, and reduces the
difference in growth rates between alternatives. This reflects the

IV-2
combined effect of the reduction in the annualization factor from1/
6 to 4, the reduced weight of revisions in the terminal month
(which in the proposed procedure gets only 1/3 of its present weight),
and the partly offsetting effect from including revisionsin the month
preceding the terminal month (i.e., the month of the FOMC meeting)
in the end-period.
The above factors, including a review of historical relation-
ships between revisions of monetary aggregates in the month of the FOMC
meeting and the succeeding month, suggest that projected growth rates
of both M-1 and M-2, calculated on a three-month average over a three
month average,would have been revised over the intermeeting period
by about 37 per cent of the revisions that occurred in the projected
growth rates over the present two-month policy period. Thus, experience
suggests that the tolerance ranges under the proposed procedure should
be about two-fifths as wide as at present in order to assure no change
in FOMC responses in adjusting the Federal funds rate to unanticipated
movements in the aggregates from one FOMC meeting to the next.
1/ The proposed procedure has an end-period that is centered three-months from the center of the base period, while the present pro-cedure has a one month end-period that is two months beyond thebase month.
2/ These revisions in the month prior to the terminal month have beenpositively correlated with the terminal month revisions, andthus are a factor tending to add to the variability of the pro-jected growth rate under the proposed procedure.

Chart I 12/15/78
Money Market Conditions and Interest Rates
MARKET CONDITIONS Per cent INTEREST RATES Short-term Per cent INTEREST RATES Long-term Per cent11 -- 14 14
verages Weekly Averages Weekly
-10 - 13 - - 13
9 12 - - 12
.RAL FUNDS RATE
- 8 - - 11 - 11
FHA MORTGAGES
7Borrowed 2 - --Monh FNMA Monday Auction
111 1 11 1 1 I GOVT. BONDSS5 - 8 - 1 10-Yr. Averages - 8
Billions of dollars
Borrowed - 2 7 - 7
S~3-Month
+5 - 60 PRIME COMMERCIAL PAPER
4-6 Month MUNICIPAL BOND BUYERThursdays
Net Borrowed 2I II I I I I 1 I I 1 1 1 I 1 I l 4 1 1 1 I I I I I I I~ . Il 4
1978 1979 1977 1978 19791977 1978 1979

Chart II
Actual and Projected Reserves
TOTAL
CONFIDENTIAL (FR)Class II-FOMC
12/15/78
Billions of dollars44
43
42
41
-40
-39
-38
-37
S 36
Annual rate, per cent
MONTHLY GROWTH RATES20
TOTAL
S1+
NONBORROWED
SII I 11 20JASO N D J F MA M J J A S O N D J F MA M J
1977 1978 1979

Table 1
MONETARY AGGREGATESACTUAL AND CURRENT PROJECTIONS, SEASONALLY ADJUSTED
CONFIDENTIAL (FR)CLASS II-FOMC
DEC. 15, 1978
Money Supply Total Time & Savings Deposits _Nondeposit
Period Narrow Broad U.S. Govt. TotalOther Than CD's Surces of(Ml) (M2) Deposits 1/ Total Savin s Other CD's Funds 2/
MONTHLY LEVELS-SBIL
1978--SEPT.OCT.NOV.DEC.
% ANNUAL GROWTH
QUARTERLY
1978-2ND QTR.3RD QTR.4TH QTR.
QUARTERLY-AV
1978-2ND QTR.3RD QTR.4TH QTR.
MONTHLY
1978-SEPT.OCT.NOV.DEC.
NOV.-DEC.
WEEKLY LEVELS-SBIL
1978-NOV. 18
1522 P29 P
DEC. 6 P
360.9362.0360.6
(361.2)
11.59.20.3)
9.97.64.5)
14.13.7
-4.62.0)
-1.3)
361.2362.3361.4359.3358.7
360.7
862.4867.4870.5
1874.6)
8.810.4
S5.7)
7.98.9
1 7.9)
12.57.04.3
1 5.7)
S5.0)
868.2870.9870.9870.1869.2
872.1
17.421.221.7
( 12.9)
19.622.120.423.123.5
17.0
4
589.7593.6605.3(609.6)
9.110.613.5)
10.19.5
12.9)
13.87.9
23.78.5)
16.2)
598.9602.6604.9607.0606.9
607.5
501.6505.4509.9
(513.4)
6.811.39.4)
6.410.010.3)
11.89.1
10.78.2)
9.5)
507.1508.6509.5510.7510.5
511.5
224.2223.9221.9
(220.8)
1.34.5
-6.1)
1.61.3
S-0.5)
9.7-1.6
-10.7-5.9)
-8.3)
222.9222.9222.4221.5221.1
220.9
22121
(2'
7
77.481.588.192.6)
11.417.0
( 21.9)
10.517.3
(19.1)
13.617.728.118.7)
23.7)
284.2285.7287.1289.2
289.5
290.6
88.188.295.4
( 96.2)
22.96.5
1 36.8)
32.87.5
(27.5)
25.01.4
98.010.1)
54.4)
91.894.095.496.396.4
96.1
69.874.973.2
79.8
73.468.272.276.3
NOTE: DAIA SHOWN IN PARENTHESES ARE CURRENT PROJECTIONS. P - PRELIMINARY
1/ INCLUDES TREASURY DEMAND DEPOSITS AT COMMERCIAL BANKS AND FEDERAL RESERVE BANKS AND TREASURY NOTE BALANCES.
2/ INCLUDES BORROWINGS FRUM OTHER THAN COMMERCIAL BANKS IN THE FORM OF FEDERAL FUNDS PURCHASED, SECURITIES SOLD UNDER AGREE-MENTS TO REPURCHASE, AND OTHER LIABILITIES FOR BORROWED MONEY, PLUS GROSS LIABILITIES TO OWN FOREIGN BRANCHES(EURODOLLAR BORROWINGS), LOANS SOLD TO AFFILIATES, LOAN RPS, AND OTHER MINOR ITEMS.
8

Table 1-ATIME AND SAVINGS DEPOSITS AT ALL COMMERCIAL BANKS
SEASONALLY ADJUSTED EXCEPT AS NOTED
CONFIDENTIAL (FR)CLASS II-FOMC
DEC. 15, 1978
Total Savings Deposits Time DepositsTime Memo: Large
erod and Total ndividual Business Government Total Large Small Negotiable CD'sSavings Nonproft (NSA) (NSA) Denomination Denomination
OUTSTANDING (I BILLIONS)
197d--NAR.APR.MAYJUNEJULYAUG.SEPI.
O)CT.*UV.
CHANGES (4 9'LLIONS)
1977 YEAR
QUARTERLY AVERAGE:
1977--III
IV
1978--1IIIII
MONTHLY AVERAGE:
1978--APR.MAYJUNFJULYAUG.SEPT.OCT.NOV.
561.7565.?571.6574.5579.4583.0589.7593.6605.3
55.3
13.117.0
17.314.113.6
3.56.42.94.93.66.73.9
11.7
221.0221.6222.0221.7220.9222.4224.2
223.9221.9
17.7
3.92.9
1.40.90.7
0.60.4
-0.3-0.81.51.8
-0.3-2.0
205.8206.3206.5206.1206.0207.7209.2208.7207.2
16.9
4.7
3.3
1.20.91.3
0.50.2
-0.4-0. 1
1.71.5
-0.5-1.5
10.510.6LO.t10.?10.810.610.811.011.010.9
2.3
0.40.3
-0.20.20.1
0.10.10.1
-0.20.20.20.0
-0.1
4.74.74.84.94.24.04.04.23.8
-1.6
-1.2-0.6
0.3-0.2-0.7
0.00.10.1
-0.7-0.2
0.00.2
-0.4
340.8343.6349.7352.8358.5360.6365.5369.7383.5
17.7
9.214.1
16.013.212.8
2.86.1
3.15.7
2.14.94.2
13.8
7
174.3176.1181.2182.7187.2188.7
191.9192.7205.8
23.9
5.912.7
14.510.49.3
1.85.11.54.51.53.20.8
13.1
166.5167.5168.5170.1171.3171.9173.6177.0177.7
13.8
3.31.3
1.52.83.6
1.01.01.61.20.61.73.40.7
A A I A I A ANOTE: COLUMNS (11, (2). AND 19) ONAGGREGATES. FIGURES IN COLUMNS (1),DERIVED FROM DATA REPORTED BY SMALLGOVERNMENIAL UNITS-COLUMNS 14) AND
WEDNESDAY BY LARGE COMMERCIAL BANKS
SHIPS.
82.083.487.186.787.486.388.188.295.4
11.3
0.77.1
8.86.51.6
1.43.7
-0.40.7
-1.11.80.17.2
THIS TABLE CORRESPOND TO COLUMNS (4), (6), AND (8), RESPECTIVELY, ON TABLE I-MONETARY(2), AND (6) REFLECT DAILY DATA REPORTED BY MEMBER BANKS, WITH ESTIMATES FOR NONMEMBER BANKS
MEMBER BANKS, BENCHMARKED TO NONMEMBER CALL REPORT FIGURES. SAVINGS DEPOSITS OF BUSINESS AND151-- AND LARGE DENOMINATION TINE DEPOSITS -- COLUMN (7)--REFLECT BREAKDOWNS REPORTED EACHBLOWN UP TO REPRESENT DEPOSITS AT ALL COMMERCIAL BANKS ON THE BASIS OF CALL REPORT RELATION-

TABLE 2
BANK RESERVESACTUAL AND CURRENT PROJECTIONS, SEASONALLY ADJUSTED
NFIDENTIAL (F.R.)CLASS -FOMC
DEC. 15, 1978
BANK RESERVES _REQUIRED RESERVES
Period Total Nonborrowed Monetary Total Private Total Time Gov't. andReserves Reserves Base Required Demand Deposits Interbank
MONTHLY LEVELS-SMILLIONS
1978--SEPT.OCT.NOV.DEC.
PERCENT ANNUAL GROWTH
QUARTERLY
1978--2ND QTR.3RD OTR.4TH QTR.
QUARTERLY-AV
1976--2ND QTR.3kD QTR.4TH QTR.
MONTHLY
1978-StPT.OCT.NOV.DEC.
NOV.-DEC.
WEEKLY LEVELS-SMILLIONS
1978-NOV. 18
152229
DEC. 6
41,17241,43441,289
(41,335)
11.54.6
( 1.6)
6.68.2
( 2.6)
8.17.6
-4.2
1.3)
-1.4)
41,31041,30441,04941,36141,397
41,576
2
0 11240,15640,586
(40,674)
3.75.0
( 5.6)
1.16.2
( 5.6)
10.71.3
12.82.6)
7.7)
40,00540,60640,41640,75740,606
40,878
139,750140,782141,501
(142.441)
10.48.5
S 7.7)
8.19.0
( t.5)
12.68.96.18.01
7.1)
141,361140,927141,072141,769142,155
142,215
40,97941,26141,112
(41,252)
11.74.4
S2.7)
7.28.2
S3.0)
7.4b.3-4.34.1)
-0.1)
41,197
40,91840,80441,306
41,357
41,470
NOTE: RESERVE SERIES HAVE BEEN ADJUSTED TO REMOVE DISCONTINUITIES ASSOCIATED WITHDATA SHOWN IN PARENTHESES ARE CURRENT PROJECTIONS.
22,84523,05922,705(22,604)
13.18.3
( -4.2)
5.09.5
S 2.7)
14.211.2
-18.4l -5.3)
1 -11.8)
23*29922,55622,58922,74222*856
22,666
16,74016,61816,936(17,2041
10.14.4
(11.1)
11.56.6
( 6.4)
9.2-8.723.0
(19.0)
1 21.2)
16,54216,70516,87517,02417,155
17,230
1,3941,5841,470
( 1,4451
1,3561,6571,3401,5401,346
1,574
CHANGES IN RESERVE REQUIREMENT RATIO.
4

TABLE 3 1/NET CHANGES IN SYSTEM HOLDINGS OF SECURITIES-
($ million, not seasonally adjusted)
STRICTLY CONFIDENTIAL (FR)CLASS II - FOMCDECEMBER 15, 1978
TreasuryBills Net ithChange 2/ i year
TreasNet Pu
1-5
ury Couponsurchases 3/
5 - 10 Over 10 Total Within1 vear
Federal AgenciesNet Purchases 4/
1 - 5 5 - 10 Over 10
-4907,2321,280-468
8634,361
1977--Qtr. IIIQtr. IV
1978--Qtr. IQtr. IIQtr. III
1978--June
JulyAug.Sept.
Oct.Nov.
1978--Oct. 4111825
Nov. 18
152229
Dec. 6132027
LEVEL--Dec. 13/in hllinns
789579797
3,2843,0252,833
539500434
1,5101,048
758
167129196
1,070642553
1,5821,4151,7476,2025,1874,660
886 116 681 96 128 1,021186 99 628 166 108 1,001
-2,6555,4443,152
4,395
235283
2,635
-170
-2,151
721100
-1,667-2,052
-923504716
1,1231,156
774
247 2,175334 2,246235 1,697
135 631 176 115 1,057
507 87 139 807628 163 108 1,037
592400
1,665824469792
1,059864
3,0821,613891
1,433
1,6319,2736,3037,2676,227
10,035
S - - - 4,273
- 386 177 145 707 -643
-----------555
46 127 104 24 301 7,930-92 -81 -- - -173 4,632
46 127 104 24 301 5,724
231-92 -81 - -- -173 1,043
S - - - 3,358
S - - - 625
---------- -1,154
-- -- -- -- -- -- -- -- -- -- -1,672-- -- -- -- -- -- -- -- -- -- -2,052
-- -- -- -- -- -- -- -- -- -- -923139 628 163 108 1,037 -- -- -- -- -- 1,540
-- -- -- -- -- -- -- -- -- -- 683
45.4 10.3 31.6 14.7 10.7 67.3
-1,358-46
-1541,2723,607
-2,892
-2,33134
-1,1331,224
266
2,950
-2,5361,7011,102
-1,594-1,265
-6,2705,822-6,9626,923
-1,809-6,6631,7832,0922,643
-10,5006,851
1.9 3.7 1.5 .9 7.9 120.6
Change from end-of-period to end-of-period.Outright transactions in market and with foreign accounts, and redemptions (-) in bill auctions.Outright transactions in market and with foreign accounts, and short-term notes acquired in exchange for maturing bills. Excludes redemptions,maturity shifts, rollovers of maturing coupon issues, and direct Treasury borrowing from the System.Outright transactions in market and with foreign accounts only. Excludes redemptions and maturity shifts.In addition to net purchases of securities, also reflects changes in System holdings of bankers' acceptances, direct Treasury borrowings fromthe System, and redemptions (-) of Agency and Treasury coupon issues.Includes changes in both RP's (+) and matched sale-purchase transactions (-).
Net ChangeOutrightHoldingsTnlInl *l/
1 vear Total 5/I
f4 n 114-sj-m

TABLE 4SECURITY DEALER POSITIONS AND BANK POSITIONS
(millions of dollars)
STRICTLY CONFIDENTIAL (FR)CLASS II - FOMCDECEMBER 15, 1978
U.S. Govt. Security Underwriting Member Bank Reserve PositionsDealer Positions Syndicate Positions Excss**Borrowing at FRB** Basic Reserve Deficit**
uBillp Corporate n Reserves Total Seasonal 8 New York 38 OthersB sIssues Bonds Bonds 3 Oer
1977--HighLow
1978--HighLow
1977--Nov.Dec.
1978--Jan.Feb.Mar.
Apr.MayJune
JulyAug.Sept.
Oct.Nov.
1978--Oct. 4111825
Nov. 18152229
Dec. 6132027
7,2341,729
5,625278
3,6174,257
4,1273,4182,713
3,1831,2032,847
1,1961,9942,571
1,495*1,960
1,6761,3931,5071,255
1,7861,6391,660
*1,462*2,004
*1,909*2,520
3,017-1,445
2,043-1,076
610804
3271,492
740
-183578
-626423125
-309*462
-19-369-528-290
121,032
687*275*135
*-281*-83
2950
2150
36195
422496
462535
513449
1623
35524
0
30
1073
30
64120p
513-111
719-227
251193
268243200
149219178
197168193
1771
82p
123367
-119367
11338624555p
40p
106p
-4p
1,86120
1,716172
863570
484406328
5571,2121,094
1,3171,1391,060
1,2777 0 3
p
1,2861,2391,2501,314
1,305698633604p791p
698p
5 94p
-9,151-4,234
-8,224-2,370
-6,971-7,403
-6,047-4,980-6,778
-6,196-4,038-4,514
-3,651-4,793-5,098
-4,651-3,
44 8p
-5,173-6,292-4,918-3,139
-3,843-4,221-4,763-2,519-2,370
-2,48 2
p-4,081p
* Strictly confidential.** Monthly averages for excess reserves and borrowings are weighted averages of statement week figures.
-13,975- 8,206
-14,657- 8,273
-11,825-11,350
-12,299-12,603-11,060
-12,998-11,653-12,202
-10,204-11,089-11,357
-11,551-13,452p
-10,398-12,406-13,059-10,731
-10,522-12,872-13,128-14,657-13,585
- 1 3 , 3 3 7 p-13,348p
NOTE: Government security dealer trading positions are on a commitment basis. Trading positions, which exclude Treasury securities financed byrepurchase agreements maturing in 16 days or more, are indicators of dealer holdings available for sale over the near-term. Underwriting syndicatepositions consist of issues still in syndicate, excluding trading positions. The basic reserve deficit is excess reserves less borrowing at FederalReserve less net Federal funds purchases. Weekly data are daily averages for statement weeks, except for corporate and municipal issues in syndicatewhich are Friday figures.
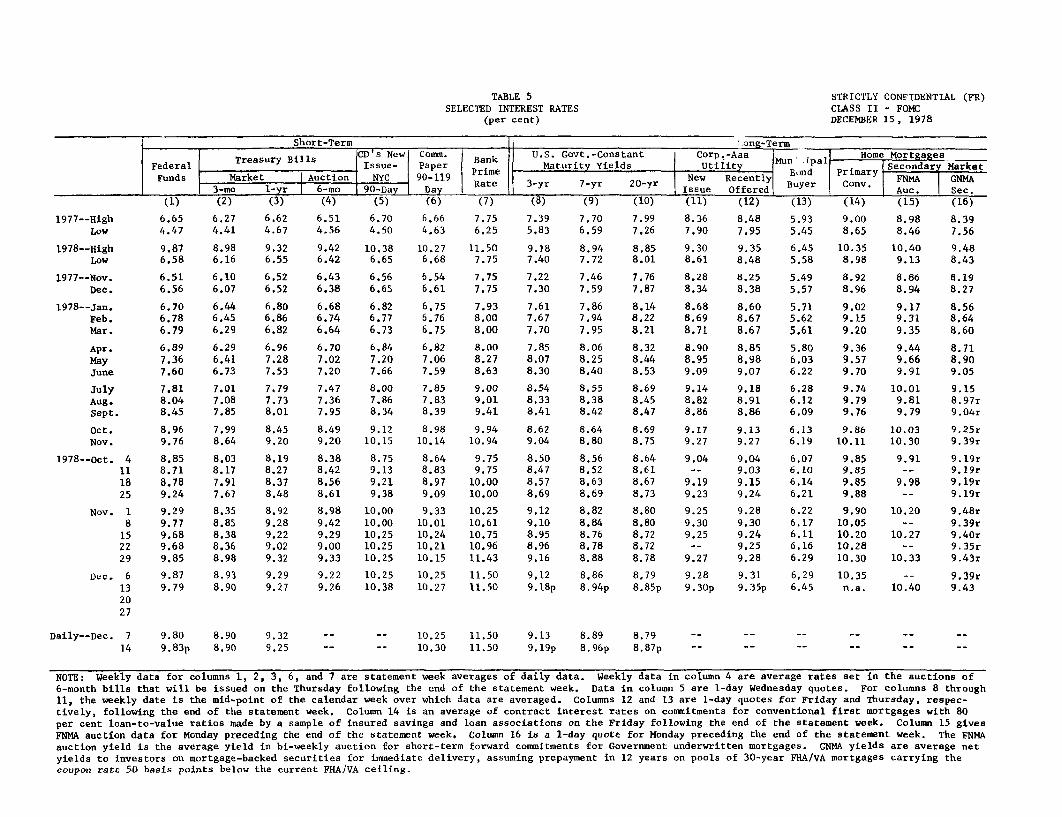
TABLE 5SELECTED INTEREST RATES
(per cent)
STRICTLY CONFIDENTIAL (FR)CLASS II - FOMCDECEMBER 15, 1978
Short-Term
FederalTreasury Bills
CD's NewIssue-
unds Market Auction NYC3-mo 1-yr 6-mo 90-Day
(1) (2) (3) (4) (5)
Comm.
Paper90-119Day
(6)
BankPrimeRate
(7)
U.S. Govt.-ConstantMaturity Yields
N3-yr 7-yr 20-yr
(8) (9) () ((8) (9) (10)
.ong-TermCorp.-Aaa Mun p Home MortgagesUtility Munil rimary Secondar Market
ew Recently Bod ConPry FNMA GNMAsue Offered yAuc. Sec.11) (12) (13) (14) (15) (16)
1977--HighLow
1978--HighLow
1977--Nov.Dec.
1978--Jan.Feb.Mar.
Apr.MayJune
JulyAug.Sept.
Oct.Nov.
1978--Oct. 4111825
Nov. 18152229
Dec, 6132027
Daily--Dec. 714
6.65 6.27 6.62 6.51 6.70 6.66 7.75 7.39 7.70 7.99 8.36 8.48 5.93 9.00 8.98 8.394.47 4.41 4.67 4.56 4.50 4.63 6.25 5.83 6.59 7.26 7.90 7.95 5.45 8.65 8.46 7.56
9.87 8.98 9.32 9.42 10.38 10.27 11.50 9.18 8.94 8.85 9.30 9.35 6.45 10.35 10.40 9.486.58 6.16 6.55 6.42 6.65 6.68 7.75 7.40 7.72 8.01 8.61 8.48 5.58 8.98 9.13 8.43
6.51 6.10 6.52 6.43 6.56 6.54 7.75 7.22 7.46 7.76 8.28 8.25 5.49 8.92 8.86 8.196.56 6.07 6.52 6.38 6.65 6.61 7.75 7.30 7.59 7.87 8.34 8.38 5.57 8.96 8.94 8.27
6.70 6.44 6.80 6.68 6.82 6.75 7.93 7.61 7.86 8.14 8.68 8.60 5.71 9.02 9.17 8.566.78 6.45 6.86 6.74 6.77 6.76 8.00 7.67 7.94 8.22 8.69 8.67 5.62 9.15 9.31 8.646.79 6.29 6.82 6.64 6.73 6.75 8.00 7.70 7.95 8.21 8.71 8.67 5.61 9.20 9.35 8.60
6.89 6.29 6.96 6.70 6.84 6.82 8.00 7.85 8.06 8.32 8.90 8.85 5.80 9.36 9.44 8.717.36 6.41 7.28 7.02 7.20 7.06 8.27 8.07 8.25 8.44 8.95 8.98 6.03 9.57 9.66 8.907.60 6.73 7.53 7.20 7.66 7.59 8.63 8.30 8.40 8.53 9.09 9.07 6.22 9.70 9.91 9.05
7.81 7.01 7.79 7.47 8.00 7.85 9.00 8.54 8.55 8.69 9.14 9.18 6.28 9.74 10.018.04 7.08 7.73 7.36 7.86 7.83 9.01 8.33 8.38 8.45 8.82 8.91 6.12 9.79 9.818.45 7.85 8.01 7.95 8.34 8.39 9.41 8.41 8.42 8.47 8.86 8.86 6.09 9.76 9.79
9.158.97r9.04r
8.96 7.99 8.45 8.49 9.12 8.98 9.94 8.62 8.64 8.69 9.17 9.13 6.13 9.86 10.03 9.25r9.76 8.64 9.20 9.20 10.15 10.14 10.94 9.04 8.80 8.75 9.27 9.27 6.19 10.11 10.30 9.39r
8.85 8.03 8.19 8.38 8.75 8.64 9.758.71 8.17 8.27 8.42 9.13 8.83 9.758.78 7.91 8.37 8.56 9.21 8.97 10.009.24 7.67 8.48 8.61 9.38 9.09 10.00
8.358.858.388.368.98
8.989.429.299.009.33
10.0010.0010.2510.2510.25
9.3310.0110.2410.2110.15
10.2510.6110.7510.9611.43
8.50 8.56 8.648.47 8.52 8.618.57 8.63 8.678.69 8.69 8.73
9.12 8.82 8.809.10 8.84 8.808.95 8.76 8.728.96 8.78 8.729.16 8.88 8.78
9.049.039.159.24
9.289.309.249.259.28
6.076.106.146.21
6.226.176.116.166.29
9.859.859.859.88
9.9010.0510.2010.2810.30
9.91
9.98
10.20
10.27
10.33
9.19r9.19r9.19r9.19r
9.48r9.39r9.40r9.35r9.43r
9.87 8.93 9.29 9.22 10.25 10.25 11.50 9,12 8,86 8.79 9.28 9.31 6,29 10.35 -- 9.39r9.79 8.90 9.27 9.26 10.38 10.27 11.50 9.18p 8.94p 8.85p 9.30p 9.35p 6.45 n.a. 10.40 9.43
9.80 8.90 9.32 -- - 10.25 11.50 9.13 8.89 8.79
9.8 3
p 8.90 9.25 - -- 10.30 11.50 9.19p 8.9
6p
8.87p
NOTE: Weekly data for columns 1, 2, 3, 6, and 7 are statement week averages of daily data. Weekly data in column 4 are average rates set in the auctions of
6-month bills that will be issued on the Thursday following the end of the statement week. Data in column 5 are 1-day Wednesday quotes. For columns 8 through11, the weekly date is the mid-point of the calendar week over which data are averaged. Columns 12 and 13 are 1-day quotes for Friday and Thursday, respec-tively, following the end of the statement week. Column 14 is an average of contract interest rates on commitments for conventional first mortgages with 80
per cent loan-to-value ratios made by a sample of insured savings and loan associations on the Friday following the end of the statement week. Column 15 gives
FNMA auction data for Monday preceding the end of the statement week. Column 16 is a 1-day quote for Monday preceding the end of the statement week. The FNMAauction yield is the average yield in bi-weekly auction for short-term forward commitments for Government underwritten mortgages. GNMA yields are average net
yields to investors on mortgage-backed securities for immediate delivery, assuming prepayment in 12 years on pools of 30-year FHA/VA mortgages carrying thecoupon rate 50 basis points below the current PHA/VA ceiling.
---- L----Y-I F

DEC. 15, 1978
Appendix Table 1-A
Money and Credit Aggregate Measures
Bank Reserves 1 Bank Money Stock Measures
TotalPeriod Total Non- Monetary Loans
Tota borrowed Base and MI M M-2 M-3 M-4 M-5 M-6 MInvest-ments
C. C- I. It 1
1 2 3 4 5 0 I o(PER CENT ANNUAL RATES OF GROWTH)
1975 -0.6 2.6 5.6 3.9 4.6 6.8 8.4 11.1 6.6 9.7 10.5 9.81976 0.7 0.8 6.7 8.0 5.8 12.6 10.9 12.8 7.1 10.3 9.9 10.01977 5.3 3.1 3.3 11.3 7.9 9.3 9.8 11.7 10.1 11.8 11.6 11.6
2/SEMI-ANNUALLY:
1ST HALF 1977 3.8 3.2 1.3 11.3 7.8 1.8 10.1 11.4 9.4 10.8 10.2 10.42NO HALF 1977 6.8 2.9 9.0 10.7 7.8 7.4 9.1 11.4 10.3 12.1 12.3 12.2
1ST HALF 1978 7.8 7.8 9.0 12.7 8.1 5.9 7.4 7.8 10.3 9.5 9.5 10.9
QUARTERLY:
4rH OTR. 1977 7.5 8.2 9.6 9.5 6.6 4.7 7.2 9.3 11.5 11.8 12.0 12.7
1ST jTR. 1978 6.3 8.9 8.0 10.4 5.2 4.3 6.5 7.0 9.6 8.9 d.9 10.52ND QTR. 1978 11.5 3.7 10.4 17.0 11.5 7.7 8.8 8.4 10.0 9.2 9.1 10.23RD QTR. 1978 4.6 5.0 8.5 8.7 9.2 7.5 10.4 11.8 10.0 11.5 10.8 10.8
QUAKTERLY-AV:
4TH 3TR. 1977 6.3 J.8 9.0 9.9 7.5 0.8 8.1 LO.6 10.8 12.2 12.7 12.7
IST QTR. 1978 8.8 14.4 9.7 10.1 6.2 4.9 6.9 1.7 10.3 9.8 9.9 11.32ND QTR. 1978 6.6 1.1 8.1 14.9 9.9 6.9 7.9 7.8 10.1 9.1 8.9 10.23RD QTR. 1978 8.2. 2 62 9.0 10.8 7.6 5.3 8.9 10.1 8.8 9.9 9.0 9.4
MONTHLY:
1977--NOV. 6.2 20.7 8.3 9.2 1.1 0.4 6.0 8.1 11.8 11.5 12.1 12.8DEC. 6.7 16.1 10.5 6.3 8.2 5.4 6.1 7.9 9.9 10.1 9.7 11.0
1978--JAN. 14.8 17.8 13.4 14.4 11.3 9.4 9.5 9.2 11.8 10,6 11.3 12.7FE8. 10.6 13.2 6.9 8.5 0.4 0.8 4.7 5.6 8.5 7.9 7.8 9.4MAR. -6.6 -4.3 3.4 7.9 3.9 2.5 5.1 6.2 8.3 8.0 7.4 9.0APR. 8.9 2.0 7.7 19.9 19.6 13.6 11.2 9.5 11.9 10.2 10.2 11.4MAY 10.2 -9.6 12.0 16.6 7.2 5.4 7.1 7.2 11.2 9.6 9.7 10.7JUNE 14.9 19.0 11.1 13.7 7.5 4.0 7.8 8.4 6.6 7.6 7.2 8.2JULY 14.0 7.6 8.5 11.0 4.8 1.5 8.0 9.4 8.Z 9.4 7.6 8.0AUG. -8.2 -3.2 4.2 5.1 8.5 8.7 10.4 11.7 8.0 10.2 9.2 8.9SEPT. 8.1 10.7 12.6 9.7 14.1 12.2 12.5 14.0 13.7 14.6 15.4 15.0OCT. 7.6 1.3 8.9 9.8 3.7 1.8 7.0 10.0 6.4 9.5 7.9 7.9NOV. P -4.2 12.8 6.1 6.5 -4.6 -7.1 4.3 6.8 12.9 12.0 11.2 11.1
1/ BASED ON DATA ADJUSTED FOR CHANGES IN RESERVE REQUIREMENTS.2/ BASED ON QUARTERLY AVERAGE DATA.P - PRELIMINARY

DEC. 15, 1978Appendix Table 1-B
Money and Credit Aggregate MeasuresSeasonally Adjusted, Billions of Dollars
Bank Reserves -1B k Money Stock MeasureBCredit Money Stock Measures
Period TotalNon- Monetary Loans
Total borrowed Base and M-1 M-l+ M-2 M-3 M-4 M-5 M-6 M-7borrowed Base andInvest-ments
1 2 3 4 5 6 7 8 9 10 11 12ANNUALLY:
1975 36,643 36,513 113,019 726.2 295.2 456.4 664.7 1092.5 746.1 1173.8 1307.4 1350.7
1976 37,050 36,996 120,671 788.9 313.5 516.8 740.5 1236.5 803.2 1299.2 1437.6 1485.4
1977 38,961 38,391 130,789 875.5 338.5 560.2 809.5 1376.1 883.5 1450.1 1604.3 1660.5
MONTHLY:
1977--MOV. 38,744 37,882 129,650 870.9 336.2 557.7 805.4 1367.1 876.3 1438.0 1591.4 1645.4
DEC. 38,961 38,391 130,789 875.5 338.5 560.2 809.5 1376.1 883.5 1450.1 1604.3 1660.5
1978--JAN. 39,443 38,959 132,252 886.0 341.7 564.6 815.9 1386.6 892.2 1462.9 1619.4 1678.1
FEB. 39,793 39,387 133,017 892.3 341.8 565.0 819.1 1393.1 898.5 1472.5 1629.9 1691.3
MAR. 39,573 39,245 133,390 898.6 342.9 566.2 822.6 1400.3 904.7 1482.3 1639.9 1704.0
APR. 39,868 39,311 134,251 913.5 348.5 572.6 830.3 1411.4 913.7 1494.9 1653.8 1720.2
MAY 40,208 38,936 135,596 926.1 350.6 575.2 835.2 1419.9 922.2 1506.9 1667.1 1735.5
JUNE 40,706 39,612 136,854 936.7 352.8 577.1 840.6 1429.8 927.3 1516.5 1677.1 1747.4
JULY 41,180 39,863 137,822 945.3 354.2 577.8 846.2 1441.0 933.6 1528.4 1687.7 1759.1
AUG. 40,897 39,757 138,302 949.3 356.7 582.0 853.5 1455.1 939.8 1541.4 1700.6 1772.2
SEPT. 41,172 40,112 139,750 957.0 360.9 587.9 862.4 1472.1 950.5 1560.2 1722.4 1794.4
OCT. 41,434 40,156 140,782 964.8 362.0 588.8 867.4 1484.4 955.6 1572.5 1733.8 1806.2
NOV. P 41,289 40,586 141,501 970.0 360.6 585.3 870.5 1492.8 965.9 1588.2 1750.0 1822.9
WEEKLY:
1978-OCT. 11 41,533 40,294 140,424 364.3 591.6 869.4 955.8
18 41,520 40,270 140,918 364.3 591.1 869.3 956.2
25 41,218 39,904 140,538 358.8 585.3 865.2 954.1
NOV. 1 41,310 40,005 141,361 361.2 586.9 868.2 960.0
8 41,304 40,606 140,927 362.3 58d.1 870.9 964.9
15 41,049 40,416 141,072 361.4 586.7 870.9 966.3
22P 41,361 40,757 141,769 359.3 583.7 870.1 966.3
29P 41,397 40,606 142,155 358.7 582.6 869.2 965.6
DEC. 6P 41,576 40,878 142,215 360.7 584.4 872.1 968.2
NOTES: WEEKLY DATA ARE DAILY AVERAGES FOR STATEMENT WEEKS. MONTHLY DATA ARE DAILY AVERAGES. WEEKLY DATA ARE NOT AVAILABLE FO
M3, MS, M6, M7, TOTAL LOANS AND INVESTMENTS AND THRIFT INSTITUTION DEPOSITS.
1/ BASED ON DATA ADJUSTED FOR CHANGES IN RESERVE REQUIREMENTS. DATA SHOWN IN MILLIONS OF DOLLARS.
P - PRELIMINARY

APPENDIX TABLE 2-A DEC. 15, 1978
COMPONENTS OF MONEY STOCK AND RELATED MEASURES
Period
2/ANNUALLY:
197519761977
2,SEMi-ANNUALLY:
1ST HALF 19772Nj HALF 1977
1ST HALF 1978
QUARTERLY:
4TH OTR. 1977
1ST QTR. 19782NO QTR. 19783RD QTR. 1978QUARTERLY-AV:
4TH QTR. 1977
1ST QTR. 19782ND QTR. 19783RD QTR. 1978
MONTHLY:
1977--NOV.DEC.
1978--JAN.FEB.MAR.APR.MAYJUNFJULYAUG.SEPT.OCT.NOV. P
8.79.8
9.6
10.7
9.59.3
10.3
10.3
10.58.49.6
8.312.3
10.89.48.06.611.89.16.59.015.310.110.0
7.47.1
7.7
5.4
3.812.0
8.9
6.4
5.010.3
7.0
-1.06.8
11.0-2.4
2.923.85.66.54.68.7
13.21.8
-10.4
7.98.0
11.4
10.411.8
11.7
14.5
12.39.1
10.6
13.0
12.810.19.5
18.510.9
12.313.310.8
7.513.66.110.27.5
13.87.9
23.7
11.715.011.2
11.910.0
6.9
7.7
7.46.8
11.3
8.5
7.36.4
10.0
9.54.6
8.47.66.05.36.78.210.311.511.89.1
10.7
5 6 7 8(Per cent annual rates of growth)
17.525.011.1
15.36.4
2.1
1.5
2.61.34.5
5.4
2.61.61.3
-1.11.1
6.01.10.53.32.2
-1.6-4.38.19.7
-1.6-10.7
7.87.4
11.4
8.913.3
11.1
13.5
11.511.417.0
11.6
11.410.517.3
18.08.7
10.013.210.8
6.511.516.022.514.213.617.728.1
-6.4-23.412.8
0.624.9
43.5
64.0
43.222.96.5
44.9
50.032.8
7.5
81.352.5
37.348.839.320.553.2-5.5
9.7-15.1
25.01.4
98.0
15.315.514.2
12.914.5
7.6
11.6
6.97.3
13.8
13.9
8.16.8
11.4
11.09.5
7.86.26.66.66.88.5
11.114.415.514.910.9
19.518.819.4
16.620.6
17.4
18.8
17.914.715.0
20.0
18.215.813.6
15.818.2
17.915.220.014.712.116.811.811.720.9
6.84.5
aII =- II--- a - . a - a *- .1/ GROWTH RATES ARE BASED ON ESTIMATED MONTHLY AVERAGE LEVELS
PREVIOUS MONTH REPORTED DATA.2/ BASED ON QUARTERLY AVERAGE DATA.P - PRELIMINARY.
DERIVED BY AVERAGING END OF CURRENT MONTH AND END OF
33.67. 1
12.6
2.622.3
12.0
23.5
11.39.53.4
29.7
16.27.5
-3.0
25.47.8
29.49.1
-4.513.513.4
1.5-23.5
-7.542.2
-17.54.4
-7.011.913.4
15.910.1
51.9
32.2
55.439.3
9.1
12.9
52.345.619.3
31.951.1
51.255.252.843.134.336.917.0
3.46.76.78.3
II _~

APPENDIX TABLE 2-B
COMPONENTS OF MONEY STOCK AND RELATED MEASURESDEC. 15, 1978
Time and Savings Deposits Mutual Short- OtherSavings Credit Term Private Non- Total
Period Currency Demand Bank Union Savings U*g Short- Deposit Gov'tDeposits Total Other Than CD's & S&L Shares Bonds Govt term Funds Demand
Total Savings Other Sharesi 1_ Sec Assets Deposts
ANNUALLY:
197519761977
MONTHLY:1977--NOV.
DEC.
1978--JAN.FEB.MAR.
APR.MAYJUNE
JULYAUG.SEPT.
OCT.NOV.P
WEEKLY:
1978-0CT. 111825
NOV. 181522P29P
DEC. 6P
1 2 3 4 5 6 7 8 9 10 11 12
221.5232.8249.9
248.5249.9
252.2251.7252.3
257.3258.5259.9
260.9262.8265.7
266.1263.8
268.5268.3263.0
264.6265.9264.8262.4261.7
263.5
450.9489.7545.0
540.1545.0
550.6556.7561.7
565.2571.6574.5
579.4583.0589.7
593.6
605.3
591.5592.0595.3
598.9602.6604.9607.0606.9
607.5
369.6427.0471.0
469.2471.0
474.3477.3479.7
481.8484.5487.8
492.0496.7501.6
505.4509.9
505.1505.0506.3
507.1508.6509.5510.7510.5
511.5
160.5201.9219.6
219.4219.6
220.7220.9221.0
221.6222.0221.7
220.9222.4224.2
223.9221.9
224.5224.0223.7
222.9222.9222.4221.5221.1
220.9
209.1225.1251.5
249.7251.5
253.6256.4258.7
260.262.6266.1
271.1274.3277.4
281.5288.1
280.7281.0282.6
284.2285.7287.1289.2289.5
290.6
81.362.774.0
70.974.0
76.379.432.0
83.487.186.7
87.486.388.1
88.295.4
86.487.089.0
91.894.095.496.396.4
96.1
394.9456.9519.8
515.7519.8
523.2525.9528.8
531.7534.7538.5
543.5550.0557.1
564.0569.1
33.039.146.8
46.146.8
47.548.148.9
49.550.050.7
51.251.752.6
52.953.1
67.271.976.6
76.276.6
77.077.477.8
78.278.678.9
79.379.579.8
80.180.3
66.366.577.6
77.177.6
79.580.179.8
80.781.681.7
80.179.6
82.4
81.281.5
73.780.788.6
87.788.6
89.490.190.7
91.292.192.8
93.394.095.2
96.096.8
95.796.095.8
96.596.496.696.997.0
97.2
43.347.856.3
54.056.3
50.761.464.1
66.468.370.4
71.471.672.0
72.472.9
13 14
34.451.062.0
60.162.0
64.965.565.4
65.766.266.4
66.768.869.8
74.9
73.2
71.674.376.6
79.873.468.272.276.3
9.512.613.0
8.013.0
10.88.59.1
9.68.2
12.9
15.516.117.4
21.221.7
21.424.122.0
19.622.120.423.123.5
17.0
I / ESTIMAE MU NHLY AVERAGE LEVELS DE RIVED BY AVERAGING END OF CURRENT MONTH AND END OF PREVIDUS MONTH REPORTED DATA.2/ INCLUDES PRIVATE DOMESTIC NONFINANCIAL INVESTORS' HOLDINGS OF COMMERCIAL PAPER, BANKERS ACCEPTANCES, SFCUR17Y RP6S AND
MONEY MARKET MUTUAL FUND SHARES.3/ BORROWINGS BY BANKS FROM OTHER THAN COMMERCIAL BANKS IN THE FORM OF FEDERAL FUNDS PURCHASED, SECURITIES SOLD UNDER
AGREEMENTS TO REPURCHASE, AND OTHFR LIABILITIES FOR BORROWED MONEY, PLUS GROSS LIABILITIES TO OWN FOREIGN BRANCHES(EURODOLLAR BORROWINGS), LOANS SOLD TO AFFILIATES, LOAN RPS, ANO OTHER MINOR ITEMS.
4/ INCLUDES TREASURY DEMAND DEPOSITS AT COMMERCIAL BANKS AND FEDERAL RESERVE BANKS AND TREASURY NOTE BALANCES.P - PRELIMINARY