Fomc 19780117 Material
36
E.M. Truman FOMC Briefing 1/17/78 As a prelude to Mr. Pardee's report on recent exchange market developments, I would like to offer a brief report covering a longer time period. Since the end of 1976 the trade-weighted average of the dollar against the G-10 currencies has declined by over 7 per cent; virtually all of this decline has occurred since the end of last September when substantial concern about our trade deficit intensified. Since December 1976, the Swiss franc and the yen have appreciated by over 20 per cent against the dollar; the pound sterling, the German mark, the Belgian franc and the guilder have appreciated 10 to 15 per cent; and the French franc rose about 6 per cent. Over the same period, the Canadian dollar and Swedish krona have depreciated against the dollar by 7 and 11 per cent, respectively. These substantial exchange-rate changes have been accompanied by almost $36 billion in net purchases of dollars by the major foreign central banks since the end of 1976, almost twice the size of our current-account deficit last year. The Bank of England purchased of the $27 billion in net dollar purchases in the first 10 months of last year. Since the end of October, have accounted for almost all of the $9 billion in net dollar purchases. How much lower the dollar would be today if it had not received such massive official support we do not know.
-
Upload
fraser-federal-reserve-archive -
Category
Documents
-
view
223 -
download
0
Transcript of Fomc 19780117 Material

E.M. TrumanFOMC Briefing1/17/78
As a prelude to Mr. Pardee's report on recent exchange
market developments, I would like to offer a brief report covering
a longer time period.
Since the end of 1976 the trade-weighted average of the
dollar against the G-10 currencies has declined by over 7 per cent;
virtually all of this decline has occurred since the end of last
September when substantial concern about our trade deficit intensified.
Since December 1976, the Swiss franc and the yen have appreciated by
over 20 per cent against the dollar; the pound sterling, the German
mark, the Belgian franc and the guilder have appreciated 10 to 15
per cent; and the French franc rose about 6 per cent. Over the same
period, the Canadian dollar and Swedish krona have depreciated against
the dollar by 7 and 11 per cent, respectively.
These substantial exchange-rate changes have been accompanied
by almost $36 billion in net purchases of dollars by the major foreign
central banks since the end of 1976, almost twice the size of our
current-account deficit last year. The Bank of England purchased
of the $27 billion in net dollar purchases in the first 10
months of last year. Since the end of October,
have accounted for almost all of the $9 billion in net
dollar purchases. How much lower the dollar would be today if it had
not received such massive official support we do not know.

We have estimated that since the end of 1976 the price-
adjusted depreciation of the dollar has been 7-1/2 to 10 per cent;
that is, the nominal depreciation of the dollar plus our slightly
better than average inflation performance have improved our price
competitiveness by 7-1/2 to 10 per cent. These calculations suggest
to some observers that the dollar is currently undervalued and will
recover. On the other hand, the staff expects a continuation over
the next six quarters of a U.S. trade deficit of around $30 billion
and a current-account deficit of close to $20 billion. These pro-
jections suggest to some that downard pressure on the dollar will
continue.
Notes for FOMC Meeting January 17, 1978 Scott E. Pardee
Mr. Chairman:
The current phase of our intervention operation dates back to late September.
Between late September and the last FOMC meeting, the dollar had declined by 8 percent
against the mark, and our swap debt in marks had swelled to $630 million equivalent.
From the December 20 FOMC meeting through January 2, the dollar declined by
a further 4 percent against the mark, and we had increased our mark indebtedness by a
further $214 million. If anything, trading conditions were more disorderly than before.
The market was simply ignoring anything positive and reacting only to news or rumors
that reinforced its concerns toward the dollar.
Our inability to restore order rested on three problems. First, although most
market participants and government officials here and abroad believed the dollar to be
unrealistically low, many market participants feared that the dollar would eventually go
lower in view of the continuing large U.S. trade deficit. This prognosis was, and is, open
to debate but it was so widely held that the dollar had little resiliency when it came on
offer.
Secondly, following the earlier efforts by the U.S. Treasury to encourage an
appreciation of the yen and the mark, Administration officials had little credibility when
they shifted ground and said they were really in favor of a strong dollar. In the absence
of concrete measures to bolster these statements as through an energy policy, market
skepticism had progressively deepened. Indeed, the statements themselves often
backfired because they carried the wrong code words. In efforts to explain policy, U.S.
officials had fallen into the habit of saying that we were intervening only to counter
disorderly conditions. To floating rate purists the only is a badge of honor suggesting a
clean float. To the dealer in the market, seeing the dollar drop in disorderly trading every
day, the only became pejorative. It reinforces the belief that the U.S. authorities were
engaging in benign neglect--or worse, the new term malign neglect, a euphemism for
competitive devaluation. The debate over U.S. intentions further eroded the dollar’s
resiliency.
Thirdly, in the confused and highly speculative atmosphere which developed, our
usual covert techniques became of limited effectiveness. The desk’s continuation of
these techniques in the face of increasing market disorder was taken as further evidence
of a lack of resolve by the U.S. authorities.
Under the more active intervention approach adopted on January 4, in which the
Federal Reserve and the Treasury shared jointly, the Desk’s objective has been to
reestablish a sense of two-way risk to the market. On several occasions, we operated
forcibly to encourage a rise of dollar rates. This was not done with a rate objective in
mind. Rather the effort was to demonstrate to market professionals, and to the world at
large, that dollar rates can move up as well as down--that selling dollars short is not as
sure a bet as it was.
Our shift of tactics has been broadly welcomed by the international financial
community, not to mention central bankers. Nevertheless, many people in and out of
government question what we are doing. Some want us to do more and express
disappointment that we aren’t being forceful enough. Others want us to do less and
express disappointment that we have engaged in what they consider an exercise in

futility. The daily press and the wire services which feed into trading rooms featured
these critical comments, giving heart to the bears on the dollar and scaring the very few
bulls who may be around. Nevertheless, we are more interested in regaining the respect
of the market than of entering into a last ditch battle with the bears.
To indicate our intentions, we reverted to a technique used sparingly before, that
of making a two-way price--placing a simultaneous bid and offer for marks--when we
approach banks either directly or in the brokers’ market. By this approach we not only
work toward re-establishing two-way trading in the market at times when bid-asked
spreads are unusually wide but we have occasionally bought marks which served as
additional ammunition later on. We have no intention of making a market permanently;
it is not the central bank’s function. But during this period of extreme uncertainty,
thoughtful people in the market are pleased to see that someone is making an effort to
reduce exchange rate volatility and make the market function more efficiently.
So far, the dollar has recovered by a net 4 percent and on recent days trading
conditions have settled significantly. The Federal Reserve’s debt in marks has risen by a
further $381 million, which corresponds to the amount done by the Treasury. As the
operations mounted during the period, our total debt in marks amounts to $1.225 billion,
a record. The Desk requested and received FOMC authorization to increase the limit on
the overall open position from $1 billion to $1.5 billion. We also received approvals as
needed both by the full Committee and by the Subcommittee on exceeding intermeeting
limits specified in the procedural instructions. Again, I would defer changes in those
instructions until the experience has been carefully reviewed by the staff and the
Subcommittee as decided last month. I might note that we have some $275 million

leeway left under the $1.5 billion net open position authorized by the Committee. I
would hope we could keep within that limit.
Recommendation
Between now and shortly after the next FOMC meeting, some four swap
drawings on the Bundesbank, in the amount of $123 million equivalent of marks, are up
for renewal. These are first renewals and need only be noted to the Committee.
James L. KichlineJanuary 17, 1978
Introduction -- FOMC Chart Show
The staff's forecast of likely economic and financial develop-
ments prepared for this meeting of the Committee has been updated for
1978 and extended to include the first half of 1979. As part of the
forecasting exercise we altered several of the underlying monetary and
fiscal assumptions. The monetary assumptions were changed to correspond
with usual practice while the fiscal assumptions were changed mainly to
incorporate a tax package expected to be announced later this month by
the Administration.
The principal policy assumptions are displayed in the first
chart of the materials distributed this morning. For monetary policy,
we have assumed growth of M1 at a 5-1/4 per cent annual rate, the mid-
point of the existing longer-run range, but have shifted forward the
base level to QIV/1977. We have also assumed growth of M 2 will average
8-1/4 per cent at an annual rate over the forecasting horizon. These
assumptions are consistent with longer-run Alternative B in the Bluebook
which includes an increase of 1/2 percentage point in deposit ceiling
rates during the first half of this year. On the fiscal side we have
included a $25 billion tax cut--2/3 going to individuals and 1/3 to
businesses--mainly effective in October, the beginning of the next fiscal
year. Unified budget outlays of $457 billion in fiscal year 1978 remain
unchanged in our forecast and are about $3 billion less than Administra-
tion estimates. Outlays in fiscal year 1979 are assumed to be in the
neighborhood of $500 billion. Delay in achieving passage of an energy

-2-
program has led us to postpone implementation of a wellhead tax from
early this year to mid-1978.
Mr. Zeisel will now review recent and prospective economic
developments.
CONFIDENTIAL (FR) CLASS II-FOMC
Material for
Staff Presentation to the
Federal Open Market Committee
January 17, 1978

PRINCIPAL ASSUMPTIONS
MONETARY POLICY
* Growth of M1 averaging 5¼% annual rate
from QIV 1977 base
* Growth of M2 averaging 8 % annual rate
from QIV 1977 base
FISCAL POLICY
* Tax cut of $25 billion in FY 1979
* Unified budget expenditures of $457 billion
in FY 1978 and $500 billion in FY 1979
ENERGY PROGRAM
* Wellhead tax of $3.50 per barrel on
domestically produced "old" oil beginning
mid-1978

RETAIL SALESLess Autos and Nonconsumer Items Billions of dollars
S-46
-- 44
--42
--40
1976 1977
TOTAL AUTO SALES Annual rate, millions
1976 1977

EMPLOYMENT
1975 1976
PERSONAL INCOME
-771975
H1 H2
1976
Millions
92
-88
84
1977Change from previous period,
annual rate, per cent
15
I-
- 5
i iIQ1 Q2 Q3 Q4
1977
SAVING RATE Per cent
8
6
4
1975 1976 1977

MANUFACTURERS' INVENTORIESChange in Book Value Annual rate, billions
1976 1977
INDUSTRIAL PRODUCTIONChange from previous month,
annual rate, per cent
15
5
+0
5
1976 1977
RATIO: MFG. INVENTORIES TO SALES
-- 1.5
1976
Ratio
21.7
1977
HOMES SOLDNew and Existing
Millions of units
OUTSTANDING MORTGAGECOMMITMENTS ATSAVINGS AND LOANS
Billions of dollars
1- 30
- 25
- 20
'73 '75 '77 '79 '73 '75 '77 '79
HOUSING STARTSMillions of units
RESIDENTIAL MORTGAGESBillions of dollars
--- - 100
- 60

REAL NEW ORDERS
Nondefense Capital Goods
1974 1975 1976 1977
ISTRUCTION CONTRACTS Millions of sc
<A Commerical and Industrial Structures
1975 1976
Billions of 1972 dollars
1974 1977

IMPACT OF SCHEDULED ANDASSUMED TAX CHANGES*
Calendar years, billions of dollars
1978 1979
TOTAL TAX INCREASES $16.1 $ 31.1
Mandated Increases
Social Security Taxes 5.3 11.7
Unemployment Insurance 2.8 2.9
Revenue Drag 1 8.0 16.5
TOTAL TAX REDUCTIONS $ 6.0 $ 25.0
Assumed ChangesPersonal Income 4.0 16.0
Corporate (Net) 2.0 7.0
Unemployment and Excise 2.0
NET ADDITIONAL TAX $10.1 $ 6.1
* Relative to 1977 base
1/Impact of inflation and progressivity on tax receipts
GROWTH RATE REAL GNP1972 Dollars Change from previous quarter, annual rates, per cent
-8
-6
With Tax Cut - 4
WithoutTan r.t -2
1978 1979

O CIVILIAN LABOR FORCE* EMPLOYMENT
Change from previous period,annual rate, millions
-4
II F I -2I I I I 2+0
H1 H2 H1 H2 H11975 1976 1977 1978 1979
UNEMPLOYMENT RATE
r
197 197 197 198 17
Per cent1
4 s
1976 1977 1978 19791975

FUNDS RAISED BY NONFINANCIALSECTORS
1971 1973 1975 1977 1979
FUNDS RAISED BY NONFINANCIALSECTORS RELATIVE TO GNP
1973 1975 1977
cent
18
14
10
1971 1979
GNP AND M1 GROWTH RATESChange from previous quarter, annual rate,
1975 1977 1979
SECURITY PURCHASES
1975
Billi
1977
INTEREST RATES
Aaa UtilityNew Issue
ons of dollars
-50
-25
1979
Per cent
- 10
3-Month Treasury Bills
19751977 1979
1975 1977 1979

TREASURY YIELD CURVES ANDDEPOSIT RATE CEILINGS
3 4Years to Maturity
NONBANK SAVINGS ACCOUNTSChange from previous period,
annual rate, percent
- 15
5
1974 1976 1978 197919761974 1978 1979

NONFINANCIAL CORPORATIONS
Capital Expenditures
1975 1977 1979
FUNDS RAISED
Long-term /
Short-term
SI I I I
200
160
120
Billions of dollars
1979
Billions
I
1973 1975 19771971
STOCK PRICESDecember 31, 1965=50
Dow-Jones Industrials30-Stock Average
PRICE / EARNINGS RATIO
- 20
S & P 500
- 15
Joseph S. Zeisel
FOMC BRIEFING
January 17, 1978
The economy ended the year on a distinctly upbeat note.
Growth of real final sales in the last quarter was apparently the
strongest for any quarter in 1977. Housing outlays picked up vigorously,
but the major source of increased buoyancy has been retail sales--
portrayed in the top panel of the next chart. Despite a slight dip
in December, retail sales excluding autos and nonconsumption items
rose in the fourth quarter at the most rapid quarterly pace in over
a decade.
Unit auto sales however--the bottom panel--have not shown
the strength in recent months exihibited by overall consumer demand.
Although sales picked up in December, the pace remains below that
of early in the year and the industry has cut back on its production
schedules somewhat. But basic underlying demographic and other
determinants of demand continue to be favorable and the most recent
slowing may reflect the tendency for auto sales to suffer somewhat
when other retail sales are extremely strong.
The next chart pinpoints a major source of the recent
strength in consumer demand--the substantial growth of employment,
which rose by over a million in the fourth quarter. Gains in payroll
employment have been more modest but still very substantial. And,
as indicated in the middle panel, there has been a comparably vigorous
rise in personal income. Thus--as the bottom panel shows--in contrast
to last winter, the strength of consumer demand recently has not been
at the expense of a sharp decline in the savings rate.
- 2 -
But the surge of consumer buying along with the increased
strength in homebuilding recently, apparently caught producers
by surprise. And, as is evident in the top panel of the next chart,
inventory accumulation in manufacturing was at a sharply reduced rate
in the past few months. As the second panel shows, gains in production have
been modest recently, in response to the slower pace of demand that
had prevailed through the summer. It is this combination of increased
sales and reduced production which cut the rate of inventory accumulation
sharply. Thus, despite strong final demands,
real GNP growth in the last quarter probably was held to about ̂a 4 to 4-1/2^
per cent annual rate, somewhat less than we were estimating last month.
It is clear, however, that the ground has been laid for a
substantial improvement in industrial activity over the next few months.
Inventories are now quite lean relative to sales, as is evident in the
bottom panel, and businessmen are bound to adjust production schedules
upward, if only to keep stocks in line with ^increased^ sales levels. This
should contribute to the resumption of a more rapid rate of GNP growth
in the first half.
But it also seems likely that once the impetus from this
inventory adjustment fades, in the absence of a tax reduction ̂package,^ under-
lying forces in the economy would tend to slow the pace of overall
growth. Among these forces are first, a likely reduction in the
contribution of residential construction during this coming year.
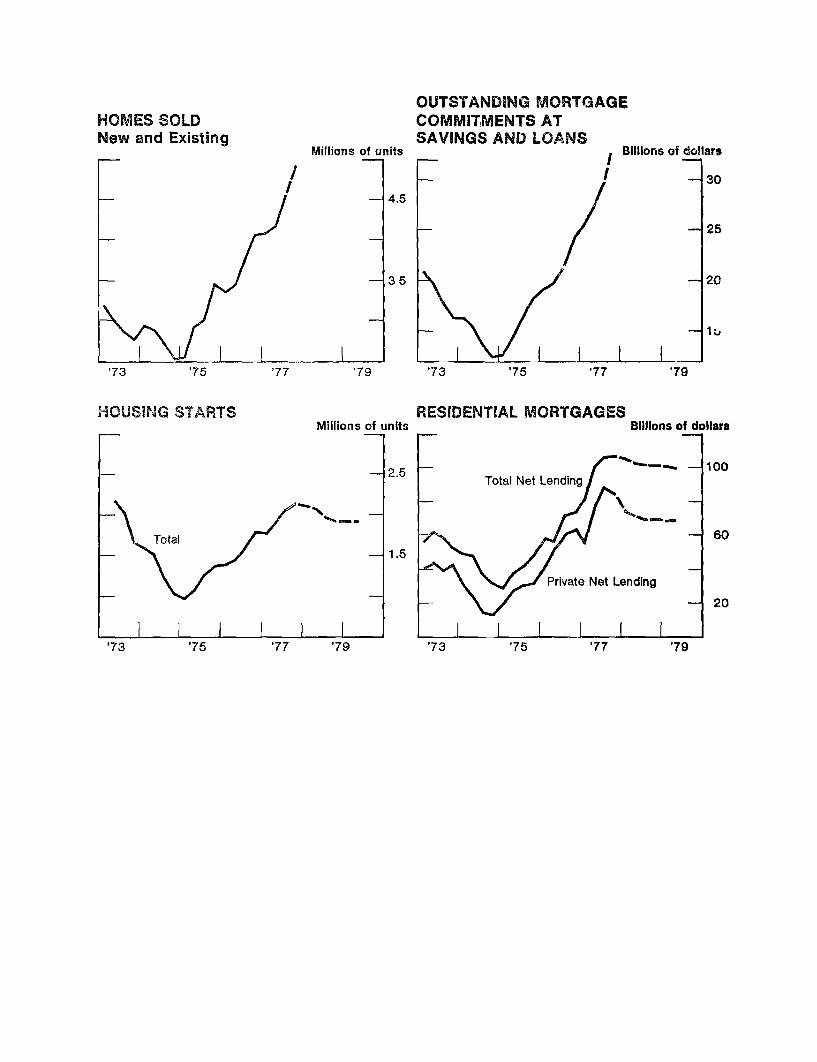
Demand for housing remains strong, as is clearly evident in the top
panels of the next chart, which show total home sales and outstanding
mortgage commitments. But we expect that starts ^ w i l l ^soon begin to decline

- 3 -
in response to tighter mortgage market conditions, reflecting recent
reductions in the flow of funds to thrift institutions. However, as noted,
we have assumed that Regulation Q ceilings will be raised in the spring,
and as is suggested in the last panel, we anticipate that government
support programs will partly offset declines in private mortgage lending,
thereby ̂helping to^ avoid any precipitous decline in construction activity.
Another source of potential drag later this year could be the
performance of business fixed investment, which has remained a disappoint-
ment throughout this recovery. As is evident on the next chart, indicators
of the near-term outlook for capital spending ̂ ,^ such as new equipment
orders and construction contracts ̂,^ have continued to rise on average
But they have not shown the degree of expansion necessary to ensure
a sustained rapid growth of capital spending. In fact, the rate of
growth of orders has slowed recently. Moreover, the latest Commerce survey
of capital spending plans showed an increase of only 10 per cent for
1978, as compared to the nearly 14 per cent realized in 1977, which suggests
a reduced contribution of investment spending to overall growth as the
year progresses.
Finally, and particularly important, is the burden on the economy--
as detailed in the next table ̂ --^ of already mandated new taxes for social
security and unemployment insurance, as well as the continuing revenue
drag resulting from the interaction of inflation and a progressive income
tax structure. Together, these various factors involve a drain on the
income stream of about $16 billion between 1977 and 1978. There is an
impact of about the same magnitude in 1979.

-4-
As indicated in the lower section of the table, these fiscal
restraints would by 1979 be offset in substantial measure by the $25
billion tax cut which the Administration reportedly will present to
Congress, and which we have incorporated as an assumption in our
projection.
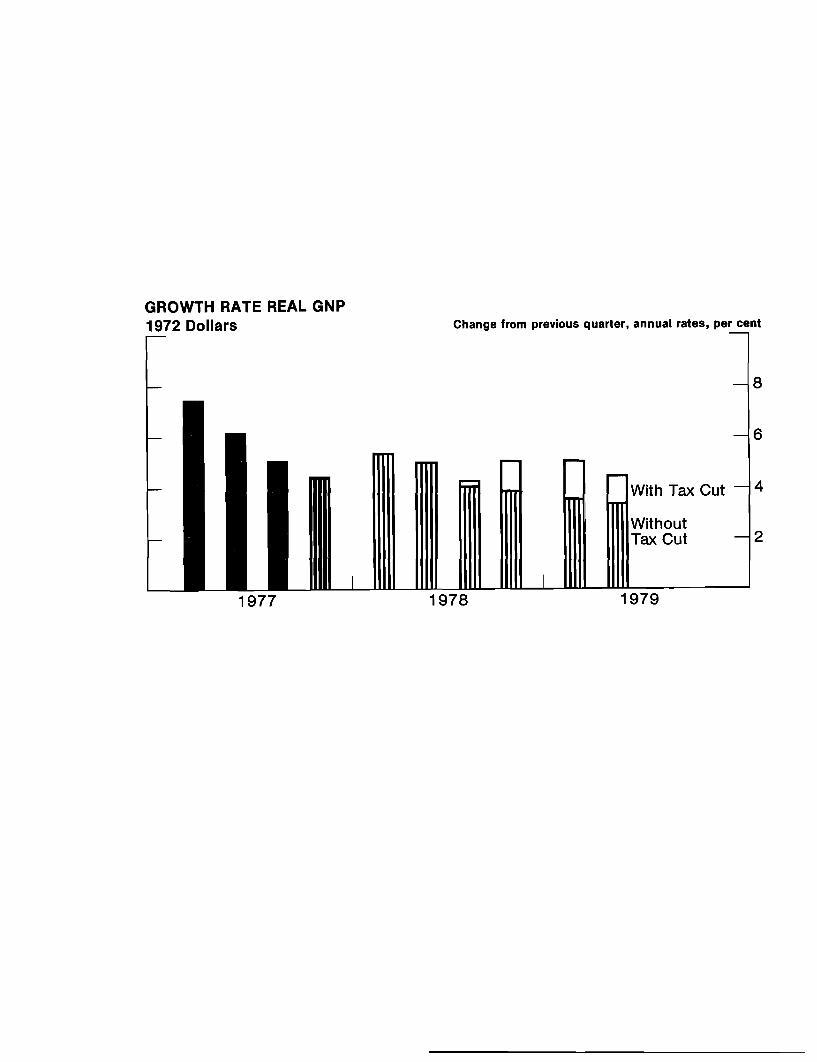
Without the proposed tax cut, we have projected that the rate
of growth of real GNP would moderate throughout 1978--as indicated in
the next chart--and average under a 4 per cent rate in the first half
of 1979. However, with the tax cut, the staff now projects a rate
of growth averaging about ^4-3/4^ per cent for the next six quarters.
Following the surge in activity expected early this year in association
with inventory building, growth is expected to moderate somewhat until
late in the year when consumers initially respond to the reduction in
personal taxes. Investment spending is expected to react modestly
somewhat earlier, to the liberalized investment tax credit, assumed
to be retroactive to January 1st. By the first half of 1979, real
GNP growth is projected to be
over 1 per cent greater than in the absence of the tax cut.
The stronger activity projected under these assumptions
should stimulate employment gains--the final chart. But even with
a more moderate increase in the civilian labor force than we have
recently experienced, the projected rate of real GNP growth of under
5 per cent is likely to have only a limited impact on unemployment.
We now anticipate that the rate may drop to about 6 per cent by mid-1979
from last month's 6-1/2 per cent level.
Mr. Kichline will complete the presentation.

James L. KichlineJanuary 17, 1978
FOMC BRIEFING
The financial counterpart of our GNP projection is contained
in the flow-of-funds forecast. The top panel of the first chart in the
financial presentation shows the volume of funds raised by nonfinancial
sectors. We expect most sectors to reduce their borrowing pace in the
first half of this year compared to the record rates experienced in the
second half of last year. Borrowing later this year and into 1979 is
expected to rise somewhat reflecting the continued large requirements of
the Federal Government and a pick up in business credit demands. But in
the aggregate, total funds raised will likely decline relative to GNP,
the bottom panel of the chart. Such a development is often associated
with tightening credit markets and we believe that will be in store dur-
ing the forecast period.
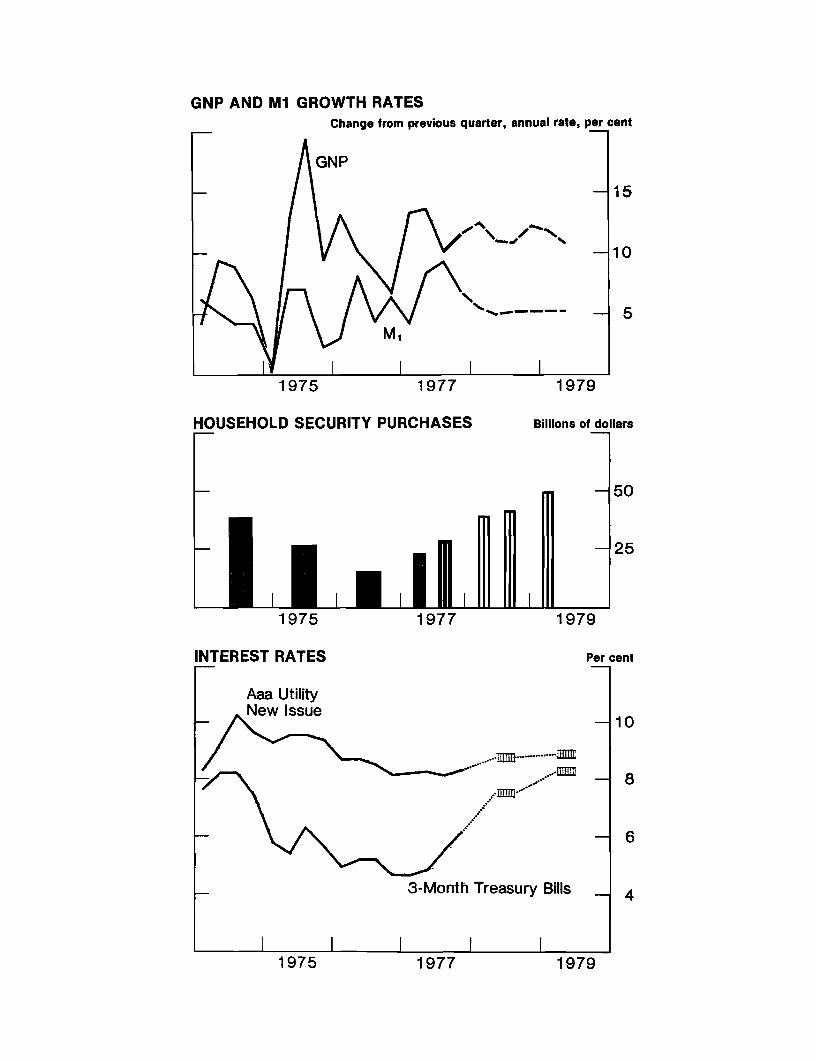
The top panel of the next chart indicates that nominal GNP is
expected to expand quite rapidly relative to the assumed 5-1/4 per
cent growth of M1. To hold down M1 expansion will likely require
appreciable further increases in the Federal funds rate, as discussed
in the Bluebook, and will be associated with a large rise in velocity
over the forecast period. The process of inducing economies in the
holding of M1 balances will encourage purchases of securities by house-
holds, another way of looking at tightening financial markets. Interest
rates on Treasury bills are expected to rise to around 7-1/2 per cent
by mid-year and to move a little above 8 per cent in 1979. Bond rates are
also expected to rise but comparatively little, reflecting the still wide

-2-
yield differentials and continuing strong demands for bonds on the part
of institutional investors.
Higher market interest rates will take their toll on deposit
flows to banks and thrift institutions. In the next chart, the top
panel indicates that effective rate ceilings on savings and time deposits
at banks and S&L's were above yields available on Treasury securities
in all maturity ranges as of July 1, 1977. By early this year, however,
only the longer-term deposits at S&L's were marginally attractive.
Recent evidence indicates interest bearing deposit flows at
banks and thrift institutions have decelerated and we anticipate continued
moderation. The growth of deposits at nonbank institutions projected
in the bottom panel allows for an increase in time deposit interest
rate ceilings of 1/2 percentage point during the first half of this
year. With slower deposit inflows, of course, depositary institutions
will need to rely on other sources of funds, including borrowings, run-
down liquid assets, and tighten lending terms and conditions. These
developments are likely to impact importantly on the mortgage market.
The nonfinancial corporate sector remains a key element in
both the economic and financial outlook. The top panel of the next
chart indicates that the forecast incorporates substantial growth in
nominal capital expenditures (including inventory investment) by non-
financial corporations. Internal funds are also expected to be rising
considerably--partly because of corporate tax reductions. The resulting
external financing gap (the difference between the two lines) thus
remains manageable; the gap is projected below that in 1974 and
corporations now are in much better financial shape than at that time.

-3-
We expect that corporations will rely quite heavily on long-term
sources of funds--the bottom panel--given the expected availability
and cost of funds in the bond market as well as their desires to
limit erosion of liquidity positions.
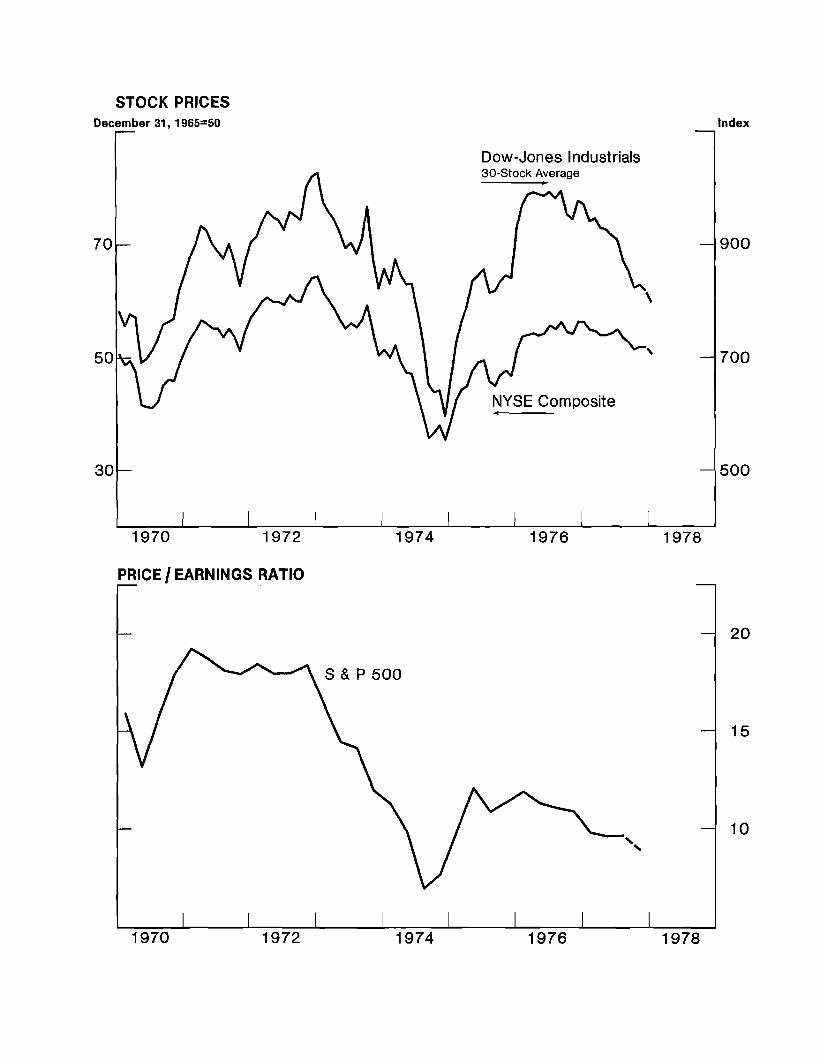
Our projection, however, incorporates a sharp decline in
equity issues in 1978 and 1979 reflecting the disappointing performance
of equity prices--the next chart. The decline of the Dow Jones Indus-
trial Index has been especially large and highly visible during the past
few weeks. Moreover, the Dow Jones Index performed poorly throughout
1977 and the more broadly based NYSE index has also been trending lower
although it has held up better than the Dow Jones. In view of the
sizable gains in corporate profits in the past two years, the price
earnings ratio has moved lower and indicates the high cost of capital.
The performance of equity prices remains an element of concern in the
outlook in regard to business spending, potential adverse impacts on
consumer spending, and the general state of confidence.

F.O.M.C. MEETINGJANUARY 17, 1978
REPORT ON OPENMARKET OPERATIONS
Mr. Sternlight made the following statement:
Desk operations for about the first two thirds of the
period since the December meeting of the Committee were aimed at
achieving a Federal funds rate around 6 1/2 percent--the center of
the 6 1/4 - 6 3/4 percent range adopted in December. In the final
third of the interval, following the January 6 announcement of a
1/2 percent increase in the discount rate and the Committee's
adoption of a 6 1/2 - 7 percent funds range, both essentially because
of the weak dollar and disorderly conditions in the foreign exchange
market, the Desk pursued the Committee's related instruction to
raise the funds rate to around 6 3/4 percent over the next few days.
Behavior of the monetary aggregates, taken together, was
reasonably well within the Committee's ranges and provided no reason
to modify the Desk's approach. Estimates of M1 growth for the two
months ending in January gradually strengthened over the period,
ending the interval in the upper part of the range but still well
within it. On the other hand, M2 estimates tended lower over the
period, and most recently were well down in the indicated range.
Through the first half of the period, the funds rate ex-
ceeded the Desk's 6 1/2 percent objective, owing to reserve short-
ages in the holiday-shortened weeks, and particular pressures around
the year-end statement date. The Desk had some difficulty in supply-
ing needed reserves, even after getting good cooperation from the
Treasury in reducing their balances. Troubles in projecting reserve
availability compounded the problem. The market appeared to under-
stand these difficulties, however, and remained confident through
early January that the System's objective was still 6 1/2 percent
even after some days of trading closer to 6 3/4 and even 7 percent.
Very briefly, January 5 and 6, the funds rate did return to around
6 1/2 percent, but starting January 9 the Desk began to push the
rate higher, reaching about 6 3/4 percent by January 12. The
funds rate pushed higher yesterday--to about 6 7/8 - 7 percent--
despite strenuous Desk efforts to provide reserves, but came
down this morning. The market perceived the Desk's intent to raise
the rate beginning January 9, and this together with the higher
discount rate produced higher interest rates across a broad front.
While market participants initially were uncertain of the extent
of the Desk's firming move, with some expecting a quick move to 7
percent, the predominant view now is that the System is seeking a
rate around 6 3/4 percent. Still some uncertainty lingers, parti-
cularly as the market seeks to factor in the heightened official
concern over the international position of the dollar.
Early in the period, the Desk sought to fill enormous
reserve needs produced largely as a result of higher Treasury balances.
The System made outright purchases of $707 million of Federal agency
issues and net purchases of about $1 1/4 billion of bills in the
market, as well as some $200 million of bills from foreign accounts.
Substantial repurchase agreements were made in the market almost
every day from December 20 to January 5, with especially heavy
activity around the year-end days. Reserves were absorbed from
January 9 to 11 through matched sale-purchase transactions in the
market and outright sales of about $350 million bills to foreign
accounts. Most recently, the Desk provided reserves again, buying
nearly $700 million of bills in the market last Friday, and arranging

repurchase agreements yesterday. Each day, matched sale-purchase
transactions were arranged with foreign accounts.
Interest rates moved a little higher over the first
two thirds of the period and then jumped sharply on January 9
following the discount rate rise and the Desk's perceived move
towards a higher Federal funds rate. The moderate rise early in
the period reflected the market views that expanding credit demands
were likely to result in higher rates as the new year unfolded. In
the last few days, rates have come down a bit as the market gained
some confidence that the System was not pushing toward additional
firming in the money market. Treasury bills were auctioned yester-
day at about 6.54 and 6.76 percent for the 3- and 6-month issues,
up from 5.99 and 6.34 percent just before the last meeting, but
off from 6.68 and 6.85 percent on January 9.
For intermediate term Treasury issues, 1 - 5 years, yields
rose about 35 to 50 basis points for the period. The two-year
note to be auctioned tomorrow is expected to go around 7.55 - 7.60
percent, compared with 7.20 percent a month earlier. For longer
Treasury issues, yield increases were about 25 to 35 basis points.
While the yield moves caused dealer losses, these were not extreme
as inventories were moderate.
In the Treasury 2-year note auction tomorrow, $1 billion
of new money is to be raised. Another $2 billion or so may be raised
in coupon issues in the quarterly refunding to be announced a week
from tomorrow. Maturing issues in the hands of the public come to
$5 billion in that refunding. The System Account holds $2.6 billion
of those February 15 notes and we would plan as usual to roll these
over into new issues in about the proportions offered to the public.

FOMC Briefing January 17, 1978 Stephen Axilrod
Since the last Committee meeting, growth in M-1 has shown somewhat more
strength than projected, while growth in M-2 has displayed somewhat less. Partly in
consequence, the 2-month ranges presented for consideration at this meeting encompass
somewhat slower growth in M-2 relative to M-1 as compared with ranges adopted at the
previous meeting. For instance, alternative B specifies the same 2-1/2 to 8-1/2 percent
annual rate for M-1 adopted by the Committee at its last meeting, but for M-2 the staff
now expects growth to be in a 5 to 9 percent range--about a percentage point lower than
projected at the last meeting. Sizable shortfalls in the time and savings deposit
component of M-2 relative to earlier expectations, as well as recent upward market rate
adjustments, account for this change.
Interest rates on intermediate-term U.S. Government securities--which had risen
20 to 30 basis points during December--rose another 15 to 25 basis points following the
discount rate action and are now above effective ceiling rates on small-denomination
time deposits at banks in all maturity categories. Thus, flows of funds into deposits
subject to ceilings at banks and thrift institutions are likely to continue at a reduced
pace, and could come under further downward pressure depending in part on the
attractiveness to individuals of the terms set by the Treasury on new issues to be offered
in the sizeable refunding operation to be announced a week from Wednesday. The
ability of thrift institutions to attract funds through deposits has also become more
restricted.
While the potential diversion of funds from interest-bearing deposits to market
instruments further complicates the interpretation of M-2 and M-3 as over-all indicators

for monetary policy, reduced deposit inflows to thrift institutions do suggest developing
pressures on mortgage terms and on the considerable willingness (evident in the latest
data available through November) of institutions to commit funds to housing. Recent
mortgage rate increases have been most pronounced in the secondary market--where
yields have risen 25 to 35 basis points since the end of November--but primary market
rates have edged up in the past few weeks.
I would expect any upward pressures on the money stock that may develop in the
period ahead to continue to focus mainly on M-l, though there could be some spillover
effects on M-2. The recent upward adjustments in short-term rates following the rise in
the discount rate and the funds rate may exert only a relatively minor restraint in growth
in M-1. Short-term rates have increased 20-35 basis points on balance since the discount
rate action. I doubt that these rate increases will lead to very substantial adjustments in
banking lending or portfolio policies. Indeed, unless the commercial paper rate rises
further from its current level, bank loan rates to businesses are not likely to adjust upward
from the levels to which they had tended -- as indexed by the 8 percent prime loan rate --
just prior to the discount rate increase. Thus, there may not be strong additional restraint
on banks' willingness to supply credit and in the process create money as a result of
recent policy moves.
At the same time, the economy's need for demand deposits for transactions
purposes should be quite sizeable. Nominal GNP is projected to increase at about a 12-
1/2 percent annual rate in the first quarter, up about 1-1/4 percentage points from last
month's projection for the period. The associated transactions demands for money could
exert a strong pull on demand deposits at current market rates. If short-term rates do not

rise over the next few weeks as a result of efforts to restrain actual M-1 growth, the staff
would expect such rates to have to begin rising shortly thereafter.