
Fomc 19760622 Gb Sup 19760618
21
Prefatory Note The attached document represents the most complete and accurate version available based on original copies culled from the files of the FOMC Secretariat at the Board of Governors of the Federal Reserve System. This electronic document was created through a comprehensive digitization process which included identifying the best- preserved paper copies, scanning those copies, 1 and then making the scanned versions text-searchable. 2 Though a stringent quality assurance process was employed, some imperfections may remain. Please note that some material may have been redacted from this document if that material was received on a confidential basis. Redacted material is indicated by occasional gaps in the text or by gray boxes around non-text content. All redacted passages are exempt from disclosure under applicable provisions of the Freedom of Information Act. 1 In some cases, original copies needed to be photocopied before being scanned into electronic format. All scanned images were deskewed (to remove the effects of printer- and scanner-introduced tilting) and lightly cleaned (to remove dark spots caused by staple holes, hole punches, and other blemishes caused after initial printing). 2 A two-step process was used. An advanced optical character recognition computer program (OCR) first created electronic text from the document image. Where the OCR results were inconclusive, staff checked and corrected the text as necessary. Please note that the numbers and text in charts and tables were not reliably recognized by the OCR process and were not checked or corrected by staff. Content last modified 6/05/2009.
-
Upload
fraser-federal-reserve-archive -
Category
Documents
-
view
215 -
download
0
Transcript of Fomc 19760622 Gb Sup 19760618

Prefatory Note The attached document represents the most complete and accurate version available based on original copies culled from the files of the FOMC Secretariat at the Board of Governors of the Federal Reserve System. This electronic document was created through a comprehensive digitization process which included identifying the best-preserved paper copies, scanning those copies,1
and then making the scanned versions text-searchable.2
Though a stringent quality assurance process was employed, some imperfections may remain. Please note that some material may have been redacted from this document if that material was received on a confidential basis. Redacted material is indicated by occasional gaps in the text or by gray boxes around non-text content. All redacted passages are exempt from disclosure under applicable provisions of the Freedom of Information Act. 1 In some cases, original copies needed to be photocopied before being scanned into electronic format. All scanned images were deskewed (to remove the effects of printer- and scanner-introduced tilting) and lightly cleaned (to remove dark spots caused by staple holes, hole punches, and other blemishes caused after initial printing). 2 A two-step process was used. An advanced optical character recognition computer program (OCR) first created electronic text from the document image. Where the OCR results were inconclusive, staff checked and corrected the text as necessary. Please note that the numbers and text in charts and tables were not reliably recognized by the OCR process and were not checked or corrected by staff.
Content last modified 6/05/2009.

CONFIDENTIAL (FR)CLASS II - FOMC
June 18, 1976
SUPPLEMENT
CURRENT ECONOMIC AND FINANCIAL CONDITIONS
Prepared for theFederal Open Market Committee
By the StaffBoard of Governors
of the Federal Reserve System

TABLE OF CONTENTS
THE DOMESTIC NONFINANCIAL ECONOMY
Private housing starts.......................................Personal income ........... .................................Auto prices................ .................................
TABLES:
Private housing starts andresidential building permits................................
Personal income. ............ ............ ....................
THE DOMESTIC FINANCIAL ECONOMY
Mortgage market................... ..... .....................
TABLES:
Average rates and yields on new-homemortgages............... ..... ..... ...... ............ ......
Interest rates.... .............. ............................
THE INTERNATIONAL DEVELOPMENTS
U.S. international transactions.. ............................
TABLE:
U.S. international transactions................................
APPENDIX
Bank credit revision.......................................... A-1
Page

SUPPLEMENTAL NOTES
The Domestic Nonfinancial Economy
Private housing starts rose 2 per cent in May to a seasonally
adjusted annual rate of 1.42 million units. All of the increase was
accounted for by a rise in the rate of multi-family unit starts. Al-
though still quite low, the May rate for such units--358,000--was the
highest in nearly 2 years. The pace of single-family starts declined
slightly further.
Residential building permits increased 6 per cent in May.
Permits for both single-family and multi-family units were higher than
a month earlier.
PRIVATE HOUSING STARTS ANDRESIDENTIAL BUILDING PERMITS
(Seasonally adjusted annual rates, in millions of units)
Per cent change inMay from:
Month1975976Month YearQIV I0 (r) Mar.(r) Apr.(r) May (p) ago ago
STARTS 1.37 1.40 1.42 1.38 1.42 + 2 +30
1 - family 1.03 1.12 1.11 1.06 1.06 - 1 +242 - or more - family .33 .28 .31 .32 .36 +13 +54
PERMITS 1.06 1.13 1.13 1.10 1.16 + 6 +27
1 - family .77 .84 .83 .81 .82 + 1 +252 - or more - family .29 .29 .31 .28 .34 +20 +33

- 2 -
Personal income rose 10.3 per cent (compound annual rate)
from April to May--the same rate as over the January to April period.
Wage and salary disbursements grew somewhat faster in May--at a 10.8
compound annual rate compared to 8.8 over the previous three months.
Growth in manufacturing payrolls slowed in May, reflecting a decline
in the nondurable sector associated with the rubber strike.
PERSONAL INCOME(Billions of dollars, seasonally adjusted at an annual rate)
Total Personal Income
Wage & Salary DisbursementsGovernmentPrivate
ManufacturingOther
Transfer Payments
Other Income
May1976
1,357.2
871.5185.3686.2234.2452.0
188.6
351.4
Per Cent Change(compound annual rate)
May 75- Jan. 76- Apr. 76-May 76 Apr. 76 May 76
11.5 10.3 10.3
10.7 8.8 10.87.4 5.2 7.4
11.6 9.9 11.713.9 10.6 8.010.5 9.5 13.7
11.4 10.1 -3.7
13.5 13.4 16.7
Auto prices. Two major auto manufacturers (GM and Chrysler)
have given indications, in the form of price protection notification
to dealers taking orders from fleet buyers, that the increase on 1977
model cars and trucks may be as high as 6 per cent, about $300 on the

- 3 -
average for cars. Ford, which followed GM last year, has so far
announced similar pricing plans only for heavy-duty trucks and options,
also 6 per cent averaging about $750 and $160, respectively, per
vehicle.
It has been customary to give such "price protection"
guarantees by early summer to permit dealers to take firm advance
orders from fleet buyers without fear of loss from larger manufacturers'
price rises than anticipated. Last year's figure was also 6 per cent
on cars; the actual increase varied widely among models but averaged
lower.
Observers differ on the likelihood of a 6 per cent increase.
Expectations of a lower advance are predicated on a relatively moderate
wage settlement; the "mix" of auto sales should be more favorable to
profit margins than last year and caution about consumer confidence
could limit the advance. However, other analysts point to increases
in materials prices and improved demand. In any case, increases are
expected to be higher on intermediate models, currently in strong demand.
A 6 per cent price increase on all cars and trucks would
contribute about 0.3 percentage points to the total level of the WPI.
The effect is usually concentrated in October. New cars have a lower
weight in the CPI--about 2 per cent--and the increase is usually spread
over several months, varying with the rate of introduction of new models
and with changes in dealers' discounts. Both the WPI and CPI also
reflect the BLS adjustment for quality which may be significant this
year.

-4-
The Domestic Financial Economy
Mortgage market. According to the HUD (FHA) opinion survey,
average interest rates on new commitments for conventional new- and
existing-home mortgages rose by 10 basis points during May to 9.00 per
cent and 9.05 per cent, respectively. Yields on FHA-insured new-home
mortgages for immediate delivery in the private secondary market
increased by 21 basis points to 9.03 per cent--implying discounts
over 4 points on 8-1/2 per cent FHA mortgages at the end of May. These
rate movements are generally consistent with the primary and secondary
mortgage market series reported in the Greenbook.
AVERAGE RATES AND YIELDS ON NEW-HOME MORTGAGES(HUD-FHA Field Office Opinion Survey)
Primary market Secondary market 1/End Conventional loans FHA-insured loansof Level 2/ Spread 4/ Level 3/ Spread 4/ Discounts
Month (per cent) (basis points) (per cent) (basis points) (points)
1975-Low 8.90 (Mar.) -70 (Mar.) 8.69 (Mar.) -91 (Mar.) 2.4 (Dec.)High 9.25 (Sept., +15 (Jan.) 9.74 (Sept.) +31 (Oct.) 6.2 (Aug.)
Oct.)1976-Jan. 9.05 +39 9.06 +40 2.4
Feb. 9.00 +42 9.04 446 2.2Mar. 8.95 +42 n.a. n.a. n.a.Apr. 8.90 +32 8.82 +24 2.5May. 9.00 + 5 9.03 + 8 4.1
1/ Any gaps in data are due to periods of adjustment to changes in maximumpermissible contract rates on FHA-insured loans.
2/ Average contract rates (excluding fees on points) on commitments for con-ventional first mortgage loans, rounded to the nearest 5 basis points.
3/ Average gross yield (before deducting servicing costs) to investors on30-year minimum-downpayment FHA-insured first mortgages for immediatedelivery in the private secondary market (excluding FNMA), assumingprepayment in 15 years.
4/ Average gross mortgage rate or yield minus average yield on new issuesof Aaa utility bonds in the last week of the month.

INTEREST RATES(One day quotes - in per cent)
1976Highs Lows May 17 June 17
Short-Term Rates
Federal funds (wkly. avg.)
3-monthTreasury bills (bid)Comm. paper (90-119 day)Bankers' acceptancesEuro-dollarsCD's (NYC) 90 day
Most often quoted new
6-monthTreasury bills (bid)Comm. paper (4-6 mo.)Federal agenciesCD's (NYC) 180 dayMost often quoted new
1-yearTreasury bills (bid)Federal agenciesCD's (NYC)
Most often quoted newPrime municipals
Intermediate and Long-Term
Treasury coupon issues5-years
20-years
CorporateSeasoned Aaa
Baa
New Issue Aaa Utility
MunicipalBond Buyer Index
Mortgage--average yieldin FNMA auction
5.54( 6/2)
5.57( 6/2)6.00(6/15)5.95( 6/2)6.81( 6/1)
5.75(6/16)
5.96(5/27)6.00(6/17)6.42(5/27)
6.50( 6/2)
6.39(5/27)6.86(5/28)
6.75(6/16)3.70(5/28)
7.82(5/27)8.20(5/21)
8.66(1/2)10.34(1/2)
8.95(5/28)
7.13( 1/8)
4.70(2/18)
4.68(1/29)5.00(4/29)4.80(4/21)5.25(1/30)
4.88(4/21)
4.97(1/29)5.13(4/29)5.31( 2/2)
5.38(4/21)
5.27( 1/2)5.82(4/14)
6.00(4/28)3.00(1/30)
7.12(4/21)7.77(4/14)
8.34(4/15)9.70(6/16)
8.38(4/22)
6.54(4/15)
5.28(5/19)
5.225.385.556.00
5.50(5/19)
5.695.506.11
6.00(5/19)
6.026.64
6.38(5/19)3.55(5/14)
7.638.18
8.619.75
8.82(5/21)
6.91(5/21)
5.47(6/16)
5.385.885.756.25
5.75(6/16)
5.756.006 . 2 7p(6/15)
6.25(6/16)
6.096. 5 9p( 6 /15)
6.75(6/16)3.45(6/18)
7.608.02
8.62(6/16)9.70(6/16)
8.6 9 p(6/18)
6.85(6/18)
9.20( 6/1) 8.83(4/19) 9.13 9.14(6/14)
- 6-
The International Developments
U.S. International Transactions. Complete first quarter
accounts for U.S. international transactions were presented in a Depart-
ment of Commerce press release on June 16, 1976. It showed that the
U.S. current account shifted to near balance from a net surplus of
$3.1 billion (quarterly rate) in the fourth quarter. The previously
announced swing in the merchandise trade balance to a $1.5 billion
deficit, primarily because of an increase in imports of industrial
supplies and fuels, was the major element in the shift. Service
transactions and unilateral transfers showed relatively minor changes
from the fourth quarter.
Data available earlier on first quarter bank-reported capital
flows and official transactions have not been substantially revised in
this release. Net bank-reported capital outflows slowed to $2.2
billion in the first quarter from $4.3 billion in the fourth quarter;
U.S. reserve assets increased by $.8 billion compared to a small
decline in the fourth; and U.S. liabilities to foreign official agencies
increased by nearly $2 billion, about the same as in the fourth
quarter. However, a decision by the Commerce Department to no longer
seasonally adjust capital account transactions (a practice that had
been generating increasingly questionable results) resulted in the
press release figure for U.S. liabilities to foreign official
agencies being about $1 billion lower than the seasonally adjusted
estimate used in the Greenbook.

-7-
The most notable new piece of information in the press
release involves the figure for foreign direct investment in the
United States which showed an unusual swing from an inflow of $1.2
billion in the fourth quarter of 1975 to an outflow of $.7 billion
in the first quarter. This swing largely reflects a special payout
of accumulated dividends to a Middle-Eastern oil-exporting country.
As had been anticipated, the statistical discrepancy in
the first quarter was an unusually large positive number--$4.6 billion,
perhaps related to speculation against sterling and the lira.
The June 16, 1976 press release incorporates the recent
changes in format for reporting U.S. international transactions that
have been adopted by the Commerce Department.
The new Commerce Department data are reflected in the follow-
ing revised table IV-T-1, which appeared in the Greenbook.

-8-
IV - T - 1
U.S. International Transactions(In millions of dollars)
1. Trade balance2. Merchandise exports3. Merchandise imports
4. Net service transactions5. Balance on goods and services 1/
6. Remittances and pensions7. Gov't grants and capital, net
8. Bank-reported private capital, net change9. Claims on foreigners (inc.-)
10. Short-term11. Long-term12. Liabilities to foreigners (inc.+)13. Long-term liabilities14. Short-term liabilities 2/15. to commercial banks abroad16. (of which liab. to branches)17. to other private foreigners18. to int'l and regional organizations
Private transactions in securities, netU.S. purchases (-) of foreign securities
of which: New bond issues22. Foreign purch. (+) of.U.S. corp. securities23. Stocks 3/24. Bonds (includes U.S. Govt. agencies)
25. U.S. direct investment abroad, (inc.-)26. Foreign direct investment in U.S., (inc.+)27. Nonbank-reported: short-term claims (inc.-)28. long-term claims, (inc.-)29. liabilities, (inc.+)
30. Changes in liab. to foreign official agencies31. OPEC countries (inc.+)32. of which: stocks33. Other countries (inc.+)34. Changes in U.S. reserve assets (inc.-)35. Gold36. Special drawing rights37. Reserve position in the IMF38. Convertible currencies
39. Statistical discrepancy
Memo:40. Official settlements balance, N.S.A.41. O/S bal. excluding OPEC, N.S.A.
1975
June 21, 1976
0 7
YEAR Q-4 -1 Feb. Mar. Apr.8,983 2,199 -1,508 -227 -603 -450
107,133 27,655 26,939 8,777 9,285 9,27998,150 25,456 28,447 9,004 9,888 9,729
7,286 2,137 2,56616.269 4.336 1.058
-1, 27 -433 -480-4$4 -L , Z/i 137
-9,936 -4,423 -2382 -67 -2.059 3.049(-13,238) (-5,287) (-3,714) (-2,573) (95) (-2,314)-10,887 -4,344 -3,469 -2,474 359 -2,077-2,351 -943 -245 -99 -264 -237(3,302) (864) (1,332 (2,506) (-2,154) (5,363)
-355 91 166 -40 179 243,657 773 1,166 2,546 -2,333 5,339(-502) (-746) (916 (2,204) (-2,671) (4,715)(231) (1,234) (-831) (531) (-2,278) (3,184)
(1,853) (863) (150 (313) (173) (673)(2,306) (656) (100 (29) (165) (-49)
-3.479 -1.144 -1.481 -947 -591 -243(-6,206) (-2,361) (-2,507) (-1,201) (-974) (-377)(-7,168) (-2,573) (-2,824) (-1,296) (-1,039) (-470)(2,727) (1,217) (1,026) (254) (383) (134)
3,205 944 942 194 425 154-478 273 84 60 -42 -20
-6.307 -1.694 -1.5802.437 1.229 -689-925 -437 -180-.3W -322 -84
78 -161 24
4.604-/ 2.088/ 1 .856 800 209 9045,677 1,780 1,500 219 1,058 372(1,469) (519) (531) (177) (157) (256)-1.07±3/ 3081' 356 581 -849 532
-607 89 -773 -39 -330 -521
-66-466
-75
4,602
-3,9971,680
-21-57167
2,143
-45-237-491
4,574
-55-275
14-170-365
I IA
-2,177-397
-1,083417
-761-542
1211,179
Lines I through 7 are seasonally adjusted.p = preliminary1/ Differs from "net exports" in the GNP account. The GNP basis excludes U.S. Governmentrest payments for foreigners from service imports and special military exports to Israel.2/ Includes transactions in U.S. Treasury bonds and notes.
3/ Excludes OPEC transactions which are included in liabilities to foreign official agencies.E/ Excludes a $250 million increase in liabilities resulting from the revaluation of System
swap liabilities to Belgium and Switzerland.
-383-11

A-1
SUPPLEMENTAL APPENDIX A*BANK CREDIT REVISION
The seasonally adjusted series on commercial bank credit andits.major components have been revised. The revised data were used inthis month's analysis of financial developments. The revision includedthe updating of seasonal adjustment factors and the usual benchmarkrevision that incorporates the latest Call Report data, December 31,1975, for nonmember banks. Revisions in seasonal factors affected theseasonally adjusted data from 1968 to date, with principal changes inthe more recent years. The benchmark revision covered the July 1975to April 1976 period.
The principal effect of the combined benchmark and seasonalrevisions was to raise the level of total bank credit in the fourthquarter of 1975 and to lower it in the first quarter of 1976. Totalloans and investments increased at an annual rate of 4.6% in the October-December 1975 period which was 1.5 percentage points higher than pre-viously estimated. In the subsequent January-March 1976 period, creditgrowth was at a rate of 5.5% or 1.8 percentage points lower than indi-cated earlier. Revisions in both total loans and holdings of U.S.Government securities followed a similar pattern and largely accountedfor the changes in total credit, while those in holdings of othersecurities were small. Revisions in business loans, alone, were largeand were downward in both late 1975 and early 1976. These loans wereunchanged in the fourth quarter of 1975 compared with an estiated in-crease of 2.5%. In the first quarter of 1975, the decline, at an annualrate of 7.4%, was 2.1 percentage points larger than estimated earlier.
According to the December Call Report data, growth in commer-cial bank credit was at a somewhat faster pace in the second half of1975 than the partially estimated data had indicated. Total loans andinvestments outstanding on December 31, 1975 were raised $2.5 billion inthis revision (Table 1). This increase reflected almost entirely moresubstantial growth in bank loans, which were $2.3 billion higher at theend of 1975 than estimated earlier (Table 2). Holdings of U.S. Treasurysecurities were nominally lower than previously estimated while holdingsof other securities--principally municipals and Federal agency issues--were slightly higher (Table 3 and 4).
* The revised seasonal factors were prepared by Edward R. Fry andMary F. Weaver, and the benchmark revisions by Mary Jane Harrington,Banking Section, Division of Research and Statistics.

A - 2
Revisions in the unadjusted data reflect corrections for twosources of error in the original monthly estimates (in addition to esti-mating errors in the San Francisco District discussed below):
1. Nonmember bank figures for loans were estimated too low.These estimates were derived initially by applying nonmember/countrymember bank ratios from the June 1975 Call Report to loans reoorted forsubsequent months by country member banks. The December Call ratiosturned out to be higher than those for June, reflecting more rapid growthin loans at nonmember banks than at country member banks in the six-month period. This upward revision in nonmember bank loans was allocatedto earlier months back to July 1975, and the new December Call ratioswere carried forward in monthly estimates for 1976.
2. Data reported earlier by member banks on form FR 635, whichare the principal basis for the all-commercial bank estimates, also wererevised by substantial amounts on December 31, 1975. Loans (includinginterbank) as originally reported by member banks for this date wereunderstated more than $2 billion according to Call Report data. This re-porting error accounted for half of the upward revision in the all-commer-cial bank estimates for total loans. Most of the error was at the largermember banks, while country member bank data were reasonably accurate.Only on the infrequent occasions when the last-Wednesday of June or Decembercoincides with the Call date, as was the case on December 31, 1975, cansuch errors be detected, and sometimes they are substantial. However,on such occasions, another source of error in bank credit estimates--"window dressing"--is eliminated. This error is the difference betweenestimates based on reported data for the last-Wednesday of June or Decem-ber and the Call Report figures for the last day of June or Decemberthat are available after a long lag. Often errors in estimating "windowdressing" have contributed heavily to overall errors in the credit seriesas measured on benchmark dates.
The bank loan component of the total bank credit series isestimated on the basis of data reported by member banks including domesticinterbank loans. However, estimated interbank loans are excluded fromthe adjusted all-commercial bank credit series. Interbank loans of non-member banks are estimated by applying a nonmember/country member bankratio from the Call Report to current data from country banks, as in thecase of total loans. On December 31, 1975, Call data for interbank loansexceeded the estimated data by $1.8 billion. However, since interbankloans are subtracted from total loans, the underestimate of interbankloans partially offset the reporting error mentioned above.
In addition to the effects of the usual benchmark revision,patterns of change between the old and new series were affected by arelatively large concurrent revision in basic member bank data from whichmonthly bank credit estimates are derived. Monthly figures for member

A - 3
banks in the San Francisco District are partially estimated as initiallyreported, and revisions in those data for the July to December 1975 periodwere incorporated into the series at the time of the benchmark revision.Therefore, "changes due to benchmark" as noted on the tables actuallyreflect the combined changes of the benchmark and the San Franciscorevision.
Among the major loan categories, business loans were $2.2 bil-lion lower on December 31 than had been estimated and real estate loanswere $1.3 billion higher (Tables 5 and 6). Consumer loans, which arepart of consumer credit reports, were not affected by the benchmarkrevision. Revisions in security, nonbank financial, and agriculturalloans were all upward, but by relatively small amounts. The upward ad-justment in the residual "all other loans," however, was large. Actualdata for these loan categories are available on a current basis onlyfrom large weekly reporting banks. Estimates for other commercial banksare made largely on the basis of the movement of total loans at thesmaller banks, the trend of business and other loans as indicated by themost recent Call Report, and patterns for previous years established inthe monthly benchmarking of the series.
The revision in business loans over the second half of 1975was relatively large by historical standards and was also one of the fewinstances in which the outstanding level was reduced. In most pastrevisions, adjustments in business and real estate loans--the two largestloan categories--have been upward, reflecting the fact that revisions intotal loans have practically always been upward. In the first quarterof 1976, business loans were reduced by an additional $900 million.About $600 million of this reduction reflected revisions in San FranciscoDistrict weekly reporting data associated with adjustments to the March1976 Call.1/
The revisions in seasonal factors were largest for the mostrecent years, with some minor revisions affecting the bank credit seriesback to 1968.2/ The new factors tended to reduce seasonally adjustedgrowth in total bank credit in the first quarter and to increase it inthe second and fourth quarters. For the fourth quarter of 1975 the up-ward revision was $1.3 billion, and for the first quarter of 1976, thedownward revision was $2.5 billion. These changes were reflected mainly
1/ First quarter changes used here are adjusted to exclude a break inseries due to portfolio reclassifications in the Chicago and San Fran-cisco Districts which lowered the level of business loans by $1.2billion in March 1976.
2/ Seasonal factors used prior to this revision were determined basicallyfrom the late 1973 seasonal review. However, by late 1975, the 1973factors were being modified somewhat to take account of changing sea-sonal patterns for business loans, total loans, and total bank credit.In the current seasonal revision, these changes were carried back toearlier years; so the impacts of seasonal changes shown for recentmonths in Tables 1, .2, and 5 differ somewhat from those for comparablemonths of earlier years.

A-4
in bank investments in U.S. Government securities and in loans. U.S.Government securities holdings were raised in the fourth quarter of 1975,with a partially offsetting reduction in other securities. In the firstquarter of this year, the revisions reduced growth in both U.S. Govern-ment security holdings and in total loans, with most of the revision inloans occurring in security loans and loans to nonbank financial insti-tutions.

Table 1
Total Loans and Investments 1/2/(Dollar changes in billions; annual rates in percent)
Old Seasonally Changes Due To: New Seasonally Annual RatesAdjusted AdjustedSeries Benchmark Seasonal Factor Series Old New
1975--MayJune
JulyAugustSeptember
OctoberNovemberDecember
Year
1st Half2nd Half
1st Quarter2nd Quarter3rd Quarter4th Quarter
1976--JanuaryFebruaryMarch
April
1st Quarter
3.03.0
1.24.01.2
3.66.3
-4.4
29.7
17.811.9
9.88.06.45.5
3.24.95.0
3.0
13.1
-1.11.5.6
.2
.21.1
2.5
2.5
1.01.5
-.7-. 4.4
.3
-. 7
-1.11.4
.5-2.01.6
-. 61.9
-1.9
-3.31.4
-5.21.9.1
1.3
-.4-.9-1.2
-2.5
1.94.4
.63.53.4
3.85.9-1.4
30.3
14.515.8
4.69.97.58.3
2.13.64.2
3.3
9.9
5.15.1
2.06.82.0
6.010.5-7.2
4.3
5.13.4
5.74.63.63.1
5.38.18.2
4.9
7.3
3.27.5
1.05.95.7
6.39.8
-2.3
4.24.5
2.65.74.24.6
3.55.97.4
5.4
5.5
Last Wednesday of month seriesIncludes loans sold outright to banks' own foreign branches, nonconsolidated nonbank affiliates of the bank,
the banks' holding company (if not a bank), and nonconsolidated nonbank subsidiaries of the holding company.

Table 2
Total Loans 1/2/
(Dollar changes in billions; annual rates in percent)
Old Seasonally Changes Due To: New Seasonally Annual RatesAdjusted Adjusted
Series Benchmark Seasonal Factor Series Old New
1975--MayJune
JulyAugustSeptember
OctoberNovemberDecember
Year
1st Half2nd Half
1st2nd3rd4th
QuarterQuarterQuarterQuarter
1976--JanuaryFebruaryMarch
April
1st Quarter
-2.1-2.9
-. 51.1-. 3
3.93.9
-3.6
-3.9
-8.44.5
-8.4.3
4.2
.61.02.4
-.4
4.0
-. 61.5
-2.01.1
-.4-.71.0
-2.1
-1.1-1.0
-4.13.0-. 9-. 1
-1.1
1.0
-1.1
-2.7-1.4
-1.1.3
1.3
3.73.5
-1.9
-3.7
-9.55.8
-4.1-5.4
.55.3
.3
.71.6
.8
2.6
-5.0-7.0
-1.22.7-.7
9.59.4-8.6
-.8
-3.31.8
-6.7.2
3.4
1.42.45.8
-1.0
3.2
-6.5-3.4
-2.7.7
3.1
8.98.4-4.5
-.7
-3.82.3
-3.2-4.3
.44.3
.71.73.8-
1.9
2.1
1/ Last Wednesday of Month series2/ Includes loans sold outright to banks' own
the banks' holding company (if not a bank)foreign branches, nonconsolidated nonbank affiliate of the bank,and nonconsolidated nonbank subsidiaries of the holding company.
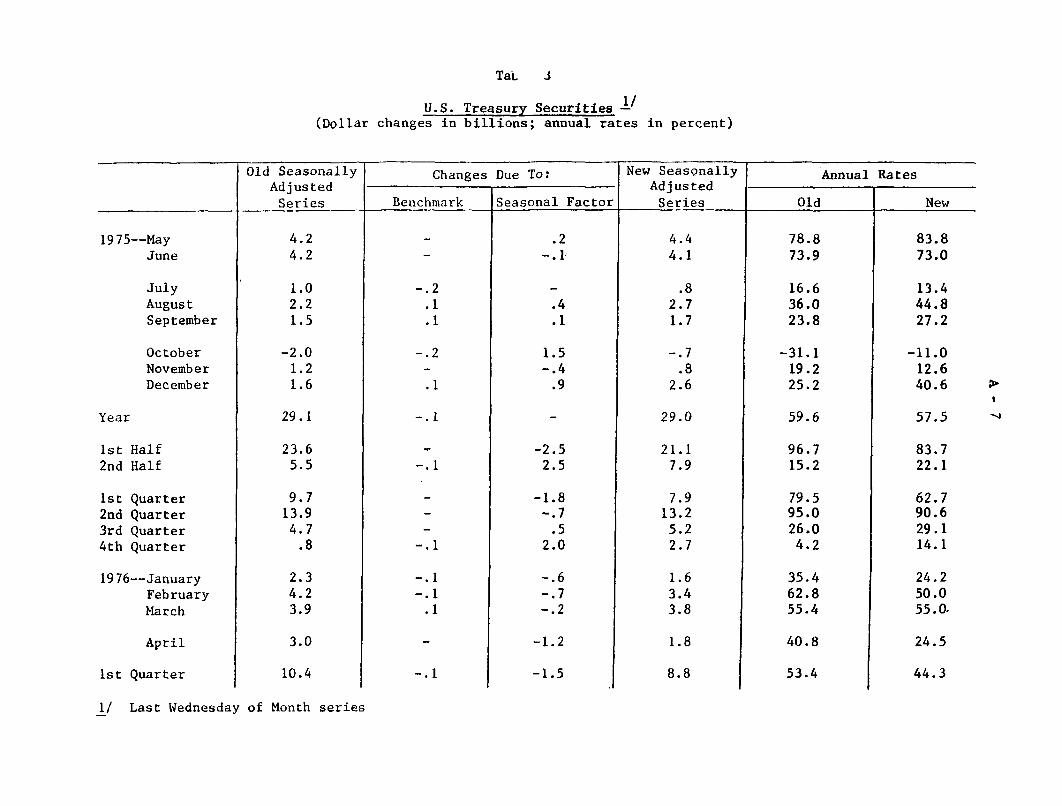
Table 3
U.S. Treasury Securities 1 /(Dollar changes in billions; annual rates in percent)
Old Seasonally Changes Due To: New Seasonally Annual RatesAdjusted Adjusted
Series Benchmark Seasonal Factor Series Old New
1975--MayJune
JulyAugustSeptember
OctoberNovemberDecember
Year
1st Half2nd Half
1st Quarter2nd Quarter3rd Quarter4th Quarter
1976--JanuaryFebruaryMarch
April
1st Quarter
4.24.2
1.02.21.5
-2.01.21.6
29.1
23.65.5
9.713.94.7.8
2.34.23.9
3.0
10.4
-.2.1.1
-. 2
.1
-. 1
-.1
-. 1
-. 1
-. 1
.1
.2-.1
.4
.1
1.5-.4.9
-2.52.5
-1.8-. 7
.52.0
-. 6-. 7-. 2
-1.2
-1.5
4.44.1
.82.71.7
-.7.8
2.6
29.0
21.17.9
7.913.2
5.22.7
1.63.43.8
1.8
8.8
78.873.9
16.636.023.8
-31.119.225.2
59.6
96.715.2
79.595.026.04.2
35.462.855.4
40.8
53.4
83.873.0
13.444.827.2
-11.012.640.6
57.5
83.722.1
62.790.629.114.1
24.250.055.0.
24.5
44.3
1/ Last Wednesday of Month series

Other Securities 1/(Dollar changes in billions; annual rates in percent)
Old Seasonally Changes Due To: New Seasonally Annual RatesAdjusted -Adjusted
Series Benchmark Seasonal Factor Series Old New
1975--MayJune
JulyAugustSeptember
OctoberNovemberDecember
Year
1st Half2nd Half
1st Quarter2nd Quarter3rd Quarter4th Quarter
1976--JanuaryFebruaryMarch
April
1st Quarter
.91.7
.7
.7
1.71.2
-2.4
4.5
2.61.9
.12.51.4.5
.3-.3-1.3
.4
-1.3
-.2.2
.1
.3
.4
.4
.4
-. 4.1
-. 3
-. 7
.4-.4.4
-1.0.4
.1
.3-.2
.7-. 4.4
-.6
.3-.3.1
.3
.1
.21.7
.9
.5
.4
.81.6
-2.1
5.0
2.92.1
.82.11.8.3
.2-. 5-1.2
.7
-1.5
7.714.5
5.95.9
14.29.9
-19.6
3.2
3.72.7
.37.13.91.4
2.5-2.5
-10.8
3.3
-3.6
1.714.5
7.54.23.3
6.613.2
-17.1
4.12.9
2.36.05.0.8
1.7-4.1
-10.0-
5.9
-4.1
1/ Last Wednesday of Month series

Table 5
Business Loans 1/2/(Dollar changes in billions; annual rates in percent)
1975--MayJune
JulyAugustSeptember
OctoberNovemberDecember
Year
1st Half2nd Half
1st Quarter2nd Quarter3rd Quarter4th Quarter
1976--JanuaryFebruaryMarch
April
1st Quarter
Old Seasonally Changes Due To: New Seasonally Annual RatesAdjusted AdjustedSeries Benchmark Seasonal Factor Series Old New
-1.3-2.7
1.2-.1
-1.1
1.6.9
-1.4
-5.0
-6.11.1
-1.6-4.5
1.1
.3-. 8
-1.9
-1.0
-2.4
-. 8.1
-. 4
-. 4
-. 1-. 6
-2.2
-2.2
-1.1
.2-. 2-.9
.2
-.9
-. 5.8
-.5-.2.3
.3
.2
.5
-. 7
-. 3-. 4
-.8.5
-. 4
.1-. 3.2
.1
-1.8-1.9
-.1-. 2
-1.2
.9
.6-1.5
-7.9
-6.4-1.5
-2.4-4.0-1.5
.6-1.3-2.6
-. 9
-3.3
-8.5-17.8
8.0-.7
-7.3
10.76.0-9.2
-2.7
-6.61.3
-3.5-9.8
2.5
2.0-5.3
-12.7
-6.8
-5.3
-11.8-12.6
-. 7-1.3-8.0
6.04.0
-10.0
-4.2
-6.9-1.7
-5.1-8.7-3.3
4.0-8.7
-17.6.
-6.2
-7.4
Last Wednesday of Month series
Includes loans sold outright to banks' ownthe banks' holding company (if not a bank)
foreign branches, nonconsolidated nonbank affiliates of the bank,and nonconsolidated nonbank subsidiaries of the holding company.

Table 6
Real Estate Loans 1/(Dollar changes in billions; annual rates in percent)
Old Seasonally Changes Due To: New Seasonally Annual RatesAdjusted Adjusted
Series Benchmark Seasonal Factor Series Old New
1975--MayJune
JulyAugustSeptember
OctoberNovemberDecember
Year
1st Half2nd Half
1st Quarter2nd Quarter3rd Quarter4th Quarter
1976--JanuaryFebruaryMarch
April
1st Quarter
.1
.6
.3
.5
2.9
1.41.5
1.0.4.1
1.4
.5
.6
.7
.7
1.8
.1
.1
.2
.2
.3
.4
1.3
1.3
.4
.9
.3
.4
.5
.1
1.2
-. 1.1
.9
.9
5.52.74.5
2.2
2.22.3
3.11.2.3
4.3
4.55.46.3
6.2
5.4
2.24.3
3.11.21.57.0
7.210.78.8
6.9
8.9
I/ Last Wednesday of Month series


