Fomc 19751216 Blue Book 19751212
32
Prefatory Note The attached document represents the most complete and accurate version available based on original copies culled from the files of the FOMC Secretariat at the Board of Governors of the Federal Reserve System. This electronic document was created through a comprehensive digitization process which included identifying the best- preserved paper copies, scanning those copies, 1 and then making the scanned versions text-searchable. 2 Though a stringent quality assurance process was employed, some imperfections may remain. Please note that some material may have been redacted from this document if that material was received on a confidential basis. Redacted material is indicated by occasional gaps in the text or by gray boxes around non-text content. All redacted passages are exempt from disclosure under applicable provisions of the Freedom of Information Act. 1 In some cases, original copies needed to be photocopied before being scanned into electronic format. All scanned images were deskewed (to remove the effects of printer- and scanner-introduced tilting) and lightly cleaned (to remove dark spots caused by staple holes, hole punches, and other blemishes caused after initial printing). 2 A two-step process was used. An advanced optical character recognition computer program (OCR) first created electronic text from the document image. Where the OCR results were inconclusive, staff checked and corrected the text as necessary. Please note that the numbers and text in charts and tables were not reliably recognized by the OCR process and were not checked or corrected by staff. Content last modified 6/05/2009.
-
Upload
fraser-federal-reserve-archive -
Category
Documents
-
view
214 -
download
0
Transcript of Fomc 19751216 Blue Book 19751212

Prefatory Note The attached document represents the most complete and accurate version available based on original copies culled from the files of the FOMC Secretariat at the Board of Governors of the Federal Reserve System. This electronic document was created through a comprehensive digitization process which included identifying the best-preserved paper copies, scanning those copies,1
and then making the scanned versions text-searchable.2
Though a stringent quality assurance process was employed, some imperfections may remain. Please note that some material may have been redacted from this document if that material was received on a confidential basis. Redacted material is indicated by occasional gaps in the text or by gray boxes around non-text content. All redacted passages are exempt from disclosure under applicable provisions of the Freedom of Information Act. 1 In some cases, original copies needed to be photocopied before being scanned into electronic format. All scanned images were deskewed (to remove the effects of printer- and scanner-introduced tilting) and lightly cleaned (to remove dark spots caused by staple holes, hole punches, and other blemishes caused after initial printing). 2 A two-step process was used. An advanced optical character recognition computer program (OCR) first created electronic text from the document image. Where the OCR results were inconclusive, staff checked and corrected the text as necessary. Please note that the numbers and text in charts and tables were not reliably recognized by the OCR process and were not checked or corrected by staff.
Content last modified 6/05/2009.

Strictly Confidential (FR) Class I FOMC
MONETARY AGGREGATES ANDMONEY MARKET CONDITIONS
Prepared for the Federal Open Market Committee
By the staff Board of Governors of the Federal Reserve System
December 12, 1975

STRICTLY CONFIDENTIAL (FR) December 12, 1975CLASS I - FOMC
MONETARY AGGREGATES ANDMONEY MARKET CONDITIONS
Recent developments
(1) M1 increased at about a 12 per cent annual rate in November,
but data available for recent weeks suggest that growth in December will
be much slower. For November and December combined, M1 is, therefore,
projected to grow at about a 7 per cent annual rate. Growth in time deposits
other than money market CD's has been somewhat stronger than expected at the
time of the November FOMC meeting, and M2 is projected to increase at about
a 9.7 per cent annual rate over the November-December period, in the upper
part of the Committee's range of tolerance. Net inflows to thrift institu-
tions have been well maintained.
Growth in Monetary Aggregates and RPD'sover November-December Period
Reserve and monetary aggregates Ranges of(Growth at SAAR in per cent) Tolerance Latest Estimates
M1 6 to 10 7.1
M2 7½ to 10½ 9.7
RPD 4½ to 8½ 4.7
Memo: Avg. for statementFederal funds rate 4½ to 5½ week ending(per cent per annum) Nov. 19 5.24
26 5.28Dec. 3 5.25
10 5.26
-2-
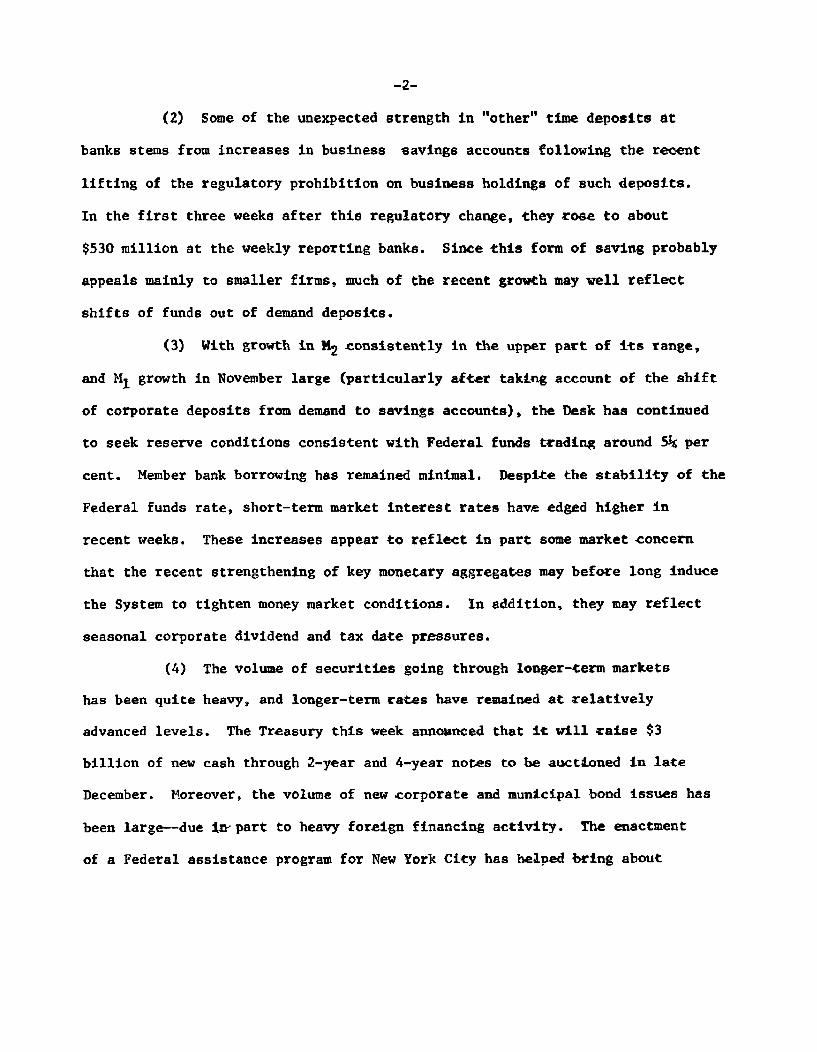
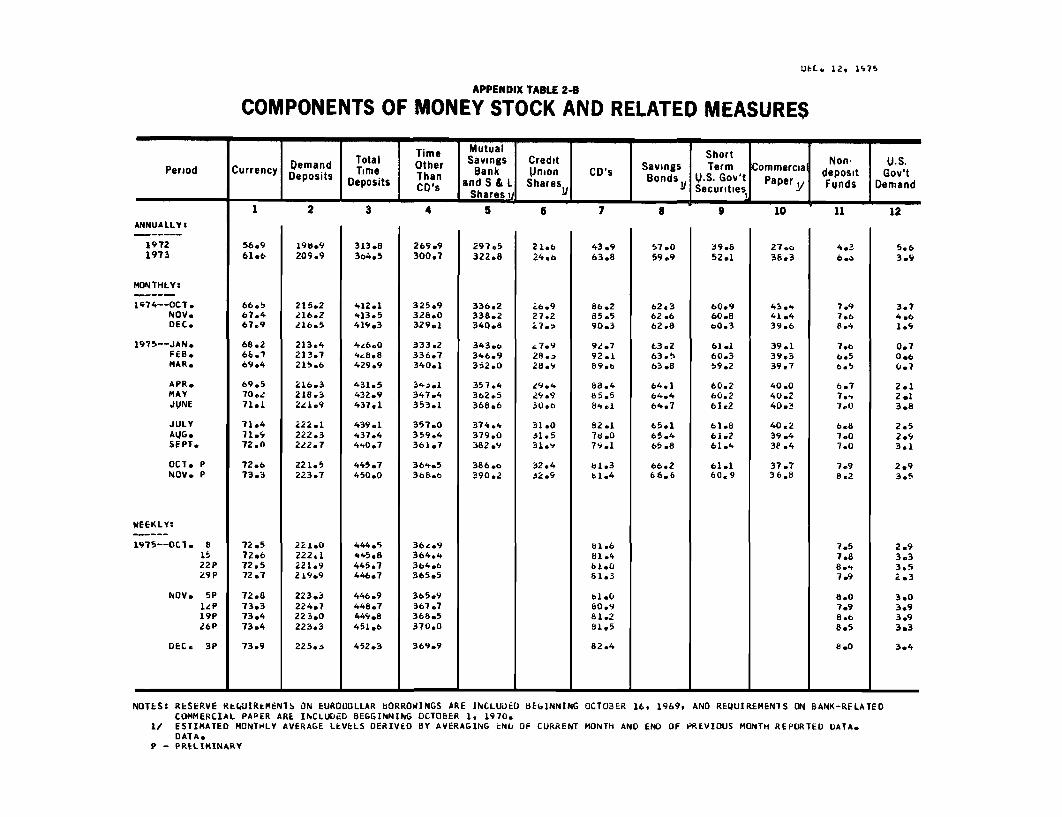
(2) Some of the unexpected strength in "other" time deposits at
banks stems from increases in business savings accounts following the recent
lifting of the regulatory prohibition on business holdings of such deposits.
In the first three weeks after this regulatory change, they rose to about
$530 million at the weekly reporting banks. Since this form of saving probably
appeals mainly to smaller firms, much of the recent growth may well reflect
shifts of funds out of demand deposits.
(3) With growth in M2 consistently in the upper part of its range,
and M1 growth in November large (particularly after taking account of the shift
of corporate deposits from demand to savings accounts), the Desk has continued
to seek reserve conditions consistent with Federal funds trading around 5 per
cent. Member bank borrowing has remained minimal. Despite the stability of the
Federal funds rate, short-term market interest rates have edged higher in
recent weeks. These increases appear to reflect in part some market concern
that the recent strengthening of key monetary aggregates may before long induce
the System to tighten money market conditions. In addition, they may reflect
seasonal corporate dividend and tax date pressures.
(4) The volume of securities going through longer-term markets
has been quite heavy, and longer-term rates have remained at relatively
advanced levels. The Treasury this week announced that it will raise $3
billion of new cash through 2-year and 4-year notes to be auctioned in late
December. Moreover, the volume of new corporate and municipal bond issues has
been large--due in part to heavy foreign financing activity. The enactment
of a Federal assistance program for New York City has helped bring about

-3-
scattered declines in municipal yields. But the market is still affected by
uncertainties with regard to state agencies, longer-run prospects for the
state itself, and legal challenges to the mandated restructuring of New York
City's debt.
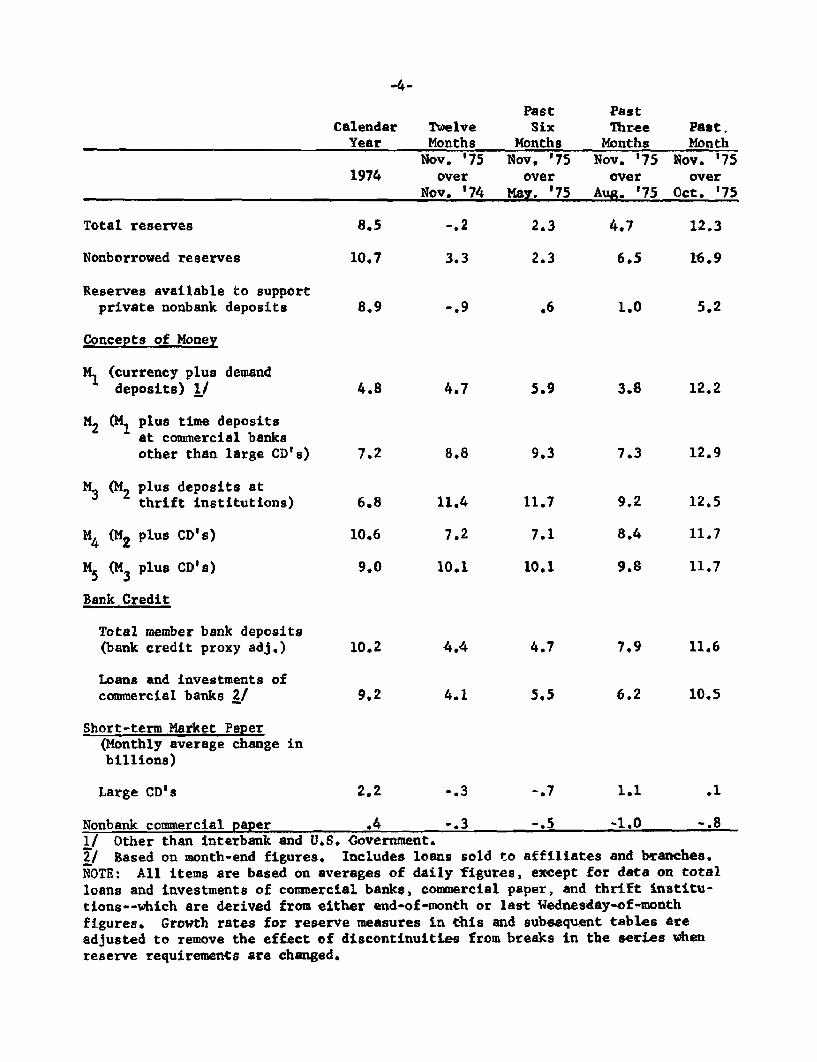
(5) The table on the following page shows (in percentage annual
rates of change) selected monetary and financial flows over various time
periods.
Past PastCalendar Twelve Six Three Past.Year Months Months Months Month
Nov. '75 Nov. '75 Nov. '75 Nov. '751974 over over over over
Nov. '74 May. '75 Aug. '75 Oct. '75
Total reserves 8.5 -.2 2.3 4.7 12.3
Nonborrowed reserves 10.7 3.3 2.3 6.5 16.9
Reserves available to supportprivate nonbank deposits 8.9 -.9 .6 1.0 5.2
Concepts of Money
M1 (currency plus demanddeposits) / 4.8 4.7 5.9 3.8 12.2
M2 (M1 plus time depositsat commercial banksother than large CD's) 7.2 8.8 9.3 7.3 12.9
M3 ( plus deposits atthrift institutions) 6.8 11.4 11.7 9.2 12.5
M4 (M2 plus CD's) 10.6 7.2 7.1 8.4 11.7
M5 (M3 plus CD's) 9.0 10.1 10.1 9.8 11.7
Bank Credit
Total member bank deposits(bank credit proxy adj.) 10.2 4.4 4.7 7.9 11.6
Loans and investments ofcommercial banks 2/ 9.2 4.1 5.5 6.2 10.5
Short-term Market Paper(Monthly average change inbillions)
Large CD's 2.2 -.3 -.7 1.1 .1
Nonbank commercial paper .4 -.3 -.5 -1.0 -.8
1/ Other than interbank and U.S. Government.2/ Based on month-end figures. Includes loans sold to affiliates and branches.
NOTE: All items are based on averages of daily figures, except for data on total
loans and investments of commercial banks, commercial paper, and thrift institu-
tions--which are derived from either end-of-month or last Wednesday-of-month
figures. Growth rates for reserve measures in this and subsequent tables are
adjusted to remove the effect of discontinuities from breaks in the series when
reserve requirements are changed.
Prospective developments
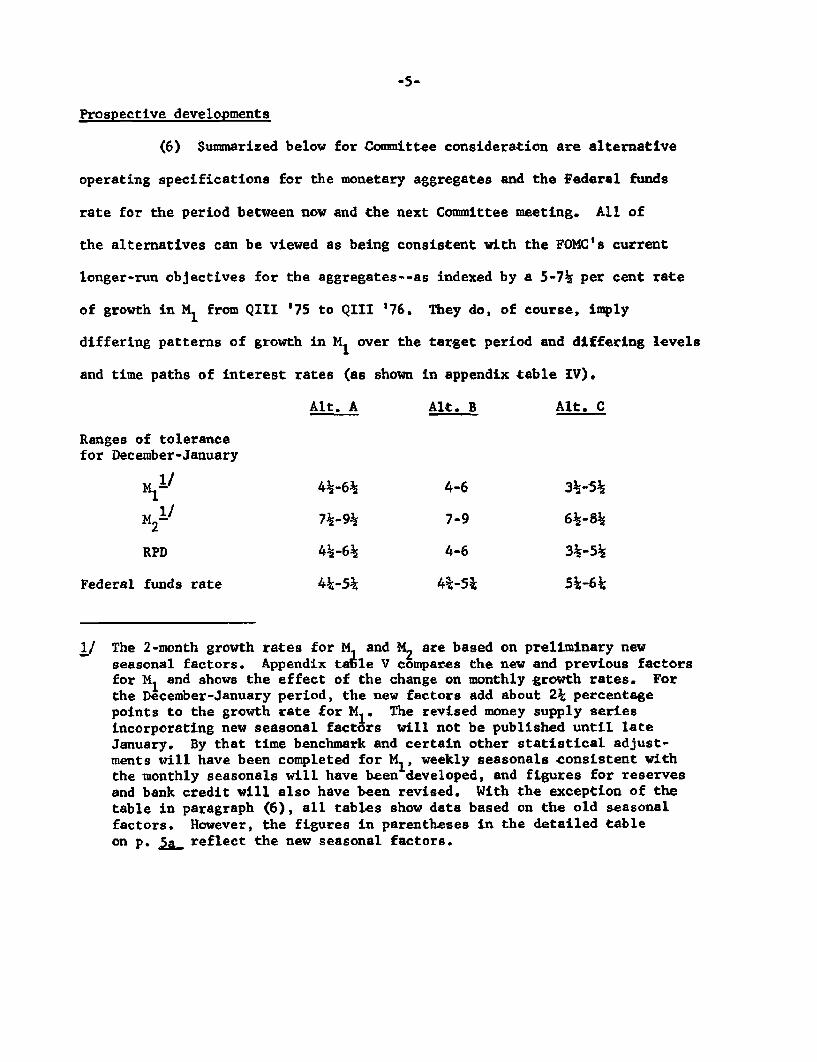
(6) Summarized below for Committee consideration are alternative
operating specifications for the monetary aggregates and the Federal funds
rate for the period between now and the next Committee meeting. All of
the alternatives can be viewed as being consistent with the FOMC's current
longer-run objectives for the aggregates--as indexed by a 5-7½ per cent rate
of growth in M1 from QIII '75 to QIII '76. They do, of course, imply
differing patterns of growth in M 1 over the target period and differing levels
and time paths of interest rates (as shown in appendix table IV).
Alt. A Alt. B Alt. C
Ranges of tolerancefor December-January
M1 1/ 4½-6½ 4-6 3½-5½
M2 1/ 7½-9½ 7-9 6½-8½
RPD 4½-6 4-6 3½-5½
Federal funds rate 4¼-5¼ 4¾-5¾ 5¼-6¼
1/ The 2-month growth rates for M1 and M2 are based on preliminary newseasonal factors. Appendix table V compares the new and previous factorsfor M1 and shows the effect of the change on monthly growth rates. Forthe December-January period, the new factors add about 2¼ percentagepoints to the growth rate for M1. The revised money supply series
incorporating new seasonal factors will not be published until lateJanuary. By that time benchmark and certain other statistical adjust-ments will have been completed for M1, weekly seasonals consistent withthe monthly seasonals will have been developed, and figures for reservesand bank credit will also have been revised. With the exception of the
table in paragraph (6), all tables show data based on the old seasonal
factors. However, the figures in parentheses in the detailed table
on p. 5a reflect the new seasonal factors.

-5a-
Alternative Levels and Growth Rates for Key Monetary Aggregates.
M1 M2
Alt. A Alt. B Alt. C Alt. A Alt. B Alt. C Alt. A Alt. B Alt. C
1975 NovemberDecember
1976 January
1975 QIIIQIV
1976 QIOilQIII
Growth RatesMonthly:
1975 December 1/1976 January 17
Quarterly Average:
1975 QIV1976 QI
QIIQIII
QIII '75-QI '76QI '76-QIII '76
QIII '75-QIII '76
297.0297.5298.6
294.1296.2
301,2307.4312.4
2.0(0.8)4.4(9.9)
2.96.88.26.5
4.87.4
6.2
297.0297.5298.4
294.1296.2
300.7306.7312.4
, 2.0(0.8)3.6(9.1)
2.96.18.07.4
4.57.8
6.2
297.0297.5298.2
294.1296.2
300.3306.3312.4
2.0(0.8)2.8(8.3)
2.95.58.08.0
4.28.1
6.2
665.6669.2673.6
653.5664.4
679.8694.7706.4
6.5(5.9)7.9(10.7)
6.79.38.86.7
8.07.8
8.1
665.6669.2673.2
653.5664.4
678,7693.3706.8
6.5(5.9)7.2(10.0)
6.78.68.67.8
7.78.3
8.2
665.6669.2672.8
1088.71096.31104,8
1088.71096.21104.1
1088.71096.11103.4
653.5 1063.7 1063.7 1063.7664.4 1087.5 1087.5 1087.4
678.0692.6707.2
6.5(5.9)6.5(9.3)
6.78.28.68.4
7.58.6
8.2
1115.21140.81161.9
8.49.3
9.010.29.27.4
9.78.4
9.2
1113.61138.61162.0
1112.21137.41162.5
8.38.6
9.09.69.08.2
9.48.7
9.2
8.99.19.18.8
9.19.0
9.3
1/ Figures in parentheses represent rates of growth based on thewith 2-month growth rates shown in summary table in paragraph
preliminary new seasonal factors and are(6).
consistent
-5b-
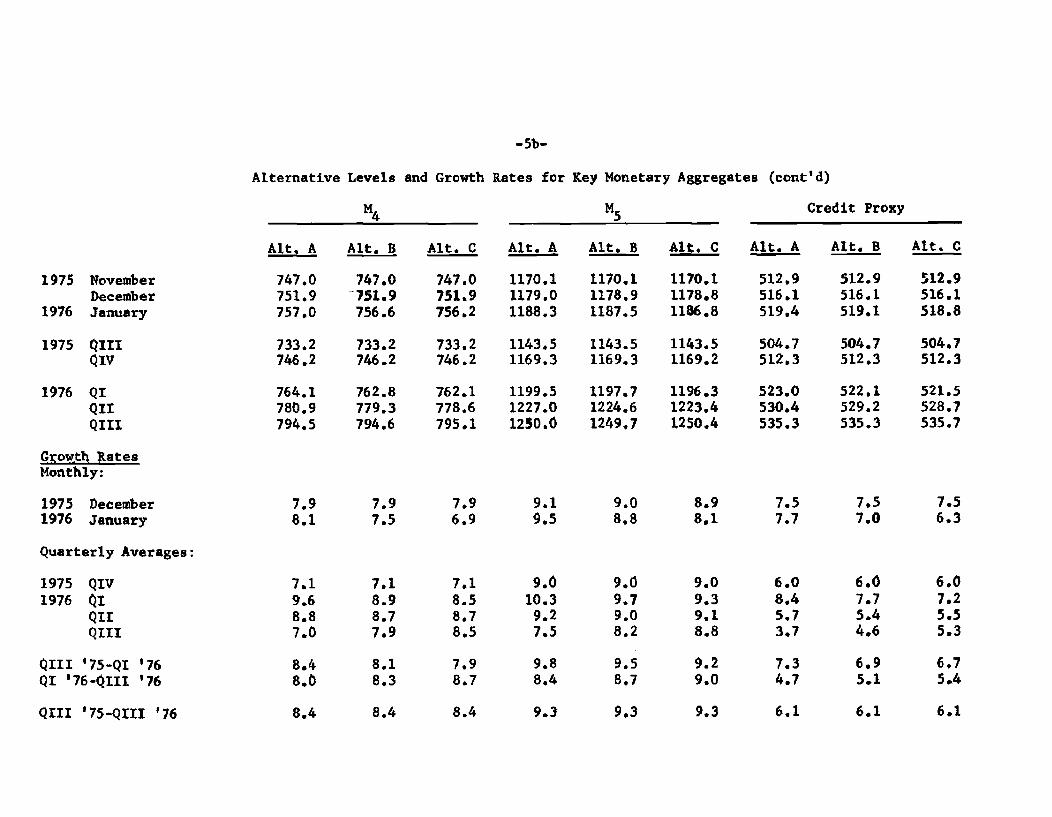
Alternative Levels and Growth Rates for Key Monetary Aggregates (cont'd)
M4 M5 Credit Proxy
Alt, A Alt. B Alt. C Alt. A Alt. B Alt. C Alt. A Alt. B Alt. C
1975 November 747.0 747.0 747.0 1170.1 1170,1 1170.1 512.9 512.9 512.9December 751.9 -751.9 751.9 1179.0 1178.9 1178.8 516.1 516.1 516.1
1976 January 757.0 756.6 756.2 1188.3 1187.5 1186.8 519.4 519.1 518.8
1975 QIII 733.2 733.2 733.2 1143.5 1143.5 1143.5 504.7 504.7 504.7QIV 746.2 746.2 746.2 1169.3 1169.3 1169.2 512.3 512.3 512.3
1976 QI 764.1 762.8 762.1 1199.5 1197.7 1196.3 523.0 522.1 521.5QII 780.9 779.3 778.6 1227.0 1224.6 1223.4 530.4 529.2 528.7QIII 794.5 794.6 795.1 1250.0 1249,7 1250.4 535.3 535.3 535.7
Growth RatesMonthly:
1975 December 7.9 7.9 7.9 9.1 9.0 8.9 7.5 7.5 7.51976 January 8.1 7.5 6.9 9.5 8.8 8.1 7.7 7.0 6.3
Quarterly Averages:
1975 QIV 7.1 7.1 7.1 9.0 9.0 9.0 6.0 6.0 6.01976 QI 9.6 8.9 8.5 10.3 9.7 9.3 8.4 7.7 7.2
QII 8.8 8.7 8.7 9.2 9.0 9.1 5.7 5.4 5.5QIII 7.0 7.9 8.5 7.5 8.2 8.8 3.7 4.6 5.3
QIII '75-QI '76 8.4 8.1 7.9 9.8 9.5 9.2 7.3 6,9 6.7QI '76-QIII '76 8.0 8.3 8.7 8.4 8.7 9.0 4.7 5.1 5.4
QIII '75-QIII '76 8.4 8.4 8.4 9.3 9.3 9.3 6.1 6.1 6.1
-6-
(7) Under alternative B the Federal funds rate range is centered
around the 5¼ per cent level that has been prevailing for several weeks.
The staff believes that in these circumstances M1 would grow in about a
4-6 per cent, annual rate, range and M2 in a 7-9 per cent range. Growth
of M 1 in the December-January period is expected to be constrained by
continuing shifts of corporate funds from demand deposits to savings accounts.
The expected range of M1 growth reflects our assumption that such shifts may
reduce M growth by 1 to 1 percentage points. This assumption is based on an
evaluation of early data on the increase in corporate savings accounts and our
expectation that the pace at which funds are transferred out of demand accounts
will slow.
(8) Assuming little change in money market conditions, the 3-month
bill rate is likely to fluctuate within a relatively narrow range between
now and the next Committee meeting. The rate could drop somewhat as mid-
December dividend and tax date pressures ease, but offsetting upward pressures
are likely to be generated by a continuation of the Treasury's practice of
raising sizable amounts of new cash in the weekly and monthly bill auctions.
Longer-term rates are likely to change little over the period ahead. The
holiday period will provide only a brief respite for the market, since the
prospective volume of new corporate and municipal offerings in January
remains relatively sizable and a large amount of Treasury financing is
anticipated for the first quarter of the year.

-7-
(9) The basic outlook over the longer run for monetary aggregates and
interest rates appears little changed from the previous blue book. Under
alternative B, the Federal funds rate would be expected to begin rising by
around mid-winter and may reach the 7-7½ per cent range by summer, which would
be a shade less than projected last time. Growth in time deposits other than
large CD's is expected to moderate progressively over the first half of next
year. We have assumed that shifts of funds from demand deposits into corporate
savings accounts will become negligible by late winter, but this assumption
is subject to considerable uncertainty because of the novelty of the development.
(10) Although there may be some effort on the part of banks to issue
CD's for year-end window-dressing purposes, banks are not likely to be aggressive
issuers of CD's in the weeks ahead. Loan demands are likely to remain on the
moderate side, and banks should have ample funds from other sources to accommodate
these demands. Moreover, there are no signs that banks are significantly changing
their conservative lending and liability management policies. Thus, bank credit
growth will probably be relatively moderate in the December-January period, and
also in the first half of next year.
(11) Alternative A contemplates a decline in the Federal funds rate
to the mid-point of a 4¼-5¼ per cent range. Given the high rates of growth
in the monetary aggregates in November, such an easing in the money market
would be contrary to current market expectations and might be accompanied by
a sizable near-term decline in short-term rates. On the other hand, many market
participants may take the view that such an easing is only temporary and, to
that extent, declines in market rates would be limited. Under this alternative,
the staff expects that the funds rate would have to begin rising later in the
-8-
winter in order to attain the FOMC's current longer-run monetary objectives
and that the rate would be in the 7½-8 per cent area by summer. This
alternative, therefore, would ultimately tend to exert considerable pressure on
savings inflows at thrift institutions and banks.
(12) Under alternative C, a rise in the funds rate to the mid-point
of the 5 -6 per cent range between now and the next meeting is contemplated.
Such a move would likely be accompanied by increases of to ¾ of a percentage
point in other short-term rates and by smaller upward adjustments in longer-
term rates. Net inflows of consumer-type time and savings deposits at banks
and thrift institutions would be expected to moderate somewhat from their
recent pace over the next few weeks. Later on, however, they would be subject
to less pressure than under alternatives A or B since the early tightening of
money market conditions would tend to limit the extent to which interest
rates would need to rise in the future in order to keep growth in the
monetary aggregates on target, given the staff's GNP projection.
Proposed directive
(13) Shown below is a proposed operational paragraph for
consideration if the Committee wishes to continue formulating its instruc-
tions in terms of desired growth in monetary aggregates over the months
ahead. No alternatives are presented for this formulation, in the expecta-
tion that the reference to desired growth will be taken to apply to the
longer-term targets and that at this meeting the Committee will not
reconsider its present 5 to 7½ per cent target range for M1, with which
all of the short-run operating alternatives discussed in the preceding
sections are consistent.
"Monetary Aggregate" Proposal
To implement this policy, while taking [DEL: more than usual]
account of developments in domestic and international financial
markets, the Committee seeks to achieve bank reserve and money
market conditions consistent with moderate growth in monetary
aggregates over the months ahead.
(14) Should the Committee desire to formulate the directive
in terms of bank reserve and money market conditions, the language needed
would depend on the specific conditions sought. These alternative "money
market" directives intended to correspond to the similarly lettered policy
alternatives are given below.
-10-
Alternative "Money Market" Proposals
Alternative A
To implement this policy, while taking [DEL: more than usual] account
of developments in domestic and international financial markets,
the Committee seeks to achieve SOMEWHAT EASIER bank reserve and money
market conditions OVER THE PERIOD IMMEDIATELY AHEAD, PROVIDED THAT
MONETARY AGGREGATES DO NOT APPEAR TO BE GROWING AT RATES ABOVE THOSE
CURRENTLY EXPECTED [DEL: consistent with moderate growth in monetary
aggregates over the months ahead].
Alternative B
To implement this policy, while taking [DEL: more than usual] account
of developments in domestic and international financial markets,
the Committee seeks to [DEL: achieve] MAINTAIN PREVAILING bank reserve and
money market conditions OVER THE PERIOD IMMEDIATELY AHEAD, PROVIDED
THAT MONETARY AGGREGATES APPEAR TO BE GROWING AT ABOUT THE RATES
CURRENTLY EXPECTED [DEL: consistent with moderate growth in monetary
aggregates over the months ahead].
Alternative C
To implement this policy, while taking [DEL: more than usual] account
of developments in domestic and international financial markets,
the Committee seeks to achieve SOMEWHAT FIRMER bank reserve and
money market conditions OVER THE PERIOD IMMEDIATELY AHEAD, PROVIDED
THAT MONETARY AGGREGATES DO NOT APPEAR TO BE GROWING AT RATES BELOW
THOSE CURRENTLY EXPECTED [DEL: consistent with moderate growth in monetary
growth in monetary aggregates over the months ahead].

-11-
(14) In all four of the alternatives, it is proposed to delete the
words "more than usual" in the phrase, "while taking more than usual account
of developments in domestic and international financial markets," since
action by the Federal Government has somewhat eased New York City's near-
term financial problems.
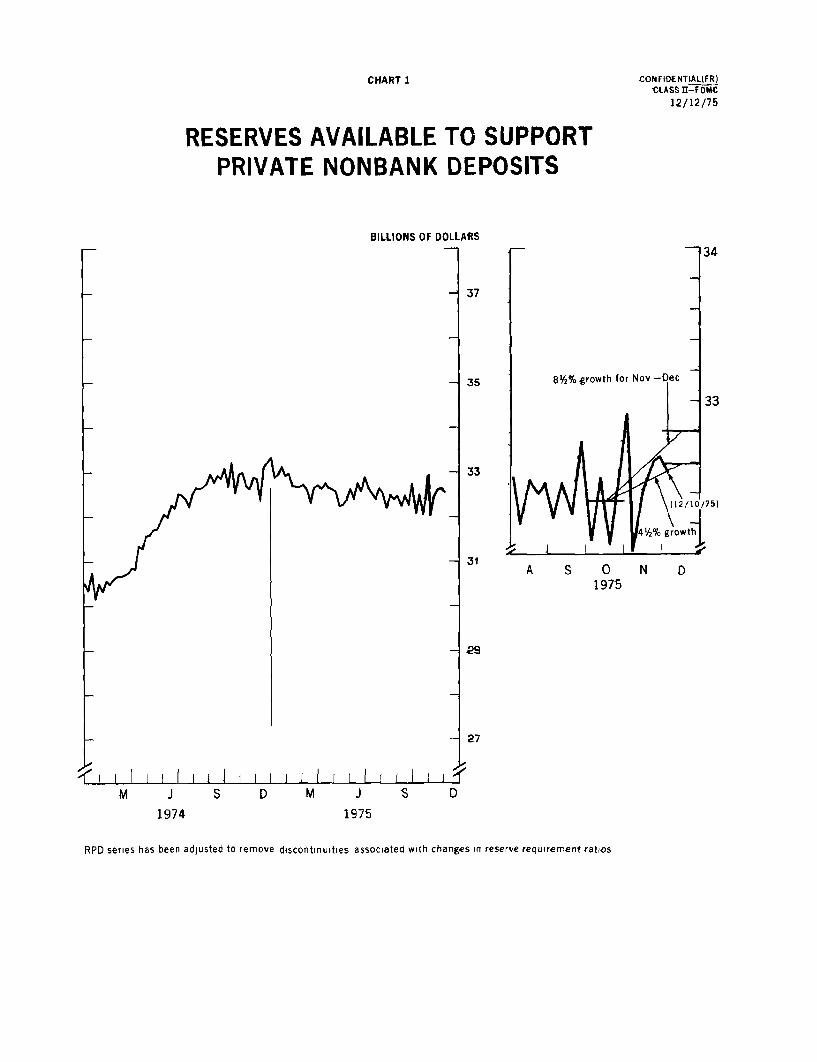
CHART 1
RESERVES AVAILABLE TO SUPPORTPRIVATE NONBANK DEPOSITS
BILLIONS OF DOLLARS
8Y2% growth for Nov
A S 01975
S D M J S D
1975
RPD series has been adjusted to remove discontinuities associated with changes in reserve requirement ratios
CONFIE NTIAL(FR)CLASS g-FOMC
12/12/75
N D
M J
1974

CONFIDENTIAL (FR)CLASS II-FOMC
12/12/75MONETARY AGGREGATES
NARROW MONEY SUPPLY M1 BILLIONS OF DOLLARS
- 00
.280
I 1J I I 260
CHART 2
A 01975
N 0

12/12/75
MONETARY AGGREGATES
ADJUSTED CREDIT PROXY BILLIONS OF DOLLARS
BILLIONS Of DOLLARS- 39
TOTAL
1974 1975Total and nonborrowed reserve series have been adjusted to remove discontinuities associated with changes in reserve requirement ratios
CHART 3
RESERVES

12/12/75
MONEY MARKET CONDITIONS AND INTEREST RATES
MONEY MARKET CONDITIONS PER CENT1 14
FUNDS
FR DISCOUNTRATE
INTEREST RATES Short-term
1974 1975
PER CENT
- 11
PER CENT
- 13
,L
- 11
CHART 4
1974 1975 1974 1875

CONFIDENTIAL (F.R.)CLASS II-FOMCTABLE 1
BANK RESERVES(ACTUAL AND CURRENT PROJECTIONS)
DEC. 12, 1975
RESERVES AVAILABLE AGGREGATE RESERVES EQUIRED RESERVES
___ _ _SEASONALLY ADJUSTEDFOR PRIVATE . T .
NONBANK DEPOSITS Total Nonborrowed Total Private Total Time Gov't. andSA NSA Reserves Reserves Required Demand Deposits Interbank
1 2 3 4 5 6 7 8
MONTHLY LEVELS-SMILLIONS
1975--SEPT.OCT.NOV.DEL.
PERCENT ANNUAL GROWTH
QUARTERLY
1975--2ND QTR.3RD OTR.4TH OTRe
QUARTERLY-AV
1975--2ND OTR.3RD OTR.4TH OTR.
MONTHLY
1975--SEPT.OCT*NOV.DEC.
WEEKLY LEVELS.
NOV.-DEC.
-1MTLL1NS
1975--NOV. 5
DEC. 310
32,42432,34532,486(32,598)
0.6-2.6
( 2 1)
-2.5-1.2
I 0.1)
0.6-2.9
5.24.1)
4.7)
32,92032,01632,42632,620
32,63532,531
32,24232,24732.498
132,812)
32996931,90532.54132,569
32,74832,389
34,32034,25734,607134,970)
1.2-2*
( 7.61
-3.7-0.8
( 2.6)
3.9-2 .212.312.6)
12.5)
34,97033,84234,70734,833
34,92434,637
33.92334,06734,547(34.910)
-0.2-4.2
( 11.6)
-2.8-2.8
( 5.0)
-2.65.1
16.9I 12.6)
1 14.8)
34,90333,80234,64834,759
34,65734,607
34,12934,050A4,324
(34,781)
1.2-2.1S 7.6)
-3.6-1.1
1 2.2)
4.1-2.89.7
( 16.0)
S12.9)
34,10633,830349t2234,621
34,59534,463
19.87019,62819,737
(19,852)
11.71.4
I -0.4)
8.05.7
I -2.0)
4.5-14.6
6.7( 7.0)
( 6.8)
19,62819,49619980419938
19,82719.832
12,36512,51012,466
(12,556)
-15.4-8.7
( 6.2)
-17.0-12.2
( 2.1)
-5.414.1-4.28.7)
2.2)
12,42812,50912,43712,470
12,48012,'26
1.8941.9122,121
f 2.373)
2,0491,825292812,213
2,2892,106
NOTE: RESERVE SERIES HAVE BEEN ADJUSTED TO REMOVE DISCONTINUITIES ASSOCIATED WITH CHANGES IN RESERVE REQUIREMENT RATIO.DATA SHOWN IN PARENTHESES ARE CURRENT PROJECTIONS. AT THE FOMC MEETING OF NOV. 18, 1975 THE COMMITTEE AGREED ON A RPORANGE OF 4.5 TO 8.5 PERCENT FOR THE NOV.-DEC. PERIOD.
- - --- ---------- "'

Table 2 CONFIDENTIAL (F R )CLASS II-FOMC
MONETARY AGGREGATES DEC. 12, 1975
ACTUAL AND CURRENT PROJECTIONS, SEASONALLY ADJUSTED
MONEY SUPPLY Adjusted U S TIME AND SAVINGS DEPOSITS NondepositPeriod Narrow Broad Credit Govt Other Sources of
(Ml) (M2) Proxy Deposits Total Than CD's CD's Funds
1 2 3 4 5 6 7 8
MDM1HLY LEVELS-S8ILLIONS
1975--SEPT. 294.7 656.3 505.8 3.1 440.7 361.7 79.1 7.0
OCT. 294.0 658.5 508.0 2.9 445.7 364.5 81.3 T.9NOV. 297.0 665.6 512.9 3.5 450.0 368.6 81.4 8.2
DEC. (297.51 (669.2) (516.11 ( 26) (454.4) (371.7) ( 82.7) ( 8.4)
PERCENT ANNUAL GROWTH
QUARTERLY
1975--ZND OTR. 11. 13.4 7.5 6.7 15.3 -25.4
3RD OTR. 2.3 6.3 -1.3 3.3 9.7 -23.84TH OTR. ( 3.8) ( 7.9) ( 8.1) 1 12.4) 1 11.1) 1 18.2)
QUARTERLY-AV
1975--2ND QTR. 8.6 11.2 5.2 5.2 13.3 -24.0
3RD QTR. 6.9 10.4 1.4 4.9 13.2 -29.34TH OTR. I 2.9) 1 6.7) ( 6.0) ( 9.9) I 9.9) ( 10.5)
MONTHLY
1975--SEPT. 2.0 4*8 6.7 9.1 7.7 16.9
OCT. -2*9 4.0 5.2 13.6 9.3 33.4
NOV. 1,.2 1:.9 11.6 11.6 13.5 1.5
DEC. ( 2.01 ( 6.51 ( 7.5) ( 11.7) I 10.1) 1 19.21
NOV.-OEC. ( 7.11) I .7) I 9.6) ( 11.7) ( 11.9) I 10.3)
WEEKLY LEV:LS-$BILLIONS
1975--OCT. 29 292.5 658.0 507.2 2.4 446.7 365.5 81.3 7.9
NOV. 5 296.1 662.0 510.2 3.0 446.9 365.9 81.0 8.0
12 298.0 665.7 513.1 3.9 448.7 367.7 80.9 7.9
19 296.4 664.9 513.5 3.9 449 368.5 81e2 8.6
26 P 296.7 666.8 514.1 3.3 451.6 370.0 81.5 8.5
DEL. 3 P 299.1 669.1 516.2 3.4 452.3 369.9 82*4 8.0
. - S - - . - S * - S
NOTI: DATA SHOWN IN PARENThESES ARE CURRENT PROJECtIONS. P - PRILIMINARYNOTt; DATA SHOWN IN PARENTHESES ARE CURRENT PROJECTlONS. P - PRELIMINARY

CONFIDENTIAL (FR)CLASS II- FOMC
DECEMBER 12, 1975
TABLE 3
RESERVE EFFECTS OFOPEN MARKET OPERATIONS AND OTHER RESERVE FACTORS(Millions of dollars, not seasonally adjusted)
Open Market Operations Daily Average Reserve Effects 6 In Reperve Catgories . .TargetBills Coupon Agency RP's Open Market A Member Other 4/ Req. res. against available res. 5/ available
Period 6 Accept. Issues Issues Net 3/ Total Operations Bank Borrowing Factors U.S.G. and interb. (6)+(7)+(8)-(9) reserves 5/
(1) (2) (3) (4) (5) (6) (7) (8) (9) (10) (11)
1975--May 197 50 -97 -3,357 -3,207 5,064 -50 -5,747 1 -734 -170June -413 958 -6 -1,855 -1,317 -3,165 211 3,438 -96 580 215
July -2,302 -- -2 -623 -2,926 -832 -10 553 167 -456 -325Aug. -371 274 313 1,007 1,222 -1,332 -50 1,210 -124 -48 -45Sept. 1,932 822 393 2,008 5,155 2,458 186 -2,432 98 114 10
Oct. 147 -- 284 15 445 1,276 -204p -1,135p 15 -78p 265Nov. -608 709 -1 -2,637 -2,537 521 -130p -327p 26p 38p 278Dec. 353
Jan.
1975--Oct. 1 435 -- 394 -1,092 -263 2,798 186 -2,157 61 7668 -240 - -- -5,806 -6.047 -2,763 -343 1,922 -86 -1,09815 -932 -- - 1,548 616 -1,935 -65 2,462 -65 52722 501 - -- 3,527 4,028 935 60 -1,112 236 -35329 690 -- 284 793 1,767 2,418 -138 -2,15
6p -422p
5 46p
Nov. 5 -85 -- -1 -7,526 -7,612 407 -28 -104p 200p
75p
12 -910 - -- 6,114 5,204 -4,580 -27 3,393p -150p -1,0
64p
19 23 355 -- 670 1,048 2,243 19 -1,301p 325p 636p
26 689 354 -- 3,216 4,259 2,995 15 -3,037p -55p
28p
Dec. 3 -202 - - -5,793 -5,994 -1,064 -7 1,207p -43p 179p10 -204 - -- -1,482 -1,686 -2,536 -37 2,152p -63p -358p172431
1/ Represents change in System's portfolio from end-of-period to end-of-period; includes redemptions in regular bill auctions.2/ Represents change in daily average level for preceeding period.3/ Ifcludes matched sale-purchase transactions as well as RP's.4/ Sum of changes in vault cash, currency in circulation, Treasury operations, F.A. float, gold and foreign accounts, and other F.R. accounts.5/ Reserves to support private nonbank deposits. Target change for November and December reflects the target adopted at the November 18, 1975 FOMC meeting.
Target change for previous months reflects the bluebook patterns that are consistent with target ranges that were adopted during the month.P - Preliminary.

CONFIDENTIAL (FR)CLASS II -- FOMC
DECEMBER 12, 1975
TABLE 4
NET CHANGES IN SYSTEM HOLDINGS OF SECURITIES 1/($ millions, not seasonally adjusted)
Treasury Coupons Federal Agencies Net ChangeNet Purchases 3/ Net urchases 4/ Outright
Treasury Bills Within Over Within Over Holdings RP'sPeriod Net Change 2/ 1-year 1- 5 5 - 10 10 Total 1-year 1 - 5 5 - 10 10 Total Total 5/ Net6/
1972 -490 87 789 539 167 1,582 46 592 253 168 1,059 1,631 -1,3581973 7,232 207 579 500 129 1,415 120 400 244 101 864 9,273 -461974 1,280 320 797 434 196 1,747 439 1,665 659 318 3,082 6,303 -154
1974--qtr.III 945 49 118 62 73 302 195 726 165 117 1,203 2,620 -986Qtr.IV -43 102 215 131 45 492 138 371 130 53 691 1,402 -238
1975--Qtr. I -2,093 33 1,054 625 312 2,024 69 169 285 61 584 508 53Qtr. II 1,086 218 1,135 454 273 2,079 - -- -2 -- -2 3,076 230Qtr. III -757 13 712 201 171 1,096 64 514 106 63 747 1,060 2,392
1975--June -352 20 650 180 109 958 - -- -- - -- 539 -1,855
July -2,305 - - - -- -- -- -- -- - - -2,304 -623Aug. -369 13 150 64 47 274 41 229 49 34 353 216 1,007Sept. 1,917 -- 562 137 124 822 23 285 57 29 394 3,148 2,008
Oct. 97 - -- - -- -- 58 141 71 14 284 430 15Nov. -588 43 267 156 244 709 - -- -- -- - 99 -2,637
1975--Oct. 1 413 -- -- - - -- 23 285 57 29 394 829 -1,0928 -239 - -- - -- - -- -- -- - - -240 -5,806
15 -926 - - -- -- -- -- -- - - - -932 1,54822 479 - -- - - - -- -- -- - -- 502 3,52729 671 - -- -- -- - 58 141 71 14 284 974 793
Nov. 5 -93 - - - -- -- -- -- -- - - -85 -7,52612 -882 - - -- -- -- -- - - - -- 910 6,11419 19 32 136 74 114 355 - -- - -- -- 378 67026 683 11 131 82 130 354 - -- -- - -- 1,043 3,216
Dec. 3 -200 - -- -- -- -- - - -- - -- -202 -5,79310 -200 -- -- - - - -- -- -- -- - -204 -1,482172431
Ij Change from end-of-period to end-of-period.2/ Outright transactions in market and with foreign accounts, and redemptions (-) in bill auctions.3/ Outright transactions in market and with foreign accounts and short-term notes acquired in exchange for maturing bills. Excludes maturity shifts,
rollovers of maturing coupon issues, and direct Treasury borrowings from the System.4/ Outright transactions in market and with foreign accounts only. Excludes redemptions and maturity shifts.5/ In addition to net purchases of securities, also reflects changes in System holdings of bankers' acceptances, direct Treasury borrowings from the
System, ahd redemptions (-) of Agency and Treasury coupon issues.6/ Includes changes in both RP's (+) and matched sale-purchase transactions (-).

TABLE 5
SECURITY DEALER POSITIONS AND BANK POSITIONS(millions of dollars)
CONFIDENTIAL (FR)CLASS II - FOMCDECEMBER 12, 1975
U.S. Govt. Security Member Bank Reserve PositionsDealer Positions Dealer Positions Borrowing at FRB** Basic Reserve Deficit
Corporate Municipal Excess**Period Bills Coupon Issues Bonds Bonds Reserves Total Seasonal 8 New York 38 Others
1974--HighLow
1975--HighLow
1974--Nov.Dec.
1975--Jan.Feb.Mar.
Apr.MayJune
JulyAug.Sept.
Oct.Nov.
1975--Oct.
Nov. 5121926
Dec. 310172431
NOTE:
(1)
3,678-289
7,0291,586
2,9002,985
2,5013,3293.143
2,7374,7445,201
4,2314,0205,008
5,766*4,571
4,6575,8127,0296,0375,085
4,9284,050
*4,765*4,616
*4,748*4,620
(2)
2,203-309
2,845253
1,6081,836
2,0502,1212,521
1,6171,7521,351
1,2461,204
588
1,480*2,073
462846
1,5761,8351,456
2,7512,585
*2,022*1,534
*1,281* 875
(5)
577-168
864-50
205258
147198195
143155201
188195191
207p283p
462-2431329p
286p
864p12p
185p212p
(6)
3,906647
87118
1,252727
39814796
11066
227
259211397
188p60p
5812381732 2
3p95p
67p
40p59p
74p
67p30p
(8)
-7,870-2,447
-7,387-1,757
-6,322-5,960
-5,378-6,318-5,732
-4,079-3,965-5,821
-5,546-3,964-3,551
-2,644
-4,488p
-2,575-2,663-3,475-2,236-2,206
-2,497-5,045-3,746-3,340
-3,459p
-4,055p
(9)
-12,826- 6,046
-11,664- 7,207
- 9,715
-10,169
- 9,744
- 9,533-10,302
-10,426- 9,567- 9,344
- 9,896- 9,966- 9,015
- 9,202
-10,055p
- 7,207- 9,923-10,042- 9,398- 7,661
- 8,868-11,632-10,635- 9,626
- 9,70
1p
-11,664p
** Monthly averages for excess reserves and borrowings are weighted averages of statement week figures.
Government security dealer trading positions are on a commitment basis. Trading positions, which exclude Treasury bills financed by repurchaseagreements maturing in 16 days or more, are indicators of dealer holdings for sale over the near-term. Other security dealer positions issuesstill in syndicate, excluding trading positions. The basic reserve deficit is excess reserves less borrowing at Federal Reserve less net Federalfunds purchases. Weekly data are daily averages for statement weeks, except for corporate and municipal issues in syndicate which are Friday figures.
- " - ~LIIIL L- i ~ - --- i--
* STRICTLY CONFIDENTIAL

STRICTLY CONFIDENTIAL (FR)CLASS II - FOMCDECEMBER 12, 1975
TABLE 6SELECTED INTEREST RATES
(Per Cent)
S Short-Term Long-Term
STreasury Bills 90-119 Day CD's New Issue-NYC Aaa Utility Municipal U.S. Government FNMA GNMA
Federal Commercial New Recently Bond (20-yr. Constant Auction Guaranteed
Period Funds 90-Day 1-year Paper 60-89 Day 190-119 Day Issue Offered Buyer Maturity) Yield Securities
1974-HighLow
1975--HighLow
1974--Nov.Dec.
1975-Jan.Feb.Mar.
Apr.MayJune
July
Aug.Sept.
Oct.Nov.Dec.
1975--Oct. 18152229
Nov. 5121926
Dec. 310172431
Daily--Dec. 411
(1)13.558.45
7.705.13
9.45
S8.53
7.136.245.54
5.495.225.55
6.106.146.24
5.825.22
6.366.065.825.735.65
5.175.245.245.28
5.255.26
(2)
9.636.53
6.685.02
7.47
7.15
6.265.505.49
5.615.235.34
6.136.446.42
5.965.48
(3)
9.546.39
7.315.46
7.296.79
6.275.565.70
6.405.915.86
6.647.167.20
6.486.07
7.266.886.616.376.18
5.875.866.106.23
6.246.44
5.61 6.395.56 6.38
(4)
12.257.88
8.435.38
8.959.18
7.396.366.06
6.115.705.67
6.326.596.79
6.355.78
(5)
12.258.00
7.885.25
8.789.00
7.436.005.88
5.855.445.34
6.056.316.44
6.085.69
(6)
12.007.88
7.755.38
8.728.84
7.456.256.03
6.035.635.51
6.256.636.81
6.456.03
7.006.756.386.006.13
6.136.00
6.006.00
6.136.00
(7)
10.618.05
9.808.89
9.219.53
9.368.979.35
9.679.639.20
9.429.459.68
9.459.20
9.729.609.539.329.22
9.109.119.40
9.46
9.37p
(5)
10.528.14
9.719.06
9.34
9.56
9.459.099.38
9.669.659.33
9.439.499.57
9.439.26
9.709.569.419.309.33
9.249.249.309.25
9.349.27p
(9)
7.155.16
7.676.27
6.617.05
6.826.396.74
6.946.976.94
7.067.177.44
7.397.43
(10)
8.687.40
8.637.63
7.997.91
7.887.717.99
8.368.228.04
8.178.508.57
8.358.28
8.598.438.348.268.22
8.198.228.348.35
8.348.
39p
8.32n.d.
111)
10.598.43
9.958.78
9.879.53
9.258.938.82
9.069.279.09
9.149.419.78
9.809.80
9.95
9.65
9.32
9.33
9.32
9.987.79
9.107.93
8.718.62
8.488.038.09
8.488.518.34
8.508.758.97
8.878.50
NOTE: Weekly data for columns 1 to 4 are statement week averages of daily data. Columns 5 and 6 are one-day Wednesday quotes. For columns 7, B, and 10,
the weekly date is the mid-point of the calendar week over which data are averaged. Column 9 is a one-day quote for Thursday following the end of
the statement week. Column 11 gives FNMA auction data for the Monday preceding the end of the statement week. Column 12 is a one-day quote for
the Monday preceding the end of the statement week. The FNMA auction yield is the average yield in bi-weekly auction for short-term forward
commitments for Government underwritten mortgages. GNMA yields are average net yields to investors on mortgage-backed securities for immediate
delivery, assuming prepayment in 12 years on pools of 30-year FRA/VA mortgages carrying the prevailing ceiling rate.

APPENDIX TABLE 1-A
MONEY AND CREDIT AGGREGATE MEASURESDEC. 12, 1975
SRESER S BANK CREDIT MONEY STOCKRESERVES MEASURES MEASURESAvailable Total
Period Non- to AdJ LoansTotal orow Support Credit and M1 M2 M3 M4 M5 M6 M7borrowed Pvt proxy Invest
Deposits ments
ANNUALLY:
197219731974
SEMI-ANNUALLY:
1ST HALF 19742ND HALF 1974
1ST HALF 1975
QUARTERLY:
LTH OTRe 1974
1ST QTR. 1975
2ND OTR. 19753RO OTR. 1975
OUARTERLY-AV:
4TH QTR. 1074
1ST OTR. 19752NO QTR. 19753RD QTR. 1975
MONTHLY:
1974--NOV.DEC.
1975--JAN.FEB.MAR.APR.MAY
JUNEJULYAUG.SEPT.OCT. PNOV. P
NOTES:
1 2 3
10.87.9ft.5
10.90 .o
-3.6
3.6
-8.41.2
-2.2
1.4
-0.9-3.7-0.8
-1.415.4
7.9-27.3
-5.68.2
-14.710.3
4.1-14.6
3.9-2.212.3
7*47.3
10.7
0.321.1
-0.7
36.4
-1.3-0.2-4.2
27.5
11.6-2.8-2.8
19.034.8
19.5-19.0
-4.18.1
-13.24.71.
-11.5
5*116.9
10.19.28.9
12.69 .0
-2.1
0.9
-4.70.6
- .6
2.6
-1.4-2.5-1.2
-2.56.6
0.0-8.6
2.9-10.3
9.1-2.1-6.1
0.6-2.95.2
4 5 6(Per cent annual rates of growth)
11.3 14.6 8.7 1110.4 13.5 h 1
9.2
15.03.1
5.1
-1.0
5.74.63.6
0.2
1.05.14.1
5.0-9.4
4.74.37.93.45.15.12.0
6.82.06.0
10.5
6:63.1
b6.0
0.3
a.a11.2
2.3
3.9
-0.38.60o.9
8.53.4
-11.3.4
11.03.4
11.318.7
2.0Z.92.0
-2.912.2
10.2
14.55.4
5.3
4.2
3.17.5
-1.3
3.5
4.15.21.4
5.27.6
3.6-0.2
5085.12.4
15.1-1.2-5.5
6.75.2
11.6
7 8 9 10 11 12
13.28.56.8
7.95.4
13.0
6.Q
9.9
58
7.813.813.2
7.75.
5.69.9
13.911.714.919.812.2
9.47.87.2
12.5
12.511.610.6
13.37.5
7.5
9.0
6.38.62.9
7.3
7.46.65.6
5.711.4
6.76.16.14.27.0
14.34.1
-1.56.17.2
11.7
14.010.6
9.0
10.96.7
12.37.4
6.6
8.810.6
9.9
6.210.8
7.98.2
10.29.2
10.716.7
9.14.48.49.0
11.7
6.8
8.09.99.6
5.89.4
8.27.0
8.29.6
10.016.3
9.23.78.18.2
10.7
12.911.9
0.9
11.06.5
9.9
6.b
7.611.9
6.2
ADJUSTED CREDIT PROXY INCLUDES MAINLY TOTAL MEMBER BANK DEPOSITS SUBJECT TO RESERVE REQUIREMENTS, LOANS SOLD 10 BANK-
RLLATED INSTITUTIONS, AND EURODOLLAR BORROWINGS OF U.S.BANKS. WEEKLY DATA ARE DAILY AVERAGES FOR STATEMENT WEEKS. MONTHLYDATA ARE DAILY AVLRAGES. WEEKLY DATA ARE NOT AVAILABLE FOR M3, M5, M6, M7, TOTAL LOANS AND INVESTMENTS AND THRIFT INSTITU-
, M7,TOTAL LOANS AND INVESTMENTS AND THRIFT INSTITUTION DEPOSITS.BASED ON DATA ADJUSTED FOR CHANGES IN RESERVE REQUIREMENTS.PRELIMINARY
- " " "
]

APPENDIX TABLE 1-B
MONEY AND CREDIT AGGREGATE MEASURESSEASONALLY ADJUSTED, BILLIONS OF DOLLARS
DEC. 12, 1975
RESERVU BANK CREDIT MONEY STOCKRESERVES MEASURES MEASURES
Available TotalPeriod Non to Adl Loans
Total borr Support Credit and MI M2 M3 M 4 MS M 6 M7borrowed Pvt proxy Invest
Deposits ments
ANNUALL:
19721973
MONTHLY:
1974--NOV.DEC.
175--JAN.FEB.MAR.
APR.MAYJUNE
JULYAUG.SEPT.
OCT. PNOV. P
WEEKLY:
1975--OCT. 8122P29P
NOV. 5P12P19P26P
DEC. 3P
1 2 3 4 5 6 7
30,01632,377
34,69335,138
35,36834,56434,404
34,64034,21634,510
34,62834,2034,320
34,25734,607
33,94534,31234,15334,320
34,97033,84234,70734,833
34,924
28,96631,078
33,44134,411
34,97034,41734,298
34,53034,15034,e83
34,32633,99633,923
34,06734,547
33,70634,13933,92034,225
34,90333,80234,64834,759
34,857
27,73430,272
32,79r,32,075
32,97432,73932,588
32,66832,38832,633
32,57532,40932,424
32.34532,486
32,08732,50032,05132,518
32,92032,01632,42632.620
3L.635
406.4448.7
491.2494.3
495.8495.7498.1
500.2501.2507.5
505.3503.0505.8
508.0512.9
506.9507.9508.7507.2
510.2513.1513.5514.1
516.2
559.0634.6
697.4691.9
694.6697.1701.7
703.7706.7709.7
710.9714.e716.1
719.7726.0
255.8271.5
2B3.6284.4
281.6282.4285.0
285.8288.5293.0
293.5294.2£94.7
294.0297.0
293.4294.7294.3292.5
Z96.1298.0296.4296.7
299.1
525.7572.2
611.6613.5
614.8619.162 .1
628.9635.96.6.1
6,0.5653.7656.3
658.5665.6
656.3659.1659.0658.0
662.0665.7664.9666.8
669.1
844.9919.6
976 .9981.7
986.3994.4
1005.9
1015.71028.31045.3
1055.91064.21071.1
1077.51088.7
9 10 11 12
569.7636.0
697.1703.7
707.6711.2714.8
717.3721.5730.1
732.6731.7735.4
739.8747.0
737.9740.5
740.0739.3
743.0746.7746.2748.3
751.4
888.8963.4
1062.41072.0
1079.11086.51095.7
1104.11113.91129.4
1138.01142.21150.2
1158.81170.1
985.51095.4
1185.81195.1
1203.31210.31218.6
1228.31238.51255.3
1264.01268.81277.4
1286.11297.6
1013.11133.6
1227.21234.7
1242.41249.51258.3
1268.31278.71295.6
1305.11308.31315.8
1323.81334.3
NOTES: ADJUSTED CREDIT PROXY INCLUDES MAINLY TOTAL MEMBER BANK DEPOSITS SUBJECT TO RESERVE REQUIREMENTS, LOANS SOLD TO BANK-RELATED INSTITUTIONS, AND EURODOLLAR BORROWINGS OF U.S.BANKS. WEEKLY DATA AKE DAILY AVERAGES FOR STATEMENT WEEKS. MONTHLYDATA ARE DAILY AVERAGES. WEEKLY DATA ARE NOT AVAILABLE FOR M3, MS, M6, M7, TOTAL LOANS AND INVESTMENTS AND THRIFT INSTITU-TION DEPOSIT .
1/ ESTIMATED MONTHLY AVERAGE LEVELS nERIVED BY AVERAGING END OF CURRENT MONTH AND END OF PREVIOUS MONTH REPORTED DATA.P - PRELIMINARY

APPENDIX TABLE 2-A DEC. 12, 1975
COMPONENTS OF MONEY STOCK AND RELATED MEASURES
Time Mutual ShortPerod u Demand Tl ther Savings Cred Savings Term CommercialPerDeaposits Te Than Bank Union CD's Bonds U S Gov'tCu c Deposits CD's and S & L Shares S e curities per
SSharesi y1 2 3 4 5 6 7 8 9 10
ANNUALLY:
107219731974
SEMI-ANNUALLY:
IST HALF 19742ND HALF 1974.
LST HALF 1975
QUARTERLY:
4TH OTR. 1974
1ST QTR. 19752NO OTR. 19753RD QTR. 197T
QUARTtRLY-AV:
47H OTR. 1974
1ST OTR* 1975,
2ND QTR. 19753RD OTR. 1975
MONTHLY:
1974--NOV.DEC.
1975--JAN.FEB.MAR.APR.MAYJUNEJULYAUG.SEPT.OCT. PNOV. P
6.95,.53.1
5.21.0
5.0
3.11
-1.711.7
1.4
1.7
-3.38.66.6
5.61.7
-17.21.7
10.73.9
11.119.8
1.11.12.2
-6.511 .
15.716.215.0
18.610.5
8.5
11.6
10.16,73.3
9.7
12.75.24.9
4.116.8
19.27.93.14.53.9
11.65.5
-4.69.1
13.611.6
(Per cent annual
13.5 16.711.4 8.59.4 5.o
10.9 5.97.6 '.1
14.6 16.3
7.9 6.9
13.4 13.115.3 18.9
9.7 15.5
8.2 4.9
11.0 10.813.3 17,613.2 17.6
7.7 7.14.0 9 e
14.9 9.912.6 11.5IL.1 17.610.6 18.415. 1 7.119.7 20.213.3 18.98.1 14.77.7 12.39.3 11.6
13.5 11.2
rates of growth)
18.0 3113.9 4511.8 41
1 r:.0 54
12.0
,0.42j.517.0
10.o
17.6L2 5'
e0.0
13.413.2
17.517.2
O0.d
Z0.',28.115.719.4
18.818.5
.0
.3
.5
-0
22.1
-13.7
25.9
-2.2-25'.-23 .8
15.2
19.2-24.0-29.3
-9.767.4
31.9-7.9
-30.0-18.7-39.4-19.6-28.5-59.9
16.933.4
1.5
0.530.915.7
19.211.2
3.0
4.0
-7.313.5
1.3
10 .
-3.32.06.6
-2.0-9,
15.9-15.7-21.9
20.30.0
19.911.8
-11.73.9
-5.9-3 .9
1 __ 1. . .& _______ I I I '
NOTES: RESERVE REQUIREMENTS ON EURODOLLARCOMMERCIAL PAPER ARE INCLUDED BEGIN
1/ GPUWTH RATES ARE BASED ON ESTIMATEOPREVIOUS MONTH RhPOR1EU DATA.
P - PRELIMINARY.
15.038.A
3.t
12e.-5.4
3.5
-34.2
1.06.0
-16.9
-9.4
-20.28.1
-9.0
-'5.3-52.2
-1".26.1
12.29.16.03.0
-3.0-23.9-30.5-21.9-28.6
BORROWINGS ARe INCLUDED BEGINNING OCTOBER 16, 1969, AND REQUIREMENTS ON BANK-RELATEDINING OCTOBER 1, 1970.
MONTHLY AVFRAGE LEVELS DERIV C 4Y AVERAGING END OF CURRENT MONTH AND END OF
DEC. 12, 1975
APPENDIX TABLE 2-B
COMPONENTS OF MONEY STOCK AND RELATED MEASURES
Time Mutual Shortemand Total Other Savings Credit Savings Term Non- U.S.
Period Currency Deposits Time Than ank Vnion CD's Bonds .S Co mmercia deposit Gov'tDeposits CD's and & L Shares SecuresJ Paery Funds Demand
as3 4 5 6 7 8 9 1 11 121 2 3 4 5 6 7 8 9 10 11 12
ANNUALLY:
19721973
MONTHLY:
1974--OCT.NOV.DEC.
1975--JAN.FEB.MAR.
APR.MAY
JUNE
JULYAUG.SEPT.
OCT. P
NOV. P
WEEKLY:
1975--OCT. 81522P29P
NOV. 5P
I2P19P26P
DEC. 3P
56.961.6
66.*67.467.9
68.266.769.4
69.570.e71.1
71.471.972.0
72.673.3
72.572.672.572.7
72.873.373.473.4
73.9
190.9209.9
215.2216.2216.5
213.4213.7215.6
216.3218.3241.9
222.1222.3222.7
221.5223.7
221.0222.1221.9219.9
223.3224.7223.0223.3
225.s
313.8304.5
412.1413.5419.3
446.0448.8429.9
431.5432.9437.1
439.1437.4440.7
445.7450.0
444.5445.8445.7446.7
446.9448.7449.8451.6
452.3
269.9300.7
325.9328.0329.1
333.2336.7340.1
343.1347.4353.1
357.0359.4361.7
364.5368.6
36,.9364.43b4.6
365.5
365.9367.7368.5370,0
369.9
297.5322.8
336.2338.2340.8
343.o346.9352.0
357.4362.5368.6
374.4379.0382.9
366.o390.2
21.624.6
i6.927.217.
L7.928.328.9
29.429.930.b
31.031.531.v
32.432.9
43.963.8
86.285.590.3
92.792.189.b
88.485.584.1
82.178d*079.1
81.3b1.4
81.681.481.081.3
61.080.981.281.5
82.4
57.059.9
62.362.662.8
63.263.563.8
64.164.464.7
65.165.465.8
66.266.6
39.852.1
60.960.860.3
61.160.359.2
60.260.261c2
61.861.261.4
61.160.9
27.o38.3
43.441.4
39.6
39.139.339e7
40.040.240.3
40.239.438.4
37.736.8
- - - - . - . - . - . - . . - . - . - . - . -
RESERVE RGUIREMENIS ON EURODOLLAR BORROWINGS ARE INCLUDED BEbINNINGCOMMERCIAL PAPER ARE INCLUDED BEGGINNING OCTOBER 1, 1970.ESTIMATED MONTHLY AVERAGE LEVELS DERIVED BY AVERAGING kNb OF CURRENTDATA.PRELIMINARY
OCTOBER 16, 1969, AND REQUIREMENTS ON BANK-RELATED
MONTH AND END OF PREVIOUS MONTH REPORTED DATA.
NOTES:
1/
P -
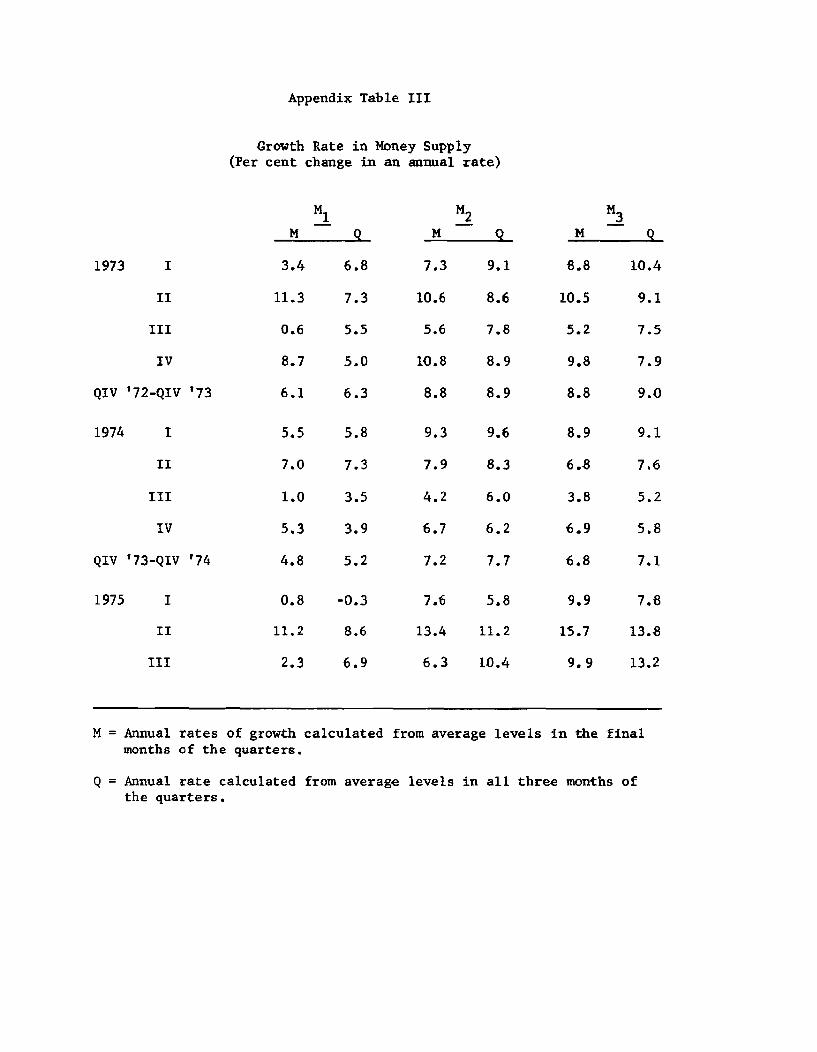
Appendix Table III
Growth Rate in Money Supply(Per cent change in an annual rate)
1973 I
II
III
IV
QIV '72-QIV '73
1974 I
II
III
IV
QIV '73-QIV '74
1975
M 1
M Q
3.4 6.8
11.3 7.3
0.6 5.5
8.7 5.0
6.1 6.3
0.8
11.2
2.3
5.8
7.3
3.5
3.9
5.2
-0.3
8.6
6.9
M2M 9.
7.3 9.1
10.6
5.6
10.8
8.8
9.3
7.9
4.2
6.7
7.2
7.6
13.4
6.3
8.6
7.8
8.9
8.9
9.6
8.3
6.0
6.2
7.7
5.8
11.2
10.4
M3M 9
8.8 10.4
10.5 9.1
5.2 7.5
9.8 7.9
8.8 9.0
8.9
6.8
3.8
6.9
6.8
9.9
15.7
9.9
9.1
7.6
5.2
5.8
7.1
7.8
13.8
13.2
M = Annual rates of growth calculatedmonths of the quarters.
from average levels in the final
Q = Annual rate calculated from average levels in all three months ofthe quarters.

Appendix Table IV
Projected Federal Funds Rates
Alt. A Alt. B
5-3/8 5-3/8
5% 5%
6% 6%
7% 7
1975 QIV
1976 QI
QII
QIII
Alt. C
5-3/8
6
6
6

Appendix Table V
Preliminary Revised Seasonal Factors on Demand Depositsand Effects on M 1 Growth Rates
Old factors
103.599.099.0
100.997.999.1
99.5598.499.2
98.8100.5103.1
New factors
Effect on Mgrowth (at11
annual rate)-
103.198.799.0
100.997.999.5
99.898.499.2
99.6100.6103.3
5.5-0.4-3.4
0.40
-4.1
2.12.0-- m
1.5-3.2-1.2
1/ Includes effect of currency seasonals.
JanuaryFebruaryMarch
AprilMayJune
JulyAugustSeptember
OctoberNovemberDecember