Fomc 19741119 Gb Sup 19741115
24
Prefatory Note The attached document represents the most complete and accurate version available based on original copies culled from the files of the FOMC Secretariat at the Board of Governors of the Federal Reserve System. This electronic document was created through a comprehensive digitization process which included identifying the best- preserved paper copies, scanning those copies, 1 and then making the scanned versions text-searchable. 2 Though a stringent quality assurance process was employed, some imperfections may remain. Please note that some material may have been redacted from this document if that material was received on a confidential basis. Redacted material is indicated by occasional gaps in the text or by gray boxes around non-text content. All redacted passages are exempt from disclosure under applicable provisions of the Freedom of Information Act. 1 In some cases, original copies needed to be photocopied before being scanned into electronic format. All scanned images were deskewed (to remove the effects of printer- and scanner-introduced tilting) and lightly cleaned (to remove dark spots caused by staple holes, hole punches, and other blemishes caused after initial printing). 2 A two-step process was used. An advanced optical character recognition computer program (OCR) first created electronic text from the document image. Where the OCR results were inconclusive, staff checked and corrected the text as necessary. Please note that the numbers and text in charts and tables were not reliably recognized by the OCR process and were not checked or corrected by staff. Content last modified 6/05/2009.
-
Upload
fraser-federal-reserve-archive -
Category
Documents
-
view
220 -
download
0
Transcript of Fomc 19741119 Gb Sup 19741115

Prefatory Note The attached document represents the most complete and accurate version available based on original copies culled from the files of the FOMC Secretariat at the Board of Governors of the Federal Reserve System. This electronic document was created through a comprehensive digitization process which included identifying the best-preserved paper copies, scanning those copies,1
and then making the scanned versions text-searchable.2
Though a stringent quality assurance process was employed, some imperfections may remain. Please note that some material may have been redacted from this document if that material was received on a confidential basis. Redacted material is indicated by occasional gaps in the text or by gray boxes around non-text content. All redacted passages are exempt from disclosure under applicable provisions of the Freedom of Information Act. 1 In some cases, original copies needed to be photocopied before being scanned into electronic format. All scanned images were deskewed (to remove the effects of printer- and scanner-introduced tilting) and lightly cleaned (to remove dark spots caused by staple holes, hole punches, and other blemishes caused after initial printing). 2 A two-step process was used. An advanced optical character recognition computer program (OCR) first created electronic text from the document image. Where the OCR results were inconclusive, staff checked and corrected the text as necessary. Please note that the numbers and text in charts and tables were not reliably recognized by the OCR process and were not checked or corrected by staff.
Content last modified 6/05/2009.
CONFIDENTIAL (FR)
SUPPLEMENT
CURRENT ECONOMIC AND FINANCIAL CONDITIONS
Prepared for theFederal Open Market Committee
November 15, 1974
By the StaffBoard of Governors
of the Federal Reserve System
SUPPLEMENTAL NOTES
The Domestic Economy
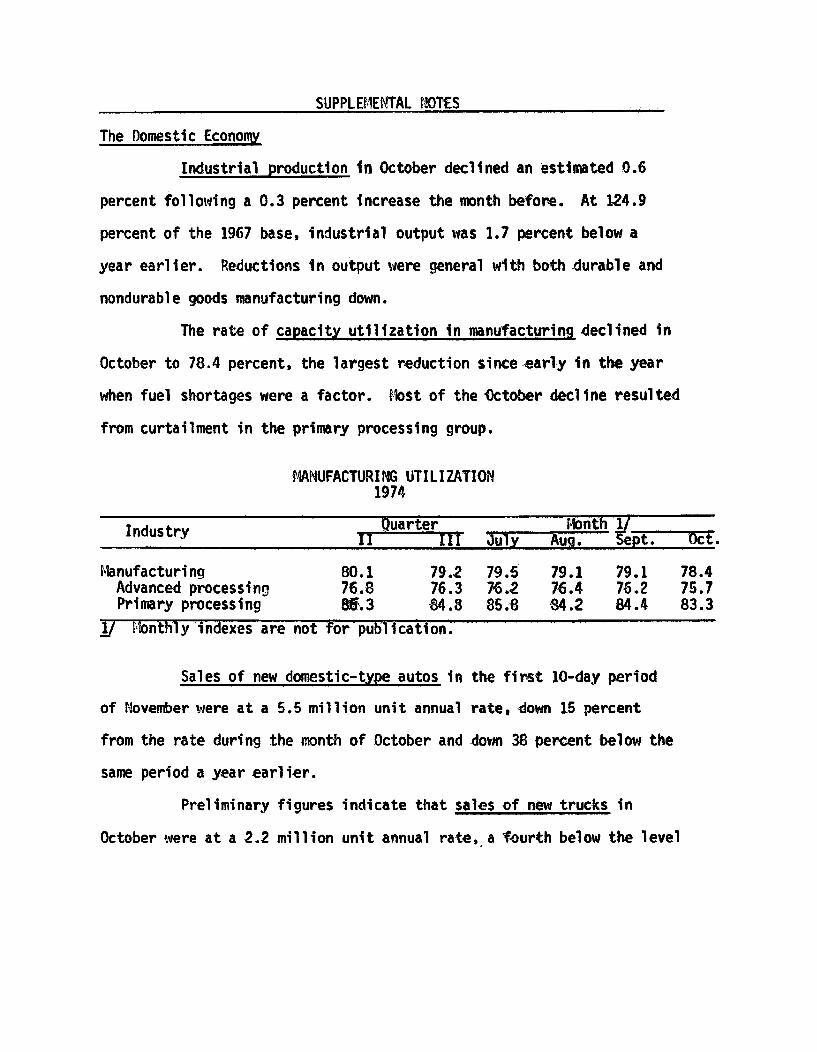
Industrial production in October declined an estimated 0.6
percent following a 0.3 percent increase the month before. At 124.9
percent of the 1967 base, industrial output was 1.7 percent below a
year earlier. Reductions in output were general with both durable and
nondurable goods manufacturing down.
The rate of capacity utilization in manufacturing declined in
October to 78.4 percent, the largest reduction since early in the year
when fuel shortages were a factor. Most of the October decline resulted
from curtailment in the primary processing group.
MANUFACTURING UTILIZATION1974
Industry Quarter MonthII III July Aug. Sept. Oct.
Manufacturing 80.1 79.2 79.5 79.1 79.1 78.4Advanced processing 76.8 76.3 76.2 76.4 76.2 75.7Primary processing 86.3 84.8 85.8 84.2 84.4 83.3
1 Monthly indexes are not for publication.
Sales of new domestic-type autos in the first 10-day period
of November were at a 5.5 million unit annual rate, down 15 percent
from the rate during the month of October and down 38 percent below the
same period a year earlier.
Preliminary figures indicate that sales of new trucks in
October were at a 2.2 million unit annual rate, a fourth below the level

-2-
of September and a fifth below October 1973. Stocks rose 15 percent
above the advanced September level.
Despite some improvement from August to September, merchant
builder sales of new single-family homes for the third quarter as a
whole were at the lowest average for any quarter in four years. Builder
backlogs of unsold homes at the end of the period remained quite large,
representing nearly 101 months' supply at the September sales rate.
The median price of the mix of homes sold in September--$36,900--was
more than a tenth above a year earlier and continued above the rising
median price of units for sale.
SALES, STOCKS AND PRICES OF NEW SINGLE FAMILY HOMES
Homes Homes Months' Median price of:sold 1/ for sale 2/ supply Homes sold Homes for sale
(thousands of units) (thousands of dollars)
1973
QI 726 426 7.0 30.4 29.4QII 680 436 7.7 32.7 31.2QIII 566 453 9.6 33.5 32.1QIV 483 446 11.1 34.0 32.9
1974
QI 525 453 10.4 35.2 34.0QII 567 435 9.2 35.6 35.0QIII 480 415 10.4 36.4 35.7
June (r) 532 435 9.8 35.1 35.0July (r) 507 431 10.2 36.8 35.3Aug. (r) 456 433 11.4 35.6 35.5Sept.(p) 478 415 10.4 36.9 35.71/ Seasonally adjusted annual rate.2/ Seasonally adjusted, end of period.

-3 -
Book value of retail trade inventories rose at a $14.7
billion annual rate in September following a $10.3 billion August rate.
The third quarter average annual rate of growth of retail trade inven-
tories was $12.2 billion, above the second quarter rate of $7.3 billion.
The annual growth rate of book value of wholesale trade inventories
was $7.1 billion in September, up from the $6.4 billion August growth
rate. The wholesale trade third quarter annual rate was $7.8 billion,
slightly above the second quarter rate.
For manufacturing and trade the annual rate of increase in
book value of inventories was $53.8 billion in September, somewhat
above the August rate. The third quarter rate increase of $55.4
billion was considerably above the second quarter rate of $43.2 billion.
The manufacturing and trade inventory-sales ratio rose in September to
1.50 from the August ratio of 1.47.
Personal income increased $8.4 billion to $1186.4, seasonally
adjusted in October following an upward revised $10.8 billion gain in
September. The income level was 8.8 percent above a year earlier.
Wage and salary disbursement rose $5.7 billion with the
increase evenly spread between the private and government sector where
Federal employees received a 5.5 percent pay raise in October. Growth
in manufacturing payrolls slowed somewhat in October as the work
force was reduced. Compared to a year ago, wage and salary disbursements
were also up 8.8 percent.
Total agricultural income declined a half of a percent in
October after showing little change in September.

- 4 -
PERSONAL INCOME(Billions of dollars; seasonal
at annual rates)
October1974
Total personal income 1186.4Wage and salary disbursements 773.4
Government 162.8Private 610.6Manufacturing 219.5Other 391.1
Nonwage income 461.9Less: Personal contribution for
social insurance 48.9
Addenda:Total nonagricultural incomeTotal agricultural income
1146.340.1
ly adjusted
September 1974-October 1974
8.45.72.92.81.71.13.0
.3
8.9- .5
Gross national product in the third quarter, according to
revised estimates, rose $31.6 billion to $1415.4 billion seasonally
adjusted annual rate. (The preliminary figures had shown a $27.8
billion rise). In real terms GNP is now indicated to have declined
at a 2.1 percent annual rate (instead of 2.9 percent). GNP prices
as measured by the implicit price deflator are now indicated to have
risen at 11.8 percent annual rate, slightly more than previously
indicated and the gross private products fixed weighted price index
slightly less at 13.8 percent per year.

-5-
The revised figures in contrast to the previous ones show
a smaller rise in business fixed investment which was more than
offset by a smaller decline in inventory investment and a larger rise
in Federal Government purchases of goods and services. (Table attached)
Corporate profits before tax for the third quarter (preliminary)
are now estimated at $158.4 billion seasonally adjusted annual rate, up
$19.4 billion or 14 percent from the second quarter. Excluding inven-
tory valuation profits, they are up only $1.1 billion or 1 percent
from the second quarter. Copporate profits before tax figures for the
first and second quarters of this year have been revised to take account
of effects on reported profits of a number of firms' shifting from FIFO
to LIFO accounting valuation methods. The net effect of these
revisions has been to reduce the gains and the levels earlier reported
for these two quarters.
The coal bargainers November 13 tentatively agreed on a new
three-year contract which provides significant increases in wages
and benefits and improvements in safety and working conditions. The
new agreement must be voted on by the 120,000 rank and file miners--
a process which will take about ten days--but United Mine Workers
officials expect the union will accept the new package ending the
current strike after about two weeks of shutdown.

-6 -
The new settlement provides wage increases totaling a
minimum of 15 percent over the life of the contract--9 percent in
the first year--and a one time $80 inflation catch-up bonus which
will also be effective in the first year. The miners will be newly
covered by a cost-of-living escalator which has a ceiling of 8 per-
cent a year. The escalator formula provides about .8 to .9 percentage
increase in wages for each 1 percent rise in the CPI.
Fringe benefits will increase substantially: funding of the
UMW Retirement Fund by mine operators will almost double over the
life of the contract and pension payments will increase from a present
minimum of $150 a month to a minimum of $250 a month. Paid days off
will total 30 days including paid sick leave--10 more days than under
the old contract, and benefits for disabled miners will be raised
substantially.
The noneconomic package provides many of the items the
union had sought: safety standards and job training will receive
increased emphasis and work rules will be changed in such a way as
to create about 8,000 jobs immediately. Although the coal operators
did not secure their objective of guarantees of fewer wildcat strikes,
industry representatives predicted the new pact would improve labor
management relationships.

-7
The wholesale price index for October rose 2.3 percent,
seasonally adjusted (not at an annual rate), to a level 22.6 percent
above a year earlier.
The index of farm and food products increased 4.7 percent,
seasonally adjusted, with most of the advance accounted for by higher
prices for manufactured animal feeds, grains, fluid milk, and soybeans.
The index of industrial commodities rose 1.1 percent, seasonally
adjusted, about at the same rate as in September. Although the increases
for each of the last two months are less than those for any of the
previous ten months, these increases are exceptionally large. The
October rise reflected mainly the higher prices for motor vehicles and
equipment, machinery and equipment, chemicals and allied products,
and fuels and power. Lumber and wood products declined for the sixth
consecutive month. Also lower were prices of textile products and
hides and leather.
WHOLESALE PRICES(Percent changes at seasonally adjusted
compound annual rates)1/
Oct.73 Dec. 72 June 73 Dec.73 June 74 Sept.74to to to to to to
Oct.74 June 73 Dec.73 June 74 Sept.74 Oct.74
All commodities 22.6 20.2 10.9 18.2 35.2 27.9
Farm and food products 10.6 45.8 10.4 -11.5 59.2 56.8
Industrial commodities 28.2 10.6 10.9 34.0 28.3 13.4Crude materials 39.0 23.0 40.4 44.3 29.1 -5.2Intermediate materials 31.4 12.2 11.7 38.0 32.2 12.6Finished goods 21.9 6.3 7.1 24.5 22.7 23.5Producer 21.4 5.4 5.3 20.0 31.8 29.1Consumer, excl. food 22.0 6.7 8.1 26.8 18.5 20.8Nondurable, excl. foods 27.1 8.5 11.3 35.6 19.1 15.6Durable 14.1 4.5 2.8 13.2 15.6 37.0
Consumer finished foods 11.3 27.0 18.5 -1.1 29.4 47.5Note: Farm and food products include farm products and processed foods and feeds.1/ Not compounded for one-month changes.

- 8 -
The Domestic Financial Situation
Mortgage market. According to the HUD (FHA) opinion survey,
average interest rates on new commitments for conventional new-and
existing home mortgages in the primary market fell 10 basis points
during October to 9.70 percent--the first decline in these rates
since February. Private secondary market yields on FHA-insured new-
home mortgages fell 25 basis points to 10.13 percent. Such movements
are consistent with the FHLMC series on primary market rates and FNMA
secondary market auction yields cited in the Greenbook.
AVERAGE RATES AND YIELDS ON NEW-HOME MORTGAGES(HUD-FHA Field Office Opinion Survey)
Primary market Secondary market 1/Conventional loans FHA-insured loans
End of Month Level 2/ Spread 4/ Level 3/ Spread 4/ Discounts(percent) (basis points) (percent) (basis points) (points)
1973 - Low 7.70 (Jan.) 30 (Jan.) 7.55 (Jan.) 15 (Jan.) 2.2 (Dec.)High 8.95 (Sept.) 114 (Sept.) 9.18 (Sept.) 137 (Sept.) 9.4 (July)
1974 - Jan. 8.65 40 -Feb. 8.55 45 8.54 44 2.3Mar. 8.60 - 4 8.66 2 3.2Apr. 8.90 - 3 9.17 19 5.1May 9.15 6 9.46 37 5.3June 9.25 -25 9.46 - 4 5.3July 9.40 n.a. 9.85 n.a. 6.3Aug. 9.60 -39 10.30 31 5.8Sept. 9.80 -66 10.38 - 8 6.3Oct. 9.70 -33 10.13 10 4.6
1/ Any gaps in data are due to periods of adjustment to changes in maximum per-missible contract rates on FHA-insured loans.
2/ Average contract rate (excluding fees or points) on commitments for con-ventional first mortgage loans, rounded to the nearest 5 basis points.
3/ Average gross yield (before deducting servicing costs) to investors on 30-yearminimum-downpayment FHA-insured first mortgages for immediate delivery in theprivate secondary market (excluding FNMA), assuming prepayment in 15 years.
4/ Average gross mortgage rate or yield minus average yield on new issues ofAaa utility bonds in the last week of the month.

-9-
INTEREST RATES
1974
Highs Lows Oct. 15 Nov.14
Short-Term Rates
Federal funds (wkly. avg.)
3-monthTreasury bills(bid)Comm. paper (90-119 day)Bankers' acceptancesEuro-dollarsCD's (NYC) 90-119 dayMost often quoted new
6-monthTreasury bills (bid)Comm. paper (4-6 mo.)Federal agenciesCD's (NYC) 180-269 dayMost often quoted new
1-yearTreasury bills (bid)Federal agenciesCD's (NYC)Most often quoted new
Prime municipals
Intermediate and Long-Term
Treasury coupon issues5-years20-years
CorporateSeasoned Aaa
Baa
New Issue Aaa Utility
MunicipalBond Buyer Index
Mortgage--average yieldin FNMA auction
13.55(7/3)
9.74(8/23)12.25(7/17)12.50(8/15)14.38(7/16)
12.00( 9/4)
9.86(8/23)12.13(7/10)10.63(8/28)
11.90(8/21)
9.65(8/23)10.18(8/26)
9.75(7/17)6.50(7/12)
8.79(8/23)8.72(8/26)
9.40(10/8)10.40(10/1)
10.61(10/2)
6.95(7/10)
8.81(2/27)
6.93( 2/6)7.75(2/22)7.75(2/26)8.25(2/18)
7.88(2/20)
6.80(2/19)7.50(2/22)7.16(2/19)
7.50(2/27)
6.37(2/15)7.01(2/19)
7.00(2/27)3.70(2/15)
6.72(2/14)7.40( 1/4)
7.73( 1/2)8.54( 1/2)
8.05(2/13)
5.16( 2/6)
10.59(9/9) 8.43(2/25)
10.11(8/16)
7.749.509.50
11.19
9.25(8/16)
7.929.388.38
9.00(8/16)
7.708.57
9.37(11/13)
7.178.888.9510.19
8.63(11/13)
7.358.758.16p(11/13)
8.25(11/13)
7.248 . 2 2 p( 1 l/ 1 3 )
8.50(8/16) 8.25(11/13)4.80(10/11) 4.25(11/15)
7.928.31
9.3110.43
7.76(11/12)7.98(11/12)
8.8710.50
10.44(10/16) 8.8 7p(11/13)
6.48(10/16) 6.55(11/13)
10.32(10/7) 9.93(11/4)

- 10 -
CORRECTIONS:
Page III-9. The statement that "instalment debt outstanding
grew at its slowest rate of the year in September" is incorrect. The
net change in September was $8.12 billion (SAAR) for instalment
credit. The increase during February amounted to $8.05 billion, and
the March gain totaled $7.40 billion.
Page IV-6, line 2 of text. Delete Interest Equalization
Tax and substitute Controls on Direct Investments.

CONFIDENTIAL - FR November 15, 1974
GROSS NATIONAL PRODUCT AND RELATED ITEMS(Quarterly figures are seasonally adjusted. Expenditures and income
figures are billions of dollars, with quarterly figures at annual rates.)
1974-IIICommerce Prel. Commerce Final
1974-II 10/17/74 11/15/74Change Change Change
Amount from Amount from Amount from74-I 74-II 74-II
Gross National Product 1383.8 25.0 1411.6 27.8 1415.4 31.6Final purchases 1370.3 28.4 1405.8 35.5 1406.7 36.4
Private 1065.9 20.3 1094.6 28.7 1094.4 28.5Excluding net exports 1067.4 33.1 1098.7 31.3 1098.4 31.0
Personal consumption expenditures 869.1 28.5 899.9 30.8 901.3 32.2Durable goods 129.5 5.6 136.0 6.5 136.1 6.6Nondurable goods 375.8 11.4 388.1 12.3 389.0 13.2Services 363.8 11.4 375.9 12.1 376.2 12.4
Gross private domestic investment 211.8 1.3 204.6 -7.2 205.8 -6.0Residential construction 48.8 .4 46.3 -2.5 46.2 -2.6Business fixed investment 149.4 4.2 152.5 3.1 150.9 1.5Change in business inventories 13.5 -3.4 5.8 -7.7 8.7 -4.8
Nonfarm 10.4 -2.7 3.1 -7.3 6.6 -3.
Net exports of goods and services -1.5 -12.8 -4.1 -2.6 -4.0 -2.5
Exports 138.5 7.3 143.9 5.4 142.6 4.1Imports 140.0 20.1 148.0 8.0 146.6 6.6
Gov. purchases of goods and services 304.4 8.1 311.2 6.8 312.3 7.9Federal 114.3 2.8 116.4 2.1 117.2 2.9
Defense 76.6 .8 78.8 2.2 78.4 1.8Other 37.7 2.0 37.7 .0 38.8 1.1
State and local 190.1 5.3 194.8 4.7 195.1 5.0
GNP in constant (1958) dollars 827.1 -3.4 821.1 -6.0 822.7 -4.4
Personal income 1134.6 22.1 1165.9 31.3 1168.2 33.6Wage and salary disbursements 745.2 17.6 762.6 17.4 763.0 17.8
Disposable personal income 966.5 15.9 990.8 24.3 993.1 26.6Personal saving 71.5 -12.9 64.6 -6.9 65.5 -6.0
Saving rate (per cent) 7.4 6.5 6.6
----------Per Cent Change at Annual Rates----------
Gross National Product 7.6 8.3 9.5Gross Private Product 7.7 8.5 9.8Gross Private Nonfarm Product 13.7 9.3 10.1GNP in constant prices -1.6 -2.9 -2.1GPP in constant prices -2.0 -3.3 -2.4GPNfP in constant prices -2.9 -3.0 -2.5GNP implicit price deflator 9.3 11.5 11.8GNP fixed weighted price index 11.1 12.8 12.7GPP fixed weighted price index 12.3 14.0 13.8

SUPPLEMENTAL APPENDIX A*THE SUPPLEMENTARY BUDGET IN THE UNITED KINGDOM
On November 12, British Chancellor of the ExchequerDenis Healey announced a mildly reflationary supplementary budget,designed to "lay the foundation of a comprehensive strategy for dealingwith Britain's economic problems over the next four years." He outlinedthree major objectives: (1) to give priority to investment and to thebalance of payments over both public expenditure and private consumption;(2) to adjust prices to reflect real costs, especially of importedenergy; and (3) to see that inflation is not fueled by an excessiveincrease in the money supply.
As expected, a major focus of the Chancellor's new policyactions was the need to improve both the liquidity position and theprofitability of private industry, in order to encourage investment.To improve the financial position of the larger firms, these firmswould be allowed to write down their inventory appreciation to amaximum of 10 per cent of trading profits for the accounting periodending in financial year 1973/74; this represents a deferment of taxand would affect tax bills currently due for payment. Similar measuresare envisaged next year, together with relief for smaller firms. Also,initial tax allowances for industrial buildings are to be raised from40 to 100 per cent. These changes in corporate tax are estimated toimprove corporate liquidity by nearly £800 million this winter.
The Bank of England will remind banks that they are urgedto give priority to financing productive investment. Moreover, theBank of England and the clearing banks have agreed to expand thelending facilities of their jointly-owned medium-term investment agency,Finance for Industry (FFI), by up to £1000 million over the next 2 yearsor so. Arrangements have been made for periodic purchases of marketableFFI stock by a wide range of financial institutions.
To improve industry's profitability, the Chancellor announcedsome easing for the next stage of the price control program -- whichhas operated principally by controlling profit margins. The main itemwas a cut in the so-called "labor productivity deduction"; whereascurrently companies can pass on in prices a maximum of 50 per cent ofthe increase in labor costs, the new proposals will allow them topass on up to 80 per cent, the exact amount varying according to theproportion of labor costs in total costs. Other limited adjustmentsto the price code were proposed, and 17-1/2 per cent of the cost inany year of investment on plant, machinery, and industrial buildings
*Prepared by Larry J. Promisel, Economist, World Payments andEconomic Activity Section, Division of International Finance.
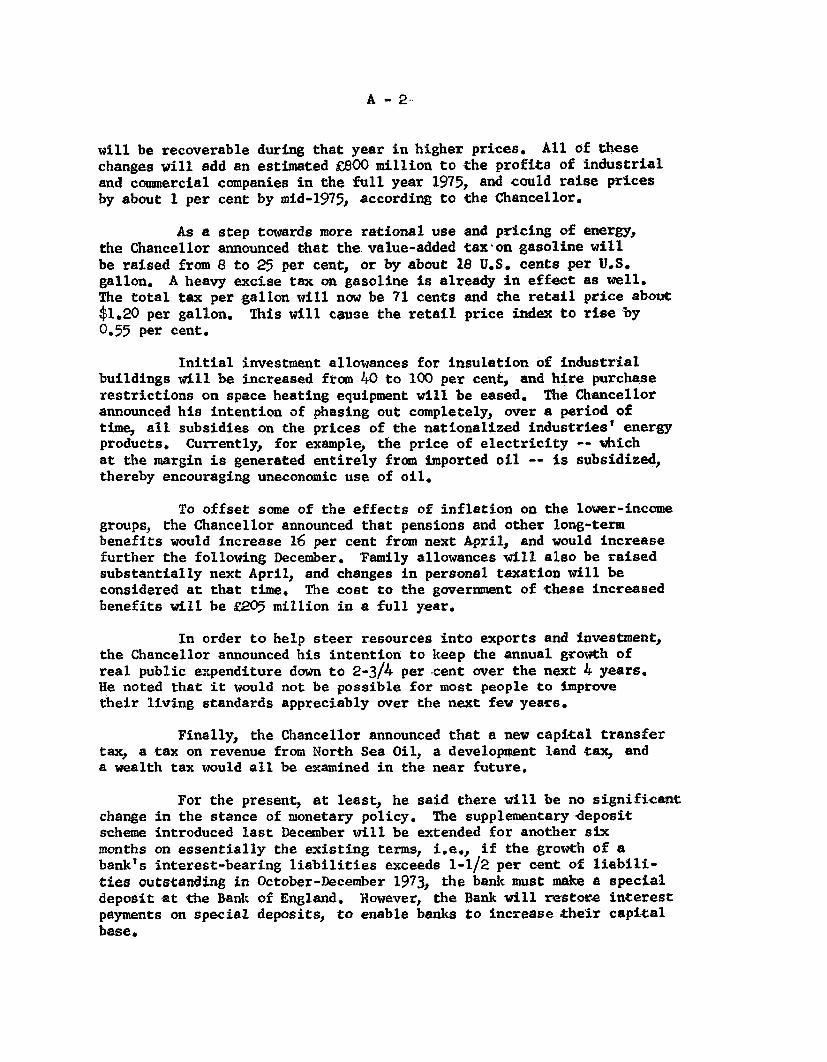
A - 2
will be recoverable during that year in higher prices. All of thesechanges will add an estimated £800 million to the profits of industrialand commercial companies in the full year 1975, and could raise pricesby about 1 per cent by mid-1975, according to the Chancellor.
As a step towards more rational use and pricing of energy,the Chancellor announced that the value-added tax on gasoline willbe raised from 8 to 25 per cent, or by about 18 U.S. cents per U.S.gallon. A heavy excise tax on gasoline is already in effect as well.The total tax per gallon will now be 71 cents and the retail price about$1.20 per gallon. This will cause the retail price index to rise by0.55 per cent.
Initial investment allowances for insulation of industrialbuildings will be increased from 40 to 100 per cent, and hire purchaserestrictions on space heating equipment will be eased. The Chancellorannounced his intention of phasing out completely, over a period oftime, all subsidies on the prices of the nationalized industries' energyproducts. Currently, for example, the price of electricity -- whichat the margin is generated entirely from imported oil -- is subsidized,thereby encouraging uneconomic use of oil.
To offset some of the effects of inflation on the lower-incomegroups, the Chancellor announced that pensions and other long-termbenefits would increase 16 per cent from next April, and would increasefurther the following December. Family allowances will also be raisedsubstantially next April, and changes in personal taxation will beconsidered at that time. The cost to the government of these increasedbenefits will be £205 million in a full year.
In order to help steer resources into exports and investment,the Chancellor announced his intention to keep the annual growth ofreal public expenditure down to 2-3/4 per cent over the next 4 years.He noted that it would not be possible for most people to improvetheir living standards appreciably over the next few years.
Finally, the Chancellor announced that a new capital transfertax, a tax on revenue from North Sea Oil, a development land tax, anda wealth tax would all be examined in the near future.
For the present, at least, he said there will be no significantchange in the stance of monetary policy. The supplementary depositscheme introduced last December will be extended for another sixmonths on essentially the existing terms, i.e., if the growth of abank's interest-bearing liabilities exceeds 1-1/2 per cent of liabili-ties outstanding in October-December 1973, the bank must make a specialdeposit at the Bank of England. However, the Bank will restore interestpayments on special deposits, to enable banks to increase their capitalbase.

A - 3
The Chancellor summed up the effects of his policy actionsby noting that the total public sector borrowing requirement for1974/75 will rise by £800 million to £6300 million (or roughly 9 percent of British GDP). There will be a corresponding improvement inthe company sector borrowing requirement. Prices will rise by anextra 1-1/2 per cent or more by mid-1975. The financial benefit tocompanies will amount to £1500 million in the full calendar year 1975(roughly half from price relief and half from tax relief). TheChancellor forecast that total output would grow at an annual rate of2 per cent over the "period ahead" (presumably through the first halfof 1975), implying that unemployment would increase but would remainbelow 1 million.
Assessment. The actions announced in the budget can becontrasted with the policy prescriptions urged on the Chancellor bothby the Confederation of British Industries (CBI) and the Trades UnionCongress (TUC). The CBI had warned that industry would need £2400million in tax and price control relief during the rest of this financialyear (ending in March) simply to survive its present cash flow crisis,and would need £3750 million or more next year. These figures areconsistent with official statistics that show the financial deficitof the company sector (i.e., net saving after taxes, fixed capitalformation, and inventory appreciation) running at an annual rate ofabout £4500 million in the first half of 1974.
In addition to the complete abolition of price controls andtax relief on stock appreciation, the CBI had urged the Chancellor toreduce the corporate tax rate (from 52 per cent to 35 per cent) andto withdraw the Advance Corporation Tax surcharge.
The TUC had asked the Chancellor to inject an extra £2500million into the economy: £1500 million by budgetary means, such asincreasing child allowances and other social improvements, and £1000million by increasing private investment. (The TUC would prefer tosee investment increased by direct government intervention, ratherthan by the measures urged by the CBI.) An injection of £2500 millionwould result in a growth rate of GDP of 3-1/2 per cent, according tothe TUC.
Thus, the budget announced on November 12 falls short ofthe degree of stimulus urged by either the CBI or the TUC. The
A - 4
budget does, however, provide substantial relief to the corporatesector. It does come to grips in a vigorous way with the energyconservation problem (especially since the Chancellor asserted thatin three years over half of Britain's oil requirement would be met
from national sources). By cutting back on public expenditure andprivate consumption (by allowing prices to rise), the budget doesleave resources free for the growth of exports and investment. Allof these actions were politically quite courageous, and representa reasonable strategy in the face of a difficult policy dilemma.
Nevertheless, serious doubt remains as to whether thesebenefits will be sufficient to induce any early pickup in investment.Given the degree of pessimism expressed in recent investment intentions
surveys -- and given the expected weakness in other components ofdemand, which are likely to be reinforced by the new policy actions --it appears that the Chancellor's forecast of a 2 per cent annual rateof growth of output may not be realized.
SUPPLEMENTAL APPENDIX B*BANK CREDIT REVISION
Seasonally adjusted bank credit data (last-Wednesday-of-the-month series) have been revised for the period January through September1974 on the basis of June 30, 1974, Call Report data. These reviseddata have been used in the current Greenbook tables.
According to the June Call Report data, growth in total commercialbank credit was at a somewhat faster pace in the first half of 1974, thanthe partly estimated data had indicated. The annual rate of growth intotal loans and investments in the first half of 1974 had been estimatedto be a 13.9 per cent rate but on the basis of Call data was revised upwardto a 15.0 per cent rate (Table 1). Some small upward adjustments occurredin all three quarters of 1974. (Data subsequent to June, however, aresubject to further revision when the December 31, 1974, Call Report becomesavailable.)
The higher June bank credit level was reflected in larger hold-ings of total loans and "other" securities (securities other than U.S.Treasury issues) than had been estimated (Table II). Holdings of U.S.Treasury securities were lower on the Call than estimated. These revisionsreflect three sources of error in the initial monthly estimates of loansand investments at all commercial banks. Monthly data are unavailable formost nonmember banks, so the estimates prepared for these banks on thebasis of data reported by small member banks are subject to estimatingerrors. The amount of the nonmember component error is determined as ofeach Call date. In addition, a "window dressing" adjustment is made inJune and December to convert reported last-Wednesday of month figures toa Call date basis and this is also subject to estimating error. Revisionsin the nonmember estimates raised each of the major credit categories--total loans, U.S. Treasury securities, and other securities. However,"window dressing" estimates were too high in the case of total loansand investments, total loans, and U.S. Treasury securities and partiallyoffset the upward revisions in nonmember estimates for these items.
Monthly estimates are also made for domestic interbank loanswhich are subtracted from the reported data. These loans were estimatedat too low a level according to Call Report figures. Revisions for theseestimates also partially offset the upward revisions of nonmember loans.Over the first half of the year, total loans adjusted to exclude domesticinterbank loans, expanded at an annual rate of 16.7 per cent compared withan estimated 15.3 per cent.
* Prepared by Mary Jane Harrington, Economist, Banking Section, Divisionof Research and Statistics.

B-2
In the case of U.S. Treasury securities the Call date errorwas slightly larger in absolute volume than the last-Wednesday error andwas also in the opposite direction. These holdings were estimated to have
increased $400 million between June 26 and June 30--typically over the
years window dressing adjustments have been upward. However, they actuallydropped $800 million, more than offsetting the effect of the upward ratiorevision. Over the first half of the year, Treasury holdings increased atan annual rate of 13.6 per cent compared with an estimated 16.3 per cent.The same directional error had occurred in estimating window dressing onthe December 1973 Call and this may be indicative of some changing pattern
in the handling of these assets around Call dates.
Holdings of other securities have always increased between last-Wednesdays and calls, and this year the adjustment was estimated correctly.The basic series revision resulted in an increase of 9.7 per cent betweenDecember and June compared with an estimated 8.0 per cent.
Business and real estate loans were both moderately higher onthe June Call date than had been estimated. Again, however, in the caseof business loans, the error in the Call figure was smaller than that inthe last-Wednesday figure reflecting a too high estimate of window dress-ing. Over the first half of the year, business loans increased at anannual rate of 24.1 per cent and real estate loans, 13.8 per cent, comparedwith estimated rates of 23.3 per cent and 12.4 per cent respectively.Consumer loans--which are taken from Consumer Credit statistics--were notaffected by the benchmark revisions.
The largest error among the loan components occurred in theagricultural category (not shown on the tables). Agricultural loanswere $900 million lower on the June 30 Call than had been estimated.Thus, agricultural loans increased only $400 million, seasonally adjusted,over the first half of 1974--far below the unusually sharp increases ofother recent periods. Agricultural loans had increased $1.3 billion inthe second half of 1972; $1.1 billion in the first half of 1973; and $2.0billion in the second half of 1973. However, the first half of 1974increase was in line generally with volume changes of years prior to1972. The reduced rate of growth in agricultural loans at commercialbanks in 1974 reflected to some extent tight money conditions at ruralbanks which apparently resulted in some shift of borrowing to theProduction Credit Association whose loans increased more than usual.Also, loan demand by livestock feeders was sharply reduced by loweroperating rates and lower prices on livestock in inventory. In the secondhalf of both 1972 and 1973, the unusually large loan increases had been

B- 3
associated in part with delayed sales because of expectations of higherprices. In addition, farmers purchased machinery and feed--which normallymight have been delayed until the next year--both because of expectedhigher prices and tax advantages.
Differences between the June 30, 1974, Call and estimated datafor security and nonbank financial loans were small. While changes inthe estimated portion of these items--i.e., those at the nonweekly report-ing banks--are generally nominal, large errors may sometimes occur becauseof incorrectly estimated window dressing adjustments at the large report-ing banks.
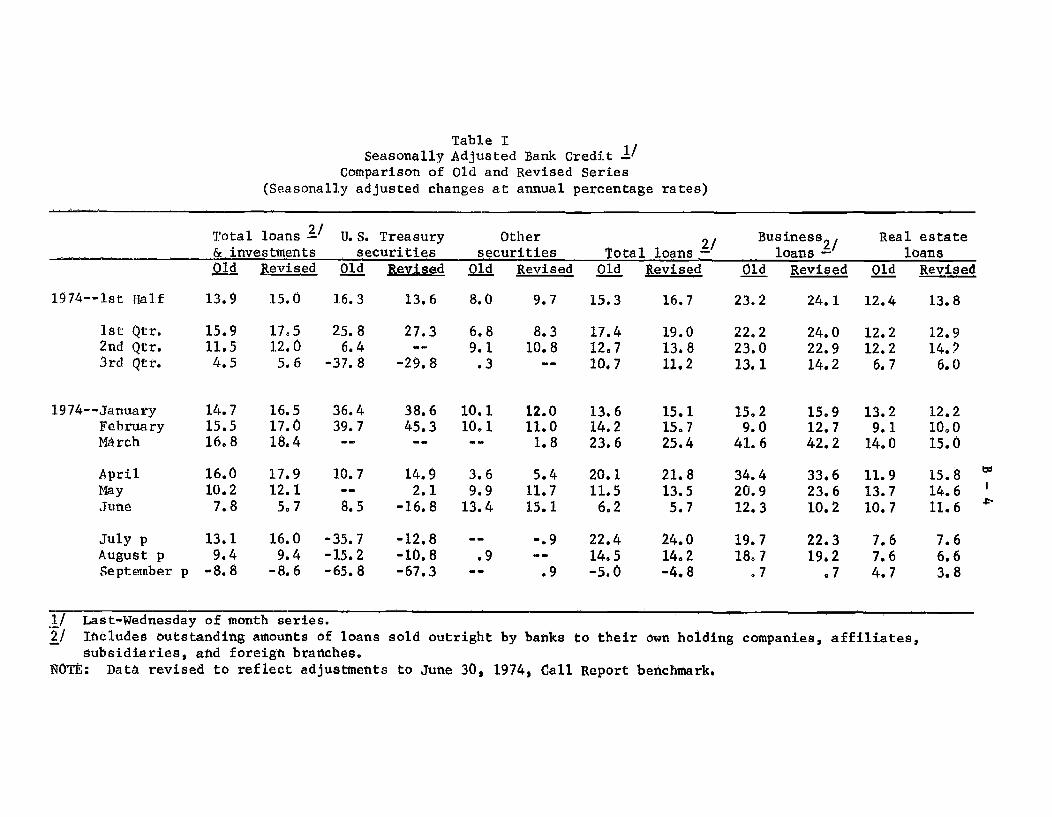
Table ISeasonally Adjusted Bank Credit 1/
Comparison of Old and Revised Series(Seasonally adjusted changes at annual percentage rates)
Total loans ² U.S. Treasury Other Business² Real estate& investments securities securities Total loans loans - loansOld Revised 0ld Revised Old Revised Old Revised Old Revised Old Revised
1974--1st Half 13.9 15.0 16.3 13.6 8.0 9.7 15.3 16.7 23.2 24.1 12.4 13.8
1st Qtr. 15.9 17.5 25.8 27.3 6.8 8.3 17.4 19.0 22.2 24.0 12.2 12.92nd Qtr. 11.5 12.0 6.4 -- 9.1 10.8 12.7 13.8 23.0 22.9 12.2 14.23rd Qtr. 4.5 5.6 -37.8 -29.8 .3 -- 10.7 11.2 13.1 14.2 6.7 6.0
1974--January 14.7 16.5 36.4 38.6 10.1 12.0 13.6 15.1 15.2 15.9 13.2 12.2February 15.5 17.0 39.7 45.3 10.1 11.0 14.2 15.7 9.0 12.7 9.1 10.0March 16.8 18.4 - -- -- 1.8 23.6 25.4 41.6 42.2 14.0 15.0
April 16.0 17.9 10.7 14.9 3.6 5.4 20.1 21.8 34.4 33.6 11.9 15.8May 10.2 12.1 -- 2.1 9.9 11.7 11.5 13.5 20.9 23.6 13.7 14.6June 7.8 5.7 8.5 -16.8 13.4 15.1 6.2 5.7 12.3 10.2 10.7 11.6
July p 13.1 16.0 -35.7 -12.8 -- -. 9 22.4 24.0 19.7 22.3 7.6 7.6August p 9.4 9.4 -15.2 -10.8 .9 -- 14.5 14.2 18.7 19.2 7.6 6.6September p -8.8 -8.6 -65.8 -67.3 -- .9 -5.0 -4.8 .7 .7 4.7 3.8
1/ Last-Wednesday of month series.2/ Includes outstanding amounts of loans
subsidiaries, and foreign branches.sold outright by banks to their own holding companies, affiliates,
NOTE: Data revised to reflect adjustments to June 30, 1974, Call Report benchmark.
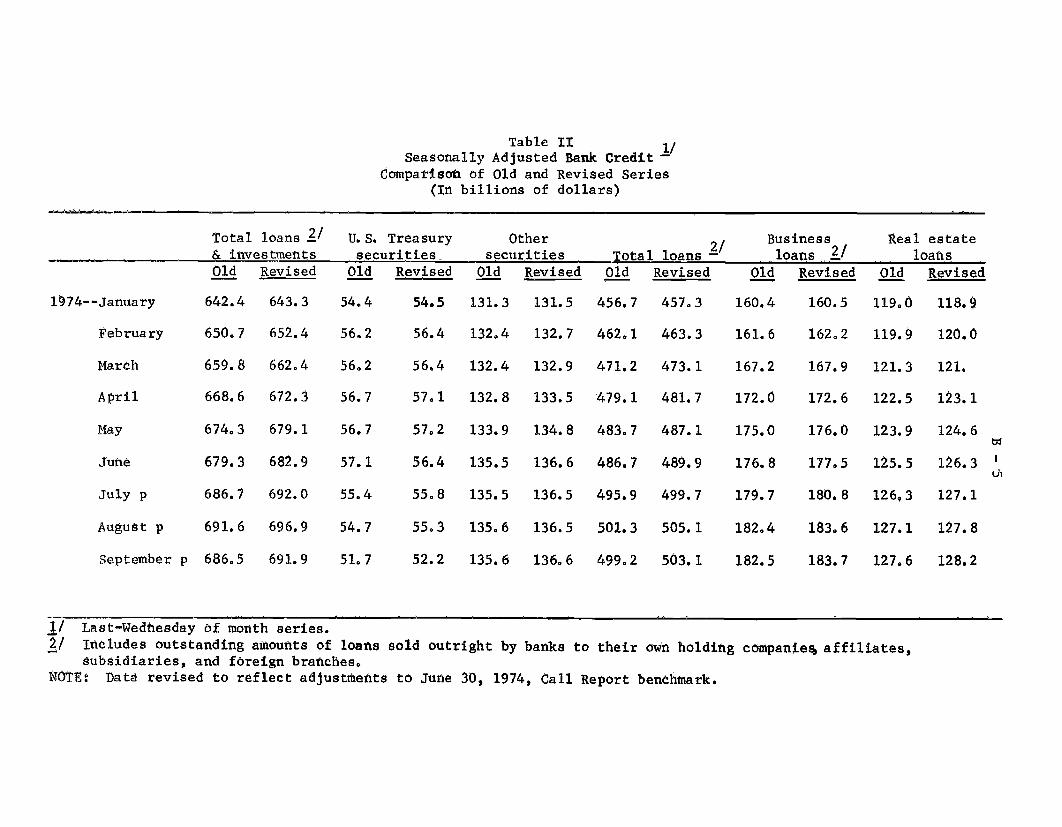
Table IISeasonally Adjusted Bank Credit ¹
Comparison of Old and Revised Series(In billions of dollars)
Total loans 2 / U.S. Treasury Other Business Real estate& investments securities securities Total loans 2/ loans 2/ loansOld Revised Old Revised Old Revised Old Revised Old Revised Old Revised
1974--January 642.4 643.3 54.4 54.5 131.3 131.5 456.7 457.3 160.4 160.5 119.0 118.9
February 650.7 652.4 56.2 56.4 132.4 132.7 462.1 463.3 161.6 162.2 119.9 120.0
March 659.8 662.4 56.2 56.4 132.4 132.9 471.2 473.1 167.2 167.9 121.3 121.
April 668.6 672.3 56.7 57.1 132.8 133.5 479.1 481.7 172.0 172.6 122.5 123.1
May 674.3 679.1 56.7 57.2 133.9 134.8 483.7 487.1 175.0 176.0 123.9 124.6
June 679.3 682.9 57.1 56.4 135.5 136.6 486.7 489.9 176.8 177.5 125.5 126.3
July p 686.7 692.0 55.4 55.8 135.5 136.5 495.9 499.7 179.7 180.8 126.3 127.1
August p 691.6 696.9 54.7 55.3 135.6 136.5 501.3 505.1 182.4 183.6 127.1 127.8
September p 686.5 691.9 51.7 52.2 135.6 136.6 499.2 503.1 182.5 183.7 127.6 128.2
1/ Last-Wednesday of month series.2/ Includes outstanding amounts of loans sold outright by banks to their own holding companies, affiliates,
subsidiaries, and foreign branches.NOTE: Data revised to reflect adjustments to June 30, 1974, Call Report benchmark.

SUPPLEMENTAL APPENDIX C*SUGAR SUPPLY AND PRICE DEVELOPMENTS
After several years of relative stability, world sugar pricesbegan to rise in 1970-71, but turned more sharply upward in recentmonths. On November 12 the U.S. sugar price was almost seven times its1971 level and more than double the peaks reached during the Civil Warand World War I periods. The world sugar price was 13 times its 1971level. The longer term increase has resulted mainly from the failureof world production, though increasing, to keep pace with the morerapidly increasing world consumption. Expiration of the Sugar Actat the end of this year--the effect of which may be to reduce U.S.sugar production--is one of a number of special factors which has con-tributed to the most recent sharp price increases.
As shown in the accompanying table world sugar production hasincreased each year since 1970-71 and is well above average productionin 1967-70. Production increased an average 1,537 million metric tonsfrom 1970-71 through 1973-74 while disappearance increased an average2,106 million metric tons. Year-end stocks as a percent of dis-appearance have declined from an average 30 percent during 1965-66through 1969-70, to an expected 18 percent in 1974-75.
As world stocks of sugar declined the world sugar price in-creased in 1971 and 1972, but not until 1973 did the world price reachthe previously stable but much higher U.S. sugar price. Until 1973,a world sugar surplus (stocks in excess of 20 percent annual usage)prevailed, and to protect the U.S. sugar industry, the domestic pricehad been kept high by limiting imports. When the world price reachedthe U.S. price level, then the two prices began to move together. Thecrops coincidence of the world and U.S. prices was one factor whichcontributed to an accelerated rate of increase.
Another factor triggering the recent faster rate of priceincrease has been the decision of Congress in June 1974 not to extendthe Sugar Act. Since 1934 U.S. sugar producers have been protectedfrom foreign competition by import quotas. Expiration of the Act onDecember 31, 1974, will remove the protection and this may result inless expansion in U.S. production than would otherwise occur. Thisis because harvest of a larger cane crop would not begin until twoyears after planting, and growers fear that prices may change enoughby then that protection will again become a factor in the profitabilityof U.S. crops. However, before year-end the President is likely to
*Prepared by Edwin Price, Economist, Business Conditions Section,Division of Research and Statistics.

C - 2
implement quotas by proclamation and this would re-establish the pro-tection desired by the high-cost domestic sugar producers.
Though world sugar production has been increasing, therehave been some notably poor crops in recent years. The Russian sugar-beet crop, the largest source of world sugar supplies, was badly hurtin 1972, the same year their wheat crop was short. Also the recentU.S. and European sugarbeet crops were below last year. While thesepoor crops have had some effect, the main problem has been deficientexpansion of beet and cane acreage.
A large Southern Hemisphere cane crop will be harvestedearly next year and this may cause a break in the sugar price.Recently large profits will induce expansion of sugar crop plantings,but the results will be slow because of the two years required forsugarcane to reach the harvest stage. Expansion in sugarbeet productionmay however bring some earlier price relief.
WORLD SUGAR BALANCE1000 Metric Tons
Ending Stocks % ofYear Production Disappearance Stocks Disappearance
1965-70 67,870 67,366 19,907 30
1970-71 72,771 75,052 19,081 25
1971-72 73,852 75,776 17,157 23
1972-73 77,173 78,536 15,794 20
1973-74 80,493 80,794 15,493 19
1974-75 (est.) 82,494 83,235 14,752 18