Fomc 19721219 Blue Book 19721215
24
Prefatory Note The attached document represents the most complete and accurate version available based on original copies culled from the files of the FOMC Secretariat at the Board of Governors of the Federal Reserve System. This electronic document was created through a comprehensive digitization process which included identifying the best- preserved paper copies, scanning those copies, 1 and then making the scanned versions text-searchable. 2 Though a stringent quality assurance process was employed, some imperfections may remain. Please note that some material may have been redacted from this document if that material was received on a confidential basis. Redacted material is indicated by occasional gaps in the text or by gray boxes around non-text content. All redacted passages are exempt from disclosure under applicable provisions of the Freedom of Information Act. 1 In some cases, original copies needed to be photocopied before being scanned into electronic format. All scanned images were deskewed (to remove the effects of printer- and scanner-introduced tilting) and lightly cleaned (to remove dark spots caused by staple holes, hole punches, and other blemishes caused after initial printing). 2 A two-step process was used. An advanced optical character recognition computer program (OCR) first created electronic text from the document image. Where the OCR results were inconclusive, staff checked and corrected the text as necessary. Please note that the numbers and text in charts and tables were not reliably recognized by the OCR process and were not checked or corrected by staff. Content last modified 6/05/2009.
-
Upload
fraser-federal-reserve-archive -
Category
Documents
-
view
217 -
download
1
Transcript of Fomc 19721219 Blue Book 19721215

Prefatory Note The attached document represents the most complete and accurate version available based on original copies culled from the files of the FOMC Secretariat at the Board of Governors of the Federal Reserve System. This electronic document was created through a comprehensive digitization process which included identifying the best-preserved paper copies, scanning those copies,1
and then making the scanned versions text-searchable.2
Though a stringent quality assurance process was employed, some imperfections may remain. Please note that some material may have been redacted from this document if that material was received on a confidential basis. Redacted material is indicated by occasional gaps in the text or by gray boxes around non-text content. All redacted passages are exempt from disclosure under applicable provisions of the Freedom of Information Act. 1 In some cases, original copies needed to be photocopied before being scanned into electronic format. All scanned images were deskewed (to remove the effects of printer- and scanner-introduced tilting) and lightly cleaned (to remove dark spots caused by staple holes, hole punches, and other blemishes caused after initial printing). 2 A two-step process was used. An advanced optical character recognition computer program (OCR) first created electronic text from the document image. Where the OCR results were inconclusive, staff checked and corrected the text as necessary. Please note that the numbers and text in charts and tables were not reliably recognized by the OCR process and were not checked or corrected by staff.
Content last modified 6/05/2009.

(CONFIDENTIAL FR)
MONETARY AGGREGATESANDMONEY MARKET CONDITIONS
Prepared for the Federal Open Market Committee
By the Staff
BOARD OF GOVERNORS OF THE FEDERAL RESERVE SYSTEM
December 15, 1972

CONFIDENTIAL (FR) December 15, 1972
MONETARY AGGREGATES ANDMONEY MARKET CONDITIONS
Recent developments
(1) The money supply aggregates now appear to be growing at
annual rates about 1-1/2 and 1 percentage points in excess of the
Committee's November-December ranges of tolerance, as shown in the table
below. However, during most of the interval, growth rates appeared to be
running at or only slightly above their acceptable ranges. During
November, growth in M1 was at about a 6-1/2 per cent annual rate--nearly
double the low October rate. While growth in M2 was at about the same
rate as in October, it too was at a faster pace than desired. 1/ It is
possible that the recent strength in the money supply partly reflects
Growth in Money and Credit Aggregates and RPDDuring November-December Period
(SAAR in Percentage Points)
Ranges of CurrentTolerance Estimates
RPD 6-10 13
M1 4-7 8-1/2
M 5-8 9
MEMO:
Federal funds 4.75--5.-50 5,29 Week ending December 131/ More detail on recent changes in the reserve and monetary aggregates isprovided by Tables 1 and 2 attached at the end of the Blue Book and inAppendix 1.

technical problems of measurement and seasonal adjustments flowing from the
change in Regulation J, although our adjustments made for the effects of
this change: appear to us to be reasonably accurate. The most likely
explanation of the overshoot would seem to be that money growth is again
beginning to respond in a more nearly usual relationship to the rapid
rate of economic expansion.
(2) Intermeeting estimates of the growth in RPD's during
the November-December target period have been substantially above the
Committee's 6-10 per cent range of tolerance, with the most recent estimate
close to a 13 per cent annual rate. However, about 3 percentage points
of this overshoot reflects an increase in the reserve multiplier, as
deposit growth has been greater than anticipated at large banks subject
to high marginal reserve requirements and less than anticipated at smaller
banks (including our estimates for non-member banks). The recent regula-
tory changes have made the multiplier unusually difficult to predict.
(3) As evidence developed that the monetary aggregates were
tending to run near the top or above the Committee's ranges of tolerance,
the Desk provided RPD's more reluctantly. As a result, member bank
borrowing rose substantially over the intermeeting period, and bank
bidding for Federal funds intensified. From the 5 per cent level pre-
vailing at the time of the last Committee meeting, the average Federal
funds rate rose in successive statement weeks to 5.03, 5.17, and 5.29 per
cent. Most recently, funds have traded around 5-1/2 per cent, the upper
limit of the Committee's range of tolerance.

(4) The advance in the Federal funds rate was accompanied by
rate increases ranging generally from 10 to 30 basis points in short-term
markets and from 5 to 20 basis points in longer-term markets. The rate
on the 3-month Treasury bill reached a high of around 5.10 per cent in
the most recent auction held today--roughly 30 basis points above the
level prevailing at the time of the last meeting. The Treasury has just
announced the offering of a $2 billion, 2-year, 5-7/8 per cent note to be
auctioned December 20 and paid for December 28. In addition, it reveal-
ed plans to offer $500-$750 million of 20-30 year bonds in early
January.
(5) The table on the following page compares recent changes
in the money and credit aggregates (at seasonally adjusted annual rates)
with those for selected earlier periods.
Most Recenttwo
Calendar Past Past 6 Past 3 PastYears Year Months Months Month
Dec. '71 Nov. '72 Nov. '72 Nov. '72 Nov. '72over over over over over
Dec. '69 Nov. '71 May '72 Aug. '72 Oct. '72
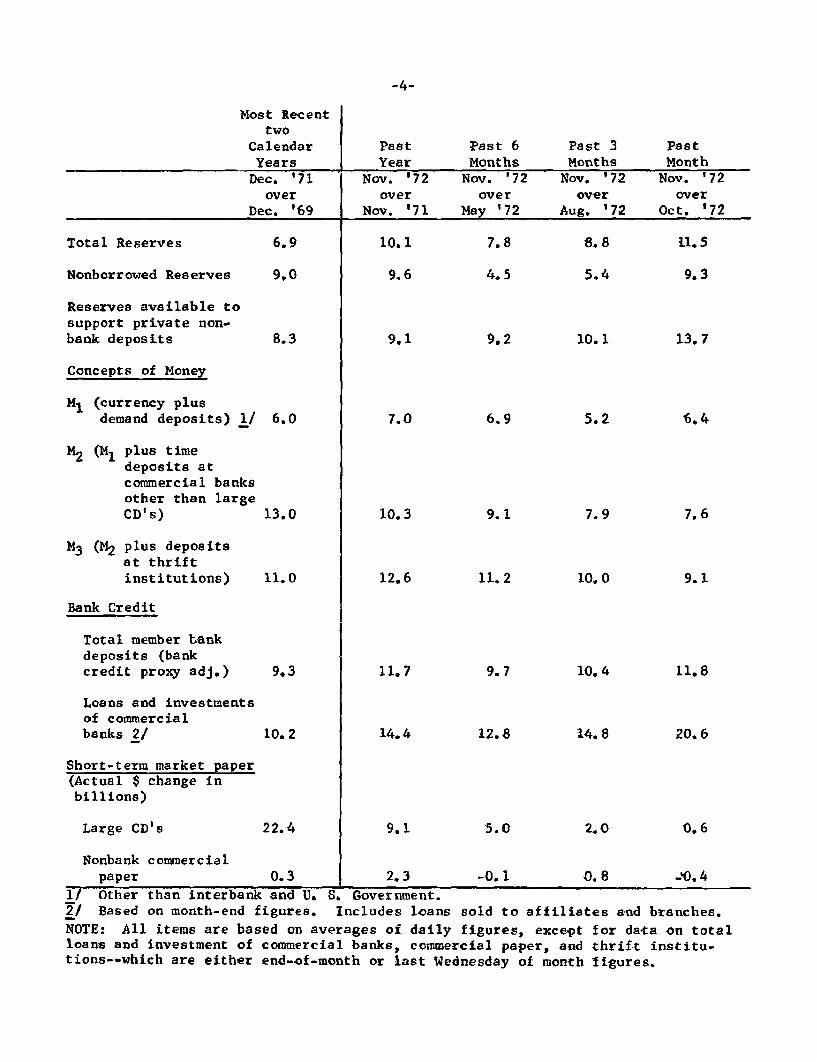
Total Reserves 6.9 10.1 7.8 8.8 11.5
Nonborrowed Reserves 9,0 9.6 4.5 5.4 9.3
Reserves available tosupport private non-bank deposits 8.3 9.1 9.2 10.1 13.7
Concepts of Money
M1 (currency plusdemand deposits) 1/ 6.0 7.0 6.9 5.2 6.4
M2 (M1 plus timedeposits atcommercial banksother than largeCD's) 13.0 10.3 9.1 7.9 7.6
M3 (M2 plus depositsat thriftinstitutions) 11.0 12.6 11.2 10.0 9.1
Bank Credit
Total member Lankdeposits (bankcredit proxy adj.) 9.3 11.7 9.7 10.4 11.8
Loans and investmentsof commercialbanks 2/ 10.2 14.4 12.8 14.8 20.6
Short-term market paper(Actual $ change inbillions)
Large CD's 22.4 9.1 5.0 2.0 0.6
Nonbank commercialpaper 0.3 2.3 -0.1 0.8 -0.4
1/ Other than interbank and U. S. Government.2/ Based on month-end figures. Includes loans sold to affiliates and branches.NOTE: All items are based on averages of daily figures, except for data on totalloans and investment of commercial banks, commercial paper, and thrift institu-tions--which are either end-of-month or last Wednesday of month figures.

Prospective developments
(6) Three alternative sets of relationships among monetary
aggregates and money market conditions (with figures for aggregates
representing seasonally adjusted annual rates of growth) are shown in
summary form below for FOMC consideration. More detailed monthly and
quarterly figures are shown in the table on the following page.
Alt. A Alt. B Alt. C
Longer-run targets for
aggregates(representedby average growth ratesfor first half of 1973) 1/
7%
7-1/2
7
7-1/2
Credit Proxy
RPD
Associated range forDecember '72-January '73
Nonborrowed RPD 10-14
RPD 8-1/2--12-1/2
M1 7-1/2--10-1/2
M2 8-11
Federal funds rate 4-7/8--5-1/2
1/ Rounded to nearest 1/2 per cent.
5-1/2
6-1/2
7
6-1/2--10-1/2
8-12
7-10
7-1/2--10-1/2
5-1/8--5-7/8
5
5
2-6
7-11
6-9
7-10
5-3/8--6-1/4

Alternative Longer-Run Targetsfor Key Monetary Aggregates
M2
1972 Dec.
1973 Jan.
March
June
Quarters
1972 4th Q.
1973 1st Q.2nd Q.
Months
1972 Dec.
1973 Jan.
Alt. A
245.7
247.2
250.3
254.4
7.0
7.56.5
10.5
7.5
1972 Dec.
1973 Jan.MarchJune
Quarters1972 4th Q.1973 let Q.
2nd Q.Months: Dec. 1972
Jan. 1973
M 1
Alt. B
245.7
247.1
250. 1
253.5
7.0
7.05.5
Alt. C
245.6
246.8
249.3
251.8
6.5
6.04.0
Alt. A Alt. B
512.5 512.5
516.2 515.9
522.7 522.4
532.1 530.8
Rates of Growth8.5 8.5
8.0 7.57.0 6.5
10.5 10.0 10.0
7.0 5.5 8.5
Total ReservesAlt. A Alt. B Alt. C
31,248
31,181
31,17632,150
13.0-1.012.512.0-2.5
31,243
31,15131,13333,049
13.0-1.512.011.5-3.5
31,240
31,08930,98631,797
13.0-3.510.511.5-6.0
10.0
8.0
Alt. C
512.4
515.4
520.5
526.5
8.5
6.54.5
Adjusted
Alt. A
401.1
403.2
406.8
415.4
8.5
5.58.5
10.0 5.0
7.0 6.5
RPDAlt. A Alt. B
28,790
29,03729,37029,884
Rates of Growth9.58.07.0
12.010.5
28,785
29,00829,32829,799
9.57.56.5
12.09.5
Credit Proxy
Alt. B
401.1
403.0
406.7
414.7
8.5
5.58.0
5.0
5.5
Alt. C
28,782
29.94729,18229,547
9.55.55.0
11.57.0
Alt. C
401.0
402.5
405. 1
411. 7
8.5
4.06.5
5.0
4.5

(7) The December-January ranges of tolerance for the aggregates
range above the associated longer-run targets. Accordingly, the Committee
may wish to specify that shortfalls of some dimension should not be taken
as indicating a need to provide reserves more actively to ease money market
conditions. The 2-month ranges are high mainly because of the substantial
increase of the monetary aggregates that seems already in train for December;
the January growth rates for M1 are indicated to be closer to longer-run
targets. Also, in both December and January the $5. 4billion of revenue
sharing payments may have a transitory effect in increasing growth in M1
for any given level of interest rates.
(8) The three alternatives shown for longer-run targets include
annual rates of growth in M1 for the first half of 1973 of 7, 6, and 5 per
cent. This is the same range of targets as presented to the FOMC at its
previous meeting. At that meeting, the Committee adopted a longer-run target
path for the aggregates (for the fourth quarter of '72 and first quarter of
'73 combined) as indexed by M1 growth of 6 per cent. Recent figures, as
noted earlier, have indicated that M growth is strong relative to Committee
desires. We expect that growth in M1 for the fourth quarter of 1972 will be
about 7 per cent, give or take 1/2 of one percentage point.
(9) None of the paths presented indicates a first quarter growth
rate for M1 consistent with a 6 per cent average growth rate for the fourth
and first quarters combined. To achieve that objective the required first
quarter growth would have to be at around a 5 per cent annual rate. The
staff believes that efforts to obtain such a growth rate would lead to a

-8-
very sharp rise in the funds rate during the winter, followed by a drop in
the funds rate during the spring unless the Committee were willing to tolerate
considerably slower growth rates in the aggregates as the year progressed.
(10) Of the alternatives presented, alternative C--which encompasses
a 5 per cent M1 target for the first half of 1973--does involve a slowing of
M1 growth that eventually compensates for recent overshoots. Because of
factors affecting money demand, the slowing of M1 growth is indicated to be
most marked in the second quarter. In that period, money demand is expected
to be moderated by disappearance of the transitory upward effect on M 1 of
unusually large tax refunds in late winter and early spring. In addition,
demand for money would be reduced,with a lag, by the substantial rise of
interest rates indicated for that alternative. It is thought that attainment
of the alternative C aggregate targets would be accompanied by a rise in the
Federal funds rate to around 6 per cent over the next few weeks, with perhaps
some modest further increase developing later in the winter.
(11) Alternative B encompasses a 6 per cent M1 growth rate over
the first half of 1973, while alternative A involves a 7 per cent rate.
The 6 per cent target appears consistent with little further change in money
market conditions, but the higher target would seem to involve some easing.
In any event, money demand is likely to be weaker in the second quarter than
the first, partly because of the effect of the tax refunds noted in the
previous paragraph. In addition, under alternative B, Treasury bill and other
short-term market rates are likely to rise a bit over the first quarter, even
given prevailing money market conditions, and thereby work to retard money
demand later.

-9-
(12) Over the next few weeks, because the market has not yet
adjusted to a 5-1/2 per cent Federal funds rate, persistence of the rate
around that level could lead to a rise in the 3-month bill to around 5-1/4
per cent. However, bill purchases by the public in recent days, partly
related to revenue sharing, have improved the technical position of the bill
market and may moderate very near-term rate adjustments. A movement of
the Federal funds rate above 5-1/2 per cent--as would be contemplated under
alternative C and is possible under alternative B--would set off larger
short-term market rate adjustments. Questions about the discount rate would
become more pressing. And if the funds rate were to penetrate the 6 per cent
level, the accompanying rise in short-term market rates could bring into
question the substainability of ceiling rates on consumer-type time deposits
as net inflows of such deposits decelerated markedly.
(13) Long-term interest rates may show only little, if any,
increase under alternative B in view of the moderate size of long-term
credit demands. The more substantial rise in short rates anticipated under
alternative C, however, probably would exert considerable pressure on
longer-term markets. This would be expected on anticipatory grounds alone,
but would be reinforced as unfavorable rate relationships put savings inflows
to banks and other institutions increasingly under downward pressure.

-10-
Proposed directives
(14) Presented below are three alternative formulations for
the operational paragraph of the directive, which might be taken to
correspond to the similarly lettered policy alternatives discussed in
the preceding section. In all three alternatives a reference to
Treasury financing operations is proposed in light of the forthcoming
auction of $2 billion in notes and the announced plans for a 20-30
year bond offering in early January. Deletion of the reference to
bank regulatory changes is suggested on the grounds that banks have
adjusted to the new regulations. For alternatives B and C, a reference
to credit market developments is suggested should the Committee wish to
take account of the possible reaction to a further rise in the funds
rate while the market is still adjusting to the rise that has already
occurred.
Alternative A
To implement this policy, while taking account of TREASURY
FINANCING OPERATIONS [DEL: the effects of recent bank regulatory changes],
the Committee seeks to achieve bank reserve and money market con-
ditions that will support [DEL: more moderate] growth in monetary aggre-
gates over the months ahead [DEL: than recorded in the third quarter] AT
ABOUT THE RATES THAT APPEAR INDICATED FOR THE SECOND HALF OF THIS
YEAR.
Alternative B
To implement this policy, while taking account of TREASURY
FINANCING OPERATIONS [DEL: the effects of recent bank regulatory changes]

-11-
AND POSSIBLE CREDIT MARKET DEVELOPMENTS, the Committee seeks
to achieve bank reserve and money market conditions that will
support [DEL: more] moderate growth in monetary aggregates over the
months ahead [DEL: than recorded in the third quarter].
Alternative C
To implement this policy, while taking account of TREASURY
FINANCING OPERATIONS [DEL: the effects of recent bank regulatory
changes] AND POSSIBLE CREDIT MARKET DEVELOPMENTS, the Committee
seeks to achieve bank reserve and money market conditions that
will support [DEL: more moderate] SLOWER growth in monetary aggregates
over the months ahead than [DEL: recorded in the third quarter] APPEARS
INDICATED FOR THE SECOND HALF OF THIS YEAR.
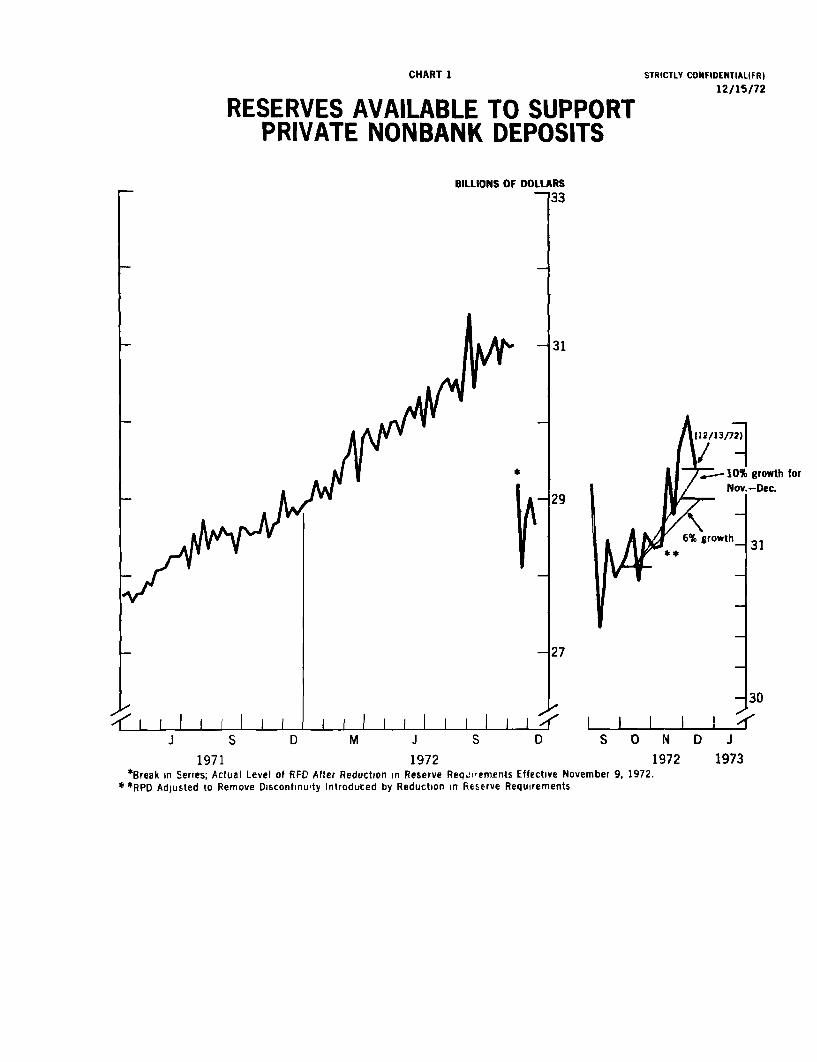
CHART 1
RESERVES AVAILABLE TO SUPPORTPRIVATE NONBANK DEPOSITS
STRICTLY CONFIDENTIAL(FR)
12/15/72
BILLIONS OF DOLLARS-133
-31
-127
J S D M J S DLS N D
1971 1972 1972*Break in Series; Actual Level of RPO After Reduction in Reserve ReqJrements Effective November 9, 1972.
**RPD Adlusted to Remove Discontinuty Introduced by Reduction in Reserve Requirements
growth for-Dec.
J
1973
I
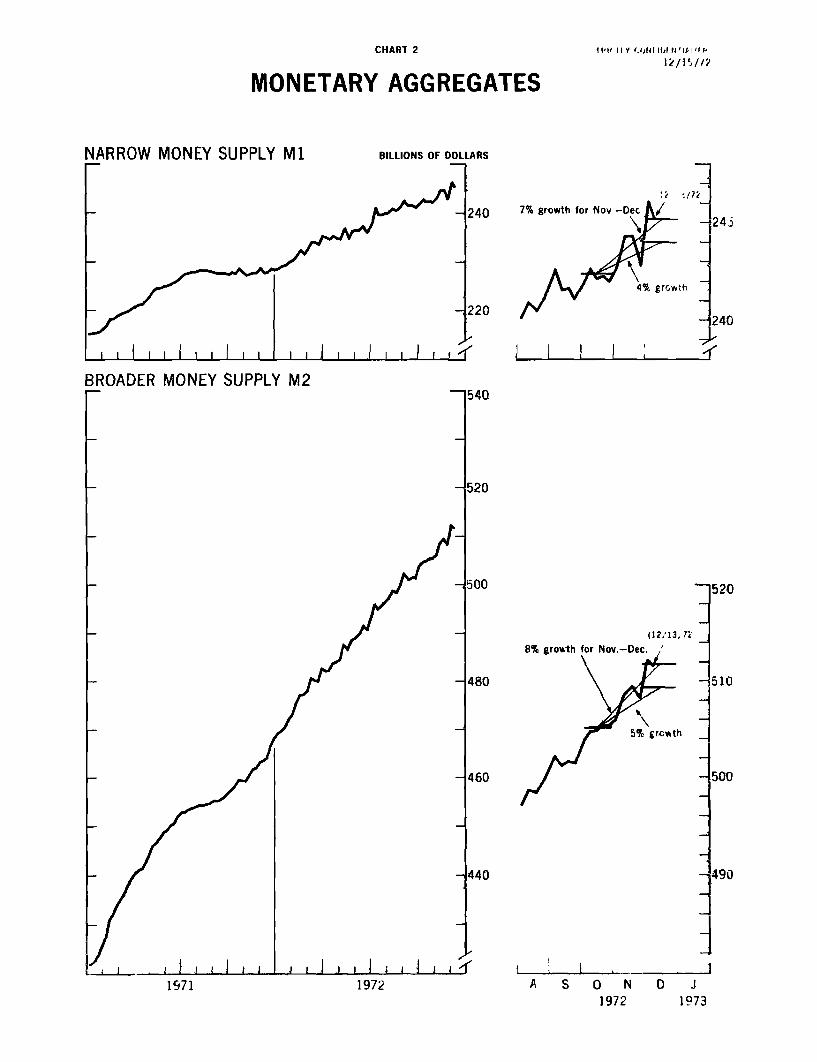
CHART 212/15/72
MONETARY AGGREGATES
NARROW MONEY SUPPLY M1 BILLIONS OF DOLLARS
L^- 240
-220
7% growth for Nov
BROADER MONEY SUPPLY M2
8% growth for
A S 0 N1972
/
- 40f<
(12/13.71
growth
0 J1973
1971 1972

STRICTLY CONFIDENTIAL (FR)12/15/72
MONETARY AGGREGATES
ADJUSTED CREDIT PROXY BILLIONS OF DOLLARS
400
-380
3160
1111 1 ;TOTAL RESERVES
i/13/72)
(12/13/72)
/
J I j j Ii i 11971 1972 A S 0 N 0 J
1972 '73
*Break in Series, Actual Level of Total Reserves After Reduction in Reserve Requirements Effective November 9, 1972
CHART 3
112/13/72)

CHART 4
MONEY MARKET CONDITIONS AND INTEREST RATES
MONEY MARKET CONDITIONS INTEREST RATES Short-term INTEREST RATES
FEDERAL
PER CENT
RESERVES BILLIONS OF DOLLAI
BORROWEDA~t~ I
*j, \ i v , - I -NET BORROWED
_L197 1 1972II II ll
1971 1972
WEEKLY AVERAGES
1971 1972
Long-termPER CENT
MUNICIPAL AaaWEDNESDAY
GOVERNMENT BONDb20 YEAR AVERAGES
1971 I I 1972I1971 1972
"'
-- ^ ^"^^"
----- ''-"F
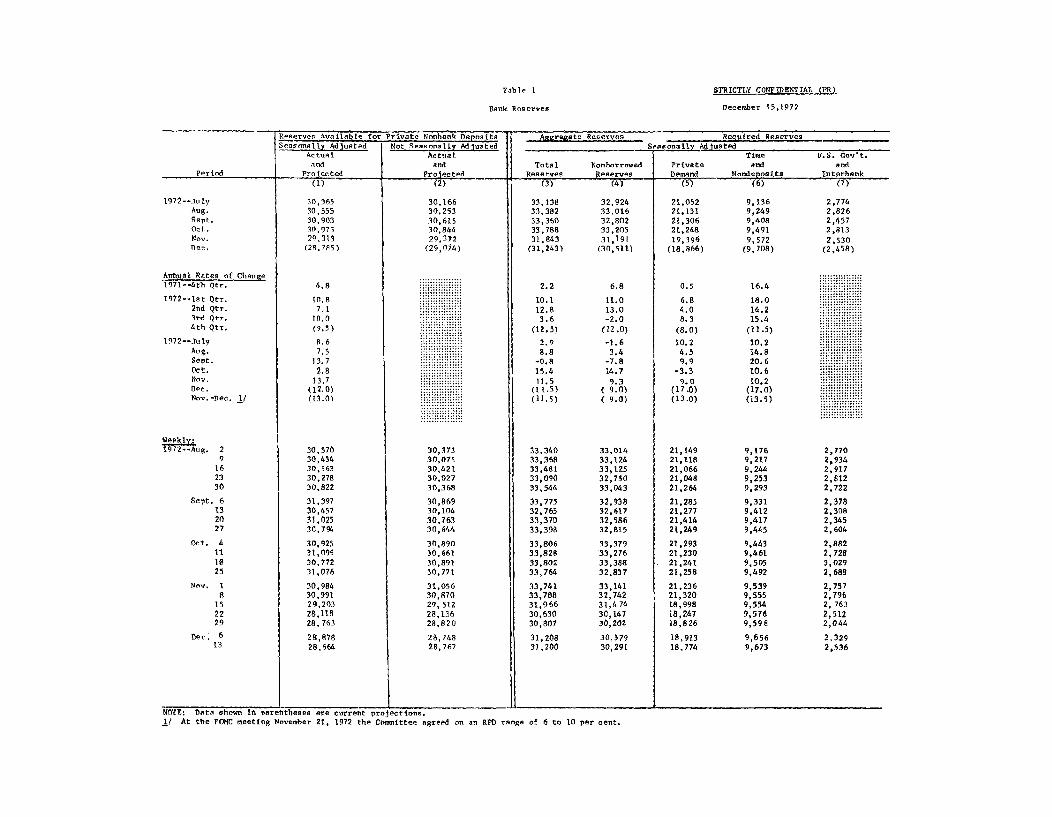
Table 1
Bank Reserves
STRICTLY CONFIDENTIAL (FR)
December 15,1972
Reserves Availale for Private Nonbank Deposits Aggregate Reserves Required ReservesSeasonally Adjusted Not Seasonally Adjusted Seasonally Adjusted
Actual Actual Time U.S. Gov't.and and Total Nonborrowed Private and and
Period Projected Projected Reserves Reserves Demand Nondeposits Interbank
1972--JulyAug.Sept.Oct.Nov.Dec.
Annual Rates of Change1971-*4th Qtr.
1972--1st Qtr.2nd Qtr.3rd Qtr.4th Qtr.
1972--JulyAug.Sept.Oct.Nov.Dec.Nov. -Dec. 1/
Weekly.1972--Aug. 2
9162330
Sept. 6132027
Oct. 4111825
Nov. 18
152229
Dec. 613
(1)
30,36530,55530,90330.97529,313
(28,785)
4.8
10.87.1
10.0(9.5)
8,67.5
13.72.8
13.7(12.0)(13.0)
30,57030,43430,56330,27830,822
31,39730,45731,02530,794
30,92531,09930,77231,076
30,98430,99129,20328,11828,763
28,87828,664
(2)
30,16630,25330,61530,84429,372
(29,074)
30,37330,07530,42130,02730,368
30,86930,10430,76330,644
30,89030,66130,89130,771
31,05630,87029,51228,13628,820
28,74828,767
(3)
33,13833,38233,36033,78831,843
(31,243)
2.2
10.112.8
3.6(12.5)
2.98.8
-0.815.411.5
(11.5)(11.5)
33,34033,36833,48133,09033,544
33,77532,76533,37033,398
33,80633,82833,80233,764
33,74133,78831,96630,63030,807
31,20831,200
(4)
32,92433,01632,80233,20531,191
(30,511)
6.8
11.013.0-2.0
(12.0)
-1.63.4
-7.814.7
9.3(9.0)( 9.0)
33,01433,12433,12532,75033,043
32,93832,61732,58632,815
33,37933,27633,38832,837
33,14132,74231,47430,14730,202
30,57930,291
NOTE: Data shown in parentheses are current projections.1/ At the FOMC meeting November 21, 1972 the Committee agreed on an RPD range of 6 to 10 per cent.
(5)
21,05221,13121,30621,24819,396
(18,866)
0.5
6.84.08.3
(8.0)
10.24.59.9
-3.39.0
(17.0)(13.0)
21,14921,11821,06621,04821,264
21,28521,27721,41421,249
21,29321,23021,24121,258
21,23621,32018,99818,24718,826
18,91318,774
(6)
9,1369,2499,4089,4919,572
(9,708)
16.4
18.014.215.4
(11.5)
10.214.820.610.610.2
(17.0)(13.5)
9,1769,2179,2449,2539,293
9,3319,4129,4179,445
9,4439,4619,5059,492
9,5399,5559,5549,5769,598
9,6569,673
(7)
2,7742,8262,4572,813
2,530(2,458)
2,7702,9342,9172,8122,722
2,3782.3082,3452,604
2,8822,7283,0292,688
2,7572,7962, 7632,5122,044
2,3292,536

Table 2
Monetary Aggregates(Actual and current projections, seasonally adjusted)
STRICTLY CONFIDENTIAL (FR)
December 15, 1972
Narrow Broad Adjusted U.S. Total Time deposits NondepositMononey ney Credit Govt. Time and other Negotiable Sources ofSupply (M) Supply (M2) Proxy Deposits Savings than CD's CD's Funds
(1) (2) (3) (4) (5) (6)Monthly Pattern in Billions of Dollars
239.4 495.0 386.3 5.3 293.7 255.6240.5 498.3 389.3 4.6 297.1 257.7241,6 501.8 392.6 5.3 300.5 260.2242.3 505.0 395.5 6.1 303.4 262.7243.6 508.2 399.4 7.8 305.9 264.6
(245.1) (512.5) (401.1) (5.3) (310.0) (266.8)
Annual Percentage Rates of Change-quarterly and Monthly
1.1 8.0 9.7 iii H:i::'li 15.9 14.7
9.3 13.3 11.3 14.8 17.15.3 8.6 11.1 15.7 11.88.5 9.3 10.7 i il! 13.2 10.1
(7.0) (8.5) (8.5) (iiiiiiii 12.5) (10.0)
14.2 11.3 12.2 iliii 11.6 8.55.5 8.0 9.3 iiiii 13.9 9.95.5 8.4 10.2 iiiiiii 13.7 11.63.5 7.7 8.9 ii.ii ili 11.6 11.56.4 7.6 11.8 iiiliili 9.9 8.7
(10.5) (10.0) (5.0) i iiiiliiiiii (16.0) (10.0)(8.5) (9.0) (8.5) i il ifil : (13.0) ( 9.5)
Weekly Pattern in Billions of Dollars
1972--JulyAug.Sept.Oct.eNov.Dec.
1971--4th Qtr.
1972--let Qtr.2nd Qtr.3rd Qtr.4th Qtr.
1972--JulyAug.Sept.Oct.Nov.Dec.Nov.-Dec.
1972--Aug. 2
9162330
Sept.132027
Oct. 4111825
Nov. I8152229 p
Dec. 6 p13 pe
5.56.05.63.13.4
4.44.95.94.7
6.75,25.26.0
7.28.05.57.08.8
7.87.4
295.1295.6296.5297.6298.9
299.4300.1300.3301.2
302.6302.6303.8304. 1
303.9304.4305.1306.7307.3
308.4309.4
256.5257.0257.7257.8258.5
259.6259.8259.9260.4
262.2262.1262.7263.0
263.4263.3264.3265.1265.5
266.0266.4
flL S A ......................... -
(7) (8)
38.1 3.939.3 4.240.3 4.140.7 4.341.3 4.3
(43.2) (4.4)
:::::;::::::; :::::::::::::::;::::::::::::: ............
;::: ::::: :: ...... ......
38.6 4.138.6 4.138.8 4.139.7 4.440.4 4.1
39.7 4.040.4 4.140.3 4.140.8 4,2
40.4 4.240.5 4.141.0 4.241.0 4.5
40.6 4.641.1 4.040.8 4.341.6 4.441.8 4.4
42-3 4.343.1 4.4
pe - Partially estimated.
Per id
496.2 387.5497.1 388.2498,6 389.8498.3 388.7499.8 390.1
502.2 390.9501.2 391.9501.6 393.2501.5 392.4
504.0 395.1504.8 394.0504.9 394.6505.4 396.3
505.4 397.5506.0 397.7508.5 396,6509.4 400.4508.3 400.9
512.2 402.8511.6 401.9
239.7240.1240.9240.5241.2
242.6241.5241.6241.1
241.8242.7242.2242.3
242.1242.7244.3244.3242.8
246.1245.2
NOTES: Data shown in parentheses are current projections.Annual rates of change other than those for the past are rounded to nearest half per cent.
- .II

STRICTLY CONFIDENTIAL (FR)
DECEMBER 15, 1972
Table 3RESERVE EFFECTS OF
OPEN MARKET OPERATIONS AND OTHER RESERVE FACTORS(Millions of dollars, not seasonally adjusted)
Open Marke.t Operations 1/ Daily Average Reserve Effect 2/ . Ain reserve categores . .aretBills Coupon Agency RP' s3/ Ttal Open Market AMember Other 4/ req. res. against available res. 5/ available
& Accept. Issues Issues Net Operations Bank Borrowing Factors U.S,G. and interb. (6)+(7)+(8)-(9) reserves 5/
(1) (2) (3) (4) (5) (6) (7) (8) (9) (10) (11)
Monthly1972 - June 748 110 127 -1,205 -221 201 -25 -449 -315 42 15
July -543 -- -26 -- -570 463 108 - 89 145 337 360Aug. -906 116 - 3 816 22 -238 237 135 -60 194 100Sept. -158 -- -35 -816 -1,009 -1,617 76 1,370 -403 232 405Oct. Ill 116 -22 -- 205 1,124 59 -378 485 320 335Nov. -548 -51 157 -- -442 -22 6p 32p ,l,76 6p -47 7p -1,483p -760Dec. -255
1973 - Tan
WeeklyOct. 4 221 -- -20 2,155 2,357 993 -114 -201 432 246
11 444 116 -- -1,380 -819 337 99 -457 208 -22918 -119 -- -- -638 -757 -428 -101 917 158 23025 -238 -- - 2 1,989 1,749 -186 331 -688 -423 -120
Nov. I - 75 -- - 9 -1,028 -1,111 117 -210 242 -136 2858 - 3 -- -- 1,084 1,081 600 404 -1,014 176 -186
15 - 26 -51 -- -3,311 -3,389 -599 -465 -498 -204 -1,35822 -415 -- 166 2,259 2,010 -307 -75 -1,211 -217 -1,37629 -105 -- -- -694 -799 -219 153p
272p -
478p 684p
Dec. 6 229 - -- 193 422 671p 15p -4 7
1p 3 19p -104p
13 288 -- -14 1,939 2,213 -42 8p 220p 287p 60p 19p2027
I/ Represents change in System's portfolio from end-of-period to end-of-period; includes redemptions in regular bill auctions.2/ Represents change in daily average level from preceding period.3/ Includes matched sale-purchase transactions as well as RP's.4/ Sum of changes in vault cash, currency ih circulation, Treasury operations, F.R. float, gold and foreign accounts, and other FR accounts.5/ Reserves to support private nonbank deposits. Target change for November and December reflects the mid-point of the target range adopted at the
November 21, 1972 FOMC meeting. Target change for previous months reflects the bluebook patterns that are consistent with the mid-points of targetranges that were adopted during the month,

STRICTLY CONFIDENTIAL (FR)
DECEMBER 15, 1972
Table 4
SECURITY DEALER POSITIONS AND BANK RESERVESMillions of Dollars
U.S. Govt. Security Other Security Member Bank Reserve PositionsPeriod Dealer Positions Dealer Positions
Bills Coupon Issues Corporate Municipal Excess Borrowings Net Free Basic Reserve DeficitBonds Bonds Reserves at FRB Reserves 8 New York 38 Other
(1) (2) (3) (4) (5) (6) (7) (8) (9)
1971 -- High 4,733 2,834 337 556 590 1,180 202 -4,714 -5,499Low 1,350 343 0 30 -61 84 -988 -1,545 -2,569
1972 -- High 4,291 1,585 235 365 796 959 380 -5,635 -4,833Low 1,916 -93 0 40 -133 12 -835 -1,638 -1,910
1971 -- Nov. 2,417 2,462 201 328 263 407 -144 -3,056 -4,063
Dec. 2,544 1,761 170 251 165 107 50 -2,791 -4,375
1972 -- Tan. 3,004 1,416 135 206 173 20 153 -2,667 -4,192Feb. 2,408 1,176 149 136 124 33 91 -3,203 -3,072Mar. 3,489 604 101 185 249 99 150 -3,208 -3,522
Apr. 2,612 274 46 99 136 109 27 -3,026 -3,299May 2,792 675 123 134 104 119 -15 -2,625 -2,652June 2,694 205 87 260 204 94 110 -2,828 -2,864
July 2,262 97 142 166 147 202 -55 -2,945 -2,603Aug. 2,643 692 114 176 255 438 -183 -3,913 -2,801Sept. 4,099 170 53 174 162 514 -352 -3,835 -4,024
Oct. 2,887 207 105 132 247 574 -347 -3,637 -4,044Nov *3,096 *1,039 84 191 418p 606p -188p -4,561 -3,622
1972 -- Oct. 4 3,507 170 51 51 230 436 -206 -3,248 -3,35411 2,904 60 59 166 358 535 -177 -4,292 -4,82218 2,452 197 145 193 109 434 -313 -4,319 -4,44525 2,734 282 235 149 150 765 -615 -2,900 -3,858
Nov. 1 3,114 328 0 173 205 555 -350 -3,272 -3,2258 2,520 1,095 31 254 124 959 -835 -4,475 -3,676
15 2,531 1,117 36 126 786 494 292 -4,902 -3,70722 *3,116 *1,079 121 136 189 419 -230 -4,727 -3,28129 *4,158 *1,001 174 249
354p 572p -218p -4,329 -3,709
Dec. 6 *3,899 * 938 85 322 310p 587p -277p -4,28
4p -4,497p
13 *3,564 * 975 75p 365p 243p 807p -564p -5,635p -4,707p
2027
. . .e..o - -- l -- - --- .. . .. ..- -- a& t - J -- J . .s . .:L 1 J . ... .•I _ t . .Government Security uealer trading positions are of a colmtitment oasis. Lrading posil ons, wnicn excLuoe Ireasury Dills rlnance oy repurcnaseagreements maturing in 16 days or more, are indicators of dealer holdings available for sale over the near-term. Other security dealer positionsare debt issues still 'n syndicate, excluding trading positions. The basic reserve deficit is excess reserves less borrowing at Federal Reserveless net Federal funds purchases. Weekly data are daily averages for statement weeks, except for corporate and municipal issues in syidicate whichare Friday figures.
*STRICTLY CONFIDENTIAL
Noces:

CONFIDENTIAL (FR)
DECEMBER 15, 1972
Table 5
SELECTED INTEREST RATESPer Cent
Short-term ... _ Lon -term
Treasury bills 90-119 day 90-119 day New IsMunicipal S. Gov't. FNMA AuctionPeriods Federal Funds 9T-day [ -year Commercial CD's Ut ey* BMnniBuper (10-Yr. Constant YiPoFeerale-nd -day -year Prie-NYC Aaa Utility* Bond Buyer Maturty YieldsI Paper Pri-NYC Maturlty
(1) (2) (3) (4) (5) (6) (7) (8) (9)
1971 -- High 5.73 5.47 5.94 5.88 5.75 8.26 6.23 6.89 8.07Low 3.29 3.32 3.53 4.00 3.63 7.02 4.97 5.42 7.32
1972 -- High 5.29 5.05 5.52 5.28 5.25 7.60 5.54 6.58 7.72Low 3.18 3.03 3.60 3.75 3.50 6.99 4.96 5.87 7.54
1971 -- Nov. 4.91 4.22 4.49 4.85 4.78 7.38 5.20 5.81 7.71Dec. 4.14 4.01 4.40 4.66 4.58 7.28 5.21 5,93 7.62
1972 -- Jan. 3.50 3.38 3.82 4.03 3.81 7.21 5.12 5.95 7.61Feb. 3.29 3.20 4.06 3.81 3.53 7.34 5.29 6.08 7.61Mar. 3.83 3.73 4.43 4.10 3.98 7.24 5.31 6.07 7.55
Apr. 4.17 3.71 4.65 4.55 4.47 7.45 5.43 6.19 7.58May 4.27 3.69 4.46 4.45 4.33 7.38 5.31 6.13 7.63June 4.46 3.91 4.71 4.60 4.50 7.32 5.34 6.11 7.62
July 4.55 3.98 4.90 4.83 4.75 7.38 5.41 6.11 7.62Aug. 4.80 4.02 4.90 4.75 4.78 7.37 5.30 6.21 7.63Sept. 4.87 4.66 5.44 5.07 5.00 7.40 5.36 6.55 7.64
Oct. 5.04 4.74 5.39 5.21 5.19 7.38 5.19 6,48 7.71Nov. 5.06 4.78 5.20 5.18 5.13 7.09 5.02 6.28 7.70
1972 -- Oct. 4 5.15 4.60 5.48 5.13 5.13 7.44 5.22 6.53 7.69LL 5.09 4.74 5.41 5.25 5.13 7.48 5.16 6.4918 4.91 4.81 5.40 5.25 5.25 7.30 5.23 6.48 7.7225 5.01 4.74 5.35 5.25 5.25 7.34 5.13 6.43
Nov. 1 5.06 4.74 5.34 5.15 5.13 7.27 5.04 6.37 7.728 5.25 4.71 5.17 5.13 5.1J -- 5.10 6.29
15 4.89 4.74 5.18 5.13 5.13 7.12 5.01 6.25 7.7122 4.97 4.79 5.17 5.23 5.13 6.99 4.96 6.2629 5.03 4.87 5.26 5.25 5.13 7.05 4.99 6.29 7.69
Dec. 6 5.17 4.94 5.25 5,28r 5.25 7.15 4.96 6.3113 5.29 5.05 5.27 5.28 5.25 7 .21p 5.03 6.34p 7.672027
NU.O... . .... o .y l.. ti ~ W UWC * L & ~~~lU L.~U t U ....
IoLumn j is a one-oay weanesuay quote. ror columns o an o a Leweekly data is the mid-point of the calendar week over which data are averaged. Columh 7 is a one-day quote for the Thursday following theend of the statement week. Columft 9 gives FIA auction data for the Monday preceding the end of the statement week. The FNMA auction yield isthe implicit yield in weekly or bi-weekly auction for short-term forward commitmehts for Government underwritten mortgages.
*NCw spries--Corporate New Issues Aaa series discontinued.
0 .. : ee y a a or c. umns 0 are statemeki t wee averages of ail data.

Appendix Table I
RESERVES AND MONETARY VARIABLES
CONFIDENTIAL (FR)
December 15, 1972
Reserves Money Stock Measures Bank Credit Measures Other
Available to Adjusted Total Time Thrift U.S.Support Pvt. M M Credit Loans and Total Other than Institution Nondeposit Gov't.
Period Total Nonborrowed Deposits M1 2 3 Proxy Investments Time CD's Deposits CD's Funds Demand
Annually.
1968196919701971
Semi-Annually:
1st Half 19702nd Half 1970
1st Half 19712nd Half 1971
1st Half 1972
Quarterly,
1st Qtr. 19712nd Qtr. 19713rd Qtr. 19714th Qtr. 19711st Qtr. 19722nd Qtr. 19723rd Qtr. 1972
1971: JulyAug.Sept.Oct.Nov.Dec.
1972: Jan.Feb.Mar.Apr.MayJuiheJulyAugSept.Oct.Nov. p
+7.6-1.2-6.0
+7.3
+0.4+11.6
+9.64.7
+11.6
+8.9+10.0
+7.2+2.2
+10 1+12.8
+3.6
+4.4+4.1
+12.9-7.4+3.4
+10.7
+20.2-5.9
+15.8+22.9
+6.9+8.4+2.9+8.8-0.8
+15.4+11.5
(4)
(Per Cent
+7.8+3.2+5.4+6.2
-5.6-2.7+9.2+8.0
+3.0+15.2
+9.3+6.5
+12.1
+9.5+9.0+6.0+6.8
+11.0+13.0
-2.0
-7.6+2.8
+22.9-2.8+2.0
+21.4
+23.1-3.6
+13.3+22.2
+7.5+8.8-1.6+3.4-7.8
+14.7+ 9.3
+8.6-2.7+8.1+7.8
+5.2+10.6
+10.9+4.6
+9.0
+10.8+10.6+4.3+4.8
+10.8+7.1
+16.0
+6.8+6.9-0.8+3.6+5.9+4.8
+9.2+7.4
+15.6+7.0+6.2+7.9+8.6+7.5
+13.7
+2.8+13.7
(5) (6)
Annual Rates of
+9.3 +8.3+2.3 +2.8+8.1 +7.8
+11.1 +13.3
+5.8 +5.0+10.1 +10.3
+15.5 +17.0+6.3 +8.8
+11.1 +13.4
+18.1 +18.9+12.4 +14.4+4.4 +7.8+8.0 +9.6
+13.3 +15.5+8.6 +10.8+9.3 +11.6
+7.5 +10.5+2.9 +6.6+2.9 +6.2+7.1 +9.1+6.5 +8.7
+10.2 +11.0
+13.4 +15.4+14.3 +16.7+11.6 +13.8+7.2 +10.9+7.7 +9.7
+10.6 +11.5+11.3 +13.5+8.0 +10.7+8.4 +10.4+7.7 +10.4+7.6 +9.1
(7)
Growth)
+9.7+0.6+8.3+9.5
+4.8+11.4
+9.7+8,8
+11.3
+10.9+8.4+7.6+9.7
+11.3+11.1+10.7
+10.7+4.1+7.9+4.8
+11.2+13.1
+9.9+5.9
+17.7+13.5+14.7+4.7
+12.2+9.3
+10.2+8.9
+11.8
+11.0+3.9+8.1
+11.3
+5.2+10.8
+11.5+10.6
+12.8
+12.3+10.3
+9.7+11.1+15.7
+9.5+13.6
+6.2+11.9+10.9+11.9
+6.2+14.9
+14.2+12.4+19.9
+5.4+70.0
+2.3+10.2+18.3+11.9+11.4
+20.6
(10)
+11.3-4.9
+17.9+17.9
+8.4+26.3
+22.3+12.2
+15.6
+28.8+14.7
+8.2+15.9+14.8+15.7+13.2
+9.4+4.2
+10.7+17.1
+9.1+20.8
+20.0+16.2
+7.8+12.4+17.8+16.3+11.6+13.9+13.7+11.6
+9.9
+11.1+1.4
+11.0+16.2
+6.0+15.6
+21.2+10.1
+14.7
+27.5+14.0
+5.3+14.7+17.1+11.8+10.1
+4.8+3.2+7.9
+13.7+13.0+17.0
+24.4+15.4+10.8+7.8
+12.6+14.8
+8.5+9.9
+11.6+11.5
+8.7
(12) (13)
(Dollar Change in
+2.8 +2.6-12.6 +13.0414.5 -8.4
+7.9 -7.6
+6.4+3.4+7.7
+17.5
+4.7+10.6
+20.1+13.5
+17.9
+21.9+17.3+13.7+12.8+20.5+14.5+15.7
+16.7+10.3+13.8+13.0+11.4+13.7
+23.9+17.6+19.0+15.8+10.6+16.6+18.3+12.3+15.8+13.5+10.4
+0.7
-9.1
-_ 1
(14)
Billions)
-0.1+0.3+1.1-0.3
+0.4+0.7
-2.1+1.8
-0.8
-2.4+0.3+2.3-0.4-0.1-0.8
+0.8+0.6+0.9-1.9+0.7+0.8
+0.1-2.6+2.4+1.3
-2.1
-0.7+0.7+0.7
+1.7
NOTE: Reserve requirements on Eurodollar borrowings are included beginning October 16, 1969, ahd requirements on bank-related commercial paper are included beginningOctober 1, 1970.
+5.6+5.2
+10.0+2.4
+7.4
+9.1+10.6
+3.7+1.1+9.3+5.3+8.5
+10.1+3.2-2.1+0.5
+2.6
+3.2+12.6+11.9
+7.7+7.6+5.6
+14.2+5.5+5.5+3.5+6.4
+2.6+11.9
43,9
+4.1
+3.7
+2.6+1.3+2.3+1.8-0.1+3.7+3.2
+1.1+0.4+0.8+1.1-0.5+1.2
-0.2+0.6-0.4+1.3+1.6+0.8+1.0+1.2+1.0+0.4+0.6

Appendix Table II
RESERVES AND MONETARY VARIABLES(Seasonally adjusted, billions of dollars)
CONFIDENTIAL (FR)
December15, 1972
Reserves Money Stock Measures Bank Credit Measures Other
Available to Adusted Total Time Thrift Non- U.S.Non- Support pvt. M1 Credit Loans and Total Other than Institution Deposit Gov't.
Period Total borrowed Deposits Total IPvt. De. M2 3 Proxy Investments Time CD's Deposits CD's Funds Demand
Annually:nee. 1968Dec. 1969Dec. 1970
Monthly:1971--.Tan.
Feb.Mar.
Apr.MayJune
July
Aug.Sept.
Oct.Nov.Dec.
1972--Jan.Feb.Mar.
Apr.MayJune
JulyAug.Sept.
Oct.Nov. p
Wekly:1972--Sept. 6
132027
Oct. 4111825
Nov. 18
152229 p
Dec. 6
p
(3) (4) (5(1) (2)
27.249 26.47127.977 26.82929.132 28.764
29.390 28.95829.600 29,24029.779 29.445
29.991 29,85930.327 30.10630.527 30.106
30.639 29.91530.743 29.98531.073 30.556
30.882 30.48530.970 30.53531.246 31.079
31.772 31.67831.616 31.58232.032 31.931
32.643 32.52532.830 32.72833.059 32.967
33,138 32.92433,382 33.01633.360 32,802
33.788 33.20531.843 31.191
33.775 32.93832.765 32,61733.370 32.58633.398 32.815
33.806 33.37933.828 33.27633.802 33.38833.764 32.837
33.741 33.14133.788 32.74231.966 31.47430.630 30.14730.807 30.202
31.208 30,579
24.96325.24526.747
26.93027.13227.470
27.73527.93528.199
28.35828.52128.503
28.58828.72828.844
29.064229.24429.625
29.79829.95130.148
30.36530.55530.903
30.97529.313
31.39730.45731.02530.794
30.92531.09930.77231.076
30.98430.99129. 20328. 11828.763
28,878
197.4203.7214.8
215.3217.7219.7
221.2223.8225.5
227.4228.0227.6
227.7227.7228.2
228.8231.2233.5
235.0235.5236.6
239.4240.5241.6
242.3243.6
242.6241.5241.6241.1
241.8242.7242.2242.3
242.1242.7244.3244.3242.8
246.1
(9)(6) (7) (8)
378.0 572.6 304.6368.8 588.3 305.4418.2 634.0 330.6
423.1 642.2 333.4430.4 653.4 336.7437.1 663.9 339.6
441.5 672.5 342.0446.6 681.0 344.5450.6 687.8 346.7
453.4 693.8 349.8454.5 697.6 351.0455.6 701.2 353.3
458.3 706.5 354.7460.8 711.6 358.0464.7 718.1 361.9
469.9 727.3 364.9475.5 737.4 366.7480.1 745.9 372.1
483.0 752.7 376.3486.1 758.8 380.9490.4 766.1 382.4
495.0 774.7 386.3498.3 781.6 389.3501.8 788.4 392.6
505.0 795.2 395.5508.2 801.2 399.4
502.2 i :ii::::i 390.9501.2 li) 391.9501.6 ii':::; 393.2501.5 iiiiiiii 392.4
504.0 [ ii;!; !!) 395.1504.8 liiii iii 394.0504.9 ::: :::::: 394.6505.4 iiiiiii 396.3505.4 :::::::::: 97505.4 iiiiiiii 397.5506.0 387:: 397.7508.5 iiiiiiii 396.6509.4 ::::: 400.4508.3 400.9
512.2 iiiH 402.8
iiiiiiiiiii
:::::::::
iiiiiii11,.::::: :
443.6449.0452.4
455.2458.9464.1
466.5471.1475.4
480.1482.6488.6
494.4499.5507.8
510.1518.6519.8
524.2532.2537.5
542.6551.9
::::::::::::
::I::::::::::
:::::::::::::
. ::::::
* ::::I:' ::::::
' :: i:::
(11) (12)(10)
204.2194.1228.9
234.4240.2245.4
248.1251.3254.4
256.4257.3259.6
263.3265.3269.9
274.4278.1279.9
282.8287.0290.9
293.7297.1300.5
303.4305.9
299.4300.1300.3301.2
302.6302.6303.8304.1
303.9304.4305.1306.7307.3
308.4
219.2223.0226.8
231.0234.4237.2
240.4243.1245.6
248.3250.8253.4
257.4261.8265.8
269.7272.6275.7
279.7283.3286.6
290.1293.0
iiiiiiiiiii
::::::::I..iiiii!! .111. 111 1.:!:::
(14) (15)(13)
23.611.025.5
26.627.528.1
27.828.529.4
30.430.831.6
32.732.233.4
33.233.833.4
34.736.337.1
38.139.340.3
40.741.3
39.740.440.340.8
40.440.541.041,0
40.641.140.841.641.8
42.3
NOTE: Reserve requirements on Euro-dollar borrowings are included beginning October 16, 1969, and requirements on bank-related commercial paper are included beginningOctober 1, 1970. Adjusted credit proxy includes mainly total member bank deposits subject to reserve requirements, bank-related commercial paper, and Euro-dollarborrowings of U.S. banks. Weekly data are daily averages for statement weeks. Monthly data are daily averages except for nonbank commercial paper figures whichare for last day of month. Weekly data are not available for M3, total loans and investments and thrift institution deposits.
p = Preliminary.