
Fomc 19720215 Green Book 19720209
81
Prefatory Note The attached document represents the most complete and accurate version available based on original copies culled from the files of the FOMC Secretariat at the Board of Governors of the Federal Reserve System. This electronic document was created through a comprehensive digitization process which included identifying the best- preserved paper copies, scanning those copies, 1 and then making the scanned versions text-searchable. 2 Though a stringent quality assurance process was employed, some imperfections may remain. Please note that some material may have been redacted from this document if that material was received on a confidential basis. Redacted material is indicated by occasional gaps in the text or by gray boxes around non-text content. All redacted passages are exempt from disclosure under applicable provisions of the Freedom of Information Act. 1 In some cases, original copies needed to be photocopied before being scanned into electronic format. All scanned images were deskewed (to remove the effects of printer- and scanner-introduced tilting) and lightly cleaned (to remove dark spots caused by staple holes, hole punches, and other blemishes caused after initial printing). 2 A two-step process was used. An advanced optical character recognition computer program (OCR) first created electronic text from the document image. Where the OCR results were inconclusive, staff checked and corrected the text as necessary. Please note that the numbers and text in charts and tables were not reliably recognized by the OCR process and were not checked or corrected by staff. Content last modified 6/05/2009.
-
Upload
fraser-federal-reserve-archive -
Category
Documents
-
view
227 -
download
0
Transcript of Fomc 19720215 Green Book 19720209

Prefatory Note The attached document represents the most complete and accurate version available based on original copies culled from the files of the FOMC Secretariat at the Board of Governors of the Federal Reserve System. This electronic document was created through a comprehensive digitization process which included identifying the best-preserved paper copies, scanning those copies,1
and then making the scanned versions text-searchable.2
Though a stringent quality assurance process was employed, some imperfections may remain. Please note that some material may have been redacted from this document if that material was received on a confidential basis. Redacted material is indicated by occasional gaps in the text or by gray boxes around non-text content. All redacted passages are exempt from disclosure under applicable provisions of the Freedom of Information Act. 1 In some cases, original copies needed to be photocopied before being scanned into electronic format. All scanned images were deskewed (to remove the effects of printer- and scanner-introduced tilting) and lightly cleaned (to remove dark spots caused by staple holes, hole punches, and other blemishes caused after initial printing). 2 A two-step process was used. An advanced optical character recognition computer program (OCR) first created electronic text from the document image. Where the OCR results were inconclusive, staff checked and corrected the text as necessary. Please note that the numbers and text in charts and tables were not reliably recognized by the OCR process and were not checked or corrected by staff.
Content last modified 6/05/2009.
CONFIDENTIAL (FR)
CURRENT ECONOMIC AND FINANCIAL CONDITIONS
February 9, 1972
By the StaffBoard of Governors
of the Federal Reserve System
TABLE OF CONTENTS
Section Page
DOMESTIC NONFINANCIAL SCENE
Summary and GNP outlook . . .Industrial production. . . . . . .Retail sales .. . . . ......Consumer durables. . . ....Consumer credit . . . . . . . .Census consumer buying survey. . .Construction and real estate . .Manufacturers' orders . . . . . .Inventories . . . . . . . . . . .Cyclical indicators. . . . . . . .Capital spending plans for 1972. .Labor market . . . . . . . . . .Productivity . . . . . . . . . .Earnings . . . . . . . . . . . . .Collective bargaining. . . . . . .Industrial relations . . . . . . .Wholesale prices . . . . . . . .Consumer prices . . . . . . . . .
DOMESTIC FINANCIAL SITUATION
Summary and outlook. . . . . . . . . . . . . . . .Monetary aggregates. . . . . . . . . . . . . . . .Bank credit . . . . . . . . . . . . . . . .Other financial institutions and mortgage markets.Short-term markets . . . . . . . . . . . .Long-term securities markets . . . . . . . . .Federal finance. . . . . . . . . . . . . . . . ..
INTERNATIONAL DEVELOPMENTS
Outlook. . . . . . . . . . . .. . . . •Balance of payments. . . . . . . . . . . . .Foreign exchange markets . . . . . .. . . ..Business situation in Western Europe and Japan . .
- 1- 7-8-9-11-12-13-16-16-17-19-20-22-24-25-26-28-31
- 1-4- 6- 8-12-13-18
- 3- 5-8-10
r r
. . . . . .

DOMESTIC NONFINANCIALSCENE
February 8, 1972
SELECTED DOMESTIC NONFINANCIAL DATA
(Seasonally adjusted)
Per Cent Change* From1971 1972 1 mo. 3 mos. Year
Oct. Nov. Dec. Jan. ago ago ago
Civilian labor force (mil.)Unemployment rate (%) 5Insured unempl. rate (%)-
Nonfarm employment, payroll (mil.)ManufacturingNonmanufacturing
Industrial production (1967=100) /
Final products, topalConsumer goodsBusineps equipment
Materials
Capacity util. rate, mfg.-
Wholesale prices (1967z100)1 / 5 /
Industrial commodities (FR)Sensitive materials (FR)
Farm products, foods & feeds
Consumer prices (1967=100)1/ 5/FoodCommodities except foodServices
Hourly earnings, pvt. nonfarm ($)Hourly earnings, mfg. ($)Weekly earnings, mfg, ($)Net spend. weekly earnings, mfg.
(3 dependents 1967 $) 1/ 5/
Personal income ($ bil.) 2/ 5/
Retail sales, total ($ bil.) 5/Autos (million units) 2/GAAF ($ bil.) 3/ 5/
12 leaders, composite (1967=100) 5/
Selected leading indicators:Housing starts, pvt. (thous.)2/ 5/Factory workweek (hours)Unempl. claims, initial (thous.)5/New orders, dur. goods, ($ bil.)5/
Capital equipmentCommon stock prices (41-43=10)
84.85.84.5
70.818.652.3
106.4105.0116.0
97.3105.8
74,1
114.4114.8115,4113.0
122.4118.9118.0130.0
3.483.60
143.57
102.49
871.2
35.010.2
9.1
129.3
2,03139.8
31331.1
8.197.29
85.16.04.2
71.018.652.4
107.0106,3117.9
97.8105.6
74.Q
114.5114,7115.3113.6
122.6119.0118.1130.4
3.483.60
144.72
102.78
874.9
35,69.59.3
130.5
2,30340.1
30432.6
8.492.78
85.26.03.8
71.218.652.6
107,8106.4117.898.5
107.5
73.9
115.4115.2116.1115,9
123.1120.3118.1130.8
3.513,68
147.81
105.81
883.8
34.67.89.0
133.4
2,51740.3
26832.1
8.599.17
85.75.9
n.a.
71.418.652.8
n.a.n.a.n.a,n.a.n.a.
n.a.
n.a.n.a.n.a.n.a.
n.a.n.a.n.a,n.a.
3.533.68
147.78
0.30.20.4
0,70,1-0.10.71.8
0.80.31.0
1.51.72.40.71.2
0.8 0,80.4 0.30.7 -0.22.0 2.6
0.41.10.00.3
0.71.00.60.8
0.6 1.40.0 2.20.0 2.9
n.a. 2.9
n.a. 1.0
n,a.8.6
n.a,
n.a.
n.a.39.9n.a,n.a.n.a.
103.30
-2,610.1-3.0
2.2
9.3-1.06/11.7--1.3
0.94.2
3.5
1.6
-1.6-16.1
-0.3
4.4
25.70.317.9-
3.66.36.2
Based on unrounded data. 1/ Not seasonally adjusted. 2/Gen'l. merchandise, apparel, and furniture and appliances.Per cent calculated to December 1971. 6/ Sign reversed.
Annual rates.4/ Actual figures.
2.4/6. I 4t4/4.0-
1.4-0.72.1
3.14.16.33.02.0
n,a.
4,03.46.76.0
3.44.32.34.1
6.05.76,0
5.3
7.7
9.14.07.4
15.0
22.50.36/8.2-6.68.1
10.5

I - 1
DOMESTIC NONFINANCIAL SCENE
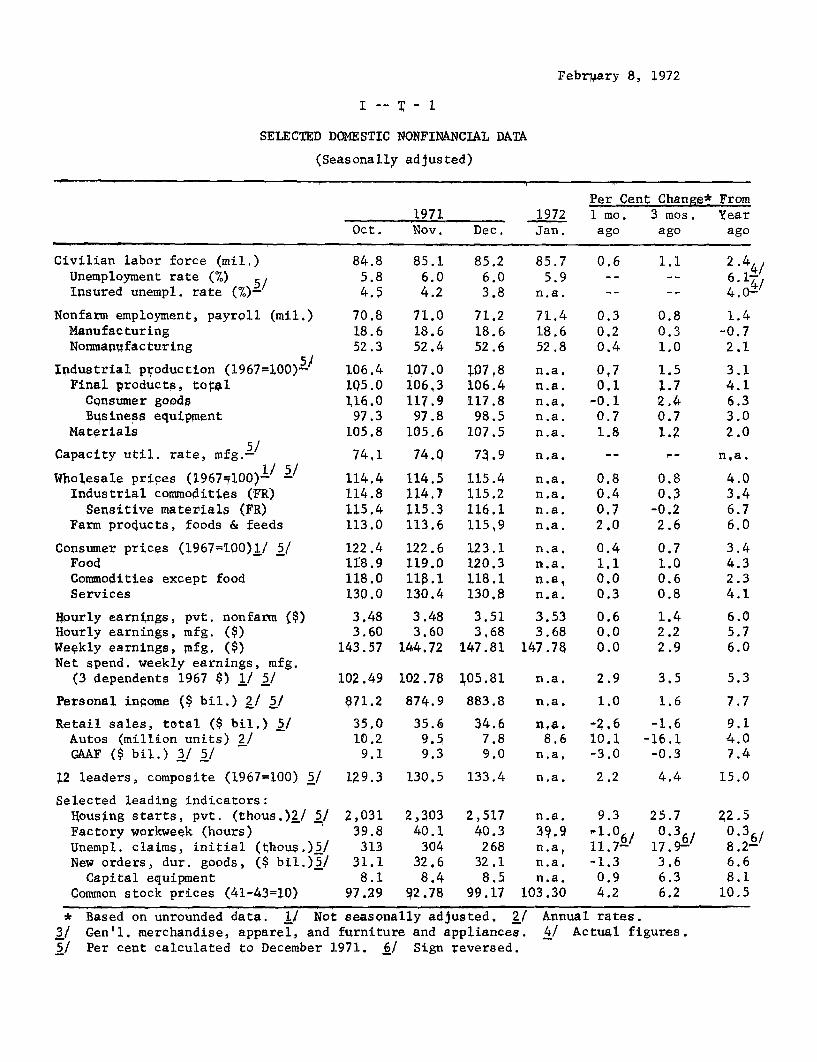
Summary and GNP outlook. Real GNP increased at an annual
rate of around 6 per cent in the fourth quarter, according to present
estimates, following significant downward revisions of the rate of
expansion in the middle quarters of the year. Industrial production
in the fourth quarter increased at an annual rate of about 4 per cent.
In January, industrial production is tentatively estimated to
be about the same as in December. New orders for capital equipment
increased in December for the third consecutive month, and for the quarter
were up 6 per cent.
Consumer spending continues to rise at a moderate pace. Unit
sales of domestic--and also of imported--autos picked up strength in
January after a poor December, although sales were still well below the
performance during the 90 day freeze. Total retail sales are estimated
to have risen somewhat in January, with some strength in furniture and
appliances and nondurable goods. The exceptionally large rise in
housing starts in December reflected mainly a year-end bulge in Govern-
ment sponsored programs.
Nonfarm payroll employment increased substantially further in
January. In manufacturing, however, the increase was small and the
workweek declined after several months of rise. The increase in average
hourly earnings for the private nonfarm economy slowed in January,
following the post-freeze December bulge. The unemployment rate edged
down to 5.9 per cent from 6.0 per cent in December.

I-2
The latest available price indexes relate to December,
when both consumer and industrial prices spurted, as expected, following
the end of the freeze. But prices of farm products and foods--largely
uncontrolled--rose very sharply, and available information suggests
that such prices at retail may still be adjusting to the higher whole-
sale quotations.
Gross national product--outlook. The staff has shaded down
its GNP projection for the year 1972. Nominal GNP is now projected to
increase $96 billion (rather than $100 billion) and real GNP 5.6 per cent
(rather than 6.0 per cent). The staff continues to assume relatively
successful Phase II policies and a moderation in the rate of increase
of the GNP price measures to under 3 per cent in the second half of
the year. Employment gains are projected to be substantial but in view
of prospective increases in the labor force and in productivity, the
decline in the unemployment rate is expected to be moderate--from
5.9 per cent in the fourth quarter of 1971 to 5.4 per cent in the fourth
quarter of this year. For purposes of this projection, monetary policy
is assumed to involve expansion in M1 in a 6-7 per cent range and no
substantial increase on balance in long-term rates during at least the
first half of the year.
The quarterly GNP pattern has been modified somewhat, as
may be seen in the table. In the current quarter, however, current
dollar GNP is projected to increase $30.0 billion and real GNP at an
annual rate of 5.9 per cent; these are virtually identical with our
preceding projections.

I-3
GNP PROJECTIONS
Per cent increase, annual rateChange in Private GNP
Nominal GNP fixed weight Unemployment$ billion Real GNP price index rate
1/7/72 Current 1/7/72 Current 1/7/72 Current 1/7/72 Current
19.5 19.6
29.9 30.0
27.0 26.5
28.0 25.5
28.0 27.6
5.7 6.1
5.8 5.9
6.6 6.5
6.9 6.1
6.8 6.7
1.6 1.6
4.0 4.0
3.1 3.1
2.9 2.9
2.8 2.8
6.0 5.9
5.9 5.8
5.8 5.7
5.6 5.6
5.4 5.4
Smaller prospective increases in personal and disposable in-
come have led the staff to scale down a little further the projected
increase over the year in consumer spending. This also seems consistent
with the moderate nature of recent advances in consumer spending--along
with surveys that indicate continued consumer cautiousness.
The expansive thrust expected over the next year from net
exports of goods and services has been cut back. This has been done
principally because the benefits of the currency realignments for the
U.S. current account are now judged to take longer to be realized than
earlier assumed.
Federal purchases of goods and services, in line with the
recent Budget message, are projected to show an increase of about
$6 billion from late 1971 to late 1972. This is about the same as in
the last projection. But the quarterly pattern has been modified. A
1971-IV
1972-I
1972-II
1972-III
1972-IV
I-4
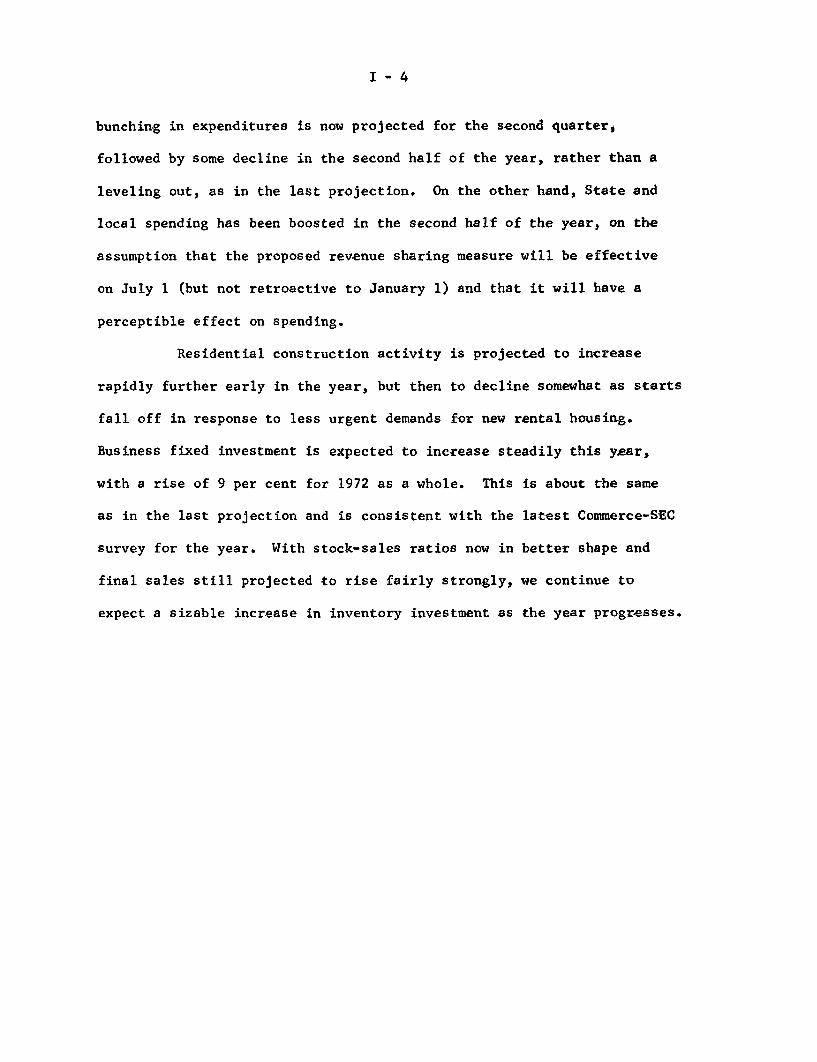
bunching in expenditures is now projected for the second quarter,
followed by some decline in the second half of the year, rather than a
leveling out, as in the last projection. On the other hand, State and
local spending has been boosted in the second half of the year, on the
assumption that the proposed revenue sharing measure will be effective
on July 1 (but not retroactive to January 1) and that it will have a
perceptible effect on spending.
Residential construction activity is projected to increase
rapidly further early in the year, but then to decline somewhat as starts
fall off in response to less urgent demands for new rental housing.
Business fixed investment is expected to increase steadily this year,
with a rise of 9 per cent for 1972 as a whole. This is about the same
as in the last projection and is consistent with the latest Commerce-SEC
survey for the year. With stock-sales ratios now in better shape and
final sales still projected to rise fairly strongly, we continue to
expect a sizable increase in inventory investment as the year progresses.

I-5
CONFIDENTIAL - FR February 9, 1972
GROSS NATIONAL PRODUCT AND RELATED ITEMS(Quarterly figures are seasonally adjusted. Expenditures and income
figures are billions of dollars, with quarterly figures at annual rates.)
1971p 1972 1971 1972Proj. Projected
III IVp I II III IV
Gross National ProductFinal purchases
PrivateExcluding net exports
Personal consumption expendituresDurable goodsNondurable goodsServices
Gross private domestic investmentResidential constructionBusiness fixed investmentChange in business Inventories
Nonfarm
Net exports of goods and servicesExportsImports
Gov't. purchases of goods & servicesFederal
DefenseOther
State & local
Gross national product inconstant (1958) dollars
GNP implicit deflator (1958 = 100)
Personal incomeWage and salary disbursements
Disposable incomePersonal saving
Saving rate (per cent)
Corporate profits before taxCorp. cash flow, net of div. (domestic)
Federal government receipts andexpenditures (N.I.A. basis)
ReceiptsExpendituresSurplus or deficit (-)
High employment surplus or deficit(-)
Total labor force (millions)Armed forces "Civilian labor force "Unemployment rate (per cent)
Nonfarm payroll employment (millions)Manufacturing
Industrial production (1967 = 100)
Capacity utilization, manufacturing(per cent)
Housing starts, private (millions, A.R.)
Sales new autos (millions, A.R.)Domestic modelsForeign models
1046.81044.7
811.6810.9
662.2100.4278.8283.0
150.840.6
108.22.11.5
1142.51135.3878.7878.2
713.5109.6299.3304 6
171.946.8
117 97.27.1
1053.41054.6820.8820.8
668.9102.9280.2285.8
150 842.7
109 3-1.2-2 0
1073.0 -1071.2 -830.3-'832.3
677.7103.2283.9290.6
156.5-44.2
110.41/
1.9/I..O-/
1/0.7 0.5 0.0 -2.01
65.5 72.5 68 2 61.2-1
64.8 72.0 68.2 63.2-'
233.197.671.426.2
135.4
256.6106.8
75.831.0
149.7
233.897.670.227 4
136.2
240.9100.671.529.2
140.3
739.5 781.2 740.7 751.7-141.6 146.2 142.2 142.7
857.0574.2741.2
60.48.1
919.5621.5795.2
62.67.9
864.6577.3748.5
61.08.2
876.6586.9754.8
58.47.7
1103.01098.7
849.8850.6
690.8105.0289.5296.3
164.146.9
112.94.33.8
1129.51124.3
869.1868.6
705.3108.0295.8301.5
168.547.4
115.95.25.0
1155 01146.8
888.1886.9
720.5111.0302.3307.2
174 6
47.0119.4828.2
1182 6
1171.4
908,0
906 8
737 4
114 5
309 5
313.4
180 6
46 0
123 4
11 2
11.2
-0.8 0.5 1 2 1.270.3 71.6 73.1 74 971.1 71.1 71.9 73 7
248.9105.5
75.030.5
143.4
255.2108.2
76.531.7
147.0
258.7107.2
75.931.3
151.5
263 4
106 4
75.9
30.5
157.0
762.8 775.1 786.9 800.1144.6 145.7 146.8 147.8
894.9604.0770.460.7
7.9
909.7615.5787.563.2
8.0
927.8626 5803.9
64 28.0
945.7640.0818.8
62 17.6
2/85.2 97.0 85.8 85.0- 89.0 94 0 99.0 10t.080.8 95.4 82.4 84.7- 89.0 93.1 97 2 102.2
198.7222.0-23.3
215.1248.2-31.1
197.8224.6-26.7
2/203.1-229.4-26.3'-
211.6239.5-27 9
211.5248.5-37.0
215.7
251.9-36.2
221.4253 4
-32.0
2.7 -6.4 2.3 6.9 0.8 -7.6 -10.0 -8.8
86.9 88.9 87 0 87.7 88.4 88.6 89.0 89.52.8 2.5 2.8 2.7 2 6 2.5 2.5 2.5
84.1 86.4 84.2 85.0 85.8 86.1 86.5 87.06.0 5.6 6.0 5.9 5.8 5.7 5.6 5.4
70.7 72.2 70.6 71.0 71.5 71.9 72.3 72.918.6 18.9 18.5 18.6 18.7 18.8 18.9 19.1
106.3
78.2
2.0510.138.681.46
112.8
75 9
2.1110.519.091.42
105.9
73.9
2.1610.278.741.53
107 1
74.0
2.2810.439.181.25
109.0
74.6
2.2010.108.751.35
111 6
75.4
2.1510.409.001.40
114 0
76 2
2.1010.659.201.45
116 5
77 2
2.0010.909.401.50
1/ Data now available suggest that net exports of goods and services will be revised to show a deficit in the
fourth quarter of about $4.5 billion, annual rate, (a downward revision of $2.5 billion) and that invertory
accumulation will be shown to be larger than is now indicated by the figures for the fourth quarter by about
as much as the downward revision in net exports. Thus, these revisions taken together would not change the
preliminary estimate of GNP, but total and private final purchases would be lower. New data for other
sectors may also result in revisions in the preliminary estimates.
2/ Estimated.
I -6
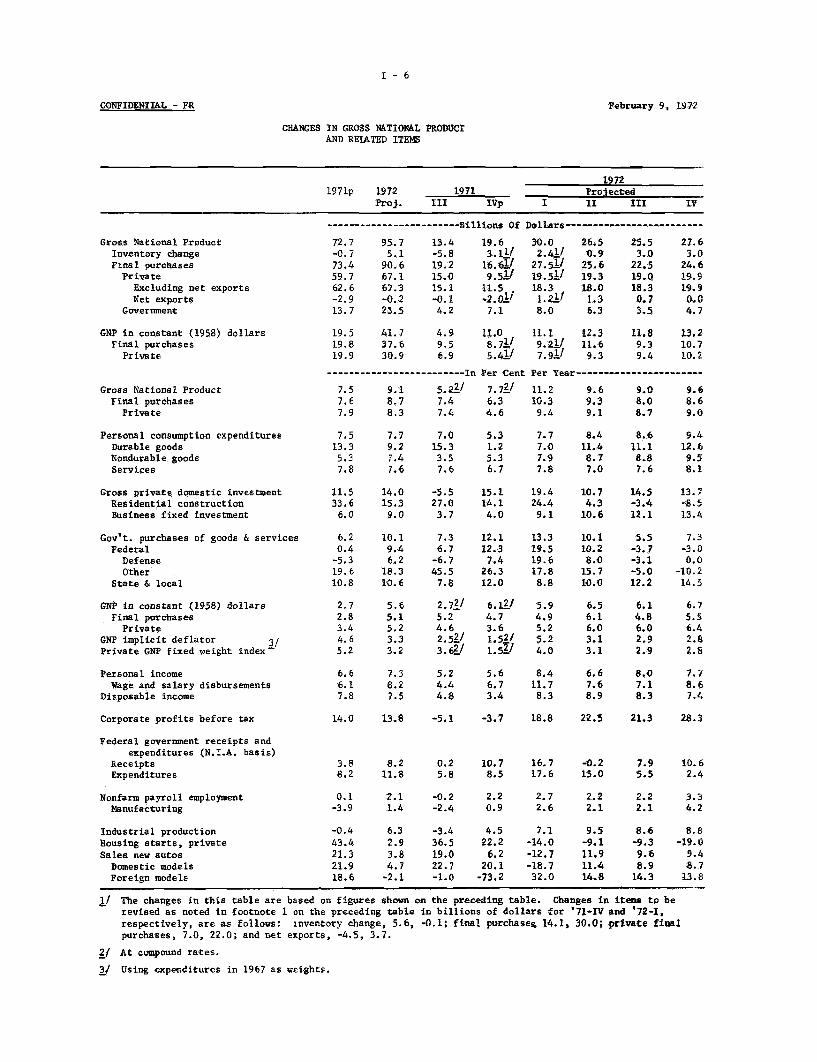
CONFIDENTIAL - FR February 9, 1972
CHANGES IN GROSS NATIONAL PRODUCTAND REIATED ITEMS
19721971p 1972 1971 Projected
Proj. III IVp I II III IV
----------------------- Billions Of Dollars----------------------
Gross National ProductInventory changeFinal purchasesPrivateExcluding net exportsNet exports
Government
GNP in constant (1958) dollarsFinal purchasesPrivate
Gross National ProductFinal purchases
Private
72.7 95.7 13.4 19.6 30.0 26.5 25.5 27.6-0.7 5.1 -5.8 3.111 2.411 0.9 3.0 3.073.4 90.6 19.2 16.6'/ 27.511 25.6 22.5 24.659.7 67.1 15.0 9.51/ 19.51/ 19.3 19.0 19.962.6 67.3 15.1 11.5 8.3 3 18.0 1.3 19.9-2.9 -0.2 -0.1 -2. 1/ 1.211 1.3 0.7 0.013.7 23.5 4.2 7.1 8.0 6.3 3.5 4.7
19.5 41.7 4.9 11.0 11.1 12.3 11.8 13.219.8 37.6 9.5 8.7
17 9.21/ 11.6 9.3 10.719.9 30.9 6.9 5.41/ 7 . 9 1i 9.3 9.4 10.2
------------------------- In Per Cent Per Year-----------------------
7.5 9.17.6 8.77.9 8.3
5.21/ 7.71/ 11.2 9.6 9.0 9.67.4 6.3 10.3 9.3 8.0 8.67.4 4.6 9.4 9.1 8.7 9.0
Personal consumption expendituresDurable goodsNondurable goodsServices
Gross private domestic investmentResidential constructionBusiness fixed investment
Gov't. purchases of goods & servicesFederalDefenseOther
State & local
GNP in constant (1958) dollarsFinal purchases
PrivateGNP implicit deflator 3/Private GNP fixed weight index-
Personal incomeWage and salary disbursements
Disposable income
Corporate profits before tax
Federal government receipts andexpenditures (N.I.A. basis)
ReceiptsExpenditures
Nonfarm payroll employmentManufacturing
Industrial productionHousing starts, privateSales new autos
Domestic modelsForeign models
7.5 7.7 7.0 5.313.3 9.2 15.3 1.25.3 7.4 3.5 5.37.8 7.6 7.6 6.7
7.7 8.4 8.6 9.47.0 11.4 11.1 12.67.9 8.7 8.8 9.57.8 7.0 7.6 8.1
11.5 14.0 -5.5 15.1 19.4 10.7 14.5 13.733.6 15.3 27.0 14.1 24.4 4.3 -3.4 -8.56.0 9.0 3.7 4.0 9.1 10.6 12.1 13.4
6.2 10.1 7.3 12.1 13.3 10.1 5.5 7.30.4 9.4 6.7 12.3 19.5 10.2 -3.7 -3.0-5.3 6.2 -6.7 7.4 19.6 8.0 -3.1 0.019.6 18.3 45.5 26.3 17.8 15.7 -5.0 -10.210.8 10.6 7.8 12.0 8.8 10.0 12.2 14.5
2.7 5.6 2.71/ 6.12/ 5.9 6.5 6.1 6.72.8 5.1 5.2 4.7 4.9 6.1 4.8 5.53.4 5.2 4.6 3.6 5.2 6.0 6.0 6.44.6 3.3 2.51/ 1.52/ 5.2 3.1 2.9 2.85.2 3.2 3.61. 1.5 ' 4.0 3.1 2.9 2.8
6.6 7.36.1 8.27.8 7.5
5.2 5.6 8.4 6.6 8.0 7.74.4 6.7 11.7 7.6 7.1 8.64.8 3.4 8.3 8.9 8.3 7.4
14.0 13.8 -5.1 -3.7 18.8 22.5 21.3 28.3
3.8 8.2 0.2 10.7 16.7 -0.2 7.9 10.68.2 11.8 5.8 8.5 17.6 15.0 5.5 2.4
0.1 2.1 -0.2 2.2 2.7 2.2-3.9 1.4 -2.4 0.9 2.6 2.1
2.2 3.32.1 4.2
-0.4 6.3 -3.4 4.5 7.1 9.5 8.6 8.843.4 2.9 36.5 22.2 -14.0 -9.1 -9.3 -19.021.3 3.8 19.0 6.2 -12.7 11.9 9.6 9.421.9 4.7 22.7 20.1 -18.7 11.4 8.9 8.718.6 -2.1 -1.0 -73.2 32.0 14.8 14.3 13.8
1/ The changes in this table are based on figures shown on the preceding table. Changes in items to berevised as noted in footnote 1 on the preceding table in billions of dollars for '71-IV and '72-1,respectively, are as follows: inventory change, 5.6, -0.1; final purchases 14.1, 30.0; private finalpurchases, 7.0, 22.0; and net exports, -4.5, 3.7.
2/ At compound rates.
3/ Using expenditures in 1967 as weights.

I- 7
Industrial production. Industrial production is tentatively
estimated to have changed little in January. Available weekly pro-
duction data for January indicate that output of paperboard, crude
oil, and petroleum products was maintained while production of raw
steel and trucks increased. Auto assemblies for the month, however,
declined from an 8.6 million unit rate in December to an 8.1 million
rate in January. Production schedules for February and March reportedly
are at an 8.4 and 8.3 million unit rate, respectively.
Production worker manhours in manufacturing declined 0.3
per cent in January. But the decline is being partially discounted
because of the unusually large rise in average weekly hours from
September to December, 0.8 hours, followed by the decline in January.
And the number of manufacturing production workers increased by 43,000
from December to January.
INDUSTRIAL PRODUCTION1967=100, annual averages
Per cent change
Total index
Consumer goodsAutosHome goodsApparel & staples
Business equipmentDefense equipment
Intermediate productsConstruction products
Materials, totalDurable
SteelNondurable
p--preliminary
1969
110.7
111.1111.4111.6110.1
107.9103.2
112.0113.0
112.4112.2113.0112.8
1970
106.7
110.386.6
107.6112.4
101.187.9
111.9110.6
107.8103.4105.3112.5
p1971
106.3
115.3108.3111.6115.7
96.277.6
112.8112.9
106.7100.896.5
113.4
1969-1971
-4.0
3.8-2.8
.05.1
-10.8-24.8
.7-.1
-5.1-10.2-14.6
.5
1970-1971
-.4
4.525.13.72.9
-4.8-11.7
.82.1
-1.0-2.5-8.4
-. 8

I-8
Retail sales. Judging by weekly data through January 29, total
retail sales in January are estimated to have increased 1/2 per cent from
December. Excluding the automotive group and nonconsumer items, the
increase apparently amounted to about 3/4 per cent. Sales of durable
goods as a whole declined around 1/2 per cent, with a rise in sales of
furniture and appliances of nearly 2 per cent offsetting part of a drop
in the automotive group. Sales of nondurable goods rose 1 per cent, led
by a 2 per cent rise in general merchandise outlets.
Census revised estimates indicate that total sales in November
and December were somewhat lower than originally reported. Total sales
in December are now shown to be down 2.6 per cent from November--instead
of 2.1 per cent--and November sales from October were up 1.7 per cent--
instead of 1.9 per cent. The December downward revisions were fairly evenly
divided between durable and nondurable goods.

I - 9
RETAIL SALESPercentage changes from previous month
1971 1972Oct Nov Dec Jan*
Total sales - .7 1.7 -2.6 .5Durable goods -1.2 1.6 -5.2 - .5
Automotive -3.5 2.0 -8.4 -1.5Furniture & appliances 5.7 - .5 3.0 1.8
Nondurable goods - .5 1.8 -1.3 1.0Food -1.7 1.1 - .4 .8General merchandise - .9 2.4 -4.8 2.0
GAAF .5 2.2 -3.0 2.0
Total, excluding automotive& nonconsumer items - .1 1.4 - .9 .8
Total, real - .6 1.6 -3.0* Estimated by FRB on the basis of weekly data.
Consumer durables. January sales of new domestic-type cars
were at a 8.6 million unit annual rate, up 10 per cent from December
and 4 per cent from a year ago. Sales were progressively stronger for
each 10 days of the month, ending with a 9.0 million unit rate for the
final period. Preliminary estimates placed dealer inventories at
a 55 days supply at the end of January, 9 per cent above a year earlier,
but 15 per cent less than last month. The recent drop was caused mainly
by the higher selling rate in January.
Sales of foreign cars in January were at an annual rate of
1.6 million units, up 42 per cent from December and 9 per cent from a
year ago. The import share of total sales rose to 15 per cent, from
12 per cent in December and 14 per cent for the year 1971.

I- 10
Based on three weeks data unit sales of TVs to dealers in
January retained the sharp increases from a year earlier characteristic
of the last several months, primarily because of the strength of color
sets. Sales of major home appliances in the first three weeks of January
were also, in general, above the levels of last year. Only sales of
washers and driers were about the same as last year.
UNIT SALES OF SELECTED HOME GOODS 1/Per cent change from a year earlier
November 1971 December 1971 January 1972
2/TVs and radios 2/
TVs 18 27 23Color 37 40 35Monochrome -1 19 8
Radios 27 25 2
Home appliancesWashers 25 25 -1Driers 33 25 0Dishwashers 52 35 31
Electric Ranges 24 40 32Refrigerators 28 38 13Freezers 15 -3 9
1/ Based on seasonally unadjusted data. Data for January are for thefirst three weeks only which contain one less selling day than in1971. Sales data are purchases by dealers.
2/ Includes foreign made units sold under US brand names. Thesepercentages of foreign-made sales in 1971 were approximately: Monochrome TVs
55 per cent, Color TVs 20 per cent, and radios 70 per cent.(Inclusion of foreign brands sold under foreign names would ofcourse raise the foreign share of total U.S. sales.)

I - 11
Consumer credit. Consumer instalment credit outstanding
rose $10.8 billion in December, seasonally adjusted annual rate, down
from the extraordinary $15.2 billion annual rate increase in November.
For the full year 1971, instalment credit rose $8.4 billion, compared
with only $3.0 billion in 1970. The record annual increase--$9.0
billion--occurred in 1968.
Both extensions and repayments of instalment credit decreased
from November to December, after seasonal adjustment. Lower extensions
reflected a decline in new car sales and a less than seasonal advance
in personal loans. Repayments were down slightly in December for all
types of credit, except automotive.
NET CHANGE IN CONSUMER INSTALMENT CREDIT OUTSTANDING(Billions of dollars)
Other Personalconsumer
loansTotal Automobile goods
1965 8.6 3.7 2.2 2.61966 6.2 1.9 2.4 1.81967 3.4 .2 1.4 1.81968 9.0 3.4 2.5 2.9
1969 8.3 2.5 2.7 3.01970 3.0 -1.1 2.3 1.71971 8.4 2.8 2.5 2.8
QIV 12.4 4.5 4.0 3.5
I - 12
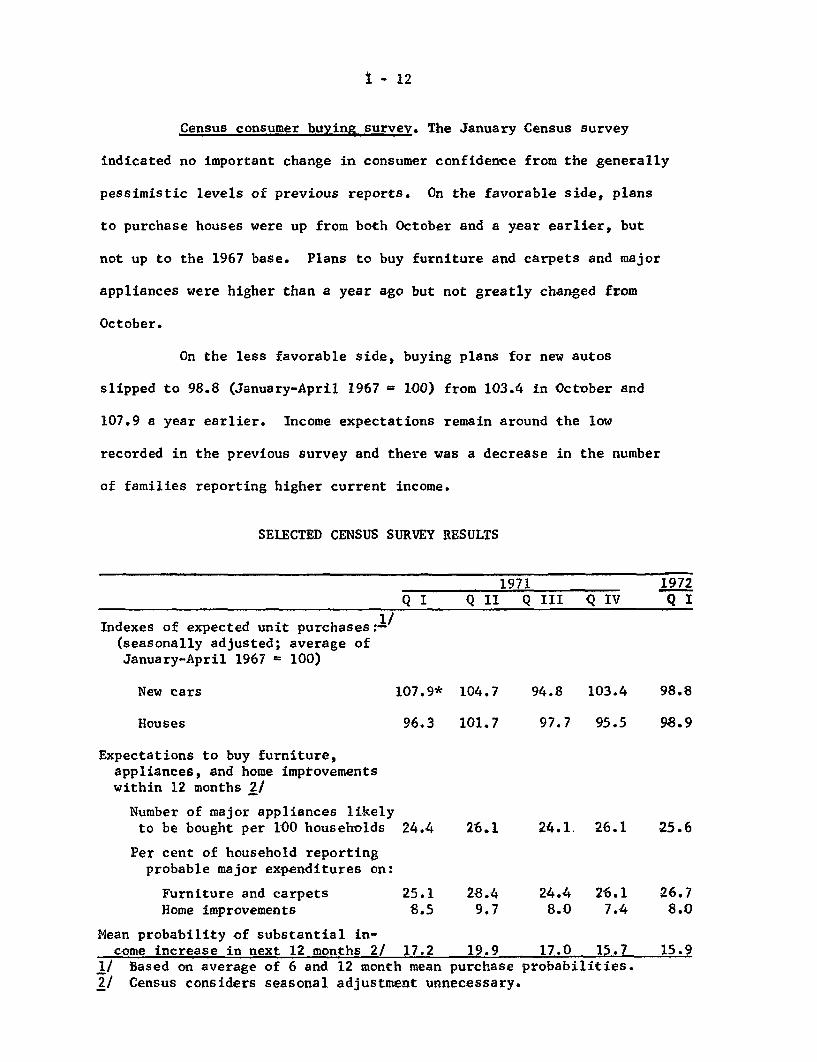
Census consumer buying survey. The January Census survey
indicated no important change in consumer confidence from the generally
pessimistic levels of previous reports. On the favorable side, plans
to purchase houses were up from both October and a year earlier, but
not up to the 1967 base. Plans to buy furniture and carpets and major
appliances were higher than a year ago but not greatly changed from
October.
On the less favorable side, buying plans for new autos
slipped to 98.8 (January-April 1967 = 100) from 103.4 in October and
107.9 a year earlier. Income expectations remain around the low
recorded in the previous survey and there was a decrease in the number
of families reporting higher current income.
SELECTED CENSUS SURVEY RESULTS
1971 1972
Q I Q II Q III Q IV Q I
Indexes of expected unit purchases: 1/(seasonally adjusted; average ofJanuary-April 1967 = 100)
New cars 107.9* 104.7 94.8 103.4 98.8
Houses 96.3 101.7 97.7 95.5 98.9
Expectations to buy furniture,appliances, and home improvementswithin 12 months 2/
Number of major appliances likelyto be bought per 100 households 24.4 26.1 24.1. 26.1 25.6
Per cent of household reportingprobable major expenditures on:
Furniture and carpets 25.1 28.4 24.4 26.1 26.7Home improvements 8.5 9.7 8.0 7.4 8.0
Mean probability of substantial in-come increase in next 12 months 2/ 17.2 19.9 17.0 15.7 15.9
1/ Based on average of 6 and 12 month mean purchase probabilities.2/ Census considers seasonal adjustment unnecessary.
I - 13
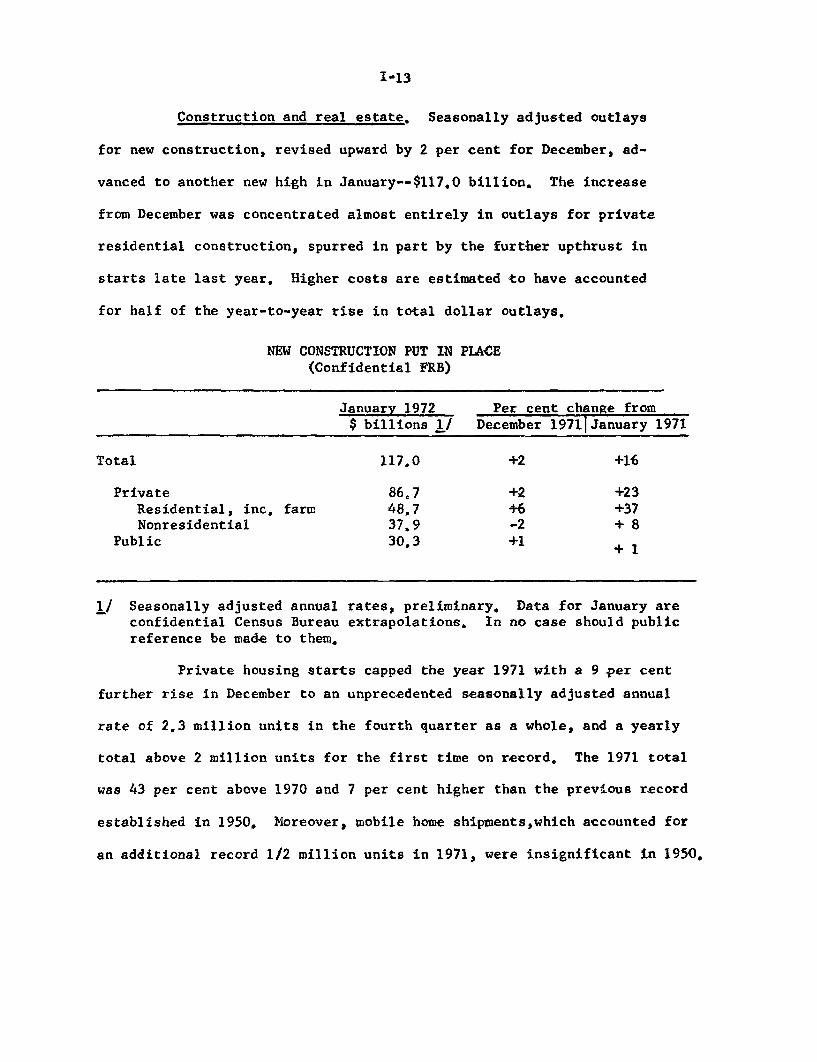
Construction and real estate. Seasonally adjusted outlays
for new construction, revised upward by 2 per cent for December, ad-
vanced to another new high in January--$117.0 billion. The increase
from December was concentrated almost entirely in outlays for private
residential construction, spurred in part by the further upthrust in
starts late last year. Higher costs are estimated to have accounted
for half of the year-to-year rise in total dollar outlays.
NEW CONSTRUCTION PUT IN PLACE(Confidential FRB)
January 1972 Per cent change from$ billions 1/ December 1971 January 1971
Total 117.0 +2 +16
Private 86.7 +2 +23Residential, inc. farm 48.7 +6 +37Nonresidential 37.9 -2 + 8
Public 30.3 +1 +1
1/ Seasonally adjusted annual rates, preliminary. Data for January areconfidential Census Bureau extrapolations. In no case should publicreference be made to them.
Private housing starts capped the year 1971 with a 9 per cent
further rise in December to an unprecedented seasonally adjusted annual
rate of 2.3 million units in the fourth quarter as a whole, and a yearly
total above 2 million units for the first time on record. The 1971 total
was 43 per cent above 1970 and 7 per cent higher than the previous record
established in 1950. Moreover, mobile home shipments, which accounted for
an additional record 1/2 million units in 1971, were insignificant in 1950.
I - 14
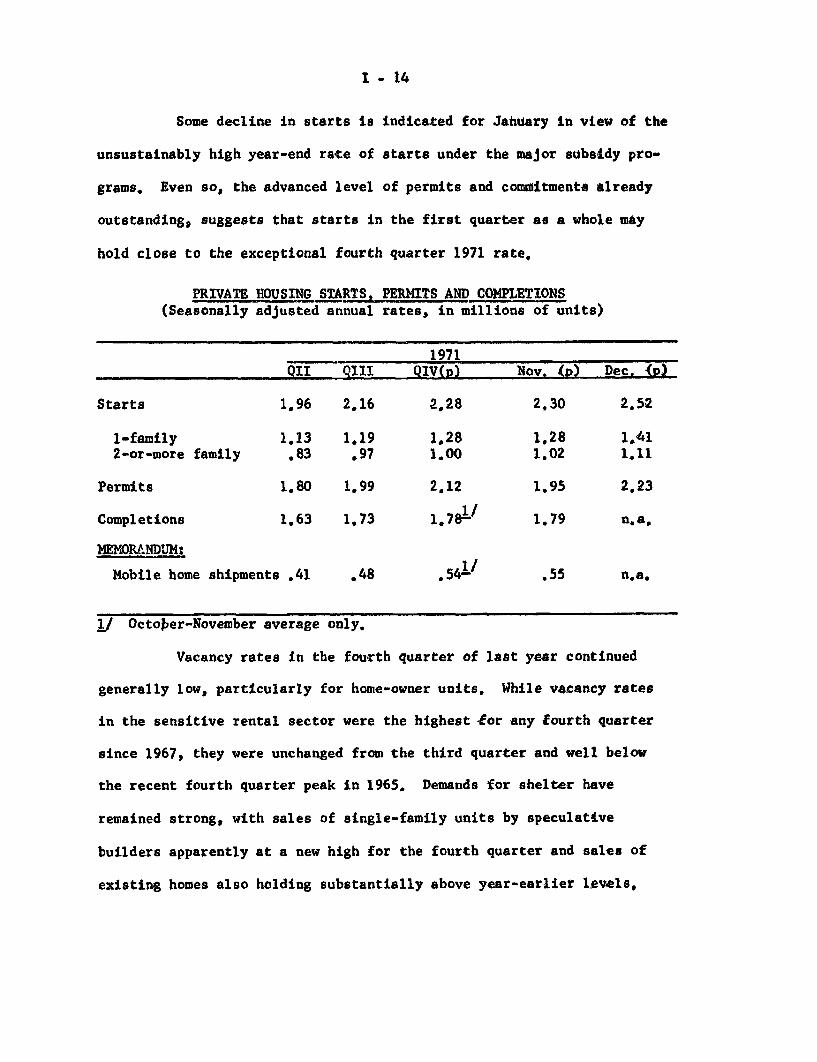
Some decline in starts is indicated for January in view of the
unsustainably high year-end rate of starts under the major subsidy pro-
grams. Even so, the advanced level of permits and commitments already
outstanding, suggests that starts in the first quarter as a whole may
hold close to the exceptional fourth quarter 1971 rate.
PRIVATE HOUSING STARTS, PERMITS AND COMPLETIONS(Seasonally adjusted annual rates, in millions of units)
1971QII QIII QIV(p) Nov. (p) Dec. (p)
Starts 1.96 2.16 2.28 2.30 2.52
1-family 1.13 1.19 1.28 1.28 1.412-or-more family .83 .97 1.00 1.02 1.11
Permits 1.80 1.99 2.12 1.95 2.23
Completions 1.63 1.73 1,78 1/ 1.79 n.a.
MEMORANDUM:
Mobile home shipments .41 .48 .54 1/ .55 n.a.
1/ October-November average only.
Vacancy rates in the fourth quarter of last year continued
generally low, particularly for home-owner units. While vacancy rates
in the sensitive rental sector were the highest for any fourth quarter
since 1967, they were unchanged from the third quarter and well below
the recent fourth quarter peak in 1965. Demands for shelter have
remained strong, with sales of single-family units by speculative
builders apparently at a new high for the fourth quarter and sales of
existing homes also holding substantially above year-earlier levels,

I - 15
RESIDENTIAL(Per
VACANCY RATEScent)
Average for fourth quarter of:1965 1967 1970 1971
Rental units 7.7 5.6 4.8 5.3Northeast 5.1 3.9 2.3 3.2North Central 6.6 5.1 5.2 5.7South 8.4 6.4 6.3 6.9West 11.7 7.4 5.4 5.1
Home-owner units 1.4 1.2 1.0 .9

I - 16
Manufacturers' orders. New orders for durable goods
declined 1.3 per cent (preliminary) in December, following a 4.6
per cent rise in November. The bulk of the decline was in the motor
vehicle group, with relatively small changes elsewhere. Capital
equipment orders (FR grouping) rose for the third successive month,
and for the quarter as a whole were 6 per cent above the third
quarter rate.
MANUFACTURERS' NEW ORDERS FOR DURABLE GOODSPer cent change
1971 (preliminary)Dec. from Nov. QIV from QIII
Durable goods, total -1.3 1.1Excluding steel and defense -1.2 1.0
Primary metals .1 7.4Motor vehicles and parts -8.1 -9.4Household durables -1.9 6.3
Defense products -3.0 -6.3Capital equipment .9 6.3All other durables .0 .2
Unfilled orders for durable goods rose about half a per
cent in December for the second month in a row, with much of the
increase in the defense products group.
In January, there may have been some temporary stimulus
to steel orders and shipments in anticipation of the February 1
price increases for cold rolled sheet.
Inventories. Book value of business inventories was
virtually unchanged in November. In December, manufacturers' stocks

I - 17
continued little changed, but wholesale trade inventories shot up
at a $9 billion annual rate, apparently reflecting dislocations
resulting from dock strikes.
For the fourth quarter as a whole, wholesale stocks rose
at more than twice the third-quarter rate, and accumulation by
manufacturers, though moderate, was at the highest rate of the year.
CHANGE IN BOOK VALUE OF BUSINESS INVENTORIESSeasonally Adjusted Annual Rate, $ Billions
1971Q III C IV October November December
(Prel.) (Rev.) (Prel.)
Manufacturing and trade 6.1 n.a. 6.5 .2 n.a
Manufacturing, total -1.1 2.0 5.7 .6 - .5Durable -1.0 -. 8 - .8 -1.1 - .4Nondurable - .0 2.7 6.5 1.8 - .1
Trade, total 7.2 n.a. .8 -1.4 n.a.Wholesale 1.9 4.7 1.4 3.7 9.1Retail 5.2 n.a. - .5 -5.1 n.a.
NOTE: Detail may not add to total because of rounding.
The inventory-sales ratio for manufacturing and trade
declined in November to its lowest point since July 1968. In
December, the manufacturing ratio remained at November's reduced
level; the wholesale trade ratio rose but was still below the
December 1970 level. The ratio of inventories to unfilled orders
at durable goods manufacturers declined in December for the second
month in a row.
Cyclical indicators. The preliminary Census composite
index of leading indicators rose 2.2 per cent in December after an

I - 18
upward-revised 0.9 per cent increase in November. Series increasing
were the workweek, initial claims for unemployment insurance
(inverted), housing permits, and common stock prices. There were
declines (relatively small) in new orders for durable goods and
contracts and orders for plant and equipment (both based on the
advance report) and in industrial materials prices and the ratio of
price to unit labor cost.
The preliminary coincident composite, which is compiled
before manufacturing and trade sales are available, rose 0.8 per
cent in December. A new series, a deflated coincident index--with
the same components but using constant-dollar data for income and
sales--also rose 0.8 per cent in December and was 7 per cent above
the cycle trough, compared with a 13 per cent recovery in the 13
months following the February 1961 trough. The lagging composite
also rose 0.8 per cent.
CHANGES IN COMPOSITE CYCLICAL INDICATORSDECEMBER 1971 (Preliminary)
Per cent change from:Previous Three monthsmonth earlier
12 Leading (trend adjusted) 2.2 4.412 Leading, prior to trend
adjustment 1.9 3.35 Coincident -.8 1.75 Coincident, deflated .8 1.66 Lagging .8 7
I - 19
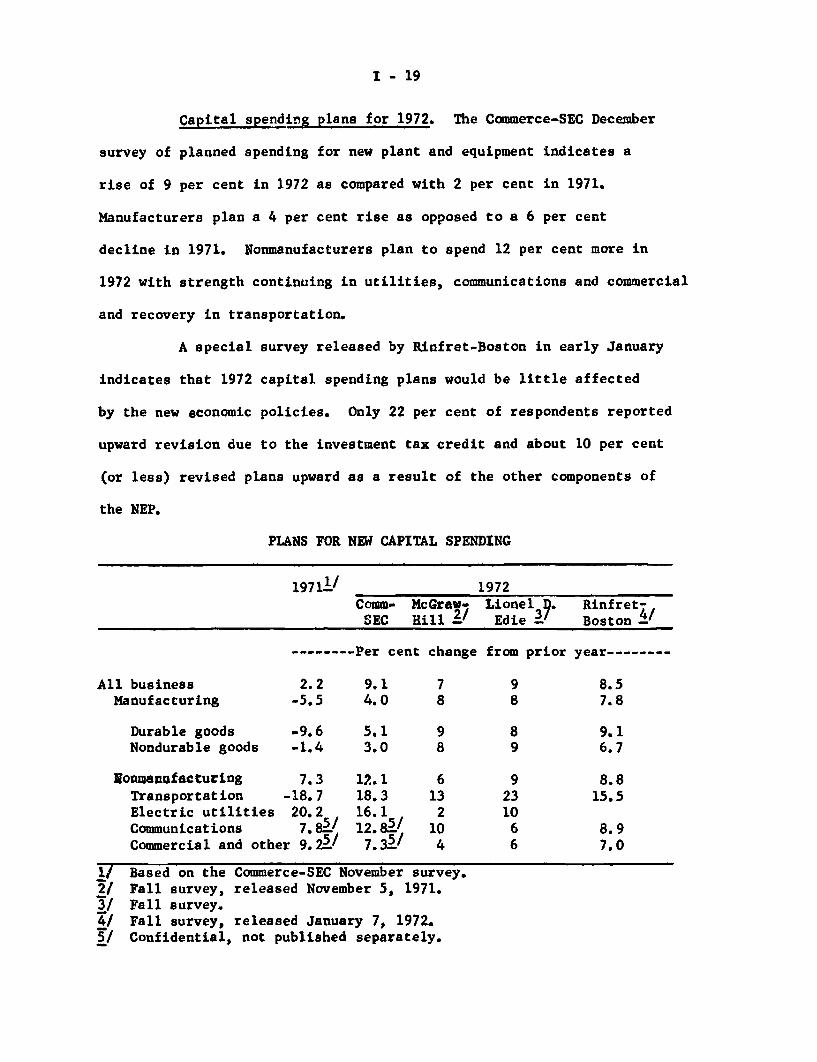
Capital spending plans for 1972. The Commerce-SEC December
survey of planned spending for new plant and equipment indicates a
rise of 9 per cent in 1972 as compared with 2 per cent in 1971.
Manufacturers plan a 4 per cent rise as opposed to a 6 per cent
decline in 1971. Nonmanufacturers plan to spend 12 per cent more in
1972 with strength continuing in utilities, communications and commercial
and recovery in transportation.
A special survey released by Rinfret-Boston in early January
indicates that 1972 capital spending plans would be little affected
by the new economic policies. Only 22 per cent of respondents reported
upward revision due to the investment tax credit and about 10 per cent
(or less) revised plans upward as a result of the other components of
the NEP.
PLANS FOR NEW CAPITAL SPENDING
1971 1/ 1972Comm- McGraw- Lionel D. Rinfret-
SEC Hill Edie 3/ Boston
-------- Per cent change from prior year--------
All business 2.2 9.1 7 9 8.5Manufacturing -5.5 4.0 8 8 7.8
Durable goods -9.6 5.1 9 8 9.1Nondurable goods -1.4 3.0 8 9 6.7
Wonmanufacturing 7.3 12.1 6 9 8.8Transportation -18.7 18.3 13 23 15.5Electric utilities 20.2 16.1 2 10Communications 7.81/ 12.8 5 7 10 6 8.9Commercial and other 9.2' 7.35 / 4 6 7.0
1/ Based on the Commerce-SEC November survey.2/ Fall survey, released November 5, 1971.3/ Fall survey.4/ Fall survey, released January 7, 1972.5/ Confidential, not published separately.

I - 20
Labor market. The unemployment rate edged lower in
January to 5.9 per cent from a downward revised 6.0 per cent rate
in December. (All of the 1971 data from the household survey now
incorporate the regular annual revisions in the seasonal adjustment
factors.) Declines were reported for both men and women 25 years and
over, but a sharp rise occurred in teenage joblessness. The unemploy-
ment rate for blue-collar workers, which has been fluctuating widely
in recent months, dropped in January, while the white-collar rate held
steady. Unemployment rates for both white and Negro workers were
little changed in January; the rate for white workers was slightly
below the year-earlier level, while that for Negroes was appreciably
above.
SELECTED UNEMPLOYMENT RATES(Seasonally adjusted)
1971 1972January July December January
Total 6.0 5.9 6.0 5.9
Men aged:20 to 24 years 10.4 10.2 10.5 10.425 and over 3.5 3.4 3.5 3.2
Women, aged 20 and over 5.7 5.7 5.8 5.5Teenagers 17.5 16.5 17.3 17.8
White-collar workers 3.5 3.5 3.6 3.6Blue-collar workers 7.6 7.2 7.5 7.1
White workers 5.5 5.4 5.4 5.3Negroes and other races 9.5 10.0 10.4 l0.6

I - 21
The decline in unemployment during January reflected a
seasonally adjusted increase in total employment of 240,000 and a rise
in the civilian labor force of about 150,000. The increase in
employment was among part time workers, and there was no change in
employment among adult males. In recent months the civilian labor
force has been growing at a substantial rate as a result of a pick-up
in the labor force participation of women and young men. (The published
data for household employment and civilian labor force in January
reflect the introduction of new population benchmark data derived from
the 1970 Census, which raise both series by about 300,000. All of the
adjustment to the new benchmark was included in the January 1972 figures.)
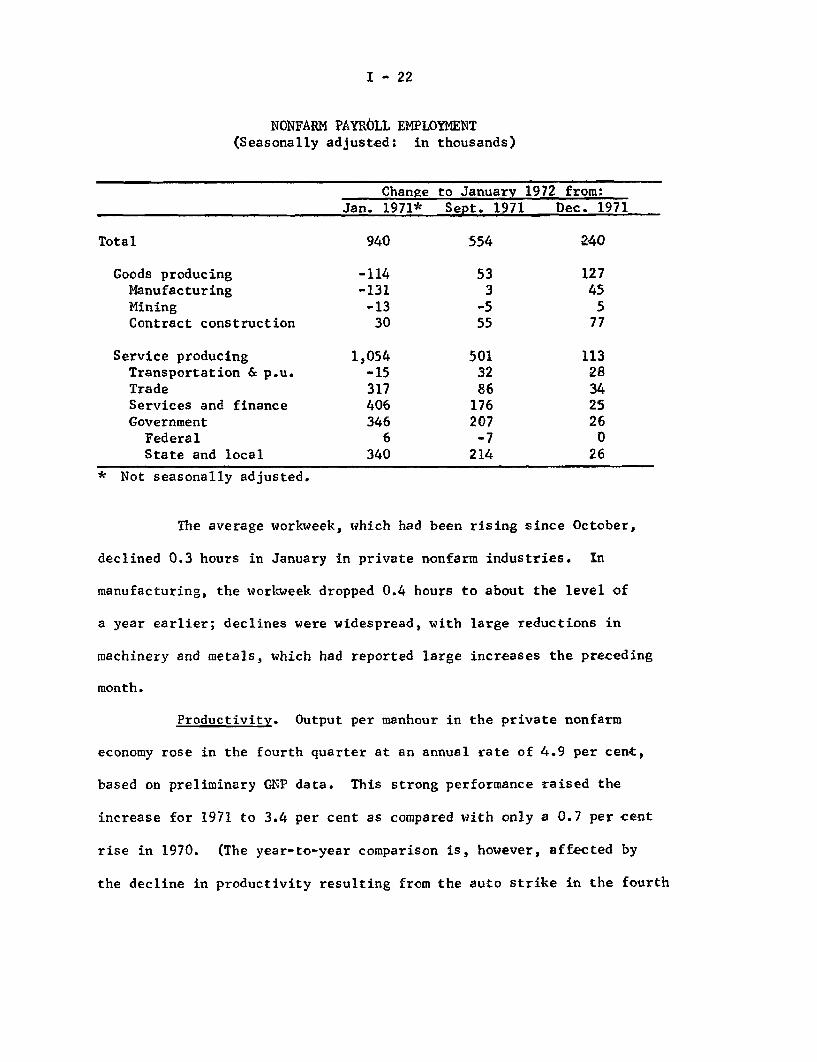
Nonfarm payroll employment also increased by a substantial
240,000 in January. The largest gains were posted in contract con-
struction (which had dropped sharply in the previous month) and in manu-
facturing, with moderate gains in other major categories. Between
September and January payroll employment increased by 550,000 and was
up 940,000 from a year earlier. Virtually all of the growth occurred
in service activities, which have been increasing on average by about
100,000 per month over the year. Employment in manufacturing has
remained at reduced levels, and at 18,6 million seasonally adjusted in
January, was still 1.6 million below the July 1969 peak.
I - 22
NONFARM PAYROLL EMPLOYMENT(Seasonally adjusted: in thousands)
Total
Goods producingManufacturingMiningContract construction
Service producingTransportation & p.u.TradeServices and financeGovernment
FederalState and local
* Not seasonally adjusted.
Change to January 1972 from:Change to January 1972 from:
Jan. 1971* Sept. 1971 Dec. 1971
940 554 240
-114 53 127-131 3 45-13 -5 530 55 77
1,054 501 113-15 32 28317 86 34406 176 25346 207 266 -7 0
340 214 26
The average workweek, which had been rising since October,
declined 0.3 hours in January in private nonfarm industries. In
manufacturing, the workweek dropped 0.4 hours to about the level of
a year earlier; declines were widespread, with large reductions in
machinery and metals, which had reported large increases the preceding
month.
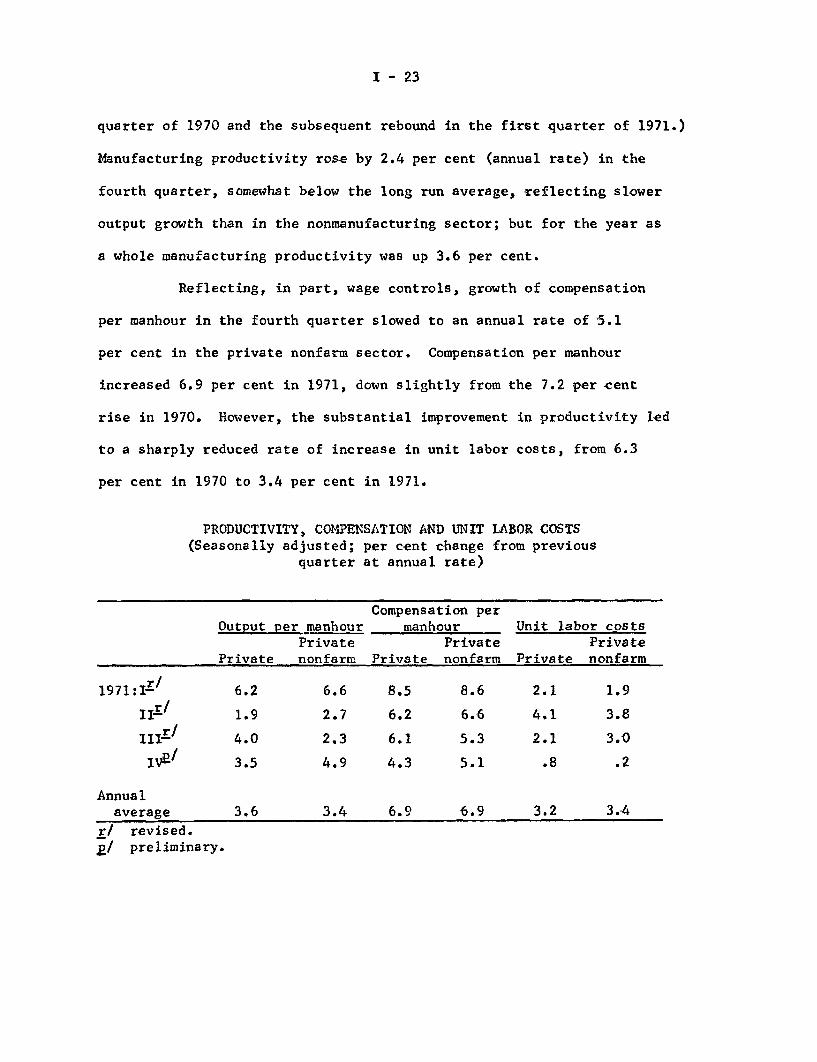
Productivity. Output per manhour in the private nonfarm
economy rose in the fourth quarter at an annual rate of 4.9 per cent,
based on preliminary GNP data. This strong performance raised the
increase for 1971 to 3.4 per cent as compared with only a 0.7 per cent
rise in 1970. (The year-to-year comparison is, however, affected by
the decline in productivity resulting from the auto strike in the fourth
I - 23
quarter of 1970 and the subsequent rebound in the first quarter of 1971.)
Manufacturing productivity rose by 2.4 per cent (annual rate) in the
fourth quarter, somewhat below the long run average, reflecting slower
output growth than in the nonmanufacturing sector; but for the year as
a whole manufacturing productivity was up 3.6 per cent.
Reflecting, in part, wage controls, growth of compensation
per manhour in the fourth quarter slowed to an annual rate of 5.1
per cent in the private nonfarm sector. Compensation per manhour
increased 6.9 per cent in 1971, down slightly from the 7.2 per cent
rise in 1970. However, the substantial improvement in productivity led
to a sharply reduced rate of increase in unit labor costs, from 6.3
per cent in 1970 to 3.4 per cent in 1971.
PRODUCTIVITY, COMPENSATION AND UNIT LABOR COSTS(Seasonally adjusted; per cent change from previous
quarter at annual rate)
Compensation perOutput per manhour manhour Unit labor costs
Private Private PrivatePrivate nonfarm Private nonfarm Private nonfarm
1971: /1- 6.2 6.6 8.5 8.6 2.1 1.9
IIr / 1.9 2.7 6.2 6.6 4.1 3.8
III- / 4.0 2.3 6.1 5.3 2.1 3.0
IVp/ 3.5 4.9 4.3 5.1 .8 .2
Annualaverage 3.6 3.4 6.9 6.9 3.2 3.4
r/ revised.p/ preliminary.
I - 24
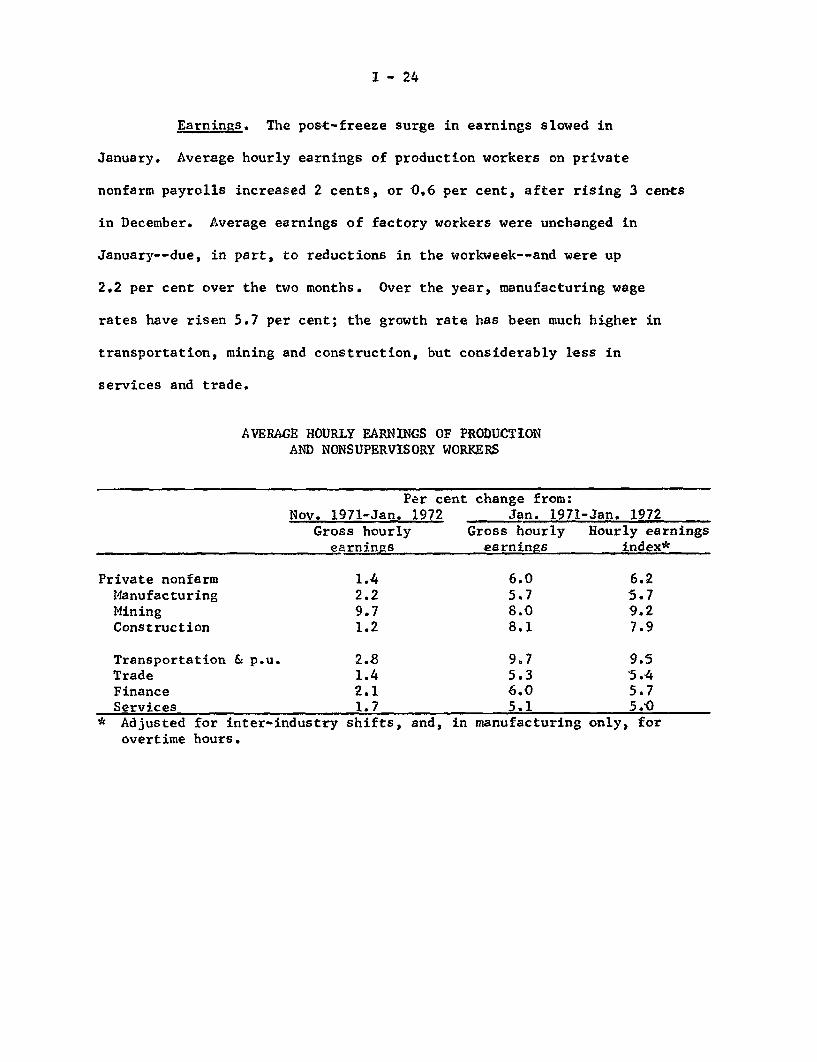
Earnings. The post-freeze surge in earnings slowed in
January. Average hourly earnings of production workers on private
nonfarm payrolls increased 2 cents, or 0.6 per cent, after rising 3 cents
in December. Average earnings of factory workers were unchanged in
January--due, in part, to reductions in the workweek--and were up
2.2 per cent over the two months. Over the year, manufacturing wage
rates have risen 5.7 per cent; the growth rate has been much higher in
transportation, mining and construction, but considerably less in
services and trade.
AVERAGE HOURLY EARNINGS OF PRODUCTIONAND NONSUPERVISORY WORKERS
Per cent change from:Nov. 1971-Jan. 1972 Jan. 1971-Jan. 1972
Gross hourly Gross hourly Hourly earningsearnings earnings index*
Private nonfarm 1.4 6.0 6.2Manufacturing 2.2 5.7 5.7Mining 9.7 8.0 9.2Construction 1.2 8.1 7.9
Transportation & p.u. 2.8 9.7 9.5Trade 1.4 5.3 5.4Finance 2.1 6.0 5.7Services 1.7 5.1 5.0
* Adjusted for inter-industry shifts, and, in manufacturing only, forovertime hours.

I - 25
Collective bargaining. Wage rate increases in major
collective bargaining settlements during 1971 averaged 8.1 per cent
over the life of the contract, as compared to an 8.9 per cent average
in 1970. The decline reflected substantially lower first-year and
deferred increases in the nonmanufacturing sector, particularly in
construction. The continued high overall rate of first-year increases
reflected the "catch-up" in the manufacturing sector. When wages and
benefits are combined, the 1971 average increases were little changed
from the previous year.
WAGE AND BENEFIT CHANGESIN MAJOR COLLECTIVE BARGAINING SETTLEMENTS
Mean percentage adjustments
1969 1970 1971
Wage rate increases: 1/
First-yearPrivate nonfarm 9.2 11.9 11.7Manufacturing 7.9 8.1 10.8Nonmanufacturing 10.8 15.2 12.7
Construction 13.1 17.6 13.3
Averaged over life of contractPrivate nonfarm 7.6 8.9 8.1
2/Wages and benefits combined-
Private nonfarmFirst-year changes 10.9 13.1 13.1Averaged over life of
contract 8.2 9.1 8.7
1/ Covers settlements affecting 1,000 workers or more.2/ Limited to settlements for 5,000 workers or more.
I - 26
Settlements included in the 1971 tabulation covered 3.4
million workers, substantially fewer than the nearly 4.8 million
whose contracts were scheduled to reopen in 1970. In part, the
smaller number reflects the fact that the Pay Board had yet to act
on contracts reached after November 13 covering at least 500,000
workers. Relatively few contracts, covering about 200,000 workers,
were negotiated in the fourth quarter, mostly during the freeze period.
Average wage increases for the quarter thus reflected selective actions
by the Pay Board and were dominated by the bituminous coal agreement
and the tandem relationship of smaller steel settlements with the major
steel agreement.
Industrial relations. A tentative agreement, providing for
substantial wage and fringe benefits has been reached between the
West Coast longshoremen and employers. If approved by the union
membership, the contract will be subject to review by the Pay Board.
Ratification of the settlement is needed to end the strike, which was
resumed on January 17, three weeks after expiration of the 80-day
injunction. On the East Coast, the tentative master agreement reached
in early January by six North Atlantic ports, which provided wage
increases totaling 32.6 per cent over three years, has not yet been
signed awaiting settlements at South Atlantic and Gulf ports. The
Taft-Hartley strike injunction, which halted the East Coast 60-day
strike November 26, expires February 14, but it appears the union does
not plan to strike on the expiration date.

I - 27
The Pay Board disapproved in early January five aerospace
contracts covering more than 100,000 workers and providing a first-
year wage increase of 51 cents, or 12 per cent; but indicated it
would approve a 34 cent, or 8 per cent first-year increase. The
Board approved in late January a 5 per cent wage increase effective
on April 1 and October 1, 1972 for 140,000 members of the United
Transportation Workers union. In return the union agreed to put into
effect work rule changes which are expected to reduce costs.

Wholesale prices. Wholesale prices rose at a seasonally
adjusted annual rate of 8.9 per cent between November and December
primarily as a result of an exceptionally large increase in farm and
food products. Industrial commodities increased at a rate of 3.2 per
cent, with higher prices reported for motor vehicles, textile products,
coal, and hides and skins and leather.
(PercentageWHOLESALE PRICES
changes, seasonally adjusted annual rates)
Phase Phase Phase
Pre-stabilization period I I & II 1IDec. 1970 June 1971 Aug. 1971 Aug. 1971 Nov. 1971
to to to to toJune 1971 Aug. 1971 Nov. 1971 Dec. 1971 Dec. 1971
All commodities 5.0 5.7 - .8 1.6 8.9
Farm & food 1/ 7.2 2.1 .0 6.4 28.2
Industrial commodities 4.1 7.7 -1.3 - .2 3.2
Crude materials2/ 4.7 1.0 1.0 1.5 3.0Inter, materials 3/ 5.5 10.4 -1.0 - .3 2.1Finished goods 4/ 2.3 4.1 -1.6 .2 5.8
Producer 3.3 4.7 -2.7 - .5 6.3Consumer 1.8 3.8 -1.1 .5 5.5
1/ Farm products and processed foods and feeds.2/ Excludes foods, plant and animal fibers, oilseeds, and leaf tobacco.3/ Excludes intermediate materials for food manufacturing and manufactured
animal feeds.4/ Excludes foods.
For the 231 industrial product classes compiled monthly by the
BLS, the number showing increases was much larger than in recent months
but was still considerably below the number usually reported prior to
the freeze.
I - 28
I -29
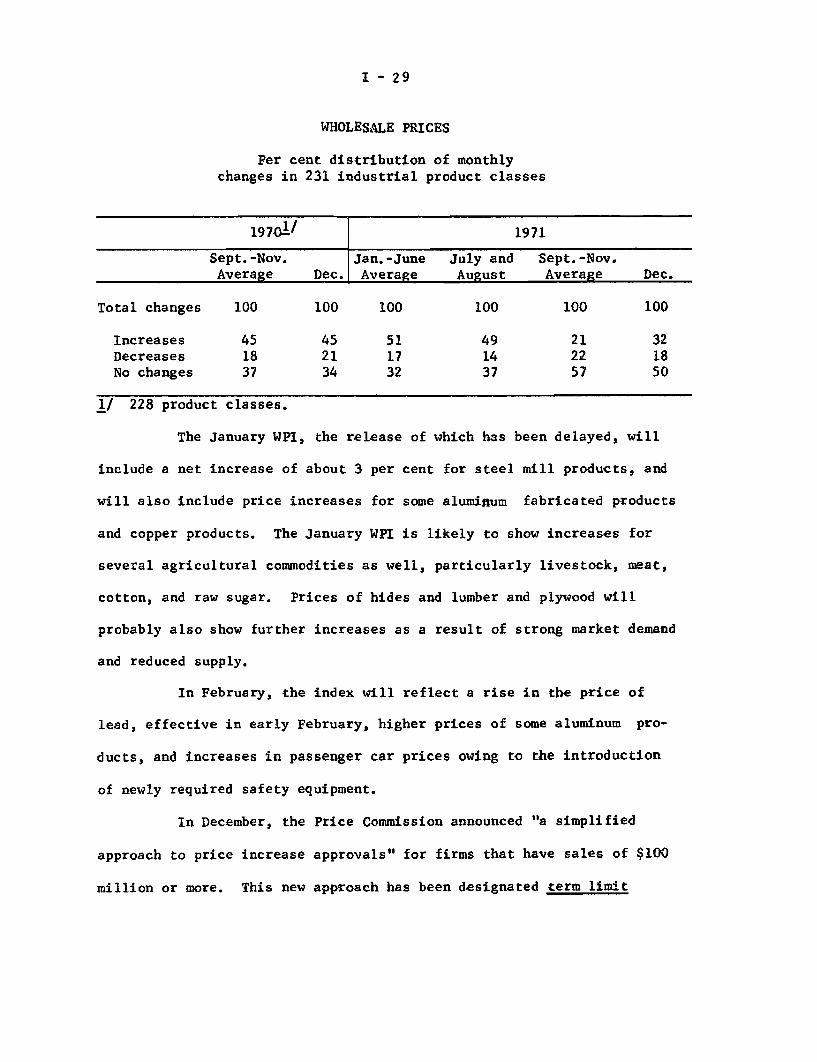
WHOLESALE PRICES
Per cent distribution of monthlychanges in 231 industrial product classes
1970 1/ 1971
Sept.-Nov. Jan.-June July and Sept.-Nov.Average Dec. Average August Average Dec.
Total changes 100 100 100 100 100 100
Increases 45 45 51 49 21 32Decreases 18 21 17 14 22 18No changes 37 34 32 37 57 50
1/ 228 product classes.
The January WPI, the release of which has been delayed, will
include a net increase of about 3 per cent for steel mill products, and
will also include price increases for some aluminum fabricated products
and copper products. The January WPI is likely to show increases for
several agricultural commodities as well, particularly livestock, meat,
cotton, and raw sugar. Prices of hides and lumber and plywood will
probably also show further increases as a result of strong market demand
and reduced supply.
In February, the index will reflect a rise in the price of
lead, effective in early February, higher prices of some aluminum pro-
ducts, and increases in passenger car prices owing to the introduction
of newly required safety equipment.
In December, the Price Commission announced "a simplified
approach to price increase approvals" for firms that have sales of $100
million or more. This new approach has been designated term limit
I - 30
pricing (TLP). Under TLP, firms receive approval to raise prices by
an average of up to 2 per cent over a year if the higher prices can
be justified by cost increases and if other general criteria speci-
fied under the Commission's guidelines are met. Approval for increases
in prices of individual products is not required; firms thus have flex-
ibility in changing prices for individual products.
As of January 21, 1972, a month after the announcement of
the inauguration of TLP, 50 of the approximately 100 firms expected to
ask for coverage under TLP had been granted agreements. Chemical firms
and firms with chemicals as a major product line account for about one-
half of these, with firms manufacturing machinery and equipment, the
next largest group.

I - 31
Consumer prices. Consumer prices rose in December at an
annual rate of 4.7 per cent, seasonally adjusted. As in November,
food prices rose sharply--at an annual rate of over 8 per cent--while
other commodity prices and service costs registered advances of 4.2
per cent and 3.7 per cent, respectively. Items exempt from regulation
account for half the (unadjusted) increase.
CONSUMER PRICES(Percentage changes, seasonally adjusted annual rates)
Dec. 1970 June 1971 Aug.1971 Nov.1971to to to to
June 1971 Aug. 1971 Nov. 1971 Dec.1971
All items 4.0 3.3 1.7 4.7
Food 6.2 1.0 1.7 8.3Commodities less food 3.0 2.6 .0 4.2Services 1/ 4.2 5.7 3.1 3.7
Addendum:
All items less mortgage costs 2/ 5.0Services less home finance 1/ 2/ 7.4
3.54.9
1.31.9
5.03.8
1/ Not seasonally adjusted.
2/ Confidential: Home financing costs excluded from services reflectproperty taxes and insurance rates as well as mortgage costs, whichin turn move with mortgage interest rates and house prices. Theindex for property taxes rose nearly6 per cent between June andDecember.
Fresh vegetable prices soared in response to certain supply
shortages, but contraseasonal increases for beef and pork also con-
tributed substantially to the total advance. Rising meat prices are
expected to continue according to USDA reports.

I -32
Outside the food component, car prices rose 1.5 per cent
(seasonally adjusted), gasoline recovered part of the November decline,
and gas and electricity rates jumped 1.7 per cent.
During the last two months special guidelines have been
issued covering the following services: rents, medical care services,
and insurance and utility rates. The objective for medical care is to
cut the rate of rise by nearly one-half; the CPI index for medical
services rose 7.4 per cent in the year ending last August. In view of
the complexity of the sector and enforcement problems, only partial
achievement of this goal seems likely.
Utility rates may well continue to rise at least as much as
the 7 - 8 per cent advances over the year preceding the freeze. Wide-
spread requests for substantial rate increases are pending, and several,
in particular for telephones, have already been granted. The requests
are generally attributed to past inflation in costs and expansion and
anti-pollution requirements. There is still considerable uncertainty
over the impact of rent regulations,but it seems unlikely that the
advance in rents will be reduced much below the rate before the freeze--
about 4.8 per cent.

DOMESTIC FINANCIALSITUATION
II -- T - 1
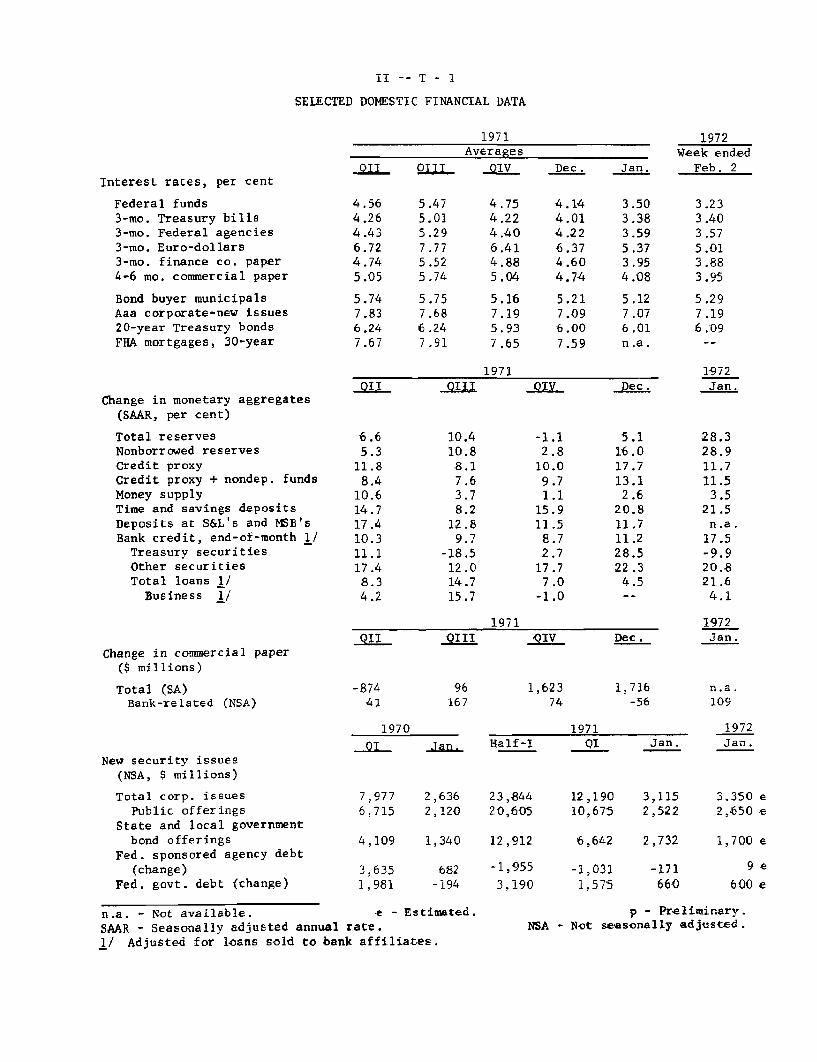
SELECTED DOMESTIC FINANCIAL DATA
1971 1972Averages Week ended
QII QIII QIV Dec. Jan. Feb. 2Interest rates, per cent
Federal funds3-mo. Treasury bills3-mo. Federal agencies3-mo. Euro-dollars3-mo. finance co. paper
4-6 mo. commercial paper
Bond buyer municipalsAaa corporate-new issues20-year Treasury bondsFHA mortgages, 30-year
Change in monetary aggregates(SAAR, per cent)
Total reservesNonborrowed reservesCredit proxyCredit proxy + nondep. fundsMoney supplyTime and savings deposits
Deposits at S&L's and MSB'sBank credit, end-of-month 1/Treasury securitiesOther securitiesTotal loans 1/
Business 1/
Change in commercial paper($ millions)
Total (SA)Bank-related (NSA)
New security issues(NSA, $ millions)
Total corp. issuesPublic offerings
State and local governmentbond offerings
Fed. sponsored agency debt(change)
Fed. govt. debt (change)
4.564.264.436.724.745.05
5.747.836.247.67
5.475.015.297.775.525.74
5.757.686.247.91
4.754.224.406.414.885.04
5.16
7.195.937.65
1971
4.144.014.226.374.604.74
5.217.096.007.59
3.503.383.595.373.954.08
5.127.076.01n.a.
QII
6.65.3
11.88.4
10.614.717.410.311.117.48.34.2
10.410.88.17.63.78.2
12.89.7
-18.512.014.715.7
-1.12.8
10.09.71.1
15.911.5
8.72.7
17.77.0
-1.0
1971QII
-87441
QIII
96167
1970
QI Jan.
QIV
1,62374
5.116.017.713.12.6
20.811.711.228.522.3
4.5
Dec .
1,716-56
1971Half-I QI
3.233.403.575.013.883.95
5.297.196.09
1972Jan.
28.328.911.711.5
3.521.5n.a.
17.5-9.920.821.6
4.1
1972Jan.
n.a.109
Jan.1972Jan.
7,977 2,636 23,844 12,190 3,115 3.350 e6,715 2,120 20,605 10,675 2,522 2,650 e
4,109 1,340 12,912
3,6351,981
682 -1,955
-194 3,190
6,642 2,732
-1,0311,575
-171660
1,700 e
9e
600 e
n.a. - Not available. e - Estimated.
SAAR - Seasonally adjusted annual rate.
1/ Adjusted for loans sold to bank affiliates.
p - Preliminary.NSA - Not seasonally adjusted.

II - 1
DOMESTIC FINANCIAL SITUATION
Summary and outlook. Yields in long-term securities markets
have risen 25 to 35 basis points since the last Committee meeting,
largely in reflection of a steady stream of announcements of new issues
in the corporate sector, as well as market reaction to indications that
Federal borrowing will be larger than many had previously expected. On
the other hand, strong private domestic and foreign official demands for
short-term instruments, along with an easing of money market conditions
induced by aggressive System reserve-supplying operations, contributed
to a declining level of short-term yields.
The low level and further decline in short-term market rates
were an important factor in the acceleration of inflows to "thrift" accounts
at commercial banks and savings and loan associations in January to a
pace only slightly below the record set in early 1971. A special sur-
vey of large member banks suggests that not only individuals, but also
pension funds and businesses, are shifting from negotiable CD's and
other money market assets to savings and time accounts in order to ob-
tain higher rates. While there is little indication of reduced offering
rates on deposits at nonbank thrift institutions, the survey of large
commercial banks indicates a number of reductions in rates on both
passbook savings and time accounts. In addition, some banks have
placed size limitations on these deposits to stem the large inflow.
Commercial banks continued in January to purchase tax-exempt
bonds in large volume and their total loans increased sharply. The

II - 2
latter expansion reflected not only the continued high rate of growth
of consumer and real estate loans, but also a bulge in security and
nonbank financial loans. Business loans, although rising for the first
time in three months, expanded quite modestly and banks again cut their
prime rate.
Outlook. In the next two or three months, total financing
demands are likely to intensify. Although private credit demands in
short-term markets are expected to be little, if any, changed from the
modest level of recent months, demands in capital markets by corporations
are projected to remain large while Treasury demands for funds rise.
Treasury net cash borrowing in the months ahead will be un-
usually large for this time of year. From February through April, the
staff expects such borrowing to be $4 to $5 billion, mainly in the
short-term area, as compared with an average net repayment of $1.2
billion over the comparable period of the last four years. Beyond
April, the size of Treasury cash needs is more uncertain, depending
mainly on whether official budget estimates are realized. However,
near-term Treasury issues, coupled with market anticipations of increased
Federal borrowing throughout 1972, is likely to place upward pressure
on short-term interest rates.
Modest private short-term credit demands are likely to offset
part of this upward rate pressure. Although inventory accumulation is
projected to rise this quarter and next, business liquidity and the
volume of funds raised in long-term markets is expected to keep business
short-term borrowing in the commercial paper market and at banks rela-
tively small. In turn, banks should continue to be unaggressive bidders
for funds in the CD market, and reductions in bank offering rates on
time and savings deposits can be expected to spread.
II - 3
In contrast to modest private demands in the short-term
markets, current financing schedules, and issues in the active nego-
tiation stage, suggest that corporate demands in the capital markets
will continue large by historical standards. Underwriters are reported
to have been advising their clients to accelerate their financing in
the belief that long-term yields may have already reached their cyclical
lows. Given the anticipatory nature of a significant share of prospec-
tive corporate bond financings, actual offerings are likely to be ex-
tremely sensitive to interest rate movements. But even if, as in late
January, upward interest rate movements lead to postponements, the
volume of issues then on the sidelines would be a factor moderating
possible subsequent rate declines.
In the tax-exempt sector of the capital market, there are no
indications of a potential build-up in volume and bank demands for
municipal securities continue high. Nevertheless, large dealer posi-
tions and general market concern about the future of long-term rates
may limit any reversal of the recent run-up of rates in this market.
The balancing of credit demands and supplies over the next
few months seems likely to entail some upward movements in short-term
rates under the pressure of Treasury financing. Longer-term rates
could also advance somewhat, although the recent increase in yields
may have already anticipated, at least in part, the sizable flow of
bonds expected to be marketed and the impact of the Federal budget.
In addition, the large cash flow at the depository institutions should
keep long-term rate pressures, should they develop further, from
spreading to the primary market for home mortgages.
II - 4
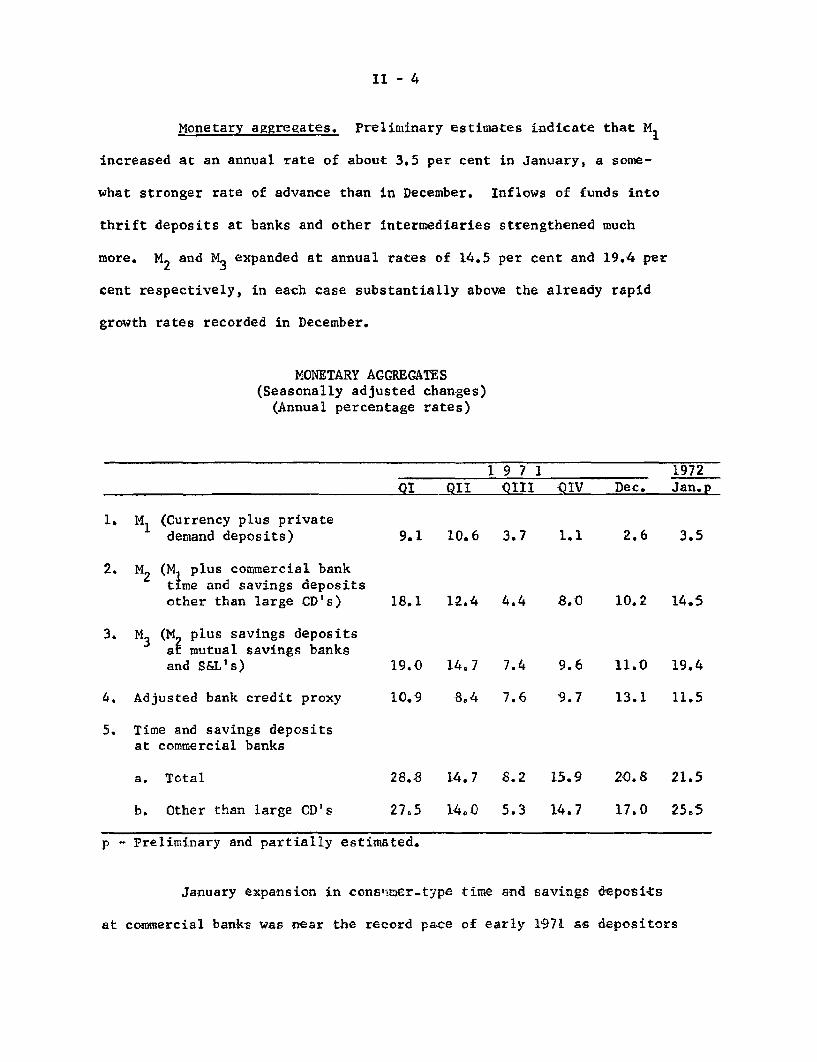
Monetary aggregates. Preliminary estimates indicate that M1
increased at an annual rate of about 3.5 per cent in January, a some-
what stronger rate of advance than in December. Inflows of funds into
thrift deposits at banks and other intermediaries strengthened much
more. M2 and M3 expanded at annual rates of 14.5 per cent and 19.4 per
cent respectively, in each case substantially above the already rapid
growth rates recorded in December.
MONETARY AGGREGATES(Seasonally adjusted changes)
(Annual percentage rates)
1 9 7 1 1972
QI QII QIII QIV Dec. Jan.p
1. M1 (Currency plus privatedemand deposits) 9.1 10.6 3.7 1.1 2.6 3.5
2. M2 (M1 plus commercial banktime and savings depositsother than large CD's) 18.1 12.4 4.4 8.0 10.2 14.5
3. M3 (M2 plus savings depositsat mutual savings banksand S&L's) 19.0 14.7 7.4 9.6 11.0 19.4
4. Adjusted bank credit proxy 10.9 8.4 7.6 9.7 13.1 11.5
5. Time and savings depositsat commercial banks
a. Total 28.8 14.7 8.2 15.9 20.8 21.5
b. Other than large CD's 27.5 14.0 5.3 14.7 17.0 25.5
p - Preliminary and partially estimated.
January expansion in consumer-type time and savings deposits
at commercial banks was near the record pace of early 1971 as depositors
II - 5
continued to respond to the attractive rate advantage produced by the
downtrend in market interest rates since late summer. The January
growth in bank thrift accounts was broadly based geographically and
both savings deposits and consumer CD's showed sharp gains. Inflows
of bank thrift deposits began to accelerate in early September and have
increased at an annual rate of 15 per cent (or by more than $13 billion)
in the last four months.
Information obtained by Reserve Banks in an informal survey
of about 80 large commercial banks provides confirmation of press
reports which have indicated that banks are introducing measures to
moderate inflows of funds into savings deposits and time certificate
accounts. Except for one district where banks had already cut rates
in either the spring or fall of last year, the survey found that a
number of large banks had cut rates on passbook savings deposits and/or
certificate accounts. Most of the remaining banks surveyed indicated
that rate cuts were under consideration.
Banks in eight districts also indicated that they were
receiving large blocks of funds seeking placement in either savings
or certificate accounts; in some instances, the source of these funds
was reported as switches from large CD's and other money market invest-
ments in order to obtain higher yields. Small businesses, pension
funds and large individual investors were mentioned as the types of
depositors involved. In reaction to these large blocks of funds,
banks in a majority of districts have instituted measures to limit
the size of such accounts, with the size of these limitations ranging
from $10,000 to $50,000.
II - 6
Despite the advance in time deposits other than large CD's,
growth in the adjusted credit proxy slowed somewhat in January, as
outstanding large CD's declined moderately and U.S. Treasury deposits
remained essentially unchanged on average. This is in contrast to
December when both deposit categories rose markedly. The average
volume of funds obtained from nondeposit sources in January remained
essentially at the same level as in December.
Bank credit. The end-of-month all commercial bank credit
series rose substantially further in January. Banks continued acquiring
securities in large volume as a modest selloff of Treasury holdings--
following the December buildup--was substantially offset by a further
large expansion of purchases of other securities--mainly municipals.
In addition, loan portfolios rose sharply, after having increased at
a modest pace during the last two months of 1971.
Both real estate loans and consumer loans continued to expand
at historically high rates in January to account for a major share of
the advance in total loans. Exceptionally large gains were also re-
corded in security loans and loans to nonbank financial institutions.
Growth in security loans primarily reflects the happenstance that
System RP's were large at the end of December and were reduced to zero
at the end of January leading to opposite movements in dealer borrowing
from banks. The growth in loans to nonbank financial institutions was
apparently produced in part by further loan origination activity by
mortgage brokers on behalf of other investors as well as by stockpiling
in anticipation of further yield reductions and in preparation for

II - 7
COMMERCIAL BANK CREDIT ADJUSTED FORSOLD TO AFFILIATES 1/
(Seasonally adjusted percentage changes at
LOANS
annual rates)
1 9 7 1 1972QIII QIV December January
Total loans & investments 2/ 9.7 8.7 11.2 17.5
U.S. Treasury securities -18.5 2.7 28.5 -9.9Other securities 12.0 17.7 22.3 20.8Total loans 2/ 14.7 7.0 4.5 21.6
Business loans 2/ 15.7 -1.3 .0 4.1Real estate loans 13.7 13.2 13.5 13.3Consumer loans 13.3 14.4 15.6 13.2
1/ Last-Wednesday-of-month series.2/ Includes outstanding amounts of loans reported as sold outright by
banks to their own holding companies, affiliates, subsidiaries, andforeign branches.
packaging and sale of GNMA mortgage-backed securities. Loans to sales
finance companies also strengthened for reasons that are not clear. In
contrast to the strengthening in most loan categories, loans to foreign
commercial banks declined perceptibly, probably reflecting repayment
of loans originated during the recent period of foreign exchange adjust-
ments.
While business loans in January expanded somewhat for the
first time since October, loan demands by nonfinancial corporations con-
tinued weak--particularly at the largest banks. In response to continued
weakness in loan demand, the sustained strong inflows of deposits, and
the competitive pressures created by previous rate cuts at banks that
tie their base rate to market rates, banks still operating with a dis-
cretionary prime rate cut their rates in two quarter-point steps to

II - 8
4-3/4 per cent in January. By month-end "tied" prime rates had been
reduced to 4-1/2 per cent, and banks with discretionary rate policies
were again under pressure to reduce their rates.
Other financial institutions and mortgage markets. Deposit
inflows to nonbank thrift institutions in January were exceptionally
strong. The estimated combined growth rate for the month is comparable
to--although not quite so rapid as--the record high rates experienced
last January and in the early months of 1971. Undoubtedly, the widened
spread of deposit rates over yields on market securities contributed to
this step-up of flows into thrift claims, although much of the accelera-
tion in deposit growth from the November-December pace occurred during
the earliest part of January, before the bulk of the further January
decline in short-term market yields had occurred.
DEPOSIT GROWTH AT NONBANK THRIFT INSTITUTIONS(Seasonally adjusted annual rates)
Mutual Savings Savings and Loan BothBanks Associations Growth Rates Net Inflows
(per cent) (per cent) (per cent) ($ billions)
1971 - 1st half 16.0 22.1 20.1 43.52nd half / 10.2 15.0 13.5 32.2
QIII 9.6 15.7 13.7 32.8
QIV / 10.5 13.9 12.8 31.6
November* 10.0 12.1 11.4 28.4December* p/ 12.1 14.3 13.6 34.3
1972 - January * e/ 14.0 24.5 21.2 53.9
* Monthly patterns may not be significant because of difficulties with seasonal
adjustment.p/ Preliminary.e/ Estimate.
II - 9
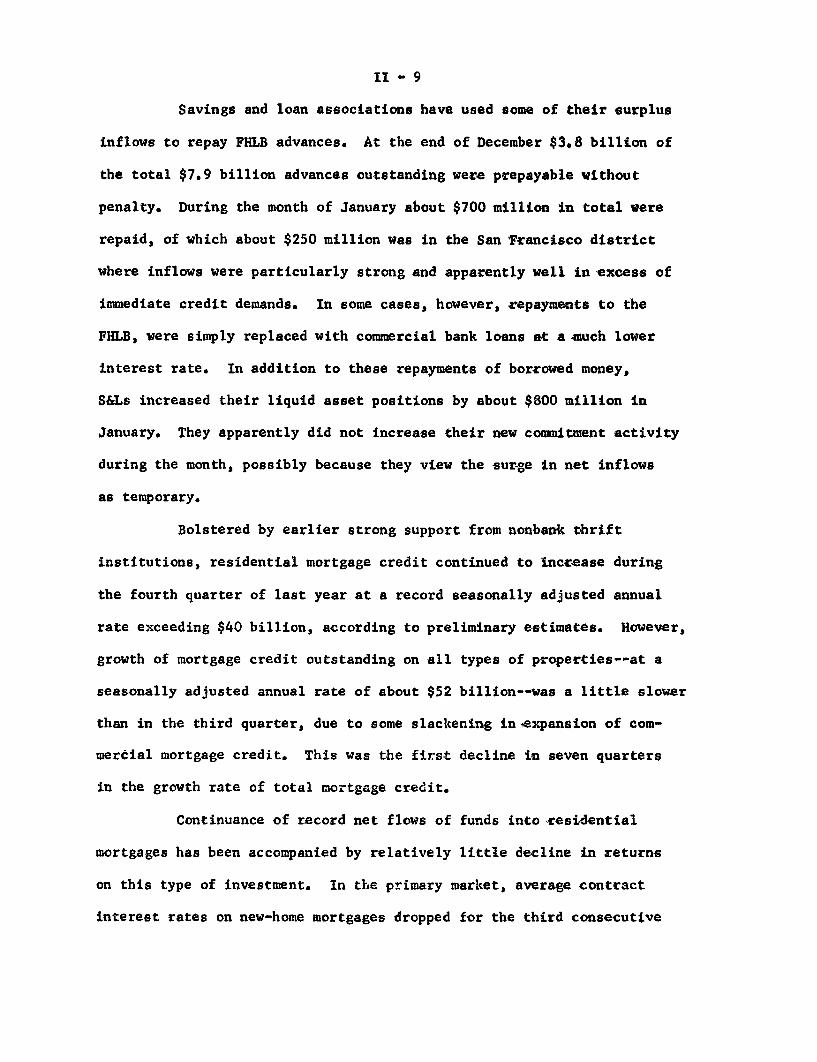
Savings and loan associations have used some of their surplus
inflows to repay FHLB advances. At the end of December $3.8 billion of
the total $7.9 billion advances outstanding were prepayable without
penalty. During the month of January about $700 million in total were
repaid, of which about $250 million was in the San Francisco district
where inflows were particularly strong and apparently well in excess of
immediate credit demands. In some cases, however, repayments to the
FHLB, were simply replaced with commercial bank loans at a much lower
interest rate. In addition to these repayments of borrowed money,
S&Ls increased their liquid asset positions by about $800 million in
January. They apparently did not increase their new commitment activity
during the month, possibly because they view the surge in net inflows
as temporary.
Bolstered by earlier strong support from nonbank thrift
institutions, residential mortgage credit continued to increase during
the fourth quarter of last year at a record seasonally adjusted annual
rate exceeding $40 billion, according to preliminary estimates. However,
growth of mortgage credit outstanding on all types of properties--at a
seasonally adjusted annual rate of about $52 billion--was a little slower
than in the third quarter, due to some slackening in expansion of com-
mercial mortgage credit. This was the first decline in seven quarters
in the growth rate of total mortgage credit.
Continuance of record net flows of funds into residential
mortgages has been accompanied by relatively little decline in returns
on this type of investment. In the primary market, average contract
interest rates on new-home mortgages dropped for the third consecutive
II - 10
month in December--by only 5 basis points. Press reports indicate that
rates were cut in some places during January, but comprehensive data
are not yet available. In the FNMA secondary market auction through
early February, yields averaged only 1 basis point below the reduced
level reached in mid-December.
In anticipation of greater improvement in secondary-market
mortgage prices over the weeks ahead, mortgage companies continue to
hold an unusually large volume of mortgages against which purchase com-
mitments have not yet been obtained from permanent investors. According
to field reports, the mortgage bankers hope to sell some of their uncom-
mitted mortgages over-the-counter to savings and loan associations;
others may be used for pools against which GNMA-guaranteed securities
may be issued.

II - 11
AVERAGE RATES AND YIELDS ON NEW-HOME MORTGAGES
Primary market: Secondary market:Conventional loans Government-underwritten loans
Yield YieldSpread Spread
Level (basis Level (basis Discount(per cent) points) (per cent) points) (points)
1971
Low 7.55 -36 7.36 -25 1.4High 7.95 71 8.02 58 8.1
Month of:
October 7.80 51 7.84 55 6.8November 7.75 56 7.71 52 5.8December 7.70 61 7.62 53 5.1
1972
January - -- 7.61 54 5.0
Week of:
January 10 -- -- 7.61 61 5.024 -- -- 7.61 60 5.0
February 7 -- -- 7.61 39 5.0
NOTE: FHA series for interest rates on conventional first mortgages (excludingadditional initial fees and charges) is rounded to the nearest 5 basispoints. Federal Reserve series for Government-underwritten mortgagesis based on FNMA auctions of short-term purchases commitments, afterallowance for commitment fee and required purchase and holding of FMAstock, assuming prepayment period of 15 years for 30-year mortgages.Rates and returns shown are gross, before deduction of any fees paid byinvestors to servicers. Gross yield spread is average mortgage returnminus average yield on new issues of high-grade corporate bonds with5-year call protection.

II - 12
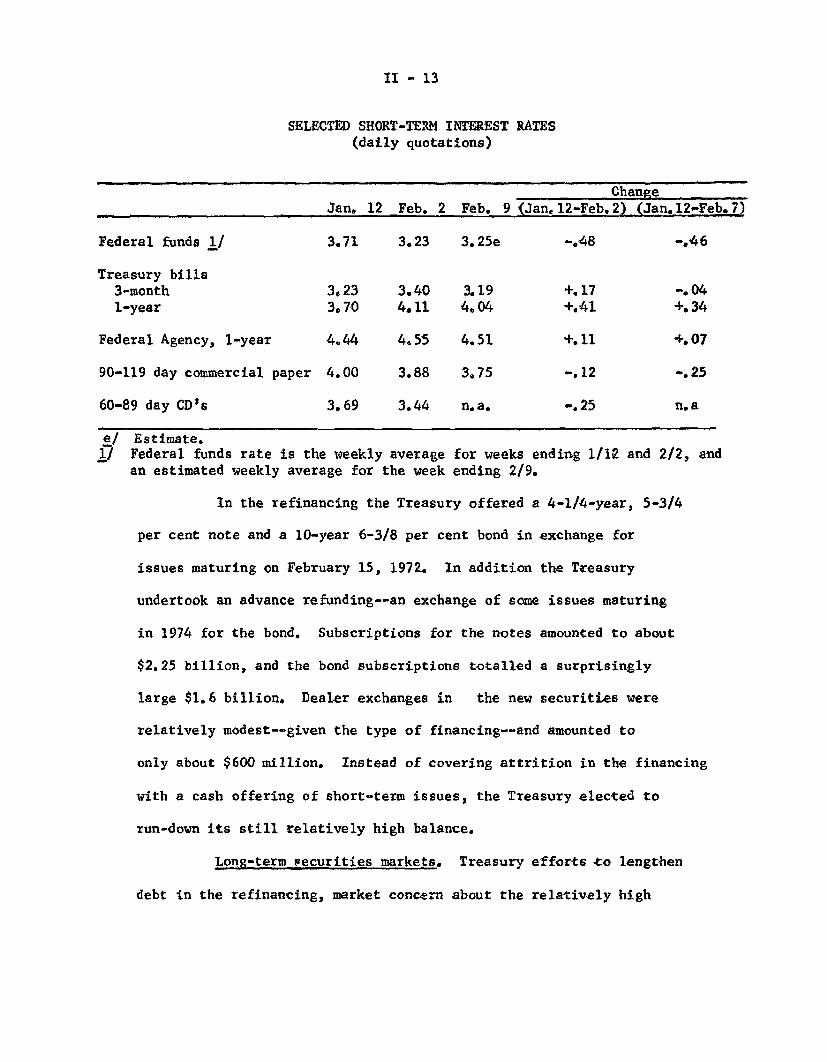
Short-term markets. Short-term market interest rates have
experienced mixed changes since the last Committee meeting. Day-to-
day money market rates have dropped about a half percentage point
in response to the ample availability of reserves, and rates on
private market instruments are down about a quarter of a percentage
point. Yields on short-term Treasury and Federal agency debt, on
the other hand, in some cases show net increases for the period.
Following the Budget revelation of a much deeper anticipated deficit
for fiscal 1972, both Treasury and agency yields backed up rather
significantly. But quotes on shorter maturities have since dropped
off again. The yield on 90-day Treasury bills, for example, has
most recently traded about at the level which prevailed at the time
of the last Committee meeting.
Recent foreign purchases of bills and continued strong demand
for bills by other investors have contributed to this improved
situation at the short end of the bill market. Additional demand
for bills is also expected when holders of maturing issues in the
recent Treasury refinancing receive their cash payments in mid-
February. Although the Treasury announced plans yesterday to add $300
million to its weekly bill auctions, starting next Monday, this had
only a minor initial impact on bill yields.
II - 13
SELECTED SHORT-TERM INTEREST RATES(daily quotations)
Jan. 12 Feb. 2Change
Feb. 9 (Jan. 12-Feb. 2) (Jan. 12-Feb.7)
Federal funds 1/ 3.71 3.23 3.25e -. 48 -. 46
Treasury bills3-month 3,23 3.40 3.19 +.17 -. 041-year 3.70 4.11 4.04 +.41 +.34
Federal Agency, 1-year 4.44 4.55 4.51 +.11 +.07
90-119 day commercial paper 4.00 3.88 3.75 -. 12 -. 25
60-89 day CD's 3.69 3.44 n.a. -. 25 n.a
e/ Estimate.1/ Federal funds rate is the weekly average for weeks ending 1/12 and 2/2, andan estimated weekly average for the week ending 2/9.
In the refinancing the Treasury offered a 4-1/4-year, 5-3/4
per cent note and a 10-year 6-3/8 per cent bond in exchange for
issues maturing on February 15, 1972. In addition the Treasury
undertook an advance refunding--an exchange of some issues maturing
in 1974 for the bond. Subscriptions for the notes amounted to about
$2.25 billion, and the bond subscriptions totalled a surprisingly
large $1.6 billion. Dealer exchanges in the new securities were
relatively modest--given the type of financing--and amounted to
only about $600 million. Instead of covering attrition in the financing
with a cash offering of short-term issues, the Treasury elected to
run-down its still relatively high balance.
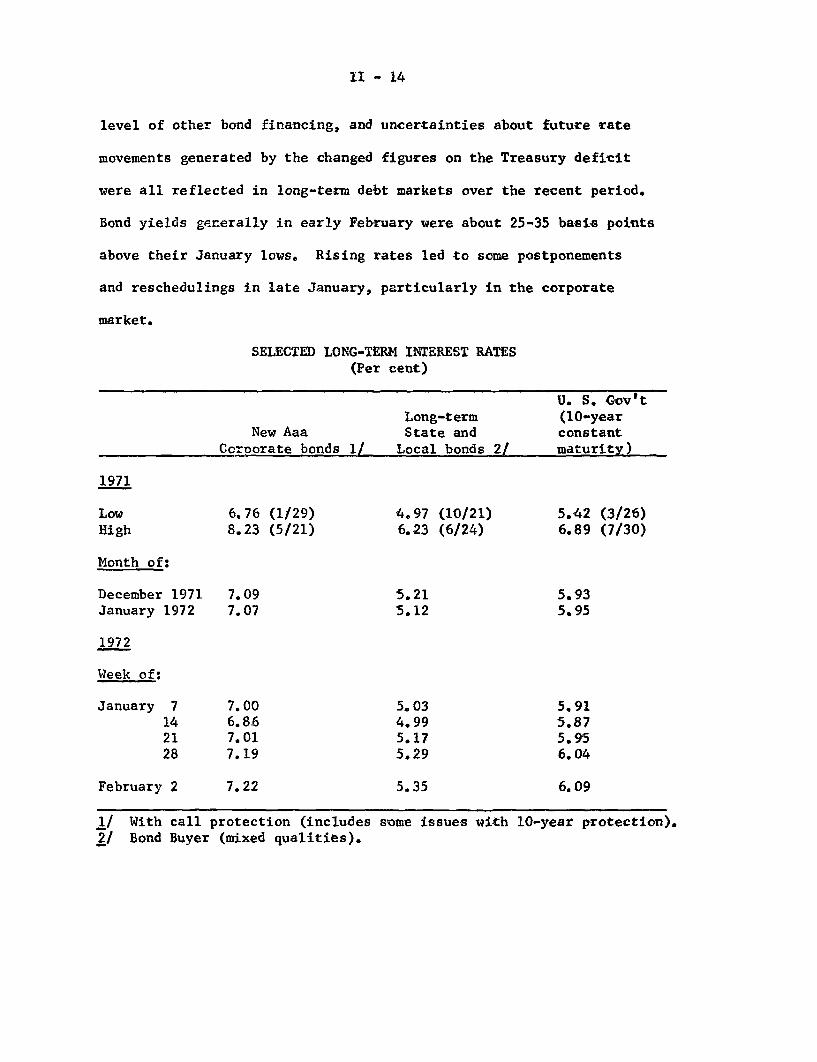
Long-term securities markets. Treasury efforts to lengthen
debt in the refinancing, market concern about the relatively high
II - 14
level of other bond financing, and uncertainties about future rate
movements generated by the changed figures on the Treasury deficit
were all reflected in long-term debt markets over the recent period.
Bond yields generally in early February were about 25-35 basis points
above their January lows. Rising rates led to some postponements
and reschedulings in late January, particularly in the corporate
market.
SELECTED LONG-TERM INTEREST RATES(Per cent)
U. S. Gov'tLong-term (10-year
New Aaa State and constantCorporate bonds 1/ Local bonds 2/ maturity)
1971
Low 6.76 (1/29) 4.97 (10/21) 5.42 (3/26)High 8.23 (5/21) 6.23 (6/24) 6.89 (7/30)
Month of:
December 1971 7.09 5.21 5.93January 1972 7.07 5.12 5.95
1972
Week of:
January 7 7.00 5.03 5.9114 6.86 4.99 5.8721 7.01 5.17 5.9528 7.19 5.29 6.04
February 2 7.22 5.35 6.09
1/ With call protection (includes some issues with 10-year protection).
2/ Bond Buyer (mixed qualities).

II - 15
Public corporate bond offerings in January were approximately
$1.8 billion, and scheduled issues for February indicate a volume of
about $1.9 billion. Several large bond offerings have not been
assigned a specific date, however, and the prospective borrowers
have indicated that, since their fund needs are not pressing, the
timing of the issues will depend on market conditions. At present the
staff estimates that total corporate security volume in early 1972
will remain at about the same monthly average level as in the latter
part of 1971.
Takedowns of private placements in January and February
are estimated at levels above the 1971 average. Life insurance
companies continue to have large flows of investible funds, and
have accordingly been maintaining a large forward commitment volume
with particular emphasis on corporate direct placements. Furthermore,
they have been directing one-half to three-quarters of a billion
dollars each quarter into common stock as a result of their rapidly
growing separate account business.
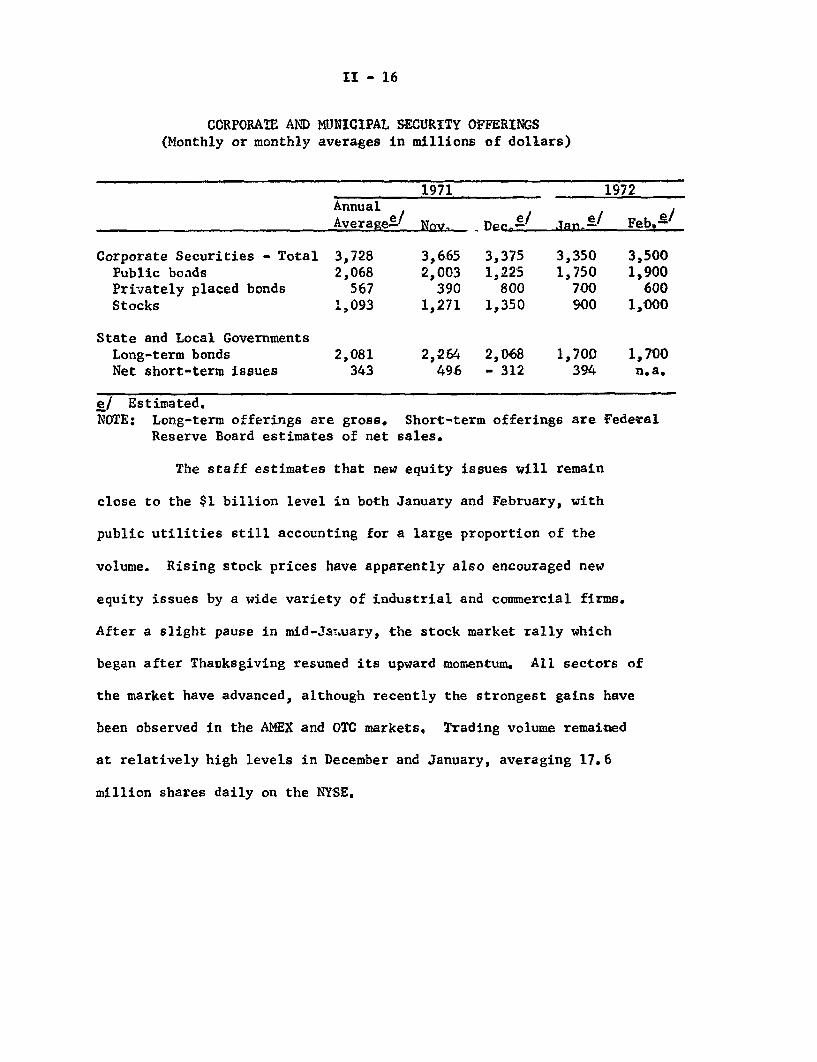
II - 16
CORPORATE AND MUNICIPAL SECURITY OFFERINGS(Monthly or monthly averages in millions of dollars)
AnnualAverage e/
1971
Dec. e /
1972
Jan e/ Feb. e/
Corporate Securities - Total 3,728 3,665 3,375 3,350 3,500Public bonds 2,068 2,003 1,225 1,750 1,900Privately placed bonds 567 390 800 700 600Stocks 1,093 1,271 1,350 900 1,000
State and Local GovernmentsLong-term bonds 2,081 2,264 2,068 1,700 1,700Net short-term issues 343 496 - 312 394 n.a,
e/ Estimated.NOTE: Long-term offerings are gross. Short-term offerings are Federal
Reserve Board estimates of net sales.
The staff estimates that new equity issues will remain
close to the $1 billion level in both January and February, with
public utilities still accounting for a large proportion of the
volume. Rising stock prices have apparently also encouraged new
equity issues by a wide variety of industrial and commercial firms.
After a slight pause in mid-January, the stock market rally which
began after Thanksgiving resumed its upward momentum. All sectors of
the market have advanced, although recently the strongest gains have
been observed in the AMEX and OTC markets. Trading volume remained
at relatively high levels in December and January, averaging 17.6
million shares daily on the NYSE.
Nov.
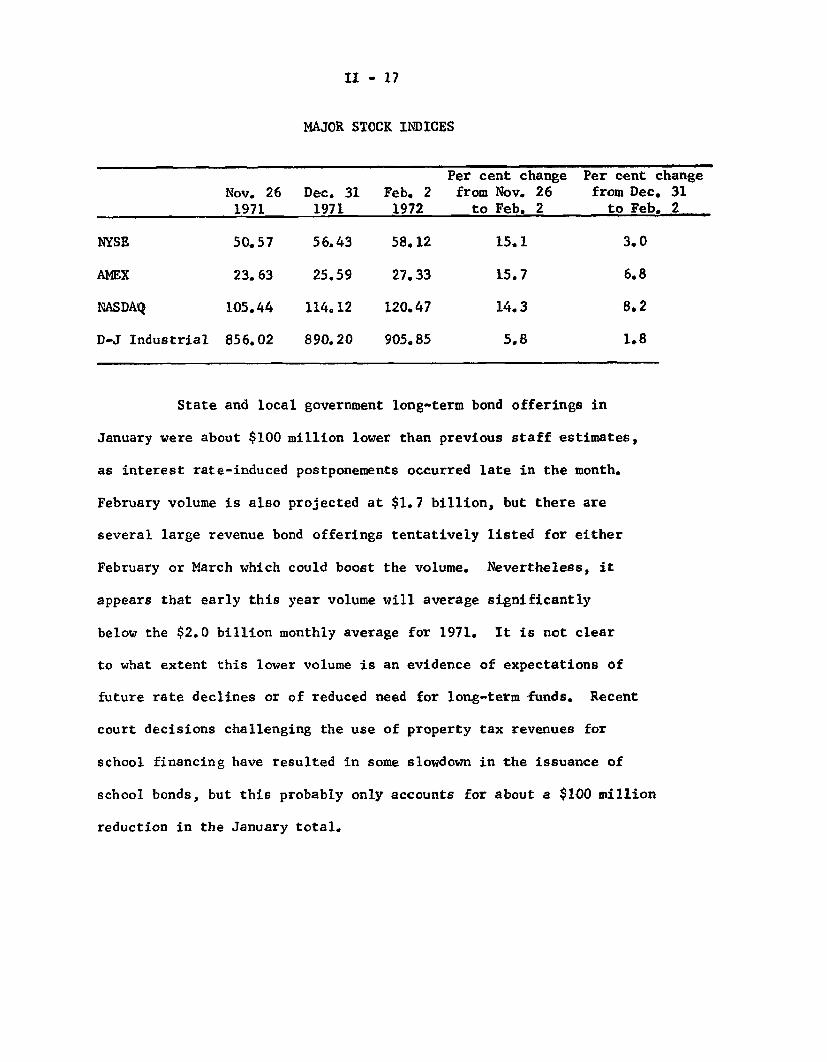
II - 17
MAJOR STOCK INDICES
Per cent change Per cent changeNov. 26 Dec. 31 Feb. 2 from Nov. 26 from Dec. 311971 1971 1972 to Feb. 2 to Feb. 2
NYSE 50.57 56.43 58.12 15.1 3.0
AMEX 23.63 25.59 27.33 15.7 6.8
NASDAQ 105.44 114.12 120.47 14.3 8.2
D-J Industrial 856.02 890.20 905.85 5.8 1.8
State and local government long-term bond offerings in
January were about $100 million lower than previous staff estimates,
as interest rate-induced postponements occurred late in the month.
February volume is also projected at $1.7 billion, but there are
several large revenue bond offerings tentatively listed for either
February or March which could boost the volume. Nevertheless, it
appears that early this year volume will average significantly
below the $2.0 billion monthly average for 1971. It is not clear
to what extent this lower volume is an evidence of expectations of
future rate declines or of reduced need for long-term funds. Recent
court decisions challenging the use of property tax revenues for
school financing have resulted in some slowdown in the issuance of
school bonds, but this probably only accounts for about a $100 million
reduction in the January total.

II - 18
Federal Finance. The new Federal budget for fiscal 1973
indicates that on a unified budget basis there will be an actual
deficit of $25.5 billion and a high employment surplus of $0.7 billion.
Outlays are projected to increase by $9.7 billion to $246.3 billion--a
relatively modest growth of 4.1 per cent. Receipts are expected to rise
by $23 billion.
In addition to proposals for fiscal 1973, the new budget includes
a significant revision in the budget for the current fiscal year. The
deficit for fiscal year 1972 is estimated at $38.8 billion, about $3
billion more than projected by the Staff in the preceding Greenbook.
About $6.0 billion of this difference reflects higher outlays, implying
a sharp increase in the rate of spending over the remaining five months
of the fiscal year. The high employment budget (unified budget basis)
is officially estimated to show a deficit of $8.1 billion in the FY 1972.
The Administration estimate of outlays for the current fiscal
year, $236.6 billion, includes $2.3 billion for general revenue sharing.
This estimate assumes that Congress will approve revenue sharing retro-
active to January 1, 1972. In addition,the budget document includes a
$1.0 billion advance payment to the states, planned in June, for public
assistance grants, which are to be "repaid" by the states in FY 1973.
Because of the relatively sluggish rate of spending for defense procure-
ment in the first six months of the current fiscal year, it may take
considerable effort for the Administration to attain the projected
level of outlays for defense procurement for the full year, especially
since faster prepayments on outstanding contracts seem to be precluded
by Defense Department regulations.
II - 19
The staff estimates FY 1972 outlays at $234.4 billion--$2.2
billion below the budget document figure for the fiscal year--on the
assumption that general revenue sharing will not be effective until
fiscal 1973. Our estimate of FY 1972 receipts, $199.3 billion, is
$1.5 billion above the Administrative estimate, largely because the
staff assumes that people will not adjust their declared exemptions
for withholding--in response to the recent changes in withholding
schedules--as quickly as the Administration projection assumes.
In regard to fiscal 1973, the new budget includes a number
of proposals that would significantly affect budget outlays, including,
among other things: (1) general revenue sharing, costing $5.3 billion
annually; (2) a 5 per cent social security benefit hike and other
social security liberalization, effective July 1, 1972, costing $3.5
billion in FY 1973; (3) a 4.9 per cent federal pay raise effective
January 1973, costing $1.2 billion for six months; and (4) about $0.5
billion for start-up costs connected with the proposed family assistance
program which would become effective in FY 1974. Staff estimates for
the last half of calendar year 1972 include the effects of all of
these proposals. The legislative success of general revenue sharing
is conjectural even for fiscal 1973. Even so, the inclusion of this
item in staff estimates may not overstate total spending because there
may be overruns in other programs. For instance, there is a possibility
of larger than projected social security benefit increases.
Proposed tax changes would increase FY 1973 receipts by about
$3 billion. The largest proposed tax changes are: (1) an increase in
the social security taxable earnings base from $9,000 to $10,200,
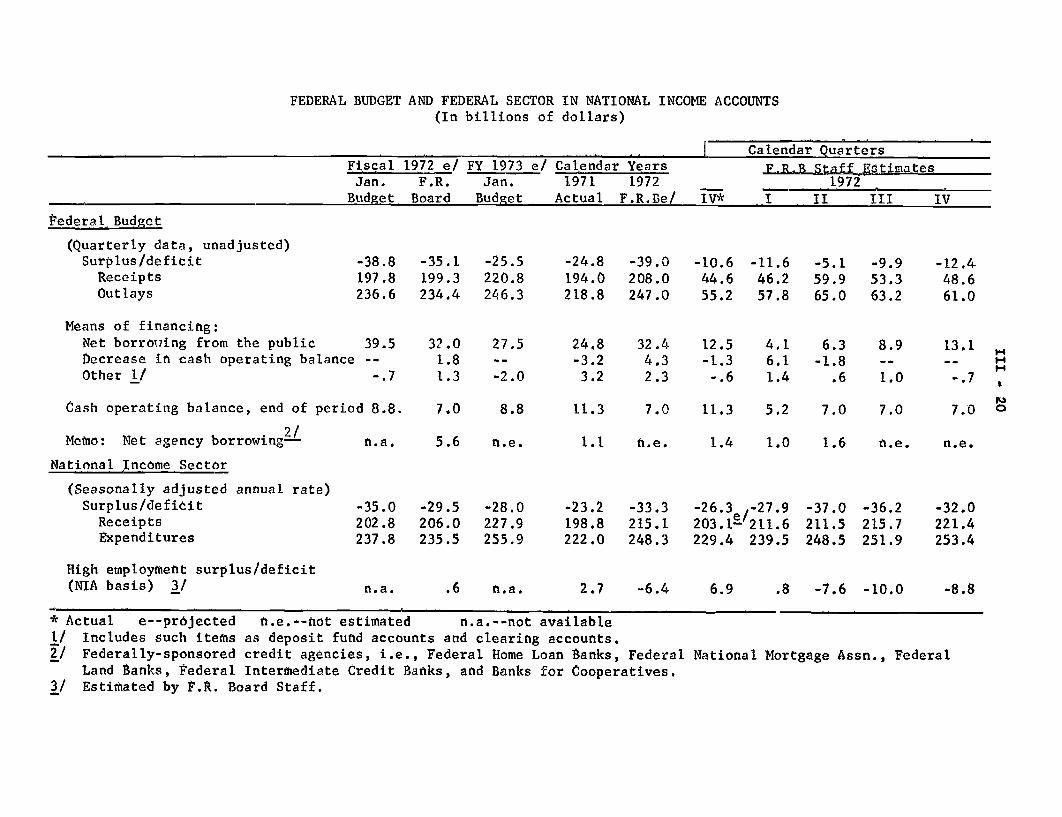
FEDERAL BUDGET AND FEDERAL SECTOR IN NATIONAL INCOME ACCOUNTS(In billions of dollars)
Calendar QuartersFiscal 1972 e/ FY 1973 e/ Calendar Years F.R.B. Staff EstimatesJan. F.R. Jan. 1971 1972 1972
Budget Board Budget Actual F.R.Be/ IV* I II III IV
Federal Budget
(Quarterly data, unadjusted)Surplus/deficit
ReceiptsOutlays
-38.8197.8236.6
Means of financing:Net borrowing from the public 39.5Decrease in cash operating balance --Other 1/ -.7
Cash operating balance, end of period 8.8.
2/Memo: Net agency borrowing--
National Income Sector
(Seasonally adjusted annual rate)Surplus/defiit
ReceiptsExpenditures
High employment surplus/deficit(NIA basis) 3/
n.a.
-35.0202.8237.8
-35.1199.3234.4
32.01.81.3
7.0
-25.5220.8246.3
27.5
-2.0
8.8
-24.8194.0218.8
24.8-3.23.2
11.3
5.6 n.e.
-29.5206.0235.5
n.a.
-28.0227.9255.9
.6 n.a.
-39.0208.0247.0
32.44.32.3
-10.644.655.2
12.5-1.3-.6
-11.646.257.8
-5.159.965.0
4.1 6.36.1 -1.81.4 .6
-9.953.363.2
8.9
1.0
7.0 11.3 5.2 7.0 7.0
1.1 n.e.
-23.2198.8222.0
-33.3215.1248.3
1.4 1.0 1.6 n.e. n.e.
-26.3 -27.9203.1 /211.6229.4 239.5
2.7 -6.4
-37.0211.5248.5
-36.2215.7251.9
.8 -7.6 -10.0
* Actual e--pr6jected n.e.--hot estimated n.a.--not available1/ Includes such items as deposit fund accounts and clearing accounts.2/ Federally-sponsored credit agencies, i.e., Federal Home Loan Banks, Federal National Mortgage Assn., Federal
Land Banks, Federal Intermediate Credit Banks, and Banks for Cooperatives.3/ Estimated by F.R. Board Staff.
-12.448.661.0
13.1
-. 7
7.0
-32.0221.4253.4
-8.8

II - 21
retroactive to January 1, 1972, yielding $2.3 billion revenues in FY
1973 and (2) an increase from 10.4 to 10. per cent in the social
security tax rate, effective January 1, 1973. It should be noted,
however, that present law calls for an increase in the employment tax
rate to 11.3 per cent early in 1973, so that this proposed tax rate
change involves a decrease relative to current law.
The Administration's budget figures shown in the preceding
table, indicate a somewhat faster growth (7.6 per cent) in NIA expendi-
tures in FY 1973 than the unified budget outlays figures (4.1 per cent),
since the NIA accounts tend to smooth out some of the bulge in spending
implied by the unified budget. The staff's estimate of the Federal
Sector NIA accounts, shown in the next table, suggests even faster
growth in FY'73 because no revenue sharing is included in the staff's
estimate until July 1972.
The staff projection indicates a sharp rise in Federal
expenditures in calendar 1972, especially in the first half of the
year when the increase is about $17 billion. A good part of this
increase in the first half of the year is accounted for by non-recurring
items as follows:
Billions of dollarsExpenditure Category Annual Rates
Special military pay raise 1.9
General military and civilian pay raises 2.2
Faster defense and nondefense procurement 3.5
Advance of public assistance grant 2.0
13-week extension of unemployment compensation 1.0
Total 10.6
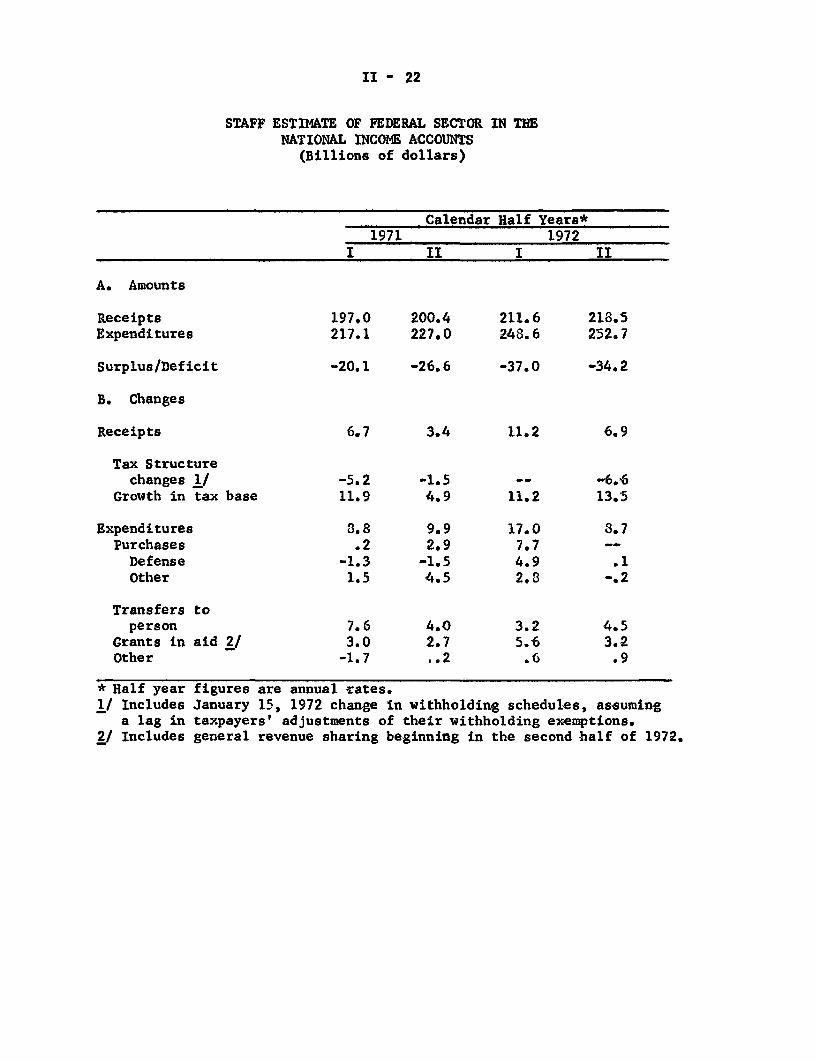
II - 22
STAFF ESTIMATE OF FEDERAL SECTOR IN THENATIONAL INCOME ACCOUNTS
(Billions of dollars)
Calendar Half Years*1971 1972
I II I II
A. Amounts
Receipts 197,0 200.4 211.6 218.5Expenditures 217.1 227.0 248.6 252.7
Surplus/Deficit -20.1 -26.6 -37.0 -34.2
B. Changes
Receipts 6.7 3.4 11.2 6.9
Tax Structurechanges 1/ -5.2 -1.5 -- -6.6
Growth in tax base 11.9 4.9 11.2 13.5
Expenditures 8.8 9.9 17.0 8.7Purchases .2 2.9 7.7 --
Defense -1.3 -1.5 4.9 .1Other 1.5 4.5 2.8 -.2
Transfers toperson 7.6 4.0 3.2 4.5
Grants in aid 2/ 3.0 2.7 5.6 3.2Other -1.7 .2 .6 .9
* Half year1/ Includes
a lag in2/ Includes
figures are annual rates.January 15, 1972 change in withholding schedules, assumingtaxpayers' adjustments of their withholding exemptions.general revenue sharing beginning in the second half of 1972.

II - 23
In the second half of calendar 1972, projected expenditure growth--
reflecting the budget projection of a slower growth in outlays in
FY 1973--is reduced to levels below that attained in the first and
second halves of calendar 1971.
According to the staff estimates, the high employment budget
on a NIA basis (see table entitled."Staff Estimate of High Employment
Budget")shows an $8.0 billion shift (annual rates) toward deficit in
the first half of calendar 1972 followed by a further $6.1 billion
shift toward deficit in the second half of the year. For the calendar
year 1972 the high employment deficit is about $6.5 billion compared to
a $2.7 billion surplus in 1971. While there is a clear shift toward
fiscal stimulus in CY 1972, the change in the first half of the year
seems to be overstated by the shift in the high employment deficit
because of some of the non-recurring expenditure increases mentioned
above. Some of these changes in expenditures--such as the advance in
public assistance grants--may be reversed in the next half year while
others may result mainly in adjustments of business inventories. On
the other hand, most of the effect on personal incomes of the large
increase in the social security wage base will be felt in the second
half of the calendar year and, in this respect, there is more stimulation
in the first half than the NIA-based estimates of the Full-employment
surplus indicate. Stimulus in the second half of the year may also be
overstated to some extent, since the general revenue sharing program
is not likely to have an immediate impact on state and local spending.
The shift toward the high employment deficit in Calendar 1972
also reflects the tax law changes recently enacted. Structural changes

II - 24
STAFF ESTIMATE OF THE HIGH EMPLOYMENTSURPLUS/DEFICIT, NIA BASIS
(Billions of dollars, annual rates)
CalendarHalf Years Surplus/Deficit
1969 I 5.1
II 5.6
1970 I 2.4
II 1.5
1971 I .8
II 4.6
1972 I -3.4
II -9.5
in taxes from CY 1971 to CY 1972 are expected to reduce high employment
receipts by $4.6 billion this calendar year, but a portion of this
stimulus is expected to be offset since taxpayers are not likely to
fully adjust their declared exemptions in response to the new withholding
schedules. The changes in high employment receipts from the corporate
sector are timed to reflect tax liabilities and probably do not ade-
quately capture the lagged stimulative impact of recently enacted tax
incentives, such as the investment tax credit and accelerated depreciation.
The new budget projects total net borrowing from the public
of $39.5 billion in the current fiscal year. The staff estimate is
about $7 billion less because our projected deficit is $3.7 billion
smaller and because we expect that the Treasury will find other means
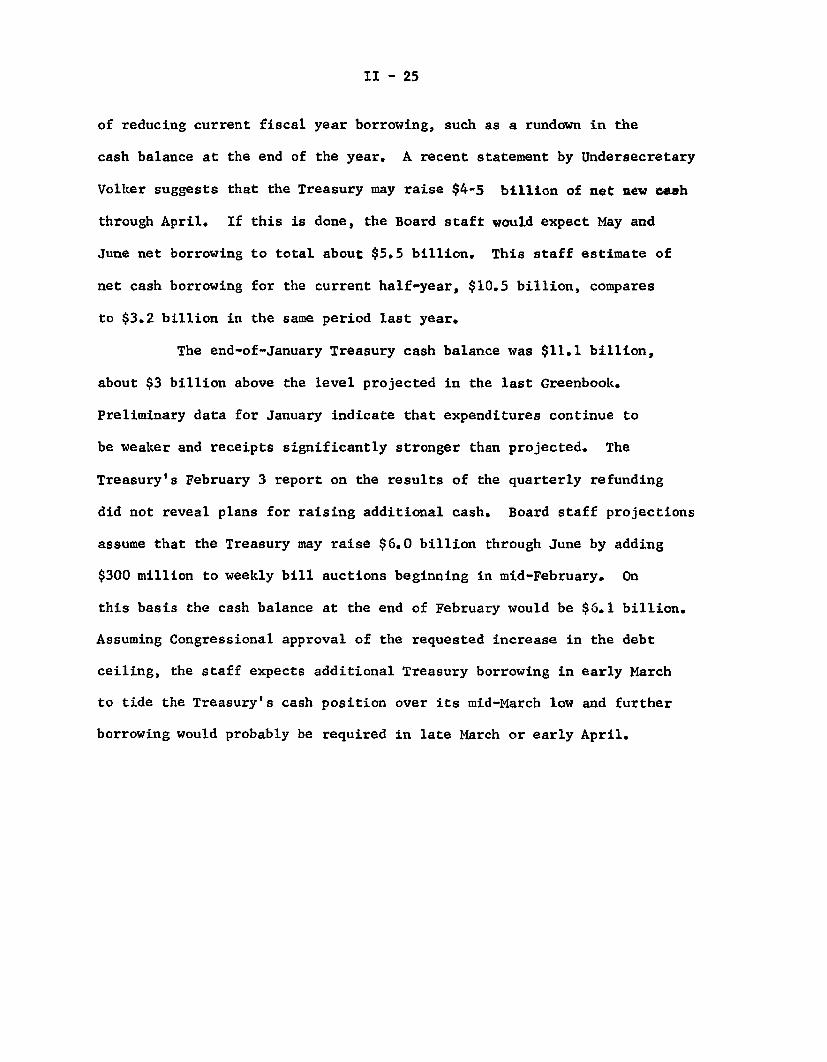
II - 25
of reducing current fiscal year borrowing, such as a rundown in the
cash balance at the end of the year. A recent statement by Undersecretary
Volker suggests that the Treasury may raise $4-5 billion of net new cash
through April. If this is done, the Board staff would expect May and
June net borrowing to total about $5.5 billion. This staff estimate of
net cash borrowing for the current half-year, $10.5 billion, compares
to $3.2 billion in the same period last year.
The end-of-January Treasury cash balance was $11.1 billion,
about $3 billion above the level projected in the last Greenbook.
Preliminary data for January indicate that expenditures continue to
be weaker and receipts significantly stronger than projected. The
Treasury's February 3 report on the results of the quarterly refunding
did not reveal plans for raising additional cash. Board staff projections
assume that the Treasury may raise $6.0 billion through June by adding
$300 million to weekly bill auctions beginning in mid-February. On
this basis the cash balance at the end of February would be $6.1 billion.
Assuming Congressional approval of the requested increase in the debt
ceiling, the staff expects additional Treasury borrowing in early March
to tide the Treasury's cash position over its mid-March low and further
borrowing would probably be required in late March or early April.
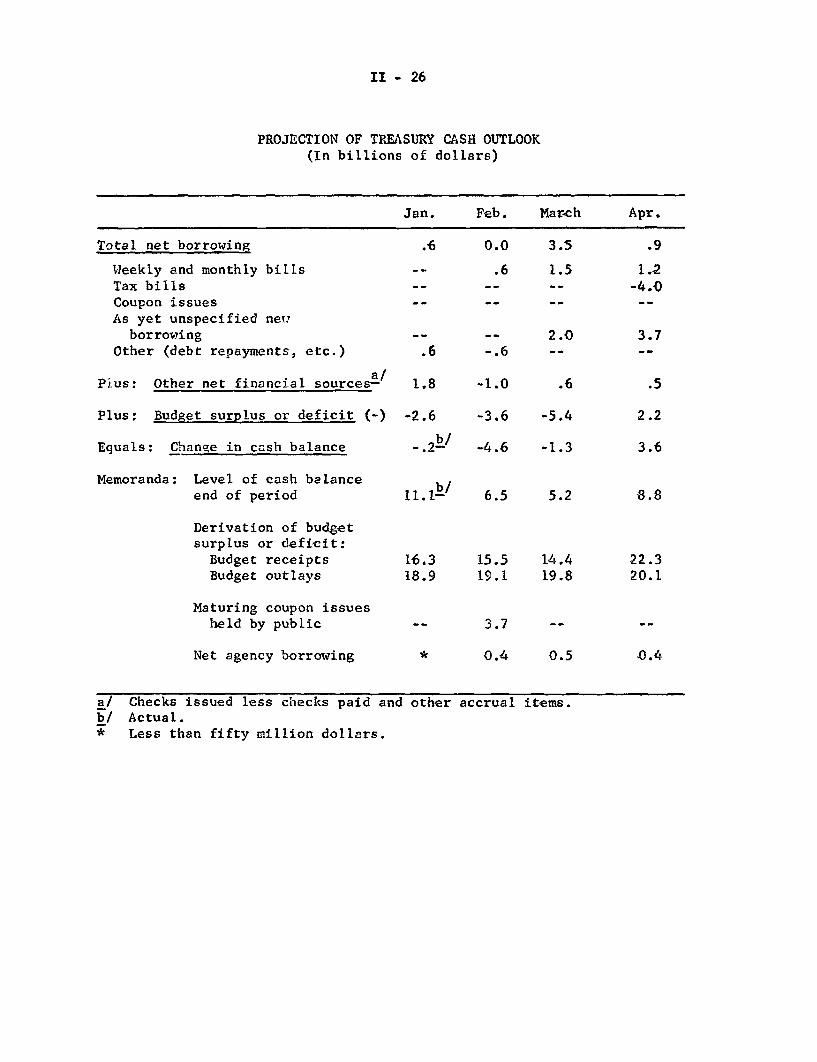
II - 26
PROJECTION OF TREASURY CASH OUTLOOK(In billions of dollars)
Total net borrowing
Weekly and monthly billsTax billsCoupon issuesAs yet unspecified newborrowing
Other (debt repayments, etc.)
a/Plus: Other net financial sources-
Plus: Budget surplus or deficit (-)
Equals: Change in cash balance
Memoranda: Level of cash balanceend of period
Derivation of budgetsurplus or deficit:
Budget receiptsBudget outlays
Maturing coupon issuesheld by public
Net agency borrowing
Jan.
.6
.6
1.8
-2.6
-.2b/
11.1 b /
16.318.9
*
Feb.
0.0
.6
-.6
-1.0
-3.6
-4.6
6.5
March
3.5
1.5
2.0
.6
-5.4
-1.3
5.2
15.5 14.419.1 19.8
3.7
0.4
Checks issued less checks paid and otherActual.Less than fifty million dollars.
accrual items.
Apr.
.9
1.2-4.0
3.7--
.5
2.2
3.6
8.8
22.320.1
0.4

INTERNATIONALDEVELOPMENTS

U.S. private capital (- = outflow)Direct investment abroadForeign securitiesBank-reported claims -- liquid
" " " otherNonbank-reported claims -- liquid
" " " other
Foreign capital (excl. reserve trans.)Direct investment in U.S.U.S. corporate stocksNew U.S. direct investment issuesOther U.S. securities (excl. U.S. Treas.)Liquid liabilities to:
Commercial banks abroadOf which liab. to branches
Other private foreignIntl. & regional institutions
Nonliquid liab. to banks and others
Foreign official reserve claims
U.S. monetary reserves (increase, -)Gold stockSpecial drawing rights 3/IMF gold trancheConvertible currencies
Errors and omissions
BALANCES (deficit -) 3/Official settlements, S.A.
" " , N.S.A.Net liquidity, S.A.
" " , N.S.A.
Liquidity, S.A. 4/" . N.S.A.
2/9/72
III -- T - 1U.S. Balance of Payments
In millions of dollars; seasonally adjusted
1 9 7 1Yeary-1 I II III IV&
Goods and services, net 1/Trade balance 2/
Exports 2/Imports 2/
Service balance
Remittances and pensionsGovt. grants & capital, net
-23.948
-57 1 139 -1 152
-2,906 248 -1,061 -560 -1,53342,753 11,016 10,706 11,466 9,565-45,659 -10,768 -11,767 -12,026 -11,098
2,849 891 1,056, 521 381
-342 -355 -388-1,026 -1,060 -883
-2,237 -2,183 -3.575-1,370 -1,393 -1,399
-875 -353 -388 -224 90-589 -90 35 -405 -129
-2,572 -42 -345 -1,203 -982-225 55 -115-157 -147 -229
-2.261 -8 -2.228
92 -16 -319740 79 -3 231 433
317 263 181164 -63 153
-6,398 -2,714 -39 -2,292 -1,353-6,595 -3,065 -92 -2,078 -1,360
(-4,948) (-2,085) (-117) (-1,817) (-92$-477 72 -145 -370 -34674 279 198 156 41
-200 -150 -182
27,281 4,851 5,072 10,949 6,409
3,065 862 838 1,373 -8866 109 456 300 1468 125 196 150 -3
1,350 255 252 851 -8381 373 -66 72 2
-1,017 -2,330 -5,204
-5,713 -5,910 -12,322 -6,401-30,346 -5,435 -6.462 -12,701 -5,748
-2,684 -5,961 -9,510 n.a.n.a. -2,560 -6,596 -10,076 n.a.
-2,999-2.901
-5,871-6.586
-10,030-10.596
-5,048-3.865
* Monthly, only exports and imports are seasonally adjusted.1/ Equals "net exports" in the GNP, except for latest revisions.2/ Balance of payments basis which differs a little from Census basis.3/ Excludes allocation of $717 million of SDRs on 1/1/71.4/ Measured by changes in U.S. monetary reserves, all liabilities to foreign official
reserve agencies and liquid liabilities to commercial banks and other foreigners.

III - 1
INTERNATIONAL DEVELOPMENTS
Despite a sharp speculative flurry against the dollar in the
past week, there has been a small net surplus in the U.S. balance of
payments on the official reserve transactions basis over the seven-
week period beginning shortly after the Smithsonian meeting. Thus, in
this period, any deficit on current account and normal capital trans-
actions has been offset by capital inflows of types identified with the
abnormal outflows of 1971.
Exchange rates for most major currencies against the dollar
were still near their floors at the beginning of January, but they
have risen considerably by now and on average are somewhat above the
central values.
Data on U.S. foreign trade, available through December, indicate
no significant change. Both exports and imports were unusually large
in December because of resumption of East Coast port operations under
a Taft-Hartley injunction. The trade deficit for the month -- contrary
to some expectations -- was larger than it had been in November,
although only slightly larger than the April-November average.
The fourth-quarter balance on goods and services ("net exports"
in the GNP accounts) is now estimated by the Commerce Department at an
annual rate of minus $4-1/2 billion, nearly double our estimate of a
month ago. The revision reflects the large December trade deficit, and
also takes account of preliminary indications that the balance on
services was relatively unfavorable in the fourth quarter.

III - 2
Noteworthy developments in capital transactions since mid-
December include a large outflow of bank loans and acceptance credits
to foreign banks and nonbanks before the year-end, which was only
partially reversed in January. On the other side of the accounts
there was large rebuilding of foreign commercial banks' balances at
their branches and agencies in the United States. Foreigners have
made substantial purchases of U.S. corporate stocks. There appears to
have been a sizable year-end slackening in direct investment outflows
(before seasonal adjustment) despite the 2-month postponement of the
normal OFDI deadline for program compliance; complete data, however,
will not be available for some time.
Abroad, industrial production in October-November showed a
continuing advance in Canada and France and an upturn in Italy, but
virtually no change from the third-quarter level in Germany, Britain,
and Japan.
Monetary and fiscal policy measures since mid-December have
included discount rate reductions in Germany, Japan, France, the
Netherlands, and Belgium. A highly expansionary budget was approved
by the Japanese Cabinet on January 12, and the German Economics and
Finance Minister, Mr. Schiller, announced on January 27 that large
amounts of funds frozen at the Bundesbank will be released within the
next six months for public capital expenditures and surtax refunds.
Other expansionary measures have been taken in Britain, France, and
Italy.
III - 3
Outlook. Forecasts of real GNP in European countries made
for the OECD Economic Policy Committee by the OECD Secretariat add
up,for the four largest countries, to a 3-1/2 per cent increase from
the year 1971 to the year 1972. Projected growth would be greater
than that in Britain and Italy, a good deal less in Germany. A shift
from absolute decline in inventories to positive investment is counted
on to power the resumption of growth. The inventory shift will be
stimulated on the continent mainly by public expenditures together with
consumer expenditures generated by budgetary actions, while in Britain
a pick-up in business fixed capital investment will also play a role.
For Europe as a whole, the rise in activity is expected to be
relatively slow during the first half of the year. In Japan, too,
expansion is unlikely to get going rapidly.
Relatively slack demand abroad for capital equipment and the
existence of more spare capacity in materials-producing industries
abroad than in 1969-70 will work against any very rapid expansion of
U.S. exports this year. The benefits of the currency realignment --
and of any differential movement of costs and prices that might favor
the U.S. competitive position -- are not likely to be fully realized
before the latter part of 1973 or even later. Projections for 1972
recently made by an interagency group put the value of U.S. exports of
goods in the fourth quarter of this year 15 per cent above the 1971
average level. But since the rise in value of imports -- accentuated by

III - 4
the initial price-raising effect of exchange rate changes -- would be
14 per cent, the merchandise trade deficit would remain near a $3 billion
rate throughout 1972. (This compares with a $4.2 billion average in
the past three quarters.)
Net exports of goods and services, which averaged a minus
$2.4 billion annual rate in the second half of 1971, are projected to
be less depressed in the current quarter, at minus $1 billion. The
difference reflects mainly the expected improvement in the merchandise
trade balance. (In judging the significance of this improvement it is
well to disregard recent quarterly fluctuations in the trade balance,
because those fluctuations reflected mainly a massive bunching of exports
at the end of the third quarter in anticipation of the East Coast dock
strike which began in October.) In addition, there will be a decline
in interest payments to foreigners in the current quarter, due to the
recent drop in interest rates.
For the over-all balance of payments there is a very wide
range of possibilities this year. If there were no reversal of the
abnormal capital outflows of 1971, the official settlements deficit
could reach an $8-to-9 billion range. Conceivably this could be fully
offset by abnormal inflows (including an unwinding of leads and lags
registered in the Errors and Omissions account and further large foreign
purchases of U.S. corporate equities).

III - 5
Present interest rate relationships are inhibiting the reversal
of last year's abnormal capital outflows that were motivated largely
by exchange rate expectations. Recent tendencies of interest rates
abroad to decline may be expected to continue over the near future,
though monetary authorities are unlikely to exert pressure in that
direction as they wait to see whether expansive fiscal and monetary
policy actions already taken, and additional fiscal measures already
announced, will produce the desired results.
Balance of payments. Data now available indicate an official
settlements deficit of $2-3/4 billion in December, making a deficit of
$5-3/4 billion before seasonal adjustment in the fourth quarter as a
whole. With seasonal adjustment, the fourth-quarter deficit was at a
$26 billion annual rate. The total for the year was over $30 billion.
As in earlier quarters, there were large capital outflows
in the fourth quarter. With the goods and services balance in that
quarter now estimated as a deficit of $4-1/2 billion, annual rate, with
remittances and pensions probably running at a $1-1/2 billion rate, and
with U.S. Government grants and credit outflows near a $4 billion
annual rate, the net outflow of private capital (together with
unidentified transactions) evidently exceeded a $15 billion rate.
Expressed as an actual quarterly amount, and excluding normal errors
and omissions, this was about $3-1/2 billion, seasonally adjusted.

III - 6
Only fragmentary information is available on the breakdown
of this $3-1/2 billion figure. One major component was an outflow
of bank loans and acceptance credits to foreign banks and nonbanks.
Bank-reported claims on foreigners increased by about $1-1/2 billion
unadjusted, or about $1 billion seasonally adjusted. Another large
component was a reduction of U.S. banks' borrowings from their foreign
branches and in balances due to other foreign commercial banks,
amounting in all to about $2 billion unadjusted, or about $1-1/2
billion seasonally adjusted. Partly counterbalancing these outflows
through banks, net purchases of U.S. corporate stocks jumped sharply
in December to the extraordinary amount of $480 million, a figure
more than half as large as total net purchases had been in the 23
months since the beginning of 1970.
Other private capital flows, for which data are not available,
include the direct investment outflows of U.S. corporations. These
outflows had been running in the first three quarters at a $5-1/2
billion rate, or nearly $1-1/2 billion a quarter. Although the OFDI
postponement of yearend compliance deadlines would have tended to
enlarge the net outflow in the fourth quarter, present indications
are that a slackening of at least the usual seasonal proportions may
have occurred.
If attention is focussed on the period since the Smithsonian
meeting of December 17-18, it is clear that there has been a small
III - 7
over-all balance of payments surplus on the official settlements basis
(of the order of magnitude of half a billion dollars in seven weeks),
but it is impossible to go very far toward identifying the components.
Presumably the underlying position was still one of substantial deficit.
Among the offsetting capital flows, foreign purchases of U.S. corporate
stocks continued sizable in January. Some of the December bank credit
outflow was reversed in January; from January 5 to February 2 there
was about a $400 million reduction in loans to foreigners identifi-
able in the weekly member bank statistics. Finally, a major factor was
a rebuilding of liabilities to foreign commercial banks, especially the
liabilities of foreign bank branches and agencies to their head offices.
In the six weeks from December 22 to February 2 the latter liabilities
rose by $1 billion. In the same period, liabilities of U.S. banks to
their foreign branches changed relatively little on balance; there
was a buildup in early January as some banks borrowed in order to
preserve reserve free bases, but over the six-week period there was
a net decline of $240 million.
In the four-week computation period ended January 19, U.S.
banks' liabilities to branches plus assets sold subject to Regulation M
averaged about $1/2 billion less than in the preceding period. Although
Eurodollar interest rates have declined since the beginning of the year,
they have remained until very recently enough above comparable U.S.
rates to make Eurodollar borrowing relatively unattractive for U.S.

III- 8
banks. In the past week, however, overnight Eurodollars have averaged
about 3 percent -- below the Federal funds rate.
Foreign exchange markets. Since the first of the year,
exchange market activity has been marked by a general uneasiness.
The dollar has depreciated by about 2 percent against major European
currencies and the Japanese yen, moving below its central rate against
most of these currencies. A burst of speculative sales of dollars in
the week ended February 4 resulted in a particularly sharp drop in
exchange rates and the purchase by major central banks of around
$400 million.
The dollar reached its lower limit only against the Belgian
franc, and the Belgian central bank purchased nearly $50 million, mostly
on a swap basis (buying dollars spot and selling them forward). Other
central banks purchasing dollars included those of the U.K., Japan,
Italy, and Germany, the latter in the amount of around $280 million.
These central banks purchased dollars at rates well above its floor
against their currencies with the avowed object of stabilizing their
markets. Following the central bank's exchange purchases, money market
interest rates in Germany and Belgium eased noticeably, aided in the
latter case by a 1/2 percent discount rate reduction, and those two
currencies eased against the dollar in the exchange markets.
In the forward markets discounts on the dollar have narrowed
as the spot dollar moved away from its ceiling and toward its lower limit.

III - 9
Gold markets experienced considerable speculative activity
in recent weeks, with the price rising from less than $44.00 at year-
end to a peak of just over $49.00 on February 2. The Treasury's
announcement that it would send a "clean' gold price bill to Congress
this week, seemed to take some of the steam out of speculative demand
for gold, and the free market price dropped back to around $48.00 as
of February 9.

III - 10
Business situation in Western Europe and Japan. The
possibility of a cumulative downturn in economic activity in the
industrial countries outside North America has diminished. A recession
of 1966-67 proportions is not likely in Europe, and the Japanese
recession appears to have touched bottom at the end of last year.
Latest surveys of business sentiment show a significant
improvement in confidence as compared with earlier months. The
change is partly explained by the alleviation of post-August uncer-
tainties about the international economic climate, but also by the
fact that demand mangement policies in virtually all countries are
now clearly expansionary (some smaller countries, such as Austria,
Belgium and the Netherlands are exceptions).
The favorable shift in confidence is not yet discernible
in the movement of the latest economic indicators: new orders in
October-November continued to lag behind deliveries (except in the
United Kingdom), industrial production remained flat (except in
France and Italy), and unemployment continued to rise. While there
may be only a moderate pick-up in activity over the next few months,
it now appears likely that the end of the present slowdown will be
reached in the current quarter.
In assessing the current situation it must be remembered
that in no Western European country, with the exception of the

III - 11
United Kingdom, Italy and Sweden, is the margin of unused capacity
currently very large. Unemployment-to-job-vacancy ratios remain
near top-of-cycle levels (except in the United Kingdom). (See table.)
A moderate upturn during 1972, bringing growth rates back to about
trend levels by the end of the year would be consistent with some
further rise in unemployment, since growth in output would initially
stem mainly from increases in productivity.
RATIOS OF REGISTERED JOB APPLICANTS TO VACANCIES(seasonally adjusted)
Nether- United
Belgium France Germany Italy a/ lands Kingdom
Preceding cycle:peak b/ 1.8 0.2 n.a. 0.2 0.8trough b/ 6.5 2.1 n a. 1.2 2.5
Recent cycle:1970--1 1.3 2.5 0.2 3.6 0.4 2.3
II 1.3 2.7 0.2 2.8 0.4 2.4III 1.3 2.8 0.2 3.2 0.3 2.6IV 1.3 3.2 0.2 3.1 0.3 2.6
1971--I 1.4 2.9 0.2 3.5 0.4 3.5II 1.4 2.4 0.3 2.9 0.5 4.7III 1.4 2.5 0.4 3.0 0.6 5.4IV n.a. 3.1 0.4 3.0 0.8 5.9
a/ Not seasonally adjusted.b/ Data not comparable.Source: OECD Main Economic Indicators.

III - 12
The slowdown in the increase in aggregate demand during the
past year resulted primarily from slower growth -- in some countries
a decline -- in private fixed investment demand coupled with an
inventory recession. (See table.) The latter seems to have run its
course by now. Expansionary budget programs indicate that a major
stimulus to growth in 1972 is likely to come from public sector
investment expenditures. This is particularly true for Japan and
France, and, given recent policy statements, probably also for Germany.
Private consumption and foreign demand, coupled with an
increase in the proportion of total demand met out of domestic pro-
duction, were major sustaining factors for the level of economic
activity during 1971. However, these are not expected to contribute
to an acceleration in rates of growth in coming months.
CONTRIBUTION OF SELECTED COMPONENTS TO TOTAL REAL DEMANDIN FOUR MAJOR EUROPEAN COUNTRIES 1/
(Change as per cent of previous year total GNP)
1. Consumer expenditures2. Government current expenditures3. Fixed investment4. Inventory change5. (1-4) Total domestic demand6. Plus exports7. Total demand8. Minus imports9. GNP
1/ Source: OECD CPE (72)1. CountriesItaly and the United Kingdom.e - Estimated.
1970
3.20.41.7
-0.15.22.07.22.54.7
included
1972
1971e Forecast
2.7 2.40.6 0.50.6 0.4
-0.9 0.43.0 3.71.6 1.24.6 4.91.5 1.43.1 3.5
are France, Germany,
III - 13
The volume of private consumption has been growing more
slowly in recent quarters, reflecting the continued rapid rise in
consumer prices, some loss in consumer confidence, and smaller increases
in disposable incomes associated with a deceleration in wage increases
and stagnant employment. Except in the United Kingdom, where recent
policy measures are stimulating consumer spending, these conditions
are likely to continue at least until mid-year. Progress in slowing
the rates of price increases, currently apparent at the wholesale
price level almost everywhere, but notably in Germany, may help to
enhance the growth of real consumption, as would a restoration of
confidence, especially given the current high rates of saving. In
Germany, the large addition to disposable incomes expected this summer
with the repayment of the income tax surcharge collected earlier (the
repayments amount to just over 1 per cent of annual net income
from wages, salaries and transfers) may turn consumption demand into
an important expansionary factor in the second half of the year.
The expansion of net foreign demand (exports minus imports
of goods and services) in 1972 will vary from country to country,
reflecting both effects of the currency realignment out of differing
cyclical positions. In all four of the largest European countries,
the contribution of net exports to the expansion of economic activity
is expected to be somewhat less in 1972 than in 1971.
The main factor in the slowing of growth rates of final
domestic demand in 1971 was the sluggishness of private investment

III - 14
demand, and this will continue to act as a drag well into this year.
But it should be kept in mind that the current slowdown in investment
proceeded from exceptionally high levels. The investment boom of
1969-70 brought the share of private investment in GNP to an extra-
ordinarily high level in virtually all industrial countries, but
particularly in Germany and Japan. The present slowdown is likely
to restore the average relationships which existed in the 1960's only
sometime during the current year, and an upturn in private investment
therefore seems unlikely in the near future. Consequently, current
policy measures aimed at expanding public sector investment and at
maintaining disposable incomes would seem to provide an appropriate
basis for the resumption of balanced growth towards the end of the
year. However, whether balanced or even adequate growth will
materialize in fact depends largely upon the future restoration of
business confidence as well as the continuation of expansionary
policies. Particularly in Germany it is not clear whether the shift
in fiscal policy will be supported by an expansionary monetary policy.


