
Follow up of GW170817 and its electromagnetic … Innovative Science LLC, Moncks Corner, SC 29461,...
26
Publications of the Astronomical Society of Australia (PASA) c Astronomical Society of Australia 2017; published by Cambridge University Press. doi: 10.1017/pas.2017.xxx. Follow up of GW170817 and its electromagnetic counterpart by Australian-led observing programs I. Andreoni 1,2,3* , K. Ackley 2,4,5 , J. Cooke 1,2,6 , A. Acharyya 7 , J. R. Allison 8,9 , G. E. Anderson 10 , M. C. B. Ashley 11 , D. Baade 12 , M. Bailes 1,2 , K. Bannister 13 , A. Beardsley 14 , M. S. Bessell 7 , F. Bian 7 , P. A. Bland 15 , M. Boer 16 , T. Booler 10 , A. Brandeker 17 , I. S. Brown 18 , D. A. H. Buckley 19 , S.-W. Chang 7,6 , D. M. Coward 20 , S. Crawford 19 , H. Crisp, 20 , B. Crosse 10 , A. Cucchiara 21 , M. Cup´ ak 15 , J. S. de Gois, 10 , A. Deller 1 , H. A. R. Devillepoix, 15 , D. Dobie 8,13,6 , E. Elmer 22 , D. Emrich 10 , W. Farah 1 , T. J. Farrell 3 , T. Franzen 23 , B. M. Gaensler 24 , D. K. Galloway 2,4,5 , B. Gendre 21,16 , T. Giblin 25 , A. Goobar 26 , J. Green 13 , P. J. Hancock 10 , B. A. D. Hartig 15 , E. J. Howell 20 , L. Horsley 10 , A. Hotan 23 , R. M. Howie 27 , L. Hu 28,29 , Y. Hu 30,29 , C. W. James 8 , S. Johnston 13 , M. Johnston-Hollitt 31 , D. L. Kaplan 18 , M. Kasliwal 32 , E. F. Keane 33 , D. Kenney 10 , A. Klotz 34 , R. Lau 32 , R. Laugier 16 , E. Lenc 6,8 , X. Li 35,29 , E. Liang 36 , C. Lidman 3 , L. C. Luvaul 7 , C. Lynch 8,6 , B. Ma 30 , D. Macpherson 20 , J. Mao 37 , D. E. McClelland 7,2 , C. McCully 38,39 , A. M¨ oller 7,6 , M. F. Morales 40 , D. Morris 21 , T. Murphy 8,6 , K. Noysena 16,34 , C. A. Onken 7,6 , N. B. Orange 41 , S. Oslowski 1 , D. Pallot 20 , J. Paxman 27 , S. B. Potter 19 , T. Pritchard 1 , W. Raja 13 , R. Ridden-Harper 7 , E. Romero-Colmenero 19,42 , E. M. Sadler 8,6 , E. K. Sansom 15 , R. A. Scalzo 7,6,43 , B. P. Schmidt 7,6 , S. M. Scott 7,2 , N. Seghouani 44 , Z. Shang 30,45,29 , R. M. Shannon 13,10,2 , L. Shao 7,46 , M. M. Shara 47,48 , R. Sharp 7,6 , M. Sokolowski 10,6 , J. Sollerman 17 , J. Staff 21 , K. Steele 10 , T. Sun 28,29 , N. B. Suntzeff 49 , C. Tao 50,51 , S. Tingay 10,6 , M. C. Towner 15 , P. Thierry 52 , C. Trott 10,6 , B. E. Tucker 7,6 , P. V¨ ais¨ anen 19,42 , V. Venkatraman Krishnan 1,6 , M. Walker 10 , L. Wang 49,28,29 , X. Wang 51 , R. Wayth 10,6 , M. Whiting 13 , A. Williams 10 , T. Williams 19 , C. Wolf 7,6 , C. Wu 20 , X. Wu 28,29 , J. Yang 28 , X. Yuan 35,29 , H. Zhang 36 , J. Zhou 36 , and H. Zovaro 7 Abstract The discovery of the first electromagnetic counterpart to a gravitational wave signal has generated follow-up observations by over 50 facilities world-wide, ushering in the new era of multi-messenger astronomy. In this paper, we present follow-up observations of the gravitational wave event GW170817 and its electromagnetic counterpart SSS17a/DLT17ck (IAU label AT2017gfo) by 14 Australian telescopes and partner observatories as part of Australian-based and Australian-led research programs. We report early- to late-time multi- wavelength observations, including optical imaging and spectroscopy, mid-infrared imaging, radio imaging, and searches for fast radio bursts. Our optical spectra reveal that the transient source afterglow cooled from approximately 6400K to 2100K over a 7-day period and produced no significant optical emission lines. The spectral profiles, cooling rate, and photometric light curves are consistent with the expected outburst and subsequent processes of a binary neutron star merger. Star formation in the host galaxy probably ceased at least a Gyr ago, although there is evidence for a galaxy merger. Binary pulsars with short (100 Myr) decay times are therefore unlikely progenitors, but pulsars like PSR B1534+12 with its 2.7 Gyr coalescence time could produce such a merger. The displacement (∼2.2 kpc) of the binary star system from the centre of the main galaxy is not unusual for stars in the host galaxy or stars originating in the merging galaxy, and therefore any constraints on the kick velocity imparted to the progenitor are poor. Keywords: gravitational waves – stars: neutron – supernovae: general – supernovae: individual: AT2017gfo – gamma-ray burst: individual: GRB170817A * [email protected] 1 arXiv:1710.05846v1 [astro-ph.HE] 16 Oct 2017
Transcript of Follow up of GW170817 and its electromagnetic … Innovative Science LLC, Moncks Corner, SC 29461,...

Publications of the Astronomical Society of Australia (PASA)c© Astronomical Society of Australia 2017; published by Cambridge University Press.doi: 10.1017/pas.2017.xxx.
Follow up of GW170817 and its electromagnetic
counterpart by Australian-led observing programs
I. Andreoni1,2,3∗, K. Ackley2,4,5, J. Cooke1,2,6, A. Acharyya7, J. R. Allison8,9, G. E. Anderson10, M. C. B. Ashley11,D. Baade12, M. Bailes1,2, K. Bannister13, A. Beardsley14, M. S. Bessell7, F. Bian7, P. A. Bland15, M. Boer16,T. Booler10, A. Brandeker17, I. S. Brown18, D. A. H. Buckley19, S.-W. Chang7,6, D. M. Coward20, S. Crawford19,H. Crisp,20, B. Crosse10, A. Cucchiara21, M. Cupak15, J. S. de Gois,10, A. Deller1, H. A. R. Devillepoix,15,D. Dobie8,13,6, E. Elmer22, D. Emrich10, W. Farah1, T. J. Farrell3, T. Franzen23, B. M. Gaensler24,D. K. Galloway2,4,5, B. Gendre21,16, T. Giblin25, A. Goobar26, J. Green13, P. J. Hancock10, B. A. D. Hartig15,E. J. Howell20, L. Horsley10, A. Hotan23, R. M. Howie27, L. Hu28,29, Y. Hu30,29, C. W. James8, S. Johnston13,M. Johnston-Hollitt31, D. L. Kaplan18, M. Kasliwal32, E. F. Keane33, D. Kenney10, A. Klotz34, R. Lau32,R. Laugier16, E. Lenc6,8, X. Li35,29, E. Liang36, C. Lidman3, L. C. Luvaul7, C. Lynch8,6, B. Ma30, D. Macpherson20,J. Mao37, D. E. McClelland7,2, C. McCully38,39, A. Moller7,6, M. F. Morales40, D. Morris21, T. Murphy8,6,K. Noysena16,34, C. A. Onken7,6, N. B. Orange41, S. Os lowski1, D. Pallot20, J. Paxman27, S. B. Potter19,T. Pritchard1, W. Raja13, R. Ridden-Harper7, E. Romero-Colmenero19,42, E. M. Sadler8,6, E. K. Sansom15,R. A. Scalzo7,6,43, B. P. Schmidt7,6, S. M. Scott7,2, N. Seghouani44, Z. Shang30,45,29, R. M. Shannon13,10,2,L. Shao7,46, M. M. Shara47,48, R. Sharp7,6, M. Sokolowski10,6, J. Sollerman17, J. Staff21, K. Steele10, T. Sun28,29,N. B. Suntzeff49, C. Tao50,51, S. Tingay10,6, M. C. Towner15, P. Thierry52, C. Trott10,6, B. E. Tucker7,6,P. Vaisanen19,42, V. Venkatraman Krishnan1,6, M. Walker10, L. Wang49,28,29, X. Wang51, R. Wayth10,6,M. Whiting13, A. Williams10, T. Williams19, C. Wolf7,6, C. Wu20, X. Wu28,29, J. Yang28, X. Yuan35,29, H. Zhang36,J. Zhou36, and H. Zovaro7
AbstractThe discovery of the first electromagnetic counterpart to a gravitational wave signal has generated follow-upobservations by over 50 facilities world-wide, ushering in the new era of multi-messenger astronomy. In thispaper, we present follow-up observations of the gravitational wave event GW170817 and its electromagneticcounterpart SSS17a/DLT17ck (IAU label AT2017gfo) by 14 Australian telescopes and partner observatoriesas part of Australian-based and Australian-led research programs. We report early- to late-time multi-wavelength observations, including optical imaging and spectroscopy, mid-infrared imaging, radio imaging,and searches for fast radio bursts. Our optical spectra reveal that the transient source afterglow cooled fromapproximately 6400K to 2100K over a 7-day period and produced no significant optical emission lines. Thespectral profiles, cooling rate, and photometric light curves are consistent with the expected outburst andsubsequent processes of a binary neutron star merger. Star formation in the host galaxy probably ceased atleast a Gyr ago, although there is evidence for a galaxy merger. Binary pulsars with short (100 Myr) decaytimes are therefore unlikely progenitors, but pulsars like PSR B1534+12 with its 2.7 Gyr coalescence timecould produce such a merger. The displacement (∼2.2 kpc) of the binary star system from the centre ofthe main galaxy is not unusual for stars in the host galaxy or stars originating in the merging galaxy, andtherefore any constraints on the kick velocity imparted to the progenitor are poor.
Keywords: gravitational waves – stars: neutron – supernovae: general – supernovae: individual: AT2017gfo– gamma-ray burst: individual: GRB170817A
1
arX
iv:1
710.
0584
6v1
[as
tro-
ph.H
E]
16
Oct
201
7
2 Andreoni et al.
AFFILIATIONS
1Centre for Astrophysics and Supercomputing, Swinburne University of Technology, PO Box 218, H29, Hawthorn,VIC 3122, Australia2The Australian Research Council Centre of Excellence for Gravitational Wave Discovery (OzGrav)3Australian Astronomical Observatory, 105 Delhi Rd, North Ryde, NSW 2113, Australia4Monash Centre of Astrophysics, Monash University, VIC 3800, Australia5School of Physics & Astronomy, Monash University, VIC 3800, Australia6The Australian Research Council Centre of Excellence for All-Sky Astrophysics (CAASTRO)7Research School of Astronomy and Astrophysics, The Australian National University, Canberra ACT 2611,Australia8Sydney Institute for Astronomy, School of Physics, University of Sydney, NSW 2006, Australia9The Australian Research Council Centre of Excellence for All-sky Astrophysics in 3 Dimensions (ASTRO 3D)10International Centre for Radio Astronomy Research, Curtin University, Bentley WA 6102, Australia11School of Physics, University of New South Wales, NSW 2052, Australia12European Organisation for Astronomical Research in the Southern Hemisphere (ESO), Karl-Schwarzschild-Str. 2,85748 Garching bei Munchen, Germany13ATNF, CSIRO Astronomy and Space Science, PO Box 76, Epping, NSW 1710, Australia14School of Earth and Space Exploration, Arizona State University, Tempe, AZ 85287, USA15Department of Applied Geology, Curtin University, GPO Box U1987, Perth, WA 6845, Australia16Artemis/Observatoire de la Cote d’Azur/CNRS, Boulevard de l’Observatoire CS 34229 - F 06304 NICE Cedex4, France17Department of Astronomy, Stockholm University, Albanova, SE 10691 Stockholm, Sweden18Department of Physics, University of Wisconsin–Milwaukee, Milwaukee, WI 53201, USA19South African Astronomical Observatory, PO Box 9, 7935 Observatory, South Africa20School of Physics, University of Western Australia, Crawley, WA 6009, Australia21University of the Virgin Islands, 2 John Brewer’s Bay, 00802 St Thomas, US Virgin Islands, USA22School of Physics and Astronomy, University of Nottingham, Nottingham, UK23ATNF, CSIRO Astronomy and Space Science, 26 Dick Perry Avenue, Kensington WA 6152, Australia24Dunlap Institute for Astronomy and Astrophysics, University of Toronto, ON, M5S 3H4, Canada25Department of Physics, 2354 Fairchild Drive, U.S. Air Force Academy, CO 80840, USA26The Oskar Klein Centre, Department of Physics, Stockholm University, Albanova, SE 106 91 Stockholm, Sweden27Department of Mechanical Engineering, Curtin University, GPO Box U1987, Perth, WA 6845, Australia28Purple Mountain Observatory, Chinese Academy of Sciences, Nanjing 210008, China29Chinese Center for Antarctic Astronomy, Nanjing 210008, China30National Astronomical Observatories, Chinese Academy of Sciences, Beijing 100012, China31Peripety Scientific Ltd., PO Box 11355 Manners Street, Wellington, 6142, New Zealand32Division of Physics, Mathematics and Astronomy, California Institute of Technology, Pasadena, CA 91125, USA33SKA Organisation, Jodrell Bank Observatory, SK11 9DL, UK34IRAP (CNRS/UPS) 34 ave. Edouard Belin, 31400 Toulouse France35Nanjing Institute of Astronomical Optics and Technology, Nanjing 210042, China36School of Astronomy and Space Science and Key Laboratory of Modern Astronomy and Astrophysics in Ministryof Education, Nanjing University, Nanjing 210093, China37Yunnan Observatories, Chinese Academy of Sciences, 650011 Kunming, Yunnan Province, China38Las Cumbres Observatory, 6740 Cortona Dr., Suite 102, Goleta, CA 93117-5575, USA39Department of Physics, University of California, Santa Barbara, CA 93106-9530, USA40Department of Physics, University of Washington, Seattle, WA 98195, USA41OrangeWave Innovative Science LLC, Moncks Corner, SC 29461, USA42Southern African Large Telescope Foundation, P.O. Box 9, 7935 Observatory, South Africa.43Centre for Translational Data Science, University of Sydney, NSW 2006, Australia44Centre de Recherche en Astronomie, Astrophysique et Geophysique, BP 63, Route de l’Observatoire, Bouzareah,16340, Alger, Algeria45Tianjin Normal University, Tianjin 300074, China46Kavli Institute for Astronomy and Astrophysics, Peking University, 5 Yiheyuan Road, Haidian District, Beijing100871, P. R. China47Department of Astrophysics, American Museum of Natural History, Central Park West and 79th Street, New
PASA (2017)doi:10.1017/pas.2017.xxx
Follow up of GW170817 and its electromagnetic counterpart by Australian-led observing programs 3
York, NY 10024, USA48Institute of Astronomy, University of Cambridge, Madingley Road, Cambridge CB3 0HA, UK49George P. and Cynthia Woods Mitchell Institute for Fundamental Physics & Astronomy, Texas A. & M.University, Department of Physics and Astronomy, 4242 TAMU, College Station, TX 77843, USA50Aix Marseille Univ, CNRS/IN2P3, CPPM, Marseille, France51Physics Department and Tsinghua Center for Astrophysics, Tsinghua University, Beijing, 100084, China52Observatoire d’Auragne, 31190 Auragne, France
PASA (2017)doi:10.1017/pas.2017.xxx

4 Andreoni et al.
1 INTRODUCTION
The first detection of an electromagnetic (EM) coun-terpart to a gravitational wave (GW) event has led tothe new era of gravitational-wave multi-messenger as-trophysics. The close coordination of LIGO data analy-sis groups and multiple observational teams worldwidevia the restricted Gamma-Ray Coordinates Network(GCN) reports under confidential Memoranda of Un-derstanding (MoU), were key to the prompt identifi-cation and detailed multi-wavelength follow up of thecounterpart.
On August 17, 2017 12:41:041 the Advanced Laser In-terferometer Gravitational-Wave Observatory (aLIGO)interferometers detected a GW signal G298048, now re-ferred to as GW170817 (Abbott et al. 2017a,b,c,d,e,f).The Advanced-Virgo (aVirgo) interferometer was on-line at the time of the discovery and also contributedto the localisation of the GW event. On August 17,2017 12:41:06, about 2 seconds after the GW detection,the Gamma-ray Burst Monitor (GBM) instrument onboard the Fermi satellite independently detected a shortgamma-ray burst, labeled as GRB 170817A (Fermi:Connaughton et al. 2017; Goldstein et al. 2017a; vonKienlin et al. 2017; Goldstein et al. 2017b), (INTE-GRAL: Savchenko et al. 2017a,b), (Abbott et al. 2017g).The close temporal coincidence of the gamma-ray burstand gravitational wave event made it a compelling tar-get for follow up observations at other wavelengths.
The One-Meter, Two-Hemisphere project (1M2H)first announced the discovery of a transient in an imageacquired with the 1 m Swope telescope at Las Cam-panas Observatory in Chile on 17 August 2017 at 23:33UTC, 10.87 hr after the LIGO detection. However, theoptical counterpart to GW170817 (and GRB 170817A)was already imaged independently by six other pro-grams before this report. The 1M2H team referred tothe transient with the name Swope Supernova Survey2017a (SSS17a, Coulter et al. 2017a,b). Details aboutthe other independent detections can be found in Allamet al. (2017) for the Dark Energy Camera; Yang et al.(2017) and Valenti et al. (2017) for the Distance LessThan 40 Mpc survey (DLT40); Arcavi et al. (2017a) andArcavi et al. (2017b) for the Las Cumbres Observatory;Tanvir et al. (2017a) and Tanvir et al. (2017b) for theVisible and Infrared Survey Telescope for Astronomy;and Lipunov et al. (2017) and Lipunov et al. (2017, inprep) for the MASTER discoveries.
Abbott et al. (2017h) offer an extensive review of theworld-wide follow up. The optical transient is located atRA = 13:09:48.089 DEC = –23:22:53.350 (Adams et al.2017; Kasliwal et al. 2017), approximately 2.2 kpc fromthe centre of its host galaxy NGC 4993. The host is a
1All dates in this paper are UT, unless a different time refer-ence is explicitly specified.
nearby E/S0 galaxy at z = 0.009727, corresponding toa distance of ∼39.5 Mpc (Freedman et al. 2001). Here-after, we refer to the EM counterpart of GW170817 withthe IAU label AT2017gfo.
Short-duration GRBs (sGRBs) were previously sug-gested to be associated with merging compact objects,such as a binary neutron star (BNS) system or neutronstar-black hole (NSBH) system (e.g., Paczynski 1986;Goodman 1986). Electromagnetically, such mergers arealso postulated to generate a relatively rapidly evolvingoptical/infrared transient - referred to as kilonova ormacronova (e.g., Li & Paczynski 1998; Barnes & Kasen2013; Tanaka & Hotokezaka 2013; Kasen et al. 2015;Metzger et al. 2015; Barnes et al. 2016). The combina-tion of an sGRB and kilonova is considered the “smok-ing gun” signature of such mergers. Kilonova candi-dates were previously identified during the follow upof sGRBs, for example GRB 080503 (Perley et al. 2009;Gao et al. 2015), GRB 130603B (Berger et al. 2013; Tan-vir et al. 2013; Hotokezaka et al. 2013), and GRB 050709(Jin et al. 2016). However, no kilonova candidates havebeen discovered unrelated to GRB triggers, despite theiranticipated isotropic emission, unlike that of sGRBs.BNS and NSBH mergers, thus sGRBs, and subsequentkilonovae, are expected to be the most promising GWevents to exhibit EM counterparts.
Previous work has discussed the importance of rapidresponse (e.g., Chu et al. 2016) and collaborative strate-gies to maximise the chances of success in the EM fol-low up of aLIGO and Virgo triggers. Specifically, How-ell et al. (2015) presents the role that Australia canplay in this context. The association of GW170817 toGRB 170817A, detected during the LIGO and VirgoCollaboration (LVC) ‘O2’ run, has enabled the firstmulti-messenger (EM multi-wavelength, neutrino, andGW observations) study of an astrophysical event (Ab-bott et al. 2017h).
This paper presents and discusses the data acquiredduring the search for an EM counterpart to GW170817and the follow up of the now confirmed counterpart,AT2017gfo, by 15 observing programs led by Aus-tralian institutions and researchers. The observing pro-grams include facilities and collaborators associatedwith the Australia Research Council (ARC) Centreof Excellence for All-sky Astrophysics (CAASTRO2),the ARC Centre of Excellence for Gravitational WaveDiscovery (OzGrav3), and the multi-wavelength, multi-facility Deeper, Wider, Faster (DWF4) program. In Sec-tion 2 we summarise the observations from the tele-scopes/instruments that participated in the GW170817follow up, including optical, mid-infrared and radioimaging and spectroscopic observations. In Section 3
2http://www.caastro.org3http://www.ozgrav.org4http://www.dwfprogram.altervista.org
PASA (2017)doi:10.1017/pas.2017.xxx

Follow up of GW170817 and its electromagnetic counterpart by Australian-led observing programs 5
we provide an overview the spectroscopic observationsof the event and host galaxy and preliminary fits of ourobservations to theoretical sGRB afterglow and kilo-nova models. Finally, we present a discussion and sum-mary and in Section 4.
2 Facilities involved in the EM follow up ofGW170817
The following sections describe the optical, mid-infrared(mIR), and radio telescopes, instruments, and relevantobservations involved in the follow up of the GW170817EM counterpart by Australian or Australian-led pro-grams.
Shortly after the LVC community was alerted to theGW event, many of the facilities discussed here weretriggered into action for follow-up observations. How-ever, NGC 4993 and the bulk of the LVC error ellipsehad set in Eastern Australia and the Zadko telescope inWestern Australia was temporarily not operational. Onthe following day, the location of the optical counter-part AT2017gfo was known. Radio telescopes were onthe field that day and optical facilities were on the fieldshortly after sunset. Figure 1 presents the broad tem-poral coverage of the GW event by our spectroscopic,radio, and optical/mIR observations that extend fromearly to late times. The general characteristics of eachfacility is presented in Table 1 and details of the corre-sponding observations are listed in Tables 2–14.
2.1 Optical/Near-Infrared Imaging
2.1.1 SkyMapper
SkyMapper (Keller et al. 2007) is a 1.35 m modified-Cassegrain telescope located at Siding Spring Observa-tory in New South Wales, Australia, which is ownedand operated by the Australian National University(ANU). The camera has a 5.7 deg2 field of view, a pixelscale of 0.5 arcsec/pixel and six photometric filters inthe uvgriz system, which span the visible and ultra-violet bands from 325 nm to 960 nm. Typical single-epoch 5σ limiting magnitudes for each filter are u=19.5,v=19.5, g=21, r=21, i=20, and z=19, over 100 s expo-sure times. Since 2014, SkyMapper has conducted a full-hemisphere Southern sky survey in all six bands (seeWolf et al. 2017b, and http://skymapper.anu.edu.
au). Alongside this survey, the SkyMapper TransientSurvey (SMT) has been performing a survey dedicatedto supernovae and other transients (Scalzo et al. 2017).
SkyMapper first received the GW trigger when thetarget area had recently set in Eastern Australia and be-gan observing relevant target ranges shortly after sun-set the following night. The follow-up strategy includedtwo components: (1) to obtain uvgriz photometry of thefield containing AT2017gfo, in the event that the tran-
sient was the correct counterpart to the GW trigger,and (2) to image the 90% probability region (85 deg2)of the LVC sky-map to search for other counterpart can-didates (Figure 2).
Archival images at the coordinates of AT2017gfo werefound from the SkyMapper Southern Sky Survey andthe SkyMapper Transient Survey from August 8, 2015to July 22, 2017. We found no evidence of a pre-existing source or variability in the images coincidentwith AT2017gfo to a a 95% upper limit of i ∼19.6 andr ∼20.5 (Figure 3; Moller et al. 2017).
Imaging of the LVC skymap started at 2017-08-18 09:04:56 in the uvgriz filters with texp=100 s. Theimages of AT2017gfo were taken between 2017-08-1809:16:58 and 2017-08-18 10:00 UT in all bands (Fig-ure 4). The observations were taken at an airmass above2 and roughly half of the primary mirror was vignettedby the telescope dome. As a result of dome seeing andhigh airmass, the images have a seeing FWHM of 3.5–6 arcsec in i/z-bands to u-band. Nevertheless, the tran-sient AT2017gfo was immediately confirmed visuallyon raw frames in all six bands. Preliminary photomet-ric AB magnitudes are given as u = 17.9±0.15, v =17.9±0.10, g = 17.76±0.05, r = 17.20±0.05, and i =16.0±0.30, respectively (Wolf et al. 2017a).
Observations of the source continued between 2017-08-18 to 2017-08-22, at which point AT2017gfo couldno longer be visually identified in uvg bands. Imagingwas attempted again between 2017-08-28 and 2017-09-03 to obtain images for host galaxy subtraction, but wasunsuccessful. A total of 83 successful exposures weretaken with exposure times of 100 s for bands griz andup to 300 s, for uv. Host galaxy images in all filters areplanned when the target re-appears from behind theSun.
2.1.2 AST3-2
The Antarctic Schmidt Telescope (AST3) project com-prises three 68 cm (50 cm non-vignetted aperture)equatorial-mount telescopes located at the Kunlun Sta-tion at Dome A, Antarctica (Cui et al. 2008).
The second of the AST3 telescopes, AST3-2, employsa 10K×10K STA1600FT camera with a pixel scale of 1arcsec/pixel and a 4.14 deg field of view. The AST3-2 observations presented in this paper were performedas part of the DWF program (PI Cooke). Most facili-ties following AT2017gfo were only able to monitor thesource for 1–2 hr per night as a result of its positionnear the Sun. The location of AST3-2 is advantageousin that it can monitor the source over longer periods oftime as the source moved low along the horizon. Thedisadvantages are that the source was always at highairmass and the dark Antarctic winter was ending.
Observations targeting the GW counterpartAT2017gfo span from 2017-08-18 to 2017-08-28 inSDSS-i filter. A total of 262 exposures were acquired,
PASA (2017)doi:10.1017/pas.2017.xxx

6 Andreoni et al.
0 5 10 15 20
Days after GW Trigger
AST32Etelman/VIRT
ZadkoDFN
ESO VLT/NACOESO VLT/VISIR
SkyMapperVLBA
ParkesATCA
ASKAPMWASALTAAT
ANU2.3
Figure 1.: Observation timeline for the facilities presented in this paper showing the time of observation offset fromthe GW event and the nominal length of the reported observations. Spectroscopic observations are shown in green,radio observations in orange, and optical and mid-infrared are in blue.
Table 1: Facilities participating in the follow up observations summarised in this paper. Principalreferences for the relevant data from each facility are indicated in the right-most column. Wespecify under which program the observations were taken when multiple groups used the sametelescope to follow up GW170817 and AT2017gfo.
OIR Imaging Band FoV Aperture (m) ReferencesSkyMapper u,v,g,r,i,z 5.7 deg2 1.35 this workAST3-2* i 4.14 deg2 0.5 Hu et al. (2017b)
Zadko r, Clear 0.15 deg2 1 this workUVI Etelman* R, Clear 0.11 deg2 0.5 this workESO VLT/NACO* L3.8µm 784 arcsec2 8.2 this workESO VLT/VISIR* J8.9µm 1 arcmin2 8.2 Kasliwal et al. (2017)
DFN V full-sky 2×8mm this work
OIR Spectroscopy Range (A) R Aperture (m) ReferencesANU2.3/WiFeS 3300–9200 3000,7000 2.3 this work
SALT/RSS* 3600–9700 ∼300 10this workMcCully et al. (2017)
Buckley et al. (2017)
AAT/2dF+AAOmega* 3700–8800 1700 3.9 this work
Radio Band FoV (deg2) Mode References
ATCA† 5.5–21.2 GHz 0.037 – 0.143 ImagingHallinan et al. (2017)
Kasliwal et al. (2017)
ASKAP 0.7–1.8 GHz 30 Imaging this workASKAP 0.7–1.8 GHz 210 FRB this workMWA§ 185 MHz 400 Imaging this workVLBA 8.7 GHz 0.04 Imaging this workParkes 1.2-1.6 GHz 0.55 deg2 FRB this work* Observations initiated, or proposed for, via collaboration with DWF program† program CX391‡ program BD218§ program D0010
PASA (2017)doi:10.1017/pas.2017.xxx
Follow up of GW170817 and its electromagnetic counterpart by Australian-led observing programs 7
NGC 4993/AT2017gfo
12h0013h0014h00
-30
-15
Blind mode
Targeted mode
6dFGS (Top 50)
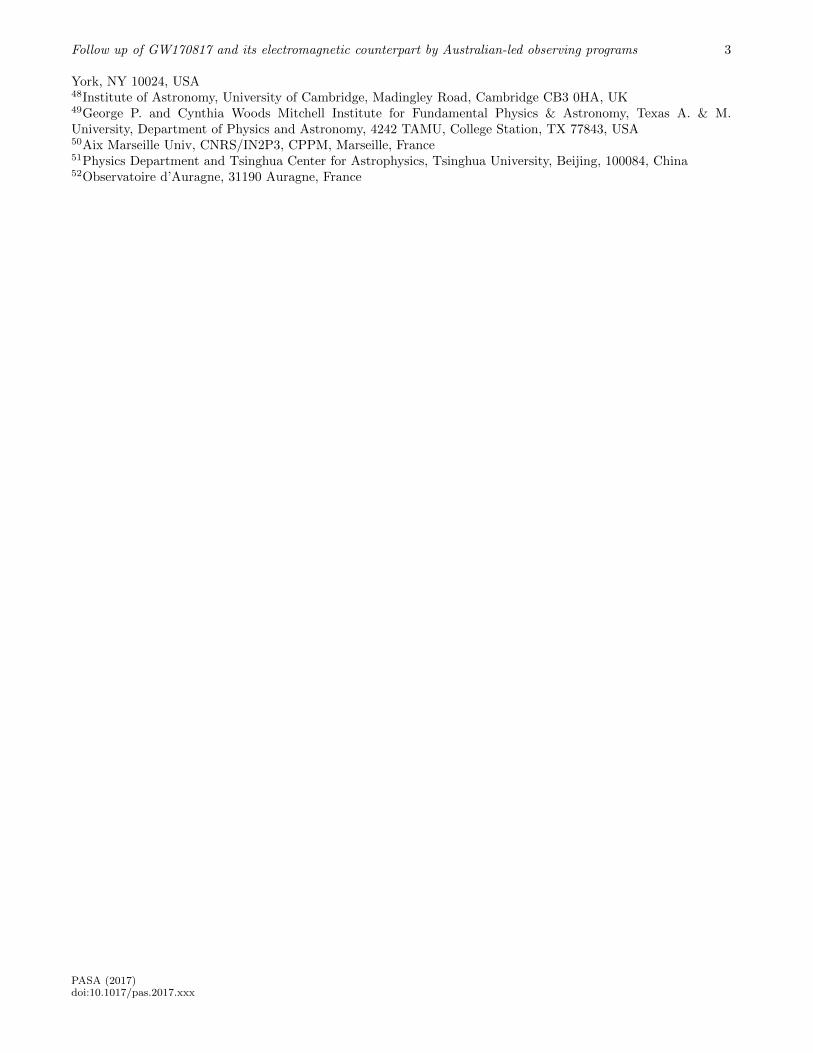
Figure 2.: Footprints of SkyMapper observations in twodifferent follow-up modes: one using the blind searchof new transient sources where fields overlap with GWlocalisation map (grey squares) and the other usingthe targeted observation of the optical counterpart,AT2017gfo, discovered by other EM follow-up groups(yellow square). The positions of AT2017gfo and its hostgalaxy (NGC 4993) are indicated on the figure. The reddots are target galaxies from the 6dFGS catalogue thatwere prioritized by their position and spectroscopic red-shift.
each with an exposure time of 300 s per image, ex-cept for the initial 5 images having exposure timeof 60 s, with approximately 54 s between exposures.AST3-2 detected AT2017gfo on 2017-08-18 with anaverage i-band magnitude of 17.23+0.22
−0.21, 17.61+0.16−0.16,
and 17.72+0.18−0.17 from coadded images. The uncertainties
of these measurements include the 0.088 mag errors ofthe zero-point calibration. The AST3-2 circular, Huet al. (2017a), reports g-band magnitudes, however,this must be corrected to the i-band magnitudes thatwe report here. Detections and upper limits estimatedin the following observations are presented in Figure 4and Table 2.
2.1.3 Zadko
The 1–m Zadko Telescope (Coward et al. 2010) is lo-cated just north of Perth in Western Australia. TheCCD imager has a pixel scale of 0.69 arcsec/pixel (bin-ning 1× 1) resulting in a field of view of 0.15 deg2 andreaches an approximate limiting magnitude of 21 in theR-band in 180 s.
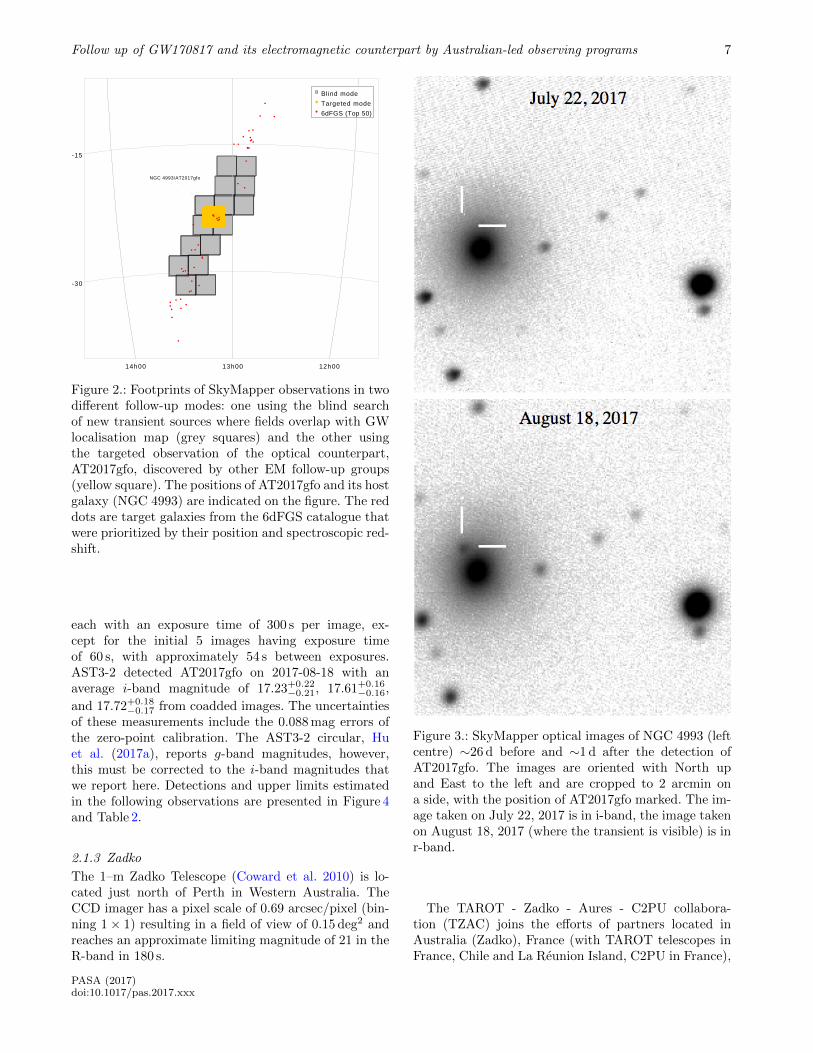
Figure 3.: SkyMapper optical images of NGC 4993 (leftcentre) ∼26 d before and ∼1 d after the detection ofAT2017gfo. The images are oriented with North upand East to the left and are cropped to 2 arcmin ona side, with the position of AT2017gfo marked. The im-age taken on July 22, 2017 is in i-band, the image takenon August 18, 2017 (where the transient is visible) is inr-band.
The TAROT - Zadko - Aures - C2PU collabora-tion (TZAC) joins the efforts of partners located inAustralia (Zadko), France (with TAROT telescopes inFrance, Chile and La Reunion Island, C2PU in France),
PASA (2017)doi:10.1017/pas.2017.xxx

8 Andreoni et al.
and Algeria (Aures Observatory, under construction).The initial position of GW 170817 was monitored usingthe TCH (TAROT-Chile) 25cm rapid robotic telescopeprior to Zadko imaging.
Zadko observations of AT2017gfo commenced on2017-08-19 10:57 and extended until 2017-08-26 11:43in the Clear (C) and r filters, with 120 s exposures and2× 2 binning. The object was observed for ∼1 hr at theonset of dusk each night, until its low elevation pre-cluded observations.
We stacked all images taken each night to increasethe signal to noise ratio under the assumption thatthe brightness of the object does not vary signifi-cantly during one hour. As AT2017gfo is located at10 arcsec from the nucleus of NGC 4993 (i.e. 7 pixels),the background varies steeply. For accurate photome-try, a galaxy reference image without AT2017gfo wassubtracted to retrieve a flat background. The refer-ence image was created from the stack of images takenon the last night (i.e., 9 nights after the the GWtrigger) when the source was no longer visible. Thephotometry was performed on the subtracted imagetaking the point spread function (PSF) of the starNOMAD-1 0666-0296321 (RA=197h28m44.96s, Dec=–2321′49.70′′ J2000.0,mR=15.580). Photometric resultsare presented in Coward et al. (2017), Figure 4, and Ta-ble 3.
2.1.4 University of Virgin Islands EtelmanObservatory
The Virgin Islands Robotic Telescope (VIRT) is a 0.5 mCassegrain telescope located the the Etelman Observa-tory in the U. S. Virgin Islands. The observations withVIRT presented in this paper were performed in associ-ation with the DWF program. VIRT is equipped with aMarconi 42-20 CCD imager that has a pixel scale of 0.5arcsec/pixel, a field of view of 0.11 deg2, and imaging inthe UBVRI and ND filters.
Observations of AT2017gfo commenced on 2017-08-19 23:19 in the R and Clear (C) filters. At approxi-mately 2017-08-19 23:54, a potential counterpart wasobserved in the C filter. Calculation of the precise sourcemagnitude is limited due to the galaxy contaminationin the observing band (Gendre et al. 2017). Additionalobservations were carried out on 2017-08-20 00:12 and2017-08-22 00:00 with the C filter, where a possible firstdetection of the source was made on 2017-08-20 mC =18.90 ±0.28 (Fig. 4). Inclement tropical weather (hur-ricane Irma, followed by hurricane Maria) delayed fullanalysis of the observations, however, the measurementsmade to date are listed in Table 4.
2.1.5 The Desert Fireball Network
The Desert Fireball Network (DFN, Day & Bland 2016)is a network of 50 remote cameras located in the West-ern and South Australian desert designed for the detec-
tion and triangulation of Fireballs and bright meteors.Each DFN camera consists of a Nikon D800E cameraequipped with a Samyang 8mm f/3.5 UMC Fish-eye CSII lens. The cameras capture full sky images with a ca-dence of 30 s from sunset to sunrise every night of theyear.
Observations from Wooleen Station are availablefrom two minutes before the GW170817 trigger and,as as result, DFN is the only optical facility imagingthe source during the GW detection. Between 12:39:28and 12:49:28, the host galaxy was observed at an el-evation of 20 deg. Initial analysis of the images findsno persistent or transient sources in a 3 deg radius ofNGC 4993, to a limiting magnitude of magv=4 (Han-cock et al. 2017). Further calibration and analysis havebrought this limiting magnitude down to magv=6.
2.1.6 ESO VLT/NACO mid-IR
The ESO Very Large Telescope (VLT) consists of four8.2-m telescopes located at the Paranal Observatoryin Chile. Observations were made with the NACO in-strument (Lenzen et al. 2003; Rousset et al. 2003) onthe VLT UT1 Antu telescope. The system allows foradaptive-optics and natural seeing imaging over J, H,Ks, L′, and M′ filters, as well as providing Wollastonpolarimetry and coronography in L′. The 5σ limitingmagnitudes are given as J=24.05, H=24.05, Ks=23.35,L′=18.55, and M′=15.15 in 1 hr. These observationswere initially proposed as Director’s Discretionary Time(PI Cooke, Baade) as part of the DWF program tobe made immediately available to the LVC community.However, the observations were finalised and executedby ESO, and made available to the LVC community.
Observations in the L′-band (3.8µm) were attemptedon each night between 2017-08-24 and 2017-09-04.Due to the proximity to the Sun and scheduling con-straints, the target was observed during twilight (at UT22:45–23:20) at airmass 1.5–1.6. Weather and inaccu-rate pointing during the first nights resulted in the datafrom the four nights of August 25, 26, 27, and Septem-ber 1 being analysed. A pixel scale of 27 mas pix−1 wasused for a total field of view of 27×27 arcsec. Observa-tions were made in natural seeing mode with integra-tion times 126×0.2 s per jitter point (with a 3 arcsecthrow per axis), for a total of 15 min, 19 min, 14 min,and 11 min per night. HD 205772 was observed as a fluxstandard on August 28. The data were reduced by a cus-tom script in a standard way, correcting for sky varianceby combining the jittered observations and de-stripingby median filtering each detector quadrant separately.
No sources apart from the NGC 4993 nucleus weredetected in the field (Figure 5). The detection limitswere estimated from the background noise assuminga conservative point-spread function corresponding tothe detected galactic nucleus at approximately 0.5 arc-sec FWHM, using a circular aperture of 1 arcsec (40
PASA (2017)doi:10.1017/pas.2017.xxx

Follow up of GW170817 and its electromagnetic counterpart by Australian-led observing programs 9
0 1 2 3 4 5 6 7Days since LIGO trigger
17
18
19
20
21
AB m
ag
LIGO
trig
ger
AAT
spec
trum
SALT
spe
ctru
m
SALT
spe
ctru
m
ANU2
.3m
spe
ctru
m
ANU2
.3m
spe
ctru
m
ANU2
.3m
spe
ctru
m
ANU2
.3m
spe
ctru
m
Zadko (r)AST3-2 (i)SkyMapper (i)SkyMapper (r)SkyMapper (g)Etelman/VIRT (Clear)
Figure 4.: Optical light curve of AT2017gfo for the first week after the GW detection obtained with the AST3-2, SkyMapper (SM), Zadko, and Etelman/VIRT telescopes. Down-arrows indicate upper limits. Note that theevolution at bluer bands is faster than the evolution at redder bands. Dashed vertical lines indicate epochs whenspectroscopy was acquired. Spectra analysed in this work and presented in Figure 7 and Figure 8 are indicated inblack, whereas spectra marked in grey are to be analysed at a later time.
pix) radius. For the nights of August 25, 26, 27, andSeptember 1, the 5σ detection limits in L′ are 14.5,14.8, 14.5, and 14.3 mag, respectively, with a combinedlimit of 15.3 mag.
2.1.7 ESO VLT/VISIR mid-IR
Imaging observations in the mid-IR were also made withthe VISIR instrument (Lagage et al. 2004) on the ESOVLT UT3 Melipal telescope. Similar to NACO above,the observations were executed by ESO and made avail-able to the LVC community. VISIR provides an imagingfield of view of 38′′ × 38′′ with a plate scale of 0.045′′ perpixel. AT2017gfo was observed on 2017 August 23, 2017August 31, September 1, 2017, and 2017 September 6,2017 with the J8.9 filter (central wavelength 8.72µm).Total on-source integration times were 44.8, 17.5, 12.2,and 44.8 minutes, respectively. Chopping and noddingin perpendicular directions with 8′′ amplitudes wereused to remove the sky and telescope thermal back-ground. No source was detected to a limiting mag ofJ8.9 ∼7–8 (Table 5). Details of the observations can befound in Kasliwal et al. (2017).
2.2 Optical/Near-Infrared Spectroscopy
Observations of AT2017gfo and the galaxy NGC 4993were taken in the optical via longslit, fibre, and integralfield unit (IFU) spectroscopic modes. Both Australianand Australian partner observational programs partici-pated in the spectroscopic follow up of AT2017gfo. De-tails of the instruments and observations are providedbelow.
2.2.1 ANU2.3/WiFeS
The Australian National University (ANU) 2.3-m tele-scope is located at Siding Spring Observatory inNew South Wales, Australia. It includes the dual-beam, image-slicing, integral-field echelle spectrograph(WiFeS, Dopita et al. 2007) which can simultaneouslyobserve spectra over a 25′′×38′′ field of view. WiFeS hasa spectral range extending from 3300 to 9800 A, whichcan be observed either in a single exposure with a reso-lution of R = 3000, or in two exposures with R = 7000,depending on the choice of low- or high-resolution grat-ing configurations, respectively. The observations weredone using Director’s Discretionary Time.
Spectroscopic observations began on 2017-08-18 at09:24:25 and 09:40:25 with a wavelength range of 3200–
PASA (2017)doi:10.1017/pas.2017.xxx
10 Andreoni et al.
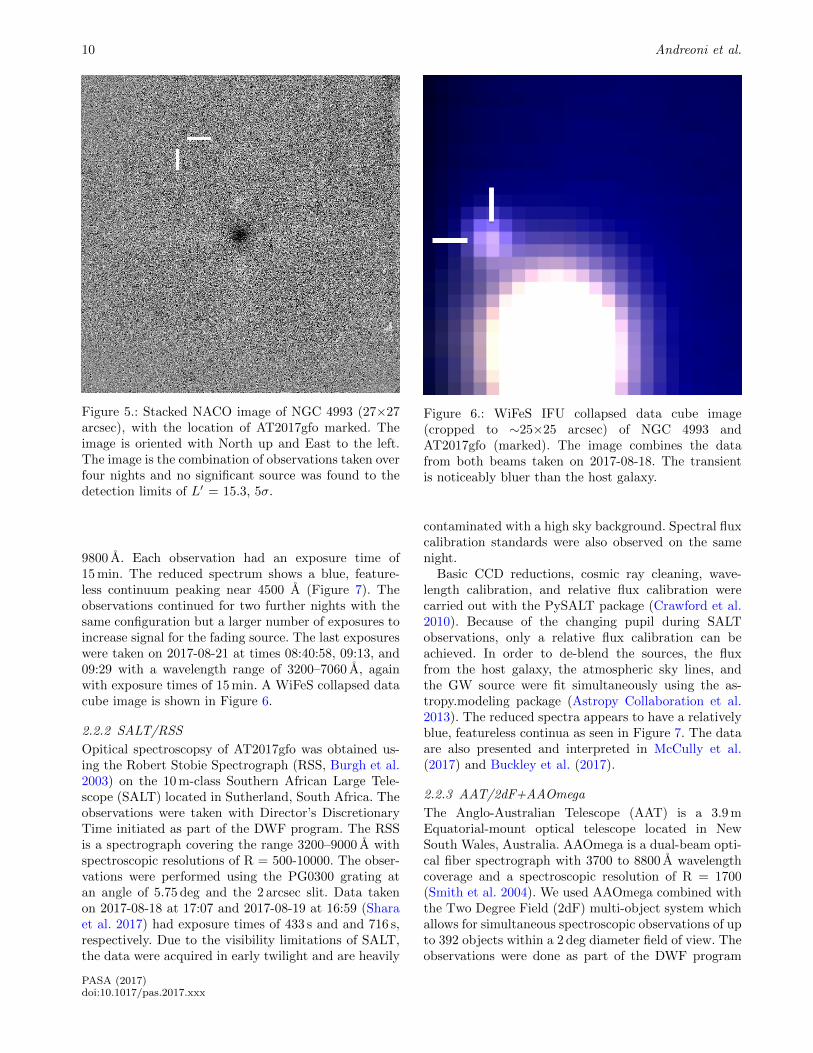
Figure 5.: Stacked NACO image of NGC 4993 (27×27arcsec), with the location of AT2017gfo marked. Theimage is oriented with North up and East to the left.The image is the combination of observations taken overfour nights and no significant source was found to thedetection limits of L′ = 15.3, 5σ.
9800 A. Each observation had an exposure time of15 min. The reduced spectrum shows a blue, feature-less continuum peaking near 4500 A (Figure 7). Theobservations continued for two further nights with thesame configuration but a larger number of exposures toincrease signal for the fading source. The last exposureswere taken on 2017-08-21 at times 08:40:58, 09:13, and09:29 with a wavelength range of 3200–7060 A, againwith exposure times of 15 min. A WiFeS collapsed datacube image is shown in Figure 6.
2.2.2 SALT/RSS
Opitical spectroscopsy of AT2017gfo was obtained us-ing the Robert Stobie Spectrograph (RSS, Burgh et al.2003) on the 10 m-class Southern African Large Tele-scope (SALT) located in Sutherland, South Africa. Theobservations were taken with Director’s DiscretionaryTime initiated as part of the DWF program. The RSSis a spectrograph covering the range 3200–9000 A withspectroscopic resolutions of R = 500-10000. The obser-vations were performed using the PG0300 grating atan angle of 5.75 deg and the 2 arcsec slit. Data takenon 2017-08-18 at 17:07 and 2017-08-19 at 16:59 (Sharaet al. 2017) had exposure times of 433 s and and 716 s,respectively. Due to the visibility limitations of SALT,the data were acquired in early twilight and are heavily
Figure 6.: WiFeS IFU collapsed data cube image(cropped to ∼25×25 arcsec) of NGC 4993 andAT2017gfo (marked). The image combines the datafrom both beams taken on 2017-08-18. The transientis noticeably bluer than the host galaxy.
contaminated with a high sky background. Spectral fluxcalibration standards were also observed on the samenight.
Basic CCD reductions, cosmic ray cleaning, wave-length calibration, and relative flux calibration werecarried out with the PySALT package (Crawford et al.2010). Because of the changing pupil during SALTobservations, only a relative flux calibration can beachieved. In order to de-blend the sources, the fluxfrom the host galaxy, the atmospheric sky lines, andthe GW source were fit simultaneously using the as-tropy.modeling package (Astropy Collaboration et al.2013). The reduced spectra appears to have a relativelyblue, featureless continua as seen in Figure 7. The dataare also presented and interpreted in McCully et al.(2017) and Buckley et al. (2017).
2.2.3 AAT/2dF+AAOmega
The Anglo-Australian Telescope (AAT) is a 3.9 mEquatorial-mount optical telescope located in NewSouth Wales, Australia. AAOmega is a dual-beam opti-cal fiber spectrograph with 3700 to 8800 A wavelengthcoverage and a spectroscopic resolution of R = 1700(Smith et al. 2004). We used AAOmega combined withthe Two Degree Field (2dF) multi-object system whichallows for simultaneous spectroscopic observations of upto 392 objects within a 2 deg diameter field of view. Theobservations were done as part of the DWF program
PASA (2017)doi:10.1017/pas.2017.xxx

Follow up of GW170817 and its electromagnetic counterpart by Australian-led observing programs 11
Figure 7.: The rapid spectral evolution of AT2017gfo. The ANU 2.3m WiFeS, SALT RSS (2 spectra), and AATAAOmega+2dF spectra obtained at 0.93 d, 1.18 d, 2.16 d, and 6.92 d, respectively, after GW detection are shownand labelled. Vertical grey bands denote telluric features that are not well removed in some spectra. Blackbodymodel fits (red curves) over the full spectra result in temperatures of 6275 K (WiFeS), 6475 K and 4700 K (RSS),and 2080 K (AAOmega). Peaks in the WiFeS, RSS, and AAOmega continua correspond to ∼6400 K, ∼5600 K,∼4400 K, and < 3200 K, respectively.
and granted via Director’s Discretionary Time while ac-tivating the newly commissioned AAT 2dF Target OfOpportunity (ToO) mode. Fully configuring all 392 fi-bres takes ∼40 minutes and is too long for rapid follow-up of short-lived transient phenomena. In rapid ToOmode, the 2dF software determines, from an existing fi-bre configuration, which fibres need to move to place asingle fibre on the target and one on a guide star. Thiscapability enables configuration and observation withina few minutes and, in the case of AT2017gfo, 5 minutesbetween ToO activation and the commencement of theobservations.
AT2017gfo observations began on 2017-08-24 at08:55:07 to 09:41:28 with exposure times of 600 s each.The data were processed using the OzDES pipeline
(Childress et al. 2017). Four exposures were analyzed,revealing an E/S0-like galaxy spectrum (Figure 8) witha weak red flux enhancement (Andreoni et al. 2017b).The source was isolated by subtracting the host galaxyusing the SALT host galaxy spectrum (McCully et al.2017) extracted from the region of the galaxy near thesource. The SALT spectrum was cleaned over chip gapsand telluric line regions using the average value on ei-ther edge of each feature. Finally, the SALT host andAAT AAOmega host+event spectra were scaled andsubtracted (Figure 7). Subtracting two spectra withrelative flux calibrations introduces uncertainties in thescalar offset. Such subtractions do not significantly af-fect the form of the residual spectrum, but can providea small affect on blackbody model fit results. Although
PASA (2017)doi:10.1017/pas.2017.xxx

12 Andreoni et al.
care was taken in the subtraction process, the two spec-tra introduce possible flux calibration differences fromthe different instruments and extraction techniques. Asa result, we stress that the spectrum presented here ismeant to be indicative of the behaviour and tempera-ture of the event at 6.92 d, and suffers from the abovecaveats. A proper host galaxy subtraction with the AATAAOmega+2dF is planned when NGC 4993 becomesvisible.
2.3 Radio
Five Australian and international radio facilities par-ticipated in this follow up campaign. In this section wedescribe the role of each radio observatory that per-formed the follow up of GW170817 and/or AT2017gfounder Australian-led observing programs.
2.3.1 ATCA
The Australia Telescope Compact Array (ATCA) islocated at the Paul Wild Observatory in New SouthWales, Australia. It is an array of six 22 m radio anten-nas, which can be configured with antenna spacings upto 6 km. The array can observe in one of 5 observingbands spread between 1.1 and 105 GHz.
We carried out ATCA observations on August 18,21, 28, and September 5, 2017 under a target of op-portunity program (CX391; PI: T. Murphy). Duringthe August observations, we targeted 53 galaxies iden-tified to be located within the 90% containment volumeof GW170817 (Bannister et al. 2017b,c). The Septem-ber 5 observation targeted only the optical counter-part, AT2017gfo and its host galaxy NGC 4993. Table 8presents a summary of the observations.
The August observations used two 2 GHz frequencybands with central frequencies of 8.5 and 10.5 GHz andobserved NGC 4993 using two frequency bands centeredon 16 and 21 GHz on August 18, For the September ob-servations we centered these two frequency bands on 5.5and 9.0 GHz. The configuration of the ATCA changedover the course of the observations, with ATCA in theEW352 configuration for the August 18 observation andin the 1.5A configuration for all other observations.
For all epochs and all frequencies, the flux scale wasdetermined using the ATCA primary calibrator PKSB1934-638. The bandpass response at 8.5 and 10.5 GHzwas determined using PKS B1934-638 and observationsof QSO B1245-197 were used to calibrate the complexgains. We used QSO B1921-293 to solve for the band-pass at 16.7 and 21.2 GHz and observations of QSOB1256-220 were used to solve for the complex gains atthese frequencies. All of the visibility data were reducedusing the standard routines in the miriad environment(Sault et al. 1995).
We used the miriad tasks invert, clean, andrestor to invert and clean the calibrated visibility data
from the August observations of the 53 targeted galax-ies. We fit a single Gaussian to each of the 53 galaxiesdetected in our August observing epochs (Lynch et al.LVC GCN 21628, Lynch et al. LVC GCN 21629). Com-paring these observations, we find no transient emissionabove a 3σ limit between 36 - 640µJy. The measuredflux densities for host galaxy NGC 4993 are listed in Ta-ble 9. The results from our observations of AT2017gfoare described in Hallinan et al. (2017), including a de-tection on September 5 at 7.25 GHz, with measured fluxdensity of 25±6µJy (Murphy et al. 2017).
2.3.2 ASKAP
The Australian Square Kilometre Array Pathfinder(ASKAP) is a system of thirty six 12 m phased-arrayfeed receiver radio telescopes located in Western Aus-tralia. The instrument covers a frequency range of 0.7 to1.8 GHz with a bandwidth of 300 MHz. The field of viewof is 30 deg2 at 1.4 GHz, with a resolution of ∼30 arcsec.
ASKAP performed imaging observations on 2017-08-19 05:34:32 (LVC GCN 21513) with 12 of the 36 anten-nas5. The 90% LVC contour region (The LIGO Scien-tific Collaboration and the Virgo Collaboration 2017d)was covered with 3 pointings using an automated algo-rithm (Dobie et al. 2017) observed over the following 4days. We place an upper limit of ∼1 mJy on emissionfrom AT2017gfo and its host galaxy NGC4993.
At the time of publication, 14 further single-beam ob-servations of the AT2017gfo location were carried outwith varying numbers of beams and antennas at dif-ferent frequencies and bandwidths (subject to commis-sioning constraints). These observations are undergoingprocessing, while further observations are ongoing.
ASKAP also searched the 90% LVC uncertaintyregion at high time resolution for fast radio bursts(FRBs Lorimer et al. 2007) using the search algo-rithms described in Sec. 2.3.5 to cover a dispersionmeasure range of 0–2000 pc cm−3. The observationswere in ‘fly’s-eye’ mode with 7 antennas at a cen-tral frequency of 1320 MHz (Bannister et al. 2017a).Observation times were 2017-08-18 04:05, 2017-08-1808:57, and 2017-08-19 02:08, for a total duration of3.6, 4.1, and 11.0 hrs, respectively. Above a flux densitythreshold of ∼40 Jy/
√w, there were no FRB detections
(GCN21671), where w is the observed width of the FRBin milliseconds.
2.3.3 MWA
The Murchison Widefield Array (MWA) is a system of2048 dual-polarization dipole antennas organized into128 tiles of 4×4 antennas located in Western Australia.MWA operates between 80 and 300 MHz (Tingay et al.2013) and has a resolution of several arcmin. Oper-ations with the original array (baselines up to 3 km)
5As a result of ongoing commissioning
PASA (2017)doi:10.1017/pas.2017.xxx
Follow up of GW170817 and its electromagnetic counterpart by Australian-led observing programs 13
with a compact configuration with maximum redun-dancy ceased in 2016. The reduced baseline was useduntil mid-2017 at which point tiles with extended base-lines up to 5 km were installed for MWA Phase II.
The telescope responded automatically to the LVCGCN (Kaplan et al. 2015) but the initial LVC noticeonly included information from a single detector, sothe telescope pointing was not useful. Later we man-ually pointed the telescope and began observations on2017-08-18 at 07:07 with only 40 tiles in a hybrid arraywith elements of the maximally redundant array and theoriginal array. Observations occurred daily from 2017-08-18 to 2017-08-22 with 75× 2 min exposures and thencontinued weekly. The observations cover a 400 deg2
field of view at a central frequency of 185 MHz anda bandwidth of 30 MHz (Kaplan et al. 2017b). Wesee no emission at the position of NGC 4993 witha flux density limit of 51 mJy/beam (3σ confidence)from the data taken on August 18, 2017 (Kaplan et al.2017c). Later observations with more functioning tilesand longer baselines should have considerably improvedperformance. Kaplan et al. (2016) discuss in detail thestrategies to use MWA for finding prompt radio coun-terparts to GW events.
2.3.4 VLBA
The Very Long Baseline Array (VLBA) is a radio inter-ferometer consisting of ten 25 m radio telescopes spreadacross the United States, and is capable of observing inone of 10 bands at frequencies between 1.2 and 96 GHz.
The counterpart AT2017gfo and its host galaxy NGC4993 were observed on three occasions under the Direc-tor’s Discretionary Time project BD218, each with 6.5hour duration. The observations were performed from2017-08-18 19:58 to 2017-08-19 01:34, 2017-08-20 18:31to 2017-08-21 01:13, and 017-08-21 18:26 to 2017-08-2201:09. The central observing frequency was 8.7 GHz,with a bandwidth of 256 MHz and dual polarisation.The source VCS1 J1258-2219, with a position uncer-tainty of 0.2 mas, was used as a primary phase referencecalibrator, with NVSS J131248-235046 as a secondarycalibrator. An observing failure rendered the first epochunusable, but the second and third epochs providedgood data.
No source was detected within 0.5 arcsec of the po-sition of AT2017gfo, consistent with the findings ofboth the VLA and ATCA instruments (e.g., Bannis-ter et al. 2017c; Kaplan et al. 2017a; Lynch et al. 2017).However, we are able to provide 5.5σ upper limits of125µJy/beam and 120µJy/beam at August 20, 201721:36 and August 21, 2017 21:36, respectively, whilestacking the two images produces an upper limit of88µJy/beam (Deller et al. 2017a,b).
Imaging the core region of NGC 4993 identifies asub-mJy radio source at the centre with coordinatesRA=13h09m47.69398s Dec=–2323′02.3195′′ (J2000).
The detection is consistent with either an unresolvedsource or a marginally-resolved source on a scale smallerthan the VLBA synthesized beam (2.5×1.0 mas). Thesystematic uncertainties of our position are ≤ 1 mas inboth RA and DEC. We find a 9σ flux density of 0.22mJy, and the a priori amplitude calibration availableto the VLBA is accurate to the 20% level. If we assumethe synthesized beam size of 2.5×1.0 mas to representa conservative upper limit on the size of the source,we infer a lower limit for the brightness temperature of1.6×106 K. An initial interpretation suggests the recov-ered brightness temperature is consistent with an AGN(Deller et al. 2017c). Comparison of the flux densitiesestimated by ATCA and VLA (see Table 9 and Halli-nan et al. 2017) to the VLBA value indicates that aconsiderable amount (∼50%) of the total source flux iscontained within this mas scale component.
2.3.5 Parkes
The Parkes Radio Telescope (Parkes) is a 64-m tele-scope located in Parkes, New South Wales, Australia.Parkes operated in FRB search mode with the Multi-beam receiver (Staveley-Smith et al. 1996) and theBPSR backend (Keith et al. 2010). The usable band-width is 340 MHz, in the range of 1182–1582 MHz. Ifthe neutron star merger produced a massive (> 2M)neutron star instead of a black hole, it would be ex-pected to possess a spin period close to the break-upvelocity of ∼1 ms and potentially a large magnetic fieldgenerated during its formation. Such objects (millisec-ond magnetars) are a potential source of FRBs or pos-sibly even repeating FRBs (Spitler et al. 2016; Metzgeret al. 2017). The FRB should be detectable at S/N >100 with Parkes at the distance of NGC 4993, if appro-priately beamed and not hidden by the ejecta from themerger.
A dedicated search for FRBs (Keane et al. 2017) withdispersion measures ranging from 0–2000 pc cm−3 as-sociated with AT2017gfo was performed on 2017-08-18at 06:49:31 and 08:50:36 with 2-hr and 1-hr integrationtimes, respectively, and again on 2017-08-20 at 01:44:32and 02:50:14 with 1-hr integration times (Bailes et al.2017a,b). No FRBs were detected with a 7σ limitingflux density of 1.4 sqrt(w/0.064) Jy sqrt(ms), where wis the observed pulse width of the FRB in ms.
3 ANALYSIS
The observations presented here identified the opticaltransient on multiple epochs for the first ∼7 days af-ter the LIGO trigger. In Figure 4 we present the themulti-band photometric light curve of AT2017gfo, ob-served in g-band (SkyMapper), r-band (SkyMapper,Zadko, Etelman/VIRT), and i-band (AST3-2, SkyMap-per). The multi-band measurements indicate a decayfaster in g-band than in the r- and i-bands. We pro-
PASA (2017)doi:10.1017/pas.2017.xxx

14 Andreoni et al.
cessed and analysed four optical spectra acquired withANU2.3m/WiFeS, SALT/RSS, AAT/2dF+AAOmega.The subtraction of the host galaxy allows the signa-ture of the transient to be identified and the spectralevolution to be assessed (Figure 7). In this section, wereview the spectral evolution of AT2017gfo, describe theproperties of the host galaxy NGC 4993, and assess thephotometric evolution of the event compared to sGRBand kilonova models.
3.1 Spectral evolution of AT2017gfo
The ANU 2.3m (WiFeS), SALT (RSS), and AAT(AAOmega+2dF) spectra reveal a rapid evolution ofthe transient over ∼7 d while maintaining relatively fea-tureless continua. As a coarse measure of the evolvingspectral energy distribution, we fit a blackbody modelto the spectra (Figure 7). Continuum blackbody tem-peratures were calculated by fitting the observed spec-tra using the python scipy package implementationof the non-linear least-squares Levenberg-Marquadt al-gorithm. Spectra are corrected to rest-frame and forMilky Way line-of-sight extinction using the Cardelliet al. (1989) prescription and adopting RV = 3.1 andE(B − V ) = 0.12 and based on the dust maps ofSchlegel, Finkbeiner, & Davis (1998).
The model fits result in a temperature evolutionfrom ∼6400 K to ∼2100 K in ∼7 d. The WiFeS spec-trum is reasonably well fit by a ∼6300 K black-body, with the peak in the spectrum continuum cor-responding to ∼6400 K. The curvature of the SALTspectrum is not well fit by a blackbody model, withthe model fit producing a temperature of ∼6500 K,whereas the peak in the spectrum roughly correspondsto ∼5600 K. The second SALT spectrum, taken at+2.16 d, is reasonably well fit, producing a blackbodymodel fit of ∼4700 K, while the continuum peak cor-responds to roughly 4400 K. By day ∼7 the source isquite faint and host galaxy subtraction is less reliable.The AAOmega+2dF spectrum at +6.92 d is best fit bya blackbody model at ∼2080 K, but has the caveatsstated in Section 2.2.3.
3.2 The host galaxy
The AAT/2dF+AAOmega spectrum (Figure 8, An-dreoni et al. 2017b) was acquired 6.92 days after theLIGO trigger. The fibre was centred on the transientposition, but the spectrum is dominated by the light ofthe host galaxy. Figure 7 shows the galaxy-subtractedtransient spectrum from the same observation.
We use pPXF (Cappellari 2017) to fit the spectrumto 7300A (the extent of the MILES spectral templatelibrary) to estimate the metallicity, age, r-band mass-to-light ratio and velocity dispersion of stars in the re-gion immediately surrounding AT2017gfo. At the red-
shift of the host galaxy, the 2 arcsec diameter of a 2dFfibre corresponds to a linear size of 400 parsec. Assum-ing a spectral resolution of 4.5 A (measured using nightsky lines), the pPXF fit yields a velocity dispersion of100 km sec−1, a stellar age of 10 billion years, a metallic-ity of [M/H] = −0.2, and an r-band mass-to-light ratioof 4. Evidence for Hα emission in the pPXF fit is veryweak, measured at EW = −0.2 A, but is consistent withzero. The environment in the location of the transientis consistent with an old, passively evolving stellar pop-ulation with no on-going star formation.
The above assessment of NGC 4993 in the regionof the source is consistent with the report of Sadleret al. (2017) for the central 6 arcsec region of the galaxybased on spectroscopy from the 6dFGS (Jones et al.2009). The central stellar velocity dispersion of 163km/s (Ogando et al. 2008) predicts a central black holemass of MBH = 107.7 M (Yu et al. 2017), which can becompared against estimates based on the radio proper-ties of the central source. The compact radio emissiondetected by VLBA in the central region of NGC 4993with a brightness temperature exceeding 106 K indi-cates the presence of a low luminosity active galacticnucleus (LLAGN), allowing us to estimate the blackhole mass using the fundamental plane of black hole ac-tivity (e.g. Plotkin et al. 2012; Merloni et al. 2003; Fal-cke et al. 2004). The VLBA flux density was measuredto be 0.22± 0.04 mJy at 8.7 GHz, which (assuming aflat spectral index) gives a 5 GHz radio luminosity of(2.1± 0.04)× 1036 erg s−1, while the X–ray luminosityas measured by SWIFT is 5.6+2.4
−1.9 × 1039 erg/s (Evanset al. 2017). The radio spectral index is consistent withbeing flat or slightly negative (as can be seen from theATCA results shown in Table 9); the results are insen-sitive to small variations in this parameter. Using therelationship described in Plotkin et al. (2012), we obtaina predicted central black hole mass of 107.8±0.3 M, ingood agreement with the velocity dispersion estimate.
(Sadler et al. 2017) also state that the nuclear dustlanes evident in the HST ACS images (Foley et al. 2017;Pan et al. 2017) may be the product of a galaxy-galaxymerger that occurred as long as several Gyr ago. Wenote that a wet galaxy merger (to produce the visibledust) implies that the binary progenitor of AT2017gfomight have originated in the merging galaxy and notnecessarily in the main early-type host. Such an origincould permit a shorter binary neutron star inspiral timethan would be plausible for a massive galaxy with no re-cent star formation. Previous sGRB hosts with possiblekilonovae are often low-mass, blue star forming galax-ies (Tanvir et al. 2013; Fong & Berger 2013), though20–40% of sGRBs occur in early-type galaxies (Fonget al. 2013). The diversity of possible host galaxies forneutron star merger events therefore needs to be keptin mind when searching for the counterparts of futureGW events.
PASA (2017)doi:10.1017/pas.2017.xxx

Follow up of GW170817 and its electromagnetic counterpart by Australian-led observing programs 15
Figure 8.: AAT fibre spectrum of NGC 4993 in a 2 arcsec region at the position of AT2017gfo. A fit to the stellarlight (blue) and the stellar light and nebular emission (red) are shown. The fits include the flux of AT2017gfo (at+6.92 d) and the galaxy. Several common atomic transitions are marked and a zoom-in of the H-α region is shown.The spectrum is corrected for line-of-sight Milky Way extinction.
3.3 Comparison with GRB afterglow andkilonova models
The optical data we acquired, alone, can give insighton the nature of the transient event. First, we explorethe GRB afterglow scenario in order to test the possi-bility that AT2017gfo behaves as a “standard” on-axisGRB in the optical, specifically using the Granot et al.(1999) and Granot & Sari (2002) models. Secondly, weinvestigate the kilonova scenario by comparing the datawe acquired with three possible models (Tanaka & Ho-tokezaka 2013; Hotokezaka et al. 2013; Barnes & Kasen2013; Metzger et al. 2015). In Figure 9 we overlay theresults we obtain to our data.
3.3.1 GRB afterglow
We investigate the GRB afterglow scenario using theGranot & Sari (Granot et al. 1999; Granot & Sari 2002,G02) formulation for a relativistic blast wave in an ISMenvironment. Far from the sites of the break frequen-cies of the GS02 spectra, each power law segment be-comes asymptotic. In particular, we can assume thatthe frequency of our optical observations, νopt, relatesto other characteristic frequencies as νsa < νm < νopt <νc, where νsa is the self-absorption frequency, νm is theminimal electron synchrotron (or peak) frequency, andνc is the frequency at which an electron cools over the
dynamical time span of the system. In this region of thespectrum we can approximate the spectral flux densityas Fν ∝ tα. Simultaneous X–ray or radio measurementswould help to constrain the locations of the break fre-quencies of the spectrum.
We calculate the index α by χ2 minimization ofthe Zadko telescope r-band data points and we findα = −1.73± 0.10, in addition we derive an electronpower law index p = 1 + 4
3α (G02) to determine p =3.31± 0.13. This value is higher than historical sGRBS(see Fong et al. 2015, for a decadal review), where themedian value of p is found to be 〈p〉 = 2.43+0.36
−0.28. In aclassical sGRB scenario, our calculated p could be inter-preted as (i) emission is not a spherically isotropic blastwave (Sari et al. 1999) giving a larger temporal decayslope than historical sGRBs (Fong et al. 2015) or (ii)evidence that the jet itself may be structured (Salafiaet al. 2015).
We use the isotropic gamma-ray energy measuredwith Fermi 〈Eγ,iso〉 ≈ (3.0± 0.6)× 1046 erg (Goldsteinet al. 2017b) to constrain our parameter space, as-suming that Eγ,iso ≈ EK,iso (Frail et al. 2001). In thisway, we find an unrealistically high circumburst numberdensity n ∼ 1013 cm−3. Placing these values back intothe GS02 models produces the solid black lightcurveas shown in Figure 9. The extremely high circumburst
PASA (2017)doi:10.1017/pas.2017.xxx

16 Andreoni et al.
number density and the poor match with our observedoptical data rule out the optical emission being theafterglow of a “standard” on-axis sGRB. This conclu-sion supports the idea that GRB 170817A was detectedoff-axis, as suggested by the Fermi detection of a sub-luminous GRB (Goldstein et al. 2017b) and the lackof any prompt X–ray afterglow detection (Cenko et al.2017).
3.3.2 Kilonova models
We compare our data with three standard models de-scribing inherent kilonova emission. In particular, weconsider the case of r-processes in the ejecta from bi-nary neutron stars mergers in the “TH13” formulation(Tanaka & Hotokezaka 2013; Hotokezaka et al. 2013) fora range of NS equations of state, the (“B&K13” model,Barnes & Kasen 2013), and free neutron-powered blueprecursor to the kilonova emission (“M15”, Metzgeret al. 2015). We plot the expected gri-bands light curvesfor all these models in Figure 9.TH13 model: We calculate the expected light curves
using the TH13 kilonova gri-bands light curves for asource located at DL=40 Mpc and for a variety of NSequations of state, specifically APR4-1215, H4-1215,Sly-135, APR4-1314, H4-1314. We calculate the lightcurves for polar view angles, where the magnitudesare K-corrected in the rest frame using a standardΛCDM cosmology with H0=70 km/s/Mpc, Ωm=0.3,and ΩΛ=0.7 (Hotokezaka et al. 2013). The results liewithin the solid orange regions in Figure 9 and showa fainter emission than we observed. The results are tobe expected, as the spectra (Figure 7) are characteristicof a blue transient - at least in the first few days afterthe merger - while the TH13 model predicts a transientpeaking at near-IR wavelengths. The “mismatch” be-tween our measurements and the TH13 models reducesat late times and at redder bands (from g to i), butonly a longer monitoring of the source could indicatewhether the transient can be dominated by r-processesat late times.BK13 model: In the BK13 model, the ejecta have
an opacity similar to r-process material, made up ofheavier lanthanide-group elements generated from dy-namical ejection, and material made up of 56Ni whichis ejected via disk winds. These cases predict an emis-sion peaking in the near-IR and optical, respectively(Barnes & Kasen 2013). We show the results for theemission expected from 56Ni in Figure 9 as a dashedgrey line. At late times (t ≈ 6 days), we find an upperlimit magnitude consistent with this model.M15 precursor model: The photometry and spec-
troscopy acquired here show a high optical luminos-ity and hot, blue continua during the first ∼1 d (seeSec. 3.1). Therefore, we explore the M15 model that pre-dicts an energetic blue precursor. This model is basedon the idea that a small fraction (i.e. Mn ∼ 10−4M
(Metzger 2017)) of the ejected mass in the outer shell israpidly expanded after shock heating during the merger.Thus, the neutrons in the outer shell avoid capture bythe nuclei in the dense inner ejecta during the r-process.The unbound neutrons are then subject to β-decaywhich gives rise to a precursor to the kilonova which, atthe distance to AT2017gfo, would peak at magr ∼ 17.5after a few hours, and consistent with the photome-try. The peak luminosity of the neutron layer can be
approximated by Lpeak ∝( vej
0.1c
) ( Mej
10−2M
)1/3
(Metzger
2017). We overlay the gri-bands plots to our data in Fig-ure 9 for lanthanide-free ejecta and for two sets of val-ues for the velocity and mass of the ejecta (vej = 0.2c,Mej = 0.01M; and vej = 0.2c, Mej = 0.1M).
The M15 model seems to match our observations witha greater accuracy than the TH13 and BK13 models inthe first ∼2 d after the merger. However, this modelalone predicts a steeper decay of the light curve thanthe observations. The SkyMapper g-band upper limitsplace a mild constraint in favor of a scenario with onlyan M13-type precursor. Nevertheless, the combinationof the M15 and BK13 models, represented with blackdashed lines in Figure 9, is a better match to our dataand, particularly, for the r-band measurements shownin the central panel.
4 DISCUSSION
The first detection of the EM counterpart to a GWevent is a milestone in the history of modern astronomy.Australian teams contributed to both the search and thefollow up of the transient AT2017gfo, the EM counter-part to GW170817. In this paper we present the obser-vations, follow-up strategies, and data acquired by 14radio, infrared, and optical facilities led by Australianobserving programs.
It is interesting to discuss the progenitor of this event.Our own galaxy contains at least 7 binary neutron starpairs that will coalesce in less than a Hubble time, see(Ozel & Freire 2016). For some, like the double pulsarPSR J0737-3039A/B (Burgay et al. 2003) the “remain-ing time” before merger is short (∼80 Myr) whereas forothers, like PSR B1534+12 the (remaining) coalescencetime is 2.7 Gyr (Arzoumanian et al. 1999). The latterwould appear to be a more likely progenitor for thisevent as it could have formed when the last episode ofstar formation in NGC 4993 was still underway. It willbe fascinating to see how many binary star mergers areultimately observed in active star-forming galaxies from“ultra-relativistic” progenitors with short lifetimes com-pared to those from wider systems like PSR B1534+12.
The location in NGC 4993 is also of some interest. At40 Mpc, the projected distance of AT2017gfo from thecentre is 2.2 kpc. Such a displacement could be achieved
PASA (2017)doi:10.1017/pas.2017.xxx

Follow up of GW170817 and its electromagnetic counterpart by Australian-led observing programs 17
100 101
16
17
18
19
20
21
22
23
24
AB
mag
g-band
100 101
16
17
18
19
20
21
22
23
24
AB
mag
r-band
100 101
Days since LIGO trigger
16
17
18
19
20
21
22
23
24
AB
mag
i-band
Figure 9.: Comparison of models to optical photometry with Zadko (squares, r-band), AST3-2 (diamonds, i-band),Etelman/VIRT (triangles, C-filter presented in the central panel), and SkyMapper (circles, gri-bands). The solidblack line is the GS02 model of a short GRB afterglow. The dark orange region represents the kilonova model byTanaka & Hotokezaka (2013). The red solid line represents the Barnes & Kasen (2013) model for 56Ni+r-processopacities. The blue lines represent the free neutron-powered blue precursor (solid: vej = 0.2c, Mej = 0.01M;dashed: vej = 0.2c, Mej = 0.1M Metzger et al. 2015), while the black dashed and dot-dashed lines representthe Metzger et al. (2015) and Barnes & Kasen (2013) models together. The figure is organised in three panels,presenting photometry and overlaid models in g-band (top), r-band (centre), and i-band (bottom).
PASA (2017)doi:10.1017/pas.2017.xxx

18 Andreoni et al.
during a galaxy merger, so constraints on any kick re-ceived by the binary are poor.
No radio source is detected down to 40µJy with theATCA, ASKAP, VLBA, and MWA telescopes within 10days from the GW detection. However, past sGRBs thatwere detected in the radio despite being 30–60 timesmore distant than this event (Berger et al. 2005; Soder-berg et al. 2006; Fong et al. 2014; Zhang et al. 2017) im-ply that future neutron star mergers at these (40 Mpc)distances could reach flux densities of 0.1 to 1 Jy. TheParkes and ASKAP radio telescopes searched for FRBsin NGC 4993 after the binary neutron stars merger for atotal of 5 and 18.7 hours, respectively. No FRB was de-tected: a signal from a source at ∼ 40 Mpc with similarproperties of the repeating FRB 121102 (Spitler et al.2016) would have resulted in a highly significant detec-tion.
We compared “standard” sGRB afterglow models(GS02) with the optical light curve obtained with themeasurements of the Zadko, AST3-2, SkyMapper, andEtelman/VIRT telescopes. The AT2017gfo transientwas proven to be the electromagnetic counterpart toGW170817 and GRB 170817A (Abbott et al. 2017h),but its optical light curve does not match the sGRBafterglow models. The continuum profiles and evolu-tion of the spectra of AT2017gfo are unlike sGRBs andargue for a kilonova-like explosion, with a blackbody-like event cooling rapidly over the ∼7 d of our spectralcoverage. We compared three kilonova models (T&H13,B&K13, M15) with our photometric data and the plots,combined with the spectral evolution of the transient,make the combination of a neutron-powered blue pre-cursor and a r-process red emission at later time a plau-sible scenario.
5 FUTURE PERSPECTIVES
Several facilities discussed here have existing reactiveprograms to follow up GW alerts, while others performobservations as part of DWF and/or OzGrav.
DWF coordinates∼30 major observatories worldwideand in space to provide simultaneous, fast-cadenced,deep (m ∼ 23–25, optical), radio to gamma-ray cov-erage of fast transients and GW events6 (Cooke et al.2017). As a result, DWF is on-source before, during,and after fast transients and has been in full oper-ation since 2016. Moreover, DWF performs real-time(seconds) supercomputing data analysis and transientidentification (Andreoni et al. 2017a; Vohl et al. 2017;Meade et al. 2017) and triggers rapid-response, conven-tional ToO, and long-term spectroscopy and imagingwith our network of 1–10m-class telescopes. DWF op-erates several weeks a year and was not on sky duringthis GW event. However, 10 DWF participating facili-
6http://www.dwfprogram.altervista.org
ties provided data for AT2017gfo. GW event detectionsduring future DWF observing runs will provide com-plete, densely-sampled, multi-wavelength imaging andspectroscopy of the event and host galaxy.
The intent of the EM component of OzGrav is to helpoversee a number of collaborating facilities, includingthe DWF program, in an effort to optimise the followup of GW events by Australian and Australian-led pro-grams at all wavelengths. By the time of LIGO/Virgo‘O3’ run, OzGrav will be fully optimised to providecomplete and dense coverage of GW events at all wave-lengths via imaging, spectroscopy, interferometry andfast radio burst searches.
The DFN is being augmented with cameras designedto detect bright optical transients. The first such sta-tion consists of a Nikon D810 Camera with a Samyang14mm f/2.8 IF ED UMC Lens, giving a field of view of80x100 deg, an imaging cadence of 15 s, and a limitingmagnitude of magv=10. Successor astronomy stationshave been developed to have a greater sky coverage andincreased sensitivity, via multiple cameras to tile the skywith a <5 s imaging cadence and limiting magnitude ofagv=12. The current and future DFN network is theonly facility that can provide continuous monitoring forhalf of the Southern sky.
The future of the OzGrav facilities network also in-cludes the Gravitational-wave Optical Transient Ob-server (GOTO7), a planned wide-field robotic opti-cal telescope optimised for following up LVC triggers.GOTO is supported by a collaboration between MonashUniversity; Warwick, Sheffield, Leicester and ArmaghUniversity in the UK; and the National AstronomicalResearch Institute of Thailand (NARIT). Each instru-ment consists of eight 40-cm astrographs on a singlemount, with fields-of-view arranged to achieve a totalcoverage of order 40 square degrees. The prototype in-strument, with four astrographs, was deployed in 2017June, although full robotic operation was not achievedbefore the end of O2. Funding has now been secured foran additional four astrographs, and the instrument isexpected to commence operations in 2018.
Australia will further be able to support the search forand characterisation of GW sources with GLUV, a 30cmultraviolet survey telescope under development at ANU(Sharp et al. 2016) for a high altitude balloon platform.It will feature a 7 deg2 field of view and a limiting mag-nitude in near-UV of ∼22. Ridden-Harper et al. (2017)explores the application of GLUV to gravitational wavesource characterisation, showing that early UV obser-vations could provide a powerful diagnostic to identifymerger pathways. The system is expected to fly in 2019and build towards a constellation of telescopes flying inobservation campaigns.
7http://goto-observatory.org
PASA (2017)doi:10.1017/pas.2017.xxx
Follow up of GW170817 and its electromagnetic counterpart by Australian-led observing programs 19
6 Acknowledgements
We thank Prof. Brian Metzger who provided the grilight curves for the M15 model. Part of this researchwas funded by the Australian Research Council Cen-tre of Excellence for Gravitational Wave Discovery(OzGrav), CE170100004 and the Australian ResearchCouncil Centre of Excellence for All-sky Astrophysics(CAASTRO), CE110001020. Parts of this research wereconducted by the Australian Research Council Centreof Excellence for All-sky Astrophysics in 3 Dimensions(ASTRO-3D), CE170100013.
Research support to IA is provided by the Aus-tralian Astronomical Observatory (AAO). JC acknowl-edges the Australian Research Council Future Fel-lowship grant FT130101219. The Etelman Obser-vatory team acknowledges support through NASAgrants NNX13AD28A and NNX15AP95A. TM ac-knowledges the support of the Australian ResearchCouncil through grant FT150100099. SO acknowledgesthe Australian Research Council grant Laureate Fel-lowship FL15010014. DLK and ISB are additionallysupported by NSF grant AST-141242.1 PAB and theDFN team acknowledge the Australian Research Coun-cil for support under their Australian Laureate Fellow-ship scheme. C.M. is supported by NSF grant AST-1313484.
The Australia Telescope Compact Array is part of theAustralia Telescope National Facility which is funded bythe Australian Government for operation as a NationalFacility managed by CSIRO.
This scientific work makes use of the MurchisonRadio-astronomy Observatory, operated by CSIRO. Weacknowledge the Wajarri Yamatji people as the tradi-tional owners of the Observatory site. Support for theoperation of the MWA is provided by the AustralianGovernment (NCRIS), under a contract to Curtin Uni-versity administered by Astronomy Australia Limited.We acknowledge the Pawsey Supercomputing Centrewhich is supported by the Western Australian and Aus-tralian Governments.
The Australian SKA Pathfinder is part of the Aus-tralia Telescope National Facility which is managedby CSIRO. Operation of ASKAP is funded by theAustralian Government with support from the Na-tional Collaborative Research Infrastructure Strategy.ASKAP uses the resources of the Pawsey Supercomput-ing Centre. Establishment of ASKAP, the MurchisonRadio-astronomy Observatory and the Pawsey Super-computing Centre are initiatives of the Australian Gov-ernment, with support from the Government of West-ern Australia and the Science and Industry Endow-ment Fund. We acknowledge the Wajarri Yamatji peo-ple as the traditional owners of the Observatory site.This work was supported by resources provided by thePawsey Supercomputing Centre with funding from the
Australian Government and the Government of West-ern Australia.
The Long Baseline Observatory is a facility of the Na-tional Science Foundation operated under cooperativeagreement by Associated Universities, Inc.
The Zadko Telescope is supported by the Universityof Western Australia Department of Physics, in the Fac-ulty of Engineering and Mathematical Sciences. We alsothank the superb technical support from J. Moore andA. Burrel that has enabled the facility to participate inthis project.
SkyMapper is owned and operated by The AustralianNational University’s Research School of Astronomyand Astrophysics. The national facility capability forSkyMapper has been funded through ARC LIEF grantLE130100104 from the Australian Research Council,awarded to the University of Sydney, the Australian Na-tional University, Swinburne University of Technology,the University of Queensland, the University of West-ern Australia, the University of Melbourne, Curtin Uni-versity of Technology, Monash University and the Aus-tralian Astronomical Observatory.
The AST3 project is supported by the National Ba-sic Research Program (973 Program) of China (GrantNo. 2013CB834900), and the Chinese Polar Environ-ment Comprehensive Investigation & Assessment Pro-gram (Grand No. CHINARE2016-02-03-05). The con-struction of the AST3 telescopes has received fund-ings from Tsinghua University, Nanjing University, Bei-jing Normal University, University of New South Wales,Texas A&M University, the Australian Antarctic Divi-sion, and the National Collaborative Research Infras-tructure Strategy (NCRIS) of Australia. It has alsoreceived fundings from Chinese Academy of Sciencesthrough the Center for Astronomical Mega-Science andNational Astronomical Observatory of China (NAOC).
Based in part on data acquired through the Aus-tralian Astronomical Observatory. We acknowledge thetraditional owners of the land on which the AAT stands,the Gamilaraay people, and pay our respects to elderspast and present.
Some of the observations reported in this paper wereobtained with the Southern African Large Telescope(SALT) under the Director’s Discretionary Time pro-gramme 2017-1-DDT-009. The SALT/SAAO team aresupported by the National Research Foundation (NRF)of South Africa.
Research partially based on observations collected atthe European Organisation for Astronomical Researchin the Southern Hemisphere under ESO programme60.A-9392.
PASA (2017)doi:10.1017/pas.2017.xxx

20 Andreoni et al.
Table 2: AST3-2 Observations of GW170817 and AT2017gfo
AST3-2UT obs date Band Mag Mag. error2017-08-18 13:11:42.72 i 17.23 0.22(-0.21)2017-08-18 14:15:54.29 i 17.61 0.162017-08-18 15:00:16.24 i 17.72 0.18(-0.17)2017-08-20 16:07:27.71 i >18.672017-08-21 15:36:49.65 i >18.38
Table 3: Zadko Observations of GW170817 and AT2017gfo
ZadkoUT obs date Band Mag Mag. error2017-08-19 10:57:00 r 18.46 0.172017-08-20 11:30:00 r 19.18 0.122017-08-21 11:52:00 r 19.86 0.212017-08-22 11:46:00 r 20.20 0.232017-08-23 11:32:00 r >20.6
Table 4: Etelman/VIRT Observations of GW170817 and AT2017gfo.
Etelman/VIRTUT obs date Band Mag Mag error2017-08-20 00:12 Clear 18.90 0.28
Table 5: ESO VLT Observations of GW170817 and AT2017gfo. Kasliwal et al. 2017, in preparation
ESO VLTInstrument UT obs date Band MagNACO 2017-08-25 22:45 L′3.8 > 14.5NACO 2017-08-26 22:45 L′3.8 > 14.8NACO 2017-08-27 22:45 L′3.8 > 14.5NACO 2017-09-01 22:45 L′3.8 > 14.3VISIR 2017-08-23 23:35 J8.9 > 8.26VISIR 2017-08-31 23:18 J8.9 > 7.74VISIR 2017-09-01 23:18 J8.9 > 7.57VISIR 2017-09-06 23:33 J8.9 > 7.42
PASA (2017)doi:10.1017/pas.2017.xxx
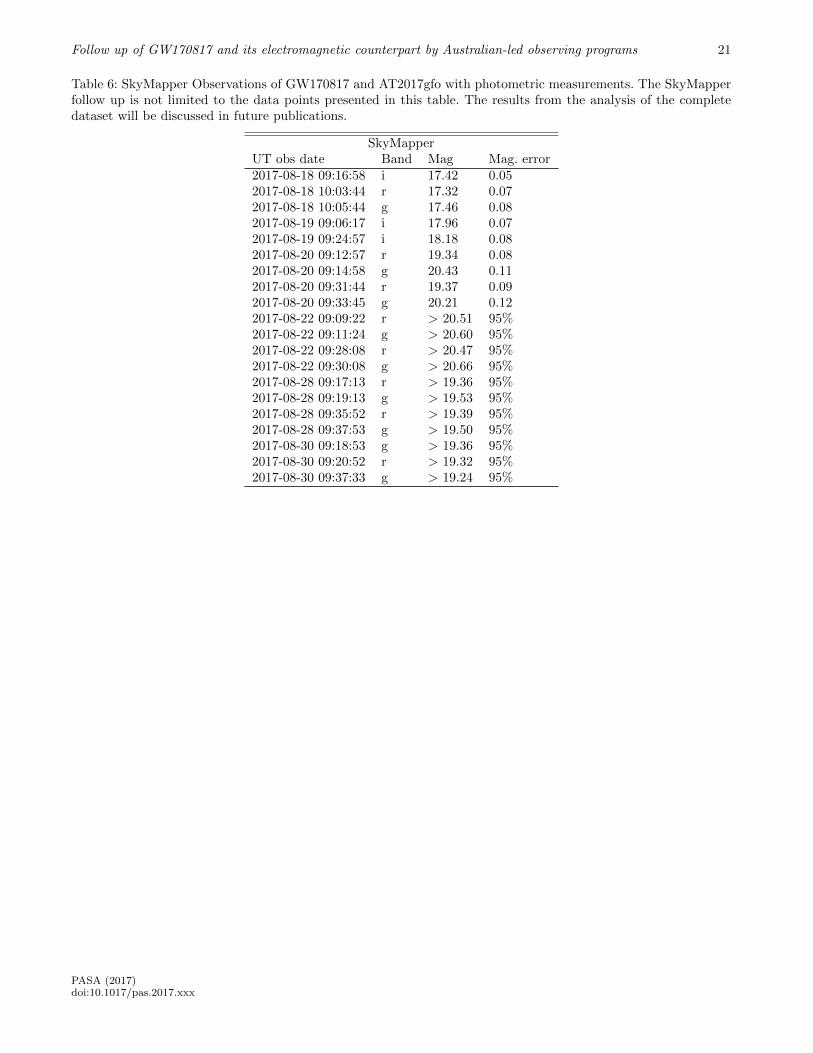
Follow up of GW170817 and its electromagnetic counterpart by Australian-led observing programs 21
Table 6: SkyMapper Observations of GW170817 and AT2017gfo with photometric measurements. The SkyMapperfollow up is not limited to the data points presented in this table. The results from the analysis of the completedataset will be discussed in future publications.
SkyMapperUT obs date Band Mag Mag. error2017-08-18 09:16:58 i 17.42 0.052017-08-18 10:03:44 r 17.32 0.072017-08-18 10:05:44 g 17.46 0.082017-08-19 09:06:17 i 17.96 0.072017-08-19 09:24:57 i 18.18 0.082017-08-20 09:12:57 r 19.34 0.082017-08-20 09:14:58 g 20.43 0.112017-08-20 09:31:44 r 19.37 0.092017-08-20 09:33:45 g 20.21 0.122017-08-22 09:09:22 r > 20.51 95%2017-08-22 09:11:24 g > 20.60 95%2017-08-22 09:28:08 r > 20.47 95%2017-08-22 09:30:08 g > 20.66 95%2017-08-28 09:17:13 r > 19.36 95%2017-08-28 09:19:13 g > 19.53 95%2017-08-28 09:35:52 r > 19.39 95%2017-08-28 09:37:53 g > 19.50 95%2017-08-30 09:18:53 g > 19.36 95%2017-08-30 09:20:52 r > 19.32 95%2017-08-30 09:37:33 g > 19.24 95%
PASA (2017)doi:10.1017/pas.2017.xxx
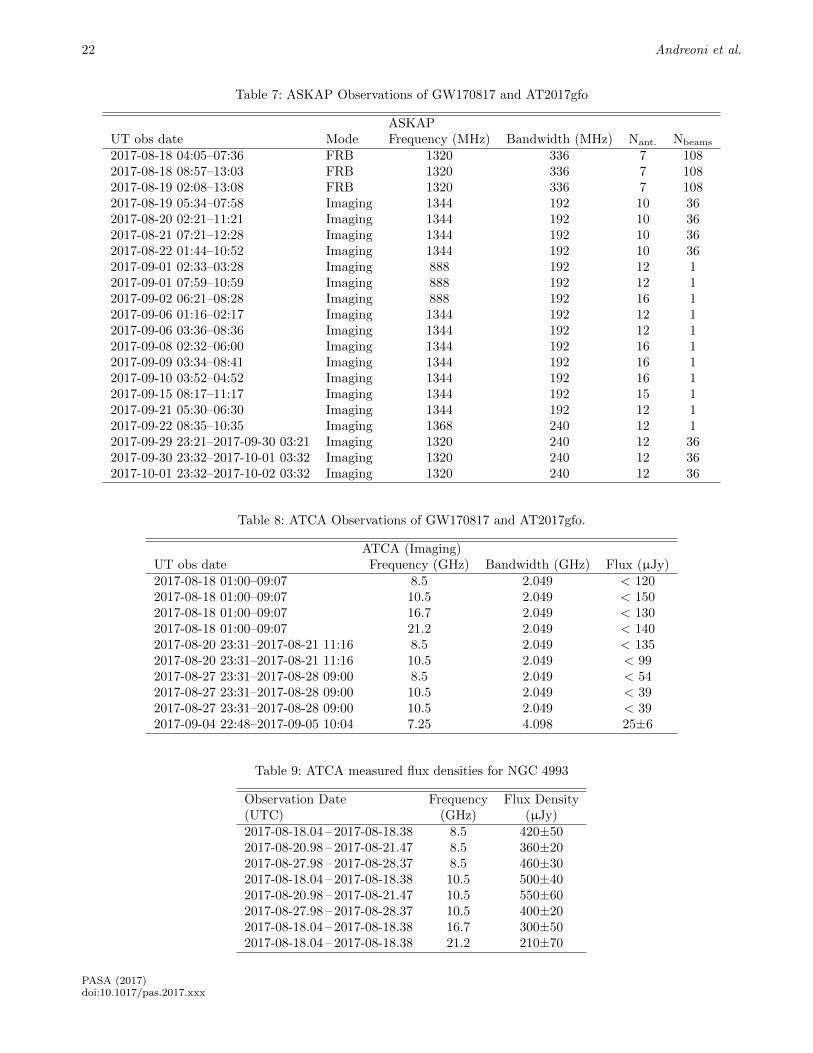
22 Andreoni et al.
Table 7: ASKAP Observations of GW170817 and AT2017gfo
ASKAPUT obs date Mode Frequency (MHz) Bandwidth (MHz) Nant. Nbeams
2017-08-18 04:05–07:36 FRB 1320 336 7 1082017-08-18 08:57–13:03 FRB 1320 336 7 1082017-08-19 02:08–13:08 FRB 1320 336 7 1082017-08-19 05:34–07:58 Imaging 1344 192 10 362017-08-20 02:21–11:21 Imaging 1344 192 10 362017-08-21 07:21–12:28 Imaging 1344 192 10 362017-08-22 01:44–10:52 Imaging 1344 192 10 362017-09-01 02:33–03:28 Imaging 888 192 12 12017-09-01 07:59–10:59 Imaging 888 192 12 12017-09-02 06:21–08:28 Imaging 888 192 16 12017-09-06 01:16–02:17 Imaging 1344 192 12 12017-09-06 03:36–08:36 Imaging 1344 192 12 12017-09-08 02:32–06:00 Imaging 1344 192 16 12017-09-09 03:34–08:41 Imaging 1344 192 16 12017-09-10 03:52–04:52 Imaging 1344 192 16 12017-09-15 08:17–11:17 Imaging 1344 192 15 12017-09-21 05:30–06:30 Imaging 1344 192 12 12017-09-22 08:35–10:35 Imaging 1368 240 12 12017-09-29 23:21–2017-09-30 03:21 Imaging 1320 240 12 362017-09-30 23:32–2017-10-01 03:32 Imaging 1320 240 12 362017-10-01 23:32–2017-10-02 03:32 Imaging 1320 240 12 36
Table 8: ATCA Observations of GW170817 and AT2017gfo.
ATCA (Imaging)UT obs date Frequency (GHz) Bandwidth (GHz) Flux (µJy)2017-08-18 01:00–09:07 8.5 2.049 < 1202017-08-18 01:00–09:07 10.5 2.049 < 1502017-08-18 01:00–09:07 16.7 2.049 < 1302017-08-18 01:00–09:07 21.2 2.049 < 1402017-08-20 23:31–2017-08-21 11:16 8.5 2.049 < 1352017-08-20 23:31–2017-08-21 11:16 10.5 2.049 < 992017-08-27 23:31–2017-08-28 09:00 8.5 2.049 < 542017-08-27 23:31–2017-08-28 09:00 10.5 2.049 < 392017-08-27 23:31–2017-08-28 09:00 10.5 2.049 < 392017-09-04 22:48–2017-09-05 10:04 7.25 4.098 25±6
Table 9: ATCA measured flux densities for NGC 4993
Observation Date Frequency Flux Density(UTC) (GHz) (µJy)2017-08-18.04 – 2017-08-18.38 8.5 420±502017-08-20.98 – 2017-08-21.47 8.5 360±202017-08-27.98 – 2017-08-28.37 8.5 460±302017-08-18.04 – 2017-08-18.38 10.5 500±402017-08-20.98 – 2017-08-21.47 10.5 550±602017-08-27.98 – 2017-08-28.37 10.5 400±202017-08-18.04 – 2017-08-18.38 16.7 300±502017-08-18.04 – 2017-08-18.38 21.2 210±70
PASA (2017)doi:10.1017/pas.2017.xxx
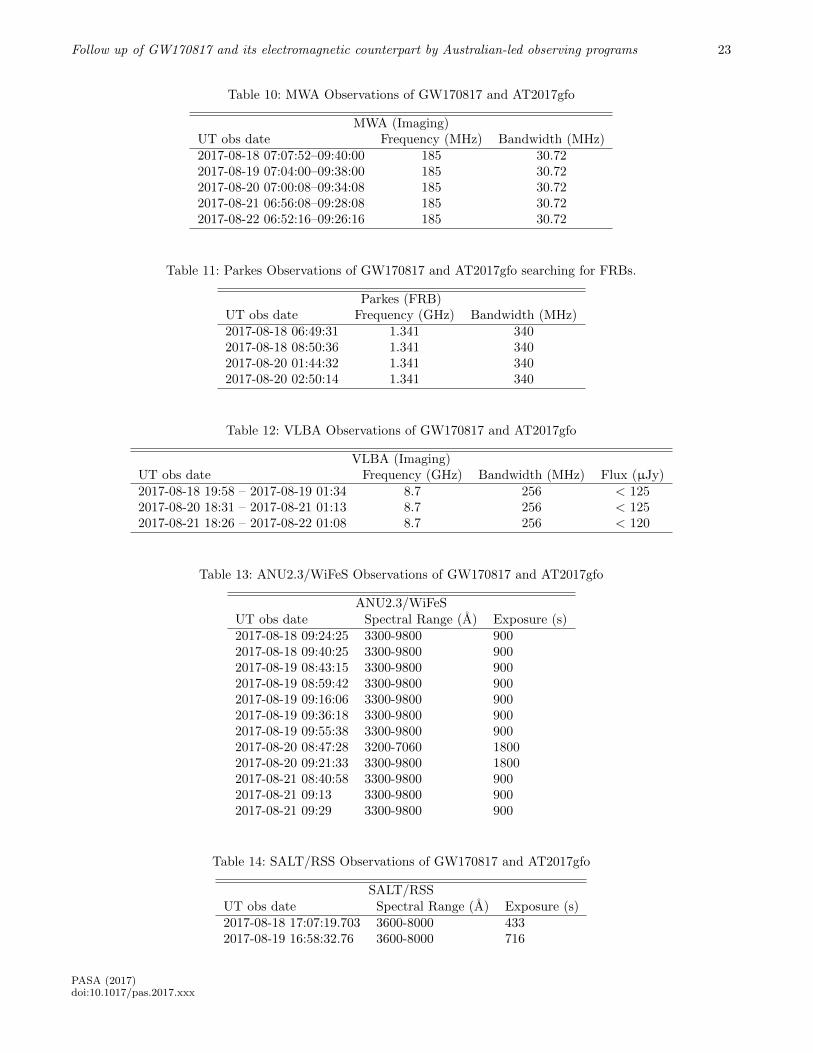
Follow up of GW170817 and its electromagnetic counterpart by Australian-led observing programs 23
Table 10: MWA Observations of GW170817 and AT2017gfo
MWA (Imaging)UT obs date Frequency (MHz) Bandwidth (MHz)2017-08-18 07:07:52–09:40:00 185 30.722017-08-19 07:04:00–09:38:00 185 30.722017-08-20 07:00:08–09:34:08 185 30.722017-08-21 06:56:08–09:28:08 185 30.722017-08-22 06:52:16–09:26:16 185 30.72
Table 11: Parkes Observations of GW170817 and AT2017gfo searching for FRBs.
Parkes (FRB)UT obs date Frequency (GHz) Bandwidth (MHz)2017-08-18 06:49:31 1.341 3402017-08-18 08:50:36 1.341 3402017-08-20 01:44:32 1.341 3402017-08-20 02:50:14 1.341 340
Table 12: VLBA Observations of GW170817 and AT2017gfo
VLBA (Imaging)UT obs date Frequency (GHz) Bandwidth (MHz) Flux (µJy)2017-08-18 19:58 – 2017-08-19 01:34 8.7 256 < 1252017-08-20 18:31 – 2017-08-21 01:13 8.7 256 < 1252017-08-21 18:26 – 2017-08-22 01:08 8.7 256 < 120
Table 13: ANU2.3/WiFeS Observations of GW170817 and AT2017gfo
ANU2.3/WiFeSUT obs date Spectral Range (A) Exposure (s)2017-08-18 09:24:25 3300-9800 9002017-08-18 09:40:25 3300-9800 9002017-08-19 08:43:15 3300-9800 9002017-08-19 08:59:42 3300-9800 9002017-08-19 09:16:06 3300-9800 9002017-08-19 09:36:18 3300-9800 9002017-08-19 09:55:38 3300-9800 9002017-08-20 08:47:28 3200-7060 18002017-08-20 09:21:33 3300-9800 18002017-08-21 08:40:58 3300-9800 9002017-08-21 09:13 3300-9800 9002017-08-21 09:29 3300-9800 900
Table 14: SALT/RSS Observations of GW170817 and AT2017gfo
SALT/RSSUT obs date Spectral Range (A) Exposure (s)2017-08-18 17:07:19.703 3600-8000 4332017-08-19 16:58:32.76 3600-8000 716
PASA (2017)doi:10.1017/pas.2017.xxx

24 Andreoni et al.
Table 15: AAT/AAOmega+2dF Observations of GW170817 and AT2017gfo
AAT/AAOmega+2dFUT obs date Spectral Range (A) Exposure (s)2017-08-24 08:55:07 3750-8900 2400
PASA (2017)doi:10.1017/pas.2017.xxx

Follow up of GW170817 and its electromagnetic counterpart by Australian-led observing programs 25
REFERENCES
Abbott B. P., et al., 2017a, GCN, 21505, 1
Abbott B. P., et al., 2017b, GCN, 21509, 1
Abbott B. P., et al., 2017c, GCN, 21510, 1
Abbott B. P., et al., 2017d, GCN, 21513, 1
Abbott B. P., et al., 2017e, GCN, 21527, 1
Abbott B. P., et al., 2017f, PRL, in press
Abbott B. P., et al., 2017g, ApJL, in press
Abbott B. P., et al., 2017h, ApJ, in press
Adams S. M., et al., 2017, GCN, 21816, 1
Allam S., et al., 2017, GCN, 21530, 1
Andreoni I., Jacobs C., Hegarty S., Pritchard T., CookeJ., Ryder S., 2017a, PASA, 34, e037
Andreoni I., et al., 2017b, GCN, 21677, 1
Arcavi I., et al., 2017a, GCN, 21538, 1
Arcavi I., et al., 2017b, Nature, accepted
Arzoumanian Z., Cordes J. M., Wasserman I., 1999,ApJ, 520, 696
Astropy Collaboration et al., 2013, A&A, 558, A33
Bailes M., et al., 2017a, GCN, 21899, 1
Bailes M., et al., 2017b, GCN, 21928, 1
Bannister K. W., et al., 2017a, ApJ, 841, L12
Bannister K., et al., 2017b, GCN, 21537, 1
Bannister K., et al., 2017c, GCN, 21559, 1
Barnes J., Kasen D., 2013, ApJ, 775, 18
Barnes J., Kasen D., Wu M.-R., Martınez-Pinedo G.,2016, ApJ, 829, 110
Berger E., et al., 2005, Nature, 438, 988
Berger E., Fong W., Chornock R., 2013, ApJL, 774, L23
Buckley D., et al., 2017, MNRAS, submitted
Burgay M., et al., 2003, Nature, 426, 531
Burgh E. B., Nordsieck K. H., Kobulnicky H. A.,Williams T. B., O’Donoghue D., Smith M. P., Perci-val J. W., 2003, in Iye M., Moorwood A. F. M., eds,Proc. SPIEVol. 4841, Instrument Design and Per-formance for Optical/Infrared Ground-based Tele-scopes. pp 1463–1471, doi:10.1117/12.460312
Cappellari M., 2017, MNRAS, 466, 798
Cardelli J. A., Clayton G. C., Mathis J. S., 1989, ApJ,345, 245
Cenko S. B., et al., 2017, GCN, 21572, 1
Childress M. J., et al., 2017, MNRAS, 472, 273
Chu Q., Howell E. J., Rowlinson A., Gao H., Zhang B.,Tingay S. J., Boer M., Wen L., 2016, MNRAS, 459,121
Connaughton V., et al., 2017, GCN, 21506, 1
Cooke J., et al., 2017, PASA, in preparation
Coulter D. A., et al., 2017a, GCN, 21529, 1
Coulter D. A., et al., 2017b, Science, in press
Coward D. M., et al., 2010, PASA, 27, 331
Coward D., et al., 2017, GCN, 21744, 1
Crawford S. M., et al., 2010, in Observatory Operations:Strategies, Processes, and Systems III. p. 773725,doi:10.1117/12.857000
Cui X., Yuan X., Gong X., 2008, in Ground-based and Airborne Telescopes II. p. 70122D,doi:10.1117/12.789458
Day B. H., Bland P., 2016, AGU Fall Meeting Ab-stracts,
Deller A., et al., 2017a, GCN, 21588, 1
Deller A., et al., 2017b, GCN, 21850, 1
Deller A., et al., 2017c, GCN, 21897, 1
Dobie D., et al., 2017, in preparation
Dopita M., Hart J., McGregor P., Oates P., BloxhamG., Jones D., 2007, Ap&SS, 310, 255
Evans P., et al., 2017, GCN, 21612, 1
Falcke H., Kording E., Markoff S., 2004, A&A, 414, 895
Foley R. J., et al., 2017, GCN, 21536, 1
Fong W., Berger E., 2013, ApJ, 776, 18
Fong W., et al., 2013, ApJ, 769, 56
Fong W., et al., 2014, ApJ, 780, 118
Fong W., Berger E., Margutti R., Zauderer B. A., 2015,The Astrophysical Journal, 815, 102
Frail D. A., et al., 2001, The Astrophysical Journal Let-ters, 562, L55
Freedman W. L., et al., 2001, ApJ, 553, 47
Gao H., Ding X., Wu X.-F., Dai Z.-G., Zhang B., 2015,ApJ, 807, 163
Gendre B., et al., 2017, GCN, 21609, 1
Goldstein A., et al., 2017a, GCN, 21528, 1
Goldstein A., et al., 2017b, ApJL, in press
Goodman J., 1986, ApJ, 308, L47
Granot J., Sari R., 2002, The Astrophysical Journal,568, 820
Granot J., Piran T., Sari R., 1999, The AstrophysicalJournal, 527, 236
Hallinan G., et al., 2017, Science, in press
Hancock P. J., et al., 2017, GCN, 21894, 1
Hotokezaka K., Kyutoku K., Tanaka M., Kiuchi K.,Sekiguchi Y., Shibata M., Wanajo S., 2013, ApJ, 778,L16
Howell E. J., et al., 2015, PASA, 32, e046
Hu L., et al., 2017a, GCN, 21883, 1
Hu L., et al., 2017b, in preparation
Jin Z.-P., et al., 2016, Nature Communications, 7, 12898
Jones D. H., et al., 2009, MNRAS, 399, 683
Kaplan D. L., et al., 2015, ApJ, 814, L25
Kaplan D. L., Murphy T., Rowlinson A., Croft S. D.,Wayth R. B., Trott C. M., 2016, PASA, 33, e050
Kaplan D., et al., 2017a, GCN, 21574, 1
Kaplan D., et al., 2017b, GCN, 21637, 1
Kaplan D., et al., 2017c, GCN, 21927, 1
Kasen D., Fernandez R., Metzger B. D., 2015, MNRAS,450, 1777
PASA (2017)doi:10.1017/pas.2017.xxx

26 Andreoni et al.
Kasliwal M., et al., 2017, Science, in press
Keane E. F., et al., 2017, MNRAS, in press, (arxiv ID:1706.04459)
Keith M. J., et al., 2010, MNRAS, 409, 619
Keller S. C., et al., 2007, PASA, 24, 1
Lagage P. O., et al., 2004, The Messenger, 117, 12
Lenzen R., et al., 2003, in Iye M., MoorwoodA. F. M., eds, Proc. SPIEVol. 4841, Instrument De-sign and Performance for Optical/Infrared Ground-based Telescopes. pp 944–952, doi:10.1117/12.460044
Li L.-X., Paczynski B., 1998, ApJ, 507, L59
Lipunov V., et al., 2017, GCN, 21546, 1
Lorimer D. R., Bailes M., McLaughlin M. A., NarkevicD. J., Crawford F., 2007, Science, 318, 777
Lynch C., et al., 2017, GCN, 21670, 1
McCully C., et al., 2017, ApJL, in press
Meade B., et al., 2017, PASA, 34, e023
Merloni A., Heinz S., di Matteo T., 2003, MNRAS, 345,1057
Metzger B. D., 2017, Living Reviews in Relativity, 20,3
Metzger B. D., Bauswein A., Goriely S., Kasen D., 2015,MNRAS, 446, 1115
Metzger B. D., Berger E., Margalit B., 2017, ApJ, 841,14
Moller A., et al., 2017, GCN, 21542, 1
Murphy T., et al., 2017, GCN, 21842, 1
Ogando R. L. C., Maia M. A. G., Pellegrini P. S., daCosta L. N., 2008, AJ, 135, 2424
Ozel F., Freire P., 2016, ARA&A, 54, 401
Paczynski B., 1986, ApJ, 308, L43
Pan Y.-C., et al., 2017, ApJL, in press
Perley D. A., et al., 2009, ApJ, 696, 1871
Plotkin R. M., Markoff S., Kelly B. C., Kording E.,Anderson S. F., 2012, MNRAS, 419, 267
Ridden-Harper R., Tucker B., Sharp R., Gilbert J.,Petkovic M., 2017, preprint, (arXiv:1706.06106)
Rousset G., et al., 2003, in Wizinowich P. L.,Bonaccini D., eds, Proc. SPIEVol. 4839, Adap-tive Optical System Technologies II. pp 140–149,doi:10.1117/12.459332
Sadler E. M., et al., 2017, GCN, 21645, 1
Salafia O. S., Ghisellini G., Pescalli A., Ghirlanda G.,Nappo F., 2015, MNRAS, 450, 3549
Sari R., Piran T., Halpern J. P., 1999, The Astrophys-ical Journal Letters, 519, L17
Sault R. J., Teuben P. J., Wright M. C. H., 1995, inShaw R. A., Payne H. E., Hayes J. J. E., eds, Astro-nomical Society of the Pacific Conference Series Vol.77, Astronomical Data Analysis Software and Sys-tems IV. p. 433 (arXiv:astro-ph/0612759)
Savchenko V., et al., 2017a, GCN, 21507, 1
Savchenko V., et al., 2017b, ApJL, in press
Scalzo R. A., et al., 2017, PASA, 34, e030
Shara M., et al., 2017, GCN, 21610, 1
Sharp R., Tucker B., Ridden-Harper R., BloxhamG., Petkovic M., 2016, in Ground-based and Air-borne Instrumentation for Astronomy VI. p. 99080V,doi:10.1117/12.2231555
Smith G. A., et al., 2004, in Moorwood A. F. M.,Iye M., eds, Proc. SPIEVol. 5492, Ground-based Instrumentation for Astronomy. pp 410–420,doi:10.1117/12.551013
Soderberg A. M., et al., 2006, ApJ, 650, 261
Spitler L. G., et al., 2016, Nature, 531, 202
Staveley-Smith L., et al., 1996, PASA, 13, 243
Tanaka M., Hotokezaka K., 2013, ApJ, 775, 113
Tanvir N. R., Levan A. J., Fruchter A. S., Hjorth J.,Hounsell R. A., Wiersema K., Tunnicliffe R. L., 2013,Nature, 500, 547
Tanvir N. R., et al., 2017a, GCN, 21544, 1
Tanvir N., et al., 2017b, ApJL, in press
Tingay S. J., et al., 2013, PASA, 30, e007
Valenti S., et al., 2017, ApJL, in press
Vohl D., Pritchard T., Andreoni I., Cooke J., Meade B.,2017, PASA, 34, e038
Wolf C., et al., 2017a, GCN, 21560, 1
Wolf C., et al., 2017b, in preparation
Yang S., et al., 2017, GCN, 21531, 1
Yu P.-C., et al., 2017, GCN, 21669, 1
Zhang S., Jin Z.-P., Wang Y.-Z., Wei D.-M., 2017, ApJ,835, 73
von Kienlin A., et al., 2017, GCN, 21520, 1
PASA (2017)doi:10.1017/pas.2017.xxx


