
Foggier as We Climb - GRUPO ASEGURANZA
24
Foggier as We Climb APRIL 2018 GSAM Insurance Survey GSAM INSURANCE ASSET MANAGEMENT Michael H. Siegel, PhD Managing Director, Global Head
Transcript of Foggier as We Climb - GRUPO ASEGURANZA

Foggier as We Climb
APRIL 2018
GSAMInsurance Survey
GSAM INSURANCE ASSET MANAGEMENT
Michael H. Siegel, PhD Managing Director, Global Head


GSAM Insurance Asset Management Insurance Survey
TABLE OF CONTENTS
I. Executive Summary 2
II. GSAM Insurance Survey Background 3
III. Key Survey Findings 5
IV. Conclusion 19

2 | Goldman Sachs Asset Management
GSAM Insurance Asset Management Insurance Survey
I. Executive Summary In a period marked by low market volatility despite high geopolitical uncertainty, this year’s GSAM Insurance Asset Management survey reveals differing expectations regarding the credit cycle, rates, risk appetite and investment returns. With rates expected to rise and equity valuations high, insurers are concerned with achieving adequate returns without leaving their portfolios overexposed in the event of a downturn. In April 2018, GSAM Insurance Asset Management conducted its seventh annual survey, which synthesizes perspectives from 300 Chief Investment Officers (CIOs) and Chief Financial Officers (CFOs), representing over $10 trillion in global balance sheet assets.
Two-thirds of insurers (65%) anticipate 10-Year US Treasury yields will end 2018 above 3.0%, and 77% believe S&P 500 Index returns will be positive this year. Expectations for the US dollar were split, as roughly one-third feel the dollar will depreciate and another third predict it will appreciate. Insurers expressed a growing consensus that we are in the late stage of the US credit cycle, while the broader global credit cycle is more middle stage. However, no insurers feel that US or global credit spreads will significantly widen this year. Similar to last year, 92% feel that Brent crude prices will be range-bound between $50 and $75.
After topping the list of macroeconomic concerns in 2017, political events risk receded, while the risk of an economic slowdown or recession in the US claimed the top spot. For the first time since we have surveyed post-crisis, inflation and US monetary tightening are significant concerns for insurers in 2018. Inflation as a concern over the next five years rose to 85%. On the opposite side of the spectrum, insurers’ concern surrounding deflation over the next five years diminished to 32% from 62% in the 2016 survey.
The survey saw a return of skepticism regarding the investment opportunity set. After only 36% of insurers last year felt that opportunities were getting worse, that number rose to 50% of insurers this year. Further expressing this view, more respondents plan to de-risk across equity and credit, increase portfolio liquidity and reduce duration. This represents a reversal in risk appetite from last year’s survey. Asian insurers are an exception, as they plan to increase credit risk and duration this year, similar to last year.
Respondents expressed continued confidence in returns for growth-related asset classes (private equity, emerging market equities, US equities). Similarly, they expect to increase their asset allocations to less liquid assets such as infrastructure debt, commercial mortgage loans and middle market corporate loans. Conversely, insurers plan to decrease allocations to high yield debt, tax-exempt municipal bonds and US equities.
Cryptocurrencies, a subject of much interest and discussion, are believed by most insurers to not have a role in an investment portfolio, while a third of respondents view cryptocurrencies as a potential risk to financial markets. Environmental, Social and Governance (ESG) continues to grow as a consideration in the investment process with 40% of global insurers taking ESG into account when making investment decisions, compared to 32% in 2017. Big data/artificial intelligence (AI) is an emerging portfolio tool; 15% of global insurers currently have a role for big data/AI in their investment portfolio with an additional 40% considering implementation in the future.
Inflation and US monetary tightening represent significant concerns for insurers this year.

Goldman Sachs Asset Management | 3
GSAM Insurance Asset Management Insurance Survey
II. GSAM Insurance Survey BackgroundMARKET ENVIRONMENT
In 2017, markets were generally characterized by low volatility and strong returns as investors shifted their expectations surrounding economic data, monetary policy and geopolitical events. The synchronous global expansion led equity and credit markets to new peaks as investors brushed off repeated geopolitical risks and embraced a “buy the dip” strategy. Volatility was reintroduced to the markets in February 2018, leading to the first correction for major US equities indices in over two years.
The US Federal Reserve (Fed) hiked rates in March 2018 at the first FOMC meeting overseen by newly appointed Fed Chairman Jerome Powell. Pro-growth sentiment from the 2016 US presidential election picked up momentum with the passage of broad-based US tax reform for individuals and corporations in December. As a result, growth expectations for 2018 and 2019 have increased, as has the US Treasury’s need to fund increasingly large deficits. Beginning with the Trump Administration’s announcements of tariffs on steel, aluminum and certain Chinese manufactured goods, escalating trade war rhetoric between the world’s two largest economies has introduced greater uncertainty to the global economic outlook.
The recovery in Europe has strengthened, though inflation remains subdued. In 2017, the populist wave suffered setbacks in Dutch and French elections but was revived somewhat in the March 2018 Italian elections due to above-expectation vote share for far-right parties. In October 2017, the European Central Bank (ECB) announced it would reduce its monthly asset purchases for the nine months beginning January 2018. The markets expect the ECB to end Quantitative Easing at the end of 2018 after a brief tapering.
The Bank of Japan (BoJ) maintained accommodative policy throughout last year. Recent data from Japan has generally been on the weak side, but this is believed to be temporary due to its stronger labor market and position to continue to benefit from global growth. With Haruhiko Kuroda reappointed as BoJ Governor, the market does not expect any change to BoJ accommodation.
Concern of a hard economic landing in China has diminished in the market as well as in our survey results. Chinese policymakers announced a 2018 growth target of 6.5%, while lowering the target for the fiscal deficit by 40 basis points to 2.6% of GDP. The 2017 Congress maintained stability of China’s leadership, who are shifting focus toward reining in the fiscal imbalance. Absent a major escalation in tariffs, Emerging Market economies outside of China offer bright growth prospects, as they are generally earlier in their recoveries and stand to benefit from the strong global growth backdrop.
INSURANCE OPERATING AND REGULATORY ENVIRONMENT
Shifts in US fiscal and regulatory policy had significant impacts on global insurers’ operating environments in 2017. US tax reform passed late in the year provided a current write-down of deferred tax assets with a boost to projected forward earnings. The reform’s changes to tax deductibility rules for municipal bonds compelled insurers to reconsider the value of the asset class relative to corporate bonds. A repeal of the Affordable Care Act individual mandate was packaged with the tax legislation and will likely cause many health insurers to face repricing costs. The Trump Administration’s deregulatory stance remains a balanced risk for insurers.
Two years after the introduction of the Solvency II framework, European insurers’ asset allocations and investment management mandates have evolved to support capital efficiency and stability of solvency ratios. Increased allocations to private assets, particularly debt
After markets reached new peaks in 2017, recent volatility has led to greater uncertainty for investors.

4 | Goldman Sachs Asset Management
GSAM Insurance Asset Management Insurance Survey
instruments, and reduced allocations to capital intensive products, such as securitizations, have contributed to changing the return on capital profile of investment portfolios, while an increasing number of mandates explicitly define Solvency II specific performance indicators and risk limits.
Low interest rates in Japan, Korea and throughout Europe remain a critical challenge for insurers operating in these markets. A strong year for equity returns helped support guaranteed rates in traditional life policies.
P&C writers and non-life reinsurers were generally able to withstand substantial catastrophe losses in the second half of 2017 due to strong capital positions. Liquidity and capital remain strong with negligible asset repositioning.
Consistent with the past few years, M&A activity remained strong in 2017. Overseas cash repatriation as a result of US tax reform contributed to buying activity. Bermudian reinsurers were popular targets as large commercial lines writers looked to expand and diversify their books of business.
Growing industry use of advanced technologies and Big Data are opening the door to new “InsurTech” market participants and insurance-led venture investments. The US GAAP change in equity accounting as well as the implementation of IFRS 9 and IFRS 17 will become additional investment considerations.
SUMMARY OF SURVEY RESPONDENTS
GSAM Insurance Asset Management continued its partnership with KRC Research, an independent research provider to conduct its seventh annual global insurance investment survey. The survey provides valuable insights from Chief Investment Officers (CIOs) and Chief Financial Officers (CFOs) regarding the macroeconomic environment, return expectations, asset allocation decisions, portfolio construction and industry capitalization. We received responses from 249 CIOs and senior investment professionals, 36 CFOs and senior finance managers and 15 individuals who serve as both the CIO and CFO. This year, our survey included insurance companies that collectively invest over $10 trillion in balance sheet assets, which represents over one-third of the balance sheet assets for the global insurance sector. The participating companies represent a broad cross section of the industry in terms of size, line of business and geography. The table below summarizes the profile of this year’s respondents.
Type CIO CFO Both Total
P&C / Non-Life 93 18 7 118
Life 94 6 3 103
Multi-Line 26 4 3 33
Health 23 3 1 27
Reinsurance 13 2 0 15
Captive 0 3 1 4
Total 249 36 15 300
Region CIO CFO Both Total
Americas 142 18 8 168
EMEA 53 17 7 77
Asia Pacific 54 1 0 55
Total 249 36 15 300
300 CIOs and CFOs representing over $10 trillion in global balance sheet assets participated in this year’s survey.

Goldman Sachs Asset Management | 5
GSAM Insurance Asset Management Insurance Survey
III. Key Survey FindingsMACRO RISKS
The top three macro risks this year are a potential economic slowdown or recession in the US economy, credit and equity market volatility and inflation. Last year’s top risk of political events reversed significantly from 26% to only 4% in 2018. Inflation risk saw the largest increase, being placed among the top three risks by 48% of insurers, compared with 25% last year.
Fears of an economic slowdown or recession in the US were least pronounced in Europe, where only 8% of respondents ranked it as a top risk compared with 32% in the Americas. Credit and equity market volatility was the top risk in both Europe (21%) and Asia (24%).
Similar to 2016 and 2017, the majority (66%) of insurers believe interest rate hikes by the US Federal Reserve will pose a moderately significant impact to their investment portfolios over the course of the year. More Asian insurers (36%) believe that rate increases will have a very significant impact on their portfolios relative to Americas-based insurers (18%).
Which of the following issues pose the greatest macroeconomic risk to your investment portfolio? Please select and rank your top three. (%)
Changes in US tax code
Large scale cyber event
Changes in ECB monetary policy
Economic slowdown/recession in Europe
Economic slowdown/recession in China
Deteriorating liquidity conditions
Political events
Deflation
US monetary tightening
Credit & equity market volitility
Inflation
Economic slowdown/recession in the US
Total Ranked 1-3 (%)Ranked First Choice (%) 2018 Macroeconomic Risks
24
21
19
14
6
4
4
3
2
2
1
0
54
48
53
38
13
32
19
15
10
8
8
2
Large scale cyber event
Changes in ECB monetary policy
Economic slowdown/recession in Europe
Deteriorating liquidity conditions
Economic slowdown/recession in China
Deflation
Inflation
US monetary tightening
Credit & equity market volitility
Economic slowdown/recession in the US
Political events
Total Ranked 1-3 (%)Ranked First Choice (%)2017 Macroeconomic Risks
26
25
18
9
7
5
3
3
3
1
0
56
54
54
29
25
16
24
17
16
5
4
A US recession and market volatility represent the greatest macro risks to insurers.
6 | Goldman Sachs Asset Management
GSAM Insurance Asset Management Insurance Survey
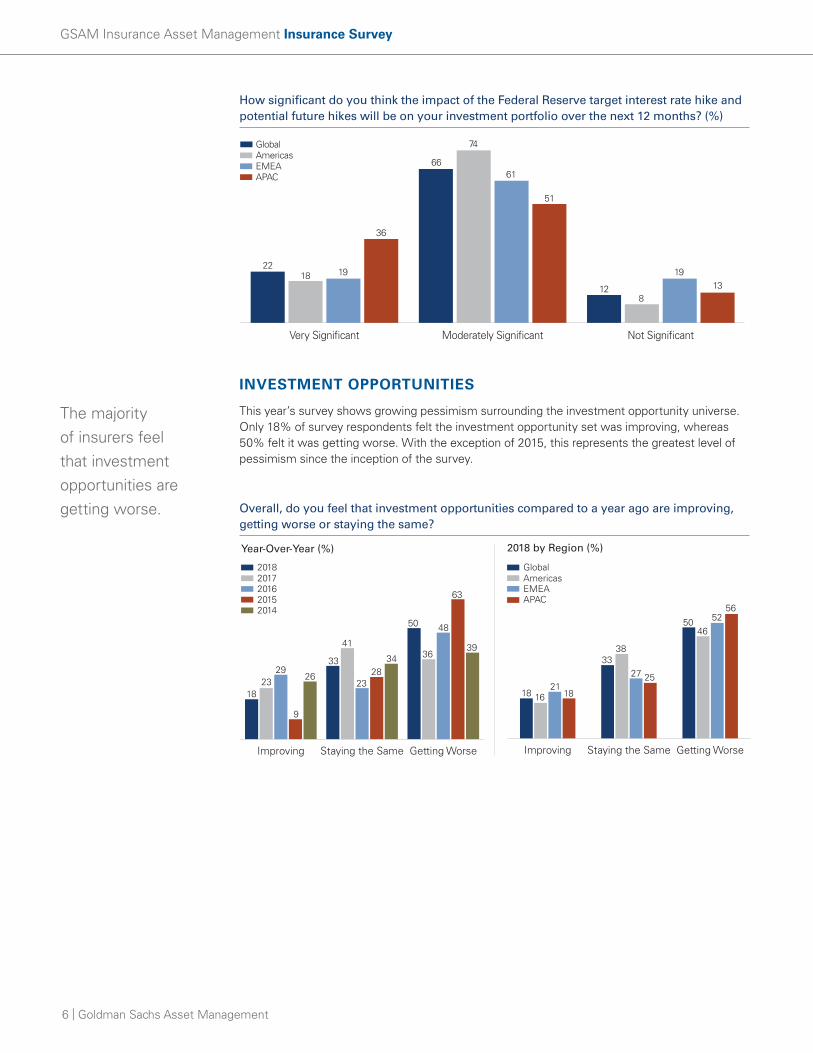
How significant do you think the impact of the Federal Reserve target interest rate hike and potential future hikes will be on your investment portfolio over the next 12 months? (%)
INVESTMENT OPPORTUNITIES
This year’s survey shows growing pessimism surrounding the investment opportunity universe. Only 18% of survey respondents felt the investment opportunity set was improving, whereas 50% felt it was getting worse. With the exception of 2015, this represents the greatest level of pessimism since the inception of the survey.
Overall, do you feel that investment opportunities compared to a year ago are improving, getting worse or staying the same?
Getting WorseStaying the SameImproving Getting WorseStaying the SameImproving
20162017
2014
2018
2015
AmericasGlobal
EMEAAPAC
1823
29
9
26
33
41
2328
34
50 48
63
3936
18 1621
18
3338
27 25
4650
5652
Year-Over-Year (%) 2018 by Region (%)
Not SignificantModerately SignificantVery Significant
22
AmericasGlobal
APACEMEA
18 19
36
66
74
61
51
128
1913
The majority of insurers feel that investment opportunities are getting worse.

Goldman Sachs Asset Management | 7
GSAM Insurance Asset Management Insurance Survey
MARKET OUTLOOK
10-Year Treasury, USD, S&P and Oil
Insurers expressed the highest US rates expectations since the 2014 post-Taper Tantrum survey, with 65% of respondents predicting the 10-Year US Treasury yield will exceed 3% at year-end 2018. US dollar (USD) expectations were dispersed, suggesting that insurance investors are continuing to digest the decoupling of US rates and the USD. Respondents maintained last year’s positive outlook on S&P 500 returns, though to a lesser extent as those predicting positive returns fell from 87% to 77% year-over-year. Expectations for oil prices were range-bound with 92% of respondents predicting that Brent crude will end 2018 between $50 and $75 USD/bbl, compared with 80% predicting this price range in 2017.
Where do you expect the 10-Year US Treasury yield will be at year-end 2018? (%)
What do you expect the 2018 total return will be for the S&P 500 Index? (%)
What do you expect the % change in the USD will be at year-end 2018? (%)
> 20%> 10% to 20%> 0% to 10%> -10% to 0%> -20% to -10%-20% or Less
0 0 1 3 19
1911
70
79
4148
0 1 087
0
20172018
2016
+10%+5%No Change-5%-10%
52
36
1825 24
32
3 3
5320172018
> 3.5% to 4.0%> 3.0% to 3.5%> 2.5% to 3.0%> 2.0% to 2.5%2.0% or Less
2016
20182017
0 0
23
3
13
64
32
63
12
62
3 0 0
23
0
65% of respondents predict the 10-Year Treasury yield will exceed 3% this year.

8 | Goldman Sachs Asset Management
GSAM Insurance Asset Management Insurance Survey
Credit Cycle
The shift we saw last year in “walking back” the global credit cycle remained intact for this year, while the view of the US credit cycle has shifted to late stage. A total of 60% of insurers believe that we are in the middle of the global credit cycle, up from 55% last year. Only 6% of respondents feel that we are in the early stage, a decrease from 2017 (10%). Consistent with these views, 54% expect global credit spreads to modestly tighten to modestly widen this year and 39% believe spreads will moderately widen. Global credit expectations are in stark contrast to US credit expectations. Most insurers (60%) feel that we are in the late stage of the US credit cycle, an increase from the 2017 figure of 49%. In aggregate, respondents expect US credit spreads to deteriorate, with 48% seeing modest tightening to modest widening and 47% seeing moderate widening.
Where do you think we are in the global credit cycle? What do you think will happen to global credit spreads in 2018?
Where do you think we are in the US credit cycle? What do you think will happen to US credit spreads in 2018?
2017 2017
Late Stage -DeterioratingCredit Quality
Middle Stage -Stable
Credit Quality
Early Stage -Improving
Credit Quality
SignificantlyWiden
ModeratelyWiden
ModestlyTighten to
Modestly Widen
Tighten
2018 2018
US Credit Cycle Stage (%) US Credit Spreads (%)
2
39
50
1
49
60
511
4855
47
34
0 0
20172016
20172016
Late Stage -DeterioratingCredit Quality
Middle Stage -Stable
Credit Quality
Early Stage -Improving
Credit Quality
SignificantlyWiden
ModeratelyWiden
ModestlyTighten to
Modestly Widen
Tighten
2018 2018
Global Credit Cycle Stage (%) Global Credit Spreads (%)
1
10
6055
22
6
3534
76
7 96
54 53
30
39 36
57
0 27
Insurers believe we are in the middle stage of the global credit cycle and late stage of the US credit cycle.

Goldman Sachs Asset Management | 9
GSAM Insurance Asset Management Insurance Survey
Inflation / Deflation
For the last several years, deflation concerns dominated inflation concerns. This has completely reversed. In reaction to firming global economic data, 25% of insurers noted inflation as a near-term concern, compared with only 2% two years ago. Three-quarters of respondents (74%)believe inflation will be a concern in their domestic market in the next two to three years. North American insurers anticipate inflation concerns soonest, with responses of 32% in the next year and 49% in two to three years.
This year, 68% of respondents believe deflation will not be a risk over the next five years, an increase from 38% two years ago.
In Japan, 56% of insurers expect inflation to be a risk in the next five years and 67% expect deflation to be a concern in the next five years. However, both of these concerns are muted in the next year with inflation at 4% and deflation at 7%.
When do you expect inflation/deflation will be a concern in your domestic market?
Liquidity Conditions and Management
Over half of respondents globally do not believe deteriorating liquidity conditions will have a significant impact on their investment portfolios, although Life (36%) and Multi-Line (42%) insurers believe it will have a higher impact relative to other types of insurers.
Year-Over-Year Deflation (%)
In the Next Year
2-3Years
3-5Years
Will Not Bea Risk in
Next 5 Years
201620172018
27
36
7 9
1923
146
68 71
38
Regional Deflation (%)
In the Next Year
2-3Years
3-5Years
Will Not Bea Risk in
Next 5 Years
2 1 3 4 7 7 6 413
22 2325
14
68
2937
68
79
55
33
APACJapan
EMEAAmericasGlobal
Year-Over-Year Inflation (%)
In the Next Year
2-3Years
3-5Years
Will Not Bea Risk in
Next 5 Years
201620172018
2518
2
4944
27
11
21
41
15 17
30
Regional Inflation (%)
In the Next Year
2-3Years
3-5Years
Will Not Bea Risk in
Next 5 Years
2532
21
13
4
4949
56
40
30
117
13 151822
APACJapan
EMEAAmericasGlobal
1210
29
44
Relative to deflation, inflation is becoming a greater concern for insurers.

10 | Goldman Sachs Asset Management
GSAM Insurance Asset Management Insurance Survey
Do you think deteriorating liquidity conditions will have a significant impact on your investment portfolio? (%)
PORTFOLIO CONSTRUCTION
Risk appetite fell year-over-year from +16% net in 2017 to -1% net in this year’s survey. This is the first time since the beginning of this survey that more insurers are planning to reduce risk rather than increase risk. While overall portfolio risk appetite in 2018 is nearly neutral across the global aggregate, the survey reveals differentiated plans across regions. North American insurers plan the most de-risking (21%) relative to risk-taking (12%). Consistent with last year, Asian insurers exhibited the largest appetite for increasing risk with 31% indicating they intend to add to overall investment risk. However, this is significantly less than the 59% of Asian insurers who planned to increase overall investment risk in the 2017 survey.
Are you planning to increase, decrease or maintain the overall risk in your investment portfolio in the next 12 months?
Decrease (%) Increase (%)
17
21
12
16
12
14
15 31
Region
APAC
EMEA
Americas
Global
Net (%)
-1
-9
+2
+16
17
10
16
16
26
25
12 33
2014
2018
2015
2012
2013
2016
2017
35
41
26
Global Year-Over-Year
8
7
14
-1
+16
+9
+21
+27
+34
+12
Yes No Do Not Believe Liquidity Conditions Are Deteriorating
P&C / Non-LifeMulti Line
Life
ReinsuranceHealth
36
18
42
27
15
53
68
39
27
63
1114
18
47
22
By Insurer Type (%)
For the first time since the survey’s inception, more respondents plan to reduce risk rather than increase risk.

Goldman Sachs Asset Management | 11
GSAM Insurance Asset Management Insurance Survey
Globally, insurers are looking to decrease equity risk (-7% net) and credit risk (-4% net). They plan to reduce duration (-6% net) and increase portfolio liquidity (+12% net). This represents a reversal across all risks from the 2017 survey, in which insurers planned to increase equity and credit risk while extending duration and reducing liquidity. Conversely, 42% of Asian insurers intend to increase credit risk and 25% plan to extend duration. These results are illustrative of continued high demand for long duration, higher-yielding US credit assets by insurers in Asia.
As expectations mount that Fed policy will be less accommodative, nearly one-quarter (23%) of North American insurers are looking to decrease portfolio duration while only 10% are looking to increase duration, in contrast with Asian peers. In Japan, 56% of insurers plan to increase credit risk while 30% intend to increase equity risk. UK respondents look to increase overall risk +17% net compared with plans to decrease in Continental Europe -10% net.
Are you planning to increase, decrease or maintain the equity risk, credit risk, liquidity and duration in your investment portfolio in the next 12 months?
Credit Risk by Region
Equity Risk by Region
APAC
EMEA
Americas
Global 26
25
34
22
17
18
APAC
EMEA
Americas
Global
Portfolio Liquidity by Region
APAC
EMEA
Americas
Global 12
12
14
24
26
18
-4
-8
-16
26
12
14
4
16
-7
-10
1
-9
23
24
18
16
14
19
25 16
16 42
11 27
Decrease (%) Increase (%) Net (%)
23
26
12
16
22
24
21 15
-7
-4
12
-6
Global
Duration
Liquidity
Credit Risk
Equity Risk
Credit Risk by Region
Equity Risk by Region
APAC
EMEA
Americas
Global 26
25
34
22
17
18
APAC
EMEA
Americas
Global
Portfolio Liquidity by Region
APAC
EMEA
Americas
Global 12
12
14
24
26
18
-4
-8
-16
26
12
14
4
16
-7
-10
1
-9
23
24
18
16
14
19
25 16
16 42
11 27
Credit Risk by Region
Equity Risk by Region
APAC
EMEA
Americas
Global 26
25
34
22
17
18
APAC
EMEA
Americas
Global
Portfolio Liquidity by Region
APAC
EMEA
Americas
Global 12
12
14
24
26
18
-4
-8
-16
26
12
14
4
16
-7
-10
1
-9
23
24
18
16
14
19
25 16
16 42
11 27
21
23
25
15
10
19
Asia Pacific
EMEA
Americas
Global
11 25
Duration Risk by Region
APAC
EMEA
Americas
Global -6
-13
-6
14
Globally, North American insurers display the strongest aversion to risk when compared to their European and Asian counterparts.

12 | Goldman Sachs Asset Management
GSAM Insurance Asset Management Insurance Survey
PORTFOLIO RISKS
Similar to last year, insurers generally believe their peers are taking on an appropriate level of investment risk (69%). Rising interest rates were cited as the greatest risk to insurers’ investment portfolios (30%). The risk is particularly pronounced in Asia where 40% of respondents selected rising rates as their top portfolio concern. This is unsurprising given their intentions to extend duration this year. Only 18% of respondents chose low yields as their top risk in 2018, a significant change from last year’s survey in which they posed the greatest risk at 35%. This suggests that insurers believe we are at a significant inflection point in the post-crisis low yield environment that has been buoyed by accommodative central bank policy. Credit quality deterioration remains a meaningful risk (23%).
Do you think your industry peer group is currently taking on too much, an appropriate level of or insufficient investment risk? (%)
Please select the investment risk that you are MOST concerned about. (%)
ASSET CLASS RETURN EXPECTATIONS
By a wide margin, insurers expect equities to be the top performing asset classes. Half of insurers expect emerging market equities to be among the top three highest returning asset classes, up from 33% a year ago. Private equity was close behind at 48%, a similar level to the 2017 survey.
Liquidity Risk
Credit Spread Widening
Equity Market Volatility
Low Yields
Credit Quality Deterioration
Rising Interest Rates
Americas EMEAGlobal APAC
3028
2940
2327
2511
1818
1622
1415
620
96
194
56
54
Too MuchInvestment Risk
InsufficientInvestment Risk
Appropriate Level of Investment Risk
AmericasEMEA
Global
APAC
22 2329
9
69 6861
80
9 8 10 11
This year, rising rates represent the greatest concern for insurers, particularly in Asia.

Goldman Sachs Asset Management | 13
GSAM Insurance Asset Management Insurance Survey
Please rank the three asset classes that you expect to deliver the highest total returns in the next 12 months. (Global % total ranked 1-3)
Investors have tempered their expectations for US equities returns with only 39% of respondents ranking them in the top three after 44% did so last year. The asset class represents the greatest degree of disagreement among respondents with 13% also expecting US equities to be one of the lowest returning asset classes in 2018. Two-thirds of insurers (68%) anticipate government and agency debt to be among the lowest returning asset classes. Another 38% expect cash and short-term instruments to be one of the three lowest returning. Further expressing views on the stage of the credit cycle, 27% of insurers predict that high yield debt will also produce particularly low returns.
Please rank the three asset classes that you expect to deliver the lowest total returns in the next 12 months. (Global % total ranked 1-3)
5048
3935
1616
1111
988
7777
54
32222
Highest Total Return (%)
Residential Mortgage-Backed Securities
Government and Agency Debt
European Investment Grade Corporates
Commercial Mortgage-Backed Securities
Commercial Mortgage Loans
US Investment Grade Corporates
Infrastructure Debt
Real Estate Equity
Emerging Market Sovereign Debt
Emerging Market Corporate Debt
Collateralized Loan Obligations
High Yield Debt
Cash and Short-Term Instruments
Mezzanine Debt
Infrastructure Equity
Hedge Funds
Middle Market Corporate Loans
Commodities
European Equities
US Equities
Private Equity
Emerging Market Equities
Residential Mortgage-Backed SecuritiesGovernment and Agency Debt European Investment Grade CorporatesCommercial Mortgage-Backed SecuritiesCommercial Mortgage Loans US Investment Grade CorporatesInfrastructure DebtReal Estate EquityEmerging Market Sovereign Debt Emerging Market Corporate DebtCollateralized Loan ObligationsHigh Yield DebtCash and Short-Term InstrumentsMezzanine DebtInfrastructure EquityHedge Funds Middle Market Corporate LoansCommodities European EquitiesUS EquitiesPrivate Equity Emerging Market Equities
6838
2727
2316
1310
999
88
55
4444
33
2
Lowest Total Return (%)
Middle Market Corporate Loans
Infrastructure Equity
Commercial Mortgage-Backed Securities
Collateralized Loan Obligations
Commercial Mortgage Loans
Infrastructure Debt
European Equities
Private Equity
Mezzanine Debt
Commodities
Residential Mortgage-Backed Securities
Emerging Market Equities
Emerging Market Sovereign Debt
Emerging Market Corporate Debt
Hedge Funds
Real Estate Equity
US Equities
European Investment Grade Corporates
Tax-Exempt Municipal Bonds
US Investment Grade Corporates
High Yield Debt
Cash and Short-Term Instruments
Government and Agency Debt
Middle Market Corporate LoansInfrastructure EquityCommercial Mortgage-Backed SecuritiesCollateralized Loan ObligationsCommercial Mortgage Loans Infrastructure DebtEuropean EquitiesPrivate Equity Mezzanine DebtCommodities Residential Mortgage-Backed SecuritiesEmerging Market EquitiesEmerging Market Sovereign Debt Emerging Market Corporate DebtHedge Funds Real Estate EquityUS EquitiesEuropean Investment Grade CorporatesTax-Exempt Municipal BondsUS Investment Grade CorporatesHigh Yield DebtCash and Short-Term InstrumentsGovernment and Agency Debt
1
Insurers have fragmented views on the performance of US equities.

14 | Goldman Sachs Asset Management
GSAM Insurance Asset Management Insurance Survey
ASSET ALLOCATION PREFERENCES
Insurers continue to express interest in higher returning, less liquid asset classes such as private equity (32%), infrastructure debt (27%), commercial mortgage loans (22%) and middle market corporate loans (21%). For the third consecutive year, insurers also plan to increase their allocation to US investment grade corporates (7%), which provide higher yields relative to other high quality assets. They intend to decrease their allocations to high yield bonds (-10%) and tax-exempt municipal bonds (-9%). These bearish views are likely in response to credit cycle assessments and US tax reform, respectively.
Are you planning to increase, decrease or maintain your allocation to the following asset classes in the next 12 months?
Insurers’ allocation plans for several assets were significantly different from last year. Most notably, respondents plan to decrease allocation in high yield debt by 20%, year-over-year. Reflecting the overall theme of de-risking, insurers will add more to cash and government debt this year than they did last year. Plans to decrease allocations to US investment grade corporates and US equities are likely market calls based on return expectations.
High Yield Debt
Tax-Exempt Municipal Bonds
US Equities
Government and Agency Debt
Cash and Short-Term Instruments
European Investment Grade Corporates
Hedge Funds
Commodities
Mezzanine Debt
Commercial Mortgage-Backed Securities
Emerging Market Corporate Debt
US Investment Grade Corporates
Residential Mortgage-Backed Securities
Emerging Market Sovereign Debt
Real Estate Equity
European Equities
Emerging Market Equities
Infrastructure Equity
Collateralized Loan Obligations
Middle Market Corporate Loans
Commercial Mortgage Loans
Infrastructure Debt
Private Equity
High Yield Debt
Tax-Exempt Municipal Bonds
US Equities
Government and Agency Debt
Cash and Short-Term Instruments
European Investment Grade Corporates
Hedge Funds
Commodities
Mezzanine Debt
Commercial Mortgage-Backed Securities
Emerging Market Corporate Debt
US Investment Grade Corporates
Residential Mortgage-Backed Securities
Emerging Market Sovereign Debt
Real Estate Equity
European Equities
Emerging Market Equities
Infrastructure Equity
Collateralized Loan Obligations
Middle Market Corporate Loans
Commercial Mortgage Loans
Infrastructure Debt
Private Equity 23
Maintain DecreaseIncrease
32
27
22
21
17
16
13
12
10
8
8
7
7
7
7
3
0
-1
-3
-3
-7
-9
-10
Do Not Invest
36 4 37
28 17 1 54
24 24 2 49
25 25 4 47
22 29 5 44
18 17 2 62
17 30 4 48
18 40 6 36
20 29 10 42
13 35 5 47
16 43 8 33
25 47 18 10
12 31 5 52
13 44 6 37
12 26 5 57
4 13 1 82
8 22 8 62
12 45 13 29
14 65 17 3
16 59 19 6
11 49 18 22
9 24 18 49
9 42 19 30
Gross (%)Global Asset Allocation Changes Net (%)
Year-Over-Year Net Allocation Changes (% Net 2017 - % Net 2016)Global Top 5 by Magnitude
2018 Net Change 2017 Net Change YoY Change
Cash and Short Term Instruments -3 -15 +12
Government and Agency Debt -3 -14 +11
US Investment Grade Corporates +7 +17 -10
US Equities -7 +7 -14
High Yield Debt -10 +10 -20
Higher returning, less liquid asset classes continue to be earmarked for increased allocations on insurers’ balance sheets.

Goldman Sachs Asset Management | 15
GSAM Insurance Asset Management Insurance Survey
REGIONAL NUANCES
Globally, there remains a strong interest in equities and broadly defined private credit. In the Americas, private equity (33%) replaced 2017’s top allocation change of CLOs, likely a reflection of the relative accessibility between the asset classes. European insurers identified private equity (21%) and European equities (17%) as new top five priorities in 2018, effectively replacing infrastructure equity and real estate equity, from the 2017 survey. Asian insurers’ plans to allocate to US investment grade corporates fell from 57% in 2017 to 25% in this year’s survey, which represents the most material allocation change across regions. This change, along with the appearance of European investment grade corporates in the top five, suggests that hedging costs have become more expensive for US credit, and the net yield on European credit has become relatively more attractive, particularly for Japanese insurers.
Regional Net Asset Allocation Changes (% Increase - % Decrease)
CAPITALIZATION
Insurers generally believe that their industry peer group is adequately capitalized (69%). Regulatory capital and rating agency capital are the main capital constraints impacting insurers’ investment strategy.
Asian insurers believe that 15% of their peers are over-capitalized and 18% are under-capitalized, the lowest and highest rates, respectively, of any region. Large insurers with at least $50bn in assets mostly believe that their peer group is adequately capitalized (78%) while some smaller insurers with $5bn or less in assets feel that their peers are over-capitalized (29%).
Multi-line and life insurers in particular have a strong conviction with 85% and 77% indicating their peer group is adequately capitalized. Similar to last year, one-third (33%) of P&C/non-life insurers believe their peer groups are over capitalized, the highest rate across industries with Reinsurance (27%) closely behind. This is indicative of the excess levels of capital that existed (and still exists) prior to the 2017 catastrophe losses.
33
28
27
22
20
Commercial Mortgage Loans
Infrastructure Debt
Collateralized Loan Obligations
Infrastructure Debt
European Equities
European Investment Grade Corporates
Private Equity
Middle Market Corporate Loans
Commercial Mortgage Loans
Middle Market Corporate Loans
Private Equity
22
21
18
17
46
36
31
25
17
Infrastructure Debt
US Investment Grade Corporates
Infrastructure Equity
Private Equity
31
Americas Top 5
EMEA Top 5
Asia Pacific Top 5
New this year, European insurers intend to prioritize investment in European and private equities.

16 | Goldman Sachs Asset Management
GSAM Insurance Asset Management Insurance Survey
Do you believe your industry peer group is currently over-, adequately or under-capitalized?
Regionally, capital constraints differ most significantly between North American insurers and the rest of the world. Internal/economic capital models are the greatest constraint in the Americas (48%), whereas they were least selected in both Europe (23%) and Asia (11%). Two-thirds of European and Asian insurers chose regulatory capital as a main constraint and one-half chose rating agency capital, selection rates that were meaningfully higher than those surveyed in the Americas. In Europe, this is a reflection of insurers continued focus on implementation of Solvency II.
What do you expect to be the two main constraints affecting your investment strategy in 2018? Please select two.
INVESTMENT THEMES
Environmental, Social and Governance (ESG)
ESG factors play a role in insurers’ investment strategies and continue to develop into an important part of the investment decision making process. On a global basis, insurers who consider ESG in the investment process rose 8% year-over-year, driven by stakeholder considerations and corporate governance policies as the primary factors. Fifty-six percent of both European and Asian insurers use ESG as an investment consideration.
Over-Capitalized
AdequatelyCapitalized
Under-Capitalized
P&C/Non-LifeMulti-Line
Life
Reinsurance
>$5BN - $50BN>$50BN
$5BN or less
Health
16
33
12
2722
77
58
85
73 70
8 83 0
7
Insurer Type (%)
Over-Capitalized
AdequatelyCapitalized
Under-Capitalized
2923
18
Total Assets (%)
66 65
78
512
4
Accounting Considerations
Rating Agency Capital
Internal/EconomicCapital Model
Regulatory Capital
Americas EMEAGlobal APAC
5343
6865
4337
5249
3548
2311
3227
3149
Region (%) Total Ranked (1 and 2)
ESG is increasingly informing insurers’ investment process.

Goldman Sachs Asset Management | 17
GSAM Insurance Asset Management Insurance Survey
To what extent is ESG and/or Impact Investing an investment consideration?
Cryptocurrencies
New to the survey this year, insurers were asked for their views on cryptocurrencies. Most feel that cryptocurrencies cannot play a role in an investment portfolio (65%) while one-third think it is too early to determine (32%). When asked to characterize market implications, 39% feel that they are a potential source of innovation for financial markets, and 33% view them as a potential risk to financial markets.
Do you think cryptocurrencies can have a role in an investment portfolio?
Artificial Intelligence (AI) and Big Data
AI and Big Data’s role in the investment portfolio was another addition to the 2018 survey. While 15% of insurers responded that Big Data and AI-driven strategies have a role in their investment portfolio, another 40% are considering implementation. Insurers see the greatest potential for these technologies in improving product pricing, underwriting and claims management.
Do Big Data / AI-driven investment strategies have a role in your investment portfolio?
Not Applicable
Critical, Always Considered
One of Several Investment Considerations
Not a Primary Consideration
Americas EMEAGlobal APAC
5058
4040
3426
4247
62
149
1014
44
Region (%)
Yes
Too Early to Determine
No
Yes
Too Early to Determine
No
65
32
3
Yes
No, but considering implementing
No, they do not have a role
Yes
No, but considering implementing
No, they do not have a role 45
40
15
Big Data and AI-driven strategies have the greatest potential to improve product pricing, underwriting and claims management.

18 | Goldman Sachs Asset Management
GSAM Insurance Asset Management Insurance Survey
Big Data / AI has the greatest potential to improve my company’s:
OUTSOURCING
Similar to last year, a majority of insurers (67%) anticipate outsourcing the same amount of their investment portfolio this year. An additional 19% plan to outsource more of their portfolios. However, 38% of Asian insurers intend to outsource more of their investment portfolios over the same period. In a significant change from the 2017 survey, 16% of insurers with $5bn or less in assets plan to outsource more of their portfolios, up from 8% last year.
Do you anticipate outsourcing more, the same amount or less of your investment portfolio in the next 12 months?
Insurers are looking to third-party managers for the management of US investment grade corporates (30%), private equity (30%), emerging market debt (23%), middle market corporate loans (22%) and infrastructure debt (20%). In Asia, nearly half of insurers plan to outsource management of US investment grade corporates (49%) and private equity (45%).
Strategic asset allocation / asset liability management
Investment portfolio alpha
Risk management
Not Applicable
Product pricing / underwriting / claims management
Strategic asset allocation / asset liability management
Investment portfolio alpha
Risk management
Not Applicable
Product pricing / underwriting / claims management 40
22
19
10
9
Global (%)
Do NotOutsource
LessSameAmount
More
Global
Region (%)
1915 16
38
67 6871
55
6 7 6 48 10
6 4
Americas
APACEMEA
Do NotOutsource
LessSameAmount
More
1621 23
68 70
61
5 59 12
48
Total Assets (%)
$5bn or Less $5 - $50bn More than $50bn
An increasing number of insurers with $5 billion or less in assets plan to outsource more of their portfolios this year.
Half of Asian insurers plan to outsource management of US investment grade corporates and private equity.

Goldman Sachs Asset Management | 19
GSAM Insurance Asset Management Insurance Survey
Which of the following asset classes are you considering outsourcing to a third party asset manager in the next 12 months? Please select all that apply.
IV. ConclusionInsurers generally believe that we are nearing the end of the low rate, low volatility global environment and have adjusted their expectations accordingly. Fifty-percent of respondents feel that the investment opportunity set is getting worse, up from 36% in 2017. After a “back-pedaling” view on the credit cycle in last year’s survey, insurers now feel that the “foot is back on the pedal,” and we are moving into the later stages. By a small margin, insurers plan to lower risks across their investment portfolios, with the exception of those based in Asia who demonstrate a greater risk appetite in credit and plan to extend duration. European insurers are looking to modestly increase equity risk while reducing credit and duration risks.
In summary, the global insurance industry expressed growing skepticism about their overall investment landscape. Concerns about low yields and political events have given way to the more typical concerns of the late cycle, such as economic slowdown and recession in the US, US monetary tightening and volatility in equity and credit markets. Inflation concerns in domestic markets over the next five years have mounted to 85%, while deflation concerns over the same period have fallen to 32%. Insurers still expect growth-related asset classes (private equity, emerging market equity, US equities) to provide the highest returns and plan to increase allocations to less liquid, higher-yielding asset classes such as infrastructure debt, commercial mortgage loans and middle market corporate loans.
Commodities
Mezzanine Debt
Cash and Short-Term Instruments
Real Estate Equity
Infrastructure Equity
Collateralized Loan Obligations
Mortgage-Backed Securities
Tax-Exempt Municipal Bonds
Emerging Market Equities
European Equities
Hedge Funds
US Equities
Government and Agency Debt
High Yield Debt
European Investment Grade Corporates
Infrastructure Debt
Middle Market Corporate Loans
Emerging Market Debt
Private Equity
US Investment Grade Corporates 30
30
23
22
20
19
19
18
18
16
16
16
15
15
14
14
14
13
12
5
As we near the end of the low rate, low volatility global environment, skepticism grows surrounding the investment opportunity landscape.

Disclosures2018 survey results as of February 28, 2018.
2017 survey results as of February 22, 2017.
2016 survey information as of February 24, 2016. 2015 survey results as of February 25, 2015. 2014 survey results as of March 6, 2014. 2013 survey results as of March 5, 2013. 2012 survey results as of May 24, 2012.
This material is provided for educational purposes only and should not be construed as investment advice or an offer or solicitation to buy or sell securities.
Views and opinions expressed are for informational purposes only and do not constitute a recommendation by GSAM to buy, sell, or hold any security. Views and opinions are current as of the date of this presentation and may be subject to change, they should not be construed as investment advice.
Economic and market forecasts presented herein reflect a series of assumptions and judgments as of the date of this presentation and are subject to change without notice. These forecasts do not take into account the specific investment objectives, restrictions, tax and financial situation or other needs of any specific client. Actual data will vary and may not be reflected here. These forecasts are subject to high levels of uncertainty that may affect actual performance. Accordingly, these forecasts should be viewed as merely representative of a broad range of possible outcomes. These forecasts are estimated, based on assumptions, and are subject to significant revision and may change materially as economic and market conditions change. Goldman Sachs has no obligation to provide updates or changes to these forecasts. Case studies and examples are for illustrative purposes only.
This information discusses general market activity, industry or sector trends, or other broad-based economic, market or political conditions and should not be construed as research or investment advice. This material has been prepared by GSAM and is not financial research nor a product of Goldman Sachs Global Investment Research (GIR). It was not prepared in compliance with applicable provisions of law designed to promote the independence of financial analysis and is not subject to a prohibition on trading following the distribution of financial research. The views and opinions expressed may differ from those of Goldman Sachs Global Investment Research or other departments or divisions of Goldman Sachs and its affiliates. Investors are urged to consult with their financial advisors before buying or selling any securities. This information may not be current and GSAM has no obligation to provide any updates or changes.
THIS MATERIAL DOES NOT CONSTITUTE AN OFFER OR SOLICITATION IN ANY JURISDICTION WHERE OR TO ANY PERSON TO WHOM IT WOULD BE UNAUTHORIZED OR UNLAWFUL TO DO SO. Prospective investors should inform themselves as to any applicable legal requirements and taxation and exchange control regulations in the countries of their citizenship, residence or domicile which might be relevant. This material is provided for informational purposes only and should not be construed as investment advice or an offer or solicitation to buy or sell securities. This material is not intended to be used as a general guide to investing, or as a source of any specific investment recommendations, and makes no implied or express recommendations concerning the manner in which any client’s account should or would be handled, as appropriate investment strategies depend upon the client’s investment objectives.
GSAM does not provide legal, tax or accounting advice and therefore expresses no view as to the legal, tax or accounting treatment of the information described herein or any related transaction, nor are we providing any assurance as to the adequacy or appropriateness of this information or our procedures for your purposes. This material is not a substitute for the professional advice or services of your own financial, tax, accounting and legal advisors.
As part of the provision of insurance advisory services, Adviser expects to consult with Client with respect to certain Client assets. Adviser does not provide legal, tax or accounting advice and therefore expresses no view as to the legal, tax or accounting treatment of any related transaction, nor are we providing any assurance as to the adequacy or appropriateness of such advice for your purposes. Client acknowledges that Client is solely responsible for interpretation and compliance with all insurance and accounting laws, regulations and related requirements applicable to Client.
Past performance does not guarantee future results, which may vary.
United Kingdom and European Economic Area (EEA): In the United Kingdom, this material is a financial promotion and has been approved by Goldman Sachs Asset Management International, which is authorized and regulated in the United Kingdom by the Financial Conduct Authority.
Switzerland: For Qualified Investor use only - Not for distribution to general public. This document is provided to you by Goldman Sachs Bank AG, Zürich. Any future contractual relationships will be entered into with affiliates of Goldman Sachs Bank AG, which are domiciled outside of Switzerland. We would like to remind you that foreign (Non-Swiss) legal and regulatory systems may not provide the same level of protection in relation to client confidentiality and data protection as offered to you by Swiss law.
Canada: This material has been communicated in Canada by Goldman Sachs Asset Management, L.P. (GSAM LP). GSAM LP is registered as a portfolio manager under securities legislation in certain provinces of Canada, as a non-resident commodity trading manager under the commodity futures legislation of Ontario and as a portfolio manager under the derivatives legislation of Quebec. In other provinces, GSAM LP conducts its activities under exemptions from the adviser registration requirements. In certain provinces, GSAM LP is not registered to provide investment advisory or portfolio management services in respect of exchange-traded futures or options contracts and is not offering to provide such investment advisory or portfolio management services in such provinces by delivery of this material.
Japan: This material has been issued or approved in Japan for the use of professional investors defined in Article 2 paragraph (31) of the Financial Instruments and Exchange Law by Goldman Sachs Asset Management Co., Ltd.
Asia Pacific: Please note that neither Goldman Sachs Asset Management International nor any other entities involved in the Goldman Sachs Asset Management (GSAM) business maintain any licenses, authorizations or registrations in Asia (other than Japan), except that it conducts businesses (subject to applicable local regulations) in and from the following jurisdictions: Hong Kong, Singapore and Malaysia. This material has been issued for use in or from Hong Kong by Goldman Sachs Asset Management (Hong Kong) Limited, in or from Singapore by Goldman Sachs Asset Management (Singapore) Pte. Ltd. (Company Number: 201329851H) and in or from Malaysia by Goldman Sachs (Malaysia) Sdn Berhad (880767W).
Australia: This material is distributed in Australia and New Zealand by Goldman Sachs Asset Management Australia Pty Ltd ABN 41 006 099 681, AFSL 228948 (’GSAMA’) and is intended for viewing only by wholesale clients in Australia for the purposes of section 761G of the Corporations Act 2001 (Cth) and to clients who either fall within any or all of the categories of investors set out in section 3(2) or sub-section 5(2CC) of the Securities Act 1978, fall within the definition of a wholesale client for the purposes of the Financial Service Providers (Registration and Dispute Resolution) Act 2008 (FSPA) and the Financial Advisers Act 2008 (FAA),and fall within the definition of a wholesale investor under one of clause 37, clause 39 or clause 40 of Schedule 1 of the Financial Markets Conduct Act 2013 (FMCA) of New Zealand (collectively, a “NZ Wholesale Investor”). GSAMA is not a registered financial service provider under the FSPA. GSAMA does not have a place of business in New Zealand. In New Zealand, this document, and any access to it, is intended only for a person who has first satisfied GSAMA that the person is a NZ Wholesale Investor. This document is intended for viewing only by the intended recipient. This document may not be reproduced or distributed to any person in whole or in part without the prior written consent of GSAMA. This information discusses general market activity, industry or sector trends, or other broad based economic, market or political conditions and should not be construed as research or investment advice. The material provided herein is for informational purposes only. This presentation does not constitute an offer or solicitation to any person in any jurisdiction in which such offer or solicitation is not authorized or to any person to whom it would be unlawful to make such offer or solicitation.
South Africa: Goldman Sachs Asset Management International is authorized by the Financial Services Board of South Africa as a financial services provider.
ConfidentialityNo part of this material may, without GSAM’s prior written consent, be (i) copied, photocopied or duplicated in any form, by any means, or (ii) distributed to any person that is not an employee, officer, director, or authorized agent of the recipient.


© 2018 Goldman Sachs. All rights reserved. 126493-OTU-733840