Focus Pursue Deliver - Kalpataru Power Transmission Limited
100
ANNUAL REPORT 2011-12 Pursue Focus Deliver
Transcript of Focus Pursue Deliver - Kalpataru Power Transmission Limited

Corporate Offi ce:
‘Kalpataru Synergy’7th Floor, Opp. Grand Hyatt,Vakola, Santacruz (E),Mumbai - 400 055, India.Tel.: +91-22-3064 5000Fax: +91-22-3064 3131
Factory & Registered Offi ce:
Plot No. 101, Part III, G.I.D.C. Estate,Sector 28, Gandhinagar - 382 028,Gujarat, India.Tel.: +91-79-2321 4000Fax: +91-22-2321 1966 / 68 / 71
Website:
www..kalpatarupower.comwww.jmcprojects.comwww.kalpataru.comwww.ssll.in
ANNUAL REPORT 2011-12
PursueFocus
Deliver
A W
YA
TT
So
luti
on
(in
fo@
wya
tt.c
o.in
)P
rin
ted
by
Tac
o V
isio
ns
Pvt
. Ltd
. (w
ww
.tac
ovis
ion
s.co
m)

Forward looking statement
In this annual report we have disclosed forward looking information to enable investors to comprehend our prospects and take informed investment decisions. This report and other statements, written and oral, that we periodically make contain forward looking statements that set out anticipated results based on the management’s plan and assumptions. We have tried wherever possible to identify such statements by using words such as ̀ anticipate’, `estimate’, ̀ expects’, ̀ project’, ̀ intends’, ̀ plans’, ̀ believes’ and words of similar substance in connection with any discussion of future performance.
We cannot guarantee that these forward-looking statements will be realised, although we believe we have been prudent in assumptions. The achievement of results is subject to risks, uncertainties and even inaccurate assumptions. Should known or unknown risks or uncertainties materialise or should underlying assumptions prove inaccurate, actual results could vary materially from those anticipated, estimated or projected. Investors should bear this in mind. We undertake no obligation to publicly update any forward looking statements, whether as a result of new information, future information or otherwise.

Annual Report 2011-12 01
Board of Directors
Focus Pursue Deliver
Chairman’s Letter
Pursued Opportunitiesacross Sectors
Focused on Core Business
02
04
08
10
14
Director’s Report
Beyond Business
Delivered Consistent Results
21
20
18
ManagementDiscussion andAnalysis
Corporate Governance
Auditor’s Report
25
29
40
Balance Sheet
44
Statement of Profi t & Loss
45
Notes on
Financial
Statement
49
Consolidated Financials
67
Contents
Kalpataru Power Transmission Ltd.02
Mr. Mofatraj P. Munot Chairman
Founder, Promoter and Chairman of Kalpataru Group with fi ve decades of experience in the fi eld of real estate and property development, civil contracting and various other industries.
Mr. Sajjanraj Mehta CA, Independent Director
An eminent professional with four decades of experience in the fi eld of foreign exchange, taxation, corporate affairs and strategy.
Mr. S. P. Talwar BA, LLB, Independent Director
An eminent banker who has served as chairman of Oriental Bank of Commerce, Union Bank of India and Bank of Baroda and RBI as Deputy Governor for a period of 7 Years. He is now serving as senior advisor to YES Bank and is on the Board of various well-known companies.
Mr. Manish Mohnot CA, ICWA, Executive Director
He possess an experience of more than 17 years in areas related to infrastructure, power, consulting, banking and business development. He is also on the Board of various subsidiaries of the Company namely JMC Projects (India) Ltd. and Shree Shubham Logistics Ltd. He has been associated with a reputed multinational bank and consulting fi rms before joining us as Executive Director in 2006.
Mr. K. V. Mani BE, MBA (IMD Switzerland), Director
An expert in the T&D business with more than 45 years of experience across project management, marketing, construction and international business. He has been associated with the Company for more than a decade and served as the Managing Director during 2001 to 2009.
Mr. Narayan Seshadri CA, Independent Director
An expert with over 25 years of consulting experience in the fi eld of fi nance, accounts, tax and business strategy. He is the founder of Tranzmute Capital & Management Pvt. Ltd. established with objective of providing new ideas, management and capital to fi rst generation entrepreneurs and family businesses. Before starting his own venture, he was the Managing Partner with KPMG for their advisory services. He is also on the Board of many prominent Indian companies.
Mr. Pankaj Sachdeva BE, PGDM, Managing Director
A power sector expert with three decades of rich experience in power systems, transmission lines and project management. He has been associated with reputed multinational companies in various capacities.
Mr. Mahendra G. Punatar MS (University of Michigan),
Independent Director
A veteran in the fi eld of power transmission with over fi ve decades of extensive technical, commercial and strategic expertise.
Mr. Vimal Bhandari CA, Independent Director
A fi nance expert with more than 25 years of rich experience in the fi nancial services industry. He is currently the CEO and Managing Director of Indostar Capital Finance, an NBFC sponsored by private equity houses like Everstone and Goldman Sachs. Before this, he was the Country Head - India of the Dutch insurance major AEGON N.V. He has also served IL&FS Ltd. as an executive director for a period of 12 years and is also on the Board of many prominent Indian companies.
Mr. Parag Munot MBA (Carnegie Mellon, USA), Promoter
Director
He is the Managing Director of Kalpataru Ltd. and has been leading the Group’s real estate development and property management business for two decades. At Group level, he drives new business initiatives and provides strategic support.
Board of Directors

Executive Management Team
Mr. Kamal K. JainPresident & CFO
Mr. Dinesh B. PatelPresident & CEO (Domestic - TL Projects)
Mr. B. K. SatishPresident & CEO (Distribution Projects)
Mr. Sanjay DalmiaGroup Head (International Business)
Mr. Gyan PrakashPresident & CEO (Oil & Gas Infrastructure)
Mr. M. A. BaraiyaHead – HR & Admin
Company Secretary
Mr. Bajrang Ramdharani
Auditors
M/s. Deloitte Haskins & Sells, Ahmedabad
Legal Advisor
M/s. Singhi & Co., Ahmedabad
Bankers
Indian BankOriental Bank of CommerceUnion Bank of IndiaState Bank of IndiaEXIM BankICICI BankIDBI BankStandard Chartered BankDBS BankBNP Paribas, Abu DhabiHSBC, Qatar
Factory and Registered Offi ce
Plot No. 101, Part III, G.I.D.C. Estate, Sector 28, Gandhinagar - 382 028, Gujarat, India.
Tel No.: +91-79-2321 4000Fax No.: +91-79-2321 1966 / 68 / 71
Email: [email protected]
Corporate Offi ce
‘Kalpataru Synergy’, 7th Floor,Opp. Grand Hyatt Hotel, Vakola, Santacruz (E), Mumbai - 400 055, India.
Tel. No.: +91-22-3064 5000Fax No : +91-22-3064 3131
Website
www.kalpatarupower.comwww.jmcprojects.comwww.kalpataru.comwww.ssll.in
03Annual Report 2011-12
Kalpataru Power Transmission Ltd.04
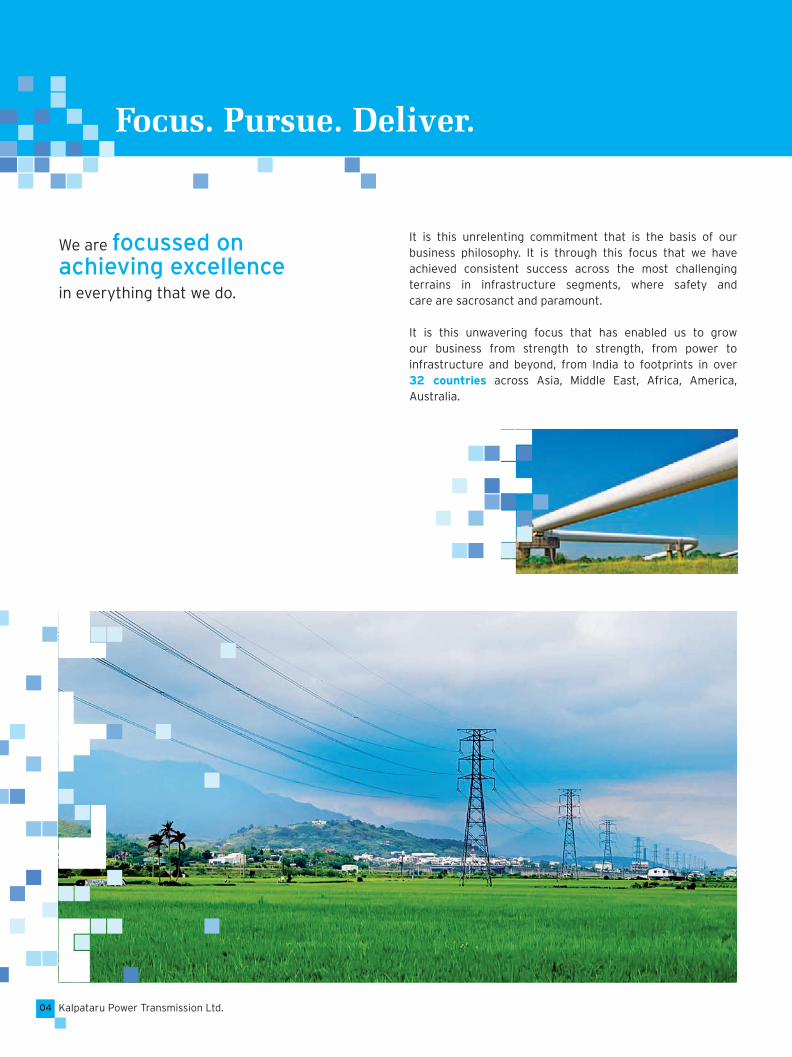
It is this unrelenting commitment that is the basis of our business philosophy. It is through this focus that we have achieved consistent success across the most challenging terrains in infrastructure segments, where safety and care are sacrosanct and paramount.
It is this unwavering focus that has enabled us to grow our business from strength to strength, from power to infrastructure and beyond, from India to footprints in over 32 countries across Asia, Middle East, Africa, America, Australia.
Focus. Pursue. Deliver.
We are focussed on achieving excellence
in everything that we do.

An unswerving focus that has ensured that each step of our business execution is well planned and delivery is consistent.
This enabled us to channelise our strategic direction with confi dence and pursue new business opportunities.
From a regional player fabricating transmission towers in early 80’s to recognised global infrastructure player offering integrated turnkey solutions in all high growth infrastructure segments like power transmission and distribution, oil and gas infrastructure, roads and bridges, railways and metros, factories and buildings, power plants, water pipelines.
Capitalising on our inherent capabilities, we have extended our offerings from construction to now partnering in India’s modernisation progress by undertaking projects on BOOT model. Our efforts in the BOOT segment are vindicated by the successful completion of our fi rst transmission line BOOT
project at Haryana in record time.
Our ability to identify and pursue unfolding opportunities has delivered consistent growth, as vindicated by our fi nancial performance year-on-year.
From revenues of less than ` 3.60 billion just 10 years back to crossing a consolidated turnover of ` 53.67 billion or one billion USD in year 2011-12.
With an order book of ̀ 117.00 billion or over two billion USD the future beckons.
Hence our commitment to “Focus”, “Pursue” and “Deliver” - three words that encapsulate the essence of our business strategy and trail our evolution. At Kalpataru Power Transmission, we dedicate our success to these well-defi ned fundamentals of business, providing the right growth impetus to our aspirations and ambitions.
05Annual Report 2011-12
Kalpataru Power Transmission Ltd.06
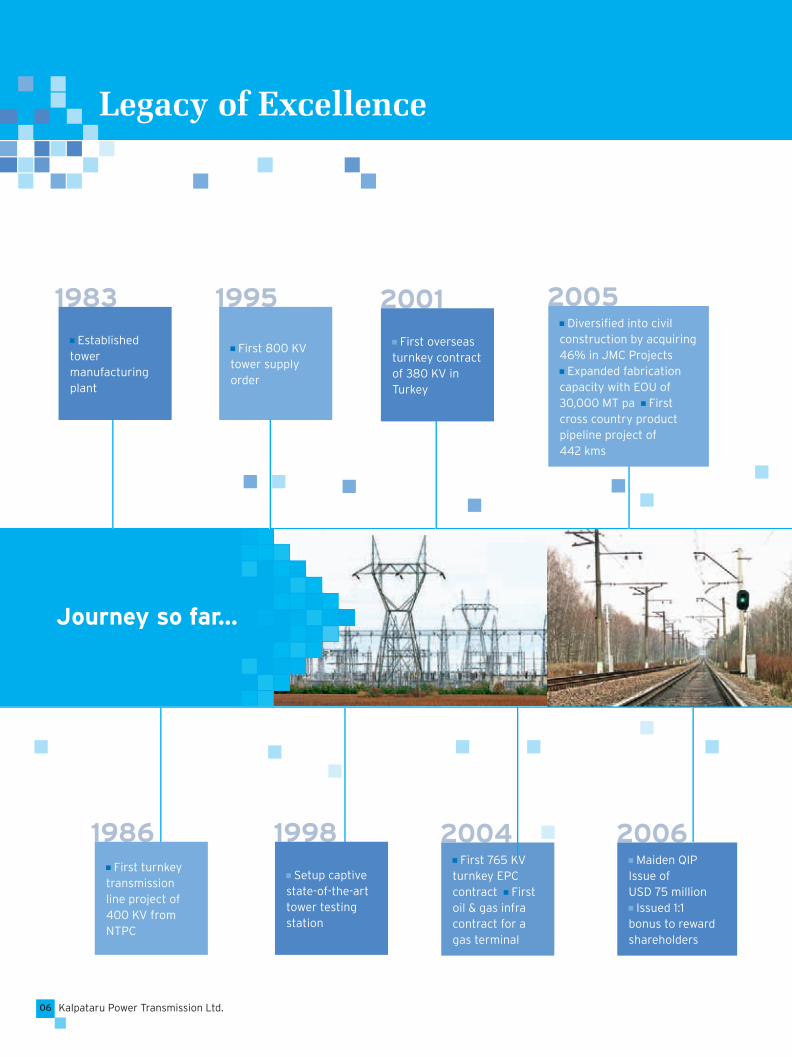
1983
Established tower manufacturing plant
1995
First 800 KV tower supply order
2004 First 765 KV
turnkey EPC contract First oil & gas infra contract for a gas terminal
2006 Maiden QIP
Issue ofUSD 75 million Issued 1:1
bonus to reward shareholders
Legacy of Excellence
1986 First turnkey
transmission line project of 400 KV from NTPC
2001
First overseas turnkey contract of 380 KV in Turkey
1998
Setup captive state-of-the-art tower testing station
2005 Diversifi ed into civil
construction by acquiring 46% in JMC Projects Expanded fabrication
capacity with EOU of 30,000 MT pa First cross country product pipeline project of 442 kms
Journey so far...
Annual Report 2011-12 07
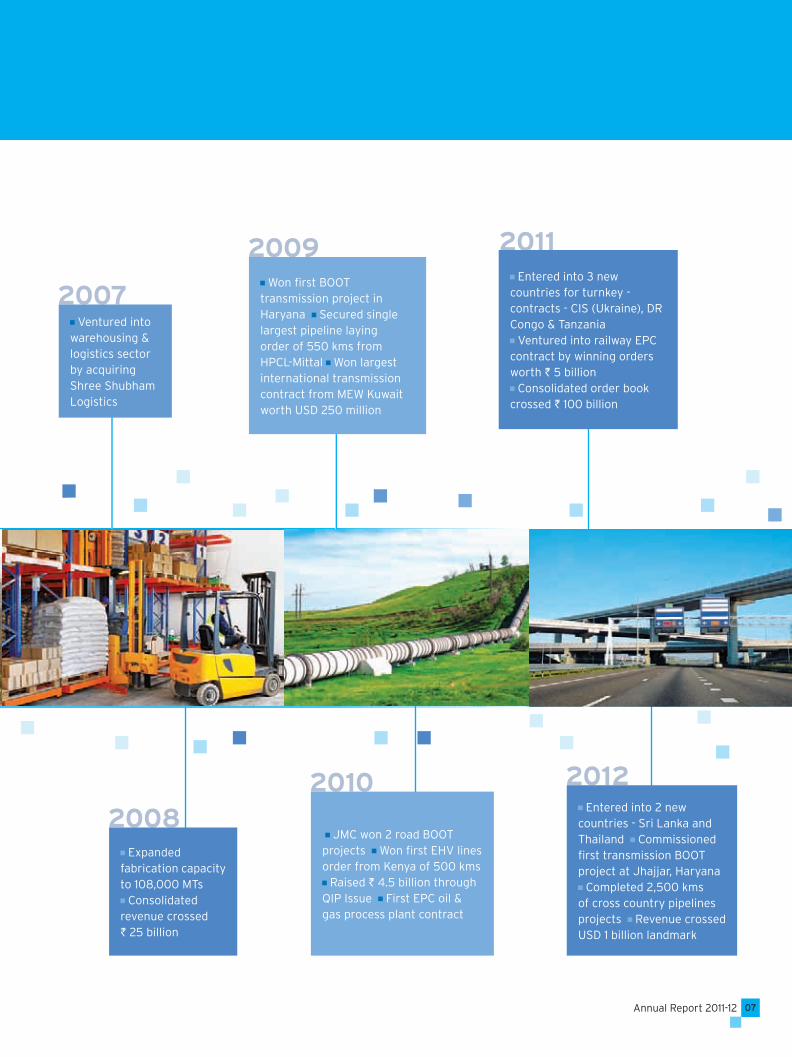
2007 Ventured into
warehousing & logistics sector by acquiring Shree Shubham Logistics
2009 Won fi rst BOOT
transmission project in Haryana Secured single largest pipeline laying order of 550 kms from HPCL-Mittal Won largest international transmission contract from MEW Kuwait worth USD 250 million
2011 Entered into 3 new
countries for turnkey - contracts - CIS (Ukraine), DR Congo & Tanzania Ventured into railway EPC
contract by winning orders worth ` 5 billion Consolidated order book
crossed ` 100 billion
2008 Expanded
fabrication capacity to 108,000 MTs Consolidated
revenue crossed ` 25 billion
2010
JMC won 2 road BOOT projects Won fi rst EHV lines order from Kenya of 500 kms Raised ` 4.5 billion through
QIP Issue First EPC oil & gas process plant contract
2012 Entered into 2 new
countries - Sri Lanka and Thailand Commissioned fi rst transmission BOOT project at Jhajjar, Haryana Completed 2,500 kms
of cross country pipelines projects Revenue crossed USD 1 billion landmark
Kalpataru Power Transmission Ltd.08
Chairman’s Letter
Dear Shareholders,It gives me immense pleasure in presenting the 31st annual report of your Company which encapsulates the performance of the year under review. As we are all aware that the current operating environment is challenging and your Company is not isolated from it. Before elaborating on these challenges, I would like to showcase various strategic initiatives undertaken over the last few years that enabled us to focus, pursue and deliver results across various economic cycles:
We have focused on long term sustainability and created a portfolio of road and transmission BOOT (Build, Own, Operate and Transfer) assets, which would provide steady cash fl ows over the next 15 to 25 years. I feel proud to announce that we have commenced commercial operations of the country’s fi rst of its kind transmission line BOOT project in Haryana. Further, your Company is also developing four road projects through its subsidiary JMC Projects with a project outlay of over ` 2,000 crores which would start generating revenues from next fi scal year onwards.
We have continued our focus on our core transmission EPC business and expanded into other high growth business verticals such as oil & gas infrastructure, power distribution, water pipeline, power plants, urban infrastructure, roads and railways.
We have focused to diversify our geographic base, client-mix and pursued opportunities in new countries. Currently your Company has footprints across 32 countries of the globe and 50% of the current order book comprises from overseas clients.
We have also diversifi ed client-mix in our domestic
transmission line business by securing good amount of orders from various private sector players and state electricity transmission utility companies.
We have focused on cost as well as volume leadership position in tower manufacturing business and have increased manufacturing capacities on three occasions over the last 6 years from 54,000 MTs to 138,000 MTs in 2012, which includes planned expansion of 30,000 MTs at Raipur in 2012. The latest capacity at Raipur is strategically located which would bring cost effi ciencies. Additionally, to strengthen our international presence we are also contemplating on expanding manufacturing capacities overseas.
We remain focused on tower testing activity as a critical element in the value chain of EPC contracting and have a dedicated tower testing station with most advanced technologies. Till date, this station has tested over 250 towers of 400 KV to 1200 KV for both domestic and international clients.
We have pursued high growth business opportunity in the warehousing and logistics sector through our subsidiary, Shree Shubham Logistics Limited. In just 4 years of entering into the business, your Company features amongst the largest private players in this sector with a capacity of around 600 thousnd MTs. We further aim to expand this to around 1.3 million MTs in the next 2 to 3 years.
These focused initiatives have helped us deliver robust growth in past 5 years during which we achieved a three-
Annual Report 2011-12 09
fold increase in our consolidated revenues which crossed the USD 1 billion mark this year. Additionally our consolidated order book witnessed an over four fold increase to cross USD 2 billion mark, which would provide steady growth in next few years. The other biggest enabler of such results is our employee strength of over 5,000 professionals. Apart from the number of employees, it is our ethos of employee engagement, empowerment and long term commitment which would enable similar growth trajectory.
Over the years, customers have continued to bestow their faith in your Company which is endorsed by securing high value orders. These include orders of USD 180 million each from Ukraine and Congo and USD 225 million from Kuwait which has been completed successfully in the previous year.
Challenges
The year under review was not short on challenges faced, which include stiff competition from local as well as global players, hardening interest rates, volatility in raw material prices, currency fl uctuations, availability of labor and several execution challenges beyond our control.
Notwithstanding these challenges, your Company’s topline has reached above USD 1 billion mark on consolidated basis. On standalone basis, the top line growth was not at par with expectations due to several external factors beyond our control. Although we still followed our core philosophy of bottom line driven approach and maintained our margin leadership position though stringent processes and
fi nancial control which is aptly refl ected in our well-funded balance sheet with among the lowest debt-equity ratio in the industry.
We always remain cautious on the associated risks in our businesses across varied sectors and geographies and pursue risk mitigation approach to the extent possible.
Future Outlook
Moving forward, given the changing business environment its imperative that we continue our focus on execution, cost reduction and enhancing productivity as these initiatives have always helped us maintain a competitive advantage. To capitalise on various large business opportunities, your Company is pursuing its strategy to partner with strong strategic and fi nancial players. With our strong management bandwidth, sound balance sheet, rich experience in manufacturing and execution, undisputed reputation for quality and service, we are well placed than ever to face all upcoming challenges.
Acknowledgements
I take this opportunity to thank the shareholders for their valuable support, my colleagues on the Board for their enlightened counsel, all our prestigious clients for their faith, the Government and its various agencies and our lenders for their kind support. I place on record my appreciation for the dedication, commitment and hard work put in by the employees of the company at all levels.
Mofatraj P. MunotChairman
“
”
Focused initiatives have helped us deliver robust growth in past 5 years during which we achieved a three-fold increase in our consolidated revenues which crossed the USD 1 billion mark this year.
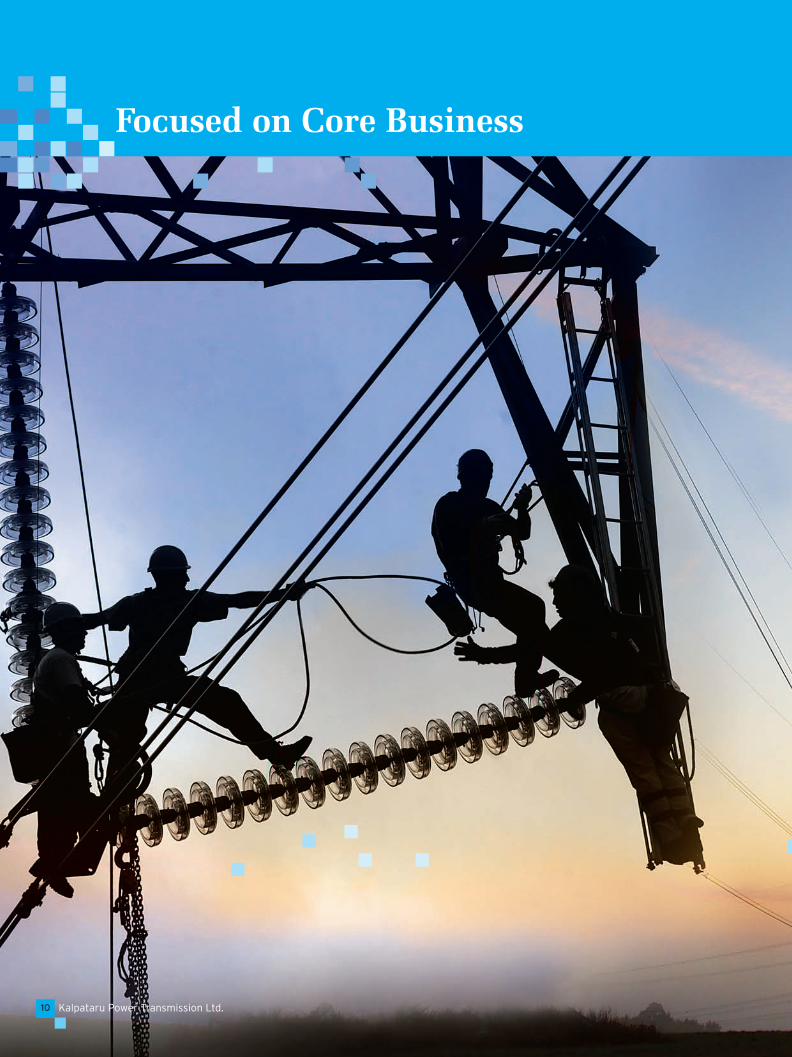
Focused on Core Business
Kalpataru Power Transmission Ltd.10
11Annual Report 2011-12
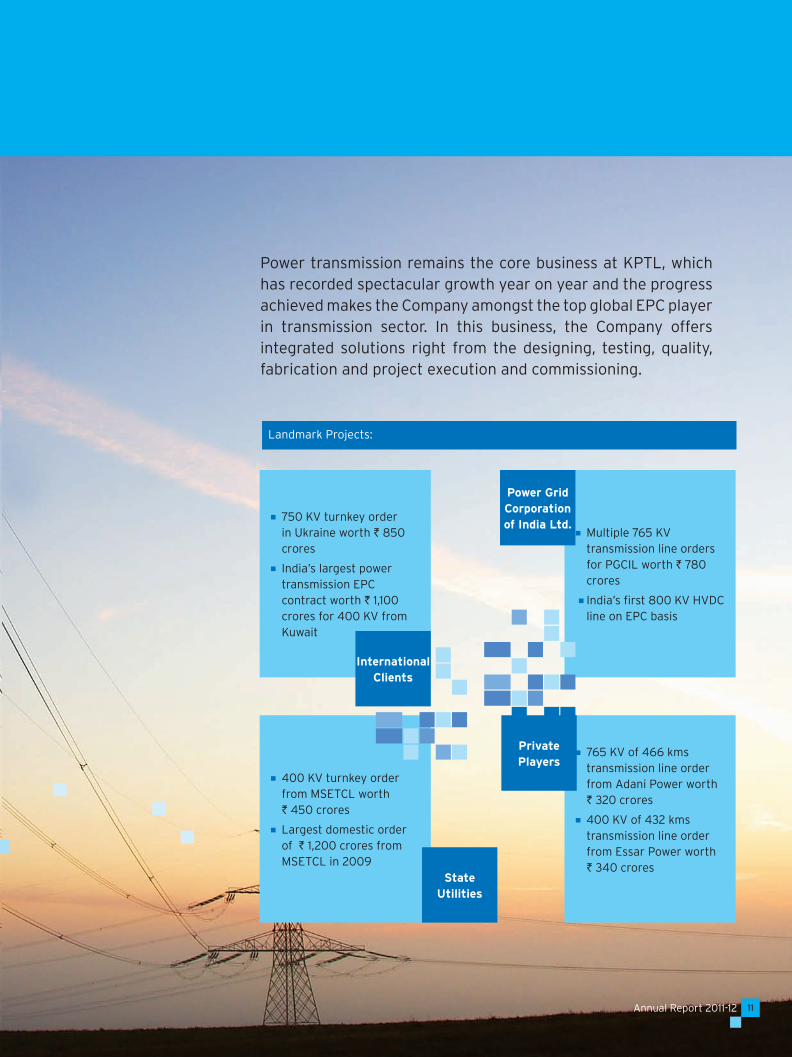
Power transmission remains the core business at KPTL, which has recorded spectacular growth year on year and the progress achieved makes the Company amongst the top global EPC player in transmission sector. In this business, the Company offers integrated solutions right from the designing, testing, quality, fabrication and project execution and commissioning.
400 KV turnkey order from MSETCL worth ` 450 crores
Largest domestic order of ` 1,200 crores from MSETCL in 2009
765 KV of 466 kms transmission line order from Adani Power worth ` 320 crores
400 KV of 432 kms transmission line order from Essar Power worth ` 340 crores
750 KV turnkey order in Ukraine worth ` 850 crores
India’s largest power transmission EPC contract worth ` 1,100 crores for 400 KV from Kuwait
InternationalClients
State Utilities
Multiple 765 KV transmission line orders for PGCIL worth ` 780 crores
India’s fi rst 800 KV HVDC line on EPC basis
Power Grid Corporation of India Ltd.
Private Players
Landmark Projects:

Kalpataru Power Transmission Ltd.12
Focused on Core Business
To channelise its focus towards its power transmission business, the Company is continuously building up its infrastructure and project management skills to deliver turnkey solutions. This is ably backed by:
Apart from towers designing, testing, fabrication and supply, the Company has also proven its mettle in turnkey projects in over 15 countries. KPTL has successfully completed over 14,000 kms of extra-high voltage lines in India and international countries and has supplied and installed the country’s fi rst 800 KV HVDC line.
Over the years, the Company has also build capabilities to supply over 120,000 MTs of towers, erect over 100,000 MTs of transmission line towers and string over 2,500 CKM of conductors on transmission lines, on annual basis. This has helped the Company emerge as one of the largest power transmission EPC contractor. Adding to the Company’s engineering feat is the qualifi cation to execute projects upto 1200 KV in any kind of terrain.
The success in this business has moved a few notches higher on account of the completion of KPTL’s fi rst BOOT project at Jhajjar, Haryana. The project was completed in a record time of 15 months despite several execution challenges. This feat strongly endorses the Company’s focus towards it power transmission business.
A testing station plays a critical role in the power transmission business. Backing this is the Company’s world class testing station which has tested over 250 towers for both domestic and international clients. The strategically located ISO certifi ed plants have delivered over 40,000 towers across globe and also became the largest supplier of lattice towers to American markets by supplying over 15,000 MTs in a span of 2 years and over 30,000 MTs orders are in progress.
Further, endorsing the Company’s capability to accept challenges is the timely completion of supplying and erecting one of its largest projects encompassing 1,000 kms of 400 KV line (Rihand) of 46,000 MTs for Power Grid, India. KPTL also secured and completed its highest value international power transmission contract worth over USD 225 million.
Design Centre
State -of-the-art design capabilities with highly qualifi ed & experienced
engineering experts
Access to the best of software’s like PLS, STADD III, iTower for tower design, PLS CADD for profi ling, AutoCAD and
BoCAD for drawing/detailing
R&D and Testing Centre
Among the largest tower testing and R&D centre across the globe
Testing capability of upto 1200 KV tower
Helicopter simulation facility to test upto 85 meters tower
Manufacturing
Amongst the largest tower fabricator in the world leading to cost effi ciency and
economies of scale
Integrated ISO certifi ed manufacturing plant of 1,08,000 MTs in Gujarat Operating at full utilisation levels
Turnkey Solutions
Executed turnkey projects in 15 countries
Proven track record in all diffi cult terrains
Managing contract workforce of around 15,000 employees

Lastly, complementing its transmission and distribution portfolio is its capability to design and execute turnkey solutions of EHV/HV substations. This makes KPTL a one stop shop for providing end to end solutions for transmission systems, covering transmission lines, substations and distribution systems globally.
13Annual Report 2011-12
Power Distribution
Whilst the Company’s achievements in the Indian and international markets for transmission lines are impressive, KPTL has also clocked remarkable success in the distribution sector. Over 300,000 BPL connections and more than 10,000 CKM of distribution lines have been laid out on EPC basis. New substations, augmentations of existing sub-stations and construction of bays to support these 10,000 CKM of distribution lines, have also been constructed by KPTL.
Execution
Another key aspect contributing towards the Company’s success is focused execution which is an unrelenting commitment and foundation of the Company’s business philosophy. This focus has helped KPTL in executing projects in a cost, quality and time effective manner, helping it feature as the most competitive player in the sector.
In a year packed with daunting challenges, it was the Company’s focus on execution that ensured timely completion of projects and increase in order book to record levels.
The Company is conscious that human resources form the backbone of its execution capabilities. With this philosophy, the Company has built its team of professionals, attracting several industry stalwarts to steer its business odyssey to greater heights.

Pursued Opportunities across Sectors
Kalpataru Power Transmission Ltd.14

Over the years, exemplary growth in the infrastructure sector has triggered a wave of opportunities unfolding across key segments of infrastructure development. From Power T&D to Oil & Gas to Railways to Asset Ownership (BOOT & Warehousing), the potential for the next level of growth and progress is immense. Identifying this, the Company has expanded its presence across these high growth verticals. KPTL on account of its proactive management and judicious approach is ideally positioned to capitalise on the opportunities growing, across key segments of its business.
15Annual Report 2011-12
Diversifi ed Infrastructure Presence:
Power generation, transmission & distribution
Oil & gas infrastructure
Factories & buildings
Roads
Railways
Urban infrastructure
Biomass plant
Transmission BOOT project
Road BOOT projects
Real estate developmental projects
Agri-logistic parks & warehouses
EPC Business
Long-term Ownership Assets
Kalpataru Power Transmission Ltd.16
Pursued Opportunities across Sectors
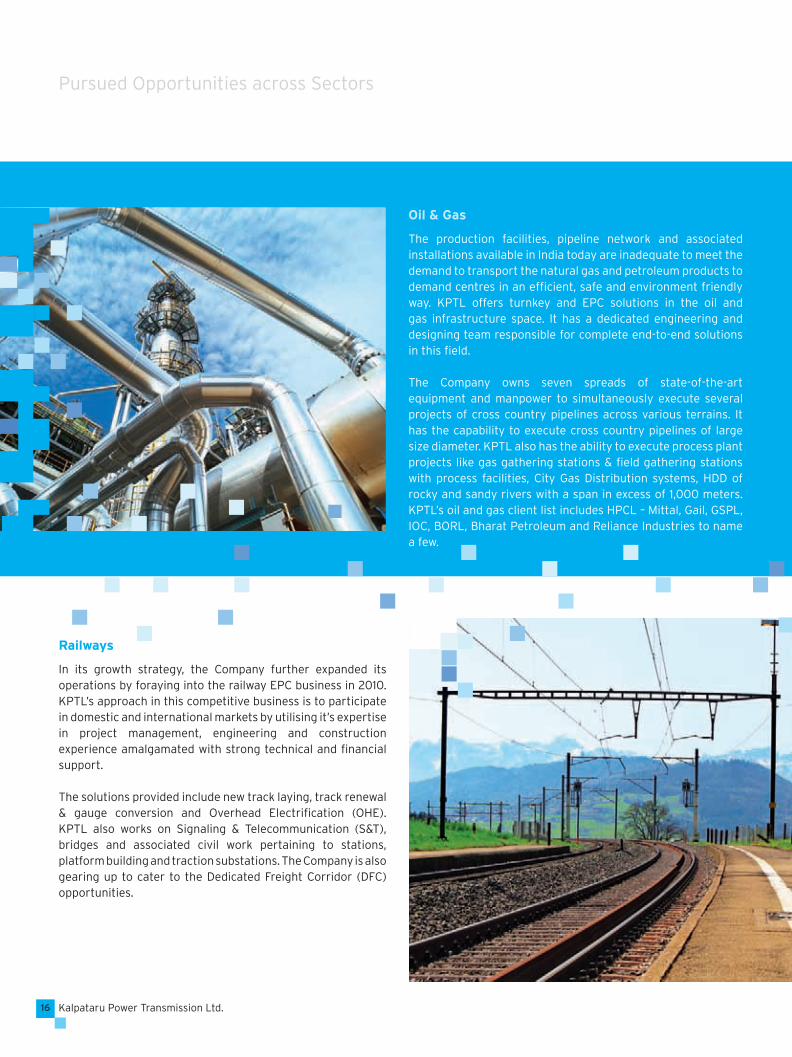
Oil & Gas
The production facilities, pipeline network and associated installations available in India today are inadequate to meet the demand to transport the natural gas and petroleum products to demand centres in an effi cient, safe and environment friendly way. KPTL offers turnkey and EPC solutions in the oil and gas infrastructure space. It has a dedicated engineering and designing team responsible for complete end-to-end solutions in this fi eld.
The Company owns seven spreads of state-of-the-art equipment and manpower to simultaneously execute several projects of cross country pipelines across various terrains. It has the capability to execute cross country pipelines of large size diameter. KPTL also has the ability to execute process plant projects like gas gathering stations & fi eld gathering stations with process facilities, City Gas Distribution systems, HDD of rocky and sandy rivers with a span in excess of 1,000 meters. KPTL’s oil and gas client list includes HPCL – Mittal, Gail, GSPL, IOC, BORL, Bharat Petroleum and Reliance Industries to name a few.
Railways
In its growth strategy, the Company further expanded its operations by foraying into the railway EPC business in 2010. KPTL’s approach in this competitive business is to participate in domestic and international markets by utilising it’s expertise in project management, engineering and construction experience amalgamated with strong technical and fi nancial support.
The solutions provided include new track laying, track renewal & gauge conversion and Overhead Electrifi cation (OHE). KPTL also works on Signaling & Telecommunication (S&T), bridges and associated civil work pertaining to stations, platform building and traction substations. The Company is also gearing up to cater to the Dedicated Freight Corridor (DFC) opportunities.
17Annual Report 2011-12
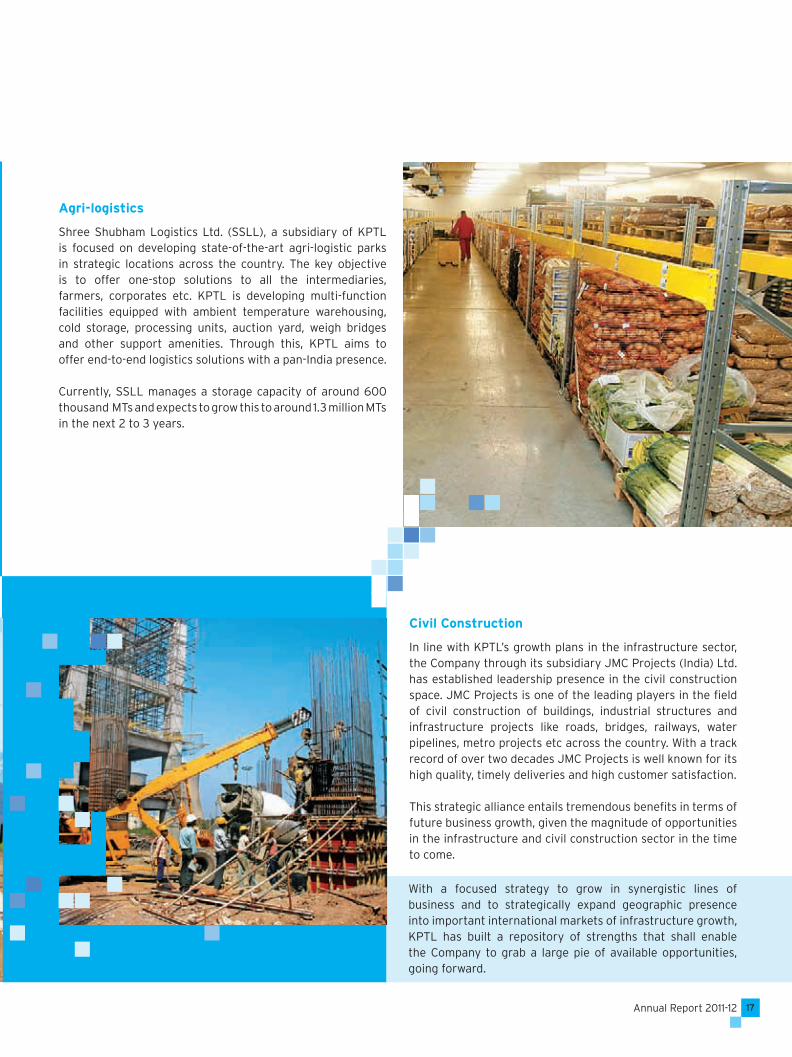
Agri-logistics
Shree Shubham Logistics Ltd. (SSLL), a subsidiary of KPTL is focused on developing state-of-the-art agri-logistic parks in strategic locations across the country. The key objective is to offer one-stop solutions to all the intermediaries, farmers, corporates etc. KPTL is developing multi-function facilities equipped with ambient temperature warehousing, cold storage, processing units, auction yard, weigh bridges and other support amenities. Through this, KPTL aims to offer end-to-end logistics solutions with a pan-India presence.
Currently, SSLL manages a storage capacity of around 600 thousand MTs and expects to grow this to around 1.3 million MTs in the next 2 to 3 years.
Civil Construction
In line with KPTL’s growth plans in the infrastructure sector, the Company through its subsidiary JMC Projects (India) Ltd. has established leadership presence in the civil construction space. JMC Projects is one of the leading players in the fi eld of civil construction of buildings, industrial structures and infrastructure projects like roads, bridges, railways, water pipelines, metro projects etc across the country. With a track record of over two decades JMC Projects is well known for its high quality, timely deliveries and high customer satisfaction.
This strategic alliance entails tremendous benefi ts in terms of future business growth, given the magnitude of opportunities in the infrastructure and civil construction sector in the time to come.
With a focused strategy to grow in synergistic lines of business and to strategically expand geographic presence into important international markets of infrastructure growth, KPTL has built a repository of strengths that shall enable the Company to grab a large pie of available opportunities, going forward.
Kalpataru Power Transmission Ltd.18
Delivered Consistent Results
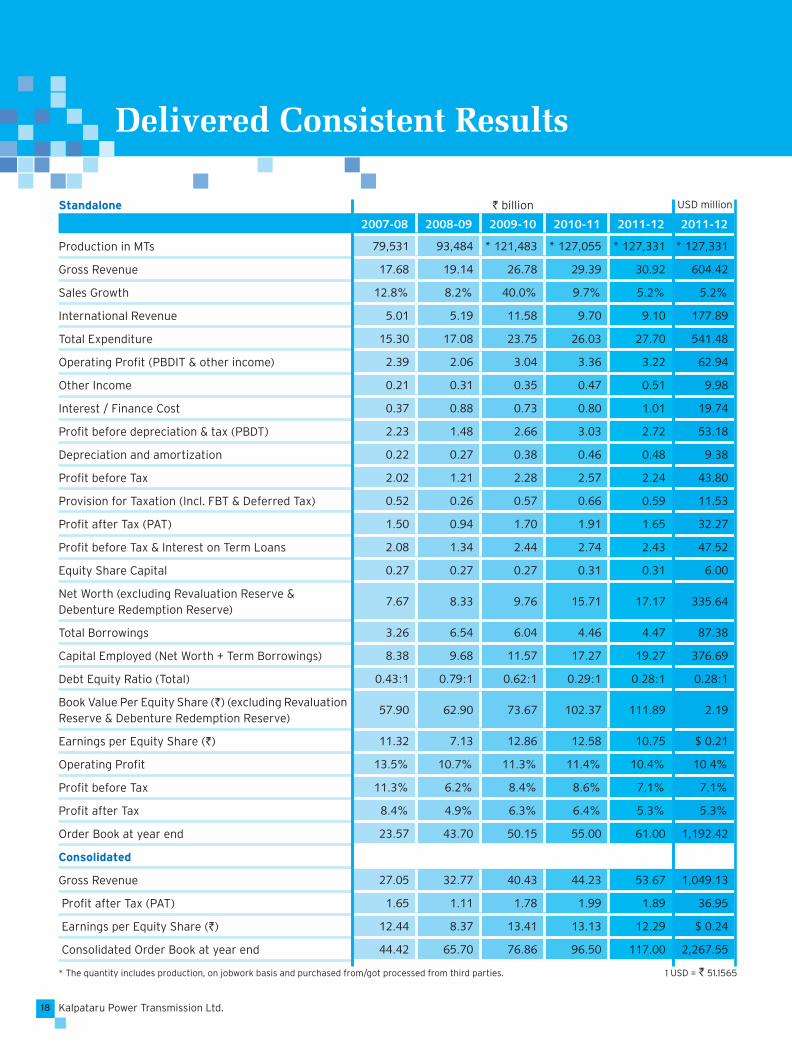
2007-08 2008-09 2009-10 2010-11 2011-12 2011-12
Production in MTs 79,531 93,484 * 121,483 * 127,055 * 127,331 * 127,331
Gross Revenue 17.68 19.14 26.78 29.39 30.92 604.42
Sales Growth 12.8% 8.2% 40.0% 9.7% 5.2% 5.2%
International Revenue 5.01 5.19 11.58 9.70 9.10 177.89
Total Expenditure 15.30 17.08 23.75 26.03 27.70 541.48
Operating Profi t (PBDIT & other income) 2.39 2.06 3.04 3.36 3.22 62.94
Other Income 0.21 0.31 0.35 0.47 0.51 9.98
Interest / Finance Cost 0.37 0.88 0.73 0.80 1.01 19.74
Profi t before depreciation & tax (PBDT) 2.23 1.48 2.66 3.03 2.72 53.18
Depreciation and amortization 0.22 0.27 0.38 0.46 0.48 9.38
Profi t before Tax 2.02 1.21 2.28 2.57 2.24 43.80
Provision for Taxation (Incl. FBT & Deferred Tax) 0.52 0.26 0.57 0.66 0.59 11.53
Profi t after Tax (PAT) 1.50 0.94 1.70 1.91 1.65 32.27
Profi t before Tax & Interest on Term Loans 2.08 1.34 2.44 2.74 2.43 47.52
Equity Share Capital 0.27 0.27 0.27 0.31 0.31 6.00
Net Worth (excluding Revaluation Reserve & Debenture Redemption Reserve)
7.67 8.33 9.76 15.71 17.17 335.64
Total Borrowings 3.26 6.54 6.04 4.46 4.47 87.38
Capital Employed (Net Worth + Term Borrowings) 8.38 9.68 11.57 17.27 19.27 376.69
Debt Equity Ratio (Total) 0.43:1 0.79:1 0.62:1 0.29:1 0.28:1 0.28:1
Book Value Per Equity Share (`) (excluding Revaluation Reserve & Debenture Redemption Reserve)
57.90 62.90 73.67 102.37 111.89 2.19
Earnings per Equity Share (`) 11.32 7.13 12.86 12.58 10.75 $ 0.21
Operating Profi t 13.5% 10.7% 11.3% 11.4% 10.4% 10.4%
Profi t before Tax 11.3% 6.2% 8.4% 8.6% 7.1% 7.1%
Profi t after Tax 8.4% 4.9% 6.3% 6.4% 5.3% 5.3%
Order Book at year end 23.57 43.70 50.15 55.00 61.00 1,192.42
Consolidated
Gross Revenue 27.05 32.77 40.43 44.23 53.67 1,049.13
Profi t after Tax (PAT) 1.65 1.11 1.78 1.99 1.89 36.95
Earnings per Equity Share (`) 12.44 8.37 13.41 13.13 12.29 $ 0.24
Consolidated Order Book at year end 44.42 65.70 76.86 96.50 117.00 2,267.55
* The quantity includes production, on jobwork basis and purchased from/got processed from third parties. 1 USD = ` 51.1565
` billion USD millionStandalone

19Annual Report 2011-12
Standalone
Consolidated
20
07-
08
20
07-
08
20
07-
08
20
07-
08
20
08
-09
20
08
-09
20
08
-09
20
08
-09
20
10-1
12
010
-11
20
10-1
12
010
-11
20
11-1
22
011
-12
20
11-1
22
011
-12
Gross revenues (` billion)
Gross revenues (` billion)
PAT (` billion)
PAT (` billion)
20
09
-10
20
09
-10
20
09
-10
20
09
-10
30.92
53.67
1.65
1.89
29.39
44.23
1.91
1.99
26.78
40.43
1.7
1.78
19.14
32.77
0.94
1.11
17.68
27.05
1.5
1.65
20
07-
08
20
07-
08
20
08
-09
20
08
-09
20
10-1
12
010
-11
20
11-1
22
011
-12
Order Book (` billion)
Order Book (` billion)
20
09
-10
20
09
-10
61.00
117.00
55.00
96.50
50.15
76.86
43.70
65.70
23.57
44.42
Kalpataru Power Transmission Ltd.20
Beyond Business
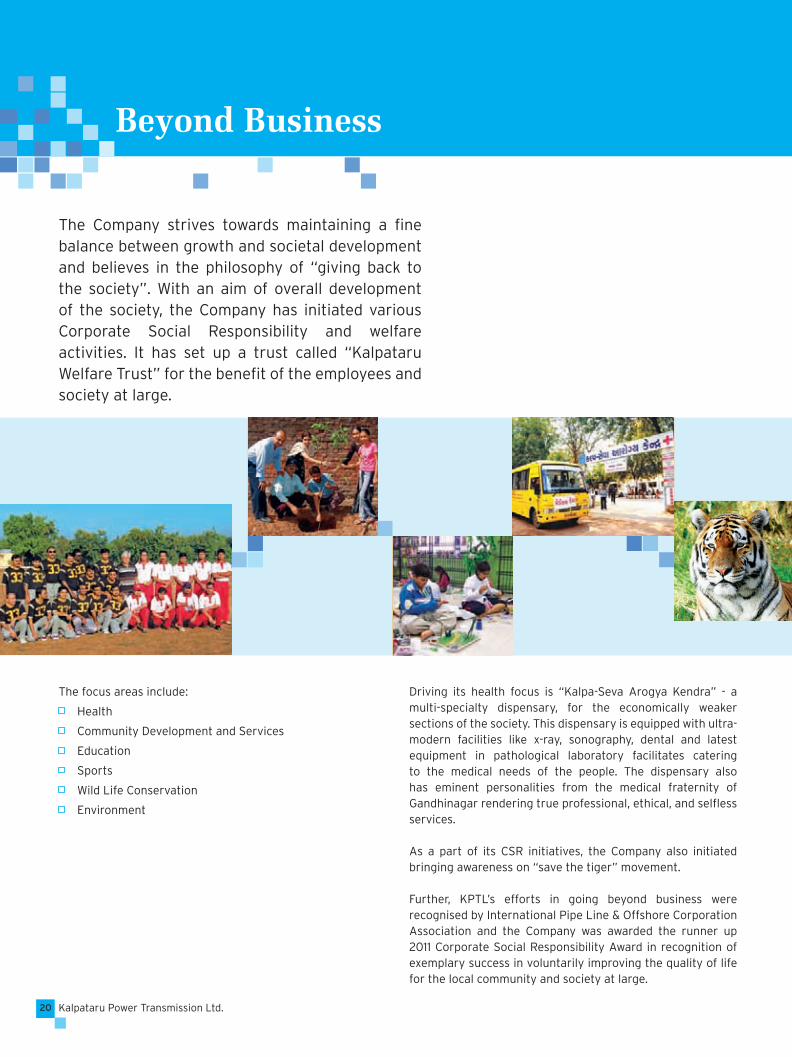
The Company strives towards maintaining a fi ne balance between growth and societal development and believes in the philosophy of “giving back to the society”. With an aim of overall development of the society, the Company has initiated various Corporate Social Responsibility and welfare activities. It has set up a trust called “Kalpataru Welfare Trust” for the benefi t of the employees and society at large.
The focus areas include:
Health
Community Development and Services
Education
Sports
Wild Life Conservation
Environment
Driving its health focus is “Kalpa-Seva Arogya Kendra” - a multi-specialty dispensary, for the economically weaker sections of the society. This dispensary is equipped with ultra-modern facilities like x-ray, sonography, dental and latest equipment in pathological laboratory facilitates catering to the medical needs of the people. The dispensary also has eminent personalities from the medical fraternity of Gandhinagar rendering true professional, ethical, and selfl ess services.
As a part of its CSR initiatives, the Company also initiated bringing awareness on “save the tiger” movement.
Further, KPTL’s efforts in going beyond business were recognised by International Pipe Line & Offshore Corporation Association and the Company was awarded the runner up 2011 Corporate Social Responsibility Award in recognition of exemplary success in voluntarily improving the quality of life for the local community and society at large.

21Annual Report 2011-12
Directors’ Report
TO,
THE MEMBERS,
Your Directors have pleasure to present the 31st ANNUAL
REPORT on the business and operations of your company
together with the Audited Statement of Accounts for the year
ended March 31, 2012.
FINANCIAL RESULTS (` in billion)
2011-2012 2010-2011
Total Revenue 31.43 29.85
Profi t before Depreciation 2.72 3.03
Less: Depreciation 0.48 0.46
Profi t before Tax 2.24 2.57
Less: Provision for Tax including Deferred Tax
0.59 0.66
Net Profi t after Tax 1.65 1.91
Add: Surplus brought forward from previous year
6.13 4.87
Profi t available for appropriation:
7.78 6.78
APPROPRIATIONS :
Transfer to General Reserve
0.30 0.30
Transfer to Debenture Redemption Reserve
0.07 0.09
Proposed Dividend on Equity Shares
0.23 0.23
Corporate Tax on Proposed Dividend
0.03 0.03
Balance carried to Balance Sheet
7.15 6.13
TOTAL 7.78 6.78
DIVIDEND
Your Directors are also pleased to recommend dividend for
the year ended March 31, 2012 @ ` 1.50 (75%) per equity
share of `2 each considering overall profi tability and growth
of Company.
FINANCIAL & OPERATIONS REVIEW
The gross revenue of the Company grew by 5.3% to ` 31.43
billion (USD 614 million) as against ` 29.85 billion (USD 584
million) in the previous year. Total Export Turnover (including
overseas projects) was ` 9.10 billion (USD 178 million) or
approx.29% of revenues in 2011-12.
The net profi t for the year stood at ` 1.65 billion (USD 32 million) as against ` 1.91 billion ( USD 37 million) in 2010-11.
Your company has supplied 130,903 MTs of Transmission Line Towers as against 129,217 MTs in preceding year, which is higher by 1.3%.
Your company has an order book of over ` 61 billion (USD 1.17 billion) excluding fairly placed bids.
Having 108,000 MTs of production capacity at Gandhinagar, Gujarat, your company has planned to expand its capacity by further 30,000 MTs by creating ultra modern state of the art manufacturing capacity near Raipur in the state of Chhattisgarh to cater the demand in eastern and southern region of India having promising market going forward. It is expected to achieve the Commercial Production by October, 2012.
Transmission BOOT Project
Company has successfully completed and commissioned its fi rst transmission BOOT project in the month of March, 2012, which was under SPV namely, Jhajjar KT Transco Pvt. Ltd. It is fi rst state level DBFOT project, which is completed by your company in joint venture.
The project was completed in record time of 15 months, overcoming all site level execution challenges. SPV has initial concession period of 25 years with an options of extension for another 10 years. The SPV will receive terminal value equivalent to 30 months revenue i.e. approx. ` 1.35 billion at the end of 25th year of concession period in case the concession period does not get extended to 35 years.
SUBSIDIARIES
JMC Projects (India) Ltd. & its subsidiaries (JMC):
JMC has reported consolidated revenue of ` 20.83 billion (USD 407 million) as against ` 13.83 billion (USD 270 million), which is 51% higher than the previous year. Profi t before tax as well as profi t after tax stood at ` 576 million and ` 452 million as against ` 476 million and ` 355 million respectively.
JMC is executing 2 DBFOT basis road project for NHAI and also in receipt of two more DBFOT basis projects during reporting period which are 1. BOT Road project from Nagpur to Wainganga on Toll basis in Maharashtra for NHAI & 2. BOT Road project - 4 Laning of Rewa- MP /UP Border on NH7 Road in Madhya Pradesh for NHAI
JMC has a strong order book exceeding ` 56 billion (USD 1.09 billion). The company has invested ` 2.19 billion and holds 67.19% stake in JMC.

Kalpataru Power Transmission Ltd.22
Shree Shubham Logistics Ltd (SSLL):
In reporting period, SSLL has achieved a turnover of ` 2.04 billion as against ` 1.36 billion, registering a growth of 49%. SSLL reported profi t of ` 32 million as against ` 24 million.
SSLL has done fi nancial closure of its 2nd phase of expansion in Rajasthan, Madhya Pradesh and Maharashtra at cost of around ` 2.80 billion, which is expected to be over by June, 2013.
At the year end, investment of your company in SSLL was ` 1.35 billion as equity shares, preference share capital and loan. SSLL is an 85% Subsidiary of your company.
Energylink (India) Ltd (ELL):
ELL plans to foray into real estate business and for which EIL has 100% subsidiary named, Saicharan Properties Limited which has land to implement commercial cum retail project in Indore. This project is expected to commence construction in 2013.
At the year end, investment of your company in ELL was ̀ 1.53 billion as capital and loan. ELL is a Wholly Owned Subsidiary of your company.
Amber Real Estate Ltd. (Amber):
Amber is in process of creating leasing space for IT/Software Technology park at Thane, Mumbai is expected to be completed by June, 2012. At year end, investment of your company in Amber was ` 523 million as capital and loan and it is a Wholly Owned Subsidiary of your company.
Adeshwar Infrabuild Ltd. (Adeshwar):
Adeshwar was incorporated as wholly owned subsidiary to venture into new areas of business which can be conveniently or advantageously run by company in the coming years which may include mining, cement etc. At the year end, investment of your company in Adeshwar was ` 2.55 million as capital and loan. It is a Wholly Owned Subsidiary of your company.
Jhajjar Power Transmission Private Ltd.(JPTPL)
JPTPL was incorporated as a subsidiary company for doing transmission project on BOOT, BOOM, DBFOT basis. At the year end, investment in JPTPL was ̀ 0.51 lacs as share capital. JPTPL is an 51% subsidiary of your company.
Kalpataru Power Transmission-USA, INC.
This company was incorporated as a 100% subsidiary of your company to increase its focus on American markets with local presence. Total income of the company for the year was ` 117 million with profi t of ` 1.08 million. Your company has invested ` 22.8 million as capital and loan in this company.
Kalpataru SA (Proprietary) Ltd.:
This Company was formed in South Africa to bid for EPC Power Transmission jobs in South Africa. During the year, this Company become wholly owned subsidiary of your Company
on purchase of shares from erstwhile JV partner. Your company made investment of ` 6.4 million towards equity capital and other expenses.
Kalpataru Power Transmission Nigeria Ltd.:
This Company was incorporated as a 100% subsidiary of your Company to explore the Power Transmission market in Nigeria. Your company made an investment of ` 7.6 million towards equity capital and loan.
Kalpataru Power Transmission (Mauritius) Ltd.(KPTML):
This Company is a 100% subsidiary, in which your Company has invested ` 17 million as capital and loan.
During the year, this Company has incorporated a 100% wholly owned subsidiary in Dubai, namely Kalpataru Power JLT in DMCC of UAE, in which KPTML has invested ` 14 million as capital and loan.
Kalpataru Power Transmission Netherland International BV:
This company is incorporated as 100% subsidiary of your Company, in which your company has invested ` 1.2.million as capital and loan.
STATEMENT OF DIRECTORS’ RESPONSIBILITY
Pursuant to requirement under Section 217(2AA) of the Companies Act, 1956, Directors based on representations received from Operating Management, confi rm:
(i) That in the preparation of the annual accounts for the fi nancial year ended March 31, 2012, the applicable accounting standards had been followed;
(ii) That Directors had selected such accounting policies and applied them consistently and made judgments and estimates that are reasonable and prudent so as to give a true and fair view of the state of affairs of the company at the end of the fi nancial year and of the profi t of the company for the year;
(iii) That the Directors had taken proper and suffi cient care for the maintenance of adequate accounting records in accordance with the provisions of the Companies Act, 1956 for safeguarding the assets of the company and for preventing and detecting fraud and other irregularities;
(iv) That the Directors had prepared the annual accounts for the fi nancial year ended March 31, 2012 on a “going concern” basis.
Corporate Governance
As per Clause 49 of listing agreement with the Stock Exchanges, a separate section on Corporate Governance and Management Discussion and Analysis, confi rming compliance is set out in Annexure forming part of this report.
Your company has been practicing principles of good corporate governance over the years. Your Board of Directors

23Annual Report 2011-12
supports broad principles of corporate governance. In addition to basic governance issues, Board lays strong emphasis on transparency, accountability and integrity.
DIRECTORS
In accordance with provisions of the Companies Act, 1956 and the Articles of Association of your company, Mr. Vimal Bhandari, Mr. Narayan Seshadri, Mr. Parag Munot are liable to retire by rotation at ensuing Annual General Meeting and being eligible they have offered themselves for re-appointment.
CONSOLIDATED FINANCIAL STATEMENTS
Your Directors have pleasure in attaching the Audited Consolidated Financial Statements pursuant to Listing Agreement entered into with the Stock Exchanges and prepared in accordance with Accounting Standards prescribed by the Institute of Chartered Accountants of India.
SUBSIDIARIES
In accordance with the general circular issued by the Ministry of Corporate Affairs, Government of India, the Balance Sheet, Profi t and Loss Account and other documents of the subsidiary companies are not being attached with the Balance Sheet of the Company. The Company will make available the Annual Accounts of the subsidiary companies and the related detailed information to any member pf the Company who may be interested in obtaining the same. The annual accounts of the subsidiary companies will also be kept open for inspection at the Registered Offi ce of the Company and that of the respective subsidiary companies. The Consolidated Financial Statements presented by the Company include the fi nancial results of its subsidiary companies and jointly controlled entities.
AUDITORS AND AUDITORS’ REPORT
Board of Directors have recommended appointment of M/s. Deloitte Haskins & Sells, Chartered Accountants as auditors of your company who retire at the conclusion of forthcoming Annual General Meeting and are eligible for re-appointment.
M/s. Deloitte Haskins & Sells, Chartered Accountants have given their consent to act as auditors, if re-appointed. Members are requested to consider their re-appointment. Auditors comments on your company’s accounts for year ended March 31, 2012 are self explanatory in nature and do not require any explanation as per provisions of Section 217(3) of the Companies Act, 1956.
COST AUDITORS:
M/s. K.G. Goyal & Associates, Cost Accountants has been appointed as Cost Auditor of the Company in compliance with Central Government’s order F. No.52/26/CAB-2010 dtd.
02/05/2011 and 30/06/2011, Notifi cation No.G.S.R.429(E)
dtd. 03/06/2011 and Circular No.15/2011 issued by Ministry
of Corporate Affairs for conducting cost audit and issuance
of compliance report respectively under the provisions of
section 233B of the Companies Act, 1956 for the fi nancial
year 2011-12.
PARTICULARS OF EMPLOYEES
In terms of provisions of Section 217(2A) of the Companies
Act, 1956, read with the Companies (Particulars of Employees)
Rules, 1975, as amended, names and other particulars of
employees are required to be set out in Annexure to the
Directors’ Report. However, as per provisions of Section 219(1)
(b)(iv) of the said Act, the Annual Report excluding aforesaid
information is being sent to all the Members of company
and others entitled thereto. Members who are desirous of
obtaining such particulars are requested to write to company.
CONSERVATION OF ENERGY & TECHNOLOGY ABSORPTION AND FOREIGN EXCHANGE INFLOW & OUTFLOW
Information required under Section 217(1)(e) of the Companies
Act, 1956 is annexed hereto and forms part of this Report.
DEPOSITS
Your company has not accepted deposits from the public
within provisions of Section 58-A and 58-AA of the Companies
Act, 1956.
ACKNOWLEDGEMENT
Your Directors wish to place on record their gratitude to the
shareholders of the Company, Banks, Financial Institutions,
valued Customers, Suppliers, and Business Associates for
their support and confi dence in the Company.
Your Directors gratefully appreciate the co-operation
and assistance extended by various Central and State
Governmental Agencies. Your Directors also place on record
their appreciation for overwhelming co-operation and
assistance extended to your company by its employees.
On behalf of the Board of Directors
Place: Mumbai MOFATRAJ P. MUNOT
Date: May 21 , 2012 CHAIRMAN

Kalpataru Power Transmission Ltd.24
Information required under the Companies (Disclosure of Particulars in the Report of the Board of Directors) Rules, 1988.
A. CONSERVATION OF ENERGY:
Transmission & Distribution Division
Following measures taken by your Company from time to time has helped us maintaining energy consumption at optimum level:
1. Use of Voltage Stabilizer to regulate fl uctuations in voltage of the Torrent Power Ltd. supply, which helps to reduce energy consumption and eliminates wastage.
2. Installed capacitors at electrical control panel boards to improve the overall power factor.
3. Implementation of recommendations made by the National Productivity Council while conducting energy audit.
4. Installed differential wound linear regulator, automatic voltage controller with advanced technology for energy saving.
5. Installed PNG Connection, an environment friendly fuel, for galvanizing plant and hot bending machine to conserve the energy.
Our total energy cost is less than 1% of our total turnover, which refl ects success of your company’s efforts in this direction.
ANNEXURE TO DIRECTORS’ REPORT
Biomass Energy Division
Following measures taken by your company from time to time has helped us in maintaining the auxiliary consumption at optimum level.
1. Use of energy effi cient motors for all auxiliaries of the plant has helped in reduction in Auxiliary consumption.
2. High capacity motors like boiler feed pump motor have been provided with soft Starters (electronic starters) to conserve energy.
3. Variable frequency drives (VFD’s) have been provided for majority of continuous running auxiliaries which helps in conserving energy.
B. TECHNOLOGY ABSORPTION:
We have not imported or used any special technology which covered under this disclosure.
C. FOREIGN EXCHANGE EARNINGS AND OUTGO: (` in billion)
Foreign exchange earnings 7.02 (including overseas projects)
Foreign exchange outgo 5.36
25Annual Report 2011-12
Management Discussion and Analysis
I. Economic Scenario
The global economy showcased a challenging operating environment over the last fi scal. This was characterized by Euro zone debt crisis coupled with the rising concerns in the Middle East leading to rising crude oil prices which were fuelled by uncertainties of supply. According to the International Monetary Fund (IMF), the global economy has grown at a modest pace of 3.9% in 2011, as compared to a robust growth of 5.2% in 2010.
This had its impact on the Indian economy as well, after clocking a growth rate of over 8% for the past two years the Indian economy did not grow to its full potential in 2011-12. Several external factors including a likely headwind of double-dip recession in Europe and US, hardening of international crude prices and high infl ation resulted in the slowdown of the Indian economy, which resulted in GDP growth rate of 6.5% only for fi nancial year 2012.
The threats to India’s economy include a weakening global economy, slow progress on major reforms, depreciation of rupee and soaring infl ation.
II. Industry Scenario
Planning Commission of India in its 11th fi ve year plan (fi scal 2007 to 2011) emphasized on development of infrastructure to achieve high levels of economic growth, which accounts for over one-fourth of India’s industrial output. The Commission has projected almost twice the investment in infrastructure space at USD 1,025 billion in the 12th fi ve year plan, compared to USD 514 billion in the 11th fi ve year plan of which 50% is expected to come from private sector, as against 36% in the 11th fi ve year plan.
a. Transmission & Distribution
i. Domestic
Transmission and distribution capacity development need to keep pace with the rising demand for electricity in India. There is a pressing need for transmission and distribution networks to be expanded and strengthened and new technologies like smart grids needs to be implemented to deliver energy more effi ciently and reliably.
During the 12th fi ve year plan, inter-regional transmission capacity of 37,800 MW has been planned. This would include addition of 110,000 circuit kilometers (CKM) of transmission lines, 13,000 MW of HVDC terminal capacities and 270,000 MVA of AC transformation capacities. It requires an investment of ` 6,400 billion in the T&D space, which is a growth of 42% over the previous plan. This includes an investment of ` 2,400 billion in transmission lines, which is a growth of 71% over the previous plan. It includes planned investments from PGCIL of around ` 1,000 billion and a similar quantum is expected to be invested by the state transmission companies and ` 400 billion of investments could be expected from private players. Typically, 65% of the transmission investment fl ows into tower package and the remaining 35% into sub-stations, which brings in immense opportunities for transmission EPC players offering end to end solutions in the sector.
Source: Report of working group of power for 12th plan (GOI, Ministry of Power)
Indian electricity distribution network has more than 200 million consumers, one of the highest in the world. Though generation and transmission capacities have increased distribution is an area of concern with increasing gap in demand and supply with peak demand defi cit is in excess of 10%. To address defi ciencies in distribution, Government continues to focus on rural electrifi cation with special schemes and increase in fund allocation.
Private sector participation in T&D sector is inevitable with such large requirement for investments. Various projects are getting executed under the PPP model.
ii. Global
Countries across the globe are planning signifi cant investment in their T&D network. The world’s electricity generation capacity has been increased by about 22.8% during 2005 to 2010, which would lead to increased investments in T&D segments. In the developed economies, the focus has been on modernizing the transmission and distribution infrastructure and to integrate the decentralized renewable energy resources into the grid .
In the Middle East, rapid economic and population growth has led to a increase in the demand for power, which has necessitated the building of a strong electricity infrastructure to meet the demand.
Africa is largely under-electrifi ed and needs to build transmission network.
The global transmission sector is estimated to attract investments worth USD 1.5-2 trillion cumulatively worldwide between FY11 and FY30.
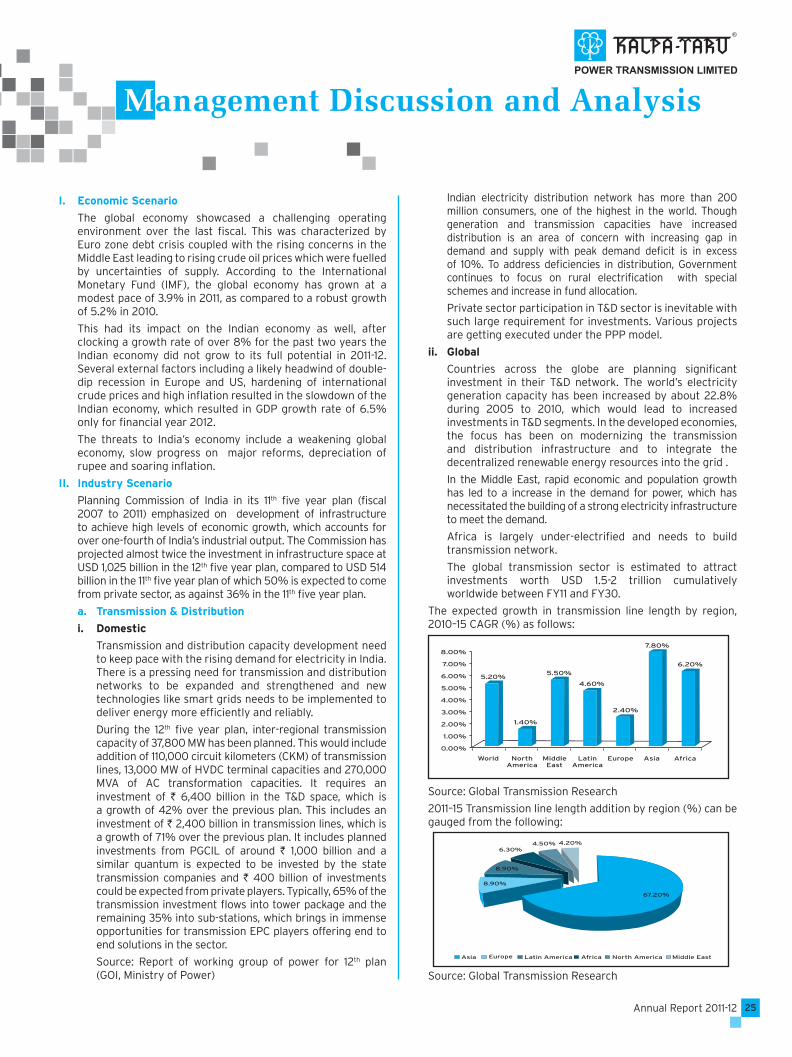
The expected growth in transmission line length by region, 2010–15 CAGR (%) as follows:
Source: Global Transmission Research
2011–15 Transmission line length addition by region (%) can be gauged from the following:
Source: Global Transmission Research
Kalpataru Power Transmission Ltd.26
Global transmission and distribution, the demand is likely to remain healthy with an expected investment in the range of USD 400 billion in the next 5 years.
b. Oil & Gas
India has around 12,000 kms of gas transmission network and almost equivalent product pipe line network, which is below global standard. With increasing demand from power sector, fertilizer industry and domestic households there is increasing demand supply mismatch. To address the situation, over 20,000 kms of pipeline capacity is planned. According to estimates, the size of offshore pipeline industry in India is in the range of USD 10 billion. According to the International Oil & Gas Journal, USD 19 billion is expected to be invested in Middle East, Africa and South East Asia in the next 5 years.
c. Railways
India’s Railway network among the largest and complex in the world, offers tremendous opportunities. Slow pace of reforms, low investment, project delays and populist policies hampered its growth and hindered private investment.
In the recent past there has been renewed focus on modernization and expansion of the rail network. Indian Railways plans to add 700 km of new rail lines in FY 13 at an investment of approximately ` 70 billion; ` 20 billion on gauge conversion (~ 800 kms); 1,100 route kms is proposed to be electrifi ed and 84 stations and terminals to be modernized with ̀ 11 billion earmarked for improving passenger amenities. A total of 31 projects covering a length of more than 5,000 km in 10 states is being executed with contribution from state governments. India planned to invest USD 147 billion in the railways during the 12th plan period (2012 to 2017). In addition, the Government has increased the scope of public-private participation (PPP) with an estimated ` 1220 billion worth of projects to be awarded. This is a huge investment outlined by Government of India and even by the most conservative estimate, presents a huge opportunity.
e. Logistics & Warehousing
India is the third largest agricultural producer and at a time when the country is producing record 250 million MTs of food grains, a large quantity is lost during transportation and storage. An estimated 20% of food grains and 30% of perishables are wasted due to lack of modern storage and processing facilities near production centers. With the agricultural sector accounting for 18% of the GDP and considering that food grains are stored for 4-5 months, there is a large requirement for modern storage with other facilities under one roof encompassing like weighing, processing (cleaning & grading), testing & certifi cation, easy fi nance against produce.
India has total agri-warehousing capacity of around 91 MMT at present to store and conserve such large quantities with state agencies owning 41% of the capacity and the balance distributed among private entrepreneurs, cooperative societies, farmers, etc. Driven by growth in the agricultural sector and defi cit in space the agri- warehousing sector is expected to grow at CAGR of 11% to 110 MMT by FY12.
Shri Shubham Logistics Ltd, our 85% subsidiary has established its name in warehousing and agro commodity business and presently providing warehousing facilities of over 600,000 Mts at various locations in Gujarat
& Rajasthan. With 2nd phase of expansion, capacities would cross 1 Million MTs mark by next year. Company has accredited with ISO ISO 22000:2005 and implemented ERP Software for on time & on line reporting.
Risks, Concerns & Threats
Each enterprise has its own risk, from which it cannot be fully isolated except through proper risk management. In the operations of its business, the Company foresees following areas of risk, concerns and threats:
• Company is exposed to variation in prices of commodities, foreign exchange and interest rate.
• Project execution is largely affected by availability of skilled and unskilled manpower. Hence, deployment, retention and competency growth of employees is vital.
• Company is exposed to risk of delay in execution due to external factors like right of way, obtaining of various approvals in time, etc.
• Company is exposed to unpredicted risk of changes in policies of Government and countries where it operates.
• Bio-mass power generation is exposed to risk of availability and pricing of its critical fuel (agriculture residue/waste) and availability of water.
• Although joint ventures/consortium are formed after proper due diligence, the risk of non performance of other can not be ruled out.
• DBFOT/BOOT projects have their own inherent risk related to execution and fi nance. Also Company has limited developmental experience and may face risk of operation & maintenance upon their commencement.
These risks are managed by the Company through a proper mix of orders across various countries, timely and adequate hedging of commodity and exchange exposure, optimization of working capital limits and effi cient inventory management. The management keeps close watch on global developments and keeps on reviewing the risks and as far as possible mitigating the same with appropriate actions from time to time.
Segment Wise Operational Performance
The Company has four primary business segments: Power Transmission & Distribution, Bio-mass Energy, Infrastructure and Real Estate.
The revenue of company can be divided geographically in two different segments-sales within India and sales outside India. Out of total revenue (Net of Excise Duty) of ` 30.33 billion for FY 2012, revenue from India is ` 21.23 billion (70%) and revenue from outside India is ` 9.10 billion (30%).
Transmission & Distribution Segment (T & D):
Segment’s revenue was higher by 4.1% at `26.40 billion.
T&D is core business segment of the company, contributing 87% of total revenue of the Company. Division has been performing consistently well and sustaining Company’s growth trajectory. and going forward also, it will remain core area for growth.
At the operational level, the following are the major highlights for this segment:
• Production (including outsourced) and dispatches of transmission line towers were at an all-time high of 127,331 MT and 130,903 MT respectively.
• Over 100,000 MT of transmission towers were erected at various domestic and international sites.
• Over 1,600 CKM of stringing work done to connect the grid to
27Annual Report 2011-12
substation or sub-station to sub-station.
• Achieved commercial operation of fi rst transmission BOOT project for Haryana Vidhyut Prasaran Nigham Ltd in joint venture. This is India’s fi rst intra state transmission BOOT project on VGF basis.
• Successful foundation lift test for a project in Kenya, which demonstrate the quality and capability of our execution.
• Demonstrated capabilities to work in severe climatic conditions by completing 1st stage work of our fi rst CIS country project for UKRENGO in Ukraine.
The segment has secured following prestigious projects during the reporting period:
• Rehabilitation of 500 kv HVDC transmission line of 1,700 kms and 220 kv SC & DC transmission line of 713 kms from SNEL, D.R Congo, funded by IDA/World Bank. This is second funded project secured in D R Congo.
• Three orders of 765 kv S/C & D/C, 600 kms Power Transmission line in Central India region from PGCIL.
• 400 kv D/C, 39 kms Power Transmission EPC project for Navasari – Boisar from PGCIL, funded by ADB.
• 400 kv D/C, 125 Kms EPC Power Transmission project for Kayathar – Karaikudi from Tamil Nadu Transmission Corporation Ltd (TANTRANSCO).
• First Turnkey, 132 kv, 146 kms power transmission lines project from Ceylon Electricity Board, Sri Lanka, funded by ADB.
• 400 Kv S/C, 112 kms power transmission line project from Eskom Holdings Ltd, South Africa
• Power transmission tower supply orders over 40,000 MT from Australia, Canada and USA.
This business segment has secured orders worth ` 30 billion during year. The order book position can be divided into 50:50 for domestic and international. Out of this majority of orders are backed by price escalation clauses which will to a large extent protect us in the present uncertain market conditions.
Green fi eld expansion of 30,000 MT of tower manufacturing capacity at Raipur is progressing as per schedule, which is expected to achieve commercial operation by Q3 FY 2013 . This will take Company’s total manufacturing to 138,000 MT and Company will become one of the largest tower manufacturer of the globe.
As previously reported, we are being selective on rural distribution business in India given the complexity and size. All existing projects have been completed.
The Company has also made successfully entry into new countries, namely Thailand & Sri Lanka and continues to keep its focus on new markets and territories to expand its presence.
Infrastructure Segment
The year remained challenging for this segment on account of intense competition in domestic market and limited number of tenders in international market.
Company’s fi rst Process Plant Contract on EPC basis from Oil India Ltd. worth ` 2.76 billion is progressing well and expected to be completed by Q3 FY 2013. During the year a contract for 18”, 45 KM Cross country gas pipeline project from Pipavav to Gundala from GSPL was secured.
With competition being intense in core area of expertise, we have geared to enter into the promising work of submarine pipelines, fl oating production & storage systems, offshore pipeline services, process facilities & plants, fabrication yards, all of which will help
us in expanding our breadth and width in this business. Apart from the domestic market, we are continuously focusing on the overseas market.
Railways EPC contracting business which was started last year, has successfully secured contracts worth over ` 6.5 billion since inception under joint ventures/ consortium arrangements and includes contracts worth ` 3.60 billion secured in the reporting period.
This segment has achieved revenue growth of 15% at ` 3.39 billion as against ` 2.95 billion in previous fi scal year.
Bio-mass Energy Segment
Our two power generation plants of 7.8 MW each at Sri Ganganagar and Tonk District of Rajasthan, generating power from non conventional energy resources i.e. using agricultural waste as fuel. The plants have registered revenue of ` 533 million during the year as against to ` 471 million in previous year, recorded a growth of 13%.
Both plants have been running at 93% PLF (excluding shut down) and have generated 103 million units, out of which 93 million units were sold to Rajasthan Vidyut Vitran Nigam Limited (RVVNL). Both plants are earning Certifi ed Emission Reductions (CERs) on usage of agriculture residues and the CERs are being realised time to time after following stringent validation & approval process.
Financial Review
The consolidated revenue of the Company grew at 22%, with total revenue of ` 53.08 billion during the year. The consolidated order book of the Company is above ` 117 billion.
On a standalone basis, the Company reported net sales and service revenue of ` 30.26 billion , a growth of 5% over. Revenue of Power T&D segment grew by 4%, Infrastructure segment grew by 15% and bio-mass energy segment grew by 13%. On a standalone basis, the order book of the Company, as on March 31, 2012, stands at ` 61 billion, the break-up of which is as follows: -
• Transmission & Distribution - ` 54 billion
• Infra (Pipeline and Railways) - ` 7 billion
Exports revenue (including overseas projects) earnings during the year is ` 9.10 billion, representing over 30% of your Company’s gross revenue.
The Company’s profi t after tax is at ` 1.65 billion as against ` 1.91 billion of the previous fi scal. The decline in profi ts is due to increase in input cost and higher fi nance cost.
Net fi xed assets (including capital work in progress), as at March 31, 2012, is ` 4.53 billion as against to ` 3.74 billion in the previous year, increase of ̀ 0.79 billion, mainly for construction equipments and under construction manufacturing faciliy at Raipur.
Fund raised through Qualifi ed Institutional Placement (QIP) issue in May 2010, was utilized as per the objects of issue and unutilized funds have been temporarily deployed in mutual funds and Bank deposits. During the year company has raised ECB (External Commercial Borrowings) of US $ 15 million for ongoing capex, on fully hedged basis.
Net current assets as at March 31, 2012 increased to ` 8.32 billion, as against ` 7.04 billion in the previous year. Current assets levels of the Company increased mainly on account of increased level of trade receivables due to milestone-based terms of payments.
The total debt/equity ratio currently stands at 0.29. The Company enjoys A1 + and AA rating for its short-term and long-term borrowing from CARE Ltd. and A1+ and AA rating from CRISIL. The Company has suffi cient working capital limits to support its growth plan.

Kalpataru Power Transmission Ltd.28
Internal Controls
The Company has an adequate system of internal controls implemented by the management towards achieving effi ciency in operation, optimum utilization of the Company’s resources and effective monitoring thereof, and compliance with applicable laws and regulations.
The Company’s internal audit department and independent Internal Auditors conduct regular audits to ensure adequacy of internal control systems, adherence to management instructions and compliance with laws and regulations of the country, as well as to suggest improvements.
Audit plans, internal/external auditors’ observations and recommendations, signifi cant risk areas assessments and adequacy of internal controls are also periodically reviewed by the Audit Committee.
The Company has implemented global ERP system - SAP, to have better internal control systems and fl ow of information. Further, the Company has also adhered to the stringent rules and regulations of ISO guideline.
Corporate Social Responsibility
Safety
Company lays utmost importance to safety standards at all its working locations. At manufacturing units, power plants and all project sites, necessary procedures are in place to ensure safety of personnel and equipments. To ensure safety and health of work force and create awareness, company undertakes the following activities.
a. Internal safety audits
b. Safety week celebration to create awareness about safety
c. Mock drills to access emergency / disaster management preparedness, etc.
Environment
Preservatio n and promotion of environment is of fundamental concern in all our business activities. The Company has installed fl ux regeneration plant, acid and white fume extractors, eco-ventilator fans, etc at its manufacturing facilities to maintain good working condition and to make it more environmental friendly. As per specifi c requirement of customers, company has started fumigation of its export supplies and dull fi nishing of products to avoid refl ection when it is installed at site. The Company is also engaged in green area development for Gujarat Industrial Development Corporation (GIDC) and Gujarat Government.
The Company has been accredited with ISO 14001 for Environment Management Systems by Intertek Quality Registrar, PLC, U.K., for its Export Oriented Unit (EOU) Division.
Community Development
As a good corporate citizen, the Company undertakes various community welfare measures and environment friendly initiatives. The Company’s social welfare and community development measures are focused on healthcare, child development and promotion of cultural activities.
The Company undertakes community development initiatives by sponsoring the various programs of government and non-government organizations such as Rotary Club of Gandhinagar, Gandhinagar Cultural Forum, Kalrav etc. in fi elds of healthcare, child development, cultural activities, youth development, women empowerment, medical check-up camp in nearby areas. Every year Company co-sponsor grand Garba celebration – a 9 night cultural dance program under the banner of Gujarat Cultural Forum, which
is being enjoyed by over 50,000 people across all culture.
Kalpataru Seva Kendra, a multi-specialty medical facility with ultra-modern facilities provides consultancy and routine health check-up facilities at almost free of cost with medicines. Over 100 patients benefi ts from this facility on daily basis. We are thankful to all well-known doctors of Gandhinagar, who are providing these services on honorary basis.
Company has organized several medical health check-up camps for economically weaker sections of the society, which has benefi ted to over 3,000 people
Company has also adopted 35 government schools in nearby area of Gandhinagar to conduct one time medical check-up of students in association with a social organization, under which more than 4,000 students got benefi ted and their individual medical reports were submitted to the State Government.
On social front, spouses of employees are always remain ahead to ensure that the bonding of family members made more strong and for which Ladies wing – Inner Circle organizes various welfare, entertaining and educative programs for ladies and children of staff which include sports days, movie show, medical check-up, outside educative visit, summer camps and many more such activities.
Our state of art training centre – “Kalpa Vriksh Learning Centre” is yielding desired results in line with our objectives. As Corporate, it has become our back bone and it is supporting us well by catering the organizational need by training and developing young generation as well as existing employees.
Company has entered into MOU with Government of Gujarat to train and develop young generation for their service oriented career. Under this, Company has selected a fi rst batch of 25 young graduates to train them for commercial, accounting & stores fundamentals, under the guidance of Center for Entrepreneur Development and gave them training of almost 2 months with an aim to captivate them for various functions of organization.
Human resources
Human resources continued to be one of the biggest assets of the Company. Recruiting the best talent, motivating and retaining them and ensuring their development is a foremost challenge in today’s business environment. The Company focuses on building an expert talent base by grooming existing talent as well as fresh recruits from reputed professional institutions in a variety of areas to enable them to take on positions of greater responsibility. The Company fi rmly recognizes that its human resources are the major source of strength to achieve its vision. There is a great team sprit amongst the member of staff. They are keys to achieving corporate objectives and are the primary source of competitive advantage. The company has strong workforce of around 2,000 people as on 31st March 2012.
Cautionary Statement
Statement in the Management Discussion and Analysis describing the Company’s objectives, expectations or predictions may be forwarded looking within the meaning of applicable securities, law and regulations. The Company assumes no responsibility to publicly amend, modify or revise forward looking statements, on the basis of subsequent event or development. Actual results may differ materially from those expressed in the statement. Important factors that could infl uence the Company’s operations affecting selling price of fi nished goods, input availability and price, changes in government regulations, tax laws, economic development within and outside the country and other factors such as litigation and industrial relations.

29Annual Report 2011-12
Report on Corporate Governance
COMPANY’S PHILOSOPHY ON CORPORATE GOVERNANCE
Company’s philosophy of corporate governance stems from its belief of transparency, integrity and accountability towards all stockholders. Corporate Governance helps to achieve excellence to enhance stakeholders’ value by focusing on long-term stakeholder value creation without compromising on integrity, social obligations and regulatory compliances.
At Kalpataru Power, our continuous endeavor is to achieve good governance, by way of a conscious and conscientious effort whereby ensuring the truth, transparency, accountability and responsibility in all our dealings with our employees, stakeholders, consumers and the community at large.
The Board of Directors represents the interest of the Company’s stakeholders, for optimizing long-term value by way of providing necessary guidance and strategic vision to the Company. The Board also ensures that the Company’s management and employees operate with the highest degree of ethical standards.
We, at Kalpataru Power, believe that the constant effort to improve operational performance, guided by our values, forms the basis for good Corporate Governance. Corporate Governance is strongly driven by our values such as quality, commitment, customer orientation and integrity.
I. BOARD OF DIRECTORS
A. Composit ion of the Board
The Board of directors consists of 10 Directors as on March 31, 2012 of which 8 are Non-Executive Directors and 2 are Executive Directors. The Chairman is a Non-Executive Promoter Director, apart from him there is 1 Promoter Director and 5 Non-Executive Independent Directors. The Board structure is in compliance with Clause 49 of the Listing Agreement.
B. Meetings of Board of Directors
6 Board Meetings were held during the year ended on March 31, 2012 and the gap between any two meetings has not exceeded four months. The dates on which the Board Meetings were held are May 14, 2011, July 29, 2011, September 28, 2011, October 22, 2011, February 8, 2012 and March 26, 2012.
C. Directors’ attendance and Directorships held
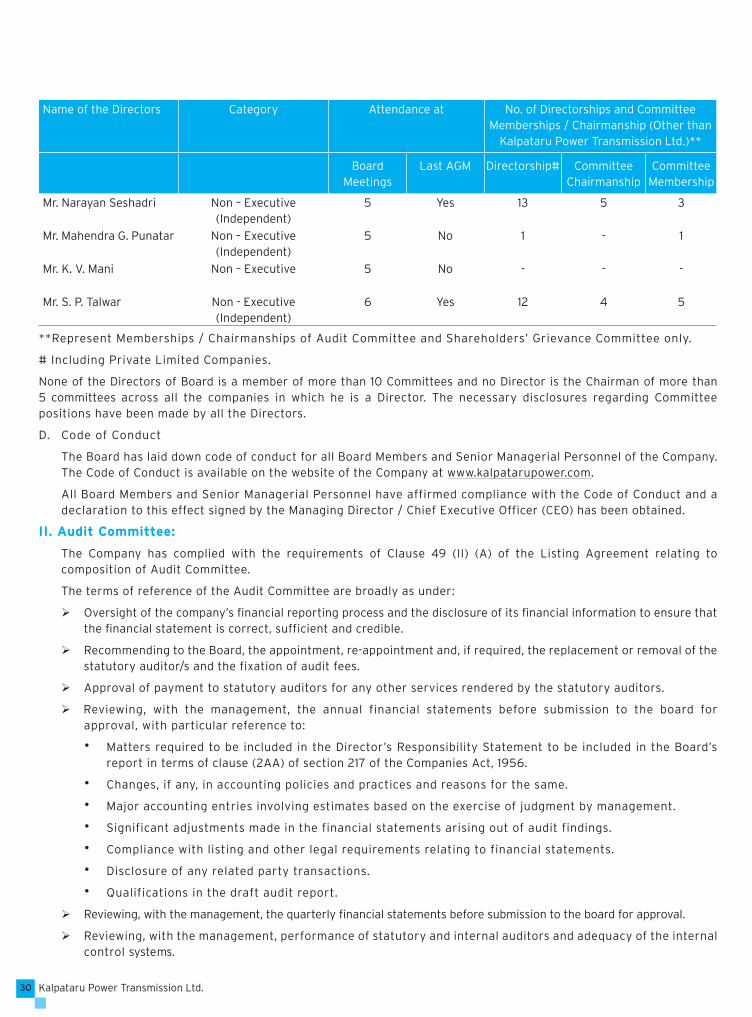
The names and category of Directors on the Board, their attendance at the Board meetings held during the year and also at the last Annual General Meeting, the number of Directorships and Committee Memberships and Chairmanships held by them in other companies are given below:
Name of the Directors Category Attendance at No. of Directorships and Committee Memberships / Chairmanship (Other than
Kalpataru Power Transmission Ltd.)**
Board Meetings
Last AGM Directorship# Committee Chairmanship
Committee Membership
Mr. Mofatraj P. Munot Non – Executive (Promoter) Chairman
6 Yes 69 - -
Mr. Pankaj Sachdeva Managing Director 5 Yes 1 - -
Mr. Parag M. Munot Non – Executive (Promoter)
5 Yes 73 - 1
Mr. Manish Mohnot Executive Director 5 Yes 8 - -
Mr. Sajjanraj Mehta Non - Executive (Independent)
6 Yes 2 1 1
Mr. Vimal Bhandari Non - Executive (Independent)
6 Yes 10 3 3
Kalpataru Power Transmission Ltd.30
Name of the Directors Category Attendance at No. of Directorships and Committee Memberships / Chairmanship (Other than
Kalpataru Power Transmission Ltd.)**
Board Meetings
Last AGM Directorship# Committee Chairmanship
Committee Membership
Mr. Narayan Seshadri Non – Executive(Independent)
5 Yes 13 5 3
Mr. Mahendra G. Punatar Non – Executive(Independent)
5 No 1 - 1
Mr. K. V. Mani Non – Executive 5 No - - -
Mr. S. P. Talwar Non - Executive (Independent)
6 Yes 12 4 5
**Represent Memberships / Chairmanships of Audit Committee and Shareholders’ Grievance Committee only.
# Including Private Limited Companies.
None of the Directors of Board is a member of more than 10 Committees and no Director is the Chairman of more than 5 committees across all the companies in which he is a Director. The necessary disclosures regarding Committee positions have been made by all the Directors.
D. Code of Conduct
The Board has laid down code of conduct for all Board Members and Senior Managerial Personnel of the Company. The Code of Conduct is available on the website of the Company at www.kalpatarupower.com.
All Board Members and Senior Managerial Personnel have affirmed compliance with the Code of Conduct and a declaration to this effect signed by the Managing Director / Chief Executive Officer (CEO) has been obtained.
II. Audit Committee:
The Company has complied with the requirements of Clause 49 (II) (A) of the Listing Agreement relating to composition of Audit Committee.
The terms of reference of the Audit Committee are broadly as under:
Oversight of the company’s fi nancial reporting process and the disclosure of its fi nancial information to ensure that the fi nancial statement is correct, sufficient and credible.
Recommending to the Board, the appointment, re-appointment and, if required, the replacement or removal of the statutory auditor/s and the fixation of audit fees.
Approval of payment to statutory auditors for any other services rendered by the statutory auditors.
Reviewing, with the management, the annual financial statements before submission to the board for approval, with particular reference to:
• Matters required to be included in the Director’s Responsibility Statement to be included in the Board’s report in terms of clause (2AA) of section 217 of the Companies Act, 1956.
• Changes, if any, in accounting policies and practices and reasons for the same.
• Major accounting entries involving estimates based on the exercise of judgment by management.
• Significant adjustments made in the financial statements arising out of audit findings.
• Compliance with listing and other legal requirements relating to financial statements.
• Disclosure of any related party transactions.
• Qualifications in the draft audit report.
Reviewing, with the management, the quarterly fi nancial statements before submission to the board for approval.
Reviewing, with the management, performance of statutory and internal auditors and adequacy of the internal control systems.

31Annual Report 2011-12
Reviewing the adequacy of internal audit function, if any, including the structure of the internal audit department, staffing and seniority of the official heading the department, reporting structure coverage and frequency of internal audit.
Discussion with internal auditors regarding any significant findings and follow up there on.
Reviewing the findings of any internal investigations by the internal auditors into matters where there is suspected fraud or irregularity or a failure of internal control systems of a material nature and reporting the matter to the board.
Discussion with statutory auditors before the audit commences, about the nature and scope of audit as well as post-audit discussion to ascertain any area of concern.
To look into the reasons for substantial defaults in the payment to the depositors, debenture holders, shareholders (in case of nonpayment of declared dividends) and creditors.
Reviewing with the management, the statement of uses/application of funds raised through an issue (public issue, right issue and preferential issue etc.), the statement of funds utilized for purposes other than those stated in the offer document/ prospectus/notice and the report submitted by the monitoring agency monitoring the utilization of proceeds of a public or right issue and making appropriate recommendations to the Board to take up steps in the matter.
Approval of appointment of CFO ( i.e. the whole time Finance Director or any other person heading the finance function or discharging that function) after assessing the qualifications, experience & background etc. of the candidate.
The Audit Committee comprises of 5 Non-Executive Directors out of which 4 are independent directors. The Committee met 4 times during the year on May 14, 2011, July 29, 2011, October 22, 2011 and February 8, 2012 and the attendance of members at the meetings were as follows :
Name of Member Category StatusNo. of Meetings attended /held
Mr. Sajjanraj Mehta Non Executive-Independent Chairman 4 / 4
Mr. Mofatraj P. Munot Non Executive-Promoter Member 4 / 4
Mr. Vimal Bhandari Non Executive-Independent Member 4 / 4
Mr. Narayan K. Seshadri Non Executive-Independent Member 3 / 4
Mr. Mahendra G. Punatar Non Executive-Independent Member 3 / 4
The President & CFO and Statutory Auditors are regular invitee, and Internal Auditors are invited as and when required. The Company Secretary is the secretary of the committee.
The Audit Committee has reviewed fi nancial condition and results of operations forming part of the management discussion and analysis and other information as mentioned in para II (E) of Clause 49 of the Listing Agreement.
III. Subsidiary Companies:
The company has the following subsidiaries:
1. JMC Projects (India) Ltd. (67.19% Subsidiary), Listed Company
2. Shree Shubham Logistics Ltd. (85.11% Subsidiary)
3. Energylink (India) Ltd. (100% Subsidiary)
4. Amber Real Estate Ltd. (100% Subsidiary)
5. Kalpataru Power Transmission USA INC. (100% Subsidiary)
6. Kalpataru Power Transmission (Mauritius) Ltd. (100% Subsidiary)
7. Kalpataru SA (Proprietary) Ltd. (100% Subsidiary)
8. Kalpataru Power Transmission Nigeria Ltd. (100% Subsidiary)
9. Adeshwar Infrabuild Ltd. (100% Subsidiary)
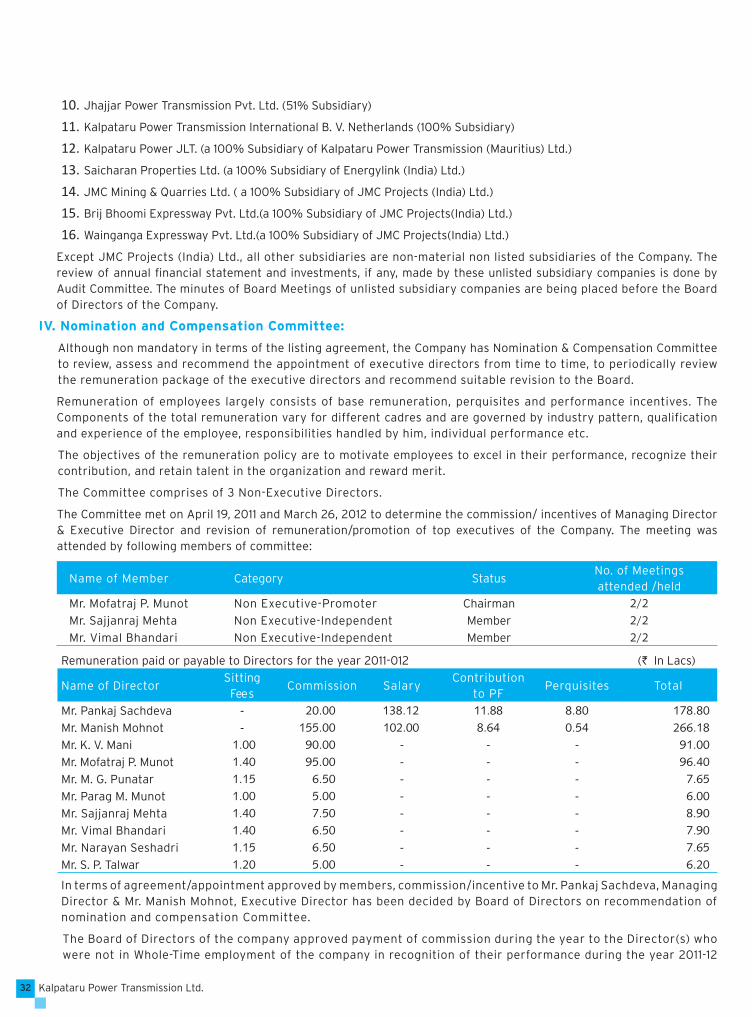
Kalpataru Power Transmission Ltd.32
10. Jhajjar Power Transmission Pvt. Ltd. (51% Subsidiary)
11. Kalpataru Power Transmission International B. V. Netherlands (100% Subsidiary)
12. Kalpataru Power JLT. (a 100% Subsidiary of Kalpataru Power Transmission (Mauritius) Ltd.)
13. Saicharan Properties Ltd. (a 100% Subsidiary of Energylink (India) Ltd.)
14. JMC Mining & Quarries Ltd. ( a 100% Subsidiary of JMC Projects (India) Ltd.)
15. Brij Bhoomi Expressway Pvt. Ltd.(a 100% Subsidiary of JMC Projects(India) Ltd.)
16. Wainganga Expressway Pvt. Ltd.(a 100% Subsidiary of JMC Projects(India) Ltd.)
Except JMC Projects (India) Ltd., all other subsidiaries are non-material non listed subsidiaries of the Company. The review of annual fi nancial statement and investments, if any, made by these unlisted subsidiary companies is done by Audit Committee. The minutes of Board Meetings of unlisted subsidiary companies are being placed before the Board of Directors of the Company.
IV. Nomination and Compensation Committee:
Although non mandatory in terms of the listing agreement, the Company has Nomination & Compensation Committee to review, assess and recommend the appointment of executive directors from time to time, to periodically review the remuneration package of the executive directors and recommend suitable revision to the Board.
Remuneration of employees largely consists of base remuneration, perquisites and performance incentives. The Components of the total remuneration vary for different cadres and are governed by industry pattern, qualification and experience of the employee, responsibilities handled by him, individual performance etc.
The objectives of the remuneration policy are to motivate employees to excel in their performance, recognize their contribution, and retain talent in the organization and reward merit.
The Committee comprises of 3 Non-Executive Directors.
The Committee met on April 19, 2011 and March 26, 2012 to determine the commission/ incentives of Managing Director & Executive Director and revision of remuneration/promotion of top executives of the Company. The meeting was attended by following members of committee:
Name of Member Category StatusNo. of Meetingsattended /held
Mr. Mofatraj P. Munot Non Executive-Promoter Chairman 2/2Mr. Sajjanraj Mehta Non Executive-Independent Member 2/2Mr. Vimal Bhandari Non Executive-Independent Member 2/2
Remuneration paid or payable to Directors for the year 2011-012 (` In Lacs)
Name of DirectorSitting
FeesCommission Salary
Contributionto PF
Perquisites Total
Mr. Pankaj Sachdeva - 20.00 138.12 11.88 8.80 178.80Mr. Manish Mohnot - 155.00 102.00 8.64 0.54 266.18Mr. K. V. Mani 1.00 90.00 - - - 91.00Mr. Mofatraj P. Munot 1.40 95.00 - - - 96.40Mr. M. G. Punatar 1.15 6.50 - - - 7.65Mr. Parag M. Munot 1.00 5.00 - - - 6.00Mr. Sajjanraj Mehta 1.40 7.50 - - - 8.90Mr. Vimal Bhandari 1.40 6.50 - - - 7.90Mr. Narayan Seshadri 1.15 6.50 - - - 7.65Mr. S. P. Talwar 1.20 5.00 - - - 6.20
In terms of agreement/appointment approved by members, commission/incentive to Mr. Pankaj Sachdeva, Managing Director & Mr. Manish Mohnot, Executive Director has been decided by Board of Directors on recommendation of nomination and compensation Committee.
The Board of Directors of the company approved payment of commission during the year to the Director(s) who were not in Whole-Time employment of the company in recognition of their performance during the year 2011-12
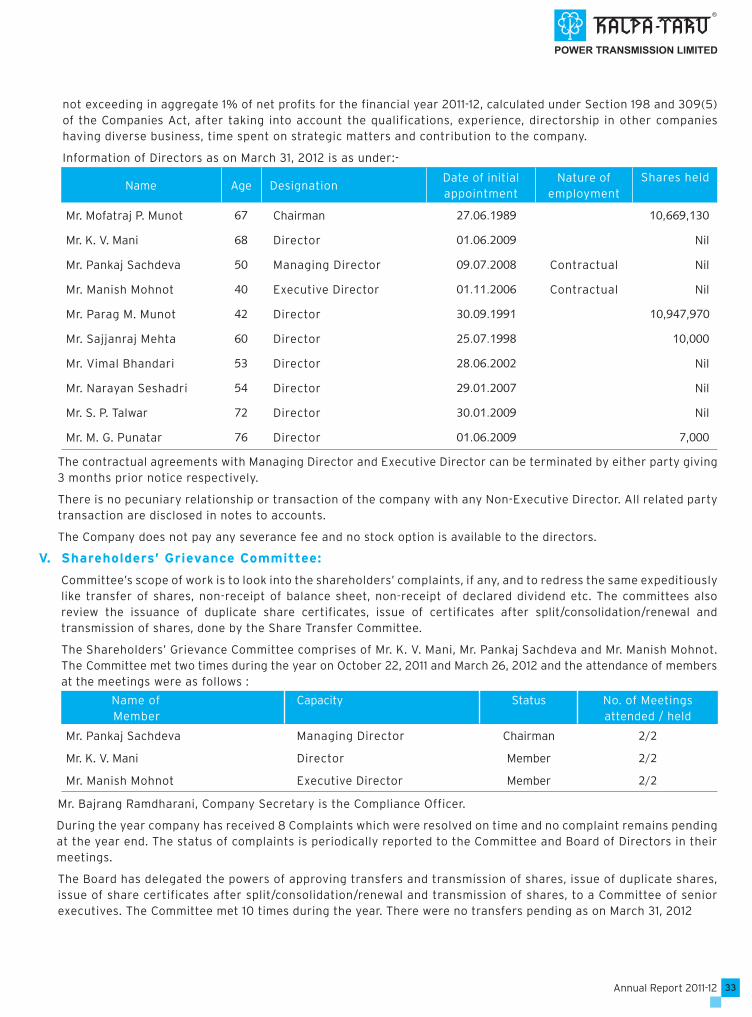
33Annual Report 2011-12
not exceeding in aggregate 1% of net profits for the financial year 2011-12, calculated under Section 198 and 309(5) of the Companies Act, after taking into account the qualifications, experience, directorship in other companies having diverse business, time spent on strategic matters and contribution to the company.
Information of Directors as on March 31, 2012 is as under:-
Name Age DesignationDate of initialappointment
Nature ofemployment
Shares held
Mr. Mofatraj P. Munot 67 Chairman 27.06.1989 10,669,130
Mr. K. V. Mani 68 Director 01.06.2009 Nil
Mr. Pankaj Sachdeva 50 Managing Director 09.07.2008 Contractual Nil
Mr. Manish Mohnot 40 Executive Director 01.11.2006 Contractual Nil
Mr. Parag M. Munot 42 Director 30.09.1991 10,947,970
Mr. Sajjanraj Mehta 60 Director 25.07.1998 10,000
Mr. Vimal Bhandari 53 Director 28.06.2002 Nil
Mr. Narayan Seshadri 54 Director 29.01.2007 Nil
Mr. S. P. Talwar 72 Director 30.01.2009 Nil
Mr. M. G. Punatar 76 Director 01.06.2009 7,000
The contractual agreements with Managing Director and Executive Director can be terminated by either party giving 3 months prior notice respectively.
There is no pecuniary relationship or transaction of the company with any Non-Executive Director. All related party transaction are disclosed in notes to accounts.
The Company does not pay any severance fee and no stock option is available to the directors.
V. Shareholders’ Grievance Committee:
Committee’s scope of work is to look into the shareholders’ complaints, if any, and to redress the same expeditiously like transfer of shares, non-receipt of balance sheet, non-receipt of declared dividend etc. The committees also review the issuance of duplicate share certificates, issue of certificates after split/consolidation/renewal and transmission of shares, done by the Share Transfer Committee.
The Shareholders’ Grievance Committee comprises of Mr. K. V. Mani, Mr. Pankaj Sachdeva and Mr. Manish Mohnot. The Committee met two times during the year on October 22, 2011 and March 26, 2012 and the attendance of members at the meetings were as follows :
Name of Member
Capacity Status No. of Meetingsattended / held
Mr. Pankaj Sachdeva Managing Director Chairman 2/2
Mr. K. V. Mani Director Member 2/2
Mr. Manish Mohnot Executive Director Member 2/2
Mr. Bajrang Ramdharani, Company Secretary is the Compliance Officer.
During the year company has received 8 Complaints which were resolved on time and no complaint remains pending at the year end. The status of complaints is periodically reported to the Committee and Board of Directors in their meetings.
The Board has delegated the powers of approving transfers and transmission of shares, issue of duplicate shares, issue of share certificates after split/consolidation/renewal and transmission of shares, to a Committee of senior executives. The Committee met 10 times during the year. There were no transfers pending as on March 31, 2012
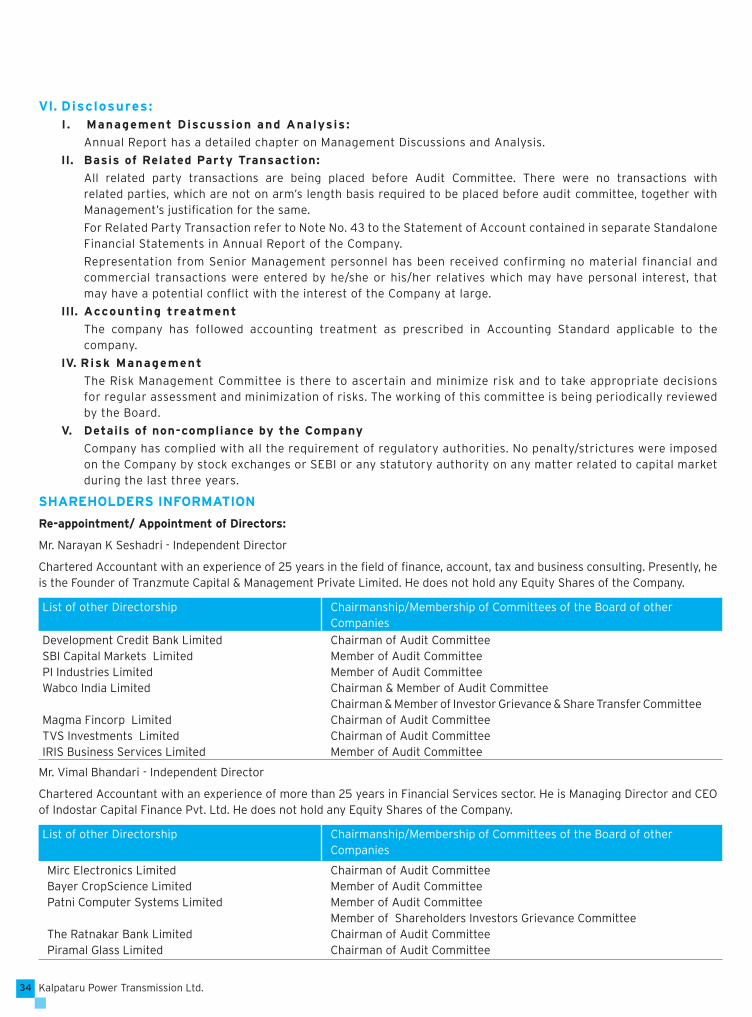
Kalpataru Power Transmission Ltd.34
VI. Disclosures: I . Management Discussion and Analysis :
Annual Report has a detailed chapter on Management Discussions and Analysis.
II. Basis of Related Party Transaction:
All related party transactions are being placed before Audit Committee. There were no transactions with related parties, which are not on arm’s length basis required to be placed before audit committee, together with Management’s justifi cation for the same.
For Related Party Transaction refer to Note No. 43 to the Statement of Account contained in separate Standalone Financial Statements in Annual Report of the Company.
Representation from Senior Management personnel has been received confirming no material financial and commercial transactions were entered by he/she or his/her relatives which may have personal interest, that may have a potential conflict with the interest of the Company at large.
III. Accounting treatment
The company has followed accounting treatment as prescribed in Accounting Standard applicable to the company.
IV. Risk Management
The Risk Management Committee is there to ascertain and minimize risk and to take appropriate decisions for regular assessment and minimization of risks. The working of this committee is being periodically reviewed by the Board.
V. Details of non-compliance by the Company
Company has complied with all the requirement of regulatory authorities. No penalty/strictures were imposed on the Company by stock exchanges or SEBI or any statutory authority on any matter related to capital market during the last three years.
SHAREHOLDERS INFORMATION
Re-appointment/ Appointment of Directors:
Mr. Narayan K Seshadri - Independent Director
Chartered Accountant with an experience of 25 years in the fi eld of fi nance, account, tax and business consulting. Presently, he is the Founder of Tranzmute Capital & Management Private Limited. He does not hold any Equity Shares of the Company.
List of other Directorship Chairmanship/Membership of Committees of the Board of other Companies
Development Credit Bank LimitedSBI Capital Markets LimitedPI Industries LimitedWabco India Limited
Magma Fincorp LimitedTVS Investments LimitedIRIS Business Services Limited
Chairman of Audit CommitteeMember of Audit CommitteeMember of Audit CommitteeChairman & Member of Audit CommitteeChairman & Member of Investor Grievance & Share Transfer CommitteeChairman of Audit CommitteeChairman of Audit CommitteeMember of Audit Committee
Mr. Vimal Bhandari - Independent Director
Chartered Accountant with an experience of more than 25 years in Financial Services sector. He is Managing Director and CEO of Indostar Capital Finance Pvt. Ltd. He does not hold any Equity Shares of the Company.
List of other Directorship Chairmanship/Membership of Committees of the Board of other Companies
Mirc Electronics LimitedBayer CropScience LimitedPatni Computer Systems Limited
The Ratnakar Bank LimitedPiramal Glass Limited
Chairman of Audit Committee Member of Audit CommitteeMember of Audit Committee Member of Shareholders Investors Grievance CommitteeChairman of Audit Committee Chairman of Audit Committee

35Annual Report 2011-12
Mr. Parag M Munot – Promoter Director
MBA, Carnegie Mellon University, USA with two decades of experience, is responsible for the group Real Estate and Property Development business. Presently Managing Director of Kalpataru Ltd. He holds 10,947,970 Equity Shares of the Company
List of other Directorship Chairmanship/Membership of Committees of the Board of other Companies
Kalpataru Limited Member of Audit Committee
General Body Meeting
The details of last 3 Annual General Meetings (AGMs) of the Company are as under:
Financial Year Date Time Venue
2010-2011 29.07.2011 3.00 p.m. Kalpa-Vriksha Learning Centre, A-1 & A-2, GIDC Electronic Estate Sector-25, Gandhinagar
2009-2010 29.07.2010 4.30 p.m. Kalpa-Vriksha Learning Centre, A-1 & A-2, GIDC Electronic Estate Sector-25, Gandhinagar
2008-2009 29.07.2009 4.30 p.m. Kalpa-Vriksha Learning Centre, A-1 & A-2, GIDC Electronic Estate Sector-25, Gandhinagar
Special Resolution in Last 3 AGMs
In AGM held on July 29, 2011, No Special Resolution was passed.
In AGM held on July 29, 2010, a Special Resolution was passed to pay commission, not exceeding 1% of the net profits of Company to Non-Executive Directors, for a period of three years commencing from April 1, 2010, as may be determined by the board of directors from time to time under the provision of the Companies Act, 1956.
In AGM dated July 29, 2009 there were three Special Resolutions passed for appointment of Managing Director, change in terms of appointment of Executive Director and Commission to Non–Executive Directors (Other than Promoter Directors).
Postal Ballot
No Postal Ballot was conducted during the year. There is no Resolution which is proposed to be passed through Postal Ballot in the ensuing Annual General Meeting.
Means of Communication
The Company has published its Quarterly Results in Economic Times – English & Gujarati, Business Standard – English and Gandhinagar Samachar – Gujarati daily.
The Results of the Company were displayed on web site www.kalpatarupower.com and the same were also submitted to the Stock Exchanges after the conclusion of the Board Meeting. The offi cial news releases are being placed on Company’s website and simultaneously sent to Stock Exchanges where the shares of the Company are listed.
COMPLIANCE
The Company has regularly submitted its quarterly compliance report to the Stock Exchanges for compliance of requirements of corporate governance under Para VI(ii)of Clause-49 of the Listing Agreement.
The Company has complied with the applicable mandatory requirements of Clause 49 of the Listing Agreement.
ADDITIONAL SHAREHOLDERS INFORMATION
Annual General Meeting, Book Closure & Dividend Payment
The information of forthcoming Annual General Meeting, Book Closure and Dividend payment details have been provided in the Notice of Annual General Meeting enclosed alongwith this Annual Report and being mailed to all the shareholders separately.

Kalpataru Power Transmission Ltd.36
Financial Calendar
Financial Year: 1st April to 31st March
Financial Results:
First Quarter Results : by 14th August
Half Year Results : by 14th November
Third Quarter Results : by 14th February
Annual Results : May End
Listing
At present, the equity shares of the Company are listed on the Bombay Stock Exchange Ltd. (BSE) and the National Stock Exchange of India Ltd. (NSE).
Name of Stock Exchange Stock Code
Bombay Stock Exchange Ltd. 522287
National Stock Exchange of India Ltd. KALPATPOWR
ISIN No. (Dematerialized Shares) INE220B01022
The Company has already paid the listing fees for the year 2011-12 to both the Stock Exchanges.
Stock Market Data
Monthly High and Low price of the Company’s shares for 2011-2012 on BSE and NSE
Face value of Shares: ` 2 each.
The share prices are as under:
Month Bombay Stock Exchange Ltd. National Stock Exchange of India Ltd.
High Share Price `
Low Share Price `
Sensex during the Month High Share Price `
Low Share Price `
Nifty during the Month
High Low High Low
Apr-11 147.90 123.00 19,811.14 18,976.19 149.80 122.55 5,944.45 5,693.25
May-11 131.30 112.00 19,253.87 17,786.13 131.75 114.30 5,775.25 5,328.70
Jun-11 128.40 118.25 18,873.39 17,314.38 131.30 118.90 5,657.90 5,195.90
Jul-11 143.65 124.40 19,131.70 18,131.86 138.00 124.70 5,740.40 5,453.95
Aug-11 129.00 108.00 18,440.07 15,765.53 130.00 108.10 5,551.90 4,720.00
Sep-11 118.50 105.10 17,211.80 15,801.01 118.80 105.50 5,169.25 4,758.85
Oct-11 112.00 97.25 17,908.13 15,745.43 112.50 98.00 5,399.70 4,728.30
Nov-11 110.05 95.50 17,702.26 15,478.69 120.00 97.00 5,326.45 4,639.10
Dec-11 106.00 88.15 17,003.71 15,135.86 105.45 89.00 5,099.25 4,531.15
Jan-12 112.50 91.05 17,258.97 15,358.02 112.40 90.50 5,217.00 4,588.05
Feb-12 134.30 102.25 18,523.78 17,061.55 134.35 101.60 5,629.95 5,159.00
Mar-12 118.50 99.15 18,040.69 16,920.61 118.90 98.65 5,499.40 5,135.95
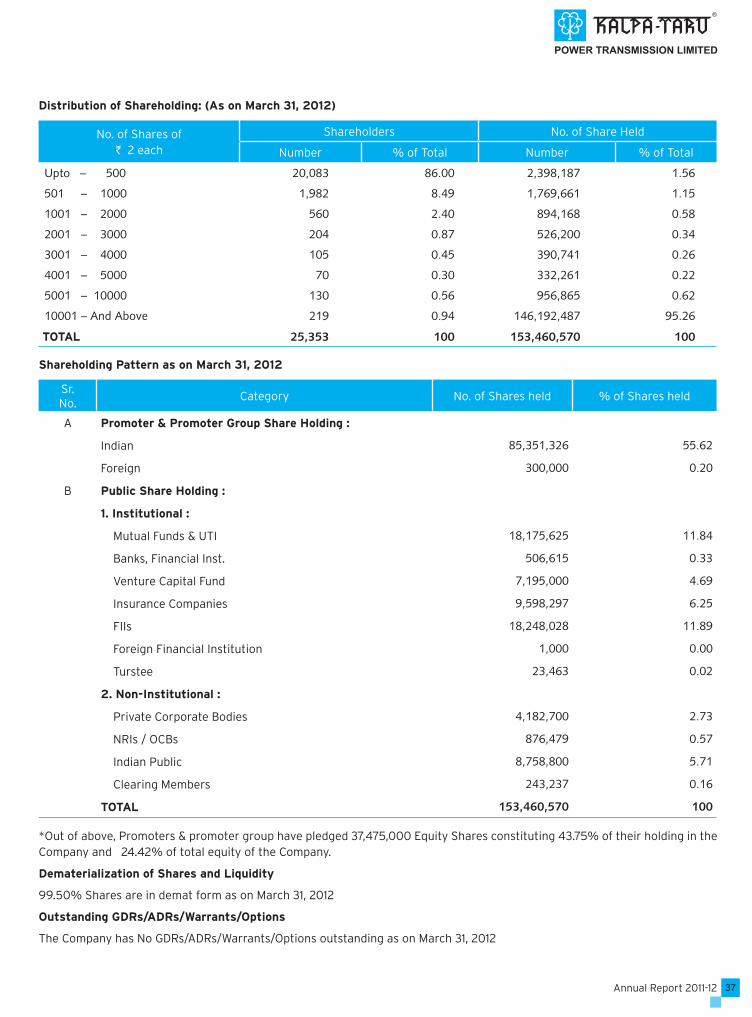
37Annual Report 2011-12
Distribution of Shareholding: (As on March 31, 2012)
No. of Shares of ` 2 each
Shareholders No. of Share Held
Number % of Total Number % of Total
Upto – 500 20,083 86.00 2,398,187 1.56
501 – 1000 1,982 8.49 1,769,661 1.15
1001 – 2000 560 2.40 894,168 0.58
2001 – 3000 204 0.87 526,200 0.34
3001 – 4000 105 0.45 390,741 0.26
4001 – 5000 70 0.30 332,261 0.22
5001 – 10000 130 0.56 956,865 0.62
10001 – And Above 219 0.94 146,192,487 95.26
TOTAL 25,353 100 153,460,570 100
Shareholding Pattern as on March 31, 2012
Sr. No.
Category No. of Shares held % of Shares held
A Promoter & Promoter Group Share Holding :
Indian 85,351,326 55.62
Foreign 300,000 0.20
B Public Share Holding :
1. Institutional :
Mutual Funds & UTI 18,175,625 11.84
Banks, Financial Inst. 506,615 0.33
Venture Capital Fund 7,195,000 4.69
Insurance Companies 9,598,297 6.25
FIIs 18,248,028 11.89
Foreign Financial Institution 1,000 0.00
Turstee 23,463 0.02
2. Non-Institutional :
Private Corporate Bodies 4,182,700 2.73
NRIs / OCBs 876,479 0.57
Indian Public 8,758,800 5.71
Clearing Members 243,237 0.16
TOTAL 153,460,570 100
*Out of above, Promoters & promoter group have pledged 37,475,000 Equity Shares constituting 43.75% of their holding in the Company and 24.42% of total equity of the Company.
Dematerialization of Shares and Liquidity
99.50% Shares are in demat form as on March 31, 2012
Outstanding GDRs/ADRs/Warrants/Options
The Company has No GDRs/ADRs/Warrants/Options outstanding as on March 31, 2012
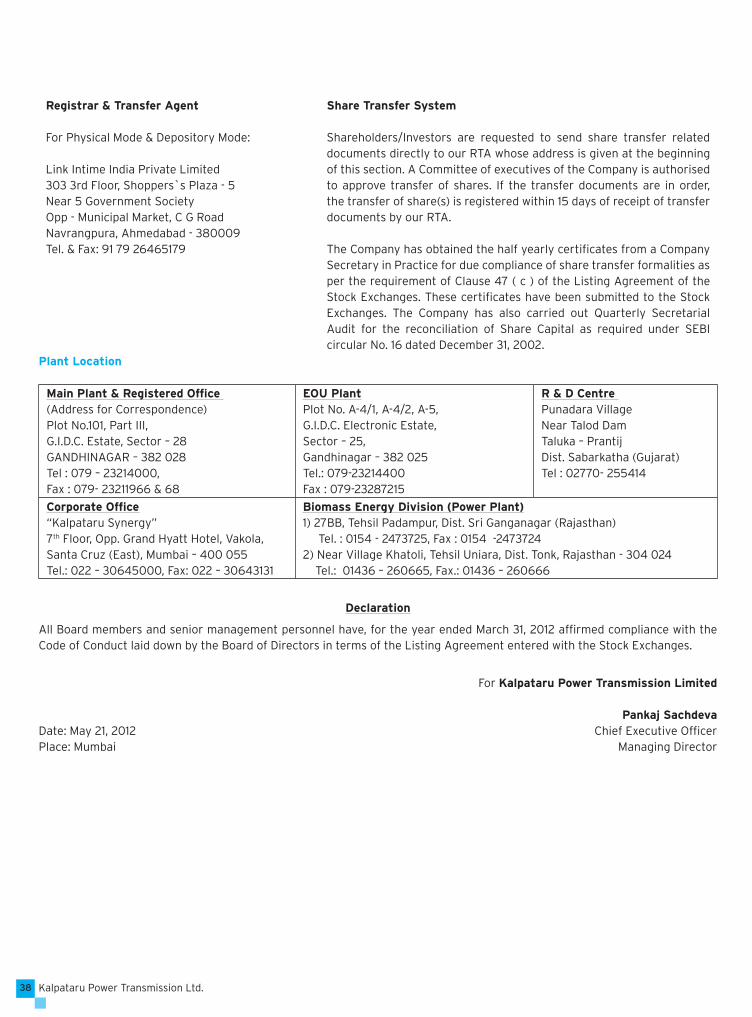
Kalpataru Power Transmission Ltd.38
Registrar & Transfer Agent
For Physical Mode & Depository Mode:
Link Intime India Private Limited303 3rd Floor, Shoppers`s Plaza - 5Near 5 Government SocietyOpp - Municipal Market, C G RoadNavrangpura, Ahmedabad - 380009Tel. & Fax: 91 79 26465179
Share Transfer System
Shareholders/Investors are requested to send share transfer related documents directly to our RTA whose address is given at the beginning of this section. A Committee of executives of the Company is authorised to approve transfer of shares. If the transfer documents are in order, the transfer of share(s) is registered within 15 days of receipt of transfer documents by our RTA.
The Company has obtained the half yearly certifi cates from a Company Secretary in Practice for due compliance of share transfer formalities as per the requirement of Clause 47 ( c ) of the Listing Agreement of the Stock Exchanges. These certifi cates have been submitted to the Stock Exchanges. The Company has also carried out Quarterly Secretarial Audit for the reconciliation of Share Capital as required under SEBI circular No. 16 dated December 31, 2002.
Plant Location
Main Plant & Registered Offi ce (Address for Correspondence)Plot No.101, Part III, G.I.D.C. Estate, Sector – 28GANDHINAGAR – 382 028 Tel : 079 – 23214000, Fax : 079- 23211966 & 68
EOU PlantPlot No. A-4/1, A-4/2, A-5, G.I.D.C. Electronic Estate,Sector – 25,Gandhinagar – 382 025Tel.: 079-23214400Fax : 079-23287215
R & D Centre Punadara VillageNear Talod DamTaluka – PrantijDist. Sabarkatha (Gujarat)Tel : 02770- 255414
Corporate Offi ce “Kalpataru Synergy” 7th Floor, Opp. Grand Hyatt Hotel, Vakola, Santa Cruz (East), Mumbai – 400 055Tel.: 022 – 30645000, Fax: 022 – 30643131
Biomass Energy Division (Power Plant)1) 27BB, Tehsil Padampur, Dist. Sri Ganganagar (Rajasthan) Tel. : 0154 - 2473725, Fax : 0154 -2473724 2) Near Village Khatoli, Tehsil Uniara, Dist. Tonk, Rajasthan - 304 024 Tel.: 01436 – 260665, Fax.: 01436 – 260666
Declaration
All Board members and senior management personnel have, for the year ended March 31, 2012 affi rmed compliance with the Code of Conduct laid down by the Board of Directors in terms of the Listing Agreement entered with the Stock Exchanges.
For Kalpataru Power Transmission Limited
Pankaj SachdevaDate: May 21, 2012 Chief Executive Offi cerPlace: Mumbai Managing Director

39Annual Report 2011-12
AUDITORS’ REPORT ON CORPORATE GOVERNANCETo
The Members of
Kalpataru Power Transmission Ltd.
We have examined the compliance of the conditions of Corporate Governance by Kalpataru Power Transmission Limited (‘the Company’) for the year ended March 31, 2012 as stipulated in Clause 49 of the Listing Agreement of the Company with Stock Exchanges in India.
The compliance of conditions of Corporate Governance is the responsibility of the management. Our examination was limited to a review of the procedures and implementation thereof, adopted by the Company for ensuring the compliance of the conditions of Corporate Governance. It is neither an audit nor an expression of the opinion on the fi nancial statements of the Company.
In our opinion and to the best of our information and explanations given to us, we certify that the Company has complied with the conditions of Corporate Governance as stipulated in the above mentioned Listing Agreement.
We further state that such compliance is neither an assurance as to the future viability of the Company nor of the effi ciency or effectiveness with which the management has conducted the affairs of the Company.
For Deloitte Haskins & SellsChartered Accountants
(Gaurav J. Shah)PartnerMembership No. 35701Place: MumbaiDate: May 21, 2012
CEO/CFO Certifi cateBoard of DirectorsKalpataru Power Transmission Limited
We, Pankaj Sachdeva, Managing Director and Kamal Jain, Chief Financial Offi cer, to the best of our knowledge and belief, hereby certify that:(a) We have reviewed fi nancial statements and the cash fl ow statement for the year ended March 31, 2012 and:
(i) these statements do not contain any materially untrue statement or omit any material fact or contain statements that might be misleading;
(ii) these statements together present a true and fair view of the Company’s affairs and are in compliance with existing Accounting Standards, applicable laws and regulations.
(b) To the best of our knowledge and belief, no transaction entered into by the Company during the years which are fraudulent, illegal or violative of the Company’s Code of Conduct.
(c) We accept responsibility for establishing and maintaining internal controls for fi nancial reporting and that we have evaluated the effectiveness of internal control systems of the Company pertaining to fi nancial reporting and have disclosed to the Auditors and the Audit Committee, defi ciencies in the design or operation of such internal controls, if any, of which we are aware and the steps we have taken or propose to take to rectify these defi ciencies.
(d) We have indicated to the Auditors and the Audit Committee:
(i) Signifi cant changes in internal control over fi nancial reporting during the year;
(ii) Signifi cant changes in accounting policies during the year and that the same have been disclosed in the notes to the fi nancial statements; and
(iii) Instances of signifi cant fraud of which we have become aware and the involvement therein, if any, of the management or an employee having a signifi cant role in the Company’s internal control system over fi nancial reporting.
Place : Mumbai Pankaj Sachdeva Kamal JainDate : May 21, 2012 Managing Director Chief Financial Offi cer

Kalpataru Power Transmission Ltd.40
Auditors’ Report
TOTHE MEMBERS OFKALPATARU POWER TRANSMISSION LIMITED 1. We have audited the attached Balance Sheet of KALPATARU POWER TRANSMISSION LIMITED (“the Company”) as at
March 31, 2012, the Profi t and Loss Account and the Cash Flow Statement of the Company for the year ended on that date, both annexed thereto. These fi nancial statements are the responsibility of the Company’s management. Our responsibility is to express an opinion on these fi nancial statements based on our audit.
2. We conducted our audit in accordance with auditing standards generally accepted in India. Those Standards require that we plan and perform the audit to obtain reasonable assurance about whether the fi nancial statements are free of material misstatement. An audit includes examining, on a test basis, evidence supporting the amounts and disclosures in the fi nancial statements. An audit also includes assessing the accounting principles used and signifi cant estimates made by management, as well as evaluating the overall fi nancial statement presentation. We believe that our audit provides a reasonable basis for our opinion.
3. As required by the Companies (Auditor’s Report) Order, 2003, (CARO), issued by the Central Government of India in terms of Section 227 (4A) of the Companies Act, 1956 (‘the Act’), we give in the Annexure a statement on the matters specifi ed in paragraphs 4 and 5 of the said Order.
4. Further to our comments in the Annexure referred to in paragraph 3 above, we report that :
(i) we have obtained all the information and explanations, which to the best of our knowledge and belief were necessary for the purposes of our audit;
(ii) in our opinion, proper books of account as required by law have been kept by the Company so far as appears from our examination of such books;
(iii) the Balance Sheet, the Profi t and Loss Account and the Cash Flow Statement dealt with by this report are in agreement with the books of account;
(iv) in our opinion, the Balance Sheet, the Profi t and Loss Account and the Cash Flow Statement dealt with by this report are in compliance with the Accounting Standards referred to in Section 211(3C) of the Companies Act, 1956;
(v) in our opinion and to the best of our information and according to the explanations given to us, the said accounts read with the notes thereon, and subject to third party confi rmations, give the information required by the Companies Act, 1956 in the manner so required and give a true and fair view in conformity with accounting principles generally accepted in India:
i. in the case of the Balance Sheet, of the state of affairs of the Company as at March 31, 2012;
ii. in the case of the Statement of Profi t and Loss, of the profi t of the Company for the year ended on that date; and
iii. in the case of the Cash Flow Statement, of the cash fl ows of the Company for the year ended on that date.
5. On the basis of written representations received from the Directors as on March 31, 2012 taken on record by the Board of Directors, we report that none of the Directors is disqualifi ed as on March 31, 2012 from being appointed as a director in terms of Section 274(1)(g) of the Companies Act, 1956;
For Deloitte Haskins & Sells Chartered Accountants
(Registration No 117365W)
Gaurav J. ShahPartner
(Membership No. 35701)
Place: Mumbai
Date: May 21, 2012

41Annual Report 2011-12
(Referred to in paragraph 3 of our report of even date)
1. In respect of its fi xed assets :
(a) The Company has maintained proper records showing full particulars including quantitative details and situation of fi xed
assets;
(b) As explained to us, the assets have been physically verifi ed by the management in accordance with a phased program of
verifi cation of its fi xed assets adopted by the Company which, in our opinion, is reasonable, considering the size and the
nature of its business. The frequency of verifi cation is reasonable and no material discrepancies have been noticed on
such physical verifi cation.
(c) In our opinion, the Company has not disposed off a substantial part of its fi xed assets during the year and the going
concern status of the Company is not affected.
2. In respect of its inventory :
(a) As explained to us, the inventories were physically verifi ed during the year by the Management at reasonable
intervals.
(b) In our opinion and according to the information and explanation given to us, the procedures of physical verifi cation of
inventories followed by the Management were reasonable and adequate in relation to the size of the Company and the
nature of its business.
(c) In our opinion and according to the information and explanations given to us, the Company has maintained proper
records of its inventories and no material discrepancies were noticed on physical verifi cation.
3. In respect of loans, secured or unsecured, granted by the Company to companies, fi rms or other parties covered in the
Register under Section 301 of the Companies Act, 1956, according to the information and explanations given to us:
(a) The Company has given loans to two companies. In respect of said loans the maximum amount involved during the year
is ` 15,175.93 lacs and the year end balance is ` 15,175.93 lacs.
(b) In our opinion, the rate of interest and other terms and conditions of the loans given by the Company are not prima facie
prejudicial to the interest of the Company.
(c) The said parties have been regular in the payment of principal and interest as per stipulation, if any.
(d) In respect of the said loans and interest thereon, there are no overdue amounts.
(e) The Company has not taken any loan during the year from companies, fi rms or other parties covered in the Register
maintained under Section 301 of the Companies Act, 1956. Consequently, the requirements of Clauses (iii) (f) and (iii) (g)
of paragraph 4 of the Order are not applicable.
4. In our opinion and according to the information and explanations given to us, there are adequate internal control procedures
commensurate with the size of the Company and the nature of its business for the purchases of inventory and fi xed assets
and for the sale of goods and services. During the course of audit, no major weakness has been noticed in the internal
controls in respect of these areas.
5. In respect of contracts or arrangements entered in the Register maintained in pursuance of Section 301 of the Companies
Act, 1956, to the best of our knowledge and belief and according to the information and explanations given to us:
(a) The particulars of contracts or arrangements referred to Section 301 that needed to be entered in the Register
maintained under the said Section have been so entered.
(b) In our opinion and according to the information and explanations given to us, the transactions made in pursuance
Annexure to the Auditors’ Report
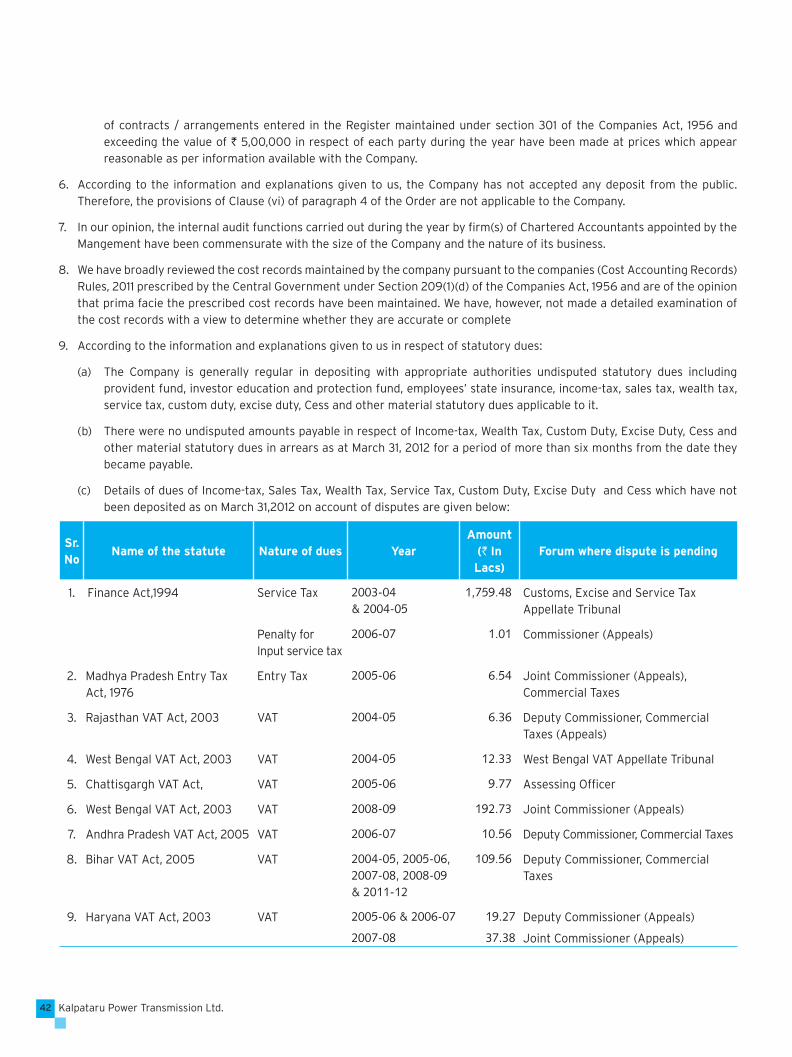
Kalpataru Power Transmission Ltd.42
of contracts / arrangements entered in the Register maintained under section 301 of the Companies Act, 1956 and
exceeding the value of ` 5,00,000 in respect of each party during the year have been made at prices which appear
reasonable as per information available with the Company.
6. According to the information and explanations given to us, the Company has not accepted any deposit from the public.
Therefore, the provisions of Clause (vi) of paragraph 4 of the Order are not applicable to the Company.
7. In our opinion, the internal audit functions carried out during the year by fi rm(s) of Chartered Accountants appointed by the
Mangement have been commensurate with the size of the Company and the nature of its business.
8. We have broadly reviewed the cost records maintained by the company pursuant to the companies (Cost Accounting Records)
Rules, 2011 prescribed by the Central Government under Section 209(1)(d) of the Companies Act, 1956 and are of the opinion
that prima facie the prescribed cost records have been maintained. We have, however, not made a detailed examination of
the cost records with a view to determine whether they are accurate or complete
9. According to the information and explanations given to us in respect of statutory dues:
(a) The Company is generally regular in depositing with appropriate authorities undisputed statutory dues including
provident fund, investor education and protection fund, employees’ state insurance, income-tax, sales tax, wealth tax,
service tax, custom duty, excise duty, Cess and other material statutory dues applicable to it.
(b) There were no undisputed amounts payable in respect of Income-tax, Wealth Tax, Custom Duty, Excise Duty, Cess and
other material statutory dues in arrears as at March 31, 2012 for a period of more than six months from the date they
became payable.
(c) Details of dues of Income-tax, Sales Tax, Wealth Tax, Service Tax, Custom Duty, Excise Duty and Cess which have not
been deposited as on March 31,2012 on account of disputes are given below:
Sr. No
Name of the statute Nature of dues YearAmount
(` In Lacs)
Forum where dispute is pending
1. Finance Act,1994 Service Tax 2003-04& 2004-05
1,759.48 Customs, Excise and Service Tax Appellate Tribunal
Penalty forInput service tax
2006-07 1.01 Commissioner (Appeals)
2. Madhya Pradesh Entry Tax Act, 1976
Entry Tax 2005-06 6.54 Joint Commissioner (Appeals), Commercial Taxes
3. Rajasthan VAT Act, 2003 VAT 2004-05 6.36 Deputy Commissioner, Commercial Taxes (Appeals)
4. West Bengal VAT Act, 2003 VAT 2004-05 12.33 West Bengal VAT Appellate Tribunal
5. Chattisgargh VAT Act, VAT 2005-06 9.77 Assessing Offi cer
6. West Bengal VAT Act, 2003 VAT 2008-09 192.73 Joint Commissioner (Appeals)
7. Andhra Pradesh VAT Act, 2005 VAT 2006-07 10.56 Deputy Commissioner, Commercial Taxes
8. Bihar VAT Act, 2005 VAT 2004-05, 2005-06,2007-08, 2008-09 & 2011-12
109.56 Deputy Commissioner, Commercial Taxes
9. Haryana VAT Act, 2003 VAT 2005-06 & 2006-07 19.27 Deputy Commissioner (Appeals)
2007-08 37.38 Joint Commissioner (Appeals)

43Annual Report 2011-12
10. There are no accumulated losses of the Company as at March 31, 2012. The Company has not incurred cash losses during the
fi nancial year covered by our audit and in the immediately preceding fi nancial year.
11. In our opinion and according to the information and explanations given to us, the Company has not defaulted in repayment of
dues to a fi nancial institution or bank or debentures holders.
12. The Company has not granted any loans or advances on the basis of security, by way of pledge of shares, debentures
and other securities.
13. As per the information and explanations given to us, the Company is not a chit fund or nidhi mutual benefi t fund/Society,
therefore, the provisions of para 4 (xiii) of the Companies (Auditor’s Report) Order, 2003 are not applicable to the Company.
14. As per the information and explanations given to us, the Company is not dealing or trading in shares, securities, debentures
and other investments. Accordingly, the provisions of para 4(xiv) of the Companies (Auditor’s Report) Order, 2003 are not
applicable to the Company.
15. In our opinion and according to the information and explanations given to us, the terms and conditions of the letter of
comfort given by the Company for loans taken by Company’s subsidiary from banks are not prima facie prejudicial to the
interests of the Company.
16. According to the information and explanations given to us, in our opinion, the term loans raised during the year have been
applied for the purposes for which they were raised.
17. In our opinion and according to the information and explanations given to us and on an overall examination of the Balance
Sheet, we report that funds raised on short-term basis have not been used during the year for long- term investment.
18. The Company has not made any preferential allotment of shares during the year.
19. The Company has not issued any debentures during the year.
20. We have verifi ed the end use of money raised through Qualifi ed Institutional Placement (QIP), as disclosed in note 40 to
the Notes on Financial Statement. Pending utilisation of the funds raised through QIP, a sum of ` 9,500 lacs have been
temporarily deployed in mutual funds and fi xed deposit with banks.
21. In our opinion and according to the information and explanations given to us, no material fraud on or by the Company was
noticed or reported during year.
For Deloitte Haskins & Sells Chartered Accountants
(Registration No 117365W)
Gaurav J. ShahPartner
(Membership No. 35701)
Place: Mumbai
Date: May 21, 2012
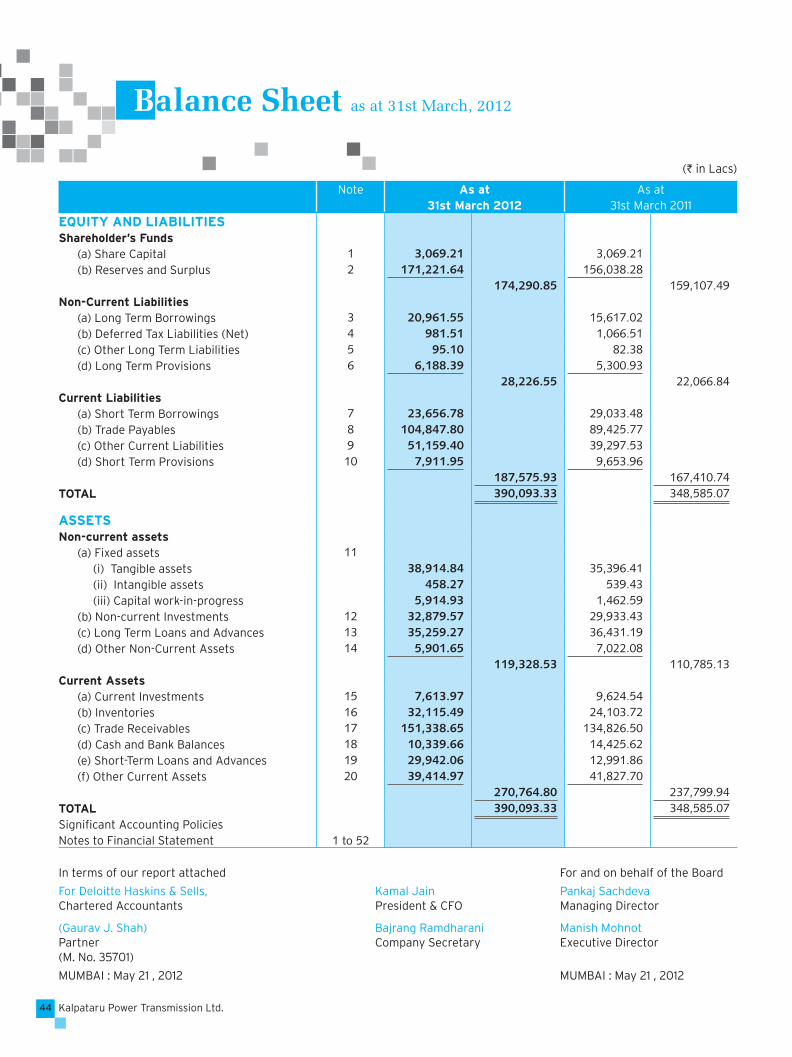
Kalpataru Power Transmission Ltd.44
In terms of our report attached For and on behalf of the Board
For Deloitte Haskins & Sells, Kamal Jain Pankaj SachdevaChartered Accountants President & CFO Managing Director
(Gaurav J. Shah) Bajrang Ramdharani Manish Mohnot Partner Company Secretary Executive Director(M. No. 35701)
MUMBAI : May 21 , 2012 MUMBAI : May 21 , 2012
Balance Sheet as at 31st March, 2012
Note As at31st March 2012
As at31st March 2011
EQUITY AND LIABILITIESShareholder’s Funds
(a) Share Capital 1 3,069.21 3,069.21 (b) Reserves and Surplus 2 171,221.64 156,038.28
174,290.85 159,107.49 Non-Current Liabilities
(a) Long Term Borrowings 3 20,961.55 15,617.02 (b) Deferred Tax Liabilities (Net) 4 981.51 1,066.51 (c) Other Long Term Liabilities 5 95.10 82.38 (d) Long Term Provisions 6 6,188.39 5,300.93
28,226.55 22,066.84 Current Liabilities
(a) Short Term Borrowings 7 23,656.78 29,033.48 (b) Trade Payables 8 104,847.80 89,425.77 (c) Other Current Liabilities 9 51,159.40 39,297.53 (d) Short Term Provisions 10 7,911.95 9,653.96
187,575.93 167,410.74 TOTAL 390,093.33 348,585.07
ASSETSNon-current assets
(a) Fixed assets 11 (i) Tangible assets 38,914.84 35,396.41 (ii) Intangible assets 458.27 539.43 (iii) Capital work-in-progress 5,914.93 1,462.59 (b) Non-current Investments 12 32,879.57 29,933.43 (c) Long Term Loans and Advances 13 35,259.27 36,431.19 (d) Other Non-Current Assets 14 5,901.65 7,022.08
119,328.53 110,785.13 Current Assets
(a) Current Investments 15 7,613.97 9,624.54 (b) Inventories 16 32,115.49 24,103.72 (c) Trade Receivables 17 151,338.65 134,826.50 (d) Cash and Bank Balances 18 10,339.66 14,425.62 (e) Short-Term Loans and Advances 19 29,942.06 12,991.86 (f) Other Current Assets 20 39,414.97 41,827.70
270,764.80 237,799.94 TOTAL 390,093.33 348,585.07 Signifi cant Accounting Policies Notes to Financial Statement 1 to 52
(` in Lacs)

45Annual Report 2011-12
In terms of our report attached For and on behalf of the Board
For Deloitte Haskins & Sells, Kamal Jain Pankaj SachdevaChartered Accountants President & CFO Managing Director
(Gaurav J. Shah) Bajrang Ramdharani Manish Mohnot Partner Company Secretary Executive Director(M. No. 35701)
MUMBAI : May 21 , 2012 MUMBAI : May 21 , 2012
Statement of Profit and Loss for the year ended 31st March, 2012
Note 2011 - 2012 2010 - 2011
INCOME
Revenue from Operations - Gross 21 309,219.20 293,856.57
Less: Excise Duty 5,948.01 6,038.67
Revenue from Operations - Net 303,271.19 287,817.90
Other Income 22 5,118.33 4,695.25
TOTAL REVENUE 308,389.52 292,513.15
EXPENSES
Cost of Materials Consumed 23 148,857.98 127,679.63
(Increase) / Decrease in Stocks 24 1,434.16 1,254.15
Employee Benefi t Expenses 25 17,023.11 18,706.01
Other Expenses 26 103,031.24 105,831.82
Financial costs 27 10,824.86 8,790.92
Depreciation and Amortization Expense 45 4,809.74 4,592.67
TOTAL EXPENSES 285,981.09 266,855.20
Profi t Before Tax 22,408.43 25,657.95
Tax Expenses
Current Tax 6,650.00 6,943.00
Excess Provision in prior year (647.38) -
Deferred Tax (85.00) (341.32)
Net Profi t for the year 16,490.81 19,056.27
Earnings per Equity Share of ` 2 each
Basic and Diluted (`) 46 10.75 12.58
Signifi cant Accounting Policies Notes to Financial Statement 1 to 52
(` in Lacs)
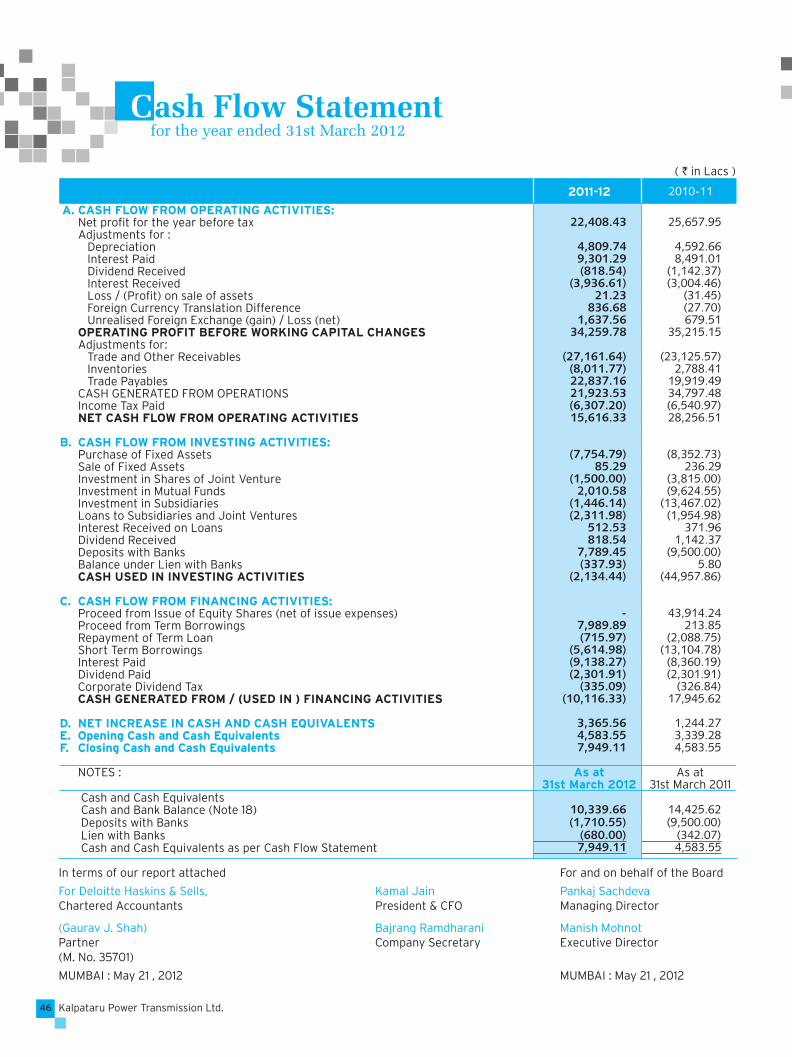
Kalpataru Power Transmission Ltd.46
Cash Flow Statement for the year ended 31st March 2012
( ` in Lacs )
2011-12 2010-11
A. CASH FLOW FROM OPERATING ACTIVITIES:Net profi t for the year before tax 22,408.43 25,657.95 Adjustments for : Depreciation 4,809.74 4,592.66 Interest Paid 9,301.29 8,491.01 Dividend Received (818.54) (1,142.37) Interest Received (3,936.61) (3,004.46) Loss / (Profi t) on sale of assets 21.23 (31.45) Foreign Currency Translation Difference 836.68 (27.70) Unrealised Foreign Exchange (gain) / Loss (net) 1,637.56 679.51 OPERATING PROFIT BEFORE WORKING CAPITAL CHANGES 34,259.78 35,215.15 Adjustments for: Trade and Other Receivables (27,161.64) (23,125.57) Inventories (8,011.77) 2,788.41 Trade Payables 22,837.16 19,919.49 CASH GENERATED FROM OPERATIONS 21,923.53 34,797.48 Income Tax Paid (6,307.20) (6,540.97)NET CASH FLOW FROM OPERATING ACTIVITIES 15,616.33 28,256.51
B. CASH FLOW FROM INVESTING ACTIVITIES:Purchase of Fixed Assets (7,754.79) (8,352.73)Sale of Fixed Assets 85.29 236.29 Investment in Shares of Joint Venture (1,500.00) (3,815.00)Investment in Mutual Funds 2,010.58 (9,624.55)Investment in Subsidiaries (1,446.14) (13,467.02)Loans to Subsidiaries and Joint Ventures (2,311.98) (1,954.98)Interest Received on Loans 512.53 371.96 Dividend Received 818.54 1,142.37 Deposits with Banks 7,789.45 (9,500.00)Balance under Lien with Banks (337.93) 5.80 CASH USED IN INVESTING ACTIVITIES (2,134.44) (44,957.86)
C. CASH FLOW FROM FINANCING ACTIVITIES:Proceed from Issue of Equity Shares (net of issue expenses) - 43,914.24 Proceed from Term Borrowings 7,989.89 213.85 Repayment of Term Loan (715.97) (2,088.75)Short Term Borrowings (5,614.98) (13,104.78)Interest Paid (9,138.27) (8,360.19)Dividend Paid (2,301.91) (2,301.91)Corporate Dividend Tax (335.09) (326.84)CASH GENERATED FROM / (USED IN ) FINANCING ACTIVITIES (10,116.33) 17,945.62
D. NET INCREASE IN CASH AND CASH EQUIVALENTS 3,365.56 1,244.27 E. Opening Cash and Cash Equivalents 4,583.55 3,339.28 F. Closing Cash and Cash Equivalents 7,949.11 4,583.55
NOTES : As at As at 31st March 2012 31st March 2011
Cash and Cash Equivalents Cash and Bank Balance (Note 18) 10,339.66 14,425.62 Deposits with Banks (1,710.55) (9,500.00) Lien with Banks (680.00) (342.07) Cash and Cash Equivalents as per Cash Flow Statement 7,949.11 4,583.55
In terms of our report attached For and on behalf of the Board
For Deloitte Haskins & Sells, Kamal Jain Pankaj SachdevaChartered Accountants President & CFO Managing Director
(Gaurav J. Shah) Bajrang Ramdharani Manish Mohnot Partner Company Secretary Executive Director(M. No. 35701)
MUMBAI : May 21 , 2012 MUMBAI : May 21 , 2012

47Annual Report 2011-12
A. Basis of preparation of Financial Statement
The Financial Statements are prepared under the historical cost convention, except for certain fi xed assets which are revalued, in accordance with the generally accepted accounting principles in India and the provisions of the Companies Act, 1956.
B. Use of Estimates:
The presentation of fi nancial statements requires certain estimates and assumptions. These estimates and assumptions affect the reported amounts of assets and liabilities on the date of the fi nancial statements and the reported amounts of revenues and expenses during the reporting period. Differences between the actual results and estimates are recognized in the period in which the results are known / materialized.
C. Fixed Assets:
Fixed assets are stated at cost of acquisition/construction net of recoverable taxes and include amounts added on revaluation, less accumulated depreciation / amortization and impairment loss, if any. All costs, including fi nance costs and adjustment arising from exchange rate variations attributable to fi xed assets till assets are put to use, are capitalized.
D. Depreciation:
Depreciation is provided on the basis of straight-line method on all depreciable fi xed assets at the rates prescribed in Schedule –XIV of the Companies Act, 1956, on pro-rata basis except:
a) Depreciation pertaining to assets of Research and Development Centre and of the Export Oriented Unit is provided on the basis of written down value method.
b) Depreciation on plant and machinery of bio-mass energy plants is provided at a higher rate at 7.5% instead of the prescribed rate for continuous process plant considering the useful life of plant supported by technical evaluation and report.
c) In case of revalued assets, the difference between the depreciation based on revalued cost and the depreciation charged on historical cost is recouped out of revaluation reserve.
d) Depreciation on assets of overseas projects is provided at the rates as per the requirement of laws of respective foreign countries. Such rates of depreciation in each overseas project are higher than the depreciation at prescribed rates under Schedule-XIV of the Companies Act, 1956.
e) Depreciation on all the vehicles in the Company is provided at a higher rate at 15% instead of the prescribed rate, considering the useful life of vehicles based on technical evaluation of the management.
f) Intangible assets are amortized over a period of fi ve years on prorata basis.
E. Impairment of assets:
The carrying amount of assets is reviewed at each balance sheet date to determine whether there is any indication of impairment. If any such indication exists, the recoverable amount of the assets is estimated. An impairment loss is recognized whenever the carrying amount of an asset or its cash generating units exceeds its recoverable amount. An impairment loss is reversed if there has been a change in the estimates used to determine the recoverable amount and recognized in compliance with AS-28.
F. Investments:
Long term investments are stated at cost after deducting the provision for diminution in value, if any, other than of a temporary nature. Current investments are stated at lower of cost and fair value.
G. Inventories:
Raw materials, Fuel, Semi fi nished goods, Finished goods, scraps, construction work in progress, construction and other stores and spares, tools are stated at lower of cost and net estimated realizable value. The cost of inventories is computed on weighted average basis.
H. Revenue Recognition:
(i) Transmission & Distribution Division:
Sales are recognized on delivery of materials. Sales include excise duty, freight receipts and export benefi ts but exclude VAT.
Erection and works contract revenue for work completed is recognized on percentage of completion method based on completion of physical proportion of the contract work. When it is probable that total contract cost will exceed the total contract revenue, the expected loss is recognized immediately.
Significant Accounting Policies

Kalpataru Power Transmission Ltd.48
(ii) Infrastructure Division:
Revenue is recognized by adding the aggregate cost and proportionate margin using the percentage completion method. Percentage of completion is determined as a proportion of cost incurred to date to the total estimated contract cost. When it is probable that total contract cost will exceed the total contract revenue, the expected loss is recognized immediately.
(iii) Bio-mass Energy Division:
Revenue is recognized on supply of electricity generated to the customer.
(iv) Others
Dividends are recorded when the right to receive payment is established. Interest income is recognized on time proportion basis.
I. Retirement Benefi ts:
(i) Gratuity liability is provided under a defi ned benefi t plan, under Group Gratuity Cash Accumulation Scheme of the Life Insurance Corporation of India under an irrevocable trust. The Company’s liability towards gratuity is determined on the basis of actuarial valuation done by an independent actuary.
(ii) Contribution to Provident Fund, a defi ned contribution plan is charged to the Profi t and Loss Account.
(iii) Provision for leave encashment liability is made on actuarial valuation as at the Balance Sheet date.
(iv) Short-term employee benefi ts are recognized as an expense at the undiscounted amount in the profi t and loss account of the year in which the related service is rendered.
J. Excise/Custom Duty:
The liability for excise and custom duty in respect of materials lying in factory/bonded premises is accounted for as and when they are cleared / debonded.
K. Foreign Currency Transactions:
Foreign currency transactions are accounted during the year at the exchange rates prevailing for the month of transaction.
Foreign currency assets and liabilities, remaining unsettled at the end of the year are translated at the exchange rate prevailing at the end of the year and difference is adjusted to respective accounts in profi t & loss account.
In case of transactions covered by forward exchange contracts, which are not intended for trading or speculation purpose, premium or discount are amortized as expenses or income over the life of the contract.
Any profi t or losses arising on settlement or cancellation of foreign currency forward contracts or options are recognized in profi t & loss account for year in which settlement or cancellation takes place.
Translation of overseas jobs / projects of non-integral foreign operations:
a) Assets and liabilities at the rates prevailing at the end of the year.
b) Income and expenses at the exchange rate prevailing for the month of transaction.
c) Resulting exchange differences are accumulated in foreign currency translation reserve account.
L. Borrowing Costs:
Borrowing costs that are directly attributable to the acquisition, construction or production of qualifying assets are capitalized as part of the cost of such assets. All other borrowing costs are recognized as expense in the period in which they are incurred.
M. Taxes on Income:
a) Tax on income for the current period is determined on the basis of estimated taxable income and tax credit computed in accordance with the provisions of the Income Tax Act, 1961.
b) Deferred tax is recognized on timing difference between estimated taxable income and accounting income that originate in one period and are capable of reversal in one or more subsequent period(s) and quantifi ed using the tax rates and laws enacted or substantively enacted as on the balance sheet date.
c) Deferred tax assets which arise mainly on account of unabsorbed losses or unabsorbed depreciation are recognized and carried forward only to the extent that there is virtual certainty supported by convincing evidence that suffi cient future taxable income will be available against which such deferred tax assets can be realized.
N. Provisions, Contingent Liabilities and Contingent Assets:
i) Provisions involving substantial degree of estimation in measurement are recognized when there is a present obligation as a result of past events and that probability requires an outfl ow of resources.
ii) A disclosure for a contingent liability is made when there is a possible obligation or a present obligation that may, but probably will not, require an outfl ow of resources. Where there is a possible obligation or a present obligation in respect of which the likelihood of outfl ow of resources is remote, no disclosure is made.
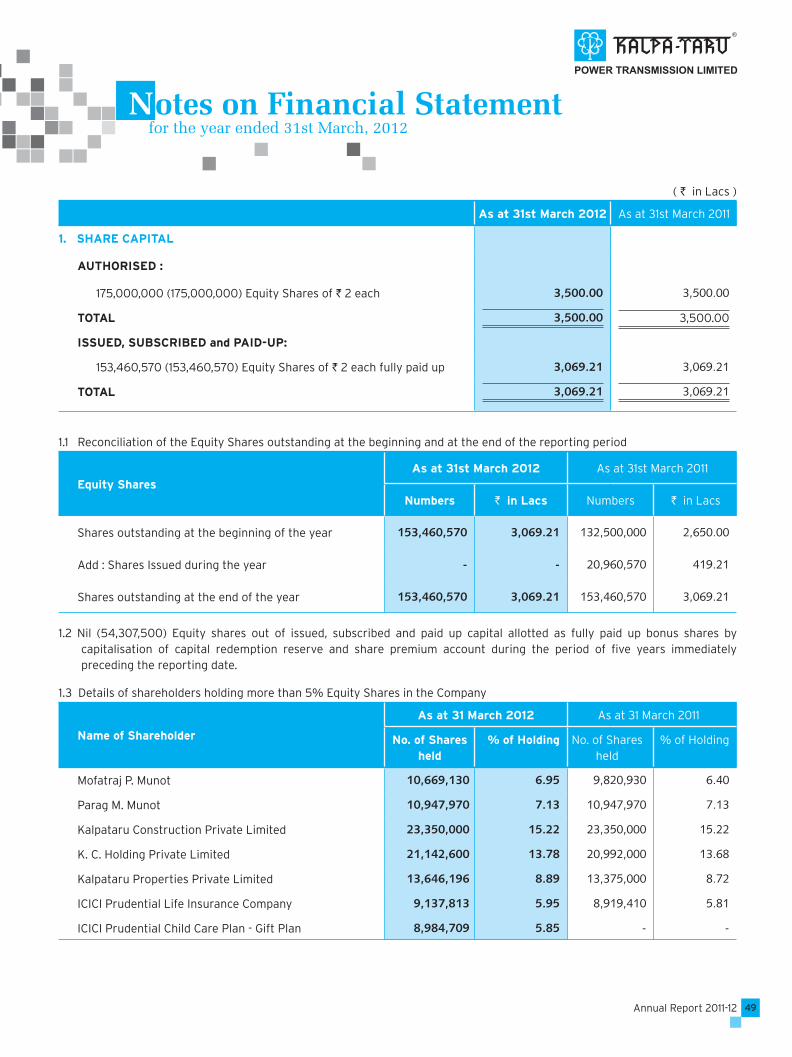
49Annual Report 2011-12
( ` in Lacs )
As at 31st March 2012 As at 31st March 2011
1. SHARE CAPITAL
AUTHORISED :
175,000,000 (175,000,000) Equity Shares of ` 2 each 3,500.00 3,500.00
TOTAL 3,500.00 3,500.00
ISSUED, SUBSCRIBED and PAID-UP:
153,460,570 (153,460,570) Equity Shares of ` 2 each fully paid up 3,069.21 3,069.21
TOTAL 3,069.21 3,069.21
1.1 Reconciliation of the Equity Shares outstanding at the beginning and at the end of the reporting period
Equity SharesAs at 31st March 2012 As at 31st March 2011
Numbers ` in Lacs Numbers ` in Lacs
Shares outstanding at the beginning of the year 153,460,570 3,069.21 132,500,000 2,650.00
Add : Shares Issued during the year - - 20,960,570 419.21
Shares outstanding at the end of the year 153,460,570 3,069.21 153,460,570 3,069.21
1.2 Nil (54,307,500) Equity shares out of issued, subscribed and paid up capital allotted as fully paid up bonus shares by capitalisation of capital redemption reserve and share premium account during the period of fi ve years immediately preceding the reporting date.
1.3 Details of shareholders holding more than 5% Equity Shares in the Company
Name of Shareholder
As at 31 March 2012 As at 31 March 2011
No. of Shares held
% of Holding No. of Shares held
% of Holding
Mofatraj P. Munot 10,669,130 6.95 9,820,930 6.40
Parag M. Munot 10,947,970 7.13 10,947,970 7.13
Kalpataru Construction Private Limited 23,350,000 15.22 23,350,000 15.22
K. C. Holding Private Limited 21,142,600 13.78 20,992,000 13.68
Kalpataru Properties Private Limited 13,646,196 8.89 13,375,000 8.72
ICICI Prudential Life Insurance Company 9,137,813 5.95 8,919,410 5.81
ICICI Prudential Child Care Plan - Gift Plan 8,984,709 5.85 - -
Notes on Financial Statement for the year ended 31st March, 2012
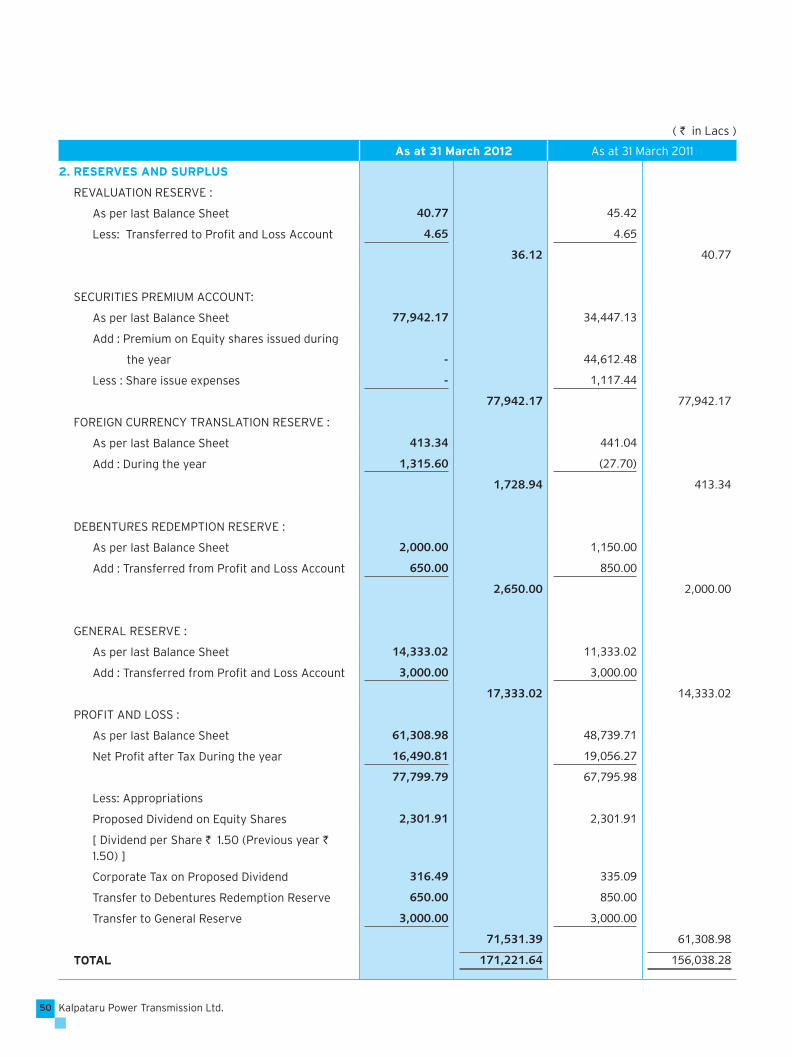
Kalpataru Power Transmission Ltd.50
( ` in Lacs )
As at 31 March 2012 As at 31 March 2011
2. RESERVES AND SURPLUS
REVALUATION RESERVE :
As per last Balance Sheet 40.77 45.42
Less: Transferred to Profi t and Loss Account 4.65 4.65
36.12 40.77
SECURITIES PREMIUM ACCOUNT:
As per last Balance Sheet 77,942.17 34,447.13
Add : Premium on Equity shares issued during
the year - 44,612.48
Less : Share issue expenses - 1,117.44
77,942.17 77,942.17
FOREIGN CURRENCY TRANSLATION RESERVE :
As per last Balance Sheet 413.34 441.04
Add : During the year 1,315.60 (27.70)
1,728.94 413.34
DEBENTURES REDEMPTION RESERVE :
As per last Balance Sheet 2,000.00 1,150.00
Add : Transferred from Profi t and Loss Account 650.00 850.00
2,650.00 2,000.00
GENERAL RESERVE :
As per last Balance Sheet 14,333.02 11,333.02
Add : Transferred from Profi t and Loss Account 3,000.00 3,000.00
17,333.02 14,333.02
PROFIT AND LOSS :
As per last Balance Sheet 61,308.98 48,739.71
Net Profi t after Tax During the year 16,490.81 19,056.27
77,799.79 67,795.98
Less: Appropriations
Proposed Dividend on Equity Shares 2,301.91 2,301.91
[ Dividend per Share ` 1.50 (Previous year ` 1.50) ]
Corporate Tax on Proposed Dividend 316.49 335.09
Transfer to Debentures Redemption Reserve 650.00 850.00
Transfer to General Reserve 3,000.00 3,000.00
71,531.39 61,308.98
TOTAL 171,221.64 156,038.28

51Annual Report 2011-12
( ` in Lacs )
As at 31 March 2012 As at 31 March 2011
Non-Current Current Non-Current Current
3. LONG TERM BORROWINGS
Secured
Non-Convertible Redeemable Debentures 13,250.00 1,750.00 15,000.00 -
Term Loans
Foreign Currency Loans
From Banks 7,375.50 565.16 493.27 493.28
Rupee Loans
From NBFC 196.72 155.05 - -
From Banks 139.33 123.26 123.75 98.92
Amount disclosed under the head Others Current
Liabilities (Note 9) (2,593.47) (592.20)
TOTAL 20,961.55 - 15,617.02 -
3.1 Details of Secured Non-Convertible Redeemable Debentures:
Face Value per Debentures (` )
Redemption Profi le Amount` Lacs
Interest Date of Allotment
100,000 Redeemable at face value in 3 equal annual instalments at the end of 5th, 6th & 7th Year starting from 26.12.2013
8,000.00 12.50% p.a. payableannually
December 26, 2008
1,000,000 Redeemable at face value in 3 instalments - 25% each at the end of 3rd year and 4th year and 50% at the end of 5th year starting from 15.07.2012
7,000.00 9.55% p.a. payable semi annually
July 15, 2009
Security:The debentures are secured by fi rst exclusive charge on movable and immovable fi xed assets (including land and building situated at Gandhinagar, Gujarat) of transmission & distribution division and infrastructure division of Company to the extent of 1.25 times of NCDs outstanding.
3.2 Foreign Currency Loans:
Loan Amount` in Lacs
Security Interest Repayment Terms
565.16 Secured by charge over all the movable and immovable Plant and Machineries of Biomass Power Plant situated at Uniara
3 M $ Libor + spread
Repayable in 21 equal instalments payable on quarterly basis starting from 04.01.2008
7,375.50 Secured by charge over specifi c movable fi xed assets fi nanced through this loan.
3M $ Libor + spread
Repayable in 13 equal instalments payable on quarterly basis starting from 21.10.2013
3.3 Rupee Loans:
(a) Rupee loans from NBFC carries interest of 10.25% p.a. and is repayable in 35 equal monthly instalments along with interest. The loan is secured by hypothecation of specifi c movable fi xed assets of the Company.
(b) Rupee loans from Bank carries interest in the range of 6.99% - 10.85% p.a. and is repayable in 35 / 36 equal monthly instalments along with interest. The loan is secured by hypothecation of Vehicles.
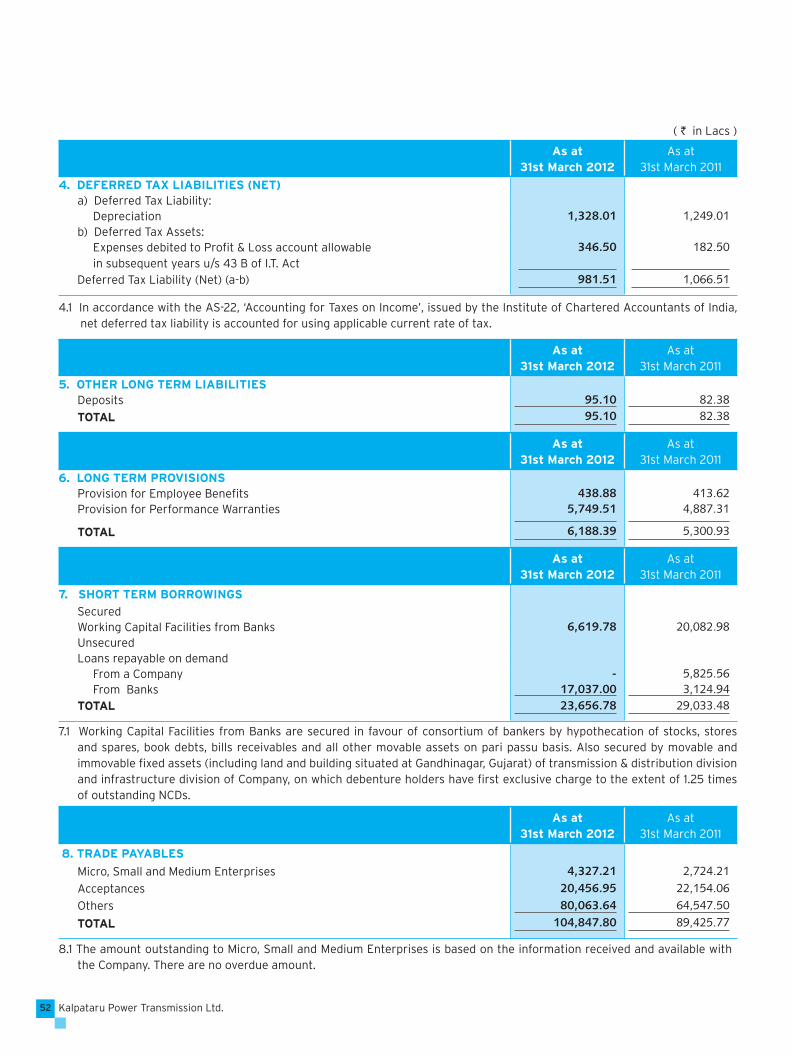
Kalpataru Power Transmission Ltd.52
( ` in Lacs )
As at 31st March 2012
As at 31st March 2011
4. DEFERRED TAX LIABILITIES (NET)a) Deferred Tax Liability: Depreciation 1,328.01 1,249.01 b) Deferred Tax Assets: Expenses debited to Profi t & Loss account allowable in subsequent years u/s 43 B of I.T. Act
346.50 182.50
Deferred Tax Liability (Net) (a-b) 981.51 1,066.51
4.1 In accordance with the AS-22, ‘Accounting for Taxes on Income’, issued by the Institute of Chartered Accountants of India, net deferred tax liability is accounted for using applicable current rate of tax.
As at 31st March 2012
As at 31st March 2011
5. OTHER LONG TERM LIABILITIES Deposits 95.10 82.38 TOTAL 95.10 82.38
As at 31st March 2012
As at 31st March 2011
6. LONG TERM PROVISIONS Provision for Employee Benefi ts 438.88 413.62 Provision for Performance Warranties 5,749.51 4,887.31
TOTAL 6,188.39 5,300.93
As at 31st March 2012
As at 31st March 2011
7. SHORT TERM BORROWINGS
SecuredWorking Capital Facilities from Banks 6,619.78 20,082.98 UnsecuredLoans repayable on demand From a Company - 5,825.56 From Banks 17,037.00 3,124.94 TOTAL 23,656.78 29,033.48
7.1 Working Capital Facilities from Banks are secured in favour of consortium of bankers by hypothecation of stocks, stores and spares, book debts, bills receivables and all other movable assets on pari passu basis. Also secured by movable and immovable fi xed assets (including land and building situated at Gandhinagar, Gujarat) of transmission & distribution division and infrastructure division of Company, on which debenture holders have fi rst exclusive charge to the extent of 1.25 times of outstanding NCDs.
As at 31st March 2012
As at 31st March 2011
8. TRADE PAYABLES
Micro, Small and Medium Enterprises 4,327.21 2,724.21 Acceptances 20,456.95 22,154.06 Others 80,063.64 64,547.50
TOTAL 104,847.80 89,425.77
8.1 The amount outstanding to Micro, Small and Medium Enterprises is based on the information received and available with the Company. There are no overdue amount.

53Annual Report 2011-12
( ` in Lacs )
As at 31st March 2012
As at 31st March 2011
9. OTHER CURRENT LIABILITIES
Current maturities of Long Term debts (refer note no. 3) 2,593.47 592.20
Interest accrued but not due on borrowings 512.94 362.97
Interest accrued and due on borrowings 78.71 65.66
Unclaimed Dividend * 26.72 23.33
Advance from Customers 42,831.24 34,345.05
Statutory Liabilities 2,331.49 3,394.70
Creditors for Capital Expenditure 2,784.83 513.62
TOTAL 51,159.40 39,297.53
* No amount is due for payment to Investor Education and Protection Fund
As at 31st March 2012
As at 31st March 2011
10. SHORT TERM PROVISIONS
Provision for Employee Benefi ts 115.14 66.42
Others
Provision for Performance Warranties 5,178.41 6,950.54
Proposed Dividend 2,301.91 2,301.91
Corporate Tax on Proposed Dividend 316.49 335.09
TOTAL 7,911.95 9,653.96
11. FIXED ASSETS
Particulars
GROSS BLOCK DEPRECIATION NET BLOCK
As at 1st April
2011
Additions* Deductions As at 31st March
2012
As at 1st April
2011
During the Year *
Recouped As at 31st March
2012
As at 31st March
2012
As at 31st March
2011
TANGIBLE ASSETS
Leasehold Land 2,538.41 - - 2,538.41 - - - - 2,538.41 2,538.41
Freehold Land 2,717.19 943.36 - 3,660.55 - - - - 3,660.55 2,717.19
Buildings 6,168.01 649.18 - 6,817.19 809.92 167.86 - 977.78 5,839.41 5,358.09
Plant and Equipment 35,816.41 5,132.85 49.18 40,900.08 14,444.17 4,022.64 37.85 18,428.96 22,471.12 21,372.24
Electric Installation 437.01 26.63 - 463.64 150.06 25.73 - 175.79 287.85 286.95
Furniture and Fixtures 1,394.96 403.19 31.21 1,766.94 389.66 113.19 13.53 489.32 1,277.62 1,005.30
Offi ce Equipments 1,770.06 350.79 35.53 2,085.32 807.41 206.79 20.13 994.07 1,091.25 962.65
Vehicles 2,206.37 1,146.40 162.18 3,190.59 1,050.79 491.24 100.07 1,441.96 1,748.63 1,155.58
Total (A) 53,048.42 8,652.40 278.10 61,422.72 17,652.01 5,027.45 171.58 22,507.88 38,914.84 35,396.41
INTANGIBLE ASSETS
Software 806.20 85.85 - 892.05 266.77 167.01 - 433.78 458.27 539.43 (other than internally generated)
Total (B) 806.20 85.85 - 892.05 266.77 167.01 - 433.78 458.27 539.43
Total (A+B) 53,854.62 8,738.25 278.10 62,314.77 17,918.78 5,194.46 171.58 22,941.66 39,373.11 35,935.84
Previous Year 47,125.66 7,022.51 293.55 53,854.62 13,632.72 4,374.77 88.71 17,918.78 35,935.84 33,492.94
* The carrying amount of the gross block and accumulated depreciation thereon pertaining to the Company’s non-integral foreign operations have been restated at closing exchange rates of the respective foreign currencies and the resultant effect of ` 856.17 lacs (Previous Year ` 247.20 lacs) and of ` 377.25 lacs (Previous Year ` 222.55 lacs) have been included in additions and depreciation for the year respectively.
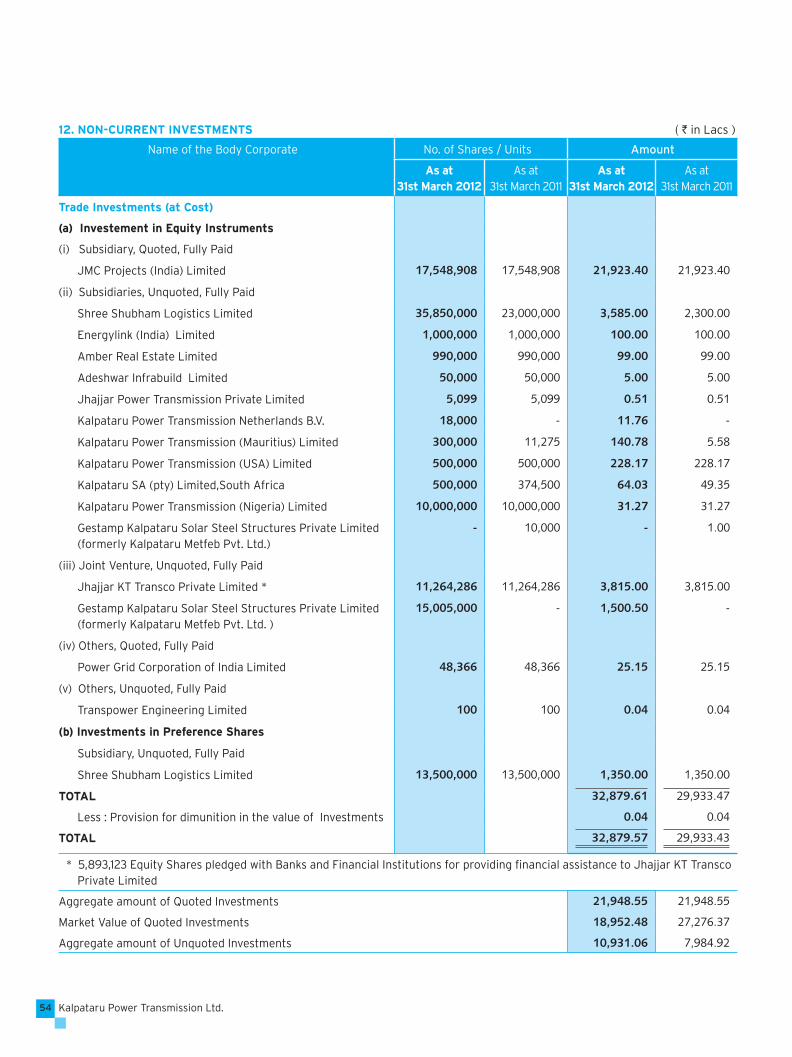
Kalpataru Power Transmission Ltd.54
12. NON-CURRENT INVESTMENTS ( ` in Lacs )
Name of the Body Corporate No. of Shares / Units Amount
As at31st March 2012
As at31st March 2011
As at31st March 2012
As at31st March 2011
Trade Investments (at Cost)
(a) Investement in Equity Instruments
(i) Subsidiary, Quoted, Fully Paid
JMC Projects (India) Limited 17,548,908 17,548,908 21,923.40 21,923.40
(ii) Subsidiaries, Unquoted, Fully Paid
Shree Shubham Logistics Limited 35,850,000 23,000,000 3,585.00 2,300.00
Energylink (India) Limited 1,000,000 1,000,000 100.00 100.00
Amber Real Estate Limited 990,000 990,000 99.00 99.00
Adeshwar Infrabuild Limited 50,000 50,000 5.00 5.00
Jhajjar Power Transmission Private Limited 5,099 5,099 0.51 0.51
Kalpataru Power Transmission Netherlands B.V. 18,000 - 11.76 -
Kalpataru Power Transmission (Mauritius) Limited 300,000 11,275 140.78 5.58
Kalpataru Power Transmission (USA) Limited 500,000 500,000 228.17 228.17
Kalpataru SA (pty) Limited,South Africa 500,000 374,500 64.03 49.35
Kalpataru Power Transmission (Nigeria) Limited 10,000,000 10,000,000 31.27 31.27
Gestamp Kalpataru Solar Steel Structures Private Limited (formerly Kalpataru Metfeb Pvt. Ltd.)
- 10,000 - 1.00
(iii) Joint Venture, Unquoted, Fully Paid
Jhajjar KT Transco Private Limited * 11,264,286 11,264,286 3,815.00 3,815.00
Gestamp Kalpataru Solar Steel Structures Private Limited (formerly Kalpataru Metfeb Pvt. Ltd. )
15,005,000 - 1,500.50 -
(iv) Others, Quoted, Fully Paid
Power Grid Corporation of India Limited 48,366 48,366 25.15 25.15
(v) Others, Unquoted, Fully Paid
Transpower Engineering Limited 100 100 0.04 0.04
(b) Investments in Preference Shares
Subsidiary, Unquoted, Fully Paid
Shree Shubham Logistics Limited 13,500,000 13,500,000 1,350.00 1,350.00
TOTAL 32,879.61 29,933.47
Less : Provision for dimunition in the value of Investments 0.04 0.04
TOTAL 32,879.57 29,933.43
* 5,893,123 Equity Shares pledged with Banks and Financial Institutions for providing fi nancial assistance to Jhajjar KT Transco Private Limited
Aggregate amount of Quoted Investments 21,948.55 21,948.55
Market Value of Quoted Investments 18,952.48 27,276.37
Aggregate amount of Unquoted Investments 10,931.06 7,984.92
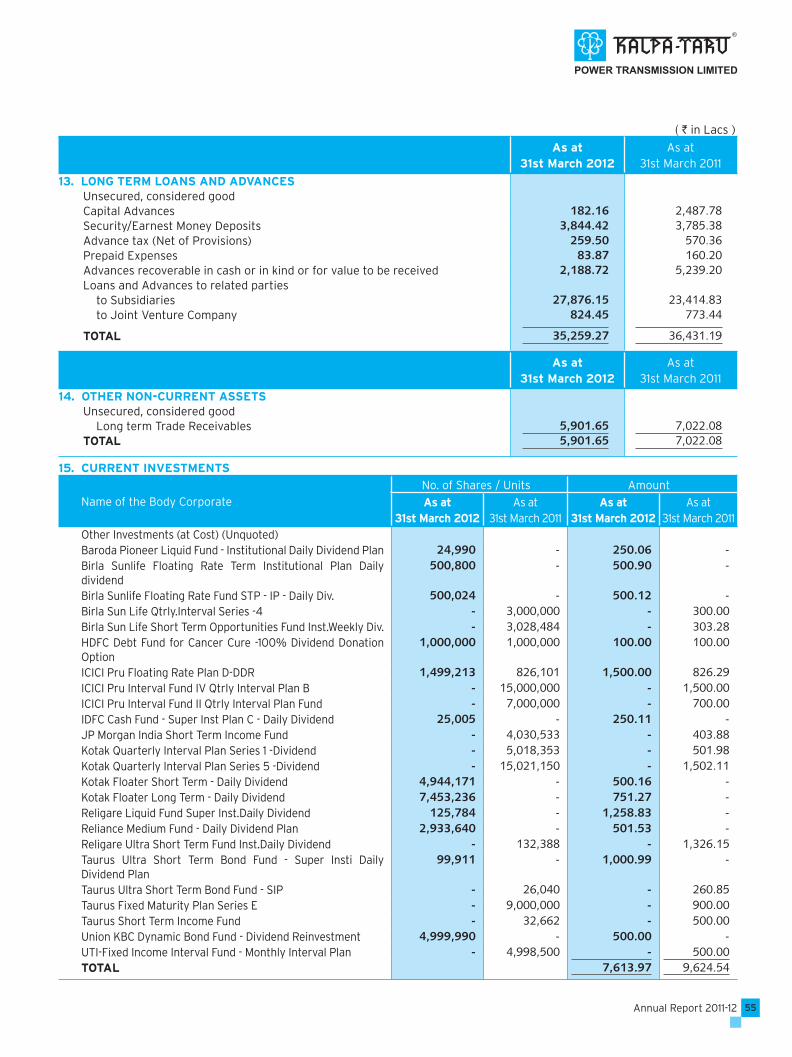
55Annual Report 2011-12
15. CURRENT INVESTMENTS
Name of the Body CorporateNo. of Shares / Units Amount
As at31st March 2012
As at31st March 2011
As at31st March 2012
As at31st March 2011
Other Investments (at Cost) (Unquoted)Baroda Pioneer Liquid Fund - Institutional Daily Dividend Plan 24,990 - 250.06 - Birla Sunlife Floating Rate Term Institutional Plan Daily dividend
500,800 - 500.90 -
Birla Sunlife Floating Rate Fund STP - IP - Daily Div. 500,024 - 500.12 - Birla Sun Life Qtrly.Interval Series -4 - 3,000,000 - 300.00 Birla Sun Life Short Term Opportunities Fund Inst.Weekly Div. - 3,028,484 - 303.28 HDFC Debt Fund for Cancer Cure -100% Dividend Donation Option
1,000,000 1,000,000 100.00 100.00
ICICI Pru Floating Rate Plan D-DDR 1,499,213 826,101 1,500.00 826.29 ICICI Pru Interval Fund IV Qtrly Interval Plan B - 15,000,000 - 1,500.00 ICICI Pru Interval Fund II Qtrly Interval Plan Fund - 7,000,000 - 700.00 IDFC Cash Fund - Super Inst Plan C - Daily Dividend 25,005 - 250.11 - JP Morgan India Short Term Income Fund - 4,030,533 - 403.88 Kotak Quarterly Interval Plan Series 1 -Dividend - 5,018,353 - 501.98 Kotak Quarterly Interval Plan Series 5 -Dividend - 15,021,150 - 1,502.11 Kotak Floater Short Term - Daily Dividend 4,944,171 - 500.16 - Kotak Floater Long Term - Daily Dividend 7,453,236 - 751.27 - Religare Liquid Fund Super Inst.Daily Dividend 125,784 - 1,258.83 - Reliance Medium Fund - Daily Dividend Plan 2,933,640 - 501.53 - Religare Ultra Short Term Fund Inst.Daily Dividend - 132,388 - 1,326.15 Taurus Ultra Short Term Bond Fund - Super Insti Daily Dividend Plan
99,911 - 1,000.99 -
Taurus Ultra Short Term Bond Fund - SIP - 26,040 - 260.85 Taurus Fixed Maturity Plan Series E - 9,000,000 - 900.00 Taurus Short Term Income Fund - 32,662 - 500.00 Union KBC Dynamic Bond Fund - Dividend Reinvestment 4,999,990 - 500.00 - UTI-Fixed Income Interval Fund - Monthly Interval Plan - 4,998,500 - 500.00 TOTAL 7,613.97 9,624.54
As at 31st March 2012
As at 31st March 2011
13. LONG TERM LOANS AND ADVANCES Unsecured, considered good Capital Advances 182.16 2,487.78 Security/Earnest Money Deposits 3,844.42 3,785.38 Advance tax (Net of Provisions) 259.50 570.36 Prepaid Expenses 83.87 160.20 Advances recoverable in cash or in kind or for value to be received 2,188.72 5,239.20 Loans and Advances to related parties
to Subsidiaries 27,876.15 23,414.83 to Joint Venture Company 824.45 773.44
TOTAL 35,259.27 36,431.19
As at 31st March 2012
As at 31st March 2011
14. OTHER NON-CURRENT ASSETS Unsecured, considered good
Long term Trade Receivables 5,901.65 7,022.08 TOTAL 5,901.65 7,022.08
( ` in Lacs )

Kalpataru Power Transmission Ltd.56
( ` in Lacs )
As at 31st March 2012
As at 31st March 2011
16. INVENTORIES (As verifi ed, valued and certifi ed by management) Raw Materials and Components [(including goods in transit 19,253.46 12,707.79` 2,308.93 Lacs (Previous Year ` 515.35 Lacs)] Finished Goods 2,947.57 4,358.57 Semi-fi nished Goods 2,177.61 2,058.39 Construction and other Stores, Spares and Tools 7,533.74 4,438.41 Construction Work-in-Progress 23.92 316.13 Scrap 179.19 224.43 TOTAL 32,115.49 24,103.72
As at 31st March 2012
As at 31st March 2011
17. TRADE RECEIVABLES (Unsecured and considered good)
Outstanding for a period exceeding six months 23,345.93 22,048.04 from the date they are due for payment
Other debts 127,992.72 112,778.46 TOTAL 151,338.65 134,826.50
As at 31st March 2012
As at 31st March 2011
18. CASH AND BANK BALANCES Cash in hand 159.94 231.01 Balances with Banks
In Current Accounts 4,262.45 2,597.51 In Fixed Deposit Accounts 3,500.00 1,731.70 Unpaid Dividend Accounts 26.72 23.33
Other Bank BalancesBalance under lien with bank - 342.07 Deposits with original maturity more than 3 months but less than 12 months 1,710.55 4,500.00 Deposits with original maturity more than 12 months* 680.00 5,000.00
TOTAL 10,339.66 14,425.62 * includes Deposits under lien with a Bank ` 680 Lacs (Previous year Nil)
As at 31st March 2012
As at 31st March 2011
19. SHORT-TERM LOANS AND ADVANCES (Unsecured and considered good) Advances recoverable in cash or in kind or for value to be received 22,846.21 9,019.03 Advance Income Tax and TDS (net of provisions) 2,571.61 1,956.17 Loans to Subsidiaries 1,053.81 261.53 Prepaid Expenses 2,323.16 1,350.45 Security/Earnest Money Deposits 1,147.27 404.68 TOTAL 29,942.06 12,991.86
As at 31st March 2012
As at 31st March 2011
20. OTHER CURRENT ASSETS Accrued Value of work done 39,163.22 41,493.35 Accrued Income 251.75 334.35 TOTAL 39,414.97 41,827.70

57Annual Report 2011-12
( ` in Lacs )2011-12 2010-11
21. REVENUE FROM OPERATIONS - GROSS
Sale of Products 204,087.60 188,407.85 Income from Services 100,522.03 101,775.74 Other Operating Income
Sale of Scrap 4,087.08 3,261.21 Certifi ed Emission Reduction Receipts 509.99 398.81 Others 12.50 12.96
4,609.57 3,672.98 TOTAL 309,219.20 293,856.57
2011-12 2010-1122. OTHER INCOME
Interest Income 3,936.61 3,004.46 Dividend from Subsidiaries 350.98 230.80 Dividend from Non Current Investments 0.99 0.73 Dividend from Current Investments 466.57 910.84 Insurance Claims 74.95 68.09 Liabilities Written Back 214.68 210.27 Miscellaneous Income 27.67 13.94 Rent Income 67.11 224.67 Profi t/(Loss) on Sale of fi xed assets (net) (21.23) 31.45 TOTAL 5,118.33 4,695.25
2011-12 2010-1123. COST OF MATERIALS CONSUMED
Raw Materials
Steel 50,266.41 45,941.21 Zinc 6,935.23 7,033.57 Components & Accessories, etc. 88,445.52 71,792.32
Agricultural Residues 3,210.82 2,912.53 TOTAL 148,857.98 127,679.63
2011-12 2010-1124.(INCREASE) / DECREASE IN STOCKS
STOCK AT BEGINNING OF THE YEAR Finished Goods
Towers and Steel structures 4,273.83 6,038.60 Others 84.74 103.62
4,358.57 6,142.22 Semi-fi nished Goods 2,058.39 1,145.75 Scrap 224.43 175.30 Construction Work in Progress 121.06 553.33
6,762.45 8,016.60 STOCK AT CLOSE OF THE YEAR Finished Goods
Towers and Steel structures 2,929.30 4,273.83 Others 18.27 84.74
2,947.57 4,358.57 Semi-fi nished Goods 2,177.61 2,058.39 Scrap 179.19 224.43 Construction Work in Progress 23.92 121.06
5,328.29 6,762.45 TOTAL 1,434.16 1,254.15

Kalpataru Power Transmission Ltd.58
( ` in Lacs )2011-12 2010-11
25. EMPLOYEE BENEFIT EXPENSES
Salaries, Wages, Bonus 15,733.96 17,249.16 Contributions to Provident and Other Funds (includes social security and other benefi ts for overseasemployees)
850.59 925.43
Employees’ Welfare Expenses 438.56 531.42 TOTAL 17,023.11 18,706.01
2011-12 2010-1126. OTHER EXPENSES
Erection and Sub-contracting Expenses 73,466.79 78,850.11 Job charges 2,510.16 2,866.30 Power and Fuel 867.68 683.26 Excise Duty 41.47 184.91 Repairs and Maintenance:
Plant and Machinery 208.25 191.16 Building 117.84 100.77 Other 61.27 55.12
Freight and Forwarding Expenses 3,690.97 2,496.42 Stores, Spares and Tools Consumed 928.91 1,037.70 Vehicle/ Equipment Running and Hire Charges 380.21 325.44 Testing Expenses 195.00 176.49 Pollution Control Expenses 74.13 73.68 Insurance Charges 1,058.66 1,032.97 Rent 1,489.15 1,662.31 Rates and Taxes 83.53 147.74 Stationery, Printing and Drawing Expenses 256.29 284.72 Telecommunication Expenses 309.37 373.52 Travelling Expenses 1,684.14 1,431.64 Legal and Professional Expenses 1,054.27 870.90 Service Charges 2,657.99 1,989.83 Auditor’s Remuneration
Audit Fees 32.50 42.00 Company Law Matters - 0.55 Taxation Matters - 5.00 Other Services & Reports 1.50 37.36 Reimbursement of Expenses 0.75 0.97
34.75 85.88General Expenses 516.05 420.09 Miscellaneous Expenses 999.36 1,431.77 Taxes and Duties 3,241.22 1,884.97 Bank Commission and Charges 2,399.57 2,488.01 Bad Debts Written Off 4.42 2.30 Balances Written Off 71.29 82.18 Performance Warranties Expenses 1,119.29 3,640.28 Loss by Theft/Damage/Fire 203.57 306.07 Service Tax 2,292.50 1,813.78 (Gain)/Loss on Exchange Rate Variation 719.15 (1,421.65)Sitting fees and Commission to Non-executive Directors 231.70 263.04 Carbon Credit Expenses 62.29 0.11 TOTAL 103,031.24 105,831.82
2011-12 2010-1127. FINANCIAL COSTS
Interest 9,301.29 8,491.01 Other Borrowing Costs 737.07 775.96 Add / (Less) : Exchange rate variation 786.50 (476.05)
TOTAL 10,824.86 8,790.92
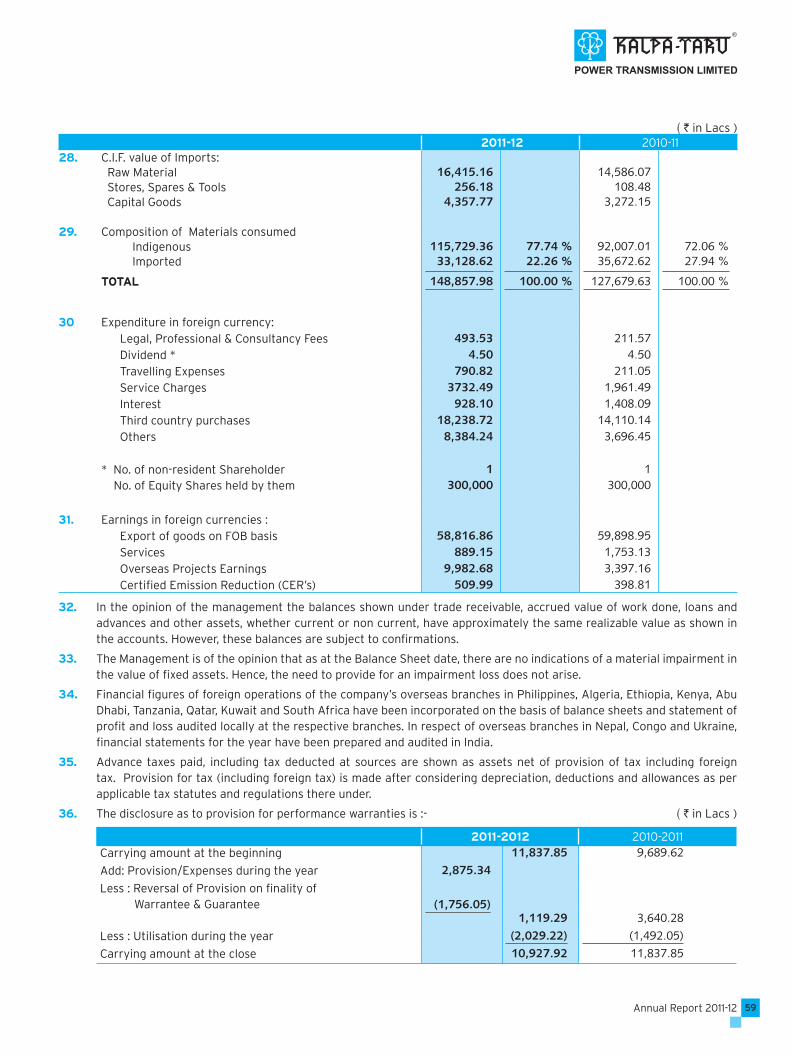
59Annual Report 2011-12
( ` in Lacs )2011-12 2010-11
28. C.I.F. value of Imports: Raw Material 16,415.16 14,586.07 Stores, Spares & Tools 256.18 108.48 Capital Goods 4,357.77 3,272.15
29. Composition of Materials consumed Indigenous 115,729.36 77.74 % 92,007.01 72.06 % Imported 33,128.62 22.26 % 35,672.62 27.94 %
TOTAL 148,857.98 100.00 % 127,679.63 100.00 %
30 Expenditure in foreign currency: Legal, Professional & Consultancy Fees 493.53 211.57 Dividend * 4.50 4.50 Travelling Expenses 790.82 211.05 Service Charges 3732.49 1,961.49 Interest 928.10 1,408.09 Third country purchases 18,238.72 14,110.14 Others 8,384.24 3,696.45
* No. of non-resident Shareholder No. of Equity Shares held by them
1300,000
1300,000
31. Earnings in foreign currencies : Export of goods on FOB basis 58,816.86 59,898.95 Services 889.15 1,753.13 Overseas Projects Earnings 9,982.68 3,397.16 Certifi ed Emission Reduction (CER’s) 509.99 398.81
32. In the opinion of the management the balances shown under trade receivable, accrued value of work done, loans and advances and other assets, whether current or non current, have approximately the same realizable value as shown in the accounts. However, these balances are subject to confi rmations.
33. The Management is of the opinion that as at the Balance Sheet date, there are no indications of a material impairment in the value of fi xed assets. Hence, the need to provide for an impairment loss does not arise.
34. Financial fi gures of foreign operations of the company’s overseas branches in Philippines, Algeria, Ethiopia, Kenya, Abu Dhabi, Tanzania, Qatar, Kuwait and South Africa have been incorporated on the basis of balance sheets and statement of profi t and loss audited locally at the respective branches. In respect of overseas branches in Nepal, Congo and Ukraine, fi nancial statements for the year have been prepared and audited in India.
35. Advance taxes paid, including tax deducted at sources are shown as assets net of provision of tax including foreign tax. Provision for tax (including foreign tax) is made after considering depreciation, deductions and allowances as per applicable tax statutes and regulations there under.
36. The disclosure as to provision for performance warranties is :- ( ` in Lacs )
2011-2012 2010-2011Carrying amount at the beginning 11,837.85 9,689.62
Add: Provision/Expenses during the year 2,875.34
Less : Reversal of Provision on fi nality of Warrantee & Guarantee (1,756.05)
1,119.29 3,640.28
Less : Utilisation during the year (2,029.22) (1,492.05)
Carrying amount at the close 10,927.92 11,837.85
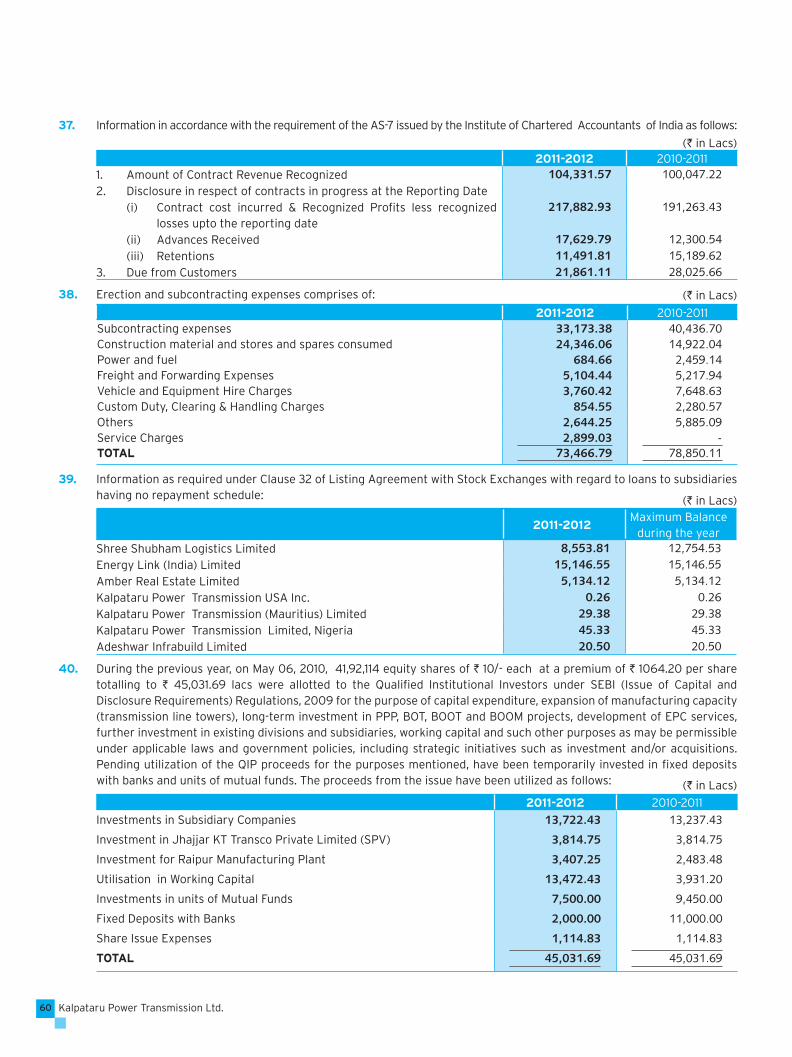
Kalpataru Power Transmission Ltd.60
37. Information in accordance with the requirement of the AS-7 issued by the Institute of Chartered Accountants of India as follows:
(` in Lacs)2011-2012 2010-2011
1. Amount of Contract Revenue Recognized 104,331.57 100,047.222. Disclosure in respect of contracts in progress at the Reporting Date
(i) Contract cost incurred & Recognized Profi ts less recognized losses upto the reporting date
217,882.93 191,263.43
(ii) Advances Received 17,629.79 12,300.54(iii) Retentions 11,491.81 15,189.62
3. Due from Customers 21,861.11 28,025.66
38. Erection and subcontracting expenses comprises of:
2011-2012 2010-2011Subcontracting expenses 33,173.38 40,436.70Construction material and stores and spares consumed 24,346.06 14,922.04Power and fuel 684.66 2,459.14Freight and Forwarding Expenses 5,104.44 5,217.94Vehicle and Equipment Hire Charges 3,760.42 7,648.63Custom Duty, Clearing & Handling Charges 854.55 2,280.57Others 2,644.25 5,885.09Service Charges 2,899.03 -TOTAL 73,466.79 78,850.11
39. Information as required under Clause 32 of Listing Agreement with Stock Exchanges with regard to loans to subsidiaries having no repayment schedule:
2011-2012Maximum Balance
during the yearShree Shubham Logistics Limited 8,553.81 12,754.53Energy Link (India) Limited 15,146.55 15,146.55Amber Real Estate Limited 5,134.12 5,134.12Kalpataru Power Transmission USA Inc. 0.26 0.26Kalpataru Power Transmission (Mauritius) Limited 29.38 29.38Kalpataru Power Transmission Limited, Nigeria 45.33 45.33Adeshwar Infrabuild Limited 20.50 20.50
40. During the previous year, on May 06, 2010, 41,92,114 equity shares of ` 10/- each at a premium of ` 1064.20 per share totalling to ` 45,031.69 lacs were allotted to the Qualifi ed Institutional Investors under SEBI (Issue of Capital and Disclosure Requirements) Regulations, 2009 for the purpose of capital expenditure, expansion of manufacturing capacity (transmission line towers), long-term investment in PPP, BOT, BOOT and BOOM projects, development of EPC services, further investment in existing divisions and subsidiaries, working capital and such other purposes as may be permissible under applicable laws and government policies, including strategic initiatives such as investment and/or acquisitions. Pending utilization of the QIP proceeds for the purposes mentioned, have been temporarily invested in fi xed deposits with banks and units of mutual funds. The proceeds from the issue have been utilized as follows:
2011-2012 2010-2011
Investments in Subsidiary Companies 13,722.43 13,237.43
Investment in Jhajjar KT Transco Private Limited (SPV) 3,814.75 3,814.75
Investment for Raipur Manufacturing Plant 3,407.25 2,483.48
Utilisation in Working Capital 13,472.43 3,931.20
Investments in units of Mutual Funds 7,500.00 9,450.00
Fixed Deposits with Banks 2,000.00 11,000.00
Share Issue Expenses 1,114.83 1,114.83
TOTAL 45,031.69 45,031.69
(` in Lacs)
(` in Lacs)
(` in Lacs)

61Annual Report 2011-12
41. Retirement benefi t plans:a) Defi ned contribution Plans The Company made contribution towards provident fund, a defi ned contribution retirement benefi t plan for qualifying
employees. The provident fund plan is operated by the Regional Provident Fund Commissioner. The Company recognized ` 679.75 lacs (Previous Year ` 674.64 lacs) for provident fund contributions in the statement of profi t & loss. The contributions payable to these plans by the company are at rates specifi ed in the rules of the scheme.
b) Defi ned benefi t plans The Company made annual contributions to the Employee’s Group Gratuity cash accumulation scheme of the Life
Insurance Corporation of India, a funded defi ned benefi t plan for qualifying employees. The scheme provides for payment to vested employees at retirement/death while in employment or on termination of employment of an amount equivalent to 15 days salary payable for each completed year of service or part thereof in excess of six months. Vesting occurs upon completion of fi ve years of service.
The present value of the defi ned benefi t obligation and the related current service cost were measured using the Projected Unit Credit method as per actuarial valuation carried out at the balance sheet date.
The following tables sets out the status of the gratuity plan as required under AS-15 and the amounts recognized in the Company’s fi nancial statements as at March 31, 2012.
(` in Lacs)2011-2012 2010-2011
Change in present value of obligations :Obligations at beginning of the year 834.42 711.75Service cost 136.57 138.95Interest cost 69.09 58.93Actuarial (gain) / loss (108.13) (30.12)Benefi ts paid (60.20) (45.09)Obligations at the end of the year 871.75 834.42Change in Plan assets :Fair value of Plan assets at beginning of the year 834.42 638.65Expected returns on plan assets 82.05 70.56Actuarial (loss) / gain (2.20) (12.74)Contributions by employer 143.45 183.04Benefi ts paid (60.20) (45.09)Fair value of plan assets at end of the year 997.52 834.42Reconciliation of Present Value of Obligation and the fair value of plan assets :Present value of the defi ned benefi t obligation at the end of the year 871.75 834.42Less: Fair value of plan assets 871.75 834.42Unfunded status amount of liability recognized in the balance sheet - -Experience AdjustmentDefi ned benefi t obligation 871.75 834.42Plan assets 871.75 834.42Surplus/(defi cit) - -Experience adjustments on plan liabilities - -Experience adjustments on plan assets - -Gratuity cost for the year :Service Cost 136.57 138.95Interest Cost 69.09 58.93Expected return on plan assets (82.05) (70.56)Actuarial (gain) / loss (105.93) (17.38)Net gratuity cost charged to profi t & loss 17.68 109.94Assumptions :Discount rate 8.75% 8.28%Estimated rate of return on plan assets 8.75% 9.25%Annual increase in salary costs 7.00% 7.00%
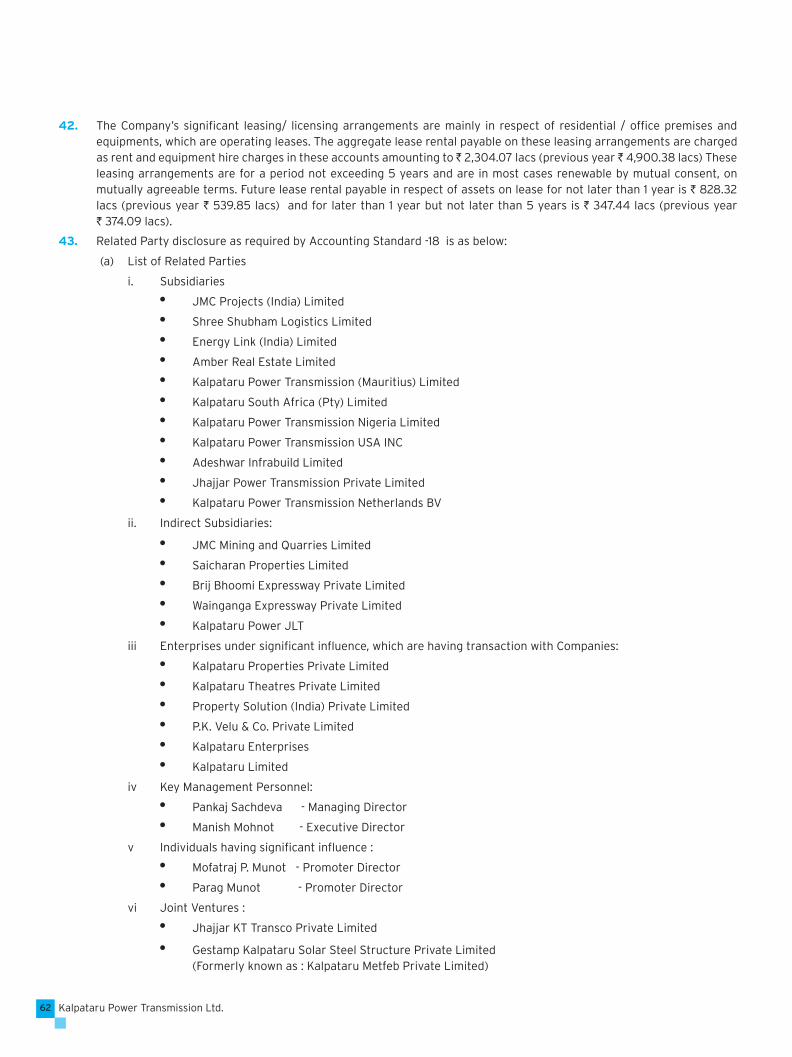
Kalpataru Power Transmission Ltd.62
42. The Company’s signifi cant leasing/ licensing arrangements are mainly in respect of residential / offi ce premises and equipments, which are operating leases. The aggregate lease rental payable on these leasing arrangements are charged as rent and equipment hire charges in these accounts amounting to ̀ 2,304.07 lacs (previous year ̀ 4,900.38 lacs) These leasing arrangements are for a period not exceeding 5 years and are in most cases renewable by mutual consent, on mutually agreeable terms. Future lease rental payable in respect of assets on lease for not later than 1 year is ` 828.32 lacs (previous year ` 539.85 lacs) and for later than 1 year but not later than 5 years is ` 347.44 lacs (previous year ` 374.09 lacs).
43. Related Party disclosure as required by Accounting Standard -18 is as below:
(a) List of Related Parties
i. Subsidiaries JMC Projects (India) Limited Shree Shubham Logistics Limited Energy Link (India) Limited Amber Real Estate Limited Kalpataru Power Transmission (Mauritius) Limited Kalpataru South Africa (Pty) Limited Kalpataru Power Transmission Nigeria Limited Kalpataru Power Transmission USA INC Adeshwar Infrabuild Limited Jhajjar Power Transmission Private Limited Kalpataru Power Transmission Netherlands BV
ii. Indirect Subsidiaries:
JMC Mining and Quarries Limited Saicharan Properties Limited Brij Bhoomi Expressway Private Limited Wainganga Expressway Private Limited Kalpataru Power JLT
iii Enterprises under signifi cant infl uence, which are having transaction with Companies: Kalpataru Properties Private Limited Kalpataru Theatres Private Limited Property Solution (India) Private Limited P.K. Velu & Co. Private Limited Kalpataru Enterprises Kalpataru Limited
iv Key Management Personnel: Pankaj Sachdeva - Managing Director Manish Mohnot - Executive Director
v Individuals having signifi cant infl uence : Mofatraj P. Munot - Promoter Director Parag Munot - Promoter Director
vi Joint Ventures : Jhajjar KT Transco Private Limited
Gestamp Kalpataru Solar Steel Structure Private Limited(Formerly known as : Kalpataru Metfeb Private Limited)

63Annual Report 2011-12
(b) The related party transactions in ordinary course of business are:
(` in Lacs)
(i) Transactions during the year with Entities
Particulars
2011-12 2010-11
Subsidiaries
Entities having
signifi cant infl uence
Joint Ventures
Subsidiaries
Entities having
signifi cant infl uence
Joint Ventures
Investment in Equity Shares 27,598.92 - 5,315.80 13,467.02 - 3,815.00
Loans given 12,723.68 - 1,494.52 9,595.27 - 765.25
Loans repaid back 10,074.75 - 1,494.52 7,429.44 - -
Advance given for Flat - 145.35 - - - -
Advance Received - - - - - 4,000.00
Construction of Fixed - Assets 1,398.03 14.89 - - - -
Revenue from Operations 979.80 - 7,724.40 6.48 - 11,466.92
Dividend received 350.98 - - 230.80 - -
Interest received 2,894.04 - 147.78 2,291.79 - 9.09
Rent received 6.97 - 0.08 79.10 - 0.05
Reimbursement of Exps. received 4.81 - 335.38 25.10 - 45.67
Job charges paid 162.87 - - 2,054.78 - -
Service charges paid 257.28 - - 110.25 - -
Rent paid - 307.58 - - 286.29 -
Interest paid 14.03 - - - - 57.85
Offi ce expenses - - - 0.62 - -
Hire charges 27.67 - - 27.67 - -
Security Charges - 1.39 - - 1.19 -
Reimbursement of expenses 43.37 31.92 - 40.84 96.67 -
(i a) Balances with Entities
Loans given 28,929.96 - 824.45 23,676.36 - 773.44
Trade Receivables 148.60 - 363.32 3.82 - 1,148.33
Advance from customers 1,839.69 - - - - 1,706.61
Advances given 2.73 145.35 137.90 - 6.64 0.02
Security deposit given - 3,326.07 - - 3,326.07 -
Trade Payable 413.74 7.01 - 280.01 9.94 -
(ii) Transactions during the year with Individuals
Particulars Key Managerial Persons
Individuals having
signifi cant infl uence
Key Managerial Persons
Individuals hav-ing signifi cant
infl uence
Salary & Commission 444.99 100.00 419.35 130.00
(ii a) Balances with Individuals
Liabilities 175.00 100.00 150.00 130.00

Kalpataru Power Transmission Ltd.64
44. Segmental Reporting: (` In Lacs)
S.N. ParticularsSegment
T&D RED BM INFRA Unallocable Total
(I) Business Segment
1 Revenue :
Sales & Services 259,972.28 - 4,814.84 33,874.50 - 298,661.62(250,307.24) (11.50) (4,303.95) (29,522.22) (-) (284,144.91)
Other Operating Income 4,079.89 12.50 517.19 - - 4,609.58(3,254.76) (12.96) (402.11) (3.15) (-) (3,672.98)
Net Sales/Income from Operation 264,052.17 12.50 5,332.03 33,874.50 - 303,271.20
(253,562.00) (24.46) (4,706.06) (29,525.38) (-) (287,817.90)
Add : Other Income 241.23 - 0.83 230.35 4,645.93 5,118.34(297.80) (-) (2.23) (159.75) (4,235.47) (4,695.25)
TOTAL 264,293.40 12.50 5,332.86 34,104.85 4,645.93 308,389.54(253,859.80) (24.46) (4,708.29) (29,685.13) (4,235.47) (292,513.15)
2 Segment Result before Interest 26,324.59 11.00 327.36 1,925.21 4,645.13 33,233.29
(net off un-allocable expenditure) (27,146.06) (22.11) (322.72) (2,727.91) (4,230.07) (34,448.87)
Interest 10,824.86(8,790.92)
Profi t after Interest 22,408.43(25,657.95)
3 Current Tax 6,650.00(6,943.00)
4 Deferred Tax -85.00(-341.32)
5 Prior Year’s Tax -647.38(-)
6 Net Profi t after Tax 16,490.81(19,056.27)
7 Segment Asset 256,386.73 - 8,753.51 48,690.55 76,262.52 390,093.31(226,775.37) (70.43) (7,978.24) (29,111.14) (84,567.52) (348,502.70)
8 Segment Liability 147,928.97 - 237.92 16,204.29 3,627.44 167,998.62(119,763.37) (27.93) (109.00) (13,501.27) (10,685.27) (144,086.84)
Capital Employed 108,457.76 - 8,515.59 32,486.26 72,635.08 222,094.69
(107,012.00) (42.50) (7,869.24) (15,609.87) (73,882.25) (204,415.86)
9 Capital Expenditure 11,844.97 - 331.60 1,014.02 - 13,190.59(Including CWIP) (7,904.38) (-) (101.94) (123.86) - (8,130.18)
10 Depreciation 2,924.76 0.36 476.90 1,407.51 0.22 4,809.74(2,780.41) (0.55) (475.06) (1,336.65) - (4,592.67)
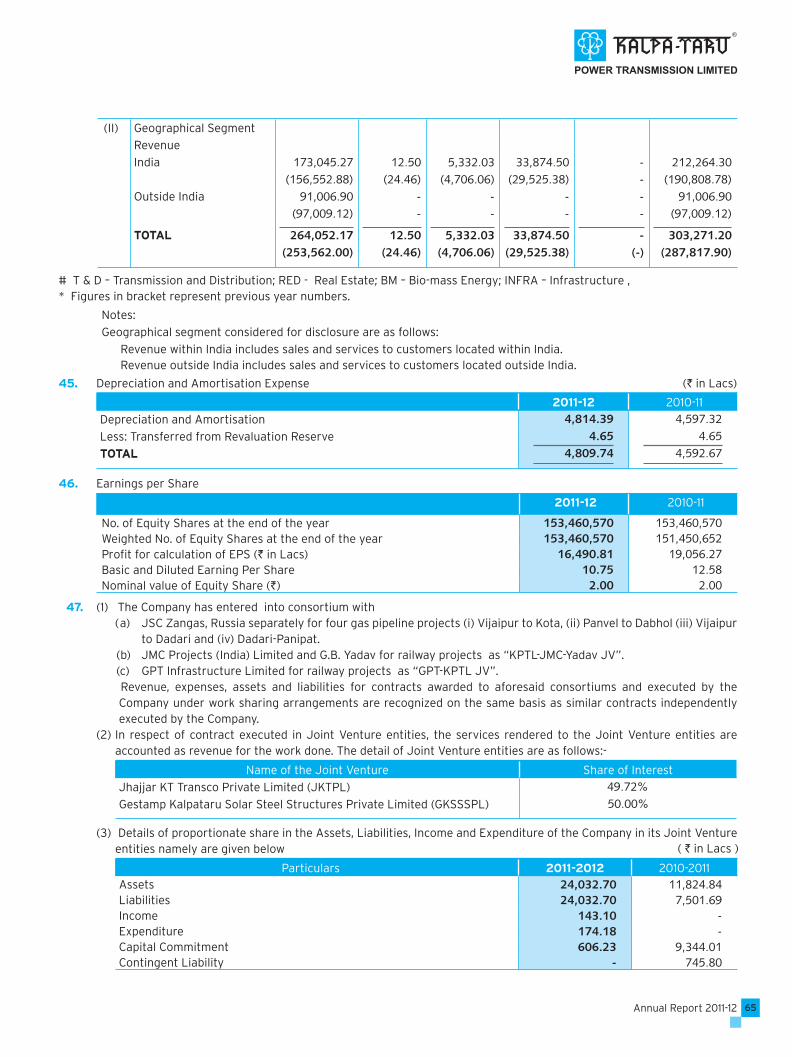
65Annual Report 2011-12
(II) Geographical Segment Revenue India 173,045.27 12.50 5,332.03 33,874.50 - 212,264.30
(156,552.88) (24.46) (4,706.06) (29,525.38) - (190,808.78) Outside India 91,006.90 - - - - 91,006.90
(97,009.12) - - - - (97,009.12)
TOTAL 264,052.17 12.50 5,332.03 33,874.50 - 303,271.20(253,562.00) (24.46) (4,706.06) (29,525.38) (-) (287,817.90)
# T & D – Transmission and Distribution; RED - Real Estate; BM – Bio-mass Energy; INFRA – Infrastructure , * Figures in bracket represent previous year numbers.
Notes:
Geographical segment considered for disclosure are as follows:
Revenue within India includes sales and services to customers located within India.Revenue outside India includes sales and services to customers located outside India.
45. Depreciation and Amortisation Expense (` in Lacs)
2011-12 2010-11
Depreciation and Amortisation 4,814.39 4,597.32Less: Transferred from Revaluation Reserve 4.65 4.65TOTAL 4,809.74 4,592.67
46. Earnings per Share
2011-12 2010-11
No. of Equity Shares at the end of the year 153,460,570 153,460,570Weighted No. of Equity Shares at the end of the year 153,460,570 151,450,652Profi t for calculation of EPS (` in Lacs) 16,490.81 19,056.27Basic and Diluted Earning Per Share 10.75 12.58Nominal value of Equity Share (`) 2.00 2.00
47. (1) The Company has entered into consortium with (a) JSC Zangas, Russia separately for four gas pipeline projects (i) Vijaipur to Kota, (ii) Panvel to Dabhol (iii) Vijaipur
to Dadari and (iv) Dadari-Panipat. (b) JMC Projects (India) Limited and G.B. Yadav for railway projects as “KPTL-JMC-Yadav JV”. (c) GPT Infrastructure Limited for railway projects as “GPT-KPTL JV”.
Revenue, expenses, assets and liabilities for contracts awarded to aforesaid consortiums and executed by the Company under work sharing arrangements are recognized on the same basis as similar contracts independently executed by the Company.
(2) In respect of contract executed in Joint Venture entities, the services rendered to the Joint Venture entities are accounted as revenue for the work done. The detail of Joint Venture entities are as follows:-
Name of the Joint Venture Share of Interest
Jhajjar KT Transco Private Limited (JKTPL) 49.72%Gestamp Kalpataru Solar Steel Structures Private Limited (GKSSSPL) 50.00%
(3) Details of proportionate share in the Assets, Liabilities, Income and Expenditure of the Company in its Joint Venture entities namely are given below
Particulars 2011-2012 2010-2011Assets 24,032.70 11,824.84Liabilities 24,032.70 7,501.69Income 143.10 -Expenditure 174.18 -Capital Commitment 606.23 9,344.01Contingent Liability - 745.80
( ` in Lacs )
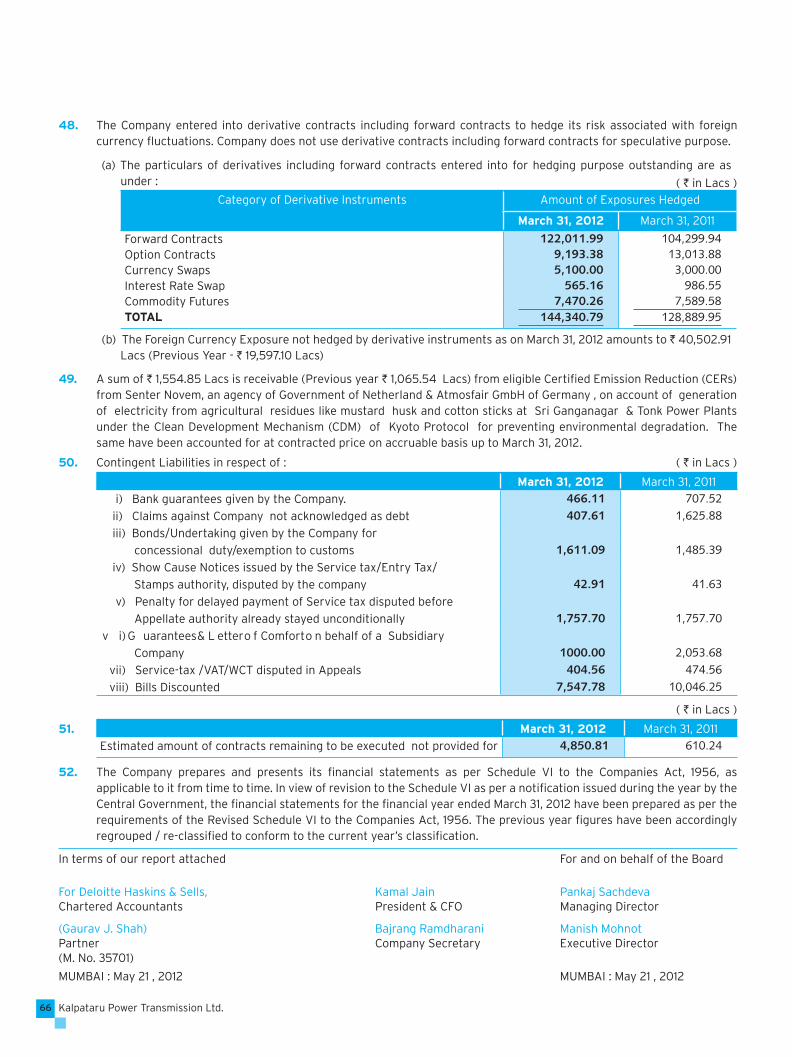
Kalpataru Power Transmission Ltd.66
48. The Company entered into derivative contracts including forward contracts to hedge its risk associated with foreign currency fl uctuations. Company does not use derivative contracts including forward contracts for speculative purpose.
(a) The particulars of derivatives including forward contracts entered into for hedging purpose outstanding are as under :
Category of Derivative Instruments Amount of Exposures Hedged
March 31, 2012 March 31, 2011
Forward Contracts 122,011.99 104,299.94Option Contracts 9,193.38 13,013.88Currency Swaps 5,100.00 3,000.00Interest Rate Swap 565.16 986.55Commodity Futures 7,470.26 7,589.58TOTAL 144,340.79 128,889.95
(b) The Foreign Currency Exposure not hedged by derivative instruments as on March 31, 2012 amounts to ` 40,502.91 Lacs (Previous Year - ` 19,597.10 Lacs)
49. A sum of ` 1,554.85 Lacs is receivable (Previous year ` 1,065.54 Lacs) from eligible Certifi ed Emission Reduction (CERs) from Senter Novem, an agency of Government of Netherland & Atmosfair GmbH of Germany , on account of generation of electricity from agricultural residues like mustard husk and cotton sticks at Sri Ganganagar & Tonk Power Plants under the Clean Development Mechanism (CDM) of Kyoto Protocol for preventing environmental degradation. The same have been accounted for at contracted price on accruable basis up to March 31, 2012.
50. Contingent Liabilities in respect of : ( ` in Lacs )
March 31, 2012 March 31, 2011
i) Bank guarantees given by the Company. 466.11 707.52 ii) Claims against Company not acknowledged as debt 407.61 1,625.88 iii) Bonds/Undertaking given by the Company for
concessional duty/exemption to customs 1,611.09 1,485.39 iv) Show Cause Notices issued by the Service tax/Entry Tax/
Stamps authority, disputed by the company 42.91 41.63 v) Penalty for delayed payment of Service tax disputed before
Appellate authority already stayed unconditionally 1,757.70 1,757.70 v i) G uarantees & L etter o f Comfort o n behalf of a Subsidiary
Company 1000.00 2,053.68 vii) Service-tax /VAT/WCT disputed in Appeals 404.56 474.56 viii) Bills Discounted 7,547.78 10,046.25
( ` in Lacs )
51. March 31, 2012 March 31, 2011
Estimated amount of contracts remaining to be executed not provided for 4,850.81 610.24
52. The Company prepares and presents its fi nancial statements as per Schedule VI to the Companies Act, 1956, as applicable to it from time to time. In view of revision to the Schedule VI as per a notifi cation issued during the year by the Central Government, the fi nancial statements for the fi nancial year ended March 31, 2012 have been prepared as per the requirements of the Revised Schedule VI to the Companies Act, 1956. The previous year fi gures have been accordingly regrouped / re-classifi ed to conform to the current year’s classifi cation.
In terms of our report attached For and on behalf of the Board
For Deloitte Haskins & Sells, Kamal Jain Pankaj SachdevaChartered Accountants President & CFO Managing Director
(Gaurav J. Shah) Bajrang Ramdharani Manish Mohnot Partner Company Secretary Executive Director(M. No. 35701)
MUMBAI : May 21 , 2012 MUMBAI : May 21 , 2012
( ` in Lacs )
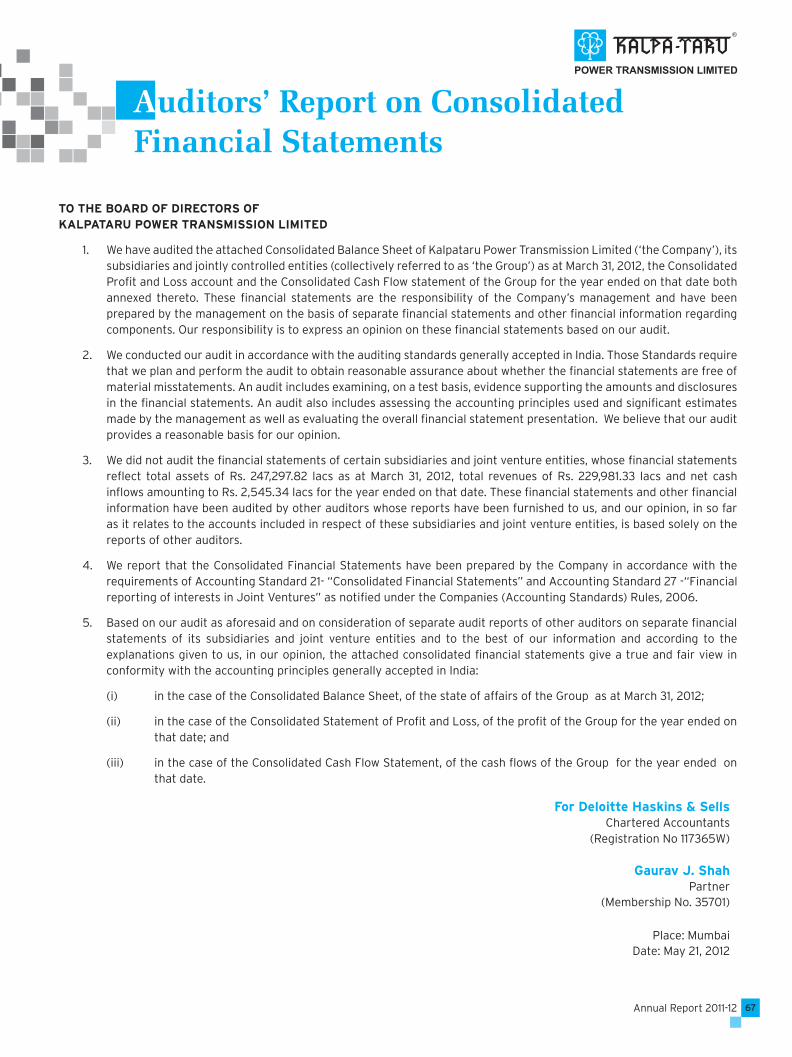
67Annual Report 2011-12
Auditors’ Report on Consolidated Financial Statements
TO THE BOARD OF DIRECTORS OFKALPATARU POWER TRANSMISSION LIMITED
1. We have audited the attached Consolidated Balance Sheet of Kalpataru Power Transmission Limited (‘the Company’), its subsidiaries and jointly controlled entities (collectively referred to as ‘the Group’) as at March 31, 2012, the Consolidated Profi t and Loss account and the Consolidated Cash Flow statement of the Group for the year ended on that date both annexed thereto. These fi nancial statements are the responsibility of the Company’s management and have been prepared by the management on the basis of separate fi nancial statements and other fi nancial information regarding components. Our responsibility is to express an opinion on these fi nancial statements based on our audit.
2. We conducted our audit in accordance with the auditing standards generally accepted in India. Those Standards require that we plan and perform the audit to obtain reasonable assurance about whether the fi nancial statements are free of material misstatements. An audit includes examining, on a test basis, evidence supporting the amounts and disclosures in the fi nancial statements. An audit also includes assessing the accounting principles used and signifi cant estimates made by the management as well as evaluating the overall fi nancial statement presentation. We believe that our audit provides a reasonable basis for our opinion.
3. We did not audit the fi nancial statements of certain subsidiaries and joint venture entities, whose fi nancial statements refl ect total assets of Rs. 247,297.82 lacs as at March 31, 2012, total revenues of Rs. 229,981.33 lacs and net cash infl ows amounting to Rs. 2,545.34 lacs for the year ended on that date. These fi nancial statements and other fi nancial information have been audited by other auditors whose reports have been furnished to us, and our opinion, in so far as it relates to the accounts included in respect of these subsidiaries and joint venture entities, is based solely on the reports of other auditors.
4. We report that the Consolidated Financial Statements have been prepared by the Company in accordance with the requirements of Accounting Standard 21- “Consolidated Financial Statements” and Accounting Standard 27 -“Financial reporting of interests in Joint Ventures” as notifi ed under the Companies (Accounting Standards) Rules, 2006.
5. Based on our audit as aforesaid and on consideration of separate audit reports of other auditors on separate fi nancial statements of its subsidiaries and joint venture entities and to the best of our information and according to the explanations given to us, in our opinion, the attached consolidated fi nancial statements give a true and fair view in conformity with the accounting principles generally accepted in India:
(i) in the case of the Consolidated Balance Sheet, of the state of affairs of the Group as at March 31, 2012;
(ii) in the case of the Consolidated Statement of Profi t and Loss, of the profi t of the Group for the year ended on that date; and
(iii) in the case of the Consolidated Cash Flow Statement, of the cash fl ows of the Group for the year ended on that date.
For Deloitte Haskins & Sells Chartered Accountants
(Registration No 117365W)
Gaurav J. ShahPartner
(Membership No. 35701)
Place: MumbaiDate: May 21, 2012

Kalpataru Power Transmission Ltd.68
In terms of our report attached For and on behalf of the Board
For Deloitte Haskins & Sells, Kamal Jain Pankaj SachdevaChartered Accountants President & CFO Managing Director
(Gaurav J. Shah) Bajrang Ramdharani Manish Mohnot Partner Company Secretary Executive Director(M. No. 35701)
MUMBAI : May 21, 2012 MUMBAI : May 21 , 2012
Consolidated Balance Sheet as at 31st March, 2012
( ` In Lacs ) Note As at
31st March 2012 As at
31st March 2011
EQUITY AND LIABILITIES Shareholder’s Funds
(a) Share Capital 1 3,069.21 3,069.21 (b) Reserves and Surplus 2 182,070.81 161,431.66
185,140.02 164,500.87 Minority Interest 12,856.71 11,198.76 Non-Current Liabilities
(a) Long Term Borrowings 3 77,792.02 38,562.41 (b) Deferred Tax Liabilities (Net) 4 295.43 1,385.73 (c) Other Long Term Liabilities 5 18,978.79 14,532.52 (d) Long Term Provisions 6 8,785.49 7,334.55
105,851.73 61,815.21 Current Liabilities
(a) Short Term Borrowings 7 37,792.40 39,367.98 (b) Trade Payables 8 145,977.74 121,396.00 (c) Other Current Liabilities 9 75,421.11 63,034.99 (d) Short Term Provisions 10 8,827.10 11,166.86
268,018.35 234,965.83 TOTAL 571,866.81 472,480.67 ASSETS Goodwill on Consolidation 2,016.77 2,016.77 Non-current assets
(a) Fixed assets 11(i) Tangible assets 106,365.95 72,355.71 (ii) Intangible assets 525.09 580.83 (iii) Intangible assets under development 24,273.26 4,060.61 (iv) Capital work-in-progress 18,381.32 28,861.17
(b) Non-current investments 12 750.64 864.07 (c) Long term Loans and Advances 13 13,234.99 19,419.67 (d) Other non-current assets 14 11,210.09 12,575.87
174,741.34 138,717.93 Current Assets
(a) Current investments 15 7,613.97 12,702.16 (b) Inventories 16 71,776.08 40,354.51 (c) Trade receivables 17 196,003.71 186,063.10 (d) Cash and Bank Balances 18 17,198.68 18,739.30 (e) Short-term loans and advances 19 41,774.87 19,313.64 (f) Other Current Assets 20 60,741.39 54,573.26
395,108.70 331,745.97 571,866.81 472,480.67
Signifi cant Accounting Policies Notes to Financial Statement 1 to 48

69Annual Report 2011-12
In terms of our report attached For and on behalf of the Board
For Deloitte Haskins & Sells, Kamal Jain Pankaj SachdevaChartered Accountants President & CFO Managing Director
(Gaurav J. Shah) Bajrang Ramdharani Manish Mohnot Partner Company Secretary Executive Director(M. No. 35701)
MUMBAI : May 21 , 2012 MUMBAI : May 21 , 2012
Consolidated Statement of Profit and Loss for the year ended 31st March, 2012
( ` In Lacs )
Note 2011-12 2010-11
Income
Revenue from operations-gross 21 536,749.26 442,320.15
Less: Excise Duty paid 5,948.01 6,038.67
Revenue from Operations - Net 530,801.25 436,281.48
Other Income 22 3,325.93 3,127.57
Total Revenue 534,127.18 439,409.05
Expenses:
Cost of materials consumed 23 246,581.69 182,910.44
(Increase) / Decrease in Stocks 24 (3,989.99) (1,501.69)
Employee Benefi t Expenses 25 32,227.29 31,936.28
Other Expenses 26 205,941.41 176,557.69
Financial costs 27 15,763.07 11,652.46
Depreciation and amortization expense 35 9,858.84 8,796.86
Total Expenses 506,382.31 410,352.04
Profi t before tax 27,744.87 29,057.01
Tax expense
Current tax 9,084.02 8,485.01
Minimum Alternate Tax 91.17 49.46
Less: MAT Credit Entitlement (91.17) (49.46)
Excess Provision for Prior Year(s) (646.43) 1.18
Deferred tax (1,089.53) (571.25)
Net Profi t for the year 20,396.81 21,142.07
Less: Minority Interest (1,530.10) (1,255.68)
Net Profi t after Minority Interest 18,866.71 19,886.39
Earnings per Equity Share of ` 2 each
Basic and Diluted (`) 36 12.29 13.13
Signifi cant Accounting Policies
Notes to Financial Statement 1 to 48

Kalpataru Power Transmission Ltd.70
In terms of our report attached For and on behalf of the Board
For Deloitte Haskins & Sells, Kamal Jain Pankaj SachdevaChartered Accountants President & CFO Managing Director
(Gaurav J. Shah) Bajrang Ramdharani Manish Mohnot Partner Company Secretary Executive Director(M. No. 35701)
MUMBAI : May 21 , 2012 MUMBAI : May 21 , 2012
( ` In Lacs ) INFLOW/(OUTFLOW)
2011-2012 2010-2011A. CASH FLOW FROM OPERATING ACTIVITIES:
Net profi t before Taxation, Extraordinary items and Minority Interest 27,744.87 29,057.01 Adjustments for :
Depreciation 9,858.84 8,796.86 Interest Paid 15,154.69 11,984.72 Dividend Received (510.22) (953.01) Interest Received (1,607.03) (1,191.02)
Amortisation of Employees Compensation (ESOP) (4.02) 62.83 Loss / (Profi t) on sale of assets 18.00 (116.31) Foreign Currency Translation Difference 1,356.80 (29.16) Unrealised Foreign Exchange (gain) / Loss (net) 1,637.50 650.55 OPERATING PROFIT BEFORE WORKING CAPITAL CHANGES 53,649.43 48,262.47 Adjustment for: Trade and other Receivables (32,911.31) (42,886.89) Inventories (31,421.58) (5,507.67) Trade and other payables 31,701.69 43,313.29 CASH GENERATED FROM OPERATIONS 21,018.23 43,181.20 Income Tax Paid (8,692.65) (9,029.30)CASH FLOW BEFORE EXTRAORDINARY ITEMS 12,325.58 34,151.90 NET CASH FLOW FROM OPERATING ACTIVITIES (A) 12,325.58 34,151.90
B. CASH FLOW FROM INVESTING ACTIVITIES:Purchase of fi xed assets (52,088.15) (33,758.52)Sale of fi xed assets 790.56 4,211.58 Investments in Mutual Fund 5,088.19 (12,702.16)Investments in Joint Venture 117.25 (171.29)Investments in Partnership Firm (3.81) (28.84)Interest Received on Loans & Deposits 1,607.03 1,191.02 Dividend Received 510.22 953.01 Fixed Deposits 7,247.90 (7,633.00)Inter Corporate Deposits (104.29)CASH USED IN INVESTING ACTIVITIES (B) (36,730.81) (48,042.49)
C. CASH FLOW FROM FINANCING ACTIVITIES:Proceed from Issue of Equity Shares (net of issue expenses) - 43,928.43 Proceeds from Issuance of Non Convertible Debentures - 5,000.00 Proceeds from Term Borrowings 52,567.49 7,281.06 Repayment of Term Loan (6,019.23) (6,499.54)Short Term Borrowings (1,813.86) (12,600.46)Interest Paid (15,154.69) (11,727.77)Dividend Paid (2,301.91) (2,301.91)Corporate Dividend Tax (419.83) (399.15)Grant in Aid (Viability Gap Funding) 3,137.59 504.62 Payment (to)/from Minority Shareholders 127.85 (3,755.93)Share issue expenses (10.92) -CASH GENERATED FROM / (USED IN) FINANCING ACTIVITIES (C) 30,112.49 19,429.35
D NET INCREASE IN CASH AND CASH EQUIVALENT (A+B+C) 5,707.26 5,538.77 E. Opening Cash and Cash Equivalent 8,659.73 3,120.97 F. Closing Cash and Cash Equivalent 14,366.99 8,659.74
NOTES: AS AT
31/03/2012 AS AT
31/03/2011Cash and Cash EquivalentsCash and Bank Balance (Note-18) (Includes margin money, deposit and lien) 17,198.68 18,739.30 Margin Money with Banks - (342.08)Deposits with Banks (2,831.69) (9,737.48)Cash and Cash Equivalent as per Cash Flow Statement 14,366.99 8,659.74
Consolidated Cash Flow Statement for the year ended 31st March, 2012

71Annual Report 2011-12
A. Basis of Preparation:
The Consolidated fi nancial statements of Kalpataru Power Transmission Limited, (the Parent) and; its subsidiaries and Joint Controlled Entities (JCE) collectively referred as (‘the Group’) are prepared in accordance with relevant accounting standards under the historical cost convention except as stated in note C(i). The accounts have been prepared on accrual basis of accountancy in accordance with the accounting principles generally accepted in India.
B. Principles of Consolidation:
The fi nancial statement of the subsidiary companies and jointly controlled entities (JCE) used in the consolidation are drawn upto the same reporting date as of the parent.
The consolidated fi nancial statements have been prepared on the following basis:
(i) The fi nancial statements of the Parent and its subsidiaries have been combined on line-by-line basis by adding together, the book value of like items of assets, liabilities, income and expenses. Inter-company balances and transactions and unrealized profi ts or losses have been fully eliminated.
(ii) The excess of cost to the Parent of its investments in subsidiary companies over its share of the net assets of the subsidiary companies at the dates, on which the investments in the subsidiary companies are made, is recognized as “Goodwill” being an asset in the consolidated fi nancial statements.
(iii) Minority interest in the net assets of consolidated subsidiaries consists of the amount of equity attributable to the minority shareholders at the date on which investments are made by the parent in the subsidiary companies.
(iv) Interest in Jointly Controlled Entities (JCE) are consolidated proportionately on a line-by-line basis by adding together the book values of assets, liabilities, income and expenses. Unrealised profi t / loss on inter company transactions have been eliminated except in two jointly controlled entities which have been reported by not using proportionate consolidation and the share of the profi t/loss only from joint venture entities has been accounted for, for the reason, as explained in Note No. 6(ii) of these notes to accounts.
C. Fixed Assets:
(i) Fixed assets are stated at cost of acquisition / construction / revalued amount less accumulated depreciation less impairment losses, if any.
(ii) Cost is inclusive of all identifi able expenditure incurred to bring the fi xed assets to their working condition for their intended use. When the fi xed asset is demolished, disposed off or destroyed, the costs and related depreciation is removed from the books of account and the resultant profi t or loss is refl ected in the profi t and loss account. Direct cost as well as related incidental expenses incurred on assets that are not yet ready for their intended use or not put to use as on the balance sheet date are stated as Capital Work In Progress.
(iii) All expenditure for capital works in progress viz. civil works, machinery under erection, construction and erection materials, pre-operative expenditure, expenditure indirectly related to the project and incidental to setting up project facilities, borrowing cost incurred prior to the date of commercial operation and trial run expenditure are shown under Capital Work In Progress (CWIP). These expenses are net of recoveries, claims and income (net of tax), if any, from surplus funds arising out of project specifi c borrowings.
D. Depreciation:
Depreciation is provided on the basis of straight-line method on all depreciable fi xed assets at the rates prescribed in Schedule –XIV of the Companies Act, 1956, on prorata basis except:
i) Depreciation pertaining to assets of Research & Development Centre, the Export Oriented Unit, mining and quarries, real estate and operating leases are provided on the basis of written down value method.
ii) Depreciation on plant and machinery of bio-mass energy plants is provided at a higher rate at 7.5% instead of the prescribed rate for continuous process plant considering the useful life of plant supported by technical evaluation and report.
iii) In case of revalued assets the difference between the depreciation based on revalued cost and the depreciation charged on historical cost is recouped out of revaluation reserve.
iv) Depreciation on overseas projects’ assets are provided at the rates as per the requirement of law of respective
Significant Accounting Policies forConsolidated Accounts

Kalpataru Power Transmission Ltd.72
foreign countries and as per such rates, depreciation provided in each overseas project is higher than the depreciation rates prescribed under Schedule-XIV of the Companies Act, 1956.
v) Deprecation on the vehicles in the group is provided at a higher rate at 15% instead of the prescribed rate, considering the useful life of vehicle based on technical evaluation by the management.
vi) Considering the useful life based on technical evaluation by the management, higher rate than the prescribed rates are applied on a few shuttering items of machinery at 30%, on offi ce equipments at 12.5% and on few plant and machineries which are acquired on or after 1st October, 2005 at 12.5% .
vii) Intangible assets are amortized over a period of fi ve years .
E. Revenue Recognition:
(i) Transmission & Distribution:
Sales are recognized on delivery of materials. Sales includes excise duty, freight receipts and export benefi ts but excludes VAT.
Erection and Works Contract revenue for work completed are recognized on percentage of completion method based on completion of physical proportion of the contract work. When it is probable that total contract cost will exceed the total contract revenue, the expected loss is recognized immediately.
(ii) Real Estate:
Revenue is recognized at the time of transfer of signifi cant risks and rewards of ownership to the buyer on executing agreement for sale and estimated cost of completion against Sales recognized, wherever applicable, is provided for in profi t and loss account. Advances received against booking of units are appearing as current liabilities.
(iii) Bio-mass Energy:
Revenue is recognized on supply of electricity generated to the customer.
(iv) Infrastructure:
Revenue is recognized by adding the aggregate cost and proportionate margin using the percentage completion method. Percentage of completion is determined as a proportion of cost incurred to date to the total estimated contract cost. When it is probable that total contract cost will exceed the total contract revenue, the expected loss is recognized immediately.
(v) Construction:
Running Account Bills for work completed are recognized on percentage of completion method based on completion of physical proportion of the contract work. Income on account of claims and extra item work is recognized to the extent group expects reasonable certainty about receipts or acceptance from the client. When it is probable that total contract cost will exceed the total contract revenue, the expected loss is recognized immediately.
(vi) Warehousing:
a. Revenue from warehousing facility under arrangement with National Collateral Management Services Ltd. (NCMSL) is recognized on the basis of 65% of revenue earned by NCMSL in terms of the agreement of Company with them, as per details provided for warehouse charges earned by them from the Warehouses of the Company.
b. Revenue from Cold storage and other warehousing facility other than in (a) above is recognized mainly as per prevailing rules and regulations of Local mandi / market, and as per terms of MOU with Rajsthan State Warehousing Corporation (RSWC )for storage of commodities; however at the end of the year revenue, if any remain to be booked is accounted for as accrued income under the accrual system of Accounting.
(vii) Trading:
Trading Sales are recognized on delivery and includes Export Incentives and excludes VAT.
(viii) Other income:
Dividends are recorded when the right to receive payment is established. Interest income is recognized on time proportion basis.
F. Inventories:
(i) Transmission & Distribution:
Raw materials, Fuel, Semi fi nished goods, Finished goods, scraps, construction work in progress, construction and other stores and spares, tools, are stated at lower of cost and net estimated realizable value. The cost of inventories is computed on weighted average basis.

73Annual Report 2011-12
ii) Construction :
Construction material, stores, spares and tools are valued at lower of cost or net realizable value. Cost includes cost of purchase and other expenses incurred in bringing inventory to their respective present location and condition. Cost is determined using FIFO method of inventory valuation.
Work in progress is valued at lower of cost and net realizable value. In case where work is completed but Running Account bill cannot be raised on client due to contractual conditions, the work in progress is valued at contract rates.
(ii) Trading :
Trading goods are stated at lower of cost and net realizable value. The cost of inventories is computed on FIFO basis.
G. Investments:
Long term investments are stated at cost after deducting the provision for diminution in value, if any, other than of a temporary nature. Current investments are stated at lower of cost or fair value.
H. Retirement Benefi ts:
(i) Gratuity liability is provided under a defi ned benefi t plan, under Group Gratuity Cash Accumulation Scheme of the Life Insurance Corporation of India under an irrevocable trust. The Company’s liability towards gratuity is determined on the basis of actuarial valuation done by an independent actuary.
(ii) Contribution to Provident Fund, a defi ned contribution plan is charged to the Profi t and Loss Account.
(iii) Provision for leave encashment liability is made on actuarial valuation as at the Balance Sheet date.
(iv) Short-term employee benefi ts are recognized as an expense at the undiscounted amount in the profi t and loss account of the year in which the related service is rendered.
I. Excise/Custom Duty:
The liability for excise and custom duty in respect of materials lying in factory/bonded premises is accounted for as and when they are cleared / debonded.
J. Foreign Currency Transactions:
Foreign currency transactions are accounted during the year at the exchange rates prevailing for the month of transaction.
Foreign currency assets and liabilities, remaining unsettled at the end of the year are translated at the exchange rate prevailing at the end of the year and difference is adjusted to respective accounts in profi t & loss account.
In case of transactions covered by forward exchange contracts, which are not intended for trading or speculation purpose, premium or discount are amortized as expenses or income over the life of the contract.
Any profi t or losses arising on settlement or cancellation of foreign currency forward contracts or options are recognized in profi t & loss account for year in which settlement or cancellation takes place.
Translation of overseas jobs / projects of non-integral foreign operations:
a) Assets and liabilities at the rates prevailing at the end of the year.
b) Income and expenses at the exchange rate prevailing for the month of transaction.
c) Resulting exchange differences are accumulated in foreign currency translation reserve account.
K. Borrowing Cost:
Borrowing costs that are directly attributable to the acquisition, construction or production of qualifying assets are capitalized as part of the cost of such assets. All other borrowing costs are recognized as expense in the period in which they are incurred.
L. Impairment of assets:
The carrying amount of assets is reviewed at each balance sheet date to determine whether there is any indication of impairment. If any such indication exists, the recoverable amount of the assets is estimated. An impairment loss is recognized whenever the carrying amount of an asset or its cash generating units exceeds its recoverable amount. An impairment loss is reversed if there has been a change in the estimates used to determine the recoverable amount and recognized in compliance with AS-28.

Kalpataru Power Transmission Ltd.74
M. Taxes on Income:
a) Tax on income for the current period is determined on the basis of estimated taxable income and tax credit computed in accordance with the provisions of the Income Tax Act, 1961.
b) Deferred tax is recognized on timing difference between estimated taxable income and accounting income that originate in one period and are capable of reversal in one or more subsequent period(s) and quantifi ed using the tax rates and laws enacted or substantively enacted as on the balance sheet date.
c) Deferred tax assets which arise mainly on account of unabsorbed losses or unabsorbed depreciation are recognized and carried forward only to the extent that there is virtual certainty supported by convincing evidence that suffi cient future taxable income will be available against which such deferred tax assets can be realized.
N. Accounting for Project Mobilization expenses:
Expenditure incurred on mobilization and creation of facilities for site is written off in proportion to work done at respective sites so as to absorb such expenditure during the tenure of the contract.
O. Use of Estimates:
The presentation of fi nancial statements requires certain estimates and assumptions. These estimates and assumptions affect the reported amount of assets and liabilities on the date of the fi nancial statements and the reported amount of revenues and expenses during the reporting period. Difference between the actual result and estimates are recognized in the period in which the results are known /materialized.
P. Provisions, Contingent Liabilities and Contingent Assets:
i) Provisions involving substantial degree of estimation in measurement are recognized when there is a present obligation as a result of past events and that probability requires an outfl ow of resources.
ii) A disclosure for a contingent liability is made when there is a possible obligation or a present obligation that may, but probably will not, require an outfl ow of resources. Where there is a possible obligation or a present obligation in respect of which the likelihood of outfl ow of resources is remote, no disclosure is made.
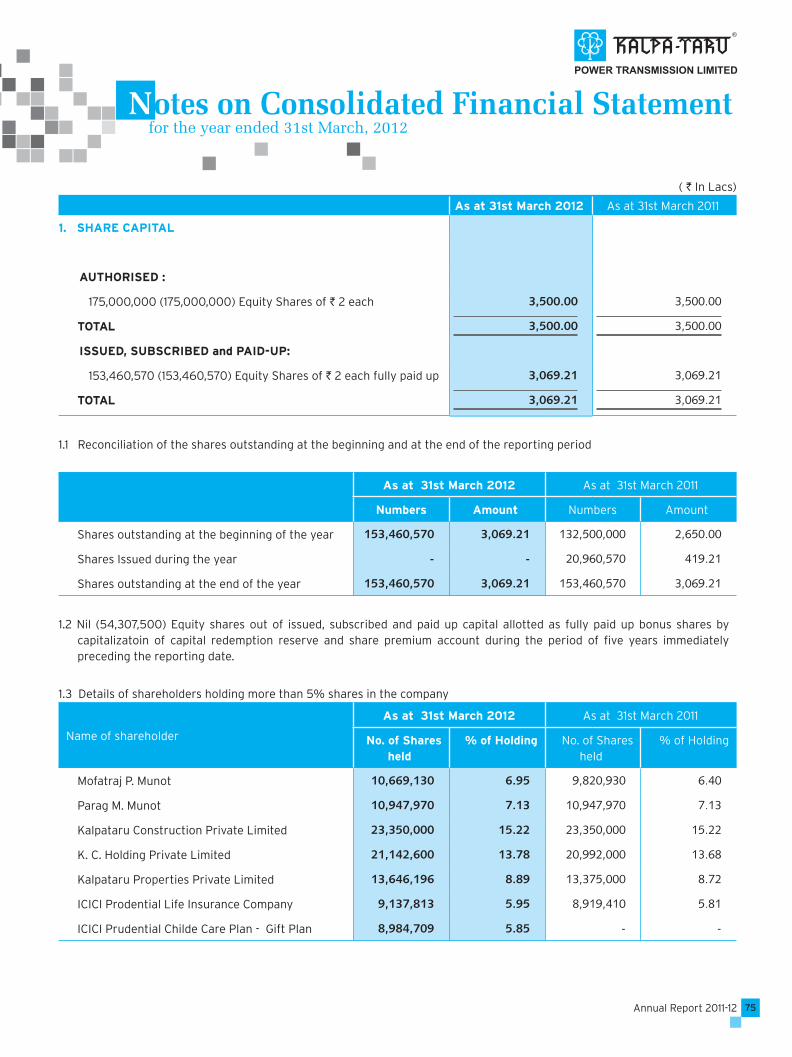
75Annual Report 2011-12
Notes on Consolidated Financial Statement for the year ended 31st March, 2012
( ` In Lacs)
As at 31st March 2012 As at 31st March 2011
1. SHARE CAPITAL
AUTHORISED :
175,000,000 (175,000,000) Equity Shares of ` 2 each 3,500.00 3,500.00
TOTAL 3,500.00 3,500.00
ISSUED, SUBSCRIBED and PAID-UP:
153,460,570 (153,460,570) Equity Shares of ` 2 each fully paid up 3,069.21 3,069.21
TOTAL 3,069.21 3,069.21
1.1 Reconciliation of the shares outstanding at the beginning and at the end of the reporting period
As at 31st March 2012 As at 31st March 2011
Numbers Amount Numbers Amount
Shares outstanding at the beginning of the year 153,460,570 3,069.21 132,500,000 2,650.00
Shares Issued during the year - - 20,960,570 419.21
Shares outstanding at the end of the year 153,460,570 3,069.21 153,460,570 3,069.21
1.2 Nil (54,307,500) Equity shares out of issued, subscribed and paid up capital allotted as fully paid up bonus shares by capitalizatoin of capital redemption reserve and share premium account during the period of fi ve years immediately preceding the reporting date.
1.3 Details of shareholders holding more than 5% shares in the company
Name of shareholder
As at 31st March 2012 As at 31st March 2011
No. of Shares held
% of Holding No. of Shares held
% of Holding
Mofatraj P. Munot 10,669,130 6.95 9,820,930 6.40
Parag M. Munot 10,947,970 7.13 10,947,970 7.13
Kalpataru Construction Private Limited 23,350,000 15.22 23,350,000 15.22
K. C. Holding Private Limited 21,142,600 13.78 20,992,000 13.68
Kalpataru Properties Private Limited 13,646,196 8.89 13,375,000 8.72
ICICI Prodential Life Insurance Company 9,137,813 5.95 8,919,410 5.81
ICICI Prudential Childe Care Plan - Gift Plan 8,984,709 5.85 - -
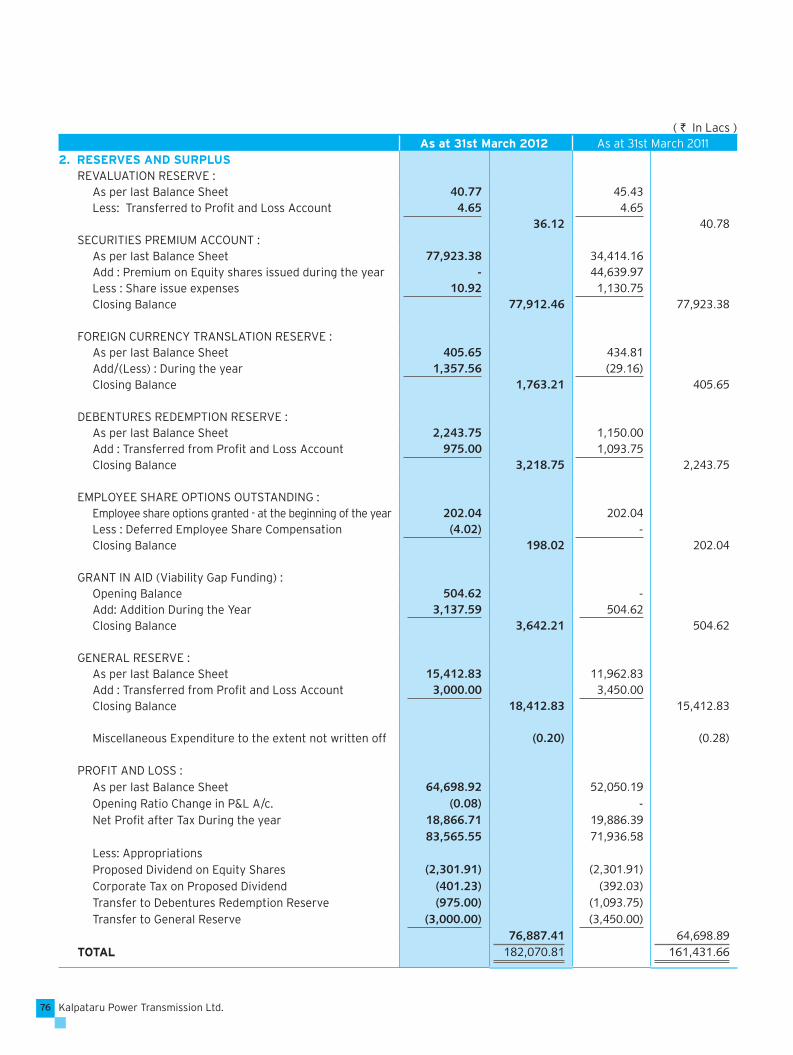
Kalpataru Power Transmission Ltd.76
( ` In Lacs )As at 31st March 2012 As at 31st March 2011
2. RESERVES AND SURPLUSREVALUATION RESERVE :
As per last Balance Sheet 40.77 45.43 Less: Transferred to Profi t and Loss Account 4.65 4.65
36.12 40.78 SECURITIES PREMIUM ACCOUNT :
As per last Balance Sheet 77,923.38 34,414.16 Add : Premium on Equity shares issued during the year - 44,639.97 Less : Share issue expenses 10.92 1,130.75 Closing Balance 77,912.46 77,923.38
FOREIGN CURRENCY TRANSLATION RESERVE : As per last Balance Sheet 405.65 434.81 Add/(Less) : During the year 1,357.56 (29.16)Closing Balance 1,763.21 405.65
DEBENTURES REDEMPTION RESERVE : As per last Balance Sheet 2,243.75 1,150.00 Add : Transferred from Profi t and Loss Account 975.00 1,093.75 Closing Balance 3,218.75 2,243.75
EMPLOYEE SHARE OPTIONS OUTSTANDING : Employee share options granted - at the beginning of the year 202.04 202.04 Less : Deferred Employee Share Compensation (4.02) - Closing Balance 198.02 202.04
GRANT IN AID (Viability Gap Funding) : Opening Balance 504.62 - Add: Addition During the Year 3,137.59 504.62 Closing Balance 3,642.21 504.62
GENERAL RESERVE : As per last Balance Sheet 15,412.83 11,962.83 Add : Transferred from Profi t and Loss Account 3,000.00 3,450.00 Closing Balance 18,412.83 15,412.83
Miscellaneous Expenditure to the extent not written off (0.20) (0.28)
PROFIT AND LOSS : As per last Balance Sheet 64,698.92 52,050.19 Opening Ratio Change in P&L A/c. (0.08) - Net Profi t after Tax During the year 18,866.71 19,886.39
83,565.55 71,936.58 Less: Appropriations Proposed Dividend on Equity Shares (2,301.91) (2,301.91)Corporate Tax on Proposed Dividend (401.23) (392.03)Transfer to Debentures Redemption Reserve (975.00) (1,093.75)Transfer to General Reserve (3,000.00) (3,450.00)
76,887.41 64,698.89 TOTAL 182,070.81 161,431.66

77Annual Report 2011-12
( ` In Lacs )As at 31st March 2012 As at 31st March 2011
Non-Current Current Non-Current Current 3. LONG TERM BORROWINGS
Secured
Non-Convertible Redeemable Debentures 18,250.00 1,750.00 20,000.00 -
Term Loans
Foreign Currency Loans
From Banks 12,365.50 565.16 493.28 493.28 Rupee Loans
From NBFC 6,061.38 704.35 2,564.72 - From Banks 40,460.22 8,581.94 14,170.09 4,443.31
Unsecured
Rupee Term Loans
From Company 365.29 - 365.29 -Fixed Deposits from Public 289.63 937.25 969.03 211.58
Amount disclosed under the head “Other Current
Liabilities” (Note 9) (12,538.70) (5,148.17)TOTAL 77,792.02 - 38,562.41 -
3.1 Details of Secured Non-Convertible Redeemable Debentures:
Non convertible redeemable debentures of Rs 150 crores are secured by fi rst exclusive charge on movable and immovable
fi xed assets (including land and building situated at Gandhinagar, Gujarat) of transmission & distribution division and
infrastructure division of Company to the extent of 1.25 times of NCDs outstanding.
Non convertible redeemable debentures of Rs 50 crores are secured by First charge on movable fi xed assets of the
Company to the extent of 1.25 times of the amount of NCDs in pari passu with consortium term lender Banks and HDFC
Bank, and fi rst charge by mortgage of a land at Maharajpura, Kadi, Gujarat.
3.2 Foreign Currency Loans:
External Commercial Borrowings are secured by charge over specifi c movable and immovable Plant and Machineries
fi nance through this Loan.
3.3 Rupee Loans from banks and NBFCs:-
Details of securities provided are as under:-
1. Secured against hypothecation of specifi c movable and immovable fi xed assets.
2. Secured against Lands, Building, Plant & Machinery created out of term loan and personally guaranteed by two
Executive Directors of one of its subsidiary.
3. Secured by:
a. fi rst mortgage and charge on all the Borrower’s immovable properties, if any, both present and future; save and
except the Project Assets.
b. a fi rst charge by way of hypothecation of all the Borrower’s movable assets; save and except the Project Assets.
c. a fi rst charge on Borrower’s Receivables save and except the Project Assets
d. a fi rst charge over all the Escrow Accounts of the Borrower
e. a fi rst charge on all intangibles of the Borrower
f. a fi rst charge by way of assignment or otherwise creation of Security Interest in all the right, title, interest,
benefi ts, claims and demands whatsoever of the Borrower in accordance with the provisions of the Substitution
Agreement and the Concession Agreement.
g. a fi rst charge by way of assignment or creation of security interest of all the rights, title, interest, benefi ts, claims
and demands whatsoever of the Borrower in the Project Documents.
h. pledge of equity shares held by the Promoter aggregating to 51% (fi fty one percent) of paid up and voting equity
share capital of the Borrower.

Kalpataru Power Transmission Ltd.78
( ` In Lacs )As at 31st March 2012 As at 31st March 2011
4. DEFERRED TAX LIABILITIES (NET)a) Deferred Tax Liability:
Depreciation 2,632.59 2,157.95 b) Deferred Tax Assets:
Expenses debited to Profi t & Loss account allowable in subsequent years u/s 43B, 40(a)(ia) of Income Tax Act, 1961 1,689.97 202.10 Unabsorbed losses and allowances 647.19 570.12
Deferred Tax Liability (Net) (a-b) 295.43 1,385.73
4.1 In accordance with the AS-22, ‘Accounting for Taxes on Income’, issued by the Institute of Chartered Accountants of India, net deferred tax liability is accounted for using the rates that have been enacted on substantially enacted at the balance sheet date.
As at 31st March 2012 As at 31st March 20115. OTHER LONG TERM LIABILITIES
Trade Payables 2,198.08 3,669.54 Advance from Clients 16,520.66 10,615.80 Payable to Joint Venture Entities 164.95 164.80 Deposits 95.10 82.38 TOTAL 18,978.79 14,532.52
As at 31st March 2012 As at 31st March 2011
6. LONG TERM PROVISIONS
Provision for Employee benefi ts 668.61 581.36 Provision for Performance Warranties 8,116.88 6,753.19
TOTAL 8,785.49 7,334.55
As at 31st March 2012 As at 31st March 20117. SHORT TERM BORROWINGS
Secured Working Capital Facilities from Banks 16,967.68 28,567.87 Other Loans from Banks 3,284.95 603.59
Unsecured a) Loans repayable on demand
from Company / Others 367.70 6,842.17 from Banks 17,037.00 3,124.94
b) Fixed Deposits from Public 135.07 229.41 TOTAL 37,792.40 39,367.98
7.1 Working Capital Facilities from Banks are secured in favour of consortium of bankers by hypothecation of stocks, stores and spares,book debts, bills receivables and all other movable assets on pari passu basis. Also secured by movable and immov-able fi xed assets (including land and building situated at Gandhinagar, Gujarat) of transmission & distribution division and infrastructure division of Company, on which debenture holders have fi rst exclusive charge to the extent of 1.25 times of outstanding debentures.
7.2 Working Capital Facilities from Banks are secured in favour of consortium bankers, by way of :
(a) First charge against hypothecation of stocks, work in progress, stores and spares, bills receivables, book debts and other current assets
(b) Second charge on plant and machineries fi nanced by consortium bankers.
(c) First charge on the offi ce premises of the Company.
7.3 Working Capital Loan secured against Hypothecation of stock, Book Debts, Plant & Machinery & Equipments,Other Fixed assets, Lands and Warehousing Complexes constructed thereon in Pari Pasu with Term Lender & Personally Guaranteed by two Executive Directors of a subsidiary.
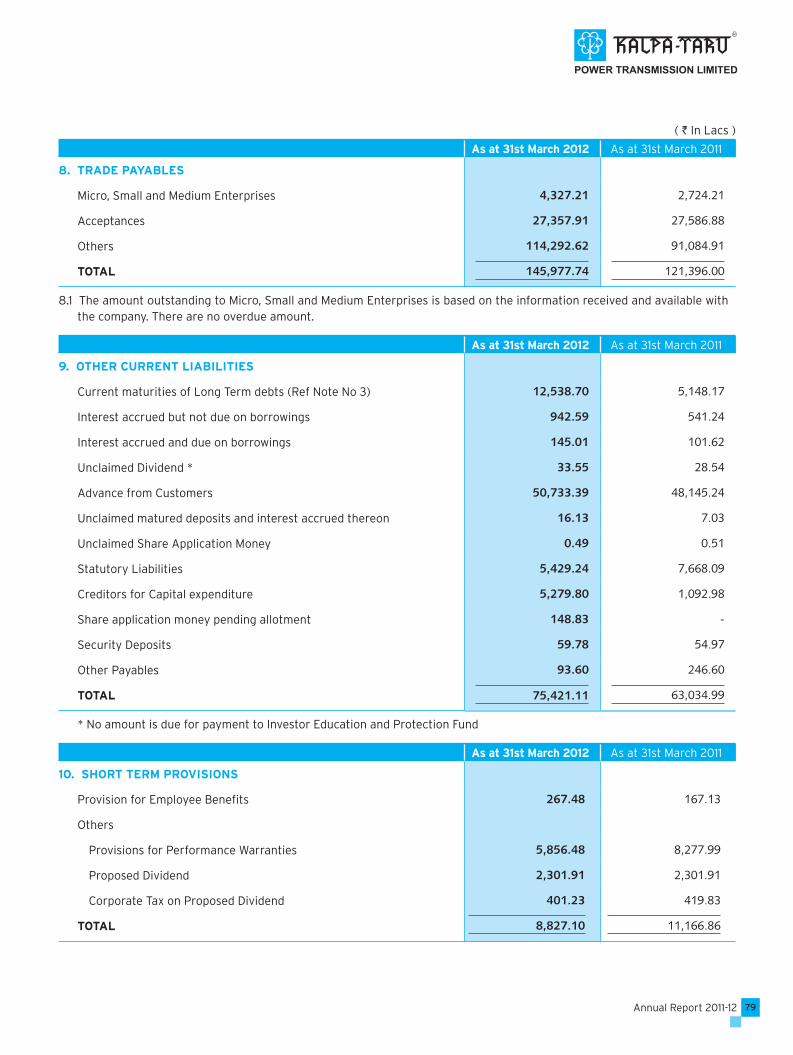
79Annual Report 2011-12
( ` In Lacs )
As at 31st March 2012 As at 31st March 2011
8. TRADE PAYABLES
Micro, Small and Medium Enterprises 4,327.21 2,724.21
Acceptances 27,357.91 27,586.88
Others 114,292.62 91,084.91
TOTAL 145,977.74 121,396.00
8.1 The amount outstanding to Micro, Small and Medium Enterprises is based on the information received and available with the company. There are no overdue amount.
As at 31st March 2012 As at 31st March 2011
9. OTHER CURRENT LIABILITIES
Current maturities of Long Term debts (Ref Note No 3) 12,538.70 5,148.17
Interest accrued but not due on borrowings 942.59 541.24
Interest accrued and due on borrowings 145.01 101.62
Unclaimed Dividend * 33.55 28.54
Advance from Customers 50,733.39 48,145.24
Unclaimed matured deposits and interest accrued thereon 16.13 7.03
Unclaimed Share Application Money 0.49 0.51
Statutory Liabilities 5,429.24 7,668.09
Creditors for Capital expenditure 5,279.80 1,092.98
Share application money pending allotment 148.83 -
Security Deposits 59.78 54.97
Other Payables 93.60 246.60
TOTAL 75,421.11 63,034.99
* No amount is due for payment to Investor Education and Protection Fund
As at 31st March 2012 As at 31st March 2011
10. SHORT TERM PROVISIONS
Provision for Employee Benefi ts 267.48 167.13
Others
Provisions for Performance Warranties 5,856.48 8,277.99
Proposed Dividend 2,301.91 2,301.91
Corporate Tax on Proposed Dividend 401.23 419.83
TOTAL 8,827.10 11,166.86
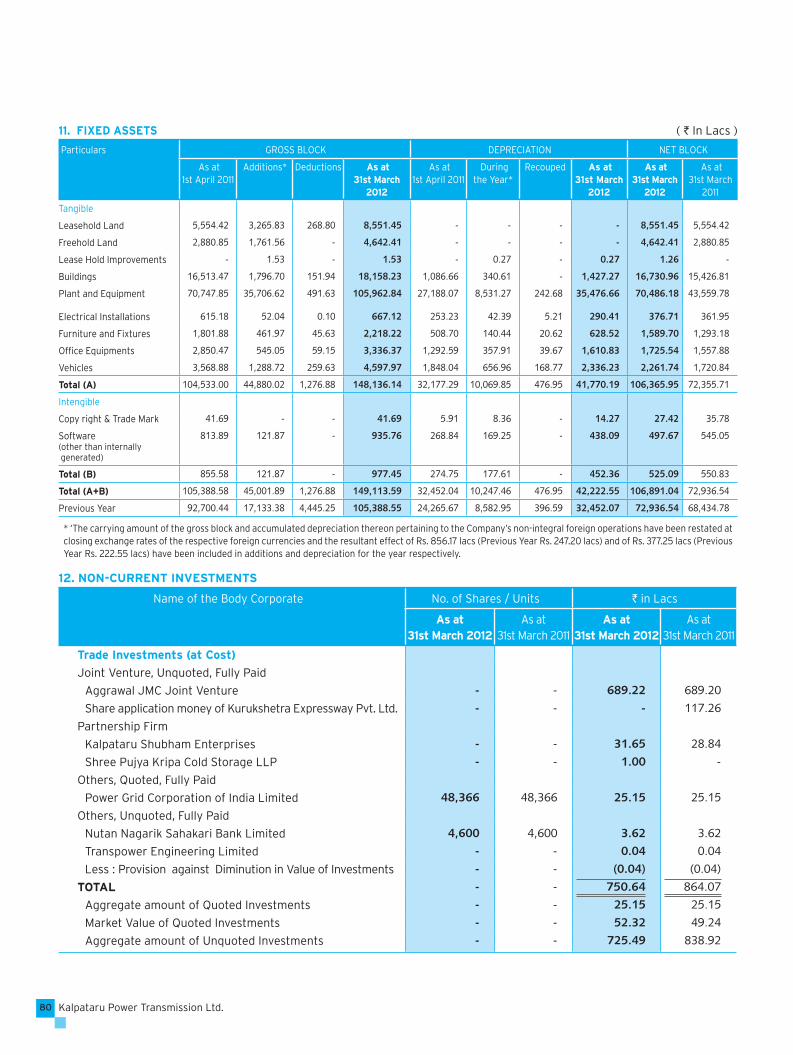
Kalpataru Power Transmission Ltd.80
11. FIXED ASSETS ( ` In Lacs )
Particulars
GROSS BLOCK DEPRECIATION NET BLOCK
As at 1st April 2011
Additions* Deductions As at 31st March
2012
As at 1st April 2011
During the Year*
Recouped As at 31st March
2012
As at 31st March
2012
As at 31st March
2011
Tangible
Leasehold Land 5,554.42 3,265.83 268.80 8,551.45 - - - - 8,551.45 5,554.42
Freehold Land 2,880.85 1,761.56 - 4,642.41 - - - - 4,642.41 2,880.85
Lease Hold Improvements - 1.53 - 1.53 - 0.27 - 0.27 1.26 -
Buildings 16,513.47 1,796.70 151.94 18,158.23 1,086.66 340.61 - 1,427.27 16,730.96 15,426.81
Plant and Equipment 70,747.85 35,706.62 491.63 105,962.84 27,188.07 8,531.27 242.68 35,476.66 70,486.18 43,559.78
Electrical Installations 615.18 52.04 0.10 667.12 253.23 42.39 5.21 290.41 376.71 361.95
Furniture and Fixtures 1,801.88 461.97 45.63 2,218.22 508.70 140.44 20.62 628.52 1,589.70 1,293.18
Offi ce Equipments 2,850.47 545.05 59.15 3,336.37 1,292.59 357.91 39.67 1,610.83 1,725.54 1,557.88
Vehicles 3,568.88 1,288.72 259.63 4,597.97 1,848.04 656.96 168.77 2,336.23 2,261.74 1,720.84
Total (A) 104,533.00 44,880.02 1,276.88 148,136.14 32,177.29 10,069.85 476.95 41,770.19 106,365.95 72,355.71
Intengible
Copy right & Trade Mark 41.69 - - 41.69 5.91 8.36 - 14.27 27.42 35.78
Software(other than internally generated)
813.89 121.87 - 935.76 268.84 169.25 - 438.09 497.67 545.05
Total (B) 855.58 121.87 - 977.45 274.75 177.61 - 452.36 525.09 550.83
Total (A+B) 105,388.58 45,001.89 1,276.88 149,113.59 32,452.04 10,247.46 476.95 42,222.55 106,891.04 72,936.54
Previous Year 92,700.44 17,133.38 4,445.25 105,388.55 24,265.67 8,582.95 396.59 32,452.07 72,936.54 68,434.78
* ‘The carrying amount of the gross block and accumulated depreciation thereon pertaining to the Company’s non-integral foreign operations have been restated at closing exchange rates of the respective foreign currencies and the resultant effect of Rs. 856.17 lacs (Previous Year Rs. 247.20 lacs) and of Rs. 377.25 lacs (Previous Year Rs. 222.55 lacs) have been included in additions and depreciation for the year respectively.
12. NON-CURRENT INVESTMENTS
Name of the Body Corporate No. of Shares / Units ` in Lacs
As at31st March 2012
As at31st March 2011
As at31st March 2012
As at31st March 2011
Trade Investments (at Cost)
Joint Venture, Unquoted, Fully Paid
Aggrawal JMC Joint Venture - - 689.22 689.20
Share application money of Kurukshetra Expressway Pvt. Ltd. - - - 117.26
Partnership Firm
Kalpataru Shubham Enterprises - - 31.65 28.84
Shree Pujya Kripa Cold Storage LLP - - 1.00 -
Others, Quoted, Fully Paid
Power Grid Corporation of India Limited 48,366 48,366 25.15 25.15
Others, Unquoted, Fully Paid
Nutan Nagarik Sahakari Bank Limited 4,600 4,600 3.62 3.62
Transpower Engineering Limited - - 0.04 0.04
Less : Provision against Diminution in Value of Investments - - (0.04) (0.04)
TOTAL - - 750.64 864.07
Aggregate amount of Quoted Investments - - 25.15 25.15
Market Value of Quoted Investments - - 52.32 49.24
Aggregate amount of Unquoted Investments - - 725.49 838.92
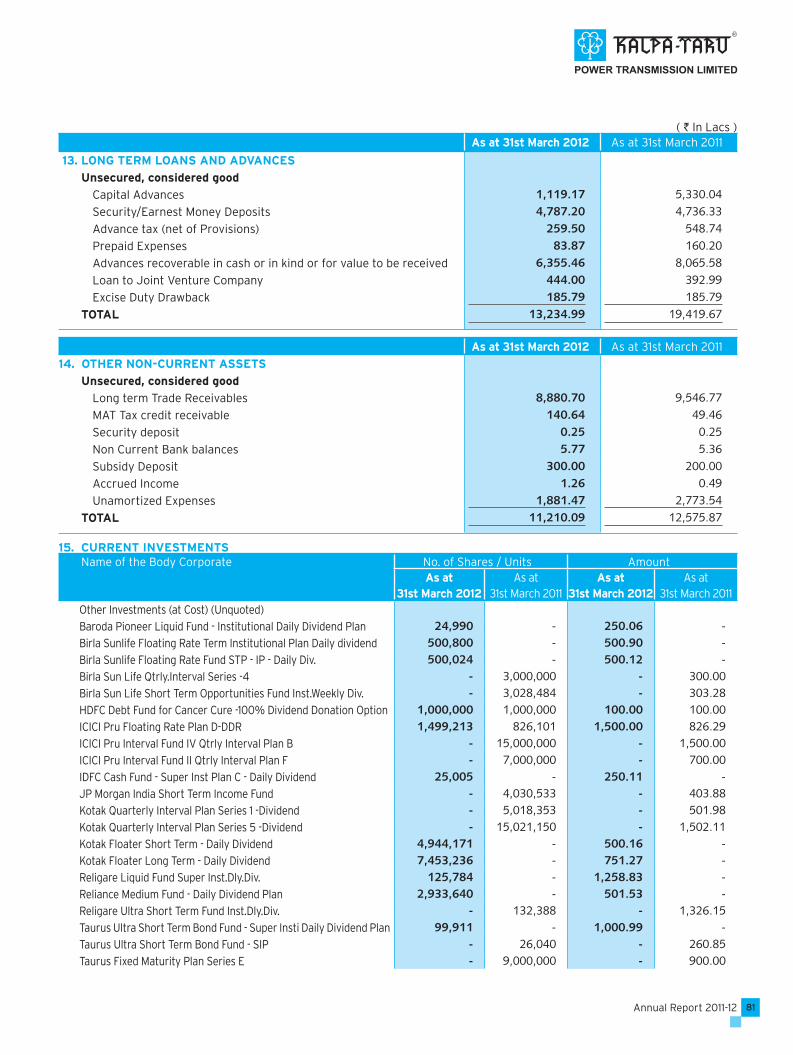
81Annual Report 2011-12
( ` In Lacs )As at 31st March 2012 As at 31st March 2011
13. LONG TERM LOANS AND ADVANCES
Unsecured, considered good
Capital Advances 1,119.17 5,330.04 Security/Earnest Money Deposits 4,787.20 4,736.33 Advance tax (net of Provisions) 259.50 548.74 Prepaid Expenses 83.87 160.20 Advances recoverable in cash or in kind or for value to be received 6,355.46 8,065.58 Loan to Joint Venture Company 444.00 392.99 Excise Duty Drawback 185.79 185.79
TOTAL 13,234.99 19,419.67
As at 31st March 2012 As at 31st March 2011
14. OTHER NON-CURRENT ASSETS
Unsecured, considered good
Long term Trade Receivables 8,880.70 9,546.77 MAT Tax credit receivable 140.64 49.46 Security deposit 0.25 0.25 Non Current Bank balances 5.77 5.36 Subsidy Deposit 300.00 200.00 Accrued Income 1.26 0.49 Unamortized Expenses 1,881.47 2,773.54
TOTAL 11,210.09 12,575.87
15. CURRENT INVESTMENTSName of the Body Corporate No. of Shares / Units Amount
As at31st March 2012
As at31st March 2011
As at31st March 2012
As at31st March 2011
Other Investments (at Cost) (Unquoted)
Baroda Pioneer Liquid Fund - Institutional Daily Dividend Plan 24,990 - 250.06 - Birla Sunlife Floating Rate Term Institutional Plan Daily dividend 500,800 - 500.90 - Birla Sunlife Floating Rate Fund STP - IP - Daily Div. 500,024 - 500.12 - Birla Sun Life Qtrly.Interval Series -4 - 3,000,000 - 300.00 Birla Sun Life Short Term Opportunities Fund Inst.Weekly Div. - 3,028,484 - 303.28 HDFC Debt Fund for Cancer Cure -100% Dividend Donation Option 1,000,000 1,000,000 100.00 100.00 ICICI Pru Floating Rate Plan D-DDR 1,499,213 826,101 1,500.00 826.29 ICICI Pru Interval Fund IV Qtrly Interval Plan B - 15,000,000 - 1,500.00 ICICI Pru Interval Fund II Qtrly Interval Plan F - 7,000,000 - 700.00 IDFC Cash Fund - Super Inst Plan C - Daily Dividend 25,005 - 250.11 - JP Morgan India Short Term Income Fund - 4,030,533 - 403.88 Kotak Quarterly Interval Plan Series 1 -Dividend - 5,018,353 - 501.98 Kotak Quarterly Interval Plan Series 5 -Dividend - 15,021,150 - 1,502.11 Kotak Floater Short Term - Daily Dividend 4,944,171 - 500.16 - Kotak Floater Long Term - Daily Dividend 7,453,236 - 751.27 - Religare Liquid Fund Super Inst.Dly.Div. 125,784 - 1,258.83 - Reliance Medium Fund - Daily Dividend Plan 2,933,640 - 501.53 - Religare Ultra Short Term Fund Inst.Dly.Div. - 132,388 - 1,326.15 Taurus Ultra Short Term Bond Fund - Super Insti Daily Dividend Plan 99,911 - 1,000.99 - Taurus Ultra Short Term Bond Fund - SIP - 26,040 - 260.85 Taurus Fixed Maturity Plan Series E - 9,000,000 - 900.00
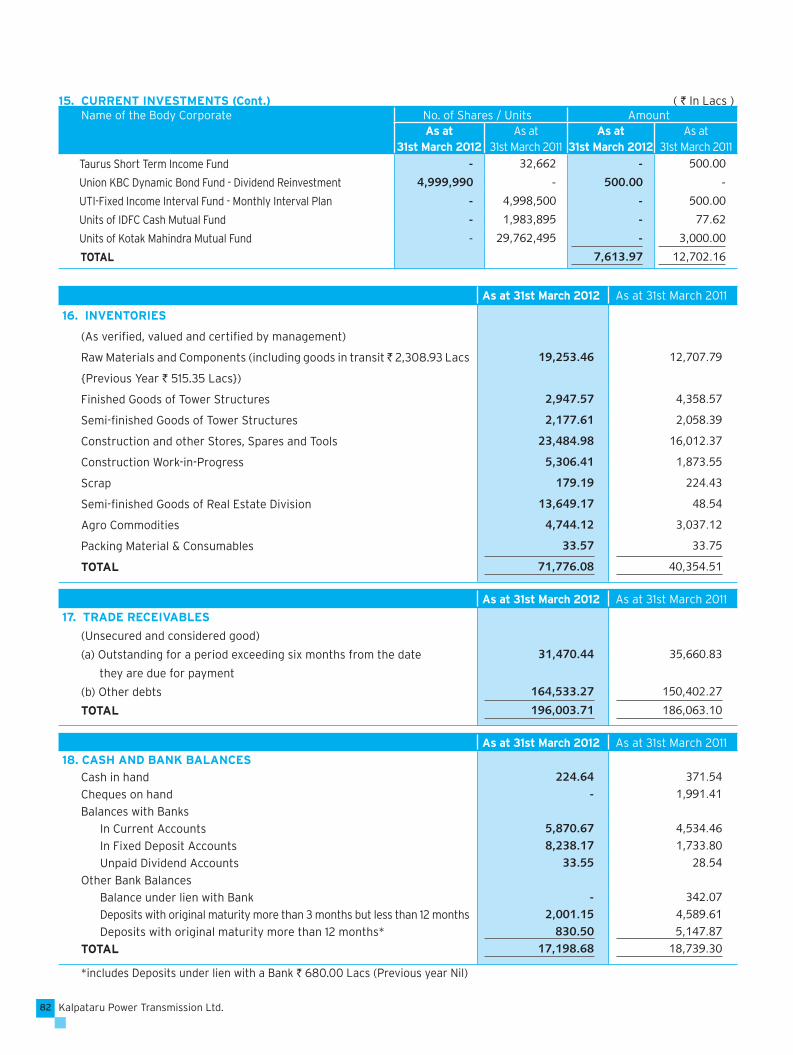
Kalpataru Power Transmission Ltd.82
As at 31st March 2012 As at 31st March 2011
16. INVENTORIES
(As verifi ed, valued and certifi ed by management)
Raw Materials and Components (including goods in transit ̀ 2,308.93 Lacs 19,253.46 12,707.79
{Previous Year ` 515.35 Lacs})
Finished Goods of Tower Structures 2,947.57 4,358.57
Semi-fi nished Goods of Tower Structures 2,177.61 2,058.39
Construction and other Stores, Spares and Tools 23,484.98 16,012.37
Construction Work-in-Progress 5,306.41 1,873.55
Scrap 179.19 224.43
Semi-fi nished Goods of Real Estate Division 13,649.17 48.54
Agro Commodities 4,744.12 3,037.12
Packing Material & Consumables 33.57 33.75
TOTAL 71,776.08 40,354.51
As at 31st March 2012 As at 31st March 2011
17. TRADE RECEIVABLES
(Unsecured and considered good)
(a) Outstanding for a period exceeding six months from the date 31,470.44 35,660.83
they are due for payment
(b) Other debts 164,533.27 150,402.27
TOTAL 196,003.71 186,063.10
As at 31st March 2012 As at 31st March 2011
18. CASH AND BANK BALANCES
Cash in hand 224.64 371.54 Cheques on hand - 1,991.41 Balances with Banks
In Current Accounts 5,870.67 4,534.46 In Fixed Deposit Accounts 8,238.17 1,733.80 Unpaid Dividend Accounts 33.55 28.54
Other Bank Balances
Balance under lien with Bank - 342.07 Deposits with original maturity more than 3 months but less than 12 months 2,001.15 4,589.61 Deposits with original maturity more than 12 months* 830.50 5,147.87
TOTAL 17,198.68 18,739.30
*includes Deposits under lien with a Bank ` 680.00 Lacs (Previous year Nil)
15. CURRENT INVESTMENTS (Cont.) ( ` In Lacs )Name of the Body Corporate No. of Shares / Units Amount
As at31st March 2012
As at31st March 2011
As at31st March 2012
As at31st March 2011
Taurus Short Term Income Fund - 32,662 - 500.00
Union KBC Dynamic Bond Fund - Dividend Reinvestment 4,999,990 - 500.00 -
UTI-Fixed Income Interval Fund - Monthly Interval Plan - 4,998,500 - 500.00
Units of IDFC Cash Mutual Fund - 1,983,895 - 77.62
Units of Kotak Mahindra Mutual Fund - 29,762,495 - 3,000.00
TOTAL 7,613.97 12,702.16

83Annual Report 2011-12
As at 31st March 2012 As at 31st March 2011
19. SHORT-TERM LOANS AND ADVANCES
(Unsecured and considered good unless otherwise stated)
Advances recoverable in cash or in kind or for value to be received 31,491.85 12,182.87
Advance Income Tax and TDS (net of provisions) 4,655.63 4,111.34
Prepaid Expenses 3,086.79 1,888.46
Security/Earnest Money Deposits 2,202.01 876.55
Commodity Margin Money 20.00 145.00
Inter Corporate Deposit 318.59 109.42
TOTAL 41,774.87 19,313.64
As at 31st March 2012 As at 31st March 2011
20. OTHER CURRENT ASSETS
Accrued Value of work done 57,103.94 51,659.76
Unamortised Expenses 2,843.01 893.10
Receivables for Sale of Fixed Assets 7.94 1,431.82
Accrued Income 786.50 588.58
TOTAL 60,741.39 54,573.26
2011-12 2010-11
21. REVENUE FROM OPERATIONS
(a) Sale of Products 222,863.96 199,445.57
(b) Income from Services 308,668.54 238,788.05
(c) Other Operating Income
Sale of Scrap 4,694.27 3,674.76
Certifi ed Emission Reduction Recepits 509.99 398.81
Other 12.50 12.96
5,216.76 4,086.53
TOTAL 536,749.26 442,320.15
2011-12 2010-11
22. OTHER INCOME
Interest Income 1,607.03 1,191.02
Dividend from Long Term Investments 0.99 0.73
Dividend from Current Investments 509.22 952.29
Insurance Claims 74.95 68.09
Liabilities Written Back 606.77 365.85
Miscellaneous Income 34.50 14.00
Rent Income 439.69 310.52
Profi t on Sale of fi xed assets 45.64 163.28
Share of Profi t in Joint Ventures 7.14 61.79
TOTAL 3,325.93 3,127.57
( ` In Lacs )
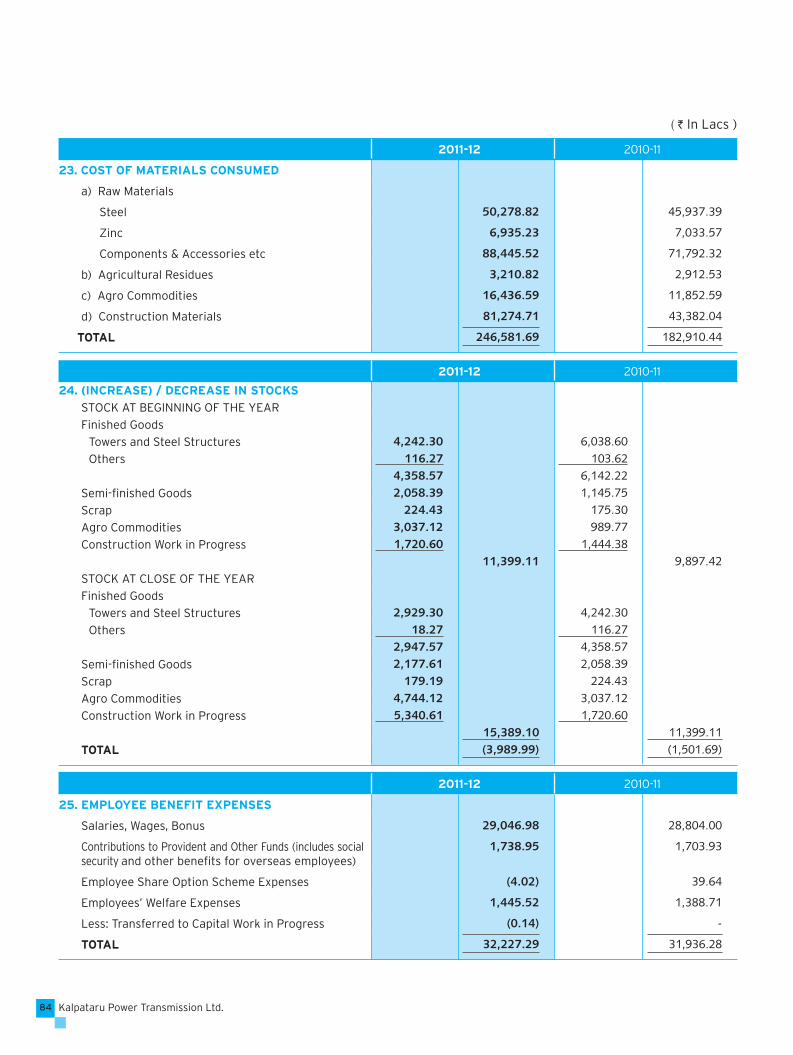
Kalpataru Power Transmission Ltd.84
2011-12 2010-11
23. COST OF MATERIALS CONSUMED
a) Raw Materials
Steel 50,278.82 45,937.39
Zinc 6,935.23 7,033.57
Components & Accessories etc 88,445.52 71,792.32
b) Agricultural Residues 3,210.82 2,912.53
c) Agro Commodities 16,436.59 11,852.59
d) Construction Materials 81,274.71 43,382.04
TOTAL 246,581.69 182,910.44
2011-12 2010-11
24. (INCREASE) / DECREASE IN STOCKS
STOCK AT BEGINNING OF THE YEAR
Finished Goods
Towers and Steel Structures 4,242.30 6,038.60 Others 116.27 103.62
4,358.57 6,142.22 Semi-fi nished Goods 2,058.39 1,145.75 Scrap 224.43 175.30 Agro Commodities 3,037.12 989.77 Construction Work in Progress 1,720.60 1,444.38
11,399.11 9,897.42 STOCK AT CLOSE OF THE YEAR
Finished Goods
Towers and Steel Structures 2,929.30 4,242.30 Others 18.27 116.27
2,947.57 4,358.57 Semi-fi nished Goods 2,177.61 2,058.39 Scrap 179.19 224.43 Agro Commodities 4,744.12 3,037.12 Construction Work in Progress 5,340.61 1,720.60
15,389.10 11,399.11 TOTAL (3,989.99) (1,501.69)
2011-12 2010-11
25. EMPLOYEE BENEFIT EXPENSES
Salaries, Wages, Bonus 29,046.98 28,804.00
Contributions to Provident and Other Funds (includes social security and other benefi ts for overseas employees)
1,738.95 1,703.93
Employee Share Option Scheme Expenses (4.02) 39.64
Employees’ Welfare Expenses 1,445.52 1,388.71
Less: Transferred to Capital Work in Progress (0.14) -
TOTAL 32,227.29 31,936.28
( ` In Lacs )

85Annual Report 2011-12
( ` In Lacs )2011-12 2010-11
26. OTHER EXPENSES
Erection and Sub-contracting Expenses 162,020.22 140,344.76 Job charges 2,363.22 2,866.30 Power and Fuel 954.11 747.43 Excise Duty 41.47 184.91 Repairs and Maintenance:
Plant and Machinery 224.82 193.66 Building 174.47 150.10 Other 97.86 74.65
Work Charges 183.90 325.82 Fumigation Expenses 152.41 30.24 Godown Rent 97.80 6.28 Freight and Forwarding Expenses 3,968.62 2,522.99 Stores, Spares and Tools Consumed 1,020.82 1,076.01 Vehicle/ Equipment Running and Hire Charges 643.29 581.46 Testing Expenses 197.23 176.50 Water Charges 8.25 5.75 Pollution Control Expenses 74.13 73.68 Insurance Charges 1,504.55 1,397.72 Rent 2,143.28 2,336.50 Rates and Taxes 8,204.76 4,263.48 Stationery,Printing and Drawing Expenses 455.57 471.95 Telecommunication Expenses 561.51 602.68 Travelling Expenses 2,413.33 2,060.82 Legal and Professional Expenses 1,892.51 1,447.56 Service Charges 2,362.15 1,860.70 Auditor’s Remuneration
Audit Fees 62.20 74.64 Company Law Matters 1.12 2.20 Taxation Matters 2.34 11.97 Other Services & Reports 2.83 46.88 Reimbursement of Expenses 3.00 2.23
71.49 137.92General Expenses 702.92 569.81 Miscellaneous Expenses 1,535.33 1,767.60 Taxes and Duties 3,250.30 1,887.19 Bank Commission and Charges 3,020.53 3,040.65 Selling Expenses 47.22 41.41 Carriage Outward 113.36 53.88 Training Expenses 26.89 35.60 Loss on sale of assets 63.64 46.97 Bad Debts Written Off 62.57 93.30 Balances Written Off 71.30 94.94 Share Issue Expenses 16.60 5.30 Share of RSWC (Refer Note No. 44) 288.16 95.36 Business Development Expenses 282.15 227.52 Loss on Investments ( Share of loss in JV fi rm ) 0.33 0.77 Performance Warranties Expenses 1,119.29 3,640.28 Loss by Theft/Damage/Fire 203.57 306.07 Service Tax 2,292.49 1,813.78 (Gain)/Loss on Exchange Rate Variation 702.40 (1,431.20)Sitting fees and Commission to Non-executive Directors 234.15 268.06 Preliminary Expenses 14.15 2.25 Carbon Credit Expenses 62.29 0.11 Reduction in WIP on valuation - 58.17 Purchase of Land - 7.23 Less : Transfer to WIP - (7.23)
205,941.41 176,557.69

Kalpataru Power Transmission Ltd.86
2011-12 2010-1127. FINANCIAL COSTS
Interest 15,154.69 11,984.72Other Borrowing Cost 855.05 993.31
16,009.74 12,978.03Add / (Less) : Exchange rate variation 909.46 (499.41)Add / (Less) : Transfer to Work In Progress (1,156.13) (826.16)TOTAL 15,763.07 11,652.46
28. a) Particulars of subsidiaries included in consolidation
Name of the SubsidiariesWith Effect
FromCountry of
Incorporation
Percentage of voting power
as at March 31, 2012
Subsidiaries (held directly)
JMC Projects (India) Limited 06.02.2007 India 67.19%
Energylink (India) Limited 30.01.2007 India 100.00%
Shree Shubham Logistics Limited 19.03.2007 India 85.19%
Amber Real Estate Limited 16.05.2008 India 100.00%
Adeshwar Infrabuild Limited 11.08.2009 India 100.00%
Kalpataru Power Transmission (Mauritius) Limited. 08.01.2009 Mauritius 100.00%
Kalpataru South Africa (Pty) Limited 03.09.2008 South Africa 100.00%
Kalpataru Power Transmission Nigeria Limited 19.05.2008 Nigeria 100.00%
Kalpataru Power Transmission USA INC 11.09.2009 USA 100.00%
Jhajjar Power Transmission Pvt Limited 25.06.2010 India 50.99%
Kalpataru Power Transmission Netherlands International B.V. 10.02.2012 Netherlands 100.00%
Subsidiaries (held indirectly)
JMC Mining & Quarries Limited, a subsidiary of JMC Projects (India) Limited 06.02.2007 India 67.19%
Saicharan Properties Limited, a subsidiary of Energylink (India) Limited 30.06.2009 India 100.00%
Brij Bhoomi Expressway Pvt. Ltd. a subsidiary of JMC Projects (India) Limited 06.12.2010 India 67.19%
Wainganga Expressway Pvt. Ltd., a subsidiary of JMC Projects (India) Limited 02.06.2011 India 67.19%
Kalpataru Power JLT, a subsidiary of Kalpataru Power Transmission (Mauritius)Limited 03.08.2011 UAE 100.00%
b) Particulars of Jointly Controlled Entities (JCE) included in consolidation.
Name of the SubsidiariesWith Effect
FromCountry of
Incorporation
Percentage of voting power
as at March 31, 2012
Kurukshetra Expressway Pvt. Ltd. 29.03.2010 India 49.61%
Jhajjar KT Transco Pvt. Ltd 19.05.2010 India 49.72%
Gestemp Kalpataru Solar Structuers Pvt. Limited 05.03.2011 India 50.00%
( ` In Lacs )
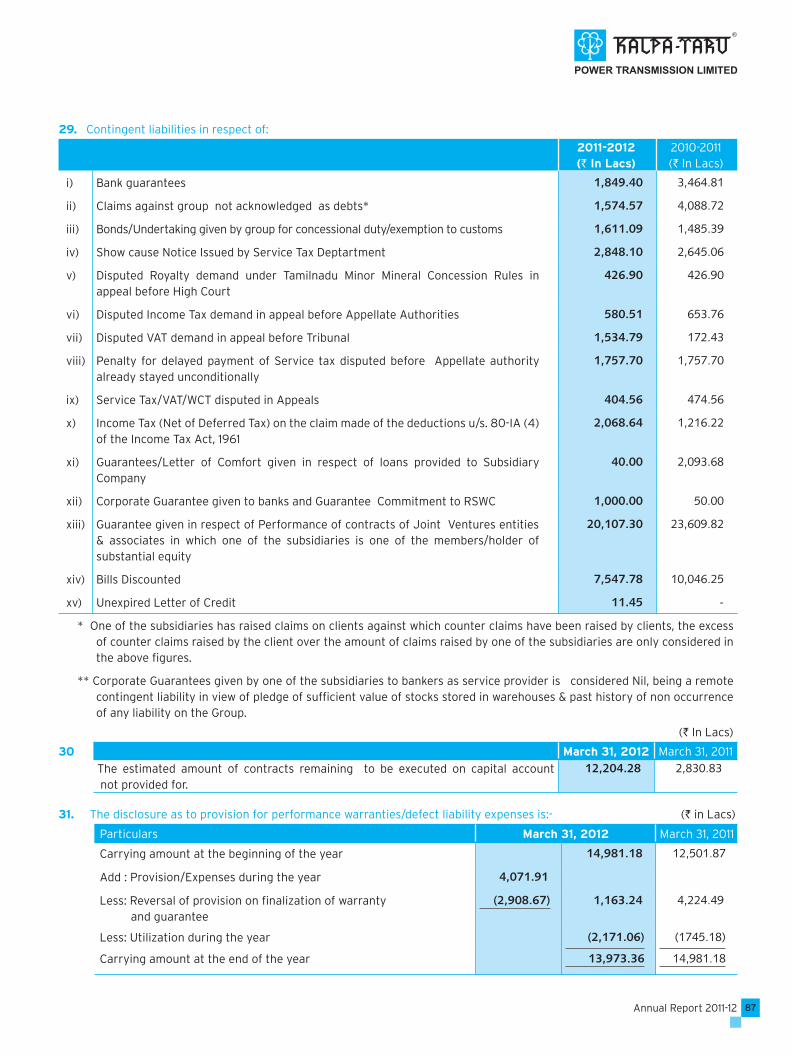
87Annual Report 2011-12
29. Contingent liabilities in respect of:
2011-2012(` In Lacs)
2010-2011(` In Lacs)
i) Bank guarantees 1,849.40 3,464.81
ii) Claims against group not acknowledged as debts* 1,574.57 4,088.72
iii) Bonds/Undertaking given by group for concessional duty/exemption to customs 1,611.09 1,485.39
iv) Show cause Notice Issued by Service Tax Deptartment 2,848.10 2,645.06
v) Disputed Royalty demand under Tamilnadu Minor Mineral Concession Rules in appeal before High Court
426.90 426.90
vi) Disputed Income Tax demand in appeal before Appellate Authorities 580.51 653.76
vii) Disputed VAT demand in appeal before Tribunal 1,534.79 172.43
viii) Penalty for delayed payment of Service tax disputed before Appellate authority already stayed unconditionally
1,757.70 1,757.70
ix) Service Tax/VAT/WCT disputed in Appeals 404.56 474.56
x) Income Tax (Net of Deferred Tax) on the claim made of the deductions u/s. 80-IA (4) of the Income Tax Act, 1961
2,068.64 1,216.22
xi) Guarantees/Letter of Comfort given in respect of loans provided to Subsidiary Company
40.00 2,093.68
xii) Corporate Guarantee given to banks and Guarantee Commitment to RSWC 1,000.00 50.00
xiii) Guarantee given in respect of Performance of contracts of Joint Ventures entities & associates in which one of the subsidiaries is one of the members/holder of substantial equity
20,107.30 23,609.82
xiv) Bills Discounted 7,547.78 10,046.25
xv) Unexpired Letter of Credit 11.45 -
* One of the subsidiaries has raised claims on clients against which counter claims have been raised by clients, the excess of counter claims raised by the client over the amount of claims raised by one of the subsidiaries are only considered in the above fi gures.
** Corporate Guarantees given by one of the subsidiaries to bankers as service provider is considered Nil, being a remote contingent liability in view of pledge of suffi cient value of stocks stored in warehouses & past history of non occurrence of any liability on the Group.
30 March 31, 2012 March 31, 2011
The estimated amount of contracts remaining to be executed on capital account not provided for.
12,204.28 2,830.83
(` In Lacs)
31. The disclosure as to provision for performance warranties/defect liability expenses is:- (` in Lacs)
Particulars March 31, 2012 March 31, 2011
Carrying amount at the beginning of the year 14,981.18 12,501.87
Add : Provision/Expenses during the year 4,071.91
Less: Reversal of provision on fi nalization of warranty and guarantee
(2,908.67) 1,163.24 4,224.49
Less: Utilization during the year (2,171.06) (1745.18)
Carrying amount at the end of the year 13,973.36 14,981.18

Kalpataru Power Transmission Ltd.88
32. Information in accordance with the requirement of the AS-7 issued by the Institute of Chartered Accountants of India as follows:- (` in Lacs)
Particulars March 31, 2012 March 31, 2011
1. Amount of Contract Revenue Recognized as Revenue in the period 308,809.63 237,032.72
2. Disclosure in respect of contract in progress at the Reporting Date
(a) Contract cost incurred & Recognized Profi t less Recognized losses up to the reporting date
516,375.27 524,387.32
(b) Advance Received 38,757.45 35,572.16
(c) Retention 21,058.47 24,655.24
3. Due from Customers 45,341.98 29,488.24
33. Related Party disclosure as required by Accounting Standard -18 is as below : -
(a) List of related persons(i) Joint Venture having transaction with group
• JMC-Associated• Aggrawal-JMC• JMC-Sadbhav• JMC-Taher Ali• JMC-PPPL• JMC-Tantia-JV• JMC-MSKE-JV• JMC –ATEPL-JV• GIL-JMC-JV• KPTL-JMC-Yadav-JV (Dankuni to Baruipara Line- Eastern Railways)• KPTL-JMC-Yadav-JV (Taljhari to Maharajpur Line- Eastern Railways)• KPTL-JMC-Yadav-JV (Baruipara to Chandanpur Line- Eastern Railways)• KPTL-JMC-Yadav-JV (Deshparan Nanigaram Line- South Eastern Railways)• GPT-KPTL-JV (Kalukhali to Bhatiapara Line), Bangladesh
(ii) Key Management Personnel and their relatives having transaction with group• Pankaj Sachdeva - Managing Director • K.V. Mani - Managing Director (upto May 31, 2009)• Manish Mohnot - Executive Director• Hemant Modi - Vice Chairman & Managing Director• Suhas Joshi - Managing Director • Aditya Bafna - Whole time Director• Shubhendra Bafna - Whole time Director • Mrs. Suverna I. Modi - Relative of Key Managerial Personnel• Mrs. Sonal H. Modi - Relative of Key Managerial Personnel• Ms. Ami H. Modi - Relative of Key Managerial Personnel
(iii) Associates/Enterprises under signifi cant infl uence having transaction with group• Kalpataru Properties Private Limited• Property Solution (India) Private Limited • Kalpataru Limited• P.K.Velu & Co. Private Limited • Kalpataru Theatres Private Limited .• Kalpataru Subham Enterprise• JMC Infrastructure Limited • SAI Consultant Engineers Private Limited
(iv) Individuals having signifi cant infl uence• Mofatraj P. Munot - Promoter Director• Parag Munot - Promoter Director
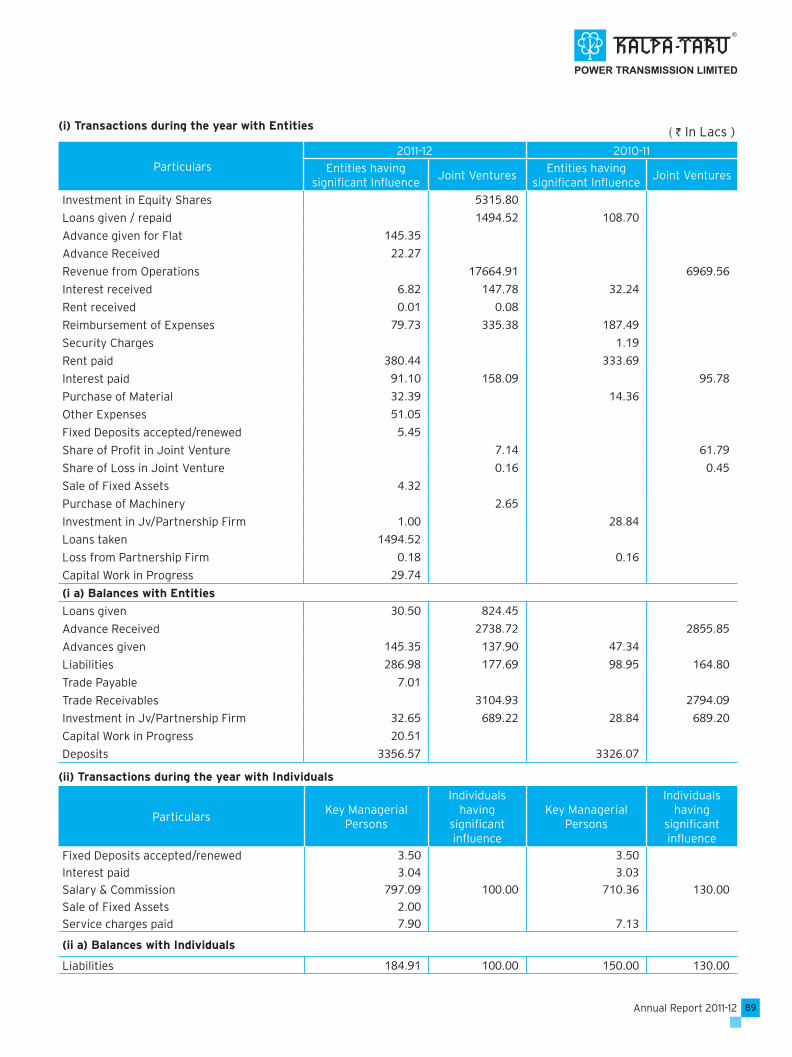
89Annual Report 2011-12
Particulars2011-12 2010-11
Entities having signifi cant Infl uence
Joint VenturesEntities having
signifi cant Infl uenceJoint Ventures
Investment in Equity Shares 5315.80Loans given / repaid 1494.52 108.70Advance given for Flat 145.35Advance Received 22.27Revenue from Operations 17664.91 6969.56Interest received 6.82 147.78 32.24Rent received 0.01 0.08Reimbursement of Expenses 79.73 335.38 187.49Security Charges 1.19Rent paid 380.44 333.69Interest paid 91.10 158.09 95.78Purchase of Material 32.39 14.36Other Expenses 51.05Fixed Deposits accepted/renewed 5.45Share of Profi t in Joint Venture 7.14 61.79Share of Loss in Joint Venture 0.16 0.45Sale of Fixed Assets 4.32Purchase of Machinery 2.65Investment in Jv/Partnership Firm 1.00 28.84Loans taken 1494.52Loss from Partnership Firm 0.18 0.16Capital Work in Progress 29.74(i a) Balances with Entities
Loans given 30.50 824.45Advance Received 2738.72 2855.85Advances given 145.35 137.90 47.34Liabilities 286.98 177.69 98.95 164.80Trade Payable 7.01Trade Receivables 3104.93 2794.09Investment in Jv/Partnership Firm 32.65 689.22 28.84 689.20Capital Work in Progress 20.51Deposits 3356.57 3326.07
(ii) Transactions during the year with Individuals
ParticularsKey Managerial
Persons
Individuals having
signifi cant infl uence
Key Managerial Persons
Individuals having
signifi cant infl uence
Fixed Deposits accepted/renewed 3.50 3.50Interest paid 3.04 3.03Salary & Commission 797.09 100.00 710.36 130.00Sale of Fixed Assets 2.00 Service charges paid 7.90 7.13
(ii a) Balances with Individuals
Liabilities 184.91 100.00 150.00 130.00
(i) Transactions during the year with Entities( ` In Lacs )

Kalpataru Power Transmission Ltd.90
34. The disclosure requirement as per Accounting Standard 17 segment reporting is :- ( ` in Lacs )
S.N. Particulars Segment
T&D # RED # BM # INFRA # Construction* Others Unallocable Consolidated
(I) Business Segment
1 Revenue :
Sales & Services 259,828.21 - 4,814.84 33,874.50 205,964.36 21,102.58 - 525,584.49
(249,562.08) (11.50) (4,303.97) (29,522.22) (135,161.56) (13,634.25) (-) (432,195.58)
Other Operating Income 4,079.89 12.50 517.19 - 607.18 - - 5,216.76
(3,255.33) (12.96) (402.11) (3.15) (412.95) (-) (-) (4,086.50)
Net Sales/Income from Operation 263,908.10 12.50 5,332.03 33,874.50 206,571.54 21,102.58 - 530,801.25
(252,817.41) (24.46) (4,706.08) (29,525.37) (135,574.51) (13,634.25) (-) (436,282.08)
Add : Other Income 241.23 0.83 230.35 1,483.68 82.76 1,287.08 3,325.93
(297.80) - (2.23) (159.75) (424.85) (161.56) (2,081.40) (3,127.59)
Total 264,149.33 12.50 5,332.86 34,104.85 208,055.22 21,185.34 1,287.08 534,127.18
(253,115.21) (24.46) (4,708.31) (29,685.12) (135,999.36) (13,795.81) (2,081.40) (439,409.67)
2 Segment Result Before Interest 27,031.88 11.00 327.36 1,925.26 10,488.64 2,442.81 1,280.99 43,507.94
(26,438.60) (22.11) (322.72) (2,727.91) (7,432.03) (1,683.73) (2,081.49) (40,708.59)
Finance Cost 15,763.07
(11,652.46)
Profi t after Finance cost 27,744.87
(29,056.13)
Extra Ordinary Item -
(-)
3 Current Tax 9,084.02
(8,485.01)
4 Deferred Tax -1,089.53
(571.25)
Prior Years’ Tax Adjustments -646.43
(1.18)
5 Net Profi t after Tax 20,396.81
(21,141.19)
6 Segment Asset 256,142.52 - 8,753.51 48,690.55 161,585.04 78,788.41 17,908.21 571,868.24
(225,636.05) (70.43) (7,978.24) (29,111.14) (120,504.53) (51,269.88) (37,914.81) (472,485.08)
7 Segment Liability 145,585.43 - 237.92 16,204.29 76,336.77 3,307.65 2,839.57 244,511.63
(117,797.61) (27.93) (109.00) (13,501.27) (69,273.68) (2,111.78) (11,004.60) (213,825.87)
Capital Employed (6 - 7 ) 110,557.09 - 8515.59 32,486.26 85,248.27 75,480.76 15,068.64 327,356.61
(107,838.44) (42.50) (7,869.24) (15,609.87) (51,230.85) (49,158.10) (26,910.21) (258,659.21)
8 Capital Expenditure 11,835.40 - 331.60 1,014.02 29,431.09 12,081.77 - 54,693.88
(Including CWIP) (7,915.01) (-) (91.31) (123.86) (10,786.58) (14,605.68) (-) (33,522.44)
9 Depreciation 2,925.40 0.36 476.90 1,407.51 4,720.27 328.18 0.22 9,858.84
(2,780.41) (0.55) (475.06) (1,336.65) (3,966.67) (237.52) (-) (8,796.86)

91Annual Report 2011-12
(II) Geographical SegmentRevenue
India 172,901.20 12.50 5,332.03 33,874.50 206,571.54 18,438.88 - 437,130.65
(155,808.29) (24.46) (4,706.08) (29,525.37) (135,574.51) (13,022.25) (-) (338,660.96)
Outside India 91,006.90 - - - - 2,663.70 - 93,670.60
(97,009.12) (-) (-) (-) (-) (612.00) (-) (97,621.12)
TOTAL 263,908.10 12.50 5,332.03 33,874.50 206,571.54 21,102.58 - 530,801.25
(252,817.41) (24.46) (4,706.08) (29,525.37) (135,574.51) (13,634.25) (-) (436,282.08)
# T&D -Transmission & Distribution ; RED - Real Estate ,BM- Bio Mass Energy;INFRA - Infrastructure
* Construction include mining receipt of JMC Mining & Quarries Ltd.
@ Figures in ( ) are for previous year.
Note:
(1) Geographical segment considered for disclosure are as follows:Revenue within India includes sales and services to customers located within India.Revenue outside India includes sales and services to customers located outside India.
35. Depreciation and Amortisation Expense
2011-12 2010-11
Depreciation and Amortisation 9,863.49 8,801.51 Less: Transferred from Revaluation Reserve 4.65 4.65TOTAL 9,858.84 8,796.86
36. Earnings per Share
2011-12 2010-11
No. of Equity Shares at the end of the year 15,34,60,570 15,34,60,570
Weighted No. of Equity Shares at the end of the year 15,34,60,570 15,14,50,652
Profi t for calculation of EPS (` in Lacs) 18,866.71 19,886.39
Basic and Diluted Earning per Share 12.29 13.13
Nominal value of Equity Share (`) 2.00 2.00
37. The Company entered into derivative contracts including forward contracts to hedger its risk associated with foreign currency fl uctuations. Company does not use derivative contracts including forward contracts for speculative purpose.
a. The particulars of derivatives including forward contracts entered into for hedging purpose outstanding are as under:( ` In Lacs )
Category of Derivative Instruments Amount of Exposures Hedged
March 31, 2012 March 31, 2011
Forward Contracts
Option Contracts
Currency Swaps
Interest Rate Swap
Commodity Futures
122,011.99
9,193.38
5,100.00
565.16
7,470.26
104,299.94
13,013.88
3,000.00
986.00
7,589.58
TOTAL 144,340.79 128,889.95
b. The Foreign Currency Exposure that is not hedged by derivative instruments as on March 31, 2012 amounts to ` 47,376.81 Lacs (P.Y. ` 29,044.06 Lacs).

Kalpataru Power Transmission Ltd.92
38. The Group has signifi cant leasing/ licensing arrangements/ (leasing arrangements) mainly in respect of residential / offi ce premises and equipments (operating lease). The aggregate lease rental payable on these leasing arrangements are charged as rent and equipment hire charges in these accounts amounting to ` 3,337.12 Lacs ( previous year ` 7,652.95 Lacs).
These leasing arrangements are for a period not exceeding 5 years and are in most cases renewal by mutual consent, on mutually agreeable terms. Future lease rental payable in respect of assets on lease for not later than 1 year is ` 1,910.34 Lacs (previous year ` 898.88 Lacs) and for later than 1 year but not later than 5 years is ` 2,459.61 Lacs. (Previous year ` 677.89 Lacs).
39. In the previous year on May 6, 2010, parent has Issued 4,192,114 equity shares of ` 10/- each at a premium of ` 1,064.20 per share totalling to ` 45,031.69 lacs to the Qualifi ed Institutional Investors under SEBI (Issue of Capital and Disclosure Requirements) Regulations, 2009 for the purpose of capital expenditure, expansion of manufacturing capacity (transmission line towers), long-term investment in PPP, BOT, BOOT and BOOM projects, development of EPC services, further investment in existing divisions and subsidiaries, working capital and such other purposes as may be permissible under applicable laws and government policies, including strategic initiatives such as investment and/or acquisitions. Pending utilization of the QIP proceeds for the purposes mentioned, they have been temporarily invested in fi xed deposits with banks and units of mutual funds. The proceeds from the issue have been utilized as follows:
( ` in Lacs )
March 31, 2012 March 31, 2011
Investments in Subsidiary Companies 13,722.43 13,237.43Investment in Jhajjar KT Transco Private Limited (SPV) 3,814.75 3,814.75Investment for Raipur Manufacturing Plant 3,407.25 2,483.48Utilisation in Working Capital 13,472.43 3,931.20Investments in units of Mutual Funds 7,500.00 9,450.00Fixed Deposits with Banks 2,000.00 11,000.00Share Issue Expenses 1,114.83 1,114.83TOTAL 45,031.69 45,031.69
40. In the opinion of the management the balances shown under trade receivables, accrued value of work done, loans and advances and other assets, whether current or non current, have approximately the same realizable value as shown in the accounts. However, these balances are subject to confi rmations.
41. The Management is of the opinion that as at the Balance Sheet date, there are no indications of a material impairment in the value of fi xed assets. Hence, the need to provide for an impairment loss does not arise.
42. Advance taxes paid, including tax deducted at sources are shown as assets net of provision of tax including foreign tax. Provision for tax (including foreign tax) is made after considering depreciation, deductions and allowances as per applicable tax statutes and regulations there under.
43. The Finance Act (2), 2009 has amended section 80-IA (4) of the Income Tax Act, 1961 by substituting an explanation to section 80-IA with retrospective effect from 01-04-2000. On the basis of the legal opinion of the experts and decided cases, one of the Subsidiaries has continued to claim deduction under section 80-IA (4) of the Act on eligible projects and consequently the subsidiary considers it appropriate not to create a liability for provision of Income Tax. However, an amount of Income tax (Net of Deferred Tax) of ̀ 877.14 Lacs for the current year and of ̀ 1191.50 Lacs for the earlier years since FY 2006-07 (both - include the amount of tax applicable on the share of profi t of Joint Venture Business claiming such deduction) has been disclosed as a contingent liability in note no. 29[x] to these Accounts.
44. One of the Subsidiaries has entered into MOU with Rajasthan State Warehousing Corporation (RSWC), a Government of Rajasthan Undertaking, for storage of Agriculture/Non Agriculture produces on the basis of sharing of revenue for own and RSWC warehouses. The share of RSWC for the revenue billed by subsidiary is shown as operating charges in Note 26 to the Profi t & Loss Account.
45. One of the Subsidiaries has fi led a writ petition in High Court of Rajasthan against order of Board of Revenue alleging violation of the principle of natural justice of audi alteram partem i.e. hearing the other party/side in the case where Board of Revenue questioned the purchase of land by the subsidiary at Alwar from the then owners. The land & building
93Annual Report 2011-12
at book value is ` 831.76 lacs. The subsidiary does not expect any liability on account of the same
46. Figures pertaining to the group companies have been re-classifi ed wherever necessary to bring them in line with the parent’s fi nancial statements.
47 Figures for the previous year for the subsidiaries named Kalpataru Power Transmission Netherlands International B.V and Wainganga Expressway Pvt. Ltd. are not included as the same became the subsidiaries in the current year.
48. The Company prepares and presents its fi nancial statements as per Schedule VI to the Companies Act, 1956, as applicable to it from time to time. In view of revision to the Schedule VI as per a notifi cation issued during the year by the Central Government, the fi nancial statements for the fi nancial year ended March31, 2012 have been prepared as per the requirements of the Revised Schedule VI to the Companies Act, 1956. The previous year fi gures have been accordingly regrouped / re-classifi ed to conform to the current year’s classifi cation.
In terms of our report attached For and on behalf of the Board
For Deloitte Haskins & Sells, Kamal Jain Pankaj SachdevaChartered Accountants President & CFO Managing Director
(Gaurav J. Shah) Bajrang Ramdharani Manish Mohnot Partner Company Secretary Executive Director(M. No. 35701)
MUMBAI : May 21 , 2012 MUMBAI : May 21 , 2012

Kalpataru Power Transmission Ltd.94
Statement pursuant to Section 212 of the Companies Act, 1956 relating to Subsidiary Companies
Name of the Subsidiary Company JMC Pro-jects
(India) Ltd.
JMC Mining & Quarries
Ltd.
Wainganga Expressway
Private Limited
Brij Bhoomi Expressway
Private Limited
Shree Shubham Logistics
Ltd.
Energylink (India) Ltd.
Amber Real Estate
Ltd.
Financial year of the subsidiary company ended on
3/31/2012 3/31/2012 3/31/2012 3/31/2012 3/31/2012 3/31/2012 3/31/2012
Number of Equity Shares in the subsidiary company held by Kalpataru Power Transmission Ltd. at the above date and %:
17,548,908 - - - 35,850,000 1,000,000 990,000
67.19% 67.19% 67.19% 67.19% 85.11% 100% 100.00%
The net aggregate profi t less loss-es of the subsidiary company so far as it concerns the members of Holding Company.
(i) Dealt with or provided for in the accounts of Holding Company amounted to :
(a) for the subsidiary’s fi nancial year ended March 31, 2010
Nil Nil Nil Nil Nil Nil Nil
(b) for previous fi nancial years of the subsidiary since it
Nil Nil Not Appli-cable, Since
it became subsidiary during the
year
Nil Nil Nil Nil
became subsidiary :
(ii) Not dealt or provided for in the accounts of Holding Company amounted to :
(a) for the subsidiary’s fi nancial year ended March 31, 2011 Rs. in lacs
2,501.47 NIL NIL NIL 274.48 (5.29) (4.09)
(b) for previous fi nancial years of the subsidiary since it
5,820.42 NIL Not Appli-cable, Since
it became subsidiary during the
year
NIL (37.08) (24.31) (5.81)
became subsidiary Rs in lacs:
Statement pursuant to exemption received under Section 212(8) of the Companies Act, 1956 relating toSubsidiary Companies
Sr. No.
Name of SubsidiaryCompanies
JMC Pro-jects
(India) Ltd.
JMC Mining & Quarries
Ltd.
Wainganga Expressway
Private Limited
Brij Bhoomi Expressway
Private Limited
Shree Shubham Logistics
Ltd.
Energylink (India) Ltd.
Amber Real Estate
Ltd.
Financial year of the sub-sidiary companies ended on
3/31/2012 3/31/2012 3/31/2012 3/31/2012 3/31/2012 3/31/2012 3/31/2012
1 Capital 2,611.83 50.00 3,000.00 2,125.00 5,800.00 100.00 99.00
2 Reserves 39,634.95 22.16 (11.31) (9.60) 247.27 (30.74) (10.73)
3 Total Liabiltiies 109,899.62 150.62 2,121.80 3,717.96 25,034.39 15,531.71 12,093.15
4 Total Assets 152,146.40 257.74 5,110.49 5,834.36 31,081.66 15,600.98 12,181.42
5 Investments (Other than in subsidiaries)
1.15 2.47 - - 32.65 - -
6 Turnover 207,637.76 84.26 - - 20,289.16 24.00 -
7 Profi t before taxation 6,436.61 (10.83) (11.31) 0.94 468.36 (4.95) (4.09)
8 Provision for taxation 1,242.99 1.91 - 145.88 0.34 -
9 Profi t after taxation 5,193.62 (8.91) (11.31) 0.94 322.48 (5.29) (4.09)
10 Proposed dividend
(Percentage) 20% - - - - - -
As on 31.03.2012: 1 USD = INR 51.16, 1 ZAR = INR 6.69 , 1 NGN = INR 0.32, 1 EUR = INR 68.34

95Annual Report 2011-12
Statement pursuant to Section 212 of the Companies Act, 1956 relating to Subsidiary Companies (Cont.)
Jhajjar Power
Transmis-sion Pvt. Ltd
Kalpa-taru Power
Transmision Nigeria Ltd.
Kalpataru SA (Propri-etary) Ltd.
Kalpa-taru Power
Transmision (Mauritius)
Ltd.
Kalpa-taru Power
Transmision USA., INC
Kalpataru Power JLT
Kalpa-taru Power
Transmis-sion Inter-
national B.V.
Adeshwar Infrabuild
Limited
Saicharan Properties
Limited
3/31/2012 3/31/2012 3/31/2012 3/31/2012 3/31/2012 3/31/2012 3/31/2012 3/31/2012 3/31/2012
5,099 1,000,000 500,000 300,000 500,000 - 18,000 500,000 -
50.99% 100.00% 100.00% 100.00% 100.00% 100.00% 100.00% 100.00% 100.00%
Nil Nil Nil Nil Nil Nil Nil Nil Nil
Nil Nil Nil Nil Nil Not Applica-ble, Since it
became sub-sidiary during
the year
Not Appli-cable, Since
it became subsidiary during the
year
Nil Nil
(0.13) (25.00) (2.00) (15.18) 107.98 NIL (8.91) (1.33) NIL
(0.93) (26.66) (1.53) (20.32) (33.09) Not Applica-ble, Since it
became sub-sidiary during
the year
Not Appli-cable, Since
it became subsidiary during the
year
(23.99) NIL
Statement pursuant to exemption received under Section 212(8) of the Companies Act, 1956 relating to Subsidiary Companies (cont.)
Jhajjar Power
Transmis-sion Pvt Ltd
Kalpa-taru Power
Transmision Nigeria Ltd.
Kalpataru SA (Propri-etary) Ltd.
Kalpa-taru Power
Transmision (Mauritius)
Ltd.
Kalpa-taru Power
Transmision USA., INC
Kalpataru Power JLT
Kalpa-taru Power
Transmis-sion Inter-
national B.V.
Adeshwar Infrabuild
Limited
Saicharan Properties
Limited
3/31/2012 3/31/2012 3/31/2012 3/31/2012 3/31/2012 3/31/2012 3/31/2012 3/31/2012 3/31/2012
1.00 32.43 33.44 153.47 255.78 132.99 12.30 5.00 5.00
(2.07) (55.02) 28.20 (38.42) 74.26 (4.83) (8.91) (25.32) (2.21)
1.91 46.87 0.82 31.81 106.99 7.80 8.41 20.73 12,615.57
0.84 24.29 62.45 146.86 437.03 135.97 11.80 0.41 12,618.36
- - - - - - - -
- - - - 1,174.07 - - - -
(0.25) (25.00) (2.00) (15.18) 150.17 (4.83) (8.91) (1.33) (0.57)
- - - - 42.19 - - - -
(0.25) (25.00) (2.00) (15.18) 107.98 (4.83) (8.91) (1.33) (0.57)
- - - - - - - -
As on 31.03.2012: 1 USD = INR 51.16, 1 ZAR = INR 6.69 , 1 NGN = INR 0.32, 1 EUR = INR 68.34

Kalpataru Power Transmission Ltd.96
NOTES

Forward looking statement
In this annual report we have disclosed forward looking information to enable investors to comprehend our prospects and take informed investment decisions. This report and other statements, written and oral, that we periodically make contain forward looking statements that set out anticipated results based on the management’s plan and assumptions. We have tried wherever possible to identify such statements by using words such as ̀ anticipate’, `estimate’, ̀ expects’, ̀ project’, ̀ intends’, ̀ plans’, ̀ believes’ and words of similar substance in connection with any discussion of future performance.
We cannot guarantee that these forward-looking statements will be realised, although we believe we have been prudent in assumptions. The achievement of results is subject to risks, uncertainties and even inaccurate assumptions. Should known or unknown risks or uncertainties materialise or should underlying assumptions prove inaccurate, actual results could vary materially from those anticipated, estimated or projected. Investors should bear this in mind. We undertake no obligation to publicly update any forward looking statements, whether as a result of new information, future information or otherwise.

Corporate Offi ce:
‘Kalpataru Synergy’7th Floor, Opp. Grand Hyatt,Vakola, Santacruz (E),Mumbai - 400 055, India.Tel.: +91-22-3064 5000Fax: +91-22-3064 3131
Factory & Registered Offi ce:
Plot No. 101, Part III, G.I.D.C. Estate,Sector 28, Gandhinagar - 382 028,Gujarat, India.Tel.: +91-79-2321 4000Fax: +91-22-2321 1966 / 68 / 71
Website:
www..kalpatarupower.comwww.jmcprojects.comwww.kalpataru.comwww.ssll.in
ANNUAL REPORT 2011-12
PursueFocus
Deliver
A W
YA
TT
So
luti
on
(in
fo@
wya
tt.c
o.in
)P
rin
ted
by
Tac
o V
isio
ns
Pvt
. Ltd
. (w
ww
.tac
ovis
ion
s.co
m)


![Proposed Project Kalpataru Yashodhan [formerly Kalpataru ... · PDF fileProposed Project "Kalpataru Yashodhan" [formerly Kalpataru Grandeur(Yashodhan)] at FP - 71, TPS, Andheri - VI,](https://static.fdocuments.in/doc/165x107/5a9c85ce7f8b9ad96f8e8939/proposed-project-kalpataru-yashodhan-formerly-kalpataru-proposed-project.jpg)