FOCUS DISCIPLINE GROWTH
39
FOCUS DISCIPLINE GROWTH Second Quarter Report 2021 Q2
Transcript of FOCUS DISCIPLINE GROWTH

F O C U S D I S C I P L I N E G R O W T H
Second Quarter Report 2021
Q2

report to shareholders 1
management’s discussion and analysis 2
consolidated financial statements 24
notes to consolidated financial statements 28
corporate information 36
Total Energy Services Inc. (“Total Energy” or the “Company”) is a public energy
services company based in Calgary, Alberta that provides a variety of products and
services to the oil and natural gas industry through its subsidiaries and aboriginal
partnerships. Total Energy is involved in four businesses: contract drilling services,
the rental and transportation of equipment used in the drilling, completion and
production of oil and natural gas wells, the fabrication, sale, rental and servicing of
new and used natural gas compression and oil and natural gas process equipment
and well servicing. Together these businesses provide a platform for building long-
term shareholder value. Total Energy has achieved its growth by maintaining a
disciplined acquisition strategy and undertaking strategic internal growth.
The shares of Total Energy are listed and trade on the Toronto Stock Exchange
under the symbol TOT.
T O T A L E N E R G Y S E R V I C E S I N C .
R E P O R T T O S H A R E H O L D E R S
Despite continued global economic and market uncer-tainty, with the sustained increase in oil and natural gas prices, North American energy service industry conditions began to recover during the second quarter of 2021 from the historic lows following the COVID-19 outbreak in March of 2020. While second quarter activity levels in Australia were lower compared to 2020, due in part to wet weather condi-tions that restricted field activity, they increased modestly from the first quarter of 2021.
While industry activity remained well below pre-COVID levels for the first half of 2021, Total Energy generated over $41.0 million of free cash flow after changes in non-cash working capital and funding net capital expenditures and interest expense. This substantial free cash flow was used in part to repay $29.3 million of bank debt. The Company also began to return capital to its owners with $1.9 million directed towards share buybacks during the second quar-ter. With $127.2 million of positive working capital, Total Energy exited the second quarter of 2021 with over $142 million of liquidity (consisting of $29.2 million of cash on hand and $113 million available on existing credit facilities) and its lowest net debt position since completing the acqui-sition of Savanna Energy Services in June 2017.
LOOKING FORWARD
North American drilling activity has continued to increase in the third quarter, particularly in Canada where the number of wells drilled in July was approximately eight times higher than July of 2020. Total Energy currently has 16 rigs drilling in Canada and additional rigs are expected to begin operations over the next several weeks. While the overall land rig count in the United States has not recov-ered to the same extent as Canada, market share gains have seen the Company’s current active rig count return to 2019 levels, with 8 of 13 rigs currently operating. In Australia, the first of two rigs removed from service in the third quarter of 2020 for recertification and upgrades commenced drill-ing in late April. The second rig was completed and com-menced operations in late July such that four of five rigs are currently operating as compared to two rigs at the begin-ning of 2021.
Higher drilling activity is driving increased demand for the equipment and services provided by Total Energy’s other business segments. Industry rationalization and reduced maintenance spending over the past several quarters is
expected to lead to certain equipment shortages should de-mand for such equipment continue to increase. Increasing activity levels is also expected to give rise to human resource challenges, particularly in Canada where a multi-year downturn has caused many experienced workers to leave the industry.
The fabrication sales backlog in Total Energy’s Compression and Process Services segment increased for the third con-secutive quarter and multi-year high natural gas prices are providing a tailwind for quoting activity. The CPS segment’s extensive inventory of major components, notably large horsepower Caterpillar engines, positions our business well as supply chain issues begin to weigh on timely access to such components. Further, as fabrication sales activity con-tinues to recover, such inventory will be converted to cash, thereby mitigating the normal working capital demands associated with increasing business activity.
We are proud to have navigated through the most difficult industry downturn ever faced in Total’s 25-year operating history. We are particularly proud of our investment track record in a highly cyclical industry insofar as we have never recorded an impairment of any of our capital assets, includ-ing goodwill. That said, we remain absolutely committed to our core principle of capital discipline, particularly given the current attractiveness of share buybacks. We have also never shied away from using our financial strength to pursue compelling investment opportunities, as evidenced by our Board’s approval of a $13.1 million increase to our 2021 capital expenditure budget.
Finally, I am pleased to welcome Jessica Kirstine to our Board of Directors. Ms. Kirstine not only brings extensive upstream oil and gas industry experience to Total Energy, but she will also provide a unique and valuable perspective on existing and future energy infrastructure challenges and opportunities. Management looks forward to ben-efitting from Jessica’s insight and guidance as we strive to provide innovative and efficient offerings to the global energy industry.
DANIEL K. HALYKPresident and Chief Executive Officer
August 11, 2021
1
F O C U S • D I S C I P L I N E • G R O W T H
T O T A L E N E R G Y S E R V I C E S I N C .
M A N AG E M E N T ’ S D I S C U S S I O N A N D A N A LYS I S (“ M D & A” )
The following MD&A for Total Energy Services Inc. (“Total Energy” or the “Company”) was prepared as at August 11, 2021 and focuses on information and key statistics from the unaudited condensed interim consolidated financial statements of the Company for the three and six months ended June 30, 2021 (the “Interim Financial Statements”) and pertains to known risks and uncertainties relating to the energy services sector. This discussion should not be considered all-inclusive as it does not include all changes regarding general economic, political, governmental and environmental conditions.
This MD&A should be read in conjunction with the Company’s Interim Financial Statements, the Company’s 2020 Annual Report, the Annual Information Form (“AIF”) for the year ended December 31, 2020 and the cautionary statement regarding forward-looking information and statements below. Additional information relating to Total Energy, including the Company’s AIF, may be found on SEDAR at www.sedar.com.
Unless otherwise indicated, all dollar amounts presented herein are in thousands of Canadian dollars except per share amounts which are presented in Canadian dollars.
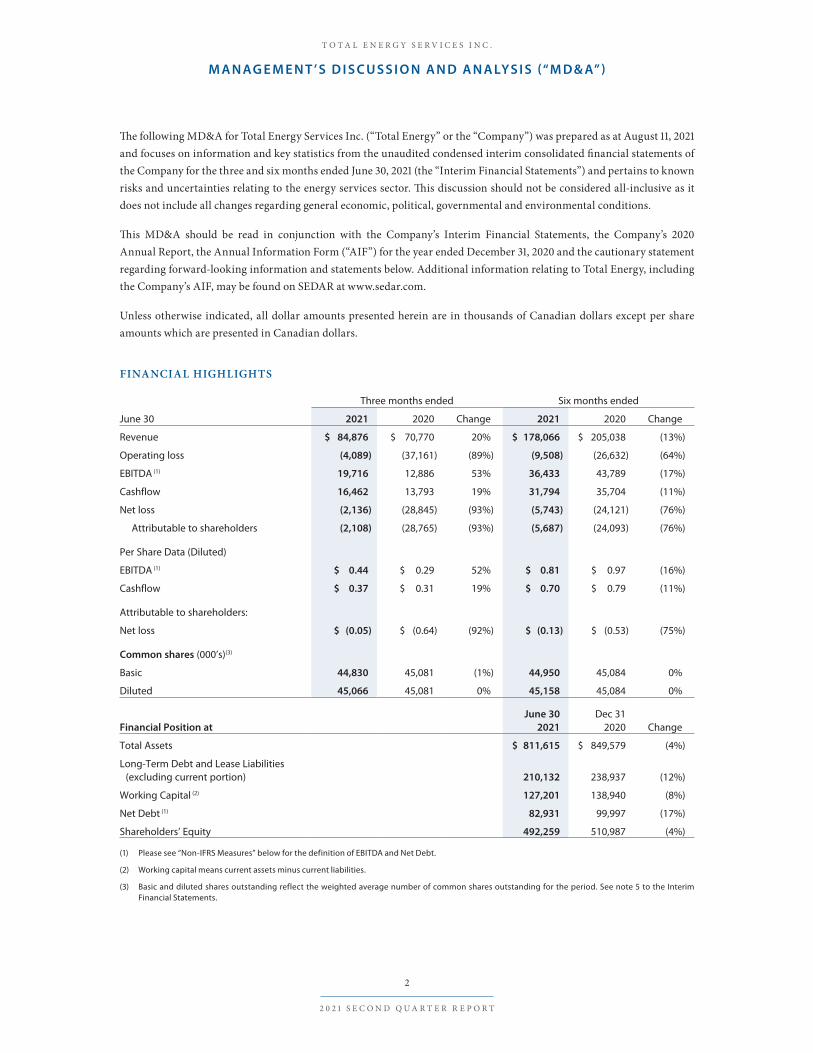
FINANCIAL HIGHLIGHTS
Three months ended Six months ended
June 30 2021 2020 Change 2021 2020 Change
Revenue $ 84,876 $ 70,770 20% $ 178,066 $ 205,038 (13%)
Operating loss (4,089) (37,161) (89%) (9,508) (26,632) (64%)
EBITDA (1) 19,716 12,886 53% 36,433 43,789 (17%)
Cashflow 16,462 13,793 19% 31,794 35,704 (11%)
Net loss (2,136) (28,845) (93%) (5,743) (24,121) (76%)
Attributable to shareholders (2,108) (28,765) (93%) (5,687) (24,093) (76%)
Per Share Data (Diluted)
EBITDA (1) $ 0.44 $ 0.29 52% $ 0.81 $ 0.97 (16%)
Cashflow $ 0.37 $ 0.31 19% $ 0.70 $ 0.79 (11%)
Attributable to shareholders:
Net loss $ (0.05) $ (0.64) (92%) $ (0.13) $ (0.53) (75%)
Common shares (000’s)(3)
Basic 44,830 45,081 (1%) 44,950 45,084 0%
Diluted 45,066 45,081 0% 45,158 45,084 0%
Financial Position atJune 30
2021Dec 31
2020 Change
Total Assets $ 811,615 $ 849,579 (4%)
Long-Term Debt and Lease Liabilities (excluding current portion) 210,132 238,937 (12%)
Working Capital (2) 127,201 138,940 (8%)
Net Debt (1) 82,931 99,997 (17%)
Shareholders’ Equity 492,259 510,987 (4%)
(1) Please see “Non-IFRS Measures” below for the definition of EBITDA and Net Debt.
(2) Working capital means current assets minus current liabilities.
(3) Basic and diluted shares outstanding reflect the weighted average number of common shares outstanding for the period. See note 5 to the Interim Financial Statements.
2
2 0 2 1 S E C O N D Q U A R T E R R E P O R T

T O T A L E N E R G Y S E R V I C E S I N C .
M A N A G E M E N T ’ S D I S C U S S I O N A N D A N A LY S I S
T O T A L E N E R G Y S E R V I C E S I N C .
M A N AG E M E N T ’ S D I S C U S S I O N A N D A N A LYS I S (“ M D & A” )
BUSINESS OF THE COMPANY
Total Energy is a public energy services company based in Calgary, Alberta that provides a variety of products and services to the energy and other resource industries through its subsidiaries and aboriginal partnerships. Total Energy is involved in four businesses: contract drilling services (“CDS”), the rental and transportation of equipment used in energy and other industrial operations (“RTS”), the fabrication, sale, rental and servicing of new and used gas compression and process equipment (“CPS”) and well servicing, including completion, workover, maintenance and abandonment services (“WS”). The Company’s operations are conducted within Canada, the United States of America (“United States” or “U.S.”) and Australia. Corporate and public issuer affairs are conducted in the Company’s Corporate segment.
Contract Drilling Services: At June 30, 2021, the Company operated a total fleet of 95 drilling rigs. During the second quarter of 2021, the Company decommissioned three mechanical double rigs in Canada. The rig fleet is supported by an extensive fleet of owned top drives, walking systems, pumps and other ancillary equipment. Composition of the Company’s drilling rig fleet is as follows:
By Type By Geography
AC triples 3 Canada 77
AC doubles 13 United States 13
Mechanical doubles 35 Australia 5
Australian shallow 5 95
TDS and singles 39
95
Rentals and Transportation Services: Total Energy’s RTS business is presently conducted from 12 locations in western Canada and three locations in the United States. At June 30, 2021, this segment had approximately 10,630 pieces of major rental equipment (excluding access matting), a fleet of 80 heavy trucks and a significant inventory of small rental equipment and access matting.
Compression and Process Services: The Company fabricates a full range of natural gas compression equipment as well as oil, natural gas and other process equipment. At June 30, 2021 the CPS segment occupied approximately 246,000 square feet of production facilities located in Calgary, Alberta and a 100,000 square foot production facility in Weirton, West Virginia. As at June 30, 2021 the CPS segment also had a network of 13 branch locations throughout western Canada and the United States from which its natural gas compression parts and service business is conducted. This segment had 55,000 horsepower of compression in its rental fleet at June 30, 2021.
Well Servicing: At June 30, 2021, the Company operated a total fleet of 83 well servicing rigs across western Canada, northwest United States and Australia. Composition of the Company’s service rig fleet is as follows:
By Type By Geography
Singles 38 Canada 57
Doubles 32 United States 14
Australian specification 9 Australia 12
Flush-by 4 83
83
3
F O C U S • D I S C I P L I N E • G R O W T H

T O T A L E N E R G Y S E R V I C E S I N C .
M A N A G E M E N T ’ S D I S C U S S I O N A N D A N A LY S I S
OVERALL PERFORMANCE
Total Energy’s results for the second quarter and first half of 2021 reflect continued difficult industry conditions that began in March of 2020 as a result of the COVID-19 pandemic and resultant decreases in economic activity and demand for oil and natural gas. As social mobility restrictions began to ease globally over the past several months, global oil and natural gas demand has continued to recover, resulting in improved oil and natural gas prices. Higher commodity prices contrib-uted to improved year over year North American industry activity levels which in turn contributed to the first year over year improvement in Total Energy’s quarterly financial results since the collapse in oil prices in April of 2020. Activity levels in Australia were lower for the first half of 2021 compared to 2020. Wet field conditions combined with reduced capital expenditure programs that began in the third quarter of 2020 in response to the decline in global crude oil and natural gas prices contributed to the decline in Australia. Additionally, two Australian drilling rigs were removed from service in the third quarter of 2020 for recertification and upgrades. The first rig was completed and commenced operations in late April of 2021 and the second rig commenced operations in late July of 2021.
Included in the financial results for the three and six months ended June 30, 2021 was $1.1 million and $2.2 million, respectively, of unrealized foreign exchange gains from the translation of intercompany working capital balances of foreign subsidiaries. For the three and six months ended June 30, 2020 results included $0.5 million of unrealized foreign exchange losses and $7.4 million of unrealized foreign exchange gains, respectively. Negatively impacting financial results for the second quarter and first half of 2020 was $26.3 million of non-recurring depreciation expense as a result of the change in CDS depreciation estimates effective April 1, 2020.
The Company’s financial condition remains strong, with a positive working capital balance of $127.2 million as at June 30, 2021. Working capital decreased by $11.7 million since December 31, 2020 primarily as a result of the voluntary repayment of $28.0 million of bank debt during the first half of 2021. Shareholders’ equity decreased by $18.7 million from December 31, 2020 mostly due to the realization of a $5.7 million net loss in the first half of 2021 and a $11.1 million other comprehen-sive loss arising from currency translation of foreign subsidiaries’ financial statements as a result of the appreciation of the Canadian dollar relative to the U.S. and Australian dollars during the first half of 2021.
Revenue
Three months ended Six months ended
June 30 2021 2020 Change 2021 2020 Change
Revenue $ 84,876 $ 70,770 20% $ 178,066 $ 205,038 (13%)
The global energy sector continued to recover from the dual shocks of the COVID-19 pandemic and the collapse in oil prices, as product demand and commodity prices strengthened during the second quarter of 2021. As a result, revenues in the second quarter of 2021 improved relative to the same period in 2020, driven by higher activity levels in North America that offset lower Australian activity. For the first half of 2021, total revenues were lower than the same period in 2020. This decrease is primarily attributable to a combination of lower first quarter of 2021 North American activity and lower Australian activity in the first half of 2021 compared to 2020.
Cost of Services and Gross Margin
Three months ended Six months ended
June 30 2021 2020 Change 2021 2020 Change
Cost of services $ 63,092 $ 52,483 20% $ 134,180 $ 153,166 (12%)
Gross margin $ 21,784 $ 18,287 19% $ 43,886 $ 51,872 (15%)
Gross margin, as a percentage of revenue 26% 26% – 25% 25% –
The increase in costs of services during the second quarter of 2021 relative to the same period in 2020 is primarily due to increased activity in North America, partially offset by lower Australian activity. For the first half of 2021, cost of services
4
2 0 2 1 S E C O N D Q U A R T E R R E P O R T

T O T A L E N E R G Y S E R V I C E S I N C .
M A N A G E M E N T ’ S D I S C U S S I O N A N D A N A LY S I S
decreased compared to the same period in 2020 in all segments as a result of lower activity in all geographic regions. Reducing operating costs for the three and six months ended June 30, 2021 was the recognition of $7.3 million and $12.5 million, respectively, of funds from various COVID-19 relief programs. Included in COVID-19 relief benefits recorded in the second quarter of 2021 was the forgiveness of $2.5 million of loans received in 2020 under the U.S. Paycheck Protection Program (“PPP”). This compares to $3.6 million of COVID-19 relief funds recognized in the second quarter of 2020. Gross margin percentage for both the three and six months ended June 30, 2021 were consistent with the same periods in 2020. Gross margin percentage remained consistent due to the combination of segment revenue mix, realized cost efficiencies in all segments as a result of measures taken by the Company in response to the COVID-19 pandemic and the receipt of assistance from various COVID-19 relief programs.
Cost of services includes salaries and benefits for operations personnel, equipment repairs and maintenance, fuel, inventory used to manufacture compression and process equipment, utilities, property taxes and other occupancy costs related to manufacturing facilities and operations branches.
Selling, General and Administration Expenses
Three months ended Six months ended
June 30 2021 2020 Change 2021 2020 Change
Selling, general and administration expenses $ 6,069 $ 5,756 5% $ 12,608 $ 16,341 (23%)
Selling, general and administration expenses increased in the second quarter of 2021 relative to the same period in 2020 pri-marily due to the restoration of employee remuneration to pre-COVID levels. For the first half of 2021, selling, general and administrative expenses decreased compared to the same period in 2020 as a result of cost savings activities implemented following the start of the pandemic. Reducing costs for the three and six months ended June 30, 2021 was $0.8 million and $1.5 million, respectively, of various COVID-19 relief programs recognized in the period as compared to $0.9 million recognized in the second quarter of 2020.
Included in selling, general and administration expenses are salaries and benefits for sales, office and administrative staff, utilities, property taxes and other occupancy costs related to the Company’s various divisional offices and its corporate head office as well as professional fees and other costs incurred to maintain the Company’s public listing and conduct investor relations activities. Also included is compensation for directors and officers pursuant to the Company’s cash based compensation plans.
Other (Income) Expense
Three months ended Six months ended
June 30 2021 2020 Change 2021 2020 Change
Other (income) expense $ (1,114) $ 536 nm $ (2,180) $ (7,392) (71%)
“nm” - calculation not meaningful
Other (income) expense arises from unrealized foreign exchange differences on translation of intercompany working capital balances of foreign subsidiaries. The strengthening of the Canadian dollar relative to the Australian and U.S. dol-lars combined with the geographical composition of intercompany balances during the period gave rise to net unrealized foreign exchange gains for the three and six months ended June 30, 2021. In the first half of 2020, an unrealized foreign exchange gain of $7.4 million was primarily due to the strengthening of the Canadian dollar relative to the Australian dollar, partially offset by a strengthening U.S. dollar relative to the Canadian dollar and the corresponding impact on intercompany working capital balances.
5
F O C U S • D I S C I P L I N E • G R O W T H

T O T A L E N E R G Y S E R V I C E S I N C .
M A N A G E M E N T ’ S D I S C U S S I O N A N D A N A LY S I S
Share-based Compensation Expense
Three months ended Six months ended
June 30 2021 2020 Change 2021 2020 Change
Share-based compensation expense $ 189 $ 264 (28%) $ 390 $ 669 (42%)
Share-based compensation expense arises from share options granted pursuant to the share option plan implemented in 2015. Share-based compensation expense for the three and six months ended June 30, 2021 relative to the same periods in 2020 is lower due to certain options fully vesting.
Depreciation Expense
Three months ended Six months ended
June 30 2021 2020 Change 2021 2020 Change
Depreciation expense $ 20,729 $ 48,892 (58%) $ 42,576 $ 68,886 (38%)
The decrease in depreciation expense for the three and six months ended June 30, 2021 compared to the same periods in 2020 is mostly due to a change in depreciation estimates in the CDS segment effective April 1, 2020. While the first half of 2021 includes $2.9 million of incremental recurring depreciation expense, the second quarter of 2020 includes $26.3 million of non-recurring depreciation expense that arose from the change in depreciation estimates. See “Critical Accounting Estimates” below for further details.
Operating Loss
Three months ended Six months ended
June 30 2021 2020 Change 2021 2020 Change
Operating loss $ (4,089) $ (37,161) (89%) $ (9,508) $ (26,632) (64%)
The operating loss for both the three and six months ended June 30, 2021 decreased substantially relative to the same periods in 2020. Included in operating losses for the second quarter of 2021 was $1.1 million of unrealized gain on foreign exchange translation of intercompany working capital compared to an unrealized loss of $0.5 million in the comparable prior year period. In the second quarter of 2020, the operating loss included $26.3 million of non-recurring depreciation expense as a result of a change in depreciation estimates in the CDS segment. Offsetting expenses in the second quarter of 2021 was $8.1 million of various COVID-19 relief funds, including the forgiveness of $2.5 million of PPP loans received in 2020. This compares to $4.5 million of funds recognized in the second quarter of 2020. The operating loss for the first half of 2021 included $2.2 million of unrealized gains on foreign exchange translation of intercompany working capital compared to an unrealized gain of $7.4 million in the comparable prior year period. Also impacting the operating loss for the comparable prior year period was $26.3 million of non-recurring depreciation expense as a result of a change in depreciation estimates in the CDS segment. Offsetting expenses in the first half of 2021 was $14.0 million of various COVID-19 relief funds as compared to $4.5 million of funds recognized in the first half of 2020.
Gain on Sale of Property, Plant and Equipment
Three months ended Six months ended
June 30 2021 2020 Change 2021 2020 Change
Gain on sale of property, plant and equipment $ 3,076 $ 1,155 166% $ 3,365 $ 1,535 119%
Proceeds on the sale of property, plant and equipment $ 8,005 $ 1,638 389% $ 8,445 $ 3,343 153%
Disposals of property, plant and equipment result from the rationalization, replacement and upgrade of older equipment in the Company’s equipment fleet.
6
2 0 2 1 S E C O N D Q U A R T E R R E P O R T

T O T A L E N E R G Y S E R V I C E S I N C .
M A N A G E M E N T ’ S D I S C U S S I O N A N D A N A LY S I S
Equipment disposed of during the three and six months ended June 30, 2021 included underutilized rental equipment, access matting, light duty vehicles, underutilized heavy trucks, compression rental units, decommissioned drilling rigs and ancillary drilling and well servicing equipment. Equipment disposed of during the three and six months ended June 30, 2020 consisted of underutilized rental equipment, light duty vehicles and ancillary drilling equipment.
Finance Costs
Three months ended Six months ended
June 30 2021 2020 Change 2021 2020 Change
Finance costs $ 1,772 $ 2,518 (30%) $ 3,579 $ 5,957 (40%)
Finance costs for the three and six months ended June 30, 2021 were lower than the prior year comparable periods due to lower effective interest rates combined with a lower year over year average outstanding balance on the Company’s credit facility.
Income Taxes and Net Loss
Three months ended Six months ended
June 30 2021 2020 Change 2021 2020 Change
Current income tax expense (recovery) $ 16 $ 957 (98%) $ (455) $ 2,293 nm
Deferred income tax recovery (665) (10,636) (94%) (3,524) (9,226) (62%)
Total income tax recovery $ (649) $ (9,679) (93%) $ (3,979) $ (6,933) (43%)
Net loss $ (2,136) $ (28,845) (93%) $ (5,743) $ (24,121) (76%)
“nm” - calculation not meaningful
The change from a current income tax expense to a recovery for the first half of 2021 compared to 2020 is primarily due to Australian operations which incurred operating losses in the first half of 2021 as compared to operating income for the same period in 2020.
The year over year change in deferred income tax recoveries was primarily a result of changes to temporary differences on the Company’s property and equipment following a change in depreciation estimates in the CDS segment in 2020. The deferred income tax recovery realized in 2021 also includes the effect of the two percentage point decrease to the Alberta provincial corporate income tax rate substantially enacted effective July 1, 2020.
SEASONALITY
A significant portion of the Company’s field operations are conducted in Canada where the ability to move heavy equipment is dependent on ground conditions. As warm weather returns in the spring, the winter’s frost comes out of the ground rendering many secondary roads incapable of supporting the weight of heavy equipment until such roads have thoroughly dried out. The duration of this “spring breakup” has a direct impact on the Company’s activity levels and operating results in Canada. In addition, many exploration and production areas in northern Canada are accessible only in winter months when the ground is frozen hard enough to support heavy equipment. The timing of freeze up and spring breakup affects the ability to move equipment in and out of these areas. As a result, late March through May is traditionally the Company’s slowest period in Canada. Additionally, wet weather in Australia, normally in the first quarter, can restrict the Company’s Australian operations. Consequently, quarterly operating results may not be indicative of full year operating results.
7
F O C U S • D I S C I P L I N E • G R O W T H

T O T A L E N E R G Y S E R V I C E S I N C .
M A N A G E M E N T ’ S D I S C U S S I O N A N D A N A LY S I S
SUMMARY OF QUARTERLY RESULTS
Financial Quarter Ended
June 30 2021
March 312021
December 312020
September 30 2020
Revenue $ 84,876 $ 93,190 $ 83,472 $ 77,240
Operating loss (4,089) (5,419) (4,013) (5,894)
EBITDA (1) 19,716 16,717 19,546 17,869
Cashflow 16,462 15,332 18,431 19,810
Cash provided by operating activities 31,622 16,866 19,226 14,391
Net loss (2,136) (3,607) (1,732) (4,602)
Attributable to shareholders (2,108) (3,579) (1,739) (4,618)
Per share data (diluted)
EBITDA (1) $ 0.44 $ 0.37 $ 0.43 $ 0.40
Cashflow 0.37 0.34 0.41 0.44
Net loss attributable to shareholders (0.05) (0.08) (0.04) (0.10)
Financial Position
Total Assets $ 811,615 $ 831,963 $ 849,579 $ 873,891
Long-Term Debt and Lease Liabilities (excluding current portion) 210,132 229,627 238,937 250,643
Working Capital (2) 127,201 135,347 138,940 138,973
Net Debt (1) 82,931 94,280 99,997 111,670
Shareholders’ Equity 492,259 501,950 510,987 517,067
Common Shares (000’s)(3)
Basic 44,830 45,072 45,081 45,081
Diluted 45,066 45,231 45,081 45,081
(1) Please see “Non-IFRS Measures” below for the definition of EBITDA and Net Debt.
(2) Working capital means current assets minus current liabilities.
(3) Basic and diluted shares outstanding reflect the weighted average number of common shares outstanding for the period. See note 5 to the Interim Financial Statements.
8
2 0 2 1 S E C O N D Q U A R T E R R E P O R T

T O T A L E N E R G Y S E R V I C E S I N C .
M A N A G E M E N T ’ S D I S C U S S I O N A N D A N A LY S I S
Financial Quarter Ended
June 30 2020
March 31 2020
December 312019
September 302019
Revenue $ 70,770 $ 134,268 $ 151,500 $ 171,213
Operating income (loss) (37,161) 10,529 14,468 (5,012)
EBITDA (1) 12,886 30,903 35,805 24,913
Cashflow 13,793 21,911 36,896 23,959
Cash provided (used) by operating activities 36,162 16,343 40,545 (21,800)
Net income (loss) (28,845) 4,724 8,593 (6,114)
Attributable to shareholders (28,765) 4,672 8,523 (6,159)
Per share data (diluted)
EBITDA (1) $ 0.29 $ 0.69 $ 0.79 $ 0.55
Cashflow 0.31 0.49 0.82 0.53
Net income (loss) attributable to shareholders (0.64) 0.10 0.19 (0.14)
Financial Position
Total Assets $ 898,940 $ 999,229 $ 997,161 $ 991,176
Long-Term Debt and Lease Liabilities (excluding current portion) 255,538 252,035 248,448 251,724
Working Capital (2) 130,968 124,010 103,234 85,778
Net Debt (1) 124,570 128,025 145,214 165,946
Shareholders’ Equity 523,979 552,995 543,142 538,790
Common Shares (000’s) (3)
Basic and diluted 45,081 45,087 45,262 45,457
(1) Please see “Non-IFRS Measures” below for the definition of EBITDA and Net Debt.
(2) Working capital means current assets minus current liabilities.
(3) Basic and diluted shares outstanding reflect the weighted average number of common shares outstanding for the period. See note 5 to the Interim Financial Statements.
Aboriginal Partnerships
The Company conducts certain of its operations through limited partnerships in which each of the Company and an Aboriginal partner hold one half of the partnership interest. The Company fully consolidates all of these partnerships, with the Aboriginal partners’ share in the equity and net earnings of the partnerships reported as non-controlling interests.
9
F O C U S • D I S C I P L I N E • G R O W T H

T O T A L E N E R G Y S E R V I C E S I N C .
M A N A G E M E N T ’ S D I S C U S S I O N A N D A N A LY S I S
SEGMENTED RESULTS
Contract Drilling Services
Three months ended Six months ended
June 30 2021 2020 Change 2021 2020 Change
Revenue $ 25,740 $ 14,170 82% $ 54,311 $ 57,195 (5%)
Canada 8,797 1,038 747% 26,641 25,737 4%
United States 9,032 1,047 763% 14,627 7,816 87%
Australia 7,911 12,085 (35%) 13,043 23,642 (45%)
Operating (loss) income $ (5,025) $ (35,490) (86%) $ (8,630) $ (35,199) (75%)
Canada (4,149) (27,804) (85%) (5,519) (27,800) (80%)
United States (1,488) (9,624) (85%) (4,027) (11,854) (66%)
Australia 612 1,938 (68%) 916 4,455 (79%)
Operating days (1) 1,235 440 181% 2,773 2,606 6%
Canada 563 72 682% 1,647 1,529 8%
United States 467 41 1,039% 768 368 109%
Australia 205 327 (37%) 358 709 (50%)
Revenue per operating day (1), dollars $ 20,842 $ 32,205 (35%) $ 19,586 $ 21,947 (11%)
Canada 15,625 14,417 8% 16,175 16,833 (4%)
United States 19,340 25,537 (24%) 19,046 21,239 (10%)
Australia 38,590 36,957 4% 36,433 33,346 9%
Utilization 14% 5% 180% 16% 14% 14%
Canada 8% 1% 700% 11% 10% 10%
United States 39% 3% 1,200% 33% 11% 200%
Australia 45% 72% (38%) 40% 78% (49%)
Rigs, average for period 97 98 (1%) 98 106 (8%)
Canada 79 80 (1%) 80 82 (2%)
United States 13 13 – 13 19 (32%)
Australia 5 5 – 5 5 –
(1) Operating days include drilling and paid stand-by days.
North American drilling activity recovered significantly during the second quarter of 2021 compared to 2020 as commod-ity prices continued to recover. In the U.S., market share gains contributed to a disproportionate increase in operating days relative to the overall increase in industry drilling activity. Effective day rates in Canada were higher in Q2 2021 compared to Q2 2020 mostly due to the mix of rigs operating as well as modest rate increases and were relatively consistent for the first half of 2021 compared to the prior year period. Partially offsetting this increase was a wage increase implemented during the second quarter of 2021 commensurate with an increase to the recommended wage schedule issued by the Canadian Association of Energy Contractors. Lower day rates in the United States were due to lower spot market pricing and the mix of rigs working for both the three and six months ended June 30, 2021 as compared to the prior year comparable periods. Negatively impacting U.S. results for the second quarter of 2021 was $0.5 million of non-recurring reactivation expenses to return rigs to the field. For the first half of 2021, U.S. results included $0.9 million of non-recurring reactivation expenses. Operating losses for the three and six months ended June 30, 2021 improved relative to the same periods in 2020 due to increased North American activity, the realization of cost control efforts and the recognition of various COVID-19 relief funds. Also included in the second quarter and first half of 2020 was $25.7 million of non-recurring depreciation expense on fully depreciated assets as a result of a change in CDS depreciation estimates in North America.
10
2 0 2 1 S E C O N D Q U A R T E R R E P O R T
T O T A L E N E R G Y S E R V I C E S I N C .
M A N A G E M E N T ’ S D I S C U S S I O N A N D A N A LY S I S
In Australia, revenues for the second quarter and first half of 2021 declined compared to the same periods in 2020 due to lower industry levels and the removal of two drilling rigs from service in the third quarter of 2020. One rig returned to ser-vice in late April of 2021 and the second in late July of 2021. Effective day rates in Australia for the second quarter and first half of 2021 were higher than the same periods in 2020, mostly due to the mix of equipment operating and a higher day rate for the upgraded rig that commenced operations in late April of 2021. Operating income for the three and six months ended June 30, 2021 decreased relative to the same periods in 2020 due to a combination of reduced activity on fewer working rigs and $0.1 million of non-recurring mobilization costs incurred to bring one rig back to work in April of 2021. Included in the three and six months ended June 30, 2020 was $0.6 million of non-recurring depreciation expense on fully depreciated Australian assets recognized in the period as a result of a change in CDS depreciation estimates.
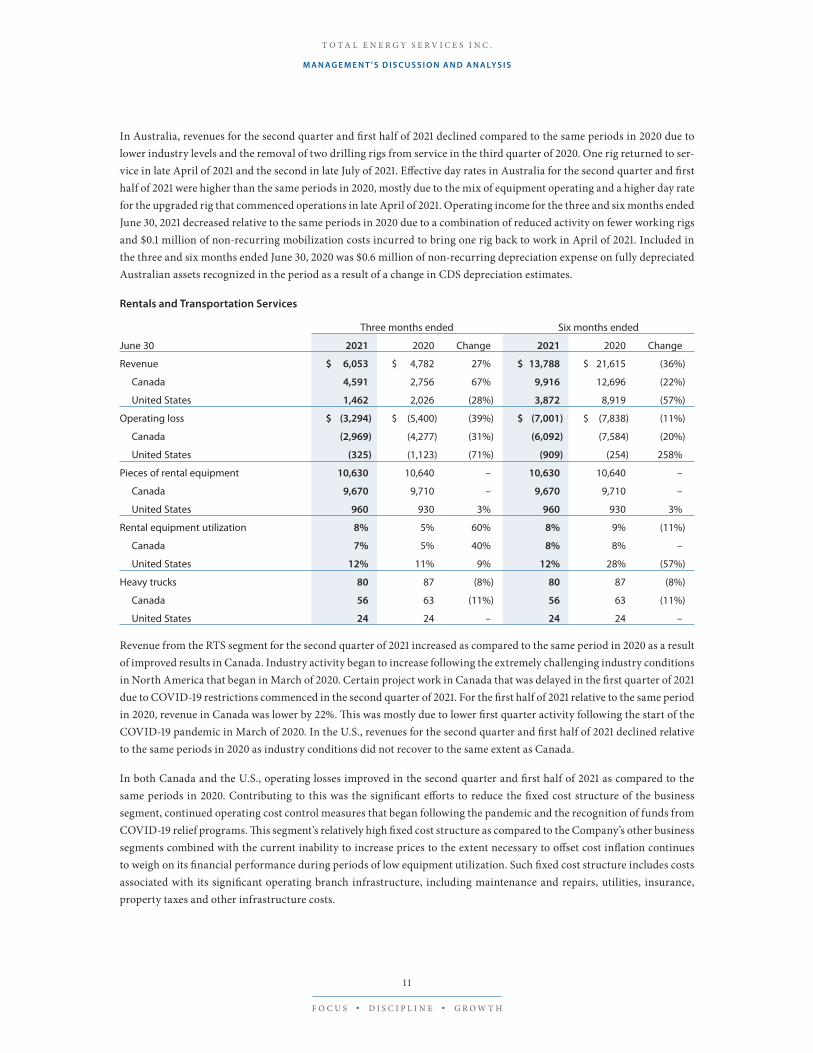
Rentals and Transportation Services
Three months ended Six months ended
June 30 2021 2020 Change 2021 2020 Change
Revenue $ 6,053 $ 4,782 27% $ 13,788 $ 21,615 (36%)
Canada 4,591 2,756 67% 9,916 12,696 (22%)
United States 1,462 2,026 (28%) 3,872 8,919 (57%)
Operating loss $ (3,294) $ (5,400) (39%) $ (7,001) $ (7,838) (11%)
Canada (2,969) (4,277) (31%) (6,092) (7,584) (20%)
United States (325) (1,123) (71%) (909) (254) 258%
Pieces of rental equipment 10,630 10,640 – 10,630 10,640 –
Canada 9,670 9,710 – 9,670 9,710 –
United States 960 930 3% 960 930 3%
Rental equipment utilization 8% 5% 60% 8% 9% (11%)
Canada 7% 5% 40% 8% 8% –
United States 12% 11% 9% 12% 28% (57%)
Heavy trucks 80 87 (8%) 80 87 (8%)
Canada 56 63 (11%) 56 63 (11%)
United States 24 24 – 24 24 –
Revenue from the RTS segment for the second quarter of 2021 increased as compared to the same period in 2020 as a result of improved results in Canada. Industry activity began to increase following the extremely challenging industry conditions in North America that began in March of 2020. Certain project work in Canada that was delayed in the first quarter of 2021 due to COVID-19 restrictions commenced in the second quarter of 2021. For the first half of 2021 relative to the same period in 2020, revenue in Canada was lower by 22%. This was mostly due to lower first quarter activity following the start of the COVID-19 pandemic in March of 2020. In the U.S., revenues for the second quarter and first half of 2021 declined relative to the same periods in 2020 as industry conditions did not recover to the same extent as Canada.
In both Canada and the U.S., operating losses improved in the second quarter and first half of 2021 as compared to the same periods in 2020. Contributing to this was the significant efforts to reduce the fixed cost structure of the business segment, continued operating cost control measures that began following the pandemic and the recognition of funds from COVID-19 relief programs. This segment’s relatively high fixed cost structure as compared to the Company’s other business segments combined with the current inability to increase prices to the extent necessary to offset cost inflation continues to weigh on its financial performance during periods of low equipment utilization. Such fixed cost structure includes costs associated with its significant operating branch infrastructure, including maintenance and repairs, utilities, insurance, property taxes and other infrastructure costs.
1 1
F O C U S • D I S C I P L I N E • G R O W T H

T O T A L E N E R G Y S E R V I C E S I N C .
M A N A G E M E N T ’ S D I S C U S S I O N A N D A N A LY S I S
Compression and Process Services
Three months ended Six months ended
June 30 2021 2020 Change 2021 2020 Change
Revenue $ 33,657 $ 30,212 11% $ 67,813 $ 70,956 (4%)
Canada 25,941 20,798 25% 52,058 53,589 (3%)
United States 7,716 9,414 (18%) 15,755 17,367 (9%)
Operating income $ 4,280 $ 3,511 22% $ 5,361 $ 6,335 (15%)
Canada 2,298 3,128 (27%) 2,708 5,994 (55%)
United States 1,982 383 417% 2,653 341 678%
Operating income, % of revenue 13% 12% 8% 8% 9% (11%)
Canada 9% 15% (40%) 5% 11% (55%)
United States 26% 4% 550% 17% 2% 750%
Horsepower of equipment on rent at period end 27,420 33,200 (17%) 27,420 33,200 (17%)
Canada 11,840 18,440 (36%) 11,840 18,440 (36%)
United States 15,580 14,760 6% 15,580 14,760 6%
Rental equipment utilization during the period (HP) 47% 65% (28%) 45% 67% (33%)
Canada 31% 52% (40%) 31% 53% (42%)
United States 74% 97% (24%) 67% 99% (32%)
Sales backlog at period end, $ million $ 57.5 $ 43.8 31% $ 57.5 $ 43.8 31%
Overall revenue and operating income reported from the CPS segment increased for the three months ended June 30, 2021 as compared to the same period in 2020. This was mostly due to an increase in Canadian fabrication sales. Fabrication sales bookings began a steady and significant decline starting in 2019. This decline was reversed during the fourth quarter of 2020 and the sales backlog increased by another $9.8 million, or 21% during the second quarter of 2021. The timeline for conversion of the sales backlog into revenue varies from order to order and often changes due to factors outside of the Company’s control. Also positively impacting operating income for the second quarter of 2021 was the recognition of various COVID-19 relief funds.
For the six months ended June 30, 2021 both overall revenue and operating income declined compared to the same period last year. This is mostly due to relatively lower utilization of the compression rental fleet in both Canada and the United States. Utilization of the rental fleet continued to recover during the second quarter of 2021 following the return of 6,500 horsepower of compression rental units in late 2020 with the bankruptcy of a U.S. customer. In the U.S., operating income increased in the first half of 2021 relative to the comparable prior year period mostly due to the recognition of COVID-19 relief funds upon the forgiveness of a PPP loan received in 2020. Operating income in Canada declined by 55% as a result of lower fabrication sales and utilization of the compression rental fleet in the first half of 2021 compared to the prior year comparable period. This was partially offset by the receipt of COVID-19 funds in the first half of 2021.
1 2
2 0 2 1 S E C O N D Q U A R T E R R E P O R T
T O T A L E N E R G Y S E R V I C E S I N C .
M A N A G E M E N T ’ S D I S C U S S I O N A N D A N A LY S I S
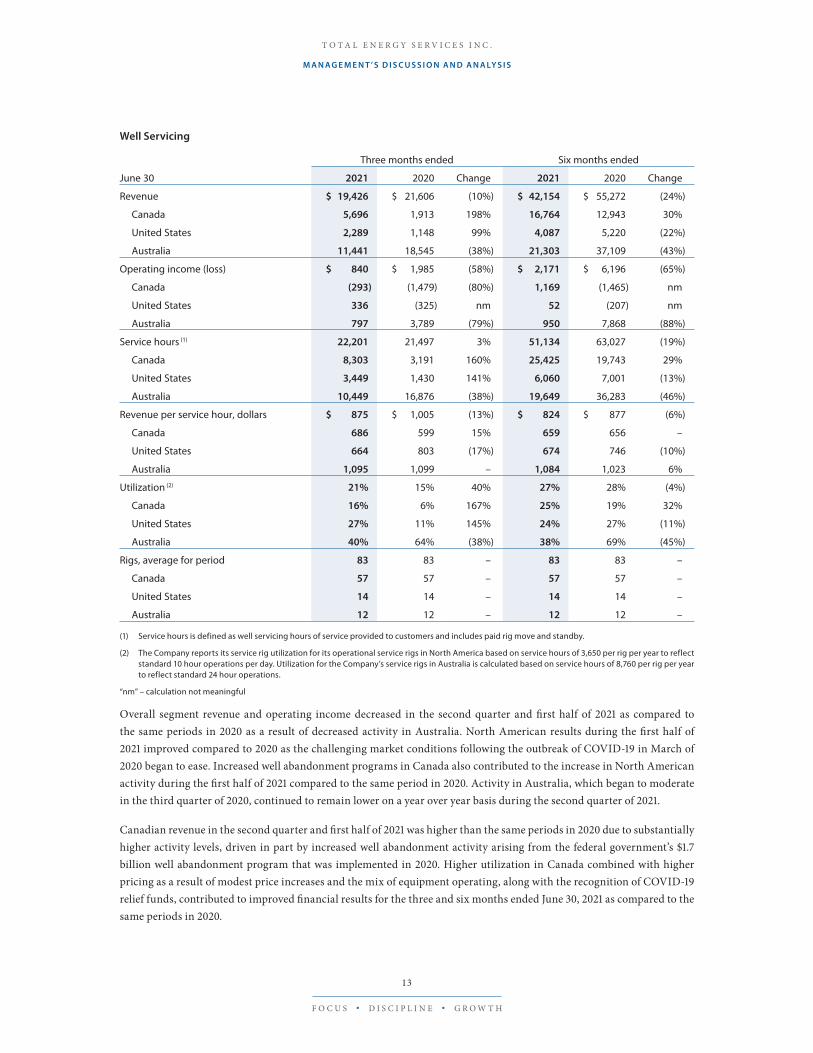
Well Servicing
Three months ended Six months ended
June 30 2021 2020 Change 2021 2020 Change
Revenue $ 19,426 $ 21,606 (10%) $ 42,154 $ 55,272 (24%)
Canada 5,696 1,913 198% 16,764 12,943 30%
United States 2,289 1,148 99% 4,087 5,220 (22%)
Australia 11,441 18,545 (38%) 21,303 37,109 (43%)
Operating income (loss) $ 840 $ 1,985 (58%) $ 2,171 $ 6,196 (65%)
Canada (293) (1,479) (80%) 1,169 (1,465) nm
United States 336 (325) nm 52 (207) nm
Australia 797 3,789 (79%) 950 7,868 (88%)
Service hours (1) 22,201 21,497 3% 51,134 63,027 (19%)
Canada 8,303 3,191 160% 25,425 19,743 29%
United States 3,449 1,430 141% 6,060 7,001 (13%)
Australia 10,449 16,876 (38%) 19,649 36,283 (46%)
Revenue per service hour, dollars $ 875 $ 1,005 (13%) $ 824 $ 877 (6%)
Canada 686 599 15% 659 656 –
United States 664 803 (17%) 674 746 (10%)
Australia 1,095 1,099 – 1,084 1,023 6%
Utilization (2) 21% 15% 40% 27% 28% (4%)
Canada 16% 6% 167% 25% 19% 32%
United States 27% 11% 145% 24% 27% (11%)
Australia 40% 64% (38%) 38% 69% (45%)
Rigs, average for period 83 83 – 83 83 –
Canada 57 57 – 57 57 –
United States 14 14 – 14 14 –
Australia 12 12 – 12 12 –
(1) Service hours is defined as well servicing hours of service provided to customers and includes paid rig move and standby.
(2) The Company reports its service rig utilization for its operational service rigs in North America based on service hours of 3,650 per rig per year to reflect standard 10 hour operations per day. Utilization for the Company’s service rigs in Australia is calculated based on service hours of 8,760 per rig per year to reflect standard 24 hour operations.
“nm” – calculation not meaningful
Overall segment revenue and operating income decreased in the second quarter and first half of 2021 as compared to the same periods in 2020 as a result of decreased activity in Australia. North American results during the first half of 2021 improved compared to 2020 as the challenging market conditions following the outbreak of COVID-19 in March of 2020 began to ease. Increased well abandonment programs in Canada also contributed to the increase in North American activity during the first half of 2021 compared to the same period in 2020. Activity in Australia, which began to moderate in the third quarter of 2020, continued to remain lower on a year over year basis during the second quarter of 2021.
Canadian revenue in the second quarter and first half of 2021 was higher than the same periods in 2020 due to substantially higher activity levels, driven in part by increased well abandonment activity arising from the federal government’s $1.7 billion well abandonment program that was implemented in 2020. Higher utilization in Canada combined with higher pricing as a result of modest price increases and the mix of equipment operating, along with the recognition of COVID-19 relief funds, contributed to improved financial results for the three and six months ended June 30, 2021 as compared to the same periods in 2020.
1 3
F O C U S • D I S C I P L I N E • G R O W T H

T O T A L E N E R G Y S E R V I C E S I N C .
M A N A G E M E N T ’ S D I S C U S S I O N A N D A N A LY S I S
In the United States, second quarter revenue increased in 2021 as compared to 2020 as service hours more than doubled. For the six months ended June 30, 2021 revenue was lower due to lower pricing and reduced activity in the first quarter of the year as compared to the same period in 2020. Operating income was realized in the second quarter and first half of 2021 as compared to operating losses in the same periods in 2020 due to increased activity in the second quarter of 2021 combined with the forgiveness of a PPP loan received in 2020.
In Australia lower revenue and operating income for the second quarter and first half of 2021 as compared to the same periods in 2020 was due primarily to lower industry activity levels that began in the third quarter of 2020 as customers reduced their capital spending. Extended wet weather conditions that restricted field operations for much of the first quarter of 2021 continued for periods of time during the second quarter and also contributed to the decline in activity in the first half of 2021 as compared to the same period in 2020.
Corporate
Three months ended Six months ended
June 30 2021 2020 Change 2021 2020 Change
Operating (loss) income $ (890) $ (1,767) (50%) $ (1,409) $ 3,874 nm
“nm” - calculation not meaningful
Total Energy’s Corporate segment includes activities related to the Company’s corporate and public issuer affairs. This segment does not generate any revenue but provides sales, operating, financial, treasury, analytical and other management and support services to Total Energy’s business segments and manages the corporate affairs of the Company, including matters related to its public listing. Included in the Corporate segment for the three and six months ended June 30, 2021 is $1.1 million and $2.2 million, respectively, of unrealized gains on the translation of working capital balances of foreign subsidiaries. This compares to a $0.5 million unrealized loss and $7.4 million unrealized gain for the three and six months ended June 30, 2020.
LIQUIDITY AND CAPITAL RESOURCES
Cash Provided by Operating Activities and Cashflow
Three months ended Six months ended
June 30 2021 2020 Change 2021 2020 Change
Cash provided by operating activities $ 31,622 $ 36,162 (13%) $ 48,488 $ 52,505 (8%)
Per Share Data (Diluted), dollars $ 0.70 $ 0.80 (13%) $ 1.07 $ 1.16 (8%)
Cashflow $ 16,462 $ 13,793 19% $ 31,794 $ 35,704 (11%)
Per Share Data (Diluted), dollars $ 0.37 $ 0.31 19% $ 0.70 $ 0.79 (11%)
The changes in cash provided by operating activities were due primarily to changes in the working capital requirements of the various business segments. Cash flow increased in the second quarter of 2021 compared to the same period in 2020 as a result of higher EBITDA, whereas cash flow decreased in the first half of 2021 compared to the same period in 2020 as a result of lower EBITDA. Given ongoing challenging and uncertain industry conditions, the Company’s current priority is to maintain strong financial liquidity and continue to repay long-term debt.
14
2 0 2 1 S E C O N D Q U A R T E R R E P O R T

T O T A L E N E R G Y S E R V I C E S I N C .
M A N A G E M E N T ’ S D I S C U S S I O N A N D A N A LY S I S
Investing Activities
Three months ended Six months ended
June 30 2021 2020 Change 2021 2020 Change
Net cash provided by (used in) investing activities $ 5 $ (6,996) nm $ (3,657) $ (8,845) (59%)
Proceeds from sale of PP&E $ 8,005 $ 1,638 389% $ 8,445 $ 3,343 153%
Purchase of PP&E $ (8,079) $ (7,944) 2% $ (13,153) $ (10,190) 29%
“nm” – calculation not meaningful
Proceeds from the sale of property, plant and equipment (“PP&E”) are derived primarily from the disposal of equipment in the ordinary course of business and the replacement and upgrade of older equipment in the Company’s fleet. During the second quarter and first half of 2021, equipment disposed of consisted primarily of light-duty vehicles, underutilized heavy trucks, underutilized rental equipment, access matting, compression rental units, decommissioned drilling rigs and ancillary drilling and well servicing equipment. For the second quarter and first half of 2020 equipment disposed of consisted primarily of underutilized rental equipment, light-duty vehicles and ancillary drilling equipment.
The following summarizes PP&E purchases by segment for the three and six months ended June 30, 2021.
Three months ended Six months ended
June 30 2021 2020 Change 2021 2020 Change
CDS $ 5,482 $ 1,158 373% $ 9,739 $ 2,019 382%
RTS 61 319 (81%) 280 842 (67%)
CPS 2,413 6,023 (60%) 2,581 6,079 (58%)
WS 123 436 (72%) 553 1,238 (55%)
Corporate – 8 nm – 12 nm
Purchase of PP&E $ 8,079 $ 7,944 2% $ 13,153 $ 10,190 29%
“nm” – calculation not meaningful
During the second quarter and first half of 2021, PP&E purchases were as follows: rig upgrades, recertifications and ancillary rig equipment purchases in the CDS segment, heavy truck recertifications and rental equipment in the RTS segment, additions to the compression rental fleet in the CPS segment and service rig recertifications and upgrades in the WS segment. Included in first half of 2021 capital expenditures was approximately $1.1 million of capital commitments carried forward from 2020 (2020: $3.7 million carried forward from 2019).
During the second quarter and first half of 2020, PP&E purchases included the following: rig equipment and rig recertification and upgrades in the CDS segment, rental equipment in the RTS segment, additions to the compression rental fleet in the CPS segment, service rig recertifications and upgrades in the WS segment.
Financing Activities
Three months ended Six months ended
June 30 2021 2020 Change 2021 2020 Change
Net cash used in financing activities $ (23,101) $ (38,015) (39%) $ (38,596) $ (42,436) (9%)
During the second quarter of 2021 the Company paid $0.7 million of interest, repaid $18.6 million of long-term debt, made $1.8 million of lease liability payments and made $1.9 million of share repurchases under the Company’s normal course issuer bid.
1 5
F O C U S • D I S C I P L I N E • G R O W T H
T O T A L E N E R G Y S E R V I C E S I N C .
M A N A G E M E N T ’ S D I S C U S S I O N A N D A N A LY S I S
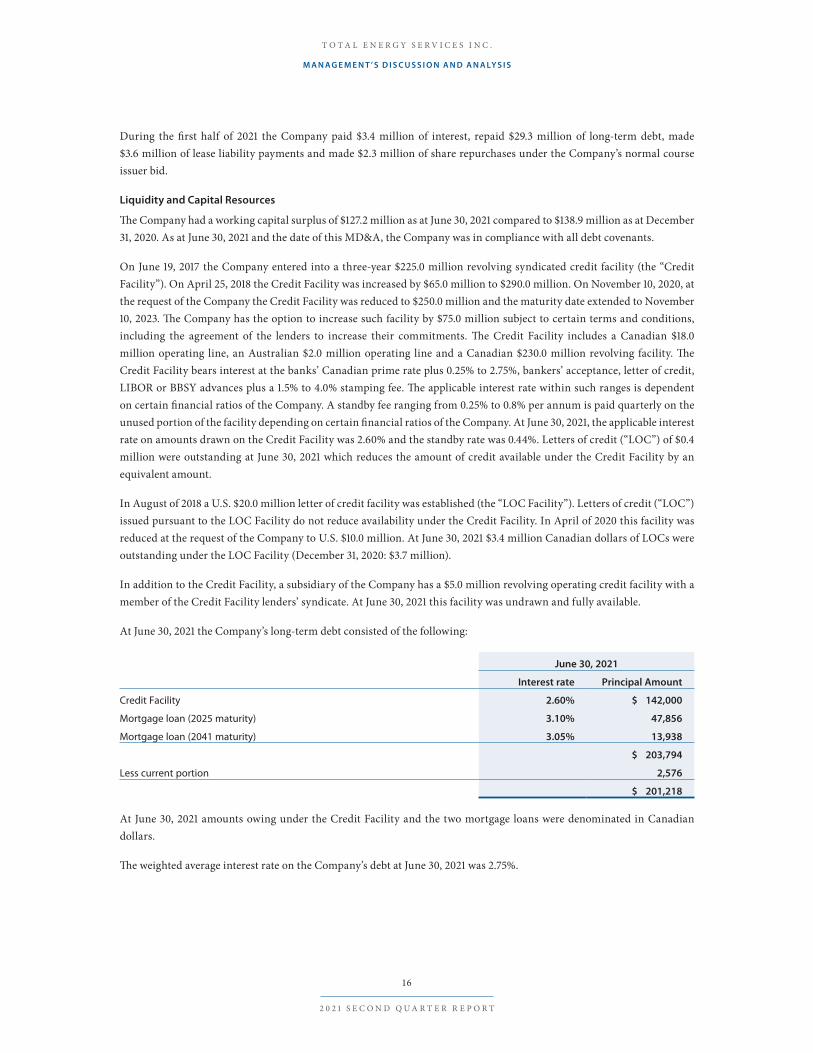
During the first half of 2021 the Company paid $3.4 million of interest, repaid $29.3 million of long-term debt, made $3.6 million of lease liability payments and made $2.3 million of share repurchases under the Company’s normal course issuer bid.
Liquidity and Capital Resources
The Company had a working capital surplus of $127.2 million as at June 30, 2021 compared to $138.9 million as at December 31, 2020. As at June 30, 2021 and the date of this MD&A, the Company was in compliance with all debt covenants.
On June 19, 2017 the Company entered into a three-year $225.0 million revolving syndicated credit facility (the “Credit Facility”). On April 25, 2018 the Credit Facility was increased by $65.0 million to $290.0 million. On November 10, 2020, at the request of the Company the Credit Facility was reduced to $250.0 million and the maturity date extended to November 10, 2023. The Company has the option to increase such facility by $75.0 million subject to certain terms and conditions, including the agreement of the lenders to increase their commitments. The Credit Facility includes a Canadian $18.0 million operating line, an Australian $2.0 million operating line and a Canadian $230.0 million revolving facility. The Credit Facility bears interest at the banks’ Canadian prime rate plus 0.25% to 2.75%, bankers’ acceptance, letter of credit, LIBOR or BBSY advances plus a 1.5% to 4.0% stamping fee. The applicable interest rate within such ranges is dependent on certain financial ratios of the Company. A standby fee ranging from 0.25% to 0.8% per annum is paid quarterly on the unused portion of the facility depending on certain financial ratios of the Company. At June 30, 2021, the applicable interest rate on amounts drawn on the Credit Facility was 2.60% and the standby rate was 0.44%. Letters of credit (“LOC”) of $0.4 million were outstanding at June 30, 2021 which reduces the amount of credit available under the Credit Facility by an equivalent amount.
In August of 2018 a U.S. $20.0 million letter of credit facility was established (the “LOC Facility”). Letters of credit (“LOC”) issued pursuant to the LOC Facility do not reduce availability under the Credit Facility. In April of 2020 this facility was reduced at the request of the Company to U.S. $10.0 million. At June 30, 2021 $3.4 million Canadian dollars of LOCs were outstanding under the LOC Facility (December 31, 2020: $3.7 million).
In addition to the Credit Facility, a subsidiary of the Company has a $5.0 million revolving operating credit facility with a member of the Credit Facility lenders’ syndicate. At June 30, 2021 this facility was undrawn and fully available.
At June 30, 2021 the Company’s long-term debt consisted of the following:
June 30, 2021
Interest rate Principal Amount
Credit Facility 2.60% $ 142,000
Mortgage loan (2025 maturity) 3.10% 47,856
Mortgage loan (2041 maturity) 3.05% 13,938
$ 203,794
Less current portion 2,576
$ 201,218
At June 30, 2021 amounts owing under the Credit Facility and the two mortgage loans were denominated in Canadian dollars.
The weighted average interest rate on the Company’s debt at June 30, 2021 was 2.75%.
16
2 0 2 1 S E C O N D Q U A R T E R R E P O R T

T O T A L E N E R G Y S E R V I C E S I N C .
M A N A G E M E N T ’ S D I S C U S S I O N A N D A N A LY S I S
The Company’s ability to access the Credit Facility is dependent, among other conditions, on compliance with the following financial ratios, the definitions and thresholds for which are further described below:
June 30, 2021 Threshold
Twelve-month trailing Bank EBITDA to interest expense 11.93 minimum 3.00
Total Senior Debt to twelve-month trailing Bank EBITDA 1.87 maximum 3.00
The Company was in compliance with all of its Credit Facility and other debt covenants at June 30, 2021. For further information regarding Credit Facility compliance requirements and details on the Company’s borrowings, please refer to note 4 to the Interim Financial Statements.
The Company expects that cash and cash equivalents, cash flow from operating activities, together with existing and available credit facilities, will be sufficient to fund its presently anticipated requirements for investments in working capital and capital assets as well as required debt and lease liability payments.
Dividends
The Company suspended payment of a dividend on March 12, 2020 given the sudden and material deterioration in industry conditions.
Management and the Board of Directors of the Company continue to monitor the Company’s dividend policy in the context of industry conditions and forecasted net income, cashflow, cash provided by operating activities, debt levels, capital expenditures and other investment opportunities and will aim to finance any future dividends through cash provided by operating activities.
Capital Spending
Capital spending for the three and six months ended June 30, 2021 consisted of $8.1 million and $13.2 million of PP&E purchases, respectively. Capital spending was funded by cash flow and $8.0 million and $8.4 million of proceeds from the sale of PP&E during the second quarter and first half of 2021, respectively.
CONTRACTUAL OBLIGATIONS
At June 30, 2021 the Company had the following contractual obligations:
Payments due by year
Total 2021 2022 2023 20242025
and after
Long-term debt and bank indebtedness $ 203,794 $ 1,277 $ 2,611 $ 144,671 $ 2,730 $ 52,505
Commitments (1) 234 85 90 58 1 –
Lease liabilities, net of lease assets 12,026 2,082 3,086 2,014 1,512 3,332
Purchase obligations (2) 8,026 8,026 – – – –
Total contractual obligations $ 224,080 $ 11,470 $ 5,787 $ 146,743 $ 4,243 $ 55,837
(1) Commitments are described in Note 24 to the 2020 Financial Statements.
(2) Purchase obligations are described in Note 24 to the 2020 Financial Statements. As at June 30, 2021 purchase obligations primarily relate to commitments to purchase inventory in the CPS segment.
OFF-BALANCE SHEET ARRANGEMENTS
During 2021 and 2020, the Company had no off-balance sheet arrangements other than short-term leases.
17
F O C U S • D I S C I P L I N E • G R O W T H

T O T A L E N E R G Y S E R V I C E S I N C .
M A N A G E M E N T ’ S D I S C U S S I O N A N D A N A LY S I S
TRANSACTIONS WITH RELATED PARTIES
During 2021 and 2020 the Company had no material transactions with related parties.
FINANCIAL INSTRUMENTS
Fair values
The discounted future cash repayments of the Company’s mortgage loan due in 2025 are calculated using prevailing market rates of a similar debt instrument as at the reporting date. The net present value of future cash repayments of such mortgage and related interest at the prevailing market rate of 3.67% for a similar debt instrument at June 30, 2021 was $47.0 million (December 31, 2020: market rate of 3.08%, $48.8 million). The carrying value and Company s̀ liability with respect to this mortgage is $47.9 million.
OUTSTANDING COMPANY SHARE DATA
As at the date of this MD&A, the Company had 44,421,000 common shares outstanding.
Summary information with respect to share options outstanding is provided below:
Outstanding atJune 30, 2021
ExercisePrice
Remaining life(years)
Exercisable atJune 30, 2021
1,175,000 $ 12.69 1.00 1,175,000
60,000 12.00 1.10 60,000
300,000 13.54 1.70 200,000
840,000 9.51 2.90 560,002
650,000 2.31 4.10 –
55,000 3.50 4.50 –
3,080,000 $ 9.54 2.31 1,995,002
OUTLOOK
Industry Conditions
The COVID-19 pandemic and the resultant historic decline in global economic activity and oil prices contributed to unprecedented challenges and uncertainty for the global energy industry during 2020 and into 2021. While oil prices have recently recovered from the lows in April 2020 resulting from the price war between Saudi Arabia and Russia as well as the global economic shock due to the COVID-19 pandemic, industry activity remains low by historical measures. As such, the Company remains cautious and continues to manage it business and affairs in a manner to protect its balance sheet and financial liquidity.
The severity of the current downturn has resulted in a substantial increase in bankruptcies and insolvencies among the Company’s competitors and customers. While this led to short term challenges, it is expected to result in more balanced market conditions over the long-term in the various markets in which the Company competes as global energy supply and demand rebalances with normalized global economic activity.
Recent improvements in global oil and natural gas prices have stabilized industry conditions although current activity levels remain low relative to historical levels as producers generally remain disciplined and cautious in regards of their capital expenditure programs.
18
2 0 2 1 S E C O N D Q U A R T E R R E P O R T

T O T A L E N E R G Y S E R V I C E S I N C .
M A N A G E M E N T ’ S D I S C U S S I O N A N D A N A LY S I S
RISK FACTORS AND RISK MANAGEMENT
In the normal course of business, Total Energy is exposed to financial and operating risks that may potentially and materially impact its operating results. A discussion of the Company’s business risks is set out in its AIF under the heading “Risk Factors” and is incorporated herein. The Company employs risk management strategies with a view to mitigating these risks on a cost-effective basis. There have been no significant changes in risk and risk management in 2021 other than as described below.
Industry Conditions
The dual shocks of the COVID-19 pandemic and collapse in oil prices contributed to extremely negative industry conditions for the global energy industry that only recently have begun to ease. The Company’s North American customers have significantly reduced near term capital spending resulting in current activity levels that are substantially below historical levels. Activity levels in Australia moderated in the third quarter of 2020. While the Company has been proactive in managing its operating cost structure, capital expenditures and dividend policy to adapt to the current environment, continued challenging industry activity levels may require additional substantive measures be taken to preserve the Company’s financial strength and flexibility.
Credit Risk
As a result of the challenging oil and natural gas market conditions, particularly in North America, the Company continues to face heightened counterparty credit risk as a substantial portion of the Company’s dealings are with entities involved in the oil and gas industry. Regarding accounts receivable, the Company remains focused on actively managing credit risk. Specifically, management has remained diligent in assessing credit levels granted to customers, monitoring the aging of receivables and taking proactive steps to secure and collect outstanding balances.
The Company did not have significant exposure to any individual customer or counter party other than with one major oil and gas company that accounted for over 10% of the consolidated revenue in the second quarter of 2021. In the first half of 2021, the Company did not have any significant exposure to any individual customer or counter party. In the second quarter and first half of 2020 the Company did not have significant exposure other than with two major oil and gas companies that accounted for over 10% of the consolidated revenue.
The Company increased its allowance for doubtful accounts receivable by $0.2 million and wrote-off $1.2 million against the allowance for doubtful accounts during the first half of 2021, bringing such allowance to an aggregate of $1.0 million as at June 30, 2021.
CRITICAL ACCOUNTING ESTIMATES
Management is responsible for applying judgment in preparing accounting estimates. Certain estimates and related disclosures included within the financial statements are particularly sensitive because of their significance to the financial statements and because of the possibility that future events affecting them may differ significantly from management’s current judgments. An accounting estimate is considered critical only if it requires the Company to make assumptions about matters that are highly uncertain at the time the accounting estimate is made, and different estimates the Company could have used would have a material impact on Total Energy’s financial condition, changes in financial condition or results of operations.
There have been no material changes to the Company’s Critical Accounting Estimates during 2021.
Change in accounting estimates
During the second quarter of 2020, the Company conducted a review of its drilling equipment within its CDS segment. Such review was based on the current economic and operating environment and considered the operating history of these assets in order to assess their useful lives, pace of economic consumption and residual values. As a result of this review,
1 9
F O C U S • D I S C I P L I N E • G R O W T H

T O T A L E N E R G Y S E R V I C E S I N C .
M A N A G E M E N T ’ S D I S C U S S I O N A N D A N A LY S I S
effective April 1, 2020 certain changes were made to the Company’s estimates of the useful life and residual values of various CDS assets, which are summarized as follows:
Previous estimated useful lives
New estimated useful lives
Previous basis of depreciation
New basis of depreciation
Drilling rigs and related equipment600 to 8,000
operating days 3 – 25 years
utilization(minimum annual
deemed utilization of 96 days) straight-line
As a result of these changes in estimates which related primarily to the estimated useful life and method of depreciation, a non-recurring depreciation expense relating to now fully depreciated assets of $26.3 million was incurred during the second quarter of 2020.
Critical Judgments in Applying Accounting Policies
The following are critical judgments that management has made in the process of applying accounting policies and that have the most significant effect on the amounts recognized in the consolidated financial statements.
The Company’s assets are aggregated into cash-generating units for the purpose of calculating impairment. Cash generating units (“CGU” or “CGUs”) are based on management’s judgments and assessment of the CGU’s ability to generate independent cash inflows. Judgments are also required to assess when impairment indicators exist and impairment testing is required.
The Company is required to exercise judgment in assessing whether the criteria for recognition of a provision or a contingency have been met. The Company considers whether a present obligation exists, probability of loss and if a reliable estimate can be formulated.
The Company’s functional currency is based on the primary economic environment in which it operates and is based on an analysis of several factors including which currency principally affects sales prices of products sold by the Company, which currency influences the main expenses of providing services, in which currency the Company keeps it receipts from operating activities and in which currency the Company has received financing.
The Company makes judgments regarding the determination of its reportable segments, including aggregation criteria (as appropriate), for segmented reporting.
Judgments are made by management to determine the likelihood of whether deferred income tax assets at the end of the reporting period will be realized from future taxable earnings.
Key Sources of Estimation Uncertainty
The following are key estimates and their assumptions made by management affecting the measurement of balances and transactions in the consolidated financial statements.
Where impairment indicators exist or annually for goodwill, the recoverable amount of the asset or CGU is determined using the greater of fair value less costs to sell or value-in-use. Value-in-use calculations require assumptions for discount rates and estimations of the timing for events or circumstances that will affect future cash flows. Fair value less costs to sell requires management to make estimates of fair value using market conditions for similar assets as well as estimations for costs to sell taking into account dismantle and transportation costs.
The Company is required to estimate the amount of provisions and contingencies based on the estimated future outcome of the event.
2 0
2 0 2 1 S E C O N D Q U A R T E R R E P O R T
T O T A L E N E R G Y S E R V I C E S I N C .
M A N A G E M E N T ’ S D I S C U S S I O N A N D A N A LY S I S
The Company recognizes revenue over time in accounting for its equipment manufacturing contract revenue. Recognizing revenue over time requires estimates of the stage of completion of the contract to date as a proportion of the total work to be performed.
As pertains to property, plant and equipment the Company is required to estimate the residual value and useful lives of assets for purposes of depreciation.
As pertains to accounts receivable the Company is required to estimate allowances for doubtful accounts based on expected future credit losses and experiences with customers.
In a business combination, management makes estimates of the fair value of assets acquired and liabilities assumed which includes assessing the value of property, plant and equipment and intangible assets being acquired.
The Company’s estimate of share-based compensation is dependent upon estimates of historic volatility and forfeiture rates.
The Company’s estimate of the fair value of forward foreign exchange contracts is dependent on estimated forward prices / rates and volatility in those prices / rates.
The deferred tax liability is based on estimates as to the timing of the reversal of temporary differences, substantively enacted tax rates and the likelihood of assets being realized.
FUTURE ACCOUNTING POLICIES CHANGES
Certain pronouncements were issued recently by the International Accounting Standards Board (“IASB”) of the International Financial Reporting Standards (“IFRS”) Interpretations Committee that are mandatory for accounting periods beginning in future years. Accounting standards or amendments to existing accounting standards that have been issued but have future effective dates are either not applicable or are not expected to have a significant impact on the Company’s consolidated financial statements.
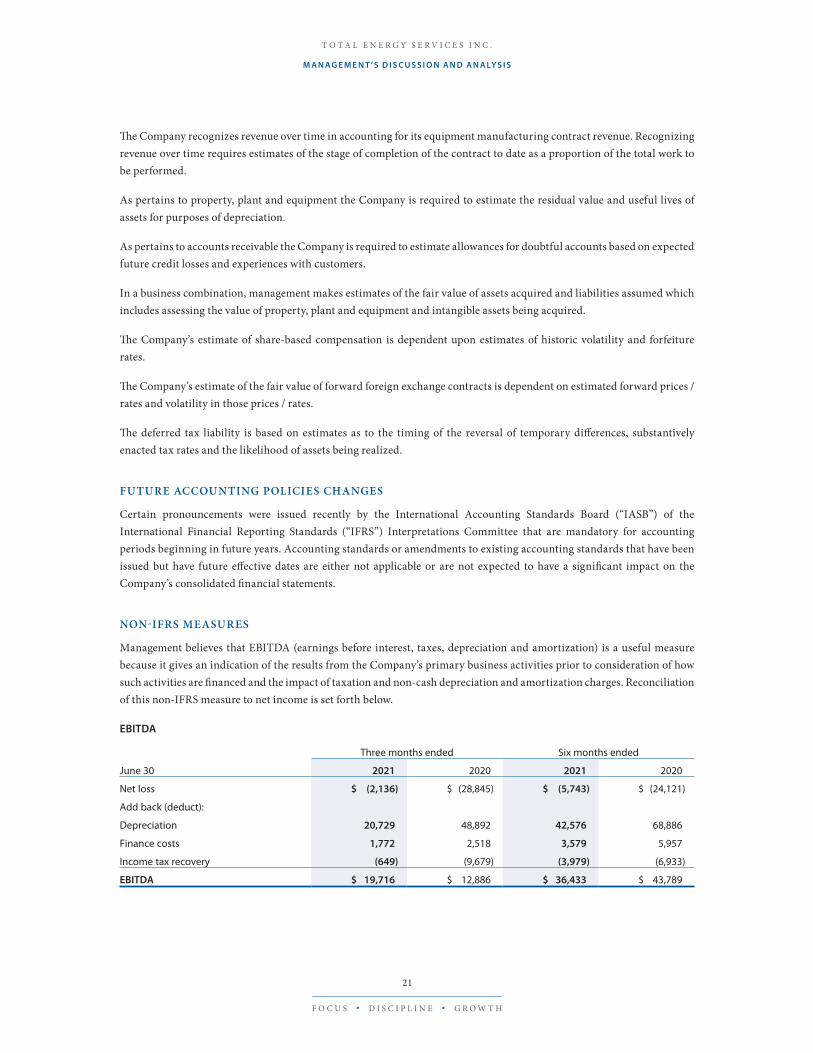
NON-IFRS MEASURES
Management believes that EBITDA (earnings before interest, taxes, depreciation and amortization) is a useful measure because it gives an indication of the results from the Company’s primary business activities prior to consideration of how such activities are financed and the impact of taxation and non-cash depreciation and amortization charges. Reconciliation of this non-IFRS measure to net income is set forth below.
EBITDA
Three months ended Six months ended
June 30 2021 2020 2021 2020
Net loss $ (2,136) $ (28,845) $ (5,743) $ (24,121)
Add back (deduct):
Depreciation 20,729 48,892 42,576 68,886
Finance costs 1,772 2,518 3,579 5,957
Income tax recovery (649) (9,679) (3,979) (6,933)
EBITDA $ 19,716 $ 12,886 $ 36,433 $ 43,789
2 1
F O C U S • D I S C I P L I N E • G R O W T H

T O T A L E N E R G Y S E R V I C E S I N C .
M A N A G E M E N T ’ S D I S C U S S I O N A N D A N A LY S I S
Net debt is equal to long-term debt plus lease liabilities plus current liabilities minus current assets.
Net Debt
As at June 30, 2021
Long-term debt $ 201,218
Lease liabilities 8,914
Add back (deduct):
Current liabilities 74,102
Current assets (201,303)
Net Debt $ 82,931
RESPONSIBILITY OF MANAGEMENT AND THE BOARD OF DIRECTORS
Management is responsible for the information disclosed in this MD&A and the accompanying unaudited condensed interim consolidated financial statements, and has in place appropriate information systems, procedures and controls to ensure that information used internally by management and disclosed externally is materially complete and reliable. In addition, the Company’s Audit Committee, on behalf of the Board of Directors, provides an oversight role with respect to all public financial disclosures made by the Company, and has reviewed and approved this MD&A and the accompanying unaudited condensed interim consolidated financial statements.
Internal Control Over Financial Reporting (“ICFR”)
There have been no significant changes in the design of the Company’s ICFR during the quarter ended June 30, 2021 that would materially affect or is reasonably likely to materially affect the Company’s ICFR.
CAUTIONARY STATEMENT REGARDING FORWARD-LOOKING INFORMATION AND STATEMENTS
Certain information and statements contained in this MD&A constitute forward-looking information, including the anticipated costs associated with the purchase of capital equipment, expectations concerning the nature and timing of growth within the various business divisions operated through affiliates of Total Energy, expectations respecting the competitive position of such business divisions, expectations concerning the financing of future business activities, statements as to future economic and operating conditions and expectations regarding the payment of dividends in the future. Readers should review the cautionary statement respecting forward-looking information that appears below.
The information and statements contained in this MD&A that are not historical facts are forward-looking statements. Forward-looking statements (often, but not always, identified by the use of words such as “seek”, “plan”, “continue”, “estimate”, “project”, “predict”, “potential”, “targeting”, “intend”, “could”, “might”, “should”, “believe”, “expect”, “may”, “anticipate” or “will” and similar expressions) may include plans, expectations, opinions, or guidance that are not statements of fact. Forward-looking statements are based upon the opinions, expectations and estimates of management as at the date the statements are made and are subject to a variety of risks and uncertainties and other factors that could cause actual events or outcomes to differ materially from those anticipated or implied by such forward-looking statements. These factors include, but are not limited to, such things as global economic conditions, changes in industry conditions (including the levels of capital expenditures made by oil and gas producers and explorers), pandemics, the credit risk to which the Company is exposed in the conduct of its business, fluctuations in prevailing commodity prices or currency and interest rates, the competitive environment to which the various business divisions are, or may be, exposed in all aspects of their business, the ability of the Company’s various business divisions to access equipment (including parts) and new technologies and to maintain relationships with key suppliers, the ability of the Company’s various business divisions to attract and maintain key personnel and other qualified employees, various environmental risks to which the Company’s business divisions are exposed in the conduct of their operations, inherent risks associated with the conduct of the businesses in which the
2 2
2 0 2 1 S E C O N D Q U A R T E R R E P O R T

T O T A L E N E R G Y S E R V I C E S I N C .
M A N A G E M E N T ’ S D I S C U S S I O N A N D A N A LY S I S
Company’s business divisions operate, timing and costs associated with the acquisition of capital equipment, the impact of weather and other seasonal factors that affect business operations, availability of financial resources or third-party financing and the impact of new laws and regulations or changes in existing laws, regulations or administrative practices on the part of regulatory authorities, including without limitation taxation, labour and environmental laws and regulations and changes in how such laws and regulations are interpreted and enforced. Forward-looking information respecting the anticipated costs associated with the purchase of capital equipment are based upon historical prices for various classes of equipment, expectations relating to the impact of inflation on the future cost of such equipment and management’s views concerning the negotiating position of the Company and its affiliates. Forward-looking information concerning the nature and timing of growth within the various business divisions is based on the current budget of the Company (which is subject to change), factors that affected the historical growth of such business divisions, sources of historic growth opportunities and expectations relating to future economic and operating conditions. Forward-looking information concerning the future competitive position of the Company’s business divisions is based upon the current competitive environment in which those business divisions operate, expectations relating to future economic and operating conditions, current and announced build programs and other expansion plans of other organizations that operate in the energy service business. Forward-looking information concerning the financing of future business activities is based upon the financing sources on which the Company and its predecessors have historically relied and expectations relating to future economic and operating conditions. Forward-looking information concerning future economic and operating conditions is based upon historical economic and operating conditions, and opinions of third-party analysts respecting anticipated economic and operating conditions. Although management of the Company believes that the expectations reflected in such forward-looking statements are reasonable, it can give no assurance that such expectations will prove to have been correct. Accordingly, readers should not place undue reliance upon any of the forward-looking information set out in this MD&A. All of the forward-looking statements of the Company contained in this MD&A are expressly qualified, in their entirety, by this cautionary statement. The various risks to which the Company is exposed are described in additional detail in this MD&A under the heading “Risk Factors” and in the Company’s AIF. Except as required by law, the Company disclaims any intention or obligation to update or revise any forward-looking information or statements, whether as a result of new information, future events or otherwise.
2 3
F O C U S • D I S C I P L I N E • G R O W T H

Note June 30, 2021 December 31, 2020
(unaudited) (audited)
ASSETS
Current assets:
Cash and cash equivalents $ 29,231 $ 22,996
Accounts receivable 72,763 73,373
Inventory 92,786 95,586
Prepaid expenses and deposits 4,835 6,876
Income taxes receivable 1,226 1,287
Current portion of lease asset 462 566
201,303 200,684
Property, plant and equipment 597,799 636,996
Income taxes receivable 7,070 7,070
Deferred income tax asset 792 57
Lease asset 598 719
Goodwill 4,053 4,053
$ 811,615 $ 849,579
LIABILITIES & SHAREHOLDERS’ EQUIT Y
Current liabilities:
Accounts payable and accrued liabilities $ 56,297 $ 46,410
Deferred revenue 11,057 6,365
Current portion of lease liabilities 4,172 6,417
Current portion of long-term debt 4 2,576 2,552
74,102 61,744
Long-term debt 4 201,218 230,517
Lease liabilities 8,914 8,420
Deferred tax liability 35,122 37,911
Shareholders’ equity:
Share capital 5 280,829 284,077
Contributed surplus 5,356 4,966
Accumulated other comprehensive loss (29,858) (18,736)
Non-controlling interest 573 629
Retained earnings 235,359 240,051
492,259 510,987
$ 811,615 $ 849,579
The notes on pages 28 to 35 are an integral part of these condensed interim consolidated financial statements.
T O T A L E N E R G Y S E R V I C E S I N C .
CO N D E N S E D I N T E R I M CO N S O L I DAT E D S TAT E M E N T S O F F I N A N C I A L P O S I T I O N(in thousands of Canadian dollars)
2 4
2 0 2 1 S E C O N D Q U A R T E R R E P O R T
T O T A L E N E R G Y S E R V I C E S I N C .
CO N D E N S E D I N T E R I M CO N S O L I DAT E D S TAT E M E N T S O F L O S SUnaudited (in thousands of Canadian dollars except per share amounts)
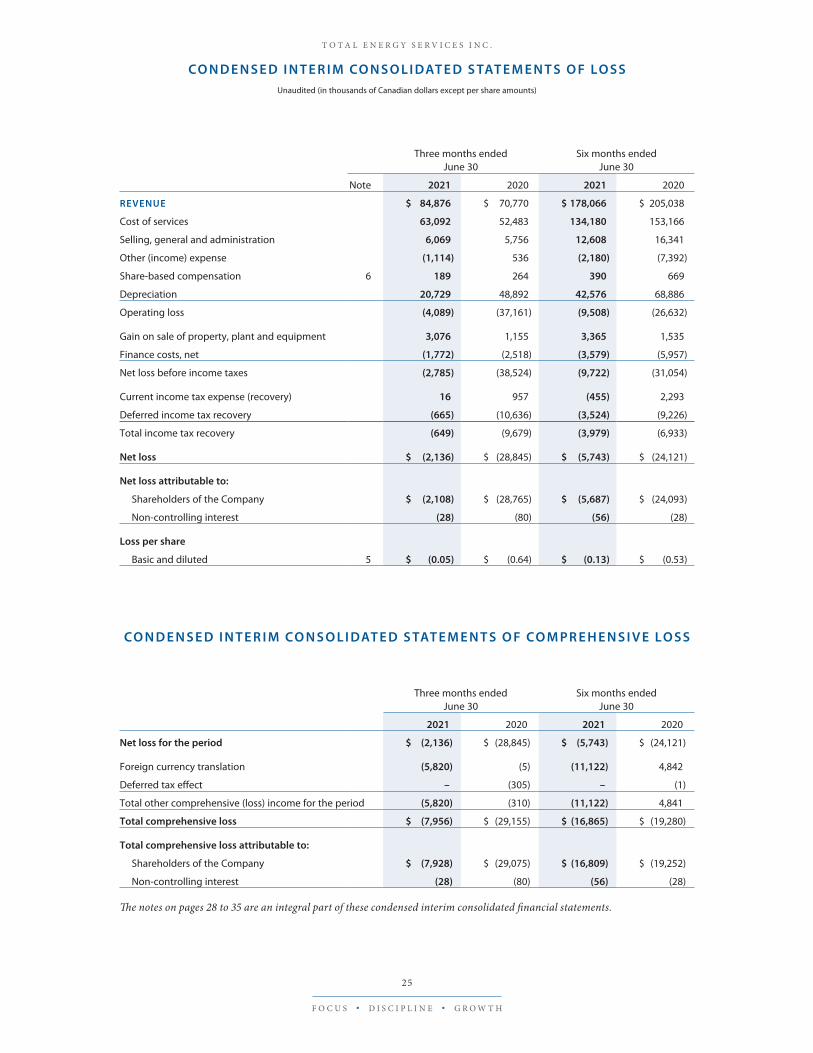
Three months ended
June 30Six months ended
June 30
Note 2021 2020 2021 2020
REVENUE $ 84,876 $ 70,770 $ 178,066 $ 205,038
Cost of services 63,092 52,483 134,180 153,166
Selling, general and administration 6,069 5,756 12,608 16,341
Other (income) expense (1,114) 536 (2,180) (7,392)
Share-based compensation 6 189 264 390 669
Depreciation 20,729 48,892 42,576 68,886
Operating loss (4,089) (37,161) (9,508) (26,632)
Gain on sale of property, plant and equipment 3,076 1,155 3,365 1,535
Finance costs, net (1,772) (2,518) (3,579) (5,957)
Net loss before income taxes (2,785) (38,524) (9,722) (31,054)
Current income tax expense (recovery) 16 957 (455) 2,293
Deferred income tax recovery (665) (10,636) (3,524) (9,226)
Total income tax recovery (649) (9,679) (3,979) (6,933)
Net loss $ (2,136) $ (28,845) $ (5,743) $ (24,121)
Net loss attributable to:
Shareholders of the Company $ (2,108) $ (28,765) $ (5,687) $ (24,093)
Non-controlling interest (28) (80) (56) (28)
Loss per share
Basic and diluted 5 $ (0.05) $ (0.64) $ (0.13) $ (0.53)
CO N D E N S E D I N T E R I M CO N S O L I DAT E D S TAT E M E N T S O F CO M P R E H E N S I V E L O S S
Three months ended
June 30Six months ended
June 30
2021 2020 2021 2020
Net loss for the period $ (2,136) $ (28,845) $ (5,743) $ (24,121)
Foreign currency translation (5,820) (5) (11,122) 4,842
Deferred tax effect – (305) – (1)
Total other comprehensive (loss) income for the period (5,820) (310) (11,122) 4,841
Total comprehensive loss $ (7,956) $ (29,155) $ (16,865) $ (19,280)
Total comprehensive loss attributable to:
Shareholders of the Company $ (7,928) $ (29,075) $ (16,809) $ (19,252)
Non-controlling interest (28) (80) (56) (28)
The notes on pages 28 to 35 are an integral part of these condensed interim consolidated financial statements.
2 5
F O C U S • D I S C I P L I N E • G R O W T H
T O T A L E N E R G Y S E R V I C E S I N C .
CO N D E N S E D I N T E R I M CO N S O L I DAT E D S TAT E M E N T S O F L O S SUnaudited (in thousands of Canadian dollars except per share amounts)
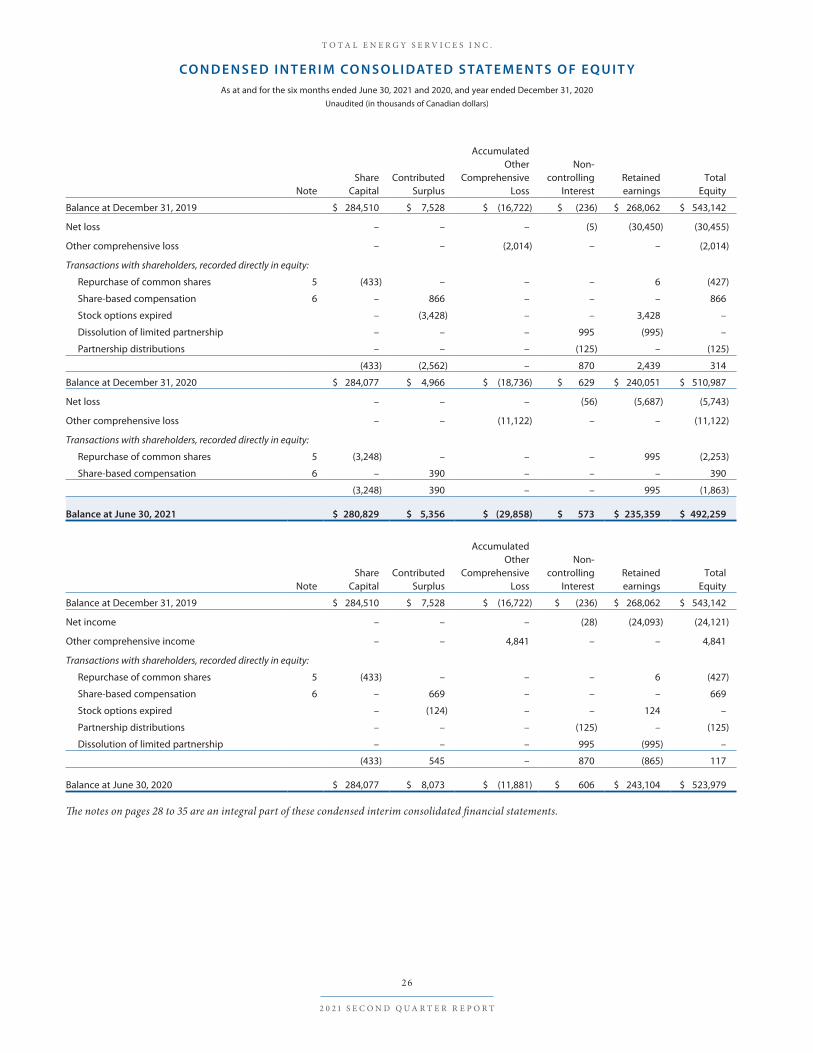
NoteShare
CapitalContributed
Surplus
Accumulated Other
ComprehensiveLoss
Non-controlling
InterestRetainedearnings
TotalEquity
Balance at December 31, 2019 $ 284,510 $ 7,528 $ (16,722) $ (236) $ 268,062 $ 543,142
Net loss – – – (5) (30,450) (30,455)
Other comprehensive loss – – (2,014) – – (2,014)
Transactions with shareholders, recorded directly in equity:
Repurchase of common shares 5 (433) – – – 6 (427)
Share-based compensation 6 – 866 – – – 866
Stock options expired – (3,428) – – 3,428 –
Dissolution of limited partnership – – – 995 (995) –
Partnership distributions – – – (125) – (125)
(433) (2,562) – 870 2,439 314
Balance at December 31, 2020 $ 284,077 $ 4,966 $ (18,736) $ 629 $ 240,051 $ 510,987
Net loss – – – (56) (5,687) (5,743)
Other comprehensive loss – – (11,122) – – (11,122)
Transactions with shareholders, recorded directly in equity:
Repurchase of common shares 5 (3,248) – – – 995 (2,253)
Share-based compensation 6 – 390 – – – 390
(3,248) 390 – – 995 (1,863)
Balance at June 30, 2021 $ 280,829 $ 5,356 $ (29,858) $ 573 $ 235,359 $ 492,259
NoteShare
CapitalContributed
Surplus
Accumulated Other
ComprehensiveLoss
Non-controlling
InterestRetainedearnings
TotalEquity
Balance at December 31, 2019 $ 284,510 $ 7,528 $ (16,722) $ (236) $ 268,062 $ 543,142
Net income – – – (28) (24,093) (24,121)
Other comprehensive income – – 4,841 – – 4,841
Transactions with shareholders, recorded directly in equity:
Repurchase of common shares 5 (433) – – – 6 (427)
Share-based compensation 6 – 669 – – – 669
Stock options expired – (124) – – 124 –
Partnership distributions – – – (125) – (125)
Dissolution of limited partnership – – – 995 (995) –
(433) 545 – 870 (865) 117
Balance at June 30, 2020 $ 284,077 $ 8,073 $ (11,881) $ 606 $ 243,104 $ 523,979
The notes on pages 28 to 35 are an integral part of these condensed interim consolidated financial statements.
2 6
2 0 2 1 S E C O N D Q U A R T E R R E P O R T
T O T A L E N E R G Y S E R V I C E S I N C .
CO N D E N S E D I N T E R I M CO N S O L I DAT E D S TAT E M E N T S O F E Q U I T YAs at and for the six months ended June 30, 2021 and 2020, and year ended December 31, 2020
Unaudited (in thousands of Canadian dollars)
T O T A L E N E R G Y S E R V I C E S I N C .
CO N D E N S E D I N T E R I M CO N S O L I DAT E D S TAT E M E N T S O F C A S H FL O W SUnaudited (in thousands of Canadian dollars)

NoteThree months ended
June 30Six months ended
June 30
2021 2020 2021 2020
Cash provided by (used in):
Operations:
Net loss for the period $ (2,136) $ (28,845) $ (5,743) $ (24,121)
Add (deduct) items not affecting cash:
Depreciation 20,729 48,892 42,576 68,886
Share-based compensation 189 264 390 669
Gain on sale of property, plant and equipment (3,076) (1,155) (3,365) (1,535)
Finance costs 1,772 2,518 3,579 5,957
Unrealized (gain) loss on foreign currencies translation (1,114) 748 (2,180) (7,828)
Current income tax expense (recovery) 16 957 (455) 2,293
Deferred income tax recovery (665) (10,636) (3,524) (9,226)
Income taxes recovered 747 1,050 516 609
Cashflow 16,462 13,793 31,794 35,704
Changes in non-cash working capital items:
Accounts receivable 3,738 37,486 (159) 43,099
Inventory 972 6,727 2,129 (672)
Prepaid expenses and deposits 1,068 2,825 2,041 6,327
Accounts payable and accrued liabilities 7,123 (27,955) 7,991 (38,192)
Deferred revenue 2,259 3,286 4,692 6,239
Cash provided by operating activities 31,622 36,162 48,488 52,505
Investing:
Purchase of property, plant and equipment (8,079) (7,944) (13,153) (10,190)
Proceeds on disposal of property, plant and equipment 8,005 1,638 8,445 3,343
Changes in non-cash working capital items 79 (690) 1,051 (1,998)
Cash provided by (used in) investing activities 5 (6,996) (3,657) (8,845)
Financing:
Advances on long-term debt – 9,796 – 29,796
Repayment of long-term debt 4 (18,637) (42,647) (29,275) (58,342)
Repayment of lease liabilities (1,802) (2,205) (3,622) (4,264)
Dividends to shareholders – – – (2,710)
Repurchase of common shares (1,924) – (2,253) (427)
Partnership distributions – (125) – (125)
Interest paid (738) (2,834) (3,446) (6,364)
Cash used in financing activities (23,101) (38,015) (38,596) (42,436)
Change in cash and cash equivalents 8,526 (8,849) 6,235 1,224
Cash and cash equivalents, beginning of period 20,705 29,946 22,996 19,873
Cash and cash equivalents, end of period $ 29,231 $ 21,097 $ 29,231 $ 21,097
The notes on pages 28 to 35 are an integral part of these condensed interim consolidated financial statements.
2 7
F O C U S • D I S C I P L I N E • G R O W T H
T O T A L E N E R G Y S E R V I C E S I N C .
CO N D E N S E D I N T E R I M CO N S O L I DAT E D S TAT E M E N T S O F C A S H FL O W SUnaudited (in thousands of Canadian dollars)

1. Reporting Entity
Total Energy Services Inc. (the “Company”) is incorporated under the Business Corporations Act (Alberta) and its head office is located in Calgary, Alberta at Suite 1000, 734 – 7th Avenue S.W. The condensed interim consolidated financial statements include the accounts of the Company, its subsidiaries and aboriginal partnerships established in Canada, the United States of America (the “United States”) and Australia.
The Company provides a variety of products and services to the energy and other resource industries primarily in Canada, the United States and Australia, including contract drilling services, the rental and transportation of equipment used in energy and other industrial operations, the fabrication, sale, rental and servicing of gas compression and process equipment and well servicing.
2. Basis of Presentation
Statement of Compliance
These condensed interim consolidated financial statements have been prepared in accordance with International Accounting Standard (“IAS”) 34, “Interim Financial Reporting” of International Financial Reporting Standards (“IFRS”) and using the accounting policies outlined in the Company’s audited consolidated financial statements for the year ended December 31, 2020 (the “2020 Financial Statements”). These condensed interim consolidated financial statements do not include all the necessary annual disclosures and should be read in conjunction with the 2020 Financial Statements.
These condensed interim consolidated financial statements were approved by the Board of Directors on August 11, 2021.
Seasonality
A significant portion of the Company’s field operations are conducted in Canada where the ability to move heavy equipment is dependent on ground conditions. As warm weather returns in the spring, the winter’s frost comes out of the ground rendering many secondary roads incapable of supporting the weight of heavy equipment until such roads have thoroughly dried out. The duration of this “spring breakup” has a direct impact on the Company’s activity levels and operating results in Canada. In addition, many exploration and production areas in northern Canada are accessible only in winter months when the ground is frozen hard enough to support equipment. The timing of freeze up and spring breakup affects the ability to move equipment in and out of these areas. As a result, late March through May is traditionally the Company’s slowest period in Canada. Additionally, wet weather in Australia, normally in the first quarter, can restrict the Company’s Australian operations. Consequently, quarterly operating results may not be indicative of full year operating results.
3. Segmented Information
The Company manages its business in five reportable segments: Contract Drilling Services, Rental and Transportation Services, Compression and Process Services, Well Servicing and Corporate. For each of the reporting segments, the Company’s Chief Operating Decision Maker reviews internal management reports on at least a quarterly basis. Corporate includes activities related to corporate and public company affairs.
Inter-segment pricing is determined on an arm’s length basis.
2 8
2 0 2 1 S E C O N D Q U A R T E R R E P O R T
T O T A L E N E R G Y S E R V I C E S I N C .
N O T E S T O T H E CO N D E N S E D I N T E R I M CO N S O L I DAT E D F I N A N C I A L S TAT E M E N T SAs at and for the six months ended June 30, 2021 and 2020
Unaudited (tabular amounts in thousands of Canadian dollars)

As at and for the three months endedJune 30, 2021
ContractDrilling
Services
Rentals andTransportation
Services
Compressionand Process
ServicesWell
Servicing Corporate (1) Total
Revenue $ 25,740 $ 6,053 $ 33,657 $ 19,426 $ – $ 84,876
Cost of services 20,355 3,029 25,932 13,776 – 63,092
Selling, general and administration 949 1,276 1,180 1,061 1,603 6,069
Other income – – – – (1,114) (1,114)
Share-based compensation – – – – 189 189
Depreciation (2) 9,461 5,042 2,265 3,749 212 20,729
Operating income (loss) (5,025) (3,294) 4,280 840 (890) (4,089)
Gain on sale of property, plant and equipment 272 1,576 1,137 78 13 3,076
Finance costs (8) (30) (74) (5) (1,655) (1,772)
Net income (loss) before income taxes (4,761) (1,748) 5,343 913 (2,532) (2,785)
Goodwill – 2,514 1,539 – – 4,053
Total assets 313,553 186,423 212,647 95,469 3,523 811,615
Total liabilities 55,394 8,253 38,462 4,887 212,360 319,356
Capital expenditures 5,482 61 2,413 123 – 8,079
Three months ended June 30, 2021 Canada United States Australia Other Total
Revenue $ 42,548 $ 22,894 $ 19,434 $ – $ 84,876
Non-current assets (3) 395,471 142,563 64,416 – 602,450
As at and for the three months endedJune 30, 2020
ContractDrilling
Services
Rentals andTransportation
Services
Compressionand Process
ServicesWell
Servicing Corporate (1) Total
Revenue $ 14,170 $ 4,782 $ 30,212 $ 21,606 $ – $ 70,770
Cost of services 11,674 3,159 22,910 14,740 – 52,483
Selling, general and administration 1,297 1,141 1,413 1,121 784 5,756
Other expense – – – – 536 536
Share-based compensation – – – – 264 264
Depreciation (2) 36,689 5,882 2,378 3,760 183 48,892
Operating income (loss) (35,490) (5,400) 3,511 1,985 (1,767) (37,161)
Gain (loss) on sale of property, plant and equipment 665 383 (3) (6) 116 1,155
Finance costs (36) (19) (99) (9) (2,355) (2,518)
Net income (loss) before income taxes (34,861) (5,036) 3,409 1,970 (4,006) (38,524)
Goodwill – 2,514 1,539 – – 4,053
Total assets 334,273 215,558 227,113 107,687 14,309 898,940
Total liabilities 59,669 15,474 35,754 5,210 258,854 374,961
Capital expenditures 1,158 319 6,023 436 8 7,944
Three months ended June 30, 2020 Canada United States Australia Other Total
Revenue $ 24,765 $ 14,542 $ 31,412 $ 51 $ 70,770
Non-current assets (3) 448,723 170,282 66,630 – 685,635
(1) Corporate includes the Company’s corporate activities and obligations pursuant to long-term credit facilities.
(2) Effective April 1, 2020 the Company changed certain estimates relating to the useful life and residual value of equipment in the Contract Drilling Services segment. See note 10 to the 2020 Financial Statements for further details.
(3) Includes property, plant and equipment, lease asset (excluding current portion) and goodwill.
T O T A L E N E R G Y S E R V I C E S I N C .
N O T E S T O T H E C O N S O L I D AT E D F I N A N C I A L S TAT E M E N T S
As at and for the six months ended June 30, 2021 and 2020
Unaudited (tabular amounts in thousands of Canadian dollars)
29
F O C U S • D I S C I P L I N E • G R O W T H

As at and for the six months endedJune 30, 2021
ContractDrilling
Services
Rentals andTransportation
Services
Compressionand Process
ServicesWell
Servicing Corporate (1) Total
Revenue $ 54,311 $ 13,788 $ 67,813 $ 42,154 $ – $ 178,066
Cost of services 41,270 7,701 55,156 30,053 – 134,180
Selling, general and administration 2,345 2,528 2,624 2,329 2,782 12,608
Other income – – – – (2,180) (2,180)
Share-based compensation – – – – 390 390
Depreciation (2) 19,326 10,560 4,672 7,601 417 42,576
Operating income (loss) (8,630) (7,001) 5,361 2,171 (1,409) (9,508)
Gain on sale of property, plant and equipment 280 1,731 1,224 47 83 3,365
Finance costs (9) (46) (152) (11) (3,361) (3,579)
Net income (loss) before income taxes (8,359) (5,316) 6,433 2,207 (4,687) (9,722)
Goodwill – 2,514 1,539 – – 4,053
Total assets 313,553 186,423 212,647 95,469 3,523 811,615
Total liabilities 55,394 8,253 38,462 4,887 212,360 319,356
Capital expenditures 9,739 280 2,581 553 – 13,153
Six months ended June 30, 2021 Canada United States Australia Other Total
Revenue $ 102,293 $ 41,203 $ 34,568 $ 2 $ 178,066
Non-current assets (3) 395,471 142,563 64,416 – 602,450
As at and for the six months endedJune 30, 2020
ContractDrilling
Services
Rentals andTransportation
Services
Compressionand Process
ServicesWell
Servicing Corporate (1) Total
Revenue $ 57,195 $ 21,615 $ 70,956 $ 55,272 $ – $ 205,038
Cost of services 44,131 13,776 56,321 38,938 – 153,166
Selling, general and administration 3,738 3,644 3,629 2,848 2,482 16,341
Other income – – – – (7,392) (7,392)
Share-based compensation – – – – 669 669
Depreciation (2) 44,525 12,033 4,671 7,290 367 68,886
Operating income (loss) (35,199) (7,838) 6,335 6,196 3,874 (26,632)
Gain on sale of property, plant and equipment 756 536 110 4 129 1,535
Finance costs (78) (42) (197) (18) (5,622) (5,957)
Net income (loss) before income taxes (34,521) (7,344) 6,248 6,182 (1,619) (31,054)
Goodwill – 2,514 1,539 – – 4,053
Total assets 334,273 215,558 227,113 107,687 14,309 898,940
Total liabilities 59,669 15,474 35,754 5,210 258,854 374,961
Capital expenditures 2,019 842 6,079 1,238 12 10,190
Six months ended June 30, 2020 Canada United States Australia Other Total
Revenue $ 96,205 $ 47,161 $ 61,619 $ 53 $ 205,038
Non-current assets (3) 448,723 170,282 66,630 – 685,635
(1) Corporate includes the Company’s corporate activities and obligations pursuant to long-term credit facilities.
(2) Effective April 1, 2020 the Company changed certain estimates relating to the useful life and residual value of equipment in the Contract Drilling Services segment. See note 10 to the 2020 Financial Statements for further details.
(3) Includes property, plant and equipment, lease asset (excluding current portion) and goodwill.
T O T A L E N E R G Y S E R V I C E S I N C .
N O T E S T O T H E C O N S O L I D AT E D F I N A N C I A L S TAT E M E N T S
As at and for the six months ended June 30, 2021 and 2020
Unaudited (tabular amounts in thousands of Canadian dollars)
3 0
2 0 2 1 S E C O N D Q U A R T E R R E P O R T

4. Long-term Debt
At June 30, 2021 the Company’s long-term debt consisted of the following:
June 30, 2021
Interest rate Principal Amount
Credit Facility 2.60% $ 142,000
Mortgage loan (2025 maturity) 3.10% 47,856
Mortgage loan (2041 maturity) 3.05% 13,938
$ 203,794
Less current portion 2,576
$ 201,218
At June 30, 2021 amounts owing under the Credit Facility were denominated in Canadian dollars.
On June 19, 2017 the Company entered into a three-year $225 million revolving syndicated credit facility (the “Credit Facility”). On April 25, 2018 the Credit Facility was increased by $65 million to $290 million. On November 10, 2020, at the request of the Company the Credit Facility was reduced to $250 million and the maturity date extended to November 10, 2023. The Company has the option to increase such facility by $75 million subject to certain terms and conditions, including the agreement of the lenders to increase their commitments. The Credit Facility includes a Canadian $18.0 million operating line, an Australian $2.0 million operating line and a Canadian $230.0 million revolving facility. The Credit Facility bears interest at the banks’ Canadian prime rate plus 0.25% to 2.75%, bankers’ acceptance, letter of credit, LIBOR or BBSY advances plus a 1.5% to 4.0% stamping fee. The applicable interest rate within such ranges is dependent on certain financial ratios of the Company. A standby fee ranging from 0.25% to 0.8% per annum is paid quarterly on the unused portion of the facility depending on certain financial ratios of the Company. At June 30, 2021, the applicable interest rate on amounts drawn on the Credit Facility was 2.60% and the standby rate was 0.44%. Letters of credit (“LOC”) of $0.4 million were outstanding at June 30, 2021 which reduces the amount of credit available under the Credit Facility by an equivalent amount.
In August of 2018 a U.S. $20 million letter of credit facility was established (the “LOC Facility”). LOCs issued pursuant to the LOC Facility do not reduce availability under the Credit Facility. In April of 2020 this facility was reduced at the request of the Company to U.S. $10 million. At June 30, 2021 $3.4 million Canadian dollars of LOCs were outstanding under the LOC Facility (December 31, 2020: $3.7 million).
In addition to the Credit Facility, a subsidiary of the Company has established a $5.0 million revolving operating credit facility with a member of the Credit Facility lenders’ syndicate. At June 30, 2021 this facility was undrawn and fully available.
The Company’s ability to access the Credit Facility is dependent, among other conditions, on compliance with the following financial ratios, the definitions and thresholds for which are further described below:
June 30, 2021 Threshold
Twelve-month trailing Bank EBITDA to interest expense 11.93 minimum 3.00
Total Senior Debt to twelve-month trailing Bank EBITDA 1.87 maximum 3.00
Readers are cautioned that the ratios described above do not have standardized meanings under IFRS as the computation of these ratios excludes amounts from certain non-guarantor subsidiaries and limited partnerships partially owned by the Company. Key definitions for the purpose of calculating the Company’s financial debt covenants are as follows:
T O T A L E N E R G Y S E R V I C E S I N C .
N O T E S T O T H E C O N S O L I D AT E D F I N A N C I A L S TAT E M E N T S
As at and for the six months ended June 30, 2021 and 2020
Unaudited (tabular amounts in thousands of Canadian dollars)
31
F O C U S • D I S C I P L I N E • G R O W T H

• Bank EBITDA is determined (on a 12-month trailing basis) as earnings before finance expenses, income taxes, depreciation, share-based compensation and certain non-recurring and non-cash income and expenses as defined in the credit agreement and excludes amounts from certain non-guarantor subsidiaries and the limited partnerships partially owned by the Company.
• Senior Debt is determined as total long-term debt (including the current portions thereof but excluding the mortgage loans and certain other obligations identified in the credit agreement) minus cash on hand.
The Credit Facility is secured by a general security agreement over all the present and future property of the Company and its subsidiaries. The Company was in compliance with all of its Credit Facility covenants at June 30, 2021.
Mortgage Loan (2025 maturity) is a loan maturing on April 29, 2025 that is amortized over 20 years with blended monthly principal and interest payments of approximately $279,800. At maturity, approximately $40.2 million of principal will become due and payable assuming only regular monthly payments are made. This loan bears interest at a fixed rate of 3.10% and is secured by certain of the Company s̀ real estate. This loan was taken to repay a $40.2 million term loan that matured on April 29, 2020 and to repay $9.6 million owing under the Credit Facility.
Mortgage Loan (2041 maturity) is a loan maturing on December 31, 2041 and bears interest at a floating rate that was 3.05% at June 30, 2021. This loan is secured by certain of the Company’s real estate.
At June 30, 2021 the Company was in compliance with all debt covenants.
5. Share Capital
(a) Common Share Capital
Common shares of Total Energy Services Inc.
(i) Authorized:
Unlimited number of common voting shares, without nominal or par value.Unlimited number of preferred shares.
(ii) Common shares issued:
Number of shares(thousands) Amount
Balance, December 31, 2019 45,150 $ 284,510
Repurchased and cancelled (69) (433)
Balance, December 31, 2020 45,081 $ 284,077
Repurchased and cancelled (481) (3,033)
Repurchased not cancelled – (215)
Balance, June 30, 2021 44,600 $ 280,829
During the six months ended June 30, 2021, 529,100 shares (June 30, 2020: 68,700) were repurchased under the Company’s normal course issuer bid at an average price of $4.26 (June 30, 2020: $6.21) per share including commissions and 481,300 shares were cancelled. Subsequent to June 30, 2021 47,800 shares were cancelled.
T O T A L E N E R G Y S E R V I C E S I N C .
N O T E S T O T H E C O N S O L I D AT E D F I N A N C I A L S TAT E M E N T S
As at and for the six months ended June 30, 2021 and 2020
Unaudited (tabular amounts in thousands of Canadian dollars)
32
2 0 2 1 S E C O N D Q U A R T E R R E P O R T

(b) Per Share Amounts
Basic and diluted earnings per share have been calculated based on the weighted average number of common shares outstanding as outlined below:
Three months endedJune 30
Six months endedJune 30
2021 2020 2021 2020
Net loss for the period attributable to shareholders $ (2,108) $ (28,765) $ (5,687) $ (24,093)
Weighted average number of shares outstanding – basic 44,830 45,081 44,950 45,084
Loss per share – basic $ (0.05) $ (0.64) $ (0.13) $ (0.53)
Net loss for the period attributable to shareholders $ (2,108) $ (28,765) $ (5,687) $ (24,093)
Weighted average number of shares outstanding – basic 44,830 45,081 44,950 45,084
Share option dilution 236 – 208 –
Weighted average number of shares outstanding – diluted 45,066 45,081 45,158 45,084
Loss per share – diluted $ (0.05) $ (0.64) $ (0.13) $ (0.53)
For the three and six months ended June 30, 2021, 2,430,000 share options (June 30, 2020: 3,780,001 options) were excluded from the diluted weighted average number of common shares calculation as their effect would have been anti-dilutive. The average market value of the Company’s shares for purposes of calculating the dilutive effect of share options was based on quoted market prices for the period during which the options were outstanding.
6. Share-Based Compensation Plan
Share option transactions during 2021 and 2020 were as follows:
Weighted averageexercise price Number of Options
Balance, December 31, 2019 $ 12.35 3,935,000
Granted 2.31 650,000
Forfeited 11.06 (204,999)
Expired 13.78 (1,355,001)
Balance, December 31, 2020 $ 9.65 3,025,000
Granted 3.50 55,000
Balance, June 30, 2021 $ 9.54 3,080,000
A total of 1,995,002 outstanding options were exercisable at June 30, 2021 at a weighted average price of $11.86 per option.
The Company uses the Black-Scholes option-pricing model to determine the estimated fair value of the share options granted. The average per share fair value of the options granted during 2021 is $1.15 per option (2020: $0.64 per option) using the following assumptions:
June 30, 2021 December 31, 2020
Expected volatility 41.26% - 44.38% 38.79% - 44.38%
Risk free interest rate 0.19% - 0.41% 0.30% - 0.41%
Forfeitures 12% 14%
Expected life (years) 3 to 5 years 3 to 5 years
T O T A L E N E R G Y S E R V I C E S I N C .
N O T E S T O T H E C O N S O L I D AT E D F I N A N C I A L S TAT E M E N T S
As at and for the six months ended June 30, 2021 and 2020
Unaudited (tabular amounts in thousands of Canadian dollars)
33
F O C U S • D I S C I P L I N E • G R O W T H

The share options issued during 2019, 2020 and 2021 vest 1/3 on the first, second and third anniversary from the grant date and expire five years from the date of grant. The outstanding options expire on various dates ranging from June 27, 2022 to January 11, 2026.
7. Government grants
In response to the COVID-19 pandemic, various governments have established programs to assist companies through this challenging period. The Company has determined that it qualifies for certain programs and recognizes such government grants when there is a reasonable assurance the grant will be received. For the three and six months ended June 30, 2021 the Company recognized $8.1 million and $14.0 million, respectively, under various COVID-19 relief programs in Canada, the United States and Australia. These funds have been recognized as a reduction of operating and administrative expenses by $7.3 million and $0.8 million for the three months and $12.5 million and $1.5 million for the six months ended June 30, 2021, respectively. For the three and six months ended June 30, 2020 the Company recognized $4.5 million under various COVID-19 relief programs. The funds were recognized as a reduction to operating and administrative expenses by $3.6 million and $0.9 million, respectively.
8. Financial Instruments
The Company’s financial instruments as at June 30, 2021 include cash and cash equivalents, accounts receivable, lease asset, accounts payable and accrued liabilities, lease liabilities and long-term debt. The fair value of cash and cash equivalents, accounts receivable and accounts payable and accrued liabilities approximate their carrying amounts due to their short terms to maturity. Lease liabilities are measured at amortized cost using the effective interest rate method. Under this method, finance charges are applied to accrete the lease liability to the present value of future lease payments.
The discounted future cash repayments of the Company s̀ mortgage loan (maturity 2025) are calculated using prevailing market rates of a similar debt instrument as at the reporting date. The net present value of future cash repayments of this mortgage loan and related interest at the prevailing market rate of 3.67% for a similar debt instrument at June 30, 2021 was $47.0 million (December 31, 2020: market rate of 3.08%, $48.8 million). The carrying value and Company s̀ liability with respect to the mortgage loan is $47.9 million.
9. Contingencies
In August of 2015 the Company was notified by the Canada Revenue Agency (the “CRA”) that certain of the Company’s income tax filings related to its conversion from an income trust to a corporation in 2009 were being re-assessed. Specifically, the CRA increased the Company’s taxable income by $56.1 million and denied $1.7 million of investment tax credits claimed (the “Reassessment”). The Reassessment is based entirely on the CRA’s proposed application of the general anti-avoidance rule (“GAAR”) and gives rise to approximately $14.1 million of federal income tax payable. In September 2015 the Company paid one half of the reassessed amount, or $7.1 million, on account of the Reassessment as required pending appeal. On November 4, 2015, related provincial income tax reassessments totaling $5.6 million (including interest and penalties) were received.
The Company has received both legal and tax advice relating to its conversion from an income trust to a corporation indicating that its income tax filing position is strong. As such, the Company has filed notices of objection in response to the Reassessment and intends to vigorously defend its filing position and seek reimbursement from the CRA for the costs arising from having to defend such Reassessment to the fullest extent possible. The matter is expected to go to trial in 2022. Management believes that it will be successful in defending its tax filing position, and as such, the Company has not recognized any provision for the Reassessment at June 30, 2021. The $7.1 million paid on account of the Reassessment has been recorded as income tax receivable on the basis management believes it will be successful in
T O T A L E N E R G Y S E R V I C E S I N C .
N O T E S T O T H E C O N S O L I D AT E D F I N A N C I A L S TAT E M E N T S
As at and for the six months ended June 30, 2021 and 2020
Unaudited (tabular amounts in thousands of Canadian dollars)
3 4
2 0 2 1 S E C O N D Q U A R T E R R E P O R T

defending the Company s̀ filing position. In the event the Company is not successful, an additional $16.8 million of cash may be owing and $23.8 million of income tax expense would be recognized.
In April of 2017 one of the Company’s subsidiaries, Savanna Energy Services Corp. (“Savanna”), received a statement of claim from Western Energy Services Corp. (“Western”) for payment of a termination fee in the amount of $20 million pursuant to an arrangement agreement between Savanna and Western dated March 8, 2017, as amended on March 14, 2017 (the “Arrangement Agreement”). Savanna terminated the Arrangement Agreement on March 28, 2017 following the acquisition by Total of over 50% of the outstanding common shares of Savanna in accordance with the terms and conditions of the Arrangement Agreement. Western is claiming Savanna was not entitled to terminate the Arrangement Agreement and therefore breached the Arrangement
Agreement. Savanna has filed a statement of defense and has received legal advice that Western’s claim is without merit. On January 28, 2021, a Master of the Court of Queen’s Bench of Alberta summarily dismissed Western’s claim and awarded costs to Savanna. Western has appealed this decision.
In November of 2017 the Company received a Statement of Claim filed in the Alberta Court of Queen’s Bench by Her Majesty the Queen in Right of Alberta, by its agent, Alberta Investment Management Corporation (“AIMCo”) against the Company and Savanna. In early 2020 AIMCo amended its claim to remove the Company as a defendant. AIMCo’s claim relates to Savanna’s refusal to pay a $6 million change of control penalty (the “Additional Penalty”) to AIMCo. The Company and Savanna have received legal advice that AIMCo’s claim for the Additional Penalty is not enforceable and have filed a statement of defense. Savanna has also filed a third party claim against its former directors that seeks indemnity in the event that AIMCo is successful in its claim against Savanna. Following the completion of discoveries, Savanna has determined to file a counterclaim against AIMCo and certain former directors of Savanna for $7.3 million.
On March 11, 2020 the COVID-19 outbreak was declared a pandemic by the World Health Organization. The situation is dynamic and the duration, nature and magnitude of the impact on the economy, commodity prices and the Company’s business is not known at this time. Such impact could include a material adverse impact on the Company’s financial liquidity position, impairments in the value of long-lived assets, future material decreases in revenue and the profitability of ongoing operations.
T O T A L E N E R G Y S E R V I C E S I N C .
N O T E S T O T H E C O N S O L I D AT E D F I N A N C I A L S TAT E M E N T S
As at and for the six months ended June 30, 2021 and 2020
Unaudited (tabular amounts in thousands of Canadian dollars)
35
F O C U S • D I S C I P L I N E • G R O W T H
BOARD OF DIRECTORS
Bruce Pachkowski 2, 3
Chairman of the Board
Daniel HalykPresident and Chief Executive Officer
George Chow 1
Glenn Dagenais 2, 3
Greg Melchin 1, 2
Ken Mullen 1, 3
1 Member of the Compensation Committee2 Member of the Audit Committee3 Member of the Corporate Governance and Nominating Committee
MANAGEMENT TEAM
Daniel HalykPresident and Chief Executive Officer
Cam DanylukVice President, Legal, General Counsel and Corporate Secretary
Yuliya GorbachVice President, Finance and Chief Financial Officer
William KosichVice President, Drilling Services
Brad MacsonVice President, Operations
Ashley TingCorporate Controller
HEAD OFFICE
Suite 1000, 734 – 7 Avenue SW T2P 3P8
Calgary, Alberta T2P 3H2
Telephone: (403) 216-3939
Toll Free: (877) 818-6825
Fax: (403) 234-8731
Website: www.totalenergy.ca
Email: [email protected]
AUDITOR
MNP LLP
Calgary, Alberta
TRUSTEE, REGISTRAR AND TRANSFER AGENT
Computershare
Calgary, Alberta
LEGAL COUNSEL
Bennett Jones, LLP
Calgary, Alberta
BANKERS
HSBC
The Toronto Dominion Bank
The Bank of Nova Scotia
Alberta Treasury Branches
Export Development Corp.
STOCK EXCHANGE LISTING
Toronto Stock Exchange
Common Shares: TOT
3 6
2 0 2 1 S E C O N D Q U A R T E R R E P O R T
T O T A L E N E R G Y S E R V I C E S I N C .
CO R P O R AT E I N F O R M AT I O N

Savanna Drilling
S
CANADIAN LOCATIONS
Brooks • Calgary • Clairmont • Dawson Creek • Drumheller • Edson • Fort St. John
Fox Creek • Grande Prairie • Lac La Biche • Leduc • Lloydminster • Medicine Hat • Red Deer
Red Earth • Rocky Mountain House • Slave Lake • Swift Current • Weyburn/Midale
U.S. LOCATIONS
Denver, CO • Greeley, CO • Dickinson, ND • Watford City, ND
Casper, WY • Gillette, WY • Weirton, WV • Odessa, TX • Williamsport, PA
AUSTRALIAN LOCATIONS
Toowoomba, QLD
Total Energy, Bidell, Bidell Gas Compression, NOMAD, Opsco Process Corp,
Savanna, and the respective logos are registered trademarks of Total Energy Services Inc.
Savanna Well Servicing
S