FMW 17 point plan to realign City of Detroit & Regional Government Operations 3-17-2013
33
Foster McCollum White & Associates Simplifying Solutions: Business Consulting Change Management Lobbying Political Consulting City of Detroit Fiscal & Operational Reorganizational plan and Regional Governance Solution model
-
Upload
eric-foster -
Category
Documents
-
view
42 -
download
0
Transcript of FMW 17 point plan to realign City of Detroit & Regional Government Operations 3-17-2013

VOLUME I
Foster McCollum White & Associates
Simplifying Solutions:
Business Consulting Change Management
Lobbying Political Consulting
City of Detroit Fiscal & Operational Reorganizational plan and Regional Governance
Solution model

2 | P a g e
Table of Contents
1 Overview of Foster McCollum White & Associates Plan ............................................ 3
2 17 Point Action Plan to re-align Detroit’s Fiscal and Operational Structure………….7

3 | P a g e
Foster McCollum White & Associates Proposed and Updated Reorganization Plan for Detroit and Regional
Government Shared Services in Southeastern Michigan
On behalf of Foster McCollum White & Associates, it is an honor to present our proposed plan for bringing Detroit from its fiscal crisis and
aligning regional services in a way that actually benefits the Southeast Michigan region. Our strategic organizational development division spent
countless hours reading and reviewing numerous fiscal and operational documents from the City of Detroit and various reports that have been
developed by stakeholder organizations of the past 20 years. Our review was more extensive then the documents we highlighted, with some of our
data sets extending to the Cavanagh mayoral regime. We believe that it was important to look at all aspects of the problems facing Detroit and the
region, so we could have a proper outline to recommend solutions. We have produced this executive summary of a comprehensive 17 point
strategy to achieve the following objectives:
1. Accept the reality of the fiscal and operational crisis that exists today.
2. Set the City of Detroit on a path for fiscal solvency within 18 months.
3. Reduce the long term debt obligation load for the City of Detroit by a minimum 50%
4. Reduce City of Detroit governmental operations to essential agencies that impact quality of life or the buying decision of existing and
potential customers (residents and businesses).
5. Create a model for regional approaches to managing large scale governmental infrastructure organizations.
6. Create a model for shared service solutions to maintain and improve the quality of public safety operations, parks management, tax
collection and information technology innovations for the Southeastern Michigan region.
Synopsis of situation:
The City of Detroit Government Organization is facing a significant financial and service crisis. From the 1964-65 fiscal year to the 2011-2012
fiscal year, spanning 48 years, the City of Detroit has operated in a continual state of deficit spending. The majority (30 years) of the past 48 years
Detroit ended with a general fund budget deficit, totaling an accumulated amount of ($2,930,972,096) in deficit spending. When added to the
Enterprise Agencies ($1,026,837,387 gross budget deficit) and Component Unit Agencies ($335,601,185 gross budget deficit) deficit over the
past 11 fiscal years, the total gross accumulated deficit has equaled ($4,293,410,668). During the same time period, Detroit has also closed 18
years with a budget surplus, totaling an accumulated amount of $269,938,275 in surplus revenues. When added to the Enterprise Agencies
($283,596,975 gross net proceeds-surplus) and Component Unit Agencies ($317,892,895 gross net proceeds-surplus) over the past 12 years,
the total net accumulated surplus during the past 48 years has equaled $871,428,145. The total net combined net accumulated deficit equals
($3,421,982,523), which equals an average annual surplus of ($74,390,924.41). To avoid bankruptcy or the elimination of municipal
independence, Detroit has accumulated massive amounts of debt obligation in an effort to maintain and deliver the wide range of city services. The
level of city agencies funded has only slightly decreased from the 1950’s, when Detroit had almost 2 million people living within the 137 square
mile city. Detroit now has a little under 700,000 citizens to service, but the price for stagnant efforts to reduce the agency burden of government is
devastating high. Detroit’s debt and long term obligation burden now equals $22.7 billion dollars, which is equal to $32,193.96 per person (per
2011 census population estimates. The median Detroit household income is $25,193 per household. If two people (parent and child) reside in one
household, their combined City of Detroit debt burden is equal to $64,387.92. If the parent makes the median income of $25,193, their share of
4 | P a g e
City debt burden is equal to $39,194.92 negative City of Detroit debt burden, or 255.58% above their median household income. The tax
burden that the household in our example pays will not allow them to create a net positive contribution towards paying down the debt obligation
while providing existing services. Detroit’s debt is an impediment to neighborhood growth and stabilization.
The impact of the fiscal crisis engulfing Detroit has spread into all other aspects of life in Detroit and southeastern Michigan. The share of
employment of Detroit residents within the southeastern Michigan region fell from 23.4% of the regions total population in 1980 to 15.3% of the
regions total population. The middle class and working class residents who greeted the 1970’s (735,104 employed Detroit Adults per 1970
census data) has crashed (203,993 employed adults as of 2011 ACS census estimates) and left the city of Detroit. That is a drop of 72.25% or
531,111 persons during that time. The share of employment of Detroit residents within the southeastern Michigan region fell from 37.9% of the
regions total population in 1970 to 12.9% of the regions total population. Only 37.38% of Detroit’s eligible working age population is
currently employed. Detroit’s purchasing power through property tax valuation has declined at an alarming rate over the last 44 fiscal years. In
1968, Detroit’s state equalized taxable property value was equal to $4,807,697,730. By 2011, Detroit’s state equalized taxable property value was
equal to $9,111,881,179. During the past 44 years, Detroit’s state equalized taxable property value rose by 89.53%, with a net gross value increase
of $4,304,183,449. However, the purchasing power of Detroit’s state equalized taxable property value has decreased during the same 44 year
period. Based on state equalized taxable property value in 1967 dollars, Detroit’s state equalized taxable property value is only equal to
$1,385,837,442, a decrease of $3,421,860,288 or 71.17% over the 44 year period. To simplify the impact, if Detroit’s state equalized taxable
property value was equal to $1 of potential purchasing power in 1968, it is now equal to $0.2883 of potential purchasing power in 2011, even
though Detroit’s state equalized taxable property value rose from $1 in value to $1.8953 by 2011. Comparably, the rest of Southeastern
Michigan’s state equalized taxable property valuation has risen at a pace to match the growing cost of Government. The following chart compares
Detroit to Wayne, Oakland and Macomb County and the SEMCOG region as a whole. The Detroit portion of the Wayne County and SEMCOG
taxable valuation is not included in those numbers.
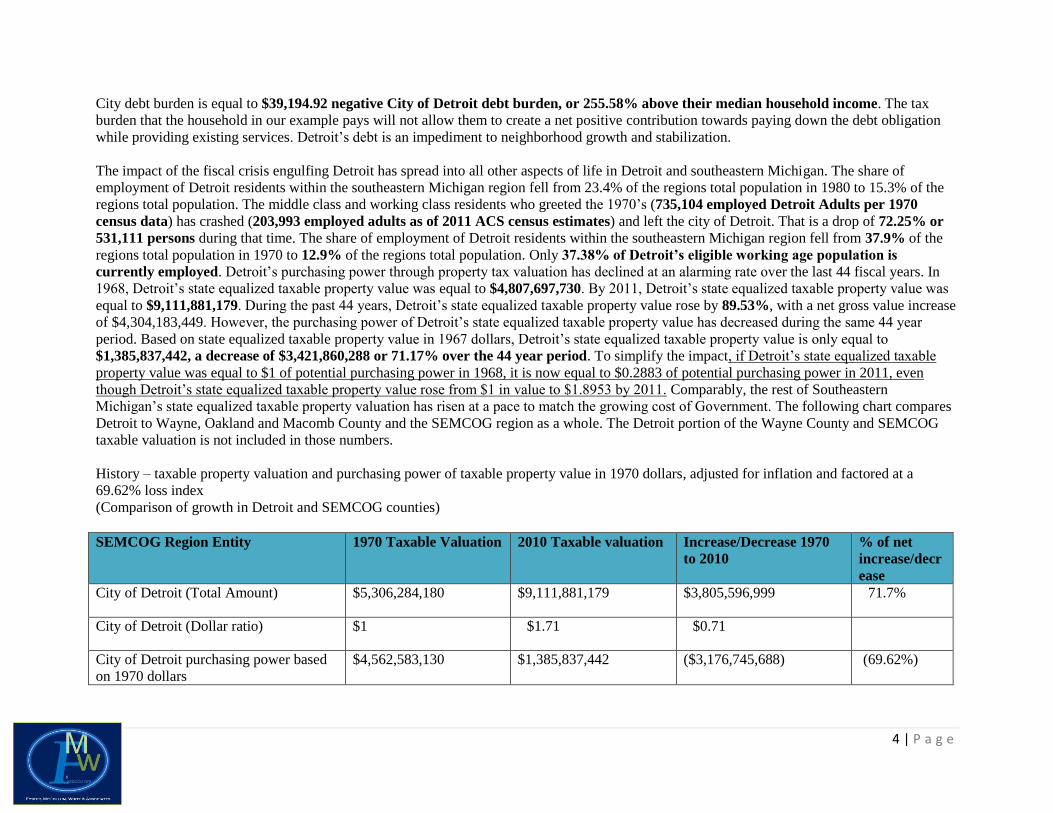
History – taxable property valuation and purchasing power of taxable property value in 1970 dollars, adjusted for inflation and factored at a
69.62% loss index
(Comparison of growth in Detroit and SEMCOG counties)
SEMCOG Region Entity 1970 Taxable Valuation 2010 Taxable valuation Increase/Decrease 1970
to 2010
% of net
increase/decr
ease
City of Detroit (Total Amount) $5,306,284,180 $9,111,881,179 $3,805,596,999 71.7%
City of Detroit (Dollar ratio) $1 $1.71 $0.71
City of Detroit purchasing power based
on 1970 dollars
$4,562,583,130 $1,385,837,442 ($3,176,745,688) (69.62%)
5 | P a g e
City of Detroit purchasing power based
on 1970 dollars (dollar ratio)
$1 $0.3038 $(0.6962) Decline
Wayne County (Total Amount) $6,202,954,224 $37,470,600,900 $31,267,646,676 504.1%
Wayne County (Dollar ratio) $1 $5.041 $4.041
Wayne County purchasing power based
on 1970 dollars
$6,202,954,224 $11,383,568,553 $5,180,614,329 83.52%
Wayne County purchasing power based
on 1970 dollars (dollar ratio)
$1 $1.8352 $0.8352 Growth
Oakland County (Total Amount) $4,738,990,509 $55,081,707,586 $50,342,717,077 1062.3%
Oakland County (Dollar ratio) $1 $10.623 $9.623
Oakland County purchasing power based
on 1970 dollars
$4,738,990,509 $16,733,822,765 $11,994,832,256 253.11%
Oakland County purchasing power based
on 1970 dollars (dollar ratio)
$1 $2.5311 $1.5311 Growth
Macomb County (Total Amount) $2,747,706,064 $27,895,119,373 $25,147,413,309 915.2%
Macomb County (Dollar ratio) $1 $9.152 $8.152
Macomb County purchasing power
based on 1970 dollars
$2,747,706,064 $8,474,537,266 $5,726,831,202 208.42%
Macomb County purchasing power
based on 1970 dollars (dollar ratio)
$1 $2.0842 $1.0842 Growth
SEMCOG Region (Total Amount) $16,271,457,261 $154,576,470,294 $138,305,013,033 849.99%
SEMCOG Region (Dollar ratio) $1 $84.899 $83.899
SEMCOG Region purchasing power
based on 1970 dollars
$16,271,457,261 $46,960,331,675 $30,688,874,414 188.61%
SEMCOG Region purchasing power
based on 1970 dollars (dollar ratio)
$1 $1.8861 $0.8861 Growth
Source: State of Michigan Department of Treasury, State tax Commission – Taxable Valuation

6 | P a g e
Detroit’s property tax growth has not been sustainable to meet the debt obligations or funding decisions of administrations dating to the Roman
Gribbs administration. Detroit’s ability to grow economically to meet its operational mandates has been further weakening by the lack of growth in
residential housing development during the past 40 years. A SEMCOG review of housing statistics from 1969 to 2009 shows the following:
Total Housing Units – Detroit has 375,096 housing units or dwellings, which equals 45.4% of the 826,145 housing units in Wayne County
and 19.2% of the 1,951,994 housing units in the 7 county SEMCOG region.
Housing demolitions – Detroit has demolished 177,700 housing units during the 40 year time frame, which equals 90.5% of the 196,339
housing demolitions in Wayne County and 77.6% of the 229,041 housing demolitions in the 7 county SEMCOG region.
New housing construction – Detroit has constructed 26,608 housing units during the 40 year time frame for this study. That is only 14.7%
of the 180,846 newly constructed housing units in Wayne County and a paltry 3.3% of the 799,862 newly constructed housing units in the
7 county SEMCOG region.
The challenges that Detroit is facing are similarly being faced currently by various Wayne County and other Metropolitan Detroit communities.
Their struggle with declining tax revenues, expanding debt and legacy obligations and efforts to maintain core municipal services is creating a
growing number of financial emergencies. Communities like Allen Park, Harper Woods, Plymouth Township, Mt. Clemens, Wayne, Westland and
Pontiac are all reducing their level of service and merge operational units with neighboring communities.
We highlight this and the aforementioned indebtedness analysis to form the basis for our hypothesis, can the City of Detroit governmental body be
structurally fixed, to improve critical service delivery functions, eliminate the fiscal emergency without incurring additional debt financing and be
a leader in the need to regionalize a growing number of governmental functions across Southeastern Michigan by using its size and scope to
relieve pressure on its smaller neighboring municipalities. Our hypothesis also lead us to consider how Wayne County and other major
communities in Wayne County can become facilitators of regional approaches to eliminating redundant functions while allowing citizens to
maintain ease of access to those streamlined services. It was these questions that allowed our team to study and develop an initial 17 point plan to
solve these problems within the current confines of existing local, county, state and federal revenues with reasonable solutions to procure
additional revenue opportunities. The follow sections outline our proposed solution path. Each action point has additional implementation
strategies to achieve turnaround results within a two year time frame. We hope that our plan will help stimulate the conversations around Michigan
about saving our urban communities and moving logical plans for regional cooperation from concept to implementation.
7 | P a g e
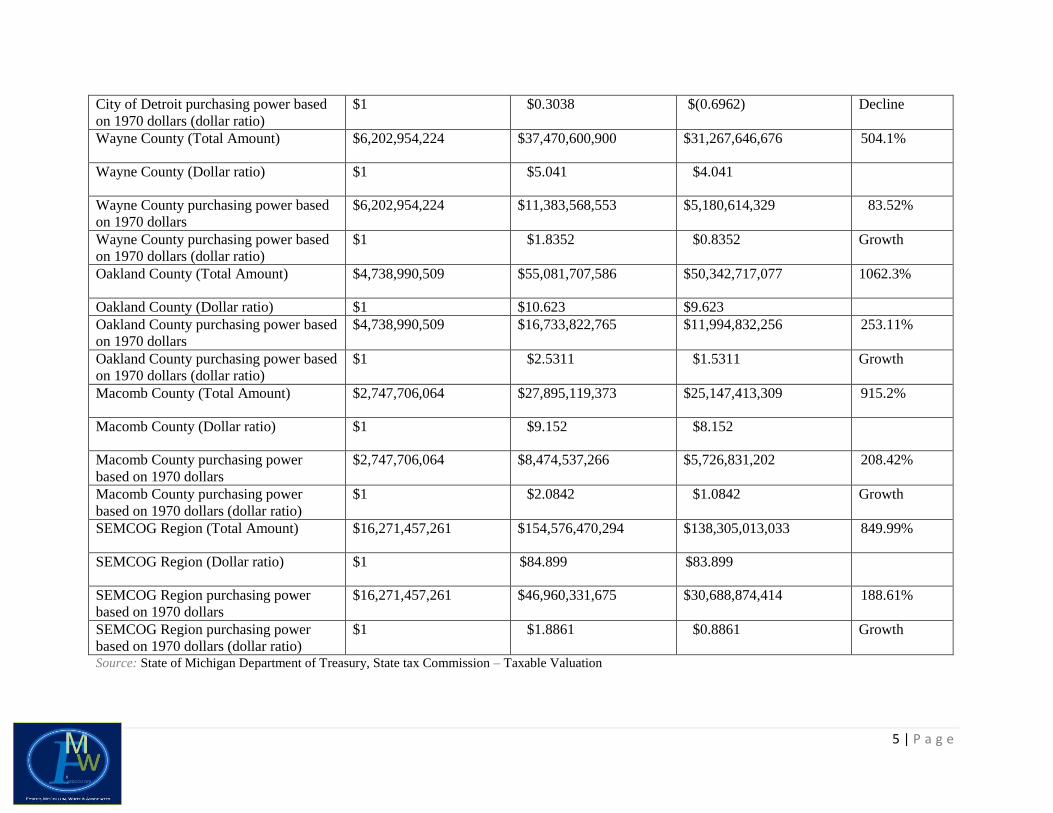
FMW 17 point proposed plan to re-align Detroit’s fiscal and operational structure
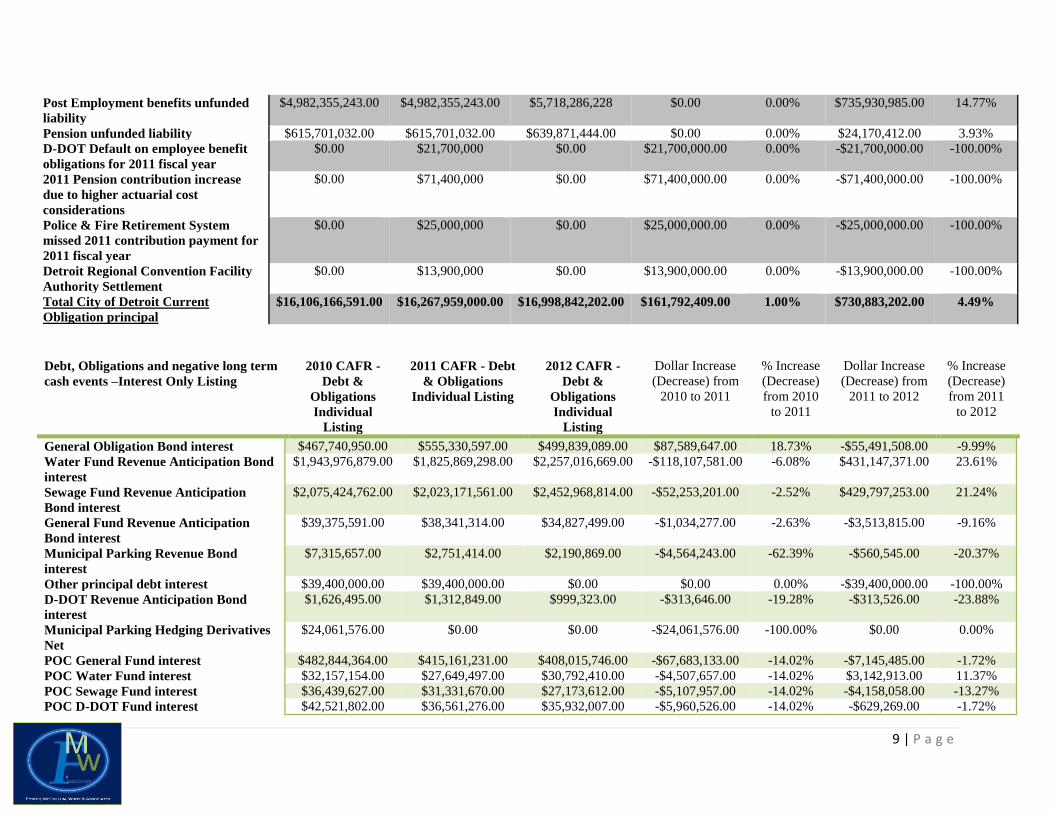
1. Understand and accept the real debt load and deficit situation for the City of Detroit. Detroit has a long term principal and
interest debt bubble. The principal debt and interest relationship for the debt (sources include but not limited to; 1990 through
2012 CAFR, City 2012-2013 Budget, State Fiscal Review 2012 & FAB Reviews) is as follows:
Three year rolling assessment – 2010 fiscal year close date to 2012 fiscal year close date Debt, Obligations and negative long
term cash events – Principal Only
Listing
2010 CAFR - Debt
& Obligations
Individual Listing
2011 CAFR - Debt
& Obligations
Individual Listing
2012 CAFR - Debt
& Obligations
Individual Listing
Dollar Increase
(Decrease) from
2010 to 2011
% Increase
(Decrease)
from 2010 to
2011
Dollar Increase
(Decrease) from
2011 to 2012
% Increase
(Decrease)
from 2011
to 2012
General Fund Obligation Bonds $1,010,303,278.00 $1,033,233,278.00 $957,128,278.00 $22,930,000.00 2.27% -$76,105,000.00 -7.37%
Sewage Dept. Revenue Anticipation
Bonds
$2,457,750,000.00 2,396,392,576.00 $2,863,856,075.00 -$61,357,424.00 -2.50% $467,463,499.00 19.51%
Water Dept. Revenue Anticipation
Bonds
$2,230,610,000.00 2,195,495,000.00 $2,556,395,000.00 -$35,115,000.00 -1.57% $360,900,000.00 16.44%
Municipal Parking Dept. Revenue
Anticipation Bonds
$39,105,000.00 11,575,000.00 $10,260,578.00 -$27,530,000.00 -70.40% -$1,314,422.00 -11.36%
General Fund Agencies Revenue
Anticipation Bonds
$166,825,199.00 125,520,622.00 $123,598,217.00 -$41,304,577.00 -24.76% -$1,922,405.00 -1.53%
D-DOT Bonds $2,406,855.00 6,271,722.00 6,271,722.00 $3,864,867.00 160.58% $0.00 0.00%
Detroit Restructuring bond proceeds
debt
$0.00 $137,000,000 $0.00 $137,000,000.00 0.00% -$137,000,000.00 -100.00%
Detroit Public Lighting Authority
Debt Principal Amount (paid for with
City Utility Users tax proceeds and
City pledged other funds if tax doesn't
cover shortfall)
$0.00 $160,000,000 $160,000,000.00 $160,000,000.00 0.00% $0.00 0.00%
Pension Obligation Certificates (Total
for general fund and enterprise
agencies)
$1,468,799,999.00 $1,468,780,000.00 $1,451,905,000.00 -$19,999.00 0.00% -$16,875,000.00 -1.15%
General fund notes payable $89,506,000.00 $88,926,000.00 $89,391,000.00 -$580,000.00 -0.65% $465,000.00 0.52%
General fund loans payable (including
DDA loan to City)
$37,943,608.00 $36,594,622.00 $34,207,217.00 -$1,348,986.00 -3.56% -$2,387,405.00 -6.52%
State of Michigan Drinking Water
Revolving Loan Fund total
outstanding loan balance Sewage
Department
$529,739,187.00 514,431,879.00 $508,236,265.00 -$15,307,308.00 -2.89% -$6,195,614.00 -1.20%

8 | P a g e
State of Michigan Drinking Water
Revolving Loan Fund total
outstanding loan balance Water
Department
$22,087,520.00 23,579,245.00 $22,953,761.00 $1,491,725.00 6.75% -$625,484.00 -2.65%
Hedging Derivatives net additional
debt (general fund and enterprise
agencies combined)
$1,136,007,248.00 $1,137,302,647.00 $800,000,000.00 $1,295,399.00 0.11% -$337,302,647.00 -29.66%
GE Capital Public Finance Inc
Capital Lease (DDOT buses)
remaining balance
$20,339,988.00 $16,588,457 $12,678,358.00 -$3,751,531.00 -18.44% -$3,910,099.00 -23.57%
Sewage Dept. other long term
liabilities
$44,423,977.00 $57,173,111 $67,752,675.00 $12,749,134.00 28.70% $10,579,564.00 18.50%
Water Dept. other long term liabilities $55,351,004.00 $65,601,680 $20,046,811.00 $10,250,676.00 18.52% -$45,554,869.00 -69.44%
DDOT other long term liabilities $75,848,038.00 $86,732,849 $94,550,778.00 $10,884,811.00 14.35% $7,817,929.00 9.01%
Municipal Parking Dept. other long
term liabilities
$1,813,465.00 $11,594,000 $12,083,744.00 $9,780,535.00 539.33% $489,744.00 4.22%
Other Enterprise Agencies long term
liabilities
$334,359 $284,373.00 $334,359.00 #DIV/0! -$49,986.00 -14.95%
General fund accrued liabilities for
pollution, remediation, accrued
compensated absences, worker's
compensation and claims and lawsuits
$282,528,101.00 $254,400,000.00 $210,333,970.00 -$28,128,101.00 -9.96% -$44,066,030.00 -17.32%
Component Agencies Other liabilities $26,370,679.00 $38,556,491 $41,368,205.00 $12,185,812.00 46.21% $2,811,714.00 7.29%
Component Agencies Long Term Debt
Obligations
$229,556,420.00 $211,917,923 $203,702,403.00 -$17,638,497.00 -7.68% -$8,215,520.00 -3.88%
Wayne Count estimated charge-
backs/recoveries payments for
uncollected delinquent taxes
$91,000,000.00 $88,400,000 $84,000,000.00 -$2,600,000.00 -2.86% -$4,400,000.00 -4.98%
Interagency fund balance and activity
(loans and debts owed from
department to department)
$447,000,000.00 $338,831,915.00 $309,464,869.00 -$108,168,085.00 -24.20% -$29,367,046.00 -8.67%
Parking fund annual bond debt
payment requirement payment
shortfall
$0.00 $1,726,266.00 $215,231.00 $1,726,266.00 0.00% -$1,511,035.00 -87.53%
Sewage fund annual bond debt
payment requirement payment
shortfall
$36,348,689.00 $30,943,083.00 $0.00 -$5,405,606.00 -14.87% -$30,943,083.00 -100.00%
Water fund annual bond debt
payment requirement payment
shortfall
$6,446,061.00 $0.00 $0.00 -$6,446,061.00 -100.00% $0.00 0.00%
9 | P a g e
Post Employment benefits unfunded
liability
$4,982,355,243.00 $4,982,355,243.00 $5,718,286,228 $0.00 0.00% $735,930,985.00 14.77%
Pension unfunded liability $615,701,032.00 $615,701,032.00 $639,871,444.00 $0.00 0.00% $24,170,412.00 3.93%
D-DOT Default on employee benefit
obligations for 2011 fiscal year
$0.00 $21,700,000 $0.00 $21,700,000.00 0.00% -$21,700,000.00 -100.00%
2011 Pension contribution increase
due to higher actuarial cost
considerations
$0.00 $71,400,000 $0.00 $71,400,000.00 0.00% -$71,400,000.00 -100.00%
Police & Fire Retirement System
missed 2011 contribution payment for
2011 fiscal year
$0.00 $25,000,000 $0.00 $25,000,000.00 0.00% -$25,000,000.00 -100.00%
Detroit Regional Convention Facility
Authority Settlement
$0.00 $13,900,000 $0.00 $13,900,000.00 0.00% -$13,900,000.00 -100.00%
Total City of Detroit Current
Obligation principal
$16,106,166,591.00 $16,267,959,000.00 $16,998,842,202.00 $161,792,409.00 1.00% $730,883,202.00 4.49%
Debt, Obligations and negative long term
cash events –Interest Only Listing
2010 CAFR -
Debt &
Obligations
Individual
Listing
2011 CAFR - Debt
& Obligations
Individual Listing
2012 CAFR -
Debt &
Obligations
Individual
Listing
Dollar Increase
(Decrease) from
2010 to 2011
% Increase
(Decrease)
from 2010
to 2011
Dollar Increase
(Decrease) from
2011 to 2012
% Increase
(Decrease)
from 2011
to 2012
General Obligation Bond interest $467,740,950.00 $555,330,597.00 $499,839,089.00 $87,589,647.00 18.73% -$55,491,508.00 -9.99%
Water Fund Revenue Anticipation Bond
interest
$1,943,976,879.00 $1,825,869,298.00 $2,257,016,669.00 -$118,107,581.00 -6.08% $431,147,371.00 23.61%
Sewage Fund Revenue Anticipation
Bond interest
$2,075,424,762.00 $2,023,171,561.00 $2,452,968,814.00 -$52,253,201.00 -2.52% $429,797,253.00 21.24%
General Fund Revenue Anticipation
Bond interest
$39,375,591.00 $38,341,314.00 $34,827,499.00 -$1,034,277.00 -2.63% -$3,513,815.00 -9.16%
Municipal Parking Revenue Bond
interest
$7,315,657.00 $2,751,414.00 $2,190,869.00 -$4,564,243.00 -62.39% -$560,545.00 -20.37%
Other principal debt interest $39,400,000.00 $39,400,000.00 $0.00 $0.00 0.00% -$39,400,000.00 -100.00%
D-DOT Revenue Anticipation Bond
interest
$1,626,495.00 $1,312,849.00 $999,323.00 -$313,646.00 -19.28% -$313,526.00 -23.88%
Municipal Parking Hedging Derivatives
Net
$24,061,576.00 $0.00 $0.00 -$24,061,576.00 -100.00% $0.00 0.00%
POC General Fund interest $482,844,364.00 $415,161,231.00 $408,015,746.00 -$67,683,133.00 -14.02% -$7,145,485.00 -1.72%
POC Water Fund interest $32,157,154.00 $27,649,497.00 $30,792,410.00 -$4,507,657.00 -14.02% $3,142,913.00 11.37%
POC Sewage Fund interest $36,439,627.00 $31,331,670.00 $27,173,612.00 -$5,107,957.00 -14.02% -$4,158,058.00 -13.27%
POC D-DOT Fund interest $42,521,802.00 $36,561,276.00 $35,932,007.00 -$5,960,526.00 -14.02% -$629,269.00 -1.72%

10 | P a g e
GE Capital Public Finance Inc Capital
Lease (DDOT buses) interest
$2,406,855.00 $1,594,808.00 $941,308.00 -$812,047.00 -33.74% -$653,500.00 -40.98%
Detroit Public Lighting Authority Debt
Interest (Projected via City analysis)
$0.00 $80,000,000.00 $0.00 $80,000,000.00 0.00% -$80,000,000.00 -100.00%
Total City of Detroit Current Obligation
interest
$5,195,291,712.00 $5,078,475,515.00 $5,750,697,346.00 -$116,816,197.00 -2.25% $672,221,831.00 13.24%
2010 CAFR - Debt
& Obligations
Individual Listing
2011 CAFR - Debt
& Obligations
Individual Listing
2012 CAFR - Debt
& Obligations
Individual Listing
Dollar Increase
(Decrease) from
2010 to 2011
% Increase
(Decrease) from
2010 to 2011
Dollar Increase
(Decrease) from
2011 to 2012
% Increase
(Decrease) from
2011 to 2012
Total City of Detroit
Current Obligation
(Principal & interest) $21,301,458,303.00 $21,346,434,515.00 $22,749,539,548.00 $44,976,212.00 0.21% $1,403,105,033.00 6.57%
Total Detroit Obligation principal & interest per 2011 citizen population (706,640 persons)
Obligation per
city population
2010 CAFR - Debt
& Obligations
Individual Listing
2011 CAFR - Debt
& Obligations
Individual Listing
2012 CAFR - Debt
& Obligations
Individual Listing
Dollar Increase
(Decrease) from
2010 to 2011
% Increase
(Decrease) from
2010 to 2011
Dollar Increase
(Decrease) from
2011 to 2012
% Increase
(Decrease) from
2011 to 2012
Total City of Detroit Current
Obligation (Principal &
interest)
$21,301,458,303.00 $21,346,434,515.00 $22,749,539,548.00 $44,976,212.00 0.21% $1,403,105,033.00 6.57%
Total City of Detroit Current
Obligation (Principal &
interest) - Per person (706,640
persons)
$30,144.71 $30,208.36 $32,193.96 $63.65 0.21% $1,985.60 6.57%

11 | P a g e
Total Detroit Obligation principal & interest per 2012-2013 proposed budget revenue ($2,538,750,778) ratio:
2012 CAFR - Debt & Obligations Individual Listing
Total City of Detroit Current Obligation (Principal & interest) $22,749,539,548.00
Ratio (Projected City of Detroit Revenues to Total Obligations expense) $8.96
Total Detroit Obligation principal & interest per category and percentage of overall obligation amount
2010 CAFR - Debt
& Obligations
Total by Category
2011 CAFR - Debt
& Obligations
Total by Category
2012 CAFR - Debt
& Obligations
Total by Category
Percentage of
Total City of
Detroit obligations
- 2010 fiscal year
Percentage of
Total City of
Detroit obligations
- 2011 fiscal year
Percentage of Total
City of Detroit
obligations - 2012
fiscal year
Total Bond & Loan related debt principal $9,211,423,882.00 $9,351,691,048.00 $9,596,881,471.00 43.24% 43.81% 42.18%
Total Bond & Loan related debt interest $5,195,291,712.00 $5,078,475,515.00 $5,750,697,346.00 24.39% 23.79% 25.28%
Total Bond & Loan related debt principal
and interest combined
$14,406,715,594.00 $14,430,166,563.00 $15,347,578,817.00 67.63% 67.60% 67.46%
2010 CAFR - Debt
& Obligations
Total by Category
2011 CAFR - Debt
& Obligations
Total by Category
2012 CAFR - Debt
& Obligations
Total by Category
Percentage of
Total City of
Detroit obligations
- 2010 fiscal year
Percentage of
Total City of
Detroit obligations
- 2011 fiscal year
Percentage of Total
City of Detroit
obligations - 2012
fiscal year
Total long term obligations (non bond or
employee) related debt principal $715,891,684.00 $726,310,413.00 $650,122,959.00 3.36% 3.40% 2.86%
Total long term obligations (non bond or
employee) related debt interest $0.00 $0.00 $0.00 0.00% 0.00% 0.00%
Total long term obligations (non bond or
employee) related debt principal and
interest combined
$715,891,684.00 $726,310,413.00 $650,122,959.00 3.36% 3.40% 2.86%
2010 CAFR - Debt
& Obligations
Total by Category
2011 CAFR - Debt
& Obligations
Total by Category
2012 CAFR - Debt
& Obligations
Total by Category
Percentage of
Total City of
Detroit obligations
- 2010 fiscal year
Percentage of
Total City of
Detroit obligations
- 2011 fiscal year
Percentage of Total
City of Detroit
obligations - 2012
fiscal year
Total Miscellaneous (non bond or employee)
related debt principal $580,794,750.00 $473,801,264.00 $393,680,100.00 2.73% 2.22% 1.73%
Total Miscellaneous (non bond or employee)
related debt interest $0.00 $0.00 $0.00 0.00% 0.00% 0.00%
Total Miscellaneous (non bond or
employee) related debt principal and
interest combined
$580,794,750.00 $473,801,264.00 $393,680,100.00 2.73% 2.22% 1.73%

12 | P a g e
2010 CAFR - Debt
& Obligations
Total by Category
2011 CAFR - Debt
& Obligations
Total by Category
2012 CAFR - Debt
& Obligations
Total by Category
Percentage of
Total City of
Detroit obligations
- 2010 fiscal year
Percentage of
Total City of
Detroit obligations
- 2011 fiscal year
Percentage of Total
City of Detroit
obligations - 2012
fiscal year
Total Employee & Post Employee expense
related debt principal $5,598,056,275.00 $5,716,156,275.00 $6,358,157,672.00 26.28% 26.78% 27.95%
Total long term obligations (non bond or
employee) related debt interest $0.00 $0.00 $0.00 0.00% 0.00% 0.00%
Total long term obligations (non bond or
employee) related debt principal and
interest combined
$5,598,056,275.00 $5,716,156,275.00 $6,358,157,672.00 26.28% 26.78% 27.95%

13 | P a g e
Total City of Detroit Debt Service Pension and Post Employment Benefit Contribution minimums (General Fund, Enterprise Agencies
and Component Agencies) from June 30, 2010 fiscal year through the June 30, 2012 fiscal year closure
2010 CAFR
Report - Total
Amount
2011 CAFR Report -
Total Amount
2012 CAFR Report -
Total Amount
Dollar Increase
(Decrease) from
2010 to 2011
% Increase
(Decrease)
from 2010
to 2011
Dollar Increase
(Decrease) from
2011 to 2012
% Increase
(Decrease)
from 2011
to 2012
Annual minimum Debt Service
contribution to meet minimum
payment obligation
$568,000,000.00 $597,260,840.00 $596,073,066.00 $29,260,840.00 5.15% -$1,187,774.00 -0.20%
Annual minimum Pension Plan
Contribution
$110,000,000.00 $177,600,000.00 $177,460,423.00 $67,600,000.00 61.45% -$139,577.00 -0.08%
Annual minimum Post
Employment Benefit Contribution
$313,900,000.00 $327,459,412.00 $355,236,173.00 $13,559,412.00 4.32% $27,776,761.00 8.48%
Annual minimum Long Term
Debt & Obligation Payments for
Detroit
$991,900,000.00 $1,102,320,252.00 $1,128,769,662.00 $110,420,252.00 11.13% $26,449,410.00 2.40%
2010 CAFR
Report - Total
Amount
2011 CAFR Report -
Total Amount
2012 CAFR Report -
Total Amount
2010 monthly
average
contribution
amount
2011 monthly average
contribution amount
2012 monthly average
contribution amount
Total Annual minimum Debt Service
contributions $568,000,000.00 $597,260,840.00 $596,073,066.00 $47,333,333.33 $49,771,736.67 $49,672,755.50
Annual minimum Pension Plan
Contribution $110,000,000.00 $177,600,000.00 $177,460,423.00 $9,166,666.67 $14,800,000.00 $14,788,368.58
Annual minimum Post Employment
Benefit Contribution $313,889,307.00 $327,459,412.00 $355,236,173.00 $26,158,333.33 $27,288,284.33 $29,603,014.42
Annual minimum Long Term Debt &
Obligation Payments for Detroit $991,900,000.00 $1,102,320,252.00 $1,128,769,662.00 $82,658,333.33 $91,166,666.67 $94,064,138.50
14 | P a g e
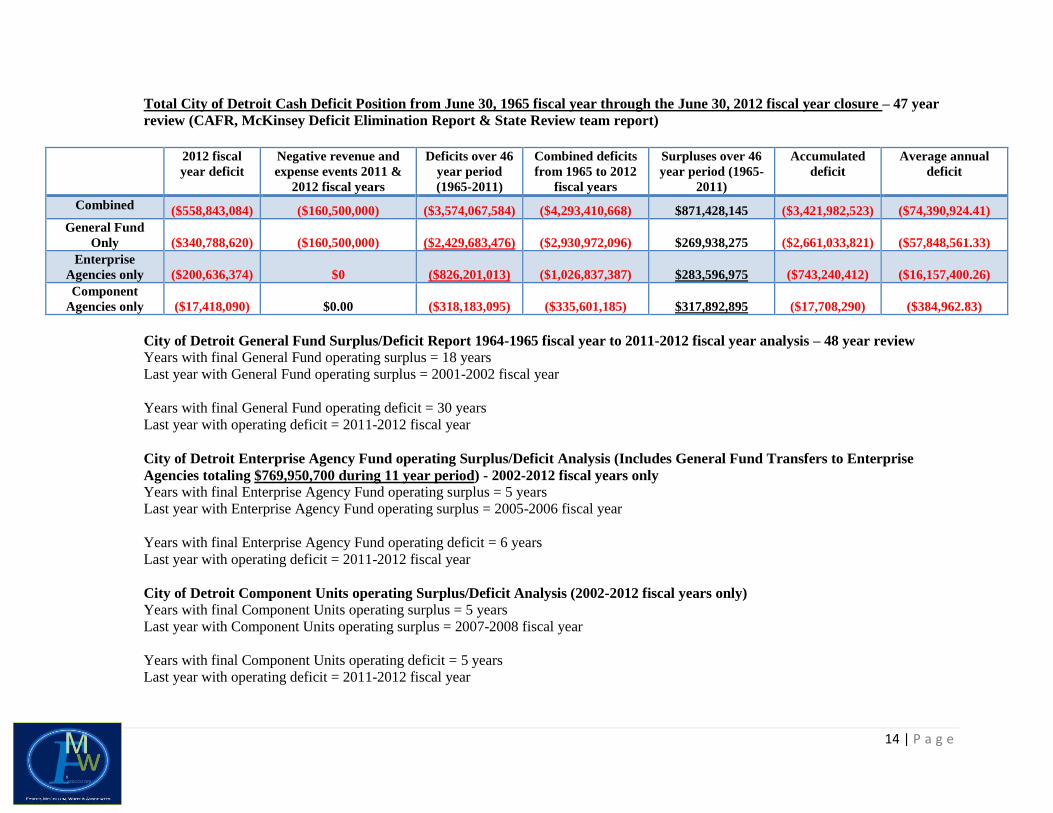
Total City of Detroit Cash Deficit Position from June 30, 1965 fiscal year through the June 30, 2012 fiscal year closure – 47 year
review (CAFR, McKinsey Deficit Elimination Report & State Review team report)
2012 fiscal
year deficit
Negative revenue and
expense events 2011 &
2012 fiscal years
Deficits over 46
year period
(1965-2011)
Combined deficits
from 1965 to 2012
fiscal years
Surpluses over 46
year period (1965-
2011)
Accumulated
deficit
Average annual
deficit
Combined ($558,843,084) ($160,500,000) ($3,574,067,584) ($4,293,410,668) $871,428,145 ($3,421,982,523) ($74,390,924.41)
General Fund
Only ($340,788,620) ($160,500,000) ($2,429,683,476) ($2,930,972,096) $269,938,275 ($2,661,033,821) ($57,848,561.33)
Enterprise
Agencies only ($200,636,374) $0 ($826,201,013) ($1,026,837,387) $283,596,975 ($743,240,412) ($16,157,400.26)
Component
Agencies only ($17,418,090) $0.00 ($318,183,095) ($335,601,185) $317,892,895 ($17,708,290) ($384,962.83)
City of Detroit General Fund Surplus/Deficit Report 1964-1965 fiscal year to 2011-2012 fiscal year analysis – 48 year review
Years with final General Fund operating surplus = 18 years
Last year with General Fund operating surplus = 2001-2002 fiscal year
Years with final General Fund operating deficit = 30 years
Last year with operating deficit = 2011-2012 fiscal year
City of Detroit Enterprise Agency Fund operating Surplus/Deficit Analysis (Includes General Fund Transfers to Enterprise
Agencies totaling $769,950,700 during 11 year period) - 2002-2012 fiscal years only
Years with final Enterprise Agency Fund operating surplus = 5 years
Last year with Enterprise Agency Fund operating surplus = 2005-2006 fiscal year
Years with final Enterprise Agency Fund operating deficit = 6 years
Last year with operating deficit = 2011-2012 fiscal year
City of Detroit Component Units operating Surplus/Deficit Analysis (2002-2012 fiscal years only)
Years with final Component Units operating surplus = 5 years
Last year with Component Units operating surplus = 2007-2008 fiscal year
Years with final Component Units operating deficit = 5 years
Last year with operating deficit = 2011-2012 fiscal year

15 | P a g e
Foster McCollum White & Associates Assessment of the 2011 and 2012 City of Detroit CAFR key items
2 Year Assessment of City of Detroit’s total agency (General, Enterprise & Component) fund balances
City of Detroit Fund Balance Highlights – Per 2011 & 2012 C.A.F.R. Final Reports
2011 2012 Net decrease
(increase)
% of decrease (increase) 2011 to
2012
Unassigned fund balance
Surplus (Deficit)
($196,600,000.00) ($326,600,000.00) ($130,000,000.00) 66.12%
Adverse revenue and
expense events
($161,000,000.00) ($141,600,000.00) $19,400,000.00 -12.05%
Deficit reduction
impacts
$73,100,000.00 $69,000,000.00 ($4,100,000.00) -5.61%
Enterprise Agency Fund
Balance Surplus (deficit)
($223,920,783.00) ($200,636,374.00) $23,284,409.00 -10.40%
Component Agencies
Fund Balance Surplus
(deficit)
($11,734,373.00) ($17,418,090.00) ($5,683,717.00) 48.44%
Total City of Detroit
Agencies Fund Balance
Surplus (deficit)
($520,155,156.00) ($617,254,464.00) ($97,099,308.00) 18.67%
16 | P a g e
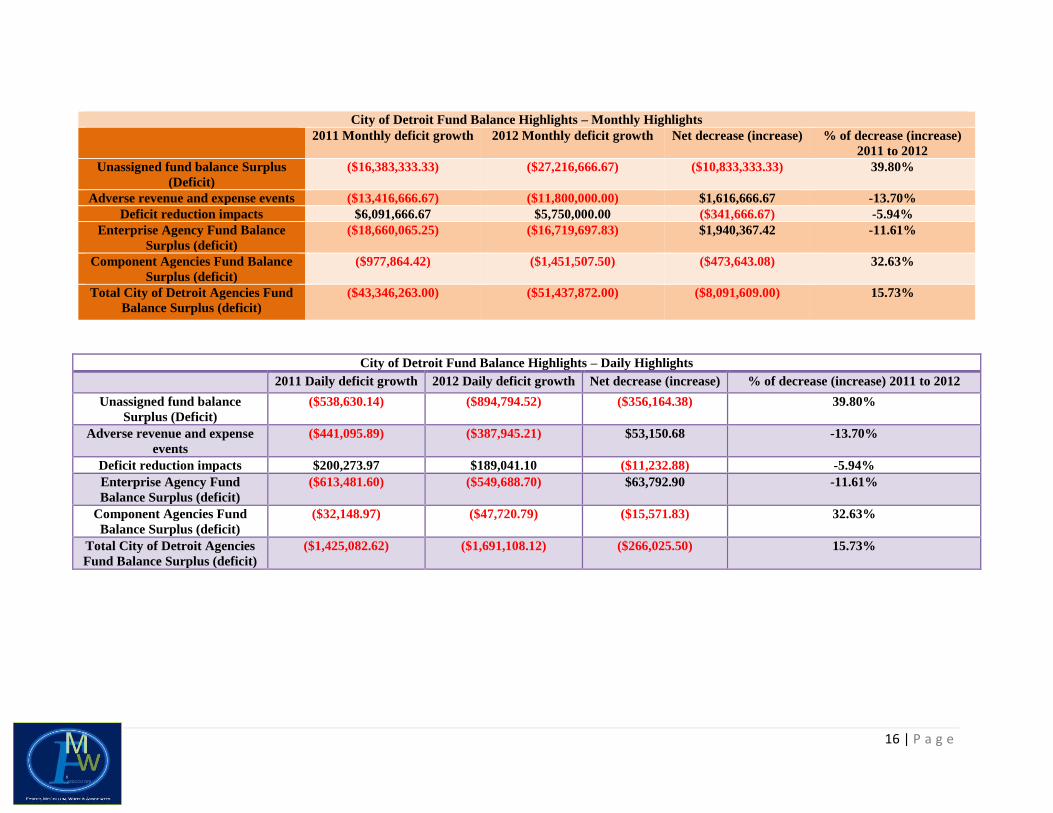
City of Detroit Fund Balance Highlights – Monthly Highlights
2011 Monthly deficit growth 2012 Monthly deficit growth Net decrease (increase) % of decrease (increase)
2011 to 2012
Unassigned fund balance Surplus
(Deficit)
($16,383,333.33) ($27,216,666.67) ($10,833,333.33) 39.80%
Adverse revenue and expense events ($13,416,666.67) ($11,800,000.00) $1,616,666.67 -13.70%
Deficit reduction impacts $6,091,666.67 $5,750,000.00 ($341,666.67) -5.94%
Enterprise Agency Fund Balance
Surplus (deficit)
($18,660,065.25) ($16,719,697.83) $1,940,367.42 -11.61%
Component Agencies Fund Balance
Surplus (deficit)
($977,864.42) ($1,451,507.50) ($473,643.08) 32.63%
Total City of Detroit Agencies Fund
Balance Surplus (deficit)
($43,346,263.00) ($51,437,872.00) ($8,091,609.00) 15.73%
City of Detroit Fund Balance Highlights – Daily Highlights
2011 Daily deficit growth 2012 Daily deficit growth Net decrease (increase) % of decrease (increase) 2011 to 2012
Unassigned fund balance
Surplus (Deficit)
($538,630.14) ($894,794.52) ($356,164.38) 39.80%
Adverse revenue and expense
events
($441,095.89) ($387,945.21) $53,150.68 -13.70%
Deficit reduction impacts $200,273.97 $189,041.10 ($11,232.88) -5.94%
Enterprise Agency Fund
Balance Surplus (deficit)
($613,481.60) ($549,688.70) $63,792.90 -11.61%
Component Agencies Fund
Balance Surplus (deficit)
($32,148.97) ($47,720.79) ($15,571.83) 32.63%
Total City of Detroit Agencies
Fund Balance Surplus (deficit)
($1,425,082.62) ($1,691,108.12) ($266,025.50) 15.73%
17 | P a g e
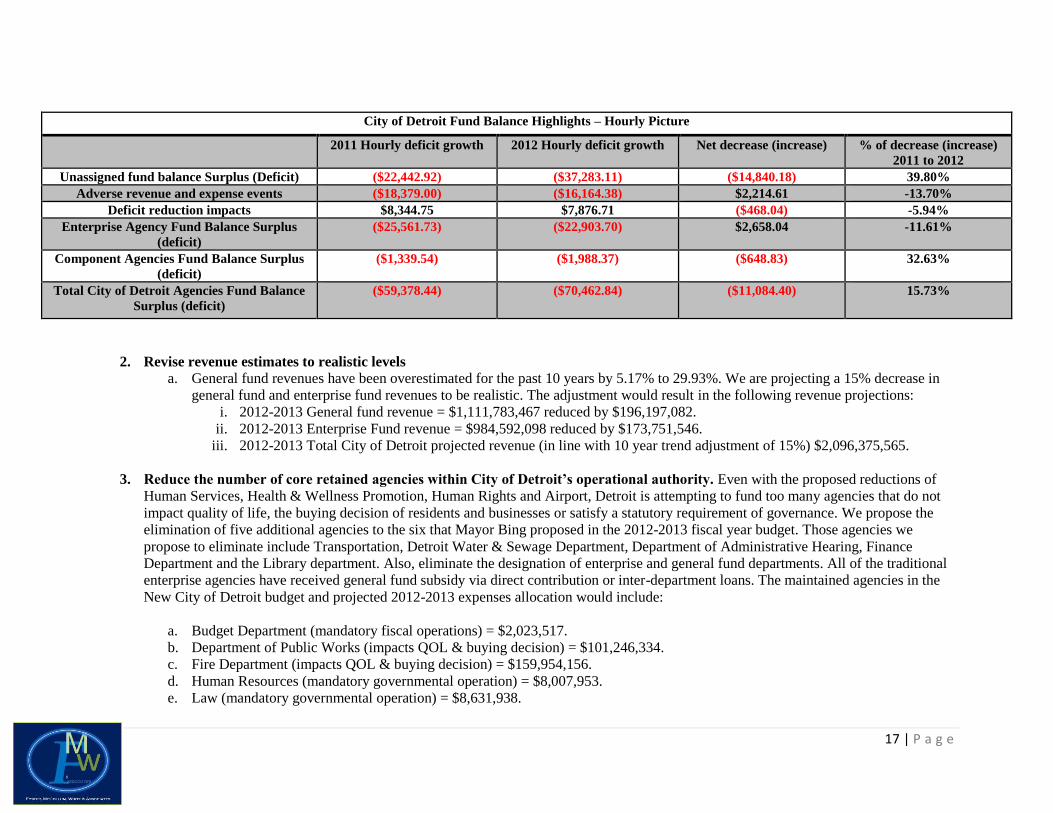
City of Detroit Fund Balance Highlights – Hourly Picture
2011 Hourly deficit growth 2012 Hourly deficit growth Net decrease (increase) % of decrease (increase)
2011 to 2012
Unassigned fund balance Surplus (Deficit) ($22,442.92) ($37,283.11) ($14,840.18) 39.80%
Adverse revenue and expense events ($18,379.00) ($16,164.38) $2,214.61 -13.70%
Deficit reduction impacts $8,344.75 $7,876.71 ($468.04) -5.94%
Enterprise Agency Fund Balance Surplus
(deficit)
($25,561.73) ($22,903.70) $2,658.04 -11.61%
Component Agencies Fund Balance Surplus
(deficit)
($1,339.54) ($1,988.37) ($648.83) 32.63%
Total City of Detroit Agencies Fund Balance
Surplus (deficit)
($59,378.44) ($70,462.84) ($11,084.40) 15.73%
2. Revise revenue estimates to realistic levels
a. General fund revenues have been overestimated for the past 10 years by 5.17% to 29.93%. We are projecting a 15% decrease in
general fund and enterprise fund revenues to be realistic. The adjustment would result in the following revenue projections:
i. 2012-2013 General fund revenue = $1,111,783,467 reduced by $196,197,082.
ii. 2012-2013 Enterprise Fund revenue = $984,592,098 reduced by $173,751,546.
iii. 2012-2013 Total City of Detroit projected revenue (in line with 10 year trend adjustment of 15%) $2,096,375,565.
3. Reduce the number of core retained agencies within City of Detroit’s operational authority. Even with the proposed reductions of
Human Services, Health & Wellness Promotion, Human Rights and Airport, Detroit is attempting to fund too many agencies that do not
impact quality of life, the buying decision of residents and businesses or satisfy a statutory requirement of governance. We propose the
elimination of five additional agencies to the six that Mayor Bing proposed in the 2012-2013 fiscal year budget. Those agencies we
propose to eliminate include Transportation, Detroit Water & Sewage Department, Department of Administrative Hearing, Finance
Department and the Library department. Also, eliminate the designation of enterprise and general fund departments. All of the traditional
enterprise agencies have received general fund subsidy via direct contribution or inter-department loans. The maintained agencies in the
New City of Detroit budget and projected 2012-2013 expenses allocation would include:
a. Budget Department (mandatory fiscal operations) = $2,023,517.
b. Department of Public Works (impacts QOL & buying decision) = $101,246,334.
c. Fire Department (impacts QOL & buying decision) = $159,954,156.
d. Human Resources (mandatory governmental operation) = $8,007,953.
e. Law (mandatory governmental operation) = $8,631,938.

18 | P a g e
f. Mayor’s Office (mandatory governmental operation) = $3,953,534.
g. Planning & Development (Impacts buying decision) = $45,989,612.
h. Police (impacts QOL & buying decision) = $339,593,842.
i. Recreation (impacts QOL & buying decision) = $12,268,611.
j. General Services Department (impacts QOL & buying decision) = $39,099,514.
k. Auditor General (Impacts QOL & improves operations) = $2,942,305.
l. Board of Zoning Appeals (Impacts buying decisions) = $606,566.
m. City Council (mandatory legislative governmental operation) = $8,296,003.
n. Ombudsman (Impacts QOL) = $592,292.
o. Inspector General (Impacts QOL & improves operations) = $592,292.
p. City Clerk (mandatory governmental operation) = $2,070,070.
q. Elections Commission (mandatory governmental operation) = $5,092,776.
r. 36th District Court (mandatory judicial governmental operation) = $31,033,117.
s. Non-Departmental staff (specific divisions of government) = $57,649,723 (Non-fixed cost factored).
t. Building Safety & Engineering (impacts QOL & buying decision) = $23,135,868.
u. Municipal Parking (Revenue generator for operations) = $19,214,738.
v. Debt Service (mandatory budget obligation) = $74,426,582.
w. Total base projected appropriations = $946,421,343
New revenue projections based on these departments can be totaled into the following categories:
1. Taxes & State Revenue Sharing = $695,000,000.
2. Sales of services = $200,000,000.
3. Grants & shared taxes = $66,000,000.
4. Special assessment taxes = $60,000,000.
5. Non-departmental verified revenues = $75,000,000.
6. Casino infrastructure assessment = $17,000,000.
7. Fines, penalties & forfeits = $6,000,000.
8. License & permits = $6,000,000.
9. Cable franchise fee = $6,000,000.
10. Revenue from assets = $4,000,000.
11. Sale from assets = $3,000,000.
12. Detroit Building Authority revenues = $1,000,000.
13. Total projected base revenues = $1,139,000,000

19 | P a g e
We also project the following “surplus revenues” from the following activities (adjustments from the 2012-2013 proposed and
adopted budgets) 1. Relief from dedicated subsidy to phased out city departments = $72,000,000.
2. Reallocation of General Services Department Budget once combined with Department of Public Works = $18,000,000.
FMW projects total operating revenues at $1,229,500,000 for 2012-2013 fiscal year
We would recommend the follow appropriations changes to the budget:
Increase the Budget department appropriations by $8,000,000 to shift various accounting functions from Finance department.
Increase DPW appropriations by $21,099,514 transferred from General Services Department.
Decrease net appropriations amount by $10,000,000.
2012-2013 City of Detroit total projected appropriations = $936,421,343
2012-2013 City of Detroit total projected revenue = $1,229,500,000
2012-2013 City of Detroit projected budget surplus (deficit) = $292,078,657
4. Pass the formerly proposed public safety millage for City of Detroit. 9 mils would generate the following annual amount of revenue
Detroit Estimated SEV at $8,000,000,000:
a. Public Safety Millage (impacts QOL & buying decision) = $72,000,000
5. Separate out EMS division from Fire Department and implement proposed billing model changes for service options and expand
units to service excess medical treatment and transport capacity. Work with City Lobbyist or hire expert lobbyist to lobby for federal
changes in Medicaid & Medicare billing for medically distressed and disproportionate share community designation and state statue
change for medical transportation service delivery. Implemented changes could result in following revenue enhancements for Detroit:
a. Potential 2012-2013 realized revenue opportunity (at a 33% projected minimum collection rate) of $5,570,730 from additional
hospital transports – Current billable model.
b. Potential realized revenue opportunity (at a 33% projected minimum collection rate) of $3,163,050 from servicing non-hospital
transports – policy and legislative policy/ billable model (By fiscal year 2013-2014).
c. Potential realized revenue opportunity (at a 33% projected minimum collection rate) of $2,533,079 from increased Medicare
billings – policy and legislative policy/ billable model (By fiscal year 2013-2014).
d. Potential realized revenue opportunity (at a 33% projected minimum collection rate) of $1,294,071 from Medicaid billings –
policy and legislative policy/ billable model (By fiscal year 2013-2014).
e. Potential maximum net realized revenue of $$30,628,750 (2011-2012 of $16,903,580) projected revenues from current City of
Detroit Adopted budget revenue estimate and potential realized revenue from additional hospital transports (By fiscal year 2014-
2015).

20 | P a g e
By passing the public safety millage and implementing recommended changes to EMS business model, City of Detroit could generate an
additional $77,570,730 in revenue for the 2012-2013 fiscal year, which would increase revenues to $1,307,070,730 and 2012-2013 fiscal
year budget surplus to $369,649,387.
2012-2013 City of Detroit total projected appropriations = $936,421,343
2012-2013 City of Detroit total projected revenue (with public safety millage and EMS revenue adjustments) = $1,307,070,730
2012-2013 City of Detroit projected budget surplus (deficit) = $369,649,387
6. Use 2012-2013 fiscal year budget surplus of $369,649,387 to fund the following department expansions:
I. Police Department - increase budget by $140,000,000 to fund 1,500 uniformed officers’ only, expanding uniformed police
force to 4,000 officers. Total budget would be $479,593,842.
II. Fire Department – increase budget by $30,000,000 to increase uniformed fire fighters by 500 personnel to 1,400
uniformed fire fighters’ total. Total budget would be $194,954,156.
III. EMS Department – Increase budget by $12,000,000 to hire 100 new EMT’s and Paramedics and procure 30 new
ambulances via leasing program. New department budget would be $37,000,000.
IV. Recreation Department – Increase budget by $13,000,000 to hire 170 FTE’s and re-open 4 recreation centers. New
department budget would be $25,268,611.
V. Building Safety & Engineering – Increase budget by 7,000,000 to hire 100 FTE’s for inspection, code violation and
approval process. The department budget would increase to $30,135,868.
VI. Law Department – Increase budget to 2011-2012 staffing levels and add an additional $2,000,000 to hire 25 new FTE’s.
Budget increase would total $13,000,000 to produce a new budget of $21,631,938.
VII. Human Resources – Increase budget by $8,000,000 to hire restore 2011-2012 staffing levels and add an additional 25
FTE’s focused on risk management programming. New budget would be $16,007,951.
VIII. Budget Department – transfer 50 FTE’s from former Finance department.
IX. Department of Public Works – Transfer 320 FTE’s from former General Services Department.
X. Total budget adjustments would cost $223,000,000.
XI. 2012-2013 remaining budget surplus would be $143,649,387.
2012-2013 City of Detroit total projected appropriations (with additional department investment spending of $223,000,000) =
$1,159,421,342 2012-2013 City of Detroit total projected revenue (with public safety millage and EMS revenue adjustments) = $1,307,070,730
2012-2013 City of Detroit projected budget surplus (deficit) = $143,649,387
21 | P a g e
7. Sell all excess buildings, physical infrastructure and land inventory for down payment on long term debt. Set 2012-2013 fiscal year
goal to generate $50,000,000 to $150,000,000 for increased debt service payments
As of the June 30, 2012 City of Detroit CAFR report, Detroit has the following capital assets valuations, net of accumulated depreciation:
Land and Land Rights - $478,532,000
Building, improvements and structures - $2,996,717,000
Sewer and Water lines - $1,154,565,000
Machinery, Equipment, Fixtures and vehicles - $1,379,005,000
Total capital asset valuation, net of accumulated depreciation, for commodity sale program - $6,000,819,000
These assets include non functioning municipal buildings, land reclaimed through property tax revision and other underutilized assets.
Selling a portion of this capacity can generate monies for debt service and free up operating cash from collateralized debt.
8. Spin off Detroit Water and Sewage Division to public private authority. The components of the spinoff would have to take place:
a. Create and pass legislation to allow public private partnership models for public authorities.
b. Create and pass legislation similar to New York’s public authority model.
c. Create applicable Bail-in statutory model legislation for governmental sector application.
d. Work with State of Michigan (leverage State of Michigan’s bond status) to get create a “Bail-in resolution for distressed
Governments and the transition of targeted agencies for the public private partnership authority model. Applicable goal will be to
have bondholders convert 40% of the long term debt notes and financing to ownership equity in the new authority.
e. Restructure remaining long term debt payment terms to spread out payment dates.
f. Establish the PPP public authority board to include ownership equity position and representation for the following stakeholders:
i. City of Detroit.
ii. Wayne County.
iii. Oakland County.
iv. Macomb County.
v. Washtenaw County.
vi. Genesse County.
vii. Labor Council of represented unions
viii. Bondholders
g. Convert existing retirement (pension and post retirement benefits) plan to a VEBA based plan and provide a dedicated amount of
proceeds from the new authority to contribute to the VEBA plans.
h. Hire private sector management to create operational and business model for sustainability and revenue growth.
i. Expand DWSD product mix including bottled water products and sales model to other communities in Michigan and neighboring
states & Ontario.

22 | P a g e
j. Transfer all non converted debt/obligations (current bond debt, pension and post employment liability is roughly $11,034,132,909
of existing Detroit debt & obligations) to new authority. Any new debt financing would be the financial obligation of the authority
and the City of Detroit would not have any obligation to use its revenues to pay for debt financing.
k. Transfer all operating revenue and expenses to new authority.
9. Spin off D-DOT to public private authority, similar to DWSD structure. Debt relief for Detroit from current DDOT bond debt,
pension and post employment liability is equal to $1,025,917,323.
a. Have the bondholders to convert 20% to 30% of the long term debt notes and financing to ownership equity in the new authority.
b. Restructure long term debt payment terms to spread out payment dates.
c. Merge SMART & Ann Arbor Transit Authority into new authority. Include light rail, rolling rapid transit and other transportation
models in authority.
d. Update fee structure to generate additional operating revenue.
e. Pursue and gain voter authorized quad-county millage to fund portion of authority.
f. Hire private sector management to create operational and business model for sustainability and revenue growth.
g. Expand transportation product mix including rail, waterway border crossings.
h. Transfer all non converted debt/obligations to new authority. Any new debt financing would be the financial obligation of the
authority and the City of Detroit would not have any obligation to use its revenues to pay for debt financing.
i. Transfer all operating revenue and expenses to new authority.
10. Spin off Detroit Public Library system from Detroit to County based authority. This authority would also absorb all other municipal
libraries in Wayne County. Library assets would be planned to share borders and community centers to maximize physical plant facilities.
a. Push for all state legislation to allow regional library authority for Wayne County.
b. Push for state appropriations from HAL to partially subsidize the new authority for initial 10 years.
c. Modify millage statues for Libraries to increase millage capacity.
d. Work with State of Michigan (leverage State of Michigan’s bond status) Get the bondholders to convert 20% of the long term debt
financing to ownership equity in the new authority.
e. Restructure long term payment terms to spread out payment dates.
f. Convert existing retirement (pension and post retirement benefits) plan underfunded amount to a VEBA based plan and provide an
ownership stake for DPL and other municipal sector unions in the new authority (10% to 20%) to contribute to the VEBA plan
payouts.
g. Review all local library millages to adjust for capacity of new authority and proper taxing distribution.
h. Transfer all non converted debt/obligations for all municipalities to new authority.
i. State legislative action to allow authority to expand debt financing options.
j. Transfer all operating revenue and expenses to new authority.
23 | P a g e
11. Correct Defects in the transition of the Public Lighting Department to Authority Model. Items in the transition discussion must
include:
a. Create and pass legislation to allow public private partnership models for public authorities.
b. Create and pass legislation similar to New York’s public authority model.
c. Create applicable Bail-in statutory model legislation for governmental sector application.
d. Work with State of Michigan (leverage State of Michigan’s bond status) to get create a “Bail-in resolution for distressed
Governments and the transition of targeted agencies for the public private partnership authority model. Applicable goal will be to
have bondholders convert 20% to 30% of the long term debt notes and financing to ownership equity in the new authority.
e. Restructure remaining long term debt payment terms to spread out payment dates.
f. Revise the PPP public authority board to include ownership equity position and representation for the following stakeholders:
i. City of Detroit.
ii. Labor Council of represented unions
iii. Bondholders
g. Convert existing retirement (pension and post retirement benefits) plan to a VEBA based plan and provide a dedicated amount of
proceeds from the new authority to contribute to the VEBA plans.
h. Hire private sector management (DTE, Consumers Power, etc.) to create operational and business model for sustainability and
revenue growth.
i. Maintain power generation management within the Public Lighting Authority.
j. From Michigan Black Caucus Foundation - Creation of renewable energy generation, storage and redistribution system
collaboration with DTE capable of supplanting PLD; providing WI-FI and CCTV service, standardizing and modernizing street,
commercial and exterior residence illumination that supports a Michigan Insurance Federation targeted neighborhood insurance
rate reduction program
k. Plan to secure Department of Energy grants to fund power generation capacity expansion to allow energy sales capacity to
resident, business and open energy market.
l. Transfer all non converted debt/obligations for all municipalities to new authority. Any new debt financing would be the financial
obligation of the authority and the City of Detroit would not have any obligation to use its revenues to pay for debt financing.
m. Transfer all operating revenue and expenses to new authority.
24 | P a g e
12. Negotiate relationship with Wayne County to transfer Detroit City Airport to Detroit-Wayne County Airport Authority
ownership and operations. Negotiate with Macomb County Executive and State of Michigan to address Airport improvements to allow for expansion to regional
airport model (Reagan in D.C or Midway in Chicago).
13. Outsource all tax collection functions to Wayne County Treasurer’s department. Work with State, Wayne County and other municipalities to create enabling legislation to allow all 43 municipalities in Wayne County to
transition out of tax collection and treasury functions and allow Wayne County Treasurer to provide service for each municipality.
14. Outsource all internal IT staff and functions to a partnership consortium of State of Michigan, Wayne County, DPS and a Private
sector partner. Consortium can also include other municipalities in Wayne, Oakland and Macomb County.
15. Enter into purchasing consortium with Wayne County, DPS, EAA, Highland Park, Hamtramck, Inkster, Ecorse, River Rouge, Harper
Woods, Allen Park and other governmental agencies for procurement of insurance products (health, life, disability, property & causality,
workman’s compensation, etc.) and other commodity procurements to reduce per unit cost and generate savings on total product
procurement.
16. Lead in push for public safety modifications to geographical scope and service delivery model. Changes would include:
a. Negotiation with Wayne County Sheriff, Detroit Public Schools Police, Wayne State Police, U of D Mercy Police, Wayne County
Community College Public Safety, Marygrove Public Safety, Michigan State Police and Macomb County Sheriff create police
zoning special districts and amendment of Proposal A & Headlee to allow Detroit and partners to levy special assessment
to fund police zoning special districts. Each agency would take a specific zone inside of Detroit for policing. Zones would be
self contained and less populated or border areas. The partner agency would be responsible for patrolling, responding to 911 calls
and have arresting powers with Detroit borders. Detroit’s police department would patrol on non partner zones only, but would
respond to 911 calls in partner zones on priority dispatch and unit availability basis.
b. Creation of M-Coles certification approval for private policing agencies (DMC Public Safety, HFHS Public Safety, Sparrow
Health System, McLaren Health System, etc) to enter into policing zones relationships with City of Detroit and other criminally
distressed communities (Flint, Saginaw, etc.) to expand zoning capacity while distressed communities add additional police
officers.
c. Push for legislation to create a county based public safety authority (similar model to Washington State). Detroit and the major 12
Wayne County communities would become the primary public safety responders (police, Fire, EMS) to zones within Wayne
County.
d. Centralize local millages into a county-wide millage model to fund centralized operations.
25 | P a g e
e. Implement EMS billing model changes for service options and expand units to service excess medical treatment and transport
capacity. Coordinate with State legislature and Congressional delegation to secure changes in Medicaid & Medicare billing for
medically distressed and disproportionate share community designation and state statue change for medical transportation service
delivery.
f. The 13 regional providers will absorb uniformed staff, vehicle equipment and stations from the other 30 communities as necessary
to maintain minimum patrolling capability for each zone. 911 call center and dispatch services will be regionalized into 4 regions
(Detroit, Western Wayne, Downriver and Near Detroit Suburbs).
g. Bonding authority for technology, communications, station improvements and vehicle investment.
Our approach to regional model for public safety services is based in the simple fiscal situation that is facing a number of smaller
municipal bodies in the US. The problem is the cost for maintaining adequately staffed police fire and EMS departments while
managing the risk management cost, operational cost, workman's compensation cost and legacy benefits, along with meeting the
current operational needs of providing a sound pay for the high risk line of work and equipment to maintain service levels. A growing
number of governmental agencies can't afford to manage this expense independently. Our model is based on the Washington State
model for EMS services. In that state, the larger municipal bodies provide advanced life support and some basic life support response
service for smaller communities within a county. Instead of levying a number of varying millages for each individual city, the
communities within the county are assessed one flat millage for the services. The individual millages are removed for the communities
who do not provide direct EMS services. We recommend a model where cities like Detroit, Livonia, Dearborn and other larger
communities in Wayne County to leverage their capacity to help the smaller cities like Plymouth Twp., Allen Park and Harper Woods,
who can't afford to provide these services any more.
17. Legislation to support a parks management relationship with State of Michigan DNR, Huron-Clinton Valley Metro Parks, Wayne
County and the Detroit Recreation and Public Works departments to transition management of Detroit’s park system (308 parks)
into an integrated parks authority system. Detroit would maintain operational and fiduciary control of neighborhood parks and parks
based on acreage would be under the operational and fiduciary control of the partner agency. Legislation model would need to include
usage fee structure for large acreage parks, program to allow for low income Detroit residents to maintain free access, specific bonding
and assessment models for Wayne County and the Metro Park System to add capacity, the development and implementation of a specific
parks capital investment program.
26 | P a g e
Foster McCollum White & Associates 17 Point Plan Addendum Items The following plan addendum section seeks to identify ways to address the immediate cash crisis that Detroit is facing and additionally identify
revenue generation opportunities/capital investment needs for the remaining core service agencies. This addendum section also expands on the
necessary development and implementation of Public Private Partnership and Bail In debt to equity conversion legislation to strengthen the public
sector authority options for Municipalities and increase partnerships with municipalities, organized labor and the private sector/bondholders.
18. Retail based business establishment retention and expansion plan (Targeted to all small to medium size retail business providers located within Detroit)
Plan Functional Outline will include the following items:
Retail Cluster Analysis and Plan for Cluster Capacity Building (targeted areas in alignment with Detroit Futures project and FMW socio-
economic demography analysis.
Plan for addressing creating density within retail clusters by attracting retailers in non-dense clusters through economic development
programs to include:
City and State regulatory and statutory program assessment and identification of necessary inputs to achieve retail cluster business model
o Property forgiveness swaps from non-dense retail areas to dense retail areas.
o Renaissance zone programs for retail development.
o State of Michigan Economic gardening program ventures for density.
o Communications and marketing strategy to promote clusters and draw consumer traffic [neighborhood, region, city-wide and
neighboring city].
o Employment training and promotion programming with State, old Detroit Workforce Development department and other
employment training stakeholders.
o Socio-Economic Assessment model (highlight only) with specific state financial support to better understand the consumer
markets per cluster, region and city-wide.
o Faith based and social service organization engagement plan for market access, consolidation and enhanced business service
delivery.
City and State regulatory and statutory program assessment and identification of necessary inputs to achieve retail cluster business model
The second item is the development of the cost-analysis model for the implementation of a business tax credit (refundable) or tax rate cut
incentive program to encourage local retail and community based businesses to hire workers (summer and/or full time).
o The plan would have to assess the incentive levels necessary for 1 PTE and 1 FTE and the resulting economic curve of diminishing returns
on the incentive to the demand for hiring.
o The plan would have to also assess the potential positive sales impact that each PTE & FTE can have on the targeted businesses and the
resulting economic curve of diminishing returns on the growth of sales to the demand for hiring.

27 | P a g e
Fiscal Revenue and Expense modification initiatives (collaborative between the State and Federal Governments and Regional Inter-Cooperation
agreements/authority models)
19. Appropriations of a specific Detroit based emergency revenue stream to support restructuring and current fiscal crisis. Appropriations
would need to equal a monthly minimum of $43,346,263.00 to equal the 2011 gross monthly cash burn of all city of Detroit agency
fund balances (General, Enterprise and Component agencies) for up to a two year period. Revenue stream models could include
the following options:
a. Allow Detroit to capture all receipts for state lottery game tickets sold within the City of Detroit physical borders – similar to TIF
or DDA’s tax capture model for infrastructure and economic development
b. Allow Detroit to create a local based lottery gaming product and retain all net proceeds after winning payouts – would require the
State to “co-sign” the financial relationship between the City and financial industry to establish initial loss reserve fund to pay for
winnings until local lottery has built up cash reserve fund and can self insure to winning payouts.
c. Allow cities like Detroit to exceed Proposal A and Headlee to excise an emergency property tax or sales tax to fund specific core
QOL & buying decision of residents and businesses (police, fire, EMS, Recreation, parks system, public works, etc.) for up to 5
years during the restructuring and redevelopment phase of municipal operations.
20. Support the 6 month freeze on all debt services and POC obligation payments during the fiscal crisis/EFM/EM period. Total
Annual minimum Debt Service contributions = $50,269,365.00 monthly and $603,232,380.00 annually as of 2012 fiscal year CAFR.
This 6 month moratorium would allow the city to recoup an estimated $301,616,190, which could be used to fund the core municipal
service activities while bond debt restructuring efforts and public sector authority model enhancements are being implemented.
21. Appropriations of up to $10 million dollars for Detroit and interested neighboring communities (Allen Park, Hamtramck,
Highland Park & Harper Woods) to create and implement the fire authority consolidated service model. Monies must be earmarked
for the specific creation activities and cannot be deposited or co-mingled with general fund dollars.
22. Fire truck, engine, hose, and ground ladder replacement; Specific State Appropriations to fund the capital vehicle replacement
program for all heavy apparatus and medic units. The last purchase of fire apparatus was in 2008. Many of these fire trucks have been
poorly maintained due to understaffing at the Apparatus Division as well as a poor to non-existence field inspection and preventive
maintenance program. Most pumps, aerial ladders have not been inspected on an annual basis as required. Ground ladders and fire
fighting hose that have not been replaced in years must be replaced. Violation of these standards can result in MIOSHA fines to the
Department and could result in negligence if a serious injury occurs as a result of failure during emergency operations. Approximately
$20M for some heavy apparatus and $4.5M for the entire medic fleet replacement is needed. All Department apparatus should be on
a replacement program. The City would be obligated to consider the value of sticking with one apparatus manufacture compared to the
lowest bidder process. Maintenance and operational efficiencies can be gained from a standardized fleet of apparatus. Monies must be
earmarked for the fire department specifically and cannot be deposited or co-mingled with general fund dollars.
28 | P a g e
23. Legislation to allow the City to adopt single-family dwelling sprinkler ordinances that require such in new construction. Over the
next 30 years this change alone will contribute to a more efficient fire department and resulting lower costs for the service. Safer
homes equal lower costs of fire insurance to the homeowner and higher ISO rating for the City, which affects businesses positively.
Cities who adopt sprinkler ordinances for single-family dwellings overtime reduce the costs of fire service for the community. Cost of
installation is down to approximately $1.20/square foot. This amount amortized over a 30-year mortgage is infinitesimal to the costs of a
30-year fire fighter pegged at $3M.
24. Create and pass legislation to allow public private partnership models for public sector authorities – Public Private Partnership
model (PPP’s) are agreements that allow private companies to take on traditionally public roles in infrastructure projects, while keeping
the public sector ultimately accountable for a project and the overall service to the public. In PPPs, a government agency typically
contracts with a private company to renovate, build, operate, maintain, manage or finance a facility. PPPs cover as many as a dozen types
of innovative contracting, project delivery and financing arrangements between public and private sector partners. As of Dec. 2010,
twenty-nine states and Puerto Rico have legislated an authorization framework for PPPs and more than $46 billion had been invested in
these projects over the last 20 years.
25. Create and pass legislation for the reconstitution of the public authority model in Michigan to utilize the Bail In restructuring
model. Applying this model to local municipal agencies would be similar to the economic recovery model that the International Monetary
Fund (IMF) is proposing to do in Europe and America to fix the mortgage and bond debt crisis that is hurting governments and
international banks. The principle application would be the same, considering that governmental organizations such as cities, counties and
large size school districts are also too big to fail and that their failure would have significant negative impact on the financial markets,
business environment and resident migration patterns. A distressed municipal agency could spin off agencies and departments that house
sizable bond and debt obligations and independent revenue generation (utilities, transportation, airport, ports, etc.) to a public private
partnership public authority with the carrying debt. The new authority would enter into a bail out relationship with the bondholders to
convert a sizable portion of the existing debt via a “Bail-in” to allow the agency to restructure its operations and use freed up profits to
invest in infrastructure and expand business offerings to increase revenue opportunities. The core municipal agency is also going through a
similar restructuring because of the spun off agency and can receive a partial write down of its remaining debt obligations
26. State legislation to modify Public Act 33 of 1951 to allow qualified cities to contract with larger municipalities (cities with 100,000 or
more population) for EMS services and to allow the raising of money by special assessment to pay for contracted EMS service
agreements with the larger municipality, in addition to current language regarding levies for Fire protection services
27. Allow Municipal EMS agencies to contract with state managed care agencies and the State’s long term care managed care organization to
provide specific emergency and non emergency ambulance transportation and other pre-hospital/mobile health services.

29 | P a g e
28. Support for the development of a joint regional Fire/Police Public Safety Training Facility on old State Fair grounds or other
large land area within Detroit. The Department has obtained its Regional Training Center status a few years ago. An opportunity to
convert training from a cost center to a profit center for Detroit while becoming the beacon for fire service training east of the Mississippi.
Benefits of this 17 point plan
1. Detroit’s government functions are aligned to three key areas (quality of life, buying decision impact and maintaining mandatory statutory
functions).
2. Detroit finally will live within its budget means and start creating surpluses to either pay down debt or invest in core departments. Detroit
has a core base of revenue that is overly stretched to meet citizen needs and deliver positive impact.
3. Long term debt relief – By spinning off the agencies we propose, Detroit can experience a range of $11 billion to $16 billion in debt relief.
It would leave Detroit with long term debt and obligations of $6 billion to $11 billion. This allows the city to develop restructuring plans
to address the overall debt situation for bonding obligation, retirement and health care obligations. That is more manageable and functional
to address.
4. Decreased annual minimum debt service payment obligation. – Detroit’s current minimum debt service and retirement obligation payment
amount would equal $1,128,769,662. This equals 44.46% of the 2012-2013 projected fiscal year revenue and 53.88% of our revised 2012-
2013 revenue projections. This amount equals to 4.96% of the total outstanding obligation load.
2011-2012 fiscal year
revenues
2012-2013 fiscal year (if revenues stay
same as 2011-2012 fiscal year)
2012-2013 fiscal year (if revenues match FMW
revised estimate per historical revenue
overstatements)
Program revenues/fees for services 1,576,427,535 1,576,427,535 $1,434,549,056.85
Taxes, interest, grants and other revenue
sources 725,785,348 725,785,348 $660,464,666.68
Total 2,302,212,883 2,302,212,883 $2,095,013,723.53
Annual minimum LTDO Payments for
Detroit $1,102,320,252.00 $1,128,769,662.00 $1,128,769,662.00
Obligation payments as percentage of
actual (projected) revenues 47.88% 49.03% 53.88%
To make a significant impact on the current outstanding obligations, Detroit would need to increase the payment amount to 8%, which
would equal $1,819,963,163.84. That would remove a minimum of 71.69% of the 2012-2013 projected operating revenues and 86.87% of
our revised 2012-2013 revenue projections before paying for any current personnel to deliver municipal services.

30 | P a g e
2012-2013 fiscal year (if
revenues stay same as 2011-
2012 fiscal year)
2012-2013 fiscal year (if revenues
match FMW revised estimate per
historical revenue overstatements)
2012-2013 fiscal year (if revenues match FMW
revised estimate per historical revenue
overstatements)
Program revenues/fees for services 1,576,427,535 $1,434,549,056.85 $1,305,439,641.73
Taxes, interest, grants and other revenue
sources 725,785,348 $660,464,666.68 $601,022,846.68
Total 2,302,212,883 $2,095,013,723.53 $2,538,750,778.00
Annual minimum LTDO Payments for
Detroit (8% of Total Obligation load) $1,819,963,163.84 $1,819,963,163.84 $1,819,963,163.84
Obligation payments as percentage of
actual (projected) revenues 79.05% 86.87% 71.69%
Under our proposed business model, Detroit would potentially decrease its annual minimum debt and obligation payments (using the
current 4.734% of total obligations model) down to a range of $284,040,000 to $473,400,000 (assuming obligation load is between
$6,000,000,000 to $11,000,000,000).
5. Public safety can expand and be properly targeted to deter crime across Detroit and Wayne County. Patrols can be increased to a two to
three police car per square mile ratio in the densely populated areas of Detroit and other high crime areas in Wayne County (Inkster,
Highland Park, Hamtramck, River Rouge) and one car per square mile in less dense population centers in Detroit, business areas and low
crime communities in Wayne County. Investigation divisions and special units (gang squad, narcotics, vice, etc.) can be realigned to
address high crime density areas and coordinate case prosecutions with the County Prosecutor’s office.
6. Detroit can leverage its existing size for Fire and EMS services to absorb smaller agencies and expand its physical footprint with a
consistent and dedicated revenue stream to pay for operations and expansion. Smaller neighboring municipalities can get out of the
function of public safety, spend a smaller portion of their budget on public safety and spread savings to other core municipal functions.
7. Regionalizing the dispatch function from 43 municipal 911 call centers dispatch services to 4 regional call centers dispatch services will
benefit Detroit. Detroit will be able to expand and invest in technologies to improve call management and add staffing to reduce stress on
existing staff. The other 39 communities will pay a participation fee which will be much smaller than their existing budget outlay for 911
and dispatch services and be able to spread the savings to other core municipal functions. Similar benefits will exist for the other three
regional providers as it will for Detroit.
8. The profitability fallacy of the Detroit Water and Sewage Department (DWSD). There are three key things that people must understand
about DWSD:
a. DWSD annually sells revenue obligation bonds to fill anywhere from 10% to 30% of their revenue projections and pay for their
operating expenses. The revenue obligation bonds are collateralizing by the future profits from other revenues that are received
from charging for services. Without the selling of Revenue obligation bonds, the department would only generate enough revenue
through sales to consumers to pay for 70% to 90% of their expenses. In theory, the DWSD department would require a general
fund subsidy (similar to D-DOT, Public Lighting and Building Safety & Engineering) to pay for the rest of their operating
expenses.
31 | P a g e
b. DWSD has pledged all profits from sales for services to make its annual debt payment on the Revenue obligation bonds. In the
2010 CAFR report, it was identified that the profits from the Water fund were $6,446,061 under the minimum annual bond
payment amount and that the Sewage fund's profit was $36,348,689 under the minimum annual bond payment amount. In short,
DWSD was $42,794,750 short on making the minimum payment on its bond debt. In the 2011 CAFR report, the sewage
department was $30,943,083 short on making the minimum payment on its bond debt through pledged revenues. This business
model will never allow DWSD to do the following:
i. Meet its growing debt obligations,
ii. Will not help it invest in capital upgrades without having to borrow more debt and,
iii. Finally invest in new product offerings, expanding its customer base and becoming a sustainable revenue engine.
c. DWSD has a total debt load (debt service obligations, unfunded OPEB liability and pension liability of over $13 billion. That is
57.14% of the City of Detroit's total indebtedness load. The department will continue to add to that debt load annually, primarily
based on taking more Revenue Obligation bonds out to meet current operating expenses. This is an unsustainable level of debt and
the operational management hasn't implemented a solid plan to end this cycle.
FMW Researched Documents (Partial List)
1. 2012 City of Detroit CAFR
2. 2011 City of Detroit CAFR
3. 2002 City of Detroit CAFR
4. 2003 City of Detroit CAFR
5. 2000 City of Detroit CAFR
6. 2005-2006 City of Detroit Fiscal Budget Documents from Mayor Kwame M. Kilpatrick
7. 2005-2006 City of Detroit Adopted Budget
8. 2005-2006 City of Detroit Auditor General’s Report and Analysis on Mayor Kilpatrick Fiscal Budget
9. 2005-2006 City of Detroit City Council Fiscal and Budget Analysis Documents
10. 2006-2007 City of Detroit Fiscal Budget Documents from Mayor Kwame M. Kilpatrick
11. 2006-2007 City of Detroit Adopted Budget
12. 2006-2007 City of Detroit Auditor General’s Report and Analysis on Mayor Kilpatrick Fiscal Budget
13. 2006-2007 City of Detroit City Council Fiscal and Budget Analysis Documents
14. 2007-2008 City of Detroit Fiscal Budget Documents from Mayor Kwame M. Kilpatrick
15. 2007-2008 City of Detroit Adopted Budget
16. 2007-2008 City of Detroit Auditor General’s Report and Analysis on Mayor Kilpatrick Fiscal Budget
17. 2007-2008 City of Detroit City Council Fiscal and Budget Analysis Documents
18. 2008-2009 City of Detroit Fiscal Budget Documents from Mayor Kwame M. Kilpatrick
19. 2008-2009 City of Detroit Adopted Budget
32 | P a g e
20. 2008-2009 City of Detroit Auditor General’s Report and Analysis on Mayor Kilpatrick Fiscal Budget
21. 2008-2009 City of Detroit City Council Fiscal and Budget Analysis Documents
22. 2009-2010 City of Detroit Fiscal Budget Documents from Mayor Kenneth V. Cockrel Jr.
23. 2009-2010 City of Detroit Adopted Budget
24. 2009-2010 City of Detroit Auditor General’s Report and Analysis on Mayor Cockrel Fiscal Budget
25. 2009-2010 City of Detroit City Council Fiscal and Budget Analysis Documents
26. 2009 City of Detroit CAFR
27. 2010-2011 City of Detroit Fiscal Budget Documents from Mayor Dave Bing
28. 2010-2011 City of Detroit Adopted Budget
29. 2010-2011 City of Detroit Auditor General’s Report and Analysis on Mayor Bing Fiscal Budget
30. 2010-2011 City of Detroit City Council Fiscal and Budget Analysis Documents
31. 2010 City of Detroit CAFR
32. 2011-2012 City of Detroit Fiscal Budget Documents from Mayor Dave Bing
33. 2011-2012 City of Detroit City Council Fiscal and Budget Analysis Documents
34. 2012-2013 City of Detroit Fiscal Budget Documents from Mayor Dave Bing
35. 2012-2013 City of Detroit City Council Fiscal and Budget Analysis Documents
36. March 26, 2012 State of Michigan Review Team Report
37. Citizens Review Council Report, Detroit and its indebtedness – 2012
38. Moody’s Detroit Bond Downgrade Report 2011 and bond reports from 2008 through 2011
39. Fitch’s Detroit Credit and Bond rating downgrade report - 2011 and bond reports from 2008 through 2011
40. Standard & Poor’s Detroit Credit and Bond rating downgrade report - 2011 and bond reports from 2008 through 2011
41. McKinsey & Co. Deficit Elimination Plan White Book Report - 2011
42. Detroit Crisis Turnaround Team Report – 2009
43. Ernst & Young Cash Flow Analysis Report
44. City of New Orleans EMS Transition Team Report
45. Administration and Response Report Pittsburgh Bureau of EMS
46. 2009 Boston EMS Vital Stats Final tcm 3-16973
47. Buncombe County EMS Staffing Solutions Report
48. EMS Field Operational Fitness Experiment and Staffing Study Produced with the Cooperation of Montgomery County, Maryland Fire and
Rescue & the Cooperation of Fairfax County, Virginia Fire and Rescue Department, The National Institutes of Standards & Technology,
The International Association of Fire Chiefs, EMS Performance Improvement Center, International Association of Fire Fighters & UNC
School of Medicine
49. IAFF and IAFC EMS System Performance Measurement
50. Fitch Report for Alameda County Final Report
51. Final Report Washington DC EMS Division with appendices 9-26-10
52. New Jersey EMS Study Report

33 | P a g e
53. EMS Response Prioritization Criteria Benefits Study
54. Seattle Fire-EMS Department Annual Report 2008
55. Medic One Emergency Medical Services 2008-2013 Strategic Plan
56. State of Massachusetts EMS service zone planning response times
57. MedPAC Payment Basics 2007 for Critical Access Hospitals
58. HR 6331 Medicare Reimbursement Report
59. NAEMT 1-26-10 Pay and Benefits for EMS Policy Report
60. Health Care in Rural vs. Urban America 2002
61. Medicare Ambulance Reimbursement Cost
62. Minnesota Rural Ambulance Service at Risk Report
To learn more about Foster McCollum White & Associates, please visit us at www.fostermccollumwhite.com or via the following social media
sites:
Facebook: http://www.facebook.com/pages/Foster-McCollum-White-Associates/210274745695329
Twitter: https://twitter.com/#!/FMWAssociates
Linkedin: http://www.linkedin.com/company/foster-mccollum-white-&-associates