FluxionalMoleculeswithFiveEquivalent Atoms: Mid ...bjm.scs.illinois.edu/miscpubs/Hodges2013.pdf ·...
42
Fluxional Molecules with Five Equivalent Atoms: Mid-infrared Spectroscopy of CH + 5 and H + 5 James N. Hodges Research Prospectus for Preliminary Examination February 11, 2013 10:30 AM A133 Chemical and Life Sciences Laboratory University of Illinois at Urbana-Champaign
-
Upload
nguyenmien -
Category
Documents
-
view
214 -
download
0
Transcript of FluxionalMoleculeswithFiveEquivalent Atoms: Mid ...bjm.scs.illinois.edu/miscpubs/Hodges2013.pdf ·...

Fluxional Molecules with Five EquivalentAtoms: Mid-infrared Spectroscopy of CH+
5and H+
5
James N. Hodges
Research Prospectus for Preliminary Examination
February 11, 2013 10:30 AM
A133 Chemical and Life Sciences Laboratory
University of Illinois at Urbana-Champaign

I. INTRODUCTION
Infrared spectroscopy is arguably one of the most powerful tools that is available to chem-
istry and molecular physics. As such, rovibrational spectroscopy’s applications in determin-
ing rotational transitions indirectly, and its use in the support of astronomical observations
are described. A description of the accomplished work to date is provided. The remainder
of the document describes proposed experiments targeted at understanding the spectra of
highly fluxional molecules with five equivalent atoms.
A. Indirect Rotational Spectroscopy
Indirect rotational spectroscopy is a technique that calculates rotational transitions by
measuring rovibrational transitions. This approach is useful in determining rotational tran-
sitions in the sub-millimeter/THz region. The nascent field of THz light generation and
detection is an active area of research, but there are technical challenges to direct spec-
troscopy in this region. Infrared spectroscopy, on the other hand, is a mature field with well
developed technology.
To determine a rotational transition via infrared spectroscopy, the difference between two
rovibrational transitions must be determined. The calculation requires that these two tran-
sitions share a rotational level in either the lower vibrational state or the upper vibrational
state. The difference does not represent a rotational transition but an energy level spacing.
In the case of a linear molecule, these differences correspond to two adjacent rotational
energy levels, such as the ∆EJ=2←0 energy level spacing. In the lower vibrational state, the
pair of rovibrational transitions whose difference results in ∆EJ=2←0 spacing are P(2) and
R(0) as demonstrated in Figure 1. For the rotational energy level spacings in the upper
vibrational level, the same energy level spacing can be determined by the difference in P(2)
and R(2). After all the energy level spacings are known, knowledge of only a single rotational
transition can be used to construct the entire rotational spectrum.
B. Astronomical Applications
Molecules with a small moment of inertia have a large rotational constant. For example,
higher J rotational transitions exist in the terahertz regime for HCO+ and N2H+. [1] The
1

lack of laboratory spectra limits the identification of astronomical species, which presents an
obvious use for indirect rotational spectroscopy. Astronomical observations of an unknown
molecular line are not unprecedented. The J = 1← 0 transition of HCO+ was first discovered
by astronomers, [2] and five years passed before the species was correctly identified by
spectroscopists. [3] Now it is one of the most commonly observed astronomical molecules,
and it may be found in a variety of astronomical environments. [4–7]
Indirect THz spectroscopy is especially noteworthy considering recent astronomical de-
velopments. Newly constructed telescopes such as the Atacama Large Millimeter and
sub-millimeter Array (ALMA) and the Stratospheric Observatory For Infrared Astronomy
(SOFIA) both have coverage in the THz region of the spectrum, which will allow for the
observation of a wealth of lines that have not yet been identified.
By targeting molecules of astronomical interest, the rotational energy level spacings can
be provided by measuring a fundamental vibrational band. Then possessing the required
rotational transitions, the entire rotational spectrum can be calculated limited solely by
the number the rovibrational lines and the precision and accuracy of the instrument. The
calculated spectrum can be used to identify new species in the interstellar medium, assign
lines that where previously unknown, and probe the environment in which the species was
observed.
II. COMPLETED WORK
A. High Precision Mid-IR Spectroscopy
1. Instrument Description
Two years were spent developing and testing a new instrument designed to perform high
precision, high sensitivity, mid-IR spectroscopy. The instrument is described by Crabtree
et al., which is attached for convenience. [8] The instrument employs a spectroscopic tech-
nique called Noise Immune Cavity Enhanced Optical Heterodyne Velocity Modulation Spec-
troscopy or NICE-OHVMS. This technique was developed in the near-IR by Siller et al. [9]
and is a combination of velocity modulation spectroscopy (VMS) [10–12] and Noise Immune
Cavity Enhanced Optical Heterodyne Molecular Spectroscopy (NICE-OHMS) [13, 14]
This instrument is the first application of NICE-OHVMS in the mid-IR, and it may be
2

seen in the block diagram in Figure 2. It uses a cw-optical parametric oscillator (cw-OPO)
as the light source, which is tunable from 3.2 to 3.9 µm. The light is generated in a ytterbium
doped fiber laser operating at 1064 nm, which is coupled into a fiber electro-optic modulator
(EOM). The EOM is driven at ∼ 4 MHz to generate side bands for Pound-Drever-Hall
(PDH) locking and is simultaneously driven at ∼ 80 MHz to generate heterodyne sidebands
for spectroscopy. After amplification, the light then enters into a fiber amplifier intensifying
the laser power to 10 W. After amplification, the light travels into a bow-tie cavity, which
is resonant between 1.5 to 1.6 µm. The cavity is where the OPO process occurs. It is singly
resonant so the sidebands are imprinted on the idler but not on the signal beam.
The idler beam is coupled into an external cavity for spectroscopy, which is PDH locked to
the idler frequency. Corrections occurring below ∼ 100 Hz are made by adjusting the cavity
length via a piezo-electric transducer (PZT) attached to a cavity mirror. Faster corrections
are made by varying the length of the signal cavity of the OPO. Within the cavity is a liquid
nitrogen cooled positive column discharge cell where a plasma is modulated at ∼ 40 kHz.
The back reflected light is detected for PDH locking, and the transmitted light is used for
heterodyne detection. The transmitted light is first demodulated by two mixers at ∼ 80
MHz and further demodulated by a pair of lock-in amplifiers at twice the plasma frequency.
The resulting four channels of detection correspond to in-phase and quadrature detection
from the lock-in amplifiers for each mixer.
Frequency calibration is performed either with a wavemeter or a frequency comb. The
pump and signal beams are measured, and the idler frequency is determined by the difference
of the pump and signal frequencies, shown in Equation 1. Here, fi is the frequency of the
idler, fp is the frequency of the pump, and fs is the frequency of the signal.
fi = fp − fs (1)
The inclusion of a frequency comb in this experiment is critical to lending unparalleled
precision and accuracy to the determination of line centers. The improvement over ordinary
wavemeters is drastic. Wavemeters tend to be accurate within 30 to 60 MHz, whereas
sub-MHz precision and accuracy are typical with a frequency comb. Sub-MHz precision is
critical to determining rotational spectra via combination differences. The requirement is a
result of the intrinsically narrow linewidth of rotational lines.
Determination of a laser frequency with the comb is governed by Equation 2. In Equation
3

2, f is the frequency of the laser, n is the mode number of the frequency comb as determined
by a wavemeter measurement, frep is the repetition rate of the comb, fceo is the carrier
envelope offset, and fbeat is the frequency of the beat note of the laser against the comb. For
the case of determining the idler frequency, Equation 1 is combined with Equation 2. The
result is shown in Equation 3.
f = n(frep)± fceo ± fbeat (2)
fi = (np − ns)frep ± fpbeat ∓ fsbeat (3)
In Equation 3, fi is the idler frequency, np and ns are the pump and signal modes determined
by two wavemeter measurements, fpbeat is the pump beat, and fsbeat is the signal beat on
the comb.
Scanning with the comb is accomplished by locking the pump to a comb mode and slewing
the repetition rate of the comb. However, by changing the repetition rate, the signal beat
is moved out of the bandpass region on the frequency counter during the scan. In order
to remedy this, the signal light is coupled through an acousto-optic modulator (AOM) in
a double pass configuration illustrated in Figure 2. The first order diffracted beam passes
through the AOM twice leading to a shift in signal frequency of 2fAOM . This configuration
is such that the pointing is independent of the AOM frequency. By shifting the frequency
of the signal, the signal beat remains in the bandpass region of the frequency counter.
When the extreme ranges of the AOM are reached, the frequency is reset and the signal
mode number is incremented or decremented depending on the scan direction. Ultimately,
the comb measures the fsbeat + 2fAOM , but the contribution by the AOM is subtracted in
software before fi is determined by Equation 3.
2. Testing via H+3
Spectroscopy
The instrument was first tested by measuring the R(1,0) and R(1,1)u transitions of the
ν2 vibrational band of H+
3 . [8] H+
3 was created in a pure hydrogen plasma by the elec-
tron ionization of a hydrogen molecule and the subsequent reaction with another hydrogen
molecule.
H2 + e− → H+
2 + 2e− (4)
H+
2 +H2 → H+
3 +H
4

H+
3 is the most abundant molecular ion in a hydrogenic discharge. [15] The relative ease of
production and abundance make it suitable testbed for the instrument.
The use of a high power light source and an optical cavity enable the saturation of
rovibrational transitions. Spectroscopically, this phenomenon manifests as Lamb dips in the
spectra. The NICE-OHVMS instrument observed Lamb dips for both R(1,0) and R(1,1)u,
shown in Figure 3. R(1,0) is shown in Figure 4. These are not the first Lamb dips to be
observed for H+
3 , [16] but the they do represent the highest signal to noise Lamb dips of
H+
3 to date and, therefore, are easily fit to high precision for line center determination. An
example fit may be seen in Figure 5. The full width at half maximum (FWHM) value for
the Lamb dips is ∼ 60 MHz. Since the heterodyne frequency is on the order of the Lamb dip
width and all the Lamb dips are blended together, it is difficult to make a precise statement
about the FWHM.
The initial work was completed before the frequency comb was integrated into the in-
strument, but the precision associated with the fitting the R(1,0) Lamb dips was 70 kHz
(the spectra from all four acquisition channels are simultaneously fit). Current work is un-
derway to measure the transitions calibrated to a frequency comb. Early results indicate a
statistical standard deviation of ∼ 400 kHz for line center determination, which supports
the instrumental claim that line centers may be determined to sub-MHz precision.
The sensitivity of the instrument was determined to be 8.5 × 10⁻¹⁰ cm−1Hz−1/2, which
corresponds to about two orders of magnitude above the shot noise limit for this particu-
lar system. Other fiber based lasers used in NICE-OHMS have similarly had sensitivities
that were between one and two orders of magnitude away from the shot noise limit. This
discrepancy is attributed to poor polarization matching to the EOM due to residual mis-
alignments in the fiber production process.[17, 18]. This causes fiber based lasers to be
especially sensitive to environmental factors.
B. Indirect Rotational Spectroscopy of HCO+
As a testbed for determining a rotational spectrum indirectly, the cavity was removed
and the instrument was used in a single pass configuration. The second attached paper
describes this work. [19] Without a counter propagating beam, sub-Doppler spectroscopy
is not possible. Therefore, Doppler broadened lines of HCO+ were observed instead. The
5

P(10) through R(9) lines of the ν1 fundamental band were all comb calibrated and fit to
determine the line centers. The line centers were compared to the previous work by Amano.
[20] The average signal to noise was ∼ 300 for the more intense lines and ∼ 100 for the
least intense lines. The statistical precision on the line center determination was ∼ 600 kHz.
Combination differences were calculated for the ground state and 1ν1 excited state. The
largest error compared to the known ground state rotational spectra [1] was 2.5 MHz. By
using the J = 3 ← 2 transition in the 1ν1 state [21], the entire excited rotational spectrum
was determined with an average error of ∼ 2 MHz, which is well within a reasonable window
for a direct rotational search. The band origin was determined to be ν = 3088.739009(5)
cm−1, and the excited state rotational constants B1 = 44240.536(9) MHz and D1 = 82.31(9)
kHz were determined. This work is a clear demonstration of how combination differences
can be used to calculate rotational spectra.
III. PROPOSED WORK
Highly fluxional species are molecules with large amplitude internal motions. In general,
these molecules may be considered as having saddle points that are close to the minimum
potential energy relative to the zero point energy. These saddle points have significant wave-
function amplitude, which suggests that the molecules are, in classical terms, undergoing
near constant motion through these low energy pathways.
Two examples of fluxional molecules with five equivalent atoms are addressed herein,
CH+
5 and H+
5 . CH+
5 can undergo a flip motion and internal rotation. [22, 23] Whereas, H+
5
has 9 conformations all within ∼ 2800 cm−1 of the minimum, demonstrating the relative
ease with which this molecule may change conformation. [24]
A. CH+5
Spectroscopy
The molecular ion CH+
5 was first observed via high resolution infrared spectroscopy by
White et al. [25] There were 917 lines observed belonging to the ion between 2770 and 3150
cm−1. However, it remains unassigned due to the fluxional nature of the molecule. The
potential energy surface has two saddle points that exist at low energies and have significant
wavefunction amplitude in the ground state. Classically, it is analogous to the protons
6

continuously scrambling around the carbon atom. There are 5! = 120 equivalent minima
with Cs symmetry, there are 120 saddle points that correspond to the internal rotation ∼
40 cm−1 above the global minimum, and there are 60 saddle points that correspond to the
flip motion ∼ 300 cm−1above the global minimum. [26]
The most accurate work to date is a numerically exact 12 dimensional calculation of
the vibrational energy levels. [26] However, it makes no consideration of rotation so it
cannot represent actual transitions of CH+
5 . The interesting result from this work is that
the potential energy surface is modified by creating a “floor” that is used to fill the low
level energy structures. The calculations found that the pattern in vibrational frequencies
did not change significantly, which seems to suggest that these structures are insignificant
to the overall spectral pattern related to vibrational energy levels.
There has also been considerable work completed in determining the millimeter-wave
spectrum of CH+
5 . The most recent work was by Bunker et al. [27] wherein a rotational
spectrum was calculated by considering the flip and internal rotation coordinates solely.
Though the range in which the J = 1 ← 0 rotation transition is predicted to occur is too
large to be useful(15 GHz), the overall structure may be similar to what is observed by
performing a combination differences analysis.
1. Four-line Combination Differences Analysis
Using the NICE-OHVMS spectrometer, the 917 observed lines of CH+
5 will be revisited
using high precision spectroscopy. CH+
5 is produced in a hydrogen dominated plasma with
methane. The reaction of H+
3 with CH4 is the most significant production path. [25].
CH4 +H+
3 → H2 + CH+
5 (5)
Initial observations have been made but they are not instrumentally optimized. Figures
6 and 7 show these spectra. Currently, we are limited by absorption in the cavity mirrors
due to water in the dielectric coating. Nevertheless, after the optimum signal is achieved,
the transitions can be measured with unprecedented accuracy.
Frequency comb calibrating the scans and fitting Lamb dips for each transition will result
in a significant advancement in the field. The most exciting analysis of these high precision
lines that can be performed is a combination difference calculation. When such an analysis
7
is done on a molecule with known rotational structure, the rotational spectrum can be
calculated. This is not the case with CH+
5 . This particular ion has never had a rotational
spectrum observed. For this reason, four-line combination differences are necessary.
An ordinary combination difference is calculated between two transitions that share a
known state. Without a priori knowledge of the rovibrational structure, a single combination
difference is useless for determining energy level spacings. However, if there exists a pair
of combination differences that match, the energy level spacing is a valid rotational energy
level spacing.
After determining all of the values of the energy levels from these unassigned lines, a
pattern may emerge, which is a real experimental advance. It is important to note that this
will not provide an assignment, but may provide insight into the underlying structure.
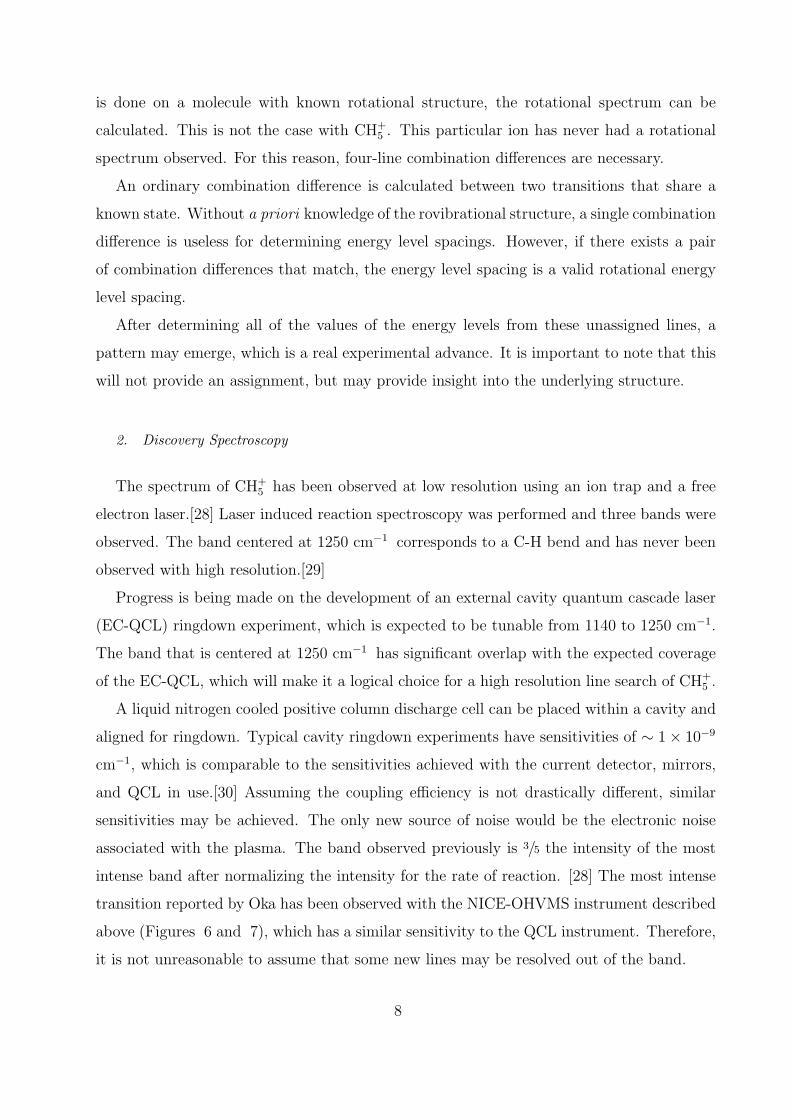
2. Discovery Spectroscopy
The spectrum of CH+
5 has been observed at low resolution using an ion trap and a free
electron laser.[28] Laser induced reaction spectroscopy was performed and three bands were
observed. The band centered at 1250 cm−1 corresponds to a C-H bend and has never been
observed with high resolution.[29]
Progress is being made on the development of an external cavity quantum cascade laser
(EC-QCL) ringdown experiment, which is expected to be tunable from 1140 to 1250 cm−1.
The band that is centered at 1250 cm−1 has significant overlap with the expected coverage
of the EC-QCL, which will make it a logical choice for a high resolution line search of CH+
5 .
A liquid nitrogen cooled positive column discharge cell can be placed within a cavity and
aligned for ringdown. Typical cavity ringdown experiments have sensitivities of ∼ 1× 10⁻⁹
cm−1, which is comparable to the sensitivities achieved with the current detector, mirrors,
and QCL in use.[30] Assuming the coupling efficiency is not drastically different, similar
sensitivities may be achieved. The only new source of noise would be the electronic noise
associated with the plasma. The band observed previously is 3/5 the intensity of the most
intense band after normalizing the intensity for the rate of reaction. [28] The most intense
transition reported by Oka has been observed with the NICE-OHVMS instrument described
above (Figures 6 and 7), which has a similar sensitivity to the QCL instrument. Therefore,
it is not unreasonable to assume that some new lines may be resolved out of the band.
8

B. Discovery Spectroscopy of H+5
H+
5 is a highly fluxional molecule that has not yet been observed with high resolution
spectroscopy. Diffusion Monte Carlo (DMC) and variational techniques have been used to
assign vibrational modes to observed multi-photon dissociation spectra.[31, 32]. These works
have illustrated that the exchange of the proton is a high intensity mode. The very high
intensity mode is due to the large change in dipole associated with a moving charge as is
expected, but the exact vibrational energies associated with these methods may not be en-
tirely accurate. Using DMC for excited states rather than the ground state assumes a priori
knowledge of the excited state nodal structure. [33] This approach can be inaccurate due
to the sensitivity of the answer to the assumptions that go into the calculation. Variational
techniques require the choice of a reference geometry, which is difficult when dealing with
fluxional molecules.
These theoretical challenges, however, do not diminish the importance of the multi-photon
dissociation work. There are many bands that have been observed in a recent publication
by Cheng et al. [32]. Most importantly, there exists a band centered at 1180 cm−1, which
is within the coverage of the EC-QCL system. It appears to be a low intensity band, but
it is important to consider that intensities are more or less meaningless for multi-photon
dissociation. Multi-photon dissociation spectroscopy relies on the fortuitous alignment of
photon energies with transitions up until the dissociation energy is reached, and the molecule
is destroyed. These fortuitous alignments may or may not overlap with transitions, which
affects the observed intensity of the band. In a purely harmonic system, the intensity
would be significant because the observed intensity would simply be normalized against the
number of photons that were absorbed. However, H+
5 is very anharmonic and the intensities
displayed bear little relevance to the intensity of an absorption feature. [32] Additionally,
the exact band centers may not correspond perfectly to the band center of an absorption
spectrum. Enhanced resonance may not occur precisely peaked at the center of the band,
instead relying on the density of states to help match the ideal route to dissociation.
This molecular ion is formed in a hydrogenic plasma via the clustering of H+
3 with a
hydrogen molecule.
H+
3 +H2 +H2 → H+
5 +H2 (6)
The reactant species in Equation 6 are the most common species in a hydrogen plasma
9

so production is feasible. H+
5 has been experimentally inferred by observing a reduction
at higher pressures of the intensity of H+
3 transitions. [34] This reaction to produce H+
5
relies on three-body collisions to remove the excess energy of the H+
5 complex. The removal
of excess energy allows the ion to stabilize below its dissociation energy. Therefore, the
production proceeds more favorably at higher pressures. A hollow cathode can achieve
colder temperatures when cooled with liquid nitrogen and higher pressures as compared to
a positive column. These facts make it a better choice for the production of H+
5 . [34] By using
the EC-QCL system with a hollow cathode, a line search may be conducted. New transitions
that can be attributed to H+
5 may be observed with rotational resolution for the first time,
which would be a boon to understanding this fluxional molecular ion. By providing theorists
with a target spectrum, numerical calculations similar to the work accomplished by Wang
et al. [26] may be undertaken.
IV. SUMMARY
The first mid-IR NICE-OHVMS spectrometer has been constructed. It made its debut
with sub-Doppler spectroscopy of H+
3 , and the resultant Lamb dips were fit to sub-MHz pre-
cision and accuracy, demonstrating the utility of the instrument. The quality of combination
differences using this instrument was assessed via Doppler broadened HCO+ spectroscopy.
The results were used to implement indirect rotational spectroscopy.
Four-line combination differences are proposed for the 917 previously observed transitions
between 2770 and 3150 cm−1. It is hoped that information regarding the underlying structure
of CH+
5 can be gained. Using an EC-QCL, line searches are to be conducted for CH+
5 and
H+
5 in the 1140 to 1250 cm−1 region, discovering new transitions belonging to these species
to guide theory.
[1] G. Cazzoli, L. Cludi, G. Buffa, C. Puzzarini, “Precise THz Measurements of HCO+ , N2H+ ,
and CF+ for Astrophysical Observations” Astrophys. J. Suppl. S. (2012), 203(1), 11.
[2] D. Buhl, L. E. Snyder, “Unidentified interstellar microwave line.” Nature (1970), 228(5268),
267–9.
10

[3] R. Woods, T. Dixon, R. Saykally, P. Szanto, “Laboratory Microwave Spectrum of HCO+”
Phys. Rev. Lett. (1975), 35(19), 1269–1272.
[4] C. Sanchez Contreras, R. Sahai, “Physical Structure of the Protoplanetary Nebula CRL 618.
II. Interferometric Mapping of a Millimeter-wavelenght HCN J = 1-0, HCO+ J = 1-0, and
Continuum Emission” Astrophys. J. (2004), 602(2), 960–977.
[5] C. R. Purcell, R. Balasubramanyam, M. G. Burton, a. J. Walsh, V. Minier, M. R. Hunt-
Cunningham, L. L. Kedziora-Chudczer, S. N. Longmore, T. Hill, I. Bains, P. J. Barnes,
a. L. Busfield, P. Calisse, N. H. M. Crighton, S. J. Curran, T. M. Davis, J. T. Dempsey,
G. Derragopian, B. Fulton, M. G. Hidas, M. G. Hoare, J.-K. Lee, E. F. Ladd, S. L. Lumsden,
T. J. T. Moore, M. T. Murphy, R. D. Oudmaijer, M. B. Pracy, J. Rathborne, S. Robertson,
a. S. B. Schultz, J. Shobbrook, P. a. Sparks, J. Storey, T. Travouillion, “A CH3CN and
HCO+ survey towards southern methanol masers associated with star formation” Mon. Not.
R. Astron. Soc. (2006), 367(2), 553–576.
[6] S. N. Milam, C. Savage, L. M. Ziurys, S. Wyckoff, “HCO+ Observations toward comet Hale-
Bopp (C/1995 O1): Ion-molecule Chemistry and Evidence for a Volatile Secondary Source”
Astrophys. J. (2004), 615(2), 1054–1062.
[7] H. Liszt, R. Lucas, “Mm-wave HCO+, HCN and CO absorption toward NGC 1052” Astron.
Astrophys. (2004), 428(2), 445–450.
[8] K. N. Crabtree, J. N. Hodges, B. M. Siller, A. J. Perry, J. E. Kelly, P. A. Jenkins, B. J. McCall,
“Sub-Doppler mid-infrared spectroscopy of molecular ions” Chem. Phys. Lett. (2012), 551,
1–6.
[9] B. M. Siller, M. W. Porambo, A. A. Mills, B. J. McCall, “Noise immune cavity enhanced
optical heterodyne velocity modulation spectroscopy.” Opt. Express (2011), 19(24), 24822–7.
[10] C. Gudeman, M. Begemann, J. Pfaff, R. Saykally, “Velocity-Modulated Infrared Laser Spec-
troscopy of Molecular Ions: The ν1 Band of HCO+” Phys. Rev. Lett. (1983), 50(10), 727–731.
[11] S. K. Stephenson, R. J. Saykally, “Velocity modulation spectroscopy of ions.” Chem. Rev.
(2005), 105(9), 3220–34.
[12] C. S. Gudeman, R. J. Saykally, “Velocity Modulation Infrared Laser Spectroscopy of Molecular
Ions” Annu. Rev. Phys. Chem. (1984), 35(1), 387–418.
[13] L.-S. Ma, J. Ye, P. Dube, J. L. Hall, “Ultrasensitive frequency-modulation spectroscopy en-
hanced by a high-finesse optical cavity: theory and application to overtone transitions of C2H2
11

and C2HD” J. Opt. Soc. Am. B (1999), 16(12), 2255.
[14] A. Foltynowicz, F. Schmidt, W. Ma, O. Axner, “Noise-immune cavity-enhanced optical het-
erodyne molecular spectroscopy: Current status and future potential” Appl. Phys. B (2008),
92(3), 313–326.
[15] T. Oka, “Observation of the Infrared Spectrum of H+3” Phys. Rev. Lett. (1980), 45(7), 531–534.
[16] H.-C. Chen, C.-Y. Hsiao, J.-L. Peng, T. Amano, J.-T. Shy, “High-Resolution Sub-Doppler
Lamb Dips of the ν2 Fundamental Band of H+3” Phys. Rev. Lett. (2012), 109(26), 263002.
[17] P. Ehlers, I. Silander, J. Wang, O. Axner, “Fiber-laser-based noise-immune cavity-enhanced
optical heterodyne molecular spectrometry instrumentation for Doppler-broadened detection
in the 10−12cm−1Hz−1/2 region” J. Opt. Soc. Am. B (2012), 29(6), 1305.
[18] A. Foltynowicz, I. Silander, O. Axner, “Reduction of background signals in fiber-based NICE-
OHMS” J. Opt. Soc. Am. B (2011), 28(11), 2797.
[19] B. M. Siller, J. N. Hodges, A. J. Perry, B. J. McCall, “Indirect rotational spectroscopy of
HCO+” (2013), J. Phys. Chem. A, Submitted.
[20] T. Amano, “The ν1 fundamental band of HCO+ by difference frequency laser spectroscopy”
J. Chem. Phys. (1983), 79(7), 3595.
[21] V. Lattanzi, A. Walters, B. J. Drouin, J. C. Pearson, “Rotational Spectrum of the Formyl
Cation, HCO+ , to 1.2 THz” Astrophys. J. (2007), 662(1), 771–778.
[22] M. Kolbuszewski, P. R. Bunker, “Potential barriers, tunneling splittings, and the predicted
J=1←0 spectrum of CH+5” J. Chem. Phys. (1996), 105(9), 3649.
[23] A. L. L. East, M. Kolbuszewski, P. R. Bunker, “Ab Initio Calculation of the Rotational
Spectrum of CH+5and CD+
5” J. Phys. Chem. A (1997), 101(36), 6746–6752.
[24] Y. Yamaguchi, J. F. Gaw, R. B. Remington, H. F. Schaefer, “The H+5potential energy hyper-
surface: Characterization of ten distinct energetically low-lying stationary points” J. Chem.
Phys. (1987), 86(9), 5072.
[25] E. T. White, J. Tang, T. Oka, “CH+5: The Infrared Spectrum Observed” Science (1999),
284(5411), 135–137.
[26] X.-G. Wang, T. Carrington, “Vibrational energy levels of CH+5” J. Chem. Phys. (2008),
129(23), 234102.
[27] P. Bunker, B. Ostojic, S. Yurchenko, “A theoretical study of the millimeterwave spectrum of
CH+5” J. Mol. Struct. (2004), 695-696, 253–261.
12

[28] O. Asvany, P. Kumar P, B. Redlich, I. Hegeman, S. Schlemmer, D. Marx, “Understanding the
Infrared Spectrum of Bare CH+5” Science (2005), 309(5738), 1219–1222.
[29] X. Huang, A. McCoy, J. Bowman, L. Johnson, C. Savage, F. Dong, D. Nesbitt, “Quantum
Deconstruction of the Infrared Spectrum of CH+5” Science (2006), 311(5757), 60–63.
[30] B. E. Brumfield, J. T. Stewart, S. L. Widicus Weaver, M. D. Escarra, S. S. Howard, C. F.
Gmachl, B. J. McCall, “A quantum cascade laser cw cavity ringdown spectrometer coupled
to a supersonic expansion source.” Rev. Sci. Instrum. (2010), 81(6), 063102.
[31] T. C. Cheng, B. Bandyopadyay, Y. Wang, S. Carter, B. J. Braams, J. M. Bowman, M. a.
Duncan, “Shared-Proton Mode Lights up the Infrared Spectrum of Fluxional Cations H+5and
D+5” J. Phys. Chem. Lett. (2010), 1(4), 758–762.
[32] T. C. Cheng, L. Jiang, K. R. Asmis, Y. Wang, J. M. Bowman, A. M. Ricks, M. A. Duncan,
“Mid- and Far-IR Spectra of H+5and D+
5Compared to the Predictions of Anharmonic Theory”
J. Phys. Chem. Lett. (2012), 3(21), 3160–3166.
[33] Z. Lin, A. B. McCoy, “Signatures of Large-Amplitude Vibrations in the Spectra of H+5
and
D+5” J. Phys. Chem. Lett. (2012), 3(24), 3690–3696.
[34] K. N. Crabtree, C. A. Kauffman, B. A. Tom, E. Becka, B. A. McGuire, B. J. McCall, “Nuclear
spin dependence of the reaction of H+3
with H2. II. Experimental measurements.” J. Chem.
Phys. (2011), 134(19), 194311.
13

Figures
FIG. 1: Illustration of the determination of the rotational energy level spacing, ∆EJ=2←0, by
combination difference.
14

FIG. 2: A block diagram of the instrument. (YDFL: Ytterbium Doped Fiber Laser, EOM: Electro-
optic Modulator, OPO: Optical Parametric Oscillator, P: Pump, S: Signal, I: Idler, PZT: Piezo
Tranducer, PSD: Phase Sensitive Detector, RF: Radio Frequency Generator, PS: Phase Shifter,
AOM: Acousto-optic Modulator)
15
6
4
2
0
-2
Mix
er 1
Sig
nal (
AU
)
2726.32726.22726.12726.02725.9
Frequency (cm-1
)
6
4
2
0
-2
Mix
er 2
Sig
nal (
AU
)
2726.32726.22726.12726.02725.9
Frequency (cm-1
)
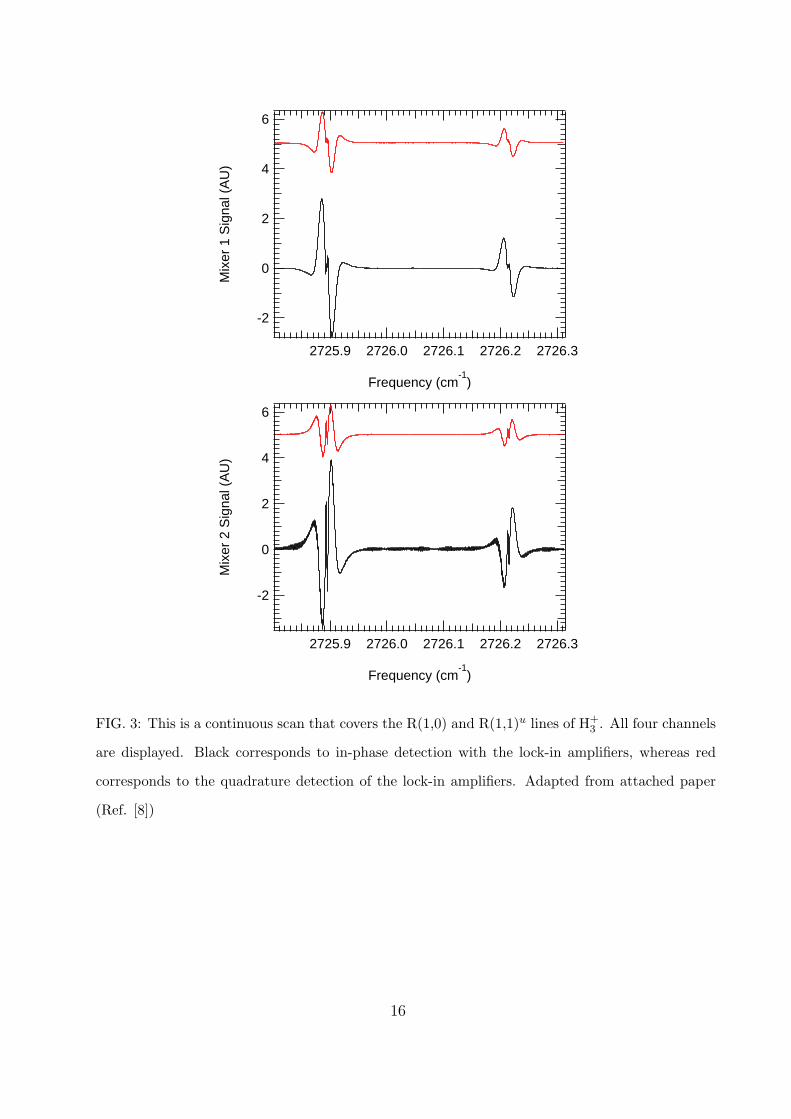
FIG. 3: This is a continuous scan that covers the R(1,0) and R(1,1)u lines of H+3. All four channels
are displayed. Black corresponds to in-phase detection with the lock-in amplifiers, whereas red
corresponds to the quadrature detection of the lock-in amplifiers. Adapted from attached paper
(Ref. [8])
16

3
2
1
0
-1
-2
-3
Sig
nal (
AU
)
2725.962725.922725.882725.84
Frequency (cm-1
)
FIG. 4: A smaller scan showing the output of mixer 1. Black corresponds to in-phase detection
with the lock-in amplifiers, whereas red corresponds to the quadrature detection of the lock-in
amplifiers.Adapted from attached paper (Ref. [8])
17

-2
-1
0
1
2
Sig
nal (
AU
)
-100 -50 0 50 100
Relative Frequency (MHz)
-0.2
0.0
0.2
M1
Res
id.
-0.2
0.0
0.2
M2
Res
id.
Mixer 1 In-phase Mixer 1 Quadrature
Mixer 2 In-phase Mixer 2 Quadrature
FIG. 5: Zoomed in fit of Lamb dips. The output of all four channels is displayed and the residuals
are plotted according to which mixer they correspond. The in-phase and quadrature detection
corresponds to the phase of the lock-in amplifiers. Adapted from attached paper (Ref. [8])
18

FIG. 6: Preliminary scan of CH+5. Output from mixer 1. The red trace is the in-phase detection
the blue trace is the quadrature detection. There may be a hint of a Lamb dip in the quadrature
channel.
FIG. 7: Preliminary scan of CH+5. Output from mixer 2. The red trace is the in-phase detection
the blue trace is the quadrature detection.
19

FRONTIERS ARTICLE
Sub-Doppler mid-infrared spectroscopy of molecular ions
Kyle N. Crabtree a,1, James N. Hodges a, Brian M. Siller a, Adam J. Perry a, Joseph E. Kelly a,Paul A. Jenkins II a, Benjamin J. McCall a,b,⇑
aDepartment of Chemistry, University of Illinois, Urbana, IL 61801, USAbDepartments of Astronomy and Physics, University of Illinois, Urbana, IL 61801, USA
a r t i c l e i n f o
Article history:
Available online 15 September 2012
a b s t r a c t
The technique of velocity modulation spectroscopy has recently been combined with cavity enhancement
and frequency modulation methods into a technique called noise-immune cavity-enhanced optical het-
erodyne velocity modulation spectroscopy (NICE-OHVMS). We have implemented NICE-OHVMS with a
cw-optical parametric oscillator (OPO) tunable from 3.2 to 3.9 lm, and used it to record spectra of the
R(1,0) and R(1,1)u transitions of the m2 fundamental band of Hþ3 . The high optical power and cavity
enhancement enable saturation of rovibrational transitions, which allows for line center frequencies to
be measured with a precision of 70 kHz.
� 2012 Elsevier B.V. All rights reserved.
1. Introduction
Molecular ions play a key role as intermediates in chemical
reactions, and a detailed understanding of their structure and
intramolecular dynamics in the gas phase, generally obtained by
spectroscopy, is a critical first step toward understanding their
behavior in more complicated systems. The primary technique
used for ion spectroscopy over the past 30 years has been velocity
modulation spectroscopy (VMS) [1,2]. In VMS, ions are produced in
an AC positive column plasma whose polarity is alternated at fre-
quency fvm. The average drift velocity of the ions in the plasma is
shifted toward the cathode from the applied electric field, while
neutral molecules are generally unaffected. As the polarity is re-
versed, the average ion drift velocity also reverses, resulting in a
periodic oscillation in the ion velocity distribution at fvm. By inter-
rogating the ions with a laser beam passing in one direction
through the plasma, the absorption profiles are alternately red-
and blue-shifted with respect to their rest frequencies, and
phase-sensitive detection at fvm allows for selective retrieval of io-
nic signals. VMS therefore addresses one of the main challenges of
ion spectroscopy, i.e., detection of ionic species that are only
�10�5—10�6 as abundant as neutral molecules. Well over 40 un-
ique molecular ions (not including isotopologues) have been de-
tected with VMS; these have been extensively reviewed by
Stephenson and Saykally [3].
Recently, the use of a Fabry–Perot optical cavity to enhance the
optical path length was demonstrated by Siller et al. (cavity-en-
hanced velocity modulation spectroscopy, CEVMS), who locked a
Ti:Sapphire laser to an optical cavity surrounding a velocity mod-
ulated positive column cell and detected the transmitted light [4].
Because the light in the cavity is bidirectional, red and blue Dopp-
ler shifts are simultaneously superimposed, encoding the velocity
modulation (VM) signal at 2fvm. Initially, this was believed to be
problematic because any neutral molecules produced or excited
by the discharge are concentration modulated (CM) at 2fvm; that
is, the population of the excited species varies with the magnitude
of the applied voltage, but not the sign of the voltage. By also
encoding the ion signal at 2fvm, it was thought the concentration
modulation signal of neutral molecules would overwhelm the ion
velocity modulation signal. Siller et al. showed that the ion and
neutral signals occurred at different phases with respect to the
plasma voltage, thereby preserving ion-neutral discrimination
through phase-sensitive detection. Additionally, the power
enhancement from the optical cavity enables saturation spectros-
copy and precise line-center determination [5]. A related tech-
nique has also been employed using an optical frequency comb
as the light source and a unidirectional ring cavity surrounding
a plasma cell, effectively converting VMS to a broadband tech-
nique while preserving the high resolution of laser spectroscopy
[6].
Cavity enhanced absorption spectroscopy suffers from the fact
that frequency noise in the laser is directly converted into intensity
noise as a result of reduced cavity transmission. This limitation
was overcome by Ye et al. with noise-immune cavity-enhanced
0009-2614/$ - see front matter � 2012 Elsevier B.V. All rights reserved.
http://dx.doi.org/10.1016/j.cplett.2012.09.015
⇑ Corresponding author at: Department of Chemistry, University of Illinois,
Urbana, IL 61801, USA.
E-mail addresses: [email protected] (K.N. Crabtree), [email protected]
(J.N. Hodges), [email protected] (B.M. Siller), [email protected] (A.J. Perry),
[email protected] (B.J. McCall).
URL: http://bjm.scs.illinois.edu (B.J. McCall).1 Present address: Harvard-Smithsonian Center for Astrophysics, Cambridge, MA
02138, USA.
Chemical Physics Letters 551 (2012) 1–6
Contents lists available at SciVerse ScienceDirect
Chemical Physics Letters
journal homepage: www.elsevier .com/ locate /cplet t

optical heterodyne molecular spectroscopy (NICE-OHMS) [7]. In
this technique, the laser is phase modulated at fh (typically
�100s of MHz), effectively generating an FM triplet consisting of
a carrier (at the optical frequency fo) and a pair of sidebands with
opposite phase at fo � fh. The triplet is coupled into the optical cav-
ity by setting fh equal to an integer multiple of the cavity free spec-
tral range (FSR). In the absence of any intracavity absorption or
dispersion, the beat notes between each sideband beating with
the carrier are balanced in both amplitude and phase, so there is
no net signal at fh. However, in the presence of an intracavity ab-
sorber or disperser, the beat notes are unbalanced in amplitude
and/or phase, yielding a net signal. By encoding absorption/disper-
sion information at a high frequency, 1=f technical noise is re-
duced. Another advantage is that any laser frequency noise
affects the cavity coupling efficiency of the carrier and both side-
bands equally, which keeps the beat notes of each sideband with
the carrier balanced, and eliminates direct conversion of laser fre-
quency noise to noise in the final spectrum. The disadvantages are
the complexity of the technique, particularly the demands of main-
taining the laser-cavity lock, and the requirement of a detector
whose bandwidth is at least fh. An extensive review of the NICE-
OHMS technique has been published by Foltynowicz et al. [8].
CEVMS and NICE-OHMS have been combined into a technique
called noise-immune cavity enhanced optical heterodyne velocity
modulation spectroscopy (NICE-OHVMS) in the near-infrared with
a Ti:Sapphire laser [9]. Because fh and fvm are at significantly differ-
ent frequencies (typically �100 MHz and �10 kHz, respectively),
the detector signal is first demodulated at fh, and then sent on to
further phase-sensitive detection at 2fvm. NICE-OHVMS preserves
the ion-neutral discrimination afforded by VMS, and takes advan-
tage of the ultra-high sensitivity, saturation, and noise immunity
of NICE-OHMS.
However, the technical demands of the NICE-OHMS technique
have largely precluded its use in the mid-infrared spectral region
in which VMS has been successfully exploited. The high bandwidth
detectors and phase modulators required for NICE-OHMS are not
as readily available in the mid-IR compared with the visible/
near-IR. The only published mid-IR NICE-OHMS work was done
with a quantum cascade laser near 8.5 lm, and was limited by
the detector bandwidth and the phase modulation characteristics
of the device [10]. Work is currently underway in our laboratory
to extend NICE-OHMS into the mid-IR using a difference frequency
generation (DFG) source in the 3–5 lm region [11], which is partic-
ularly attractive for a general-purpose ion spectrometer because
the vast majority of molecules have at least one fundamental
vibrational band in that portion of the spectrum.
Here we report the first mid-IR NICE-OHVMS spectrometer,
which uses a commercially available cw-optical parametric oscilla-
tor (OPO) tunable from 3.2 to 3.9 lm. The high optical power of the
OPO (�1 W) allows for use of high bandwidth mid-IR detectors
that are not sensitive enough to be used with many other lower-
power cw lasers in this region. This technique enables all of the
advantages of the NICE-OHVMS technique to be brought to bear
on fundamental vibrational transitions of molecular ions, including
high precision sub-Doppler spectroscopy.
Our initial demonstration of this instrument focuses on the
study of Hþ3 , which is the simplest polyatomic molecular ion and
serves as the primary initiator of ion–molecule chemistry in inter-
stellar clouds [12,13]. Its infrared spectrum was first observed by
Oka in 1980 [14], and since then it has been extensively studied
spectroscopically (see, for instance, the review in Ref. [15]). More
recent research on Hþ3 focuses on spectroscopy above the so-called
‘‘barrier to linearity,’’ at which point the molecule adopts a linear
geometry that induces a singularity in the Hamiltonian, complicat-
ing its theoretical treatment [16]. Nevertheless, for the lowest-ly-
ing energy levels, the agreement between experiment and ab
initio theory is good to spectroscopic accuracy [17]. Measuring
the energy level spacings experimentally with higher precision
and accuracy would present a greater challenge for ab initio theory,
possibly spurring new developments. The NICE-OHVMS technique
opens the possibility of measuring such energy level spacings in
Hþ3 .
As a demonstration of the capabilities of this instrument, we
present in this Letter spectra of the m2 fundamental band of Hþ3 at
3.67 lm. In Section 2 we describe the instrumental details, and
in Section 3 we discuss NICE-OHVMS lineshapes and present spec-
tra acquired with the instrument. Finally, in Section 4, the perfor-
mance of the instrument is assessed, and future directions are
discussed.
2. Experimental details
Our NICE-OHVMS instrument is outlined in Figure 1. A Ytter-
bium-doped fiber laser (YDFL, Koheras Adjustik Y-10) is sent
through a fiber EOM (EOSPACE PM-0K5–00-PFU-PFU-106-S),
amplified (IPG Photonics YAR-10 K-1064-LP-SF), and used to pump
a singly-resonant OPO (Aculight Argos 2400 SF). The pump
(1.064 lm) and signal (1.5–1.6 lm) beams are sent to a wavemeter
(Burleigh WA-1500) for frequency calibration. The idler (3.2–
3.9 lm) is locked with the Pound-Drever-Hall (PDH) technique to
a 1.9-m-long optical cavity consisting of two 1 m radius of curva-
ture concave Si mirrors dielectric coated for 99.7% reflectivity over
3.1–3.4 lm surrounding a plasma cell. Cavity reflection and trans-
mission are monitored by photodiodes (Boston Electronics Vigo
PVM-10.6-1x1) with an effective bandwidth of �125 MHz.
Heterodyne and PDH sidebands are generated by applying volt-
ages at their respective frequencies to the fiber EOM on the seed
laser simultaneously. The resultant frequency spectrum of the
pump laser is imprinted on the idler beam. A PDH error signal used
for cavity locking is generated by demodulating the cavity reflec-
tion signal at the frequency RF1 (typically 2–20 MHz). The error
signal is sent to feedback electronics which stabilize the length
of the cavity on slow timescales via a piezoelectric transducer
(PZT) attached to one of the cavity mirrors, and apply fast correc-
tions to the idler frequency by a PZT mounted to one of the signal
cavity mirrors inside the OPO head. The cavity transmission detec-
tor signal is sent to a pair of mixers �90� out of phase with one an-
other, and each is demodulated at frequency RF2 (equal to the
cavity FSR of 79.12 MHz). The overall phase of the heterodyne
detection is adjusted by phase shifting the RF signal driving the
EOM using cables of appropriate lengths. The demodulated signal
from each mixer is then sent to a lock-in amplifier referenced to
twice the frequency used to drive the plasma, and the in-phase
and quadrature outputs of each amplifier are digitized and stored
on a computer.
Ions are produced in a liquid-nitrogen-cooled multi-inlet multi-
outlet positive column discharge cell, which is placed between the
two free-standing mirrors of the optical cavity [18]. Intracavity
radiation is admitted into the cell by means of CaF2 windows
aligned at Brewster’s angle. The plasma is driven by a 40 kHz sine
wave voltage produced by amplifying the output of an arbitrary
waveform generator with an audio amplifier (Techron 7780) and
a step-up transformer. Hþ3 was produced at a pressure of 200 mTorr
and a discharge current of 170 mA. The outputs of the two mixers
were each demodulated at 80 kHz with a lock-in amplifier set to a
10 ms time constant (16 Hz detection bandwidth).
Typical operation begins by filling the cooling jacket of the cell
with liquid nitrogen and igniting the plasma. The cavity length is
adjusted to bring it into resonance with the laser, and the laser-
cavity lock is established. The idler frequency is tuned by applying
a voltage to an internal PZT on the YDFL, and the cavity length is
2 K.N. Crabtree et al. / Chemical Physics Letters 551 (2012) 1–6

controlled with the locking electronics to maintain the resonance
condition. When the cavity PZT reaches the end of its travel, the la-
ser-cavity lock is electronically interrupted, the cavity length is re-
set to the other end of its travel, a new resonance is found, and the
lock is reestablished. In this manner, the spectrometer can scan
without manual intervention over the entire range of the YDFL
PZT (around 100 GHz), although in practice a scan is generally
much shorter. It is in principle possible to extend the automated
tuning range further by electronic control of the intracavity etalon
of the OPO and the nonlinear crystal position/temperature, but the
practical utility of such efforts would likely be minimal.
3. Results and analysis
3.1. Lineshapes
The overall Doppler lineshape for NICE-OHVMS in both absorp-
tion and dispersion has odd symmetry, and qualitatively appears
similar to the third derivative of a Gaussian absorption profile. A
detailed analysis of the lineshape is beyond the scope of this Letter
and will be the subject of a future work, but a qualitative descrip-
tion follows. Consider a general NICE-OHMS lineshape such as that
shown in panels a and b of Figure 2 in Ref. [8]. If the signal belongs
to an ion, then the AC voltage of the plasma causes velocity mod-
ulation (VM), Doppler shifting the lineshape at the plasma fre-
quency. As a result of the bidirectional nature of light in our
optical cavity, the lineshape is simultaneously Doppler shifted to
the red and to the blue by the same amount at each point in time
along the plasma voltage cycle. Consequently, the time-dependent
signal repeats itself every plasma half-cycle, or at twice the AC
plasma frequency (2fvm). In addition to VM, an ion also experiences
concentration modulation (CM) at 2fvm, and CM may be phase
shifted with respect to VM. Thus, in addition to a periodic Doppler
shift at 2fvm from VM, the lineshape amplitude varies at 2f
vm from
CM. The net signal observed comes in 4 channels corresponding to
the even and odd second order Fourier coefficients of the absorp-
tion and dispersion profiles affected by VM and CM.
The sub-Doppler lineshape is more straightforward. As has been
discussed in regard to previous NICE-OHMS setups [19,20,9], the
carrier and sidebands can each act as pumps and probes for satura-
tion spectroscopy. The Lamb dips arising from the Bennet holes
burned in the population appear at half-integer multiples of the
carrier-sideband spacing fh, i.e., at all frequencies at which forward-
and reverse-propagating beams sample the same velocity compo-
nent of the Doppler distribution. At the line center m0, when the
Figure 1. Block diagram of NICE-OHVMS instrument. Details of its operation are given in the main text. YDFL: Ytterbium-doped fiber laser; EOM: electro-optic modulator;
OPO: optical parametric oscillator with pump (P, blue), signal (S, green) and idler (I, red) beams; PZT: piezoelectric transducer, PS: phase shifter; PSD: phase sensitive
detector; �: signal splitter.
6
4
2
0
-2
Mix
er
1 S
ign
al (A
U)
2726.32726.22726.12726.02725.9
Frequency (cm-1
)
6
4
2
0
-2
Mix
er
2 S
ign
al (A
U)
2726.32726.22726.12726.02725.9
Frequency (cm-1
)
Figure 2. NICE-OHVMS spectrum of the R(1,0) and R(1,1)u transitions of the m2fundamental band of Hþ
3 . Each panel shows the in-phase (black, bottom) and
quadrature (red, top) outputs of a lock-in amplifier demodulating the indicated
mixer’s signal.
K.N. Crabtree et al. / Chemical Physics Letters 551 (2012) 1–6 3

zero-velocity distribution is both pumped and probed by the car-
rier, a signal only appears in dispersion as the heterodyne detection
scheme employed by NICE-OHMS is insensitive to absorption of the
carrier. In the current work, the heterodyne modulation index (b) is
small enough (�0.63) that only the carrier has sufficient power to
saturate transitions, while the sidebands can only act as probes.
The dispersion signal therefore contains Lamb dips at m0 and
m0 � f h=2, while the absorption signal contains them at m0 � f h=2.
While VM and CM have a strong influence on the lineshape of
the Doppler profile, they do not affect the sub-Doppler features
in the same way. Because Bennet holes are only burned in the pop-
ulation at or spaced evenly around the zero-velocity component of
the ion distribution, VM effectively changes the abundance of ions
with the appropriate velocity. In that way, VM effectively behaves
like CM, and the net effect is to influence the amplitude of the
Lamb dip lineshape and the relationship between the amplitudes
of the even and odd Fourier coefficients within absorption or dis-
persion. Neglecting any change of the ions’ collision rate with
changing velocity, VM and CM do not affect the sub-Doppler profile
beyond its amplitude. The sub-Doppler lineshape function [9] is
vðmdÞ ¼ A1 va md �fh2
� �
� va md þfh2
� �� �� �
sin hh
þ �2A0vdðmdÞ þ A1 vd md �fh2
� �
þ vd md þfh2
� �� �� �
cos hh; ð1Þ
where md is the frequency detuning from the transition center fre-
quency, hh is the heterodyne detection phase, A0 is the effective
amplitude of the central (carrier-carrier) dispersion Lamb dip, and
A1 is the effective amplitude of the carrier-sideband Lamb dips for
absorption and dispersion. vaðxÞ is a Lorentzian lineshape function
for absorption, and vdðxÞ is a lineshape function for dispersion re-
lated to vaðxÞ by the Kramers–Kronig relations. These are defined as
vaðxÞ ¼1
1þ c2ðx�x0Þ2
and vdðxÞ ¼�ðx�x0Þc
1þ c2ðx�x0Þ2;
wherex0 is the center and c is the inverse of the half-width at half-
maximum. When using this fit function, fh is held at the cavity FSR
(79.12 MHz), the amplitudes are constrained such that A0 > A1, and
the Doppler profile near the line center is approximated by a third-
order polynomial with the quadratic term set to 0.
3.2. Hþ3 Spectra
A sample spectrum of the R(1,0) and R(1,1)u transitions of the m2fundamental band of Hþ
3 is shown in Figure 2. The signals in the top
and bottom panels are the demodulated in-phase (black) and
quadrature (red, offset) components of the two mixers, which in
our setup we measure to be 96� out of phase with one another.
The in-phase components of the R(1,0) transition are shown in
greater detail in Figure 3. The overall lineshape is slightly asymmet-
ric; the blue side of the transition is stronger than the red side, par-
ticularly in mixer 2. The origin of this asymmetry is unknown, and
its impact on the spectroscopic accuracy will be discussed below.
A simultaneous fit of the R(1,0) sub-Doppler features in all four
detection channels to Eq. (1) is shown in Figure 4. A number of con-
straints were employed to ensure that the fit parameters were all
internally consistent. The line center frequency and Lamb dip width
were forced to be equal for all four data channels. Mixers 1 and 2
were held at 96� apart, and the sideband spacing was held equal
to the cavity FSR of 79.12 MHz. Because the in-phase and quadra-
ture components of each mixer sample different blends of CM and
VM, the Lamb dip amplitudes were allowed to be different for the
in-phase channels and the quadrature channels. However, the two
in-phase channels were forced to have equal Lamb-dip amplitudes,
and likewise for the two quadrature channels. After all of these
constraints, there are a total of 19 fit parameters for the entire data
set: the line center frequency m0, the Lamb dip full width at half
maximum (2=c), the overall detection phase hh, Lamb dip ampli-
tudes A0 and A1 for the in-phase channels and the quadrature
channels, and baseline terms of the form c0 þ c1xþ c3x3 to approx-
imate the central portion of the Doppler profile in each channel.
The overall quality of the fit is quite good; the residuals are com-
posed primarily of fringing evident on top of the spectrum (espe-
cially mixer 2) with the notable exception of the quadrature
channel of mixer 1, which has some small systematic deviations
on the Lamb dips. The line center m0 derived from the fit is
2725:89401954� 0:0000023 cm�1, but the absolute accuracy is
limited by the > 2� 10�3 cm�1 accuracy of the wavemeter, so the
exact frequency should not be trusted. More important is the uncer-
tainty of the line center determination, which is �70 kHz; this rep-
resents the maximum potential accuracy of the technique provided
suitable frequency calibration is made (but see the discussion
3
2
1
0
-1
-2
-3
Sig
na
l (A
U)
2725.962725.922725.882725.84
Frequency (cm-1
)
Figure 3. NICE-OHVMS spectrum of the R(1,0) transition of the m2 fundamental
band of Hþ3 . The black trace is the in-phase output of mixer 1, and the red is the in-
phase output of mixer 2.
-2
-1
0
1
2S
ignal (A
U)
-100 -50 0 50 100
Relative Frequency (MHz)
-0.2
0.0
0.2
M1
Re
sid
.
-0.2
0.0
0.2
M2
Re
sid
. Mixer 1 In-phase Mixer 1 Quadrature
Mixer 2 In-phase Mixer 2 Quadrature
Figure 4. A simultaneous fit of the central sub-Doppler region of the Hþ3 R(1,0)
transition from all four data channels to Eq. (1). The symbols in the central portion
of the graph are the data, and the solid lines are the fit results. The residuals of the
fits are shown in the upper panel for mixer 1 and in the lower panel for mixer 2; in
each case the symbols correspond to those in the central panel.
4 K.N. Crabtree et al. / Chemical Physics Letters 551 (2012) 1–6

below about the effects of the asymmetry). The overall detection
phase hh was found to be 132�, indicating a blend of absorption
and dispersion in each mixer. Because the Lamb dip widths (full
width at half maximum of �110 MHz as indicated by our fit) are
much broader than the Lamb dip spacing of 39.56 MHz (fh=2), the
individual Lamb dips for absorption and dispersion cannot be re-
solved at any RF detection phase. Rather than tuning the phase to
separate absorption from dispersion in the two mixers, a phase of
132� was chosen because it was found to isolate the fringing as
much as possible in a single detection channel (mixer 2 in-phase),
thus minimizing the fringing in the other 3 channels.
4. Discussion
The most interesting aspect of the NICE-OHVMS technique is
the presence of Lamb dips which enables high precision
measurements of line center frequencies. Prior to the development
of NICE-OHVMS, the only methods capable of routine sub-Doppler
molecular ion spectroscopy utilized fast ion beams which, due to
kinematic compression, give linewidths on the order of 10 to
120 MHz [21–23]. The linewidths from ion beams are comparable
to the Lamb dips presented here, though the current work with a
positive column has the advantage of much higher ion density than
that within an ion beam.
With the Hþ3 Lamb dip linewidths of �110 MHz demonstrated
here, the precision of the line center determination is on the order
of 70 kHz. In its present implementation, the technique’s accuracy
is limited by the wavemeter, and also by slow drifts in the fre-
quency of the signal and idler beams caused by thermal fluctua-
tions of the OPO cavity. Use of an optical frequency comb to
stabilize and measure the frequencies of the pump and signal
beams would reduce the accuracy uncertainty to < 100 kHz. Ulti-
mately, the total uncertainty of the technique will be determined
by the reproducibility of line center determinations once appropri-
ately calibrated.
The asymmetry observed in the overall NICE-OHVMS lineshape
can adversely affect the overall accuracy. As mentioned above, the
origin of this asymmetry is unknown, although it varies with het-
erodyne detection phase; similar effects were not observed in the
near-IR implementation of NICE-OHVMS [9]. Nevertheless, we
have performed simulations of the effects of the asymmetry by
synthesizing skewed profiles and comparing the results of our fit
function to the actual location of the Lamb dips. Based on the fit-
ting of our simulations, we estimate the magnitude of this line cen-
ter shifting to be less than a few MHz, even for Doppler profiles
that are much more asymmetric than those shown in this Letter.
Further study of this phenomenon will be possible with an optical
frequency comb, and such work is envisioned in the near future.
The width of the Lamb dips (�110 MHz FWHM from the fitting)
is fairly broad. We have varied the intracavity laser power and the
cell pressure, but any differences in the linewidth were not obser-
vable. However, the ranges of the power and pressure measure-
ments were limited: the intracavity power could only be changed
by a factor of 2 before the laser-cavity lock was adversely affected,
and the plasma could only give stable operation over 200–600
mTorr. Such wide Lamb dips were also observed in the NICE-
OHVMS experiment performed on Nþ2 in the near-IR [9]; in that
study, the authors were able to observe a change in linewidth with
pressure, but extrapolating to zero pressure still gave a linewidth
of �30 MHz. Assuming that the linewidth is related to the time
an ion spends at zero velocity, it is perhaps unsurprising that a less
massive ion like Hþ3 has a broader linewidth than Nþ
2 , as its velocity
may be more easily altered by weak long-range interactions.
The fringing apparent in the figures above limits the sensitivity
of the present measurements in 2 of the 4 detection channels. The
origin of the fringing is not fully understood; however, it appears
to have a definite phase with respect to both the heterodyne detec-
tion and the plasmamodulation. When the plasma is turned off, the
fringing does not appear in a scan, and if the cavity transmission
detector is blocked while a signal originating from a single fringe
is present on a lock-in channel, the signal vanishes. Thus, it appears
that the fringing is the result of the plasma interacting with the la-
ser light rather than a purely electronic effect. One possibility is that
residual amplitude modulation (RAM) in the heterodyne sidebands
is being modulated by the plasma. RAM is an imbalance in the
amplitude and/or phase of the sidebands with respect to one an-
other. When demodulated, RAM appears as a DC offset in the het-
erodyne signal; because of our detection scheme using velocity
modulation and 2f detection, the NICE-OHVMS would ordinarily
be insensitive to such an offset. However, if the refractive index of
the plasma varies at 2f , the DC signal from RAM will be modulated
at 2f as well, resulting in a net NICE-OHVMS signal. Because RAM is
also affected by the presence of etalons in the optical system and
the optical frequency, a fringing pattern could possibly result as a
function of laser frequency. Testing whether this is truly the origin
of the fringing is difficult; however, it is probable that the fringing
would be reduced by employing a RAM compensation scheme via
temperature and voltage control of the fiber EOM [24].
The sensitivity of the technique at the experimental detection
bandwidth of 16 Hz, as determined from the noise-equivalent
absorption in the baseline of the in-phase component of mixer 1
(which has the least fringing of the four detection channels), is
3:4� 10�9 cm�1. which is about two orders of magnitude above
the shot noise limit of 3:9� 10�11 cm�1 calculated from
amin ¼p2F
ffiffiffiffiffiffiffiffi
eB
gP0
s
1
J0ðbÞJ1ðbÞL; ð2Þ
where F is the cavity finesse (120), e the fundamental electric
charge, B the detection bandwidth (16 Hz), g the detector respon-
sivity, P0 the power incident on the detector, JnðbÞ the nth order Bes-
sel function for modulation index b (0.63), and L the cavity length
(190 cm). While NICE-OHMS has been able to achieve a noise level
within a factor of 2 of the shot noise limit in one implementation
[7], the performance achieved by NICE-OHVMS relative to the shot
noise limit is already comparable to a number of other NICE-OHMS
setups (see the extensive discussion in Section 4 of [8]).
Ultimately, the absolute sensitivity can be improved by identi-
fying and eliminating noise sources and by increasing the cavity fi-
nesse. An increase in cavity finesse leads to additional technical
challenge in maintaining the laser-cavity lock, and may make the
system even more susceptible to the fringing effects that have al-
ready been observed. Such challenges can likely be overcome by
improving the bandwidth of the laser frequency corrections (cur-
rently limited to the 10 kHz bandwidth of the signal cavity PZT),
and correcting for RAM as discussed above.
5. Conclusions
In this Letter, we have demonstrated sub-Doppler spectroscopy
of molecular ions in the mid-infrared spectral region using the
NICE-OHVMS technique with a cw-OPO. By phase modulating the
seed laser with a fiber EOM prior to amplification and optical para-
metric oscillation, the mid-infrared idler is also phase modulated
without requiring amid-IR EOM. The high optical power of the idler
beam allows use of high-bandwidth detectors, which in turn make
ultra-sensitive spectroscopy via NICE-OHMS possible. Velocity
modulation spectroscopy is then combined with NICE-OHMS to af-
ford ion-neutral discrimination, and the intracavity laser power is
sufficient for saturating fundamental rovibrational transitions as
demonstrated by spectroscopy of Hþ3 . By fitting the sub-Doppler
spectral features, the center frequencies of individual rovibrational
lines can bemeasuredwith a precision of 70 kHz, and themaximum
K.N. Crabtree et al. / Chemical Physics Letters 551 (2012) 1–6 5

achieved sensitivity is within a factor of �90 of the shot noise limit.
Improvements to the technique, such as addition of an optical fre-
quency comb for accurate wavelength calibration, technical modifi-
cations to improve its sensitivity, and expanding the frequency
coverage of the OPO from3.2–3.9 lmto 2.8–4.8 lm, are envisioned.
The authors thank Takeshi Oka for providing us with the liquid
nitrogen cooled plasma cell and its associated pumps and plasma
electronics. KNC and BMS acknowledge support from a NASA Earth
and Space Science Fellowship. JNH acknowledges support from a
Springborn Fellowship and a National Science Foundation Gradu-
ate Research Fellowship (DGE 11-44245 FLLW). This work has been
supported by the National Science Foundation (PHY 08-55633), the
NASA Laboratory Astrophysics program (NNX08AN82G), and a Da-
vid and Lucile Packard Fellowship.
References
[1] C.S. Gudeman, M.H. Begemann, J. Pfaff, R.J. Saykally, Phys. Rev. Lett. 50 (1983)727.
[2] C.S. Gudeman, M.H. Begemann, J. Pfaff, R.J. Saykally, J. Chem. Phys. 78 (1983)5837.
[3] S.K. Stephenson, R.J. Saykally, Chem. Rev. 105 (2005) 3220.[4] B.M. Siller, A.A. Mills, B.J. McCall, Opt. Lett. 35 (2010) 1266.[5] A.A. Mills, B.M. Siller, B.J. McCall, Chem. Phys. Lett. 501 (2010) 1.[6] L.C. Sinclair, K.C. Cossel, T. Coffey, J. Ye, E.A. Cornell, Phys. Rev. Lett. 107 (2011)
093002.[7] J. Ye, L.-S. Ma, J.L. Hall, J. Opt. Soc. Am. B 15 (1998) 6.[8] A. Foltynowicz, F. Schmidt, W. Ma, O. Axner, Appl. Phys. B 92 (2008) 313.[9] B.M. Siller, M.W. Porambo, A.A. Mills, B.J. McCall, Opt. Exp. 19 (2011) 24822.[10] M.S. Taubman, T.L. Myers, B.D. Cannon, R.M. Williams, Spectrochim. Acta 60
(2004) 3457.[11] M.W. Porambo, B.M. Siller, J.M. Pearson, B.J. McCall, Opt. Lett., in press.[12] W.D. Watson, Astrophys. J. 183 (1973) L17.[13] E. Herbst, W. Klemperer, Astrophys. J. 185 (1973) 505.[14] T. Oka, Phys. Rev. Lett. 45 (1980) 531.[15] C.M. Lindsay, B.J. McCall, J. Mol. Spectrosc. 210 (2001) 60.[16] C.P. Morong, J.L. Gottfried, T. Oka, J. Mol. Spectrosc. 255 (2009) 13.[17] L. Velilla, B. Lepetit, A. Aguado, J.A. Beswick, M. Paniagua, J. Chem. Phys. 129
(2008) 084307.[18] C. Lindsay, E.T. White, T. Oka, Chem. Phys. Lett. 328 (2000) 129.[19] A. Foltynowicz, W. Ma, O. Axner, Opt. Exp. 16 (2008) 14689.[20] O. Axner, W. Ma, A. Foltynowicz, J. Opt. Soc. Am. B 25 (2008) 1166.[21] C.S. Gudeman, R.J. Saykally, Ann. Rev. Phys. Chem. 35 (1984) 387.[22] J.V. Coe, J.C. Owrutsky, E.R. Keim, N.V. Agman, D.C. Hovde, R.J. Saykally, J.
Chem. Phys. 90 (1989) 3893.[23] A.A. Mills, B.M. Siller, M.W. Porambo, M. Perera, H. Kreckel, B.J. McCall, J. Chem.
Phys. 135 (2011) 224201.[24] I. Silander, P. Ehlers, J. Wang, O. Axner, J. Opt. Soc. Am. B 29 (2012) 916
.
Kyle Crabtree graduated with a B.S. in Chemistry from
Ball State University in 2006, and received his Ph.D. in
Chemistry from the University of Illinois in 2012. He is
currently a CfA Postdoctoral Fellow at the Harvard-
Smithsonian Center for Astrophysics.
James Hodges received a B.S. in Chemistry and a B.S. in
Polymer & Fiber Chemistry in 2010 from Clemson Uni-
versity. He currently attends the University of Illinois
pursuing a PhD in Chemistry as a Springborn Fellow and
an NSF Graduate Research Fellow.
Brian Siller graduated with a B.A. in Chemistry, Com-
puter Science, and Mathematics from Ohio Wesleyan
University in 2007, and is currently pursuing a Ph.D. in
Physical Chemistry at the University of Illinois.
Adam Perry graduated with a B.S. in Chemistry from
Oregon State University in 2011, and is currently a
graduate student in Physical Chemistry at the Univer-
sity of Illinois.
Joe Kelly graduated with a B.S. in Chemistry from the
University of Illinois in 2012.
Paul Jenkins II is currently pursuing his B.S. in Chemical
Engineering at the University of Illinois, and plans to
graduate in 2015.
Ben McCall received his Ph.D. from the University of
Chicago in Chemistry and Astronomy & Astrophysics.
Following a Miller Research Fellowship at the University
of California at Berkeley, he joined the faculty of the
University of Illinois, where he is currently an Associate
Professor of Chemistry and Astronomy.
6 K.N. Crabtree et al. / Chemical Physics Letters 551 (2012) 1–6

Indirect Rotational Spectroscopy of HCO+
Brian M. Siller,† James N. Hodges,† Adam J. Perry,† and Benjamin J. McCall∗,†,‡
Department of Chemistry, University of Illinois at Urbana-Champaign, and Departments of
Physics and Astronomy, University of Illinois at Urbana-Champaign
E-mail: [email protected]
Abstract
Spectroscopy of the ν1 band of the astrophysically relevant ion HCO+ is performed with
an optical parametric oscillator calibrated with an optical frequency comb. The sub-MHz
accuracy of this technique was confirmed by performing a combination differences analysis
with the acquired rovibrational data and comparing the results to known ground-state rotational
transitions. A similar combination differences analysis was performed from the same data set
to calculate the previously unobserved rotational spectrum of the ν1 vibrationally excited state
with precision sufficient for astronomical detection. Initial results of cavity-enhanced sub-
Doppler spectroscopy are also presented, and hold promise for further improving the accuracy
and precision in the near future.
Introduction
Molecular ions are a particularly challenging group of species to study with optical spectroscopy.
Even in laboratory plasmas that are designed to observe only a specific ion, neutral molecules are
still orders of magnitude more abundant than their charged counterparts. This is why the most
∗To whom correspondence should be addressed†Department of Chemistry, University of Illinois at Urbana-Champaign‡Departments of Physics and Astronomy, University of Illinois at Urbana-Champaign
1

productive techniques for ion spectroscopy tend to have some method for discriminating ionic
absorption signals from neutral ones. Since the late 1980s, the predominant tool for this has been
velocity modulation spectroscopy (VMS). The groundwork of VMS was laid by Wing et al. in
a velocity modulated ion beam,1 and the first application of VMS as it is known today was by
Gudeman et al. in a velocity modulated positive column discharge cell.2 Since the initial work, the
technique has become a mainstay in ion spectroscopy and has been extensively reviewed.3,4
Protonated carbon monoxide, HCO+, was the first ion whose spectrum was acquired using
VMS. The R-branch of the ν1 C-H stretch band was first measured by Gudeman et al. in a pos-
itive column discharge cell out to R(18).2 Shortly after, the P-branch was also observed out to
P(10) in a modulated DC glow.5 After these lines were published it was another 24 years before
any work revisited the ν1 band, when Verbraak et al. used a continuous wave optical parametric
oscillator (cw-OPO) operating in the mid-infrared and a supersonic expansion discharge source to
rotationally cool the ions.6
The first observation of an HCO+ rotational transition was via telescope rather than in a labora-
tory in 1970 by Buhl and Snyder.7 Because the line that they observed was unidentified at the time,
it was referred to as “X-ogen”. Later that year, Klemperer suggested that the “X-ogen” line was
due to the J = 1←0 transition of HCO+.8 Five years later, Woods et al. confirmed its identity by
microwave spectroscopy.9 Since that time, HCO+ has been found in a variety of astronomical en-
vironments including protoplanetary nebulae,10 star forming regions,11 the interstellar medium,12
and even the comet Hale-Bopp.13 The abundance of HCO+ makes it an important participant in the
rich chemistry that exists in the interstellar medium. Due to the large rotational constant of HCO+,
its higher rotational transitions exist in the sub-millimeter/terahertz region. Newer telescopes such
as The Atacama Large Millimeter and sub-millimeter Array (ALMA) and the Stratospheric Ob-
servatory For Infrared Astronomy (SOFIA) have sub-millimeter/terahertz capability. These new
astronomical capabilities lend necessity to a relatively simple way to gain laboratory information
in that spectral region, a challenging region for laboratory spectroscopy, due in part to the relative
scarcity of quality sources and detectors compared to the microwave and infrared spectral regions.
2

In this work, we present a demonstration of how precision rovibrational spectroscopy can be used
to infer rotational transitions to precision sufficient to facilitate astronomical searches.
In the case of HCO+, most of the ground state transitions have been observed up to J = 17←16,
with the exception of a few gaps in coverage.14 Additionally, only a few pure rotational lines
have been observed in vibrationally excited states. One such transition is the J = 3←2 rotational
transition in the ν1 first vibrationally excited state.15 With this single transition combined with our
high-precision IR spectrum, the entire rotational spectrum of the ν1 state can be calculated, limited
only by the number of rovibrational lines that have been observed. The technique demonstrated
here is also useful for determining high precision rotational constants in excited states.
In this work, we present spectra of the ν1 fundamental band of HCO+ acquired using optical
heterodyne spectroscopy coupled with VMS (OH-VMS). This technique combines the advantages
of the low noise of heterodyne spectroscopy with ion-neutral discrimination of VMS. Our instru-
ment utilizes a cw-OPO tunable from 3.2 to 3.9 µm, and produces ions within a liquid nitrogen
cooled positive column discharge cell. Optical frequency comb calibrated scans were acquired and
fit with sub-MHz precision, and the resulting fits were used to calculate rotational transitions for
the ground state and the first vibrationally excited C-H stretch state. These calculations result in
the first experimental observation, albeit indirectly, of the J = 3←2 transition in the ground state
and the complete determination of the of the rotational spectrum up to J = 10←9 in the ν1 first
excited state.
Experimental
The experimental setup, shown in Figure 1, has been described previously16 with the exception
of the frequency comb integration, so it will be discussed only briefly here. A Ytterbium-doped
fiber laser is frequency modulated with a fiber-coupled electro optic modulator (EOM) using two
RF generators: one at ∼80 MHz for heterodyne detection, and the other at ∼2 MHz for locking
to the optical cavity around the discharge cell. After the modulation is applied, this seed laser is
3
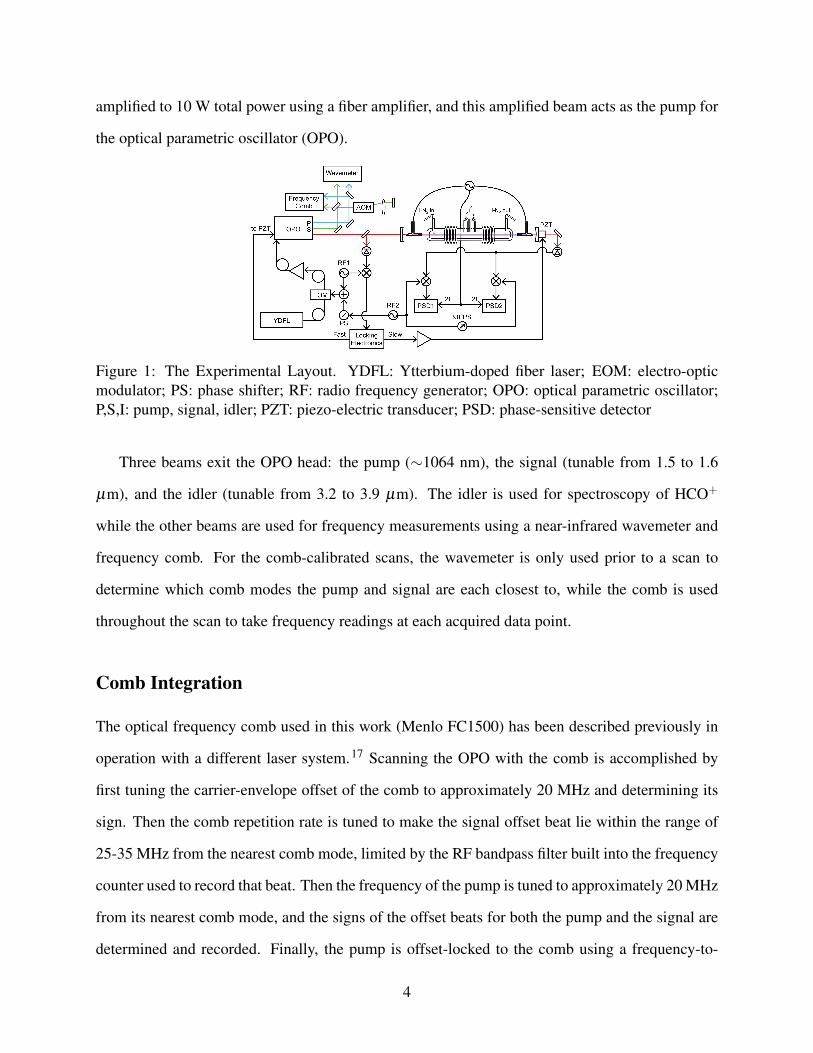
amplified to 10 W total power using a fiber amplifier, and this amplified beam acts as the pump for
the optical parametric oscillator (OPO).
Wavemeter
Frequency
Comb
OPOPSI
Locking
Electronics
RF1
PZTto PZT
EOM
PSD12f
90°PS
l-N2 in l-N2 out
2fPSD2
YDFL
Fast Slow
PS
Figure 1: The Experimental Layout. YDFL: Ytterbium-doped fiber laser; EOM: electro-optic
modulator; PS: phase shifter; RF: radio frequency generator; OPO: optical parametric oscillator;
P,S,I: pump, signal, idler; PZT: piezo-electric transducer; PSD: phase-sensitive detector
Three beams exit the OPO head: the pump (∼1064 nm), the signal (tunable from 1.5 to 1.6
µm), and the idler (tunable from 3.2 to 3.9 µm). The idler is used for spectroscopy of HCO+
while the other beams are used for frequency measurements using a near-infrared wavemeter and
frequency comb. For the comb-calibrated scans, the wavemeter is only used prior to a scan to
determine which comb modes the pump and signal are each closest to, while the comb is used
throughout the scan to take frequency readings at each acquired data point.
Comb Integration
The optical frequency comb used in this work (Menlo FC1500) has been described previously in
operation with a different laser system.17 Scanning the OPO with the comb is accomplished by
first tuning the carrier-envelope offset of the comb to approximately 20 MHz and determining its
sign. Then the comb repetition rate is tuned to make the signal offset beat lie within the range of
25-35 MHz from the nearest comb mode, limited by the RF bandpass filter built into the frequency
counter used to record that beat. Then the frequency of the pump is tuned to approximately 20 MHz
from its nearest comb mode, and the signs of the offset beats for both the pump and the signal are
determined and recorded. Finally, the pump is offset-locked to the comb using a frequency-to-
4

voltage converter circuit that generates an appropriate error signal for offset locking.
The nearest comb mode numbers are determined for the pump and the signal before each
scan using the wavemeter, then are recorded (and incremented/decremented for the signal when
necessary) as the scan progresses. At each frequency step, the data acquisition program pauses for
1.5 seconds, then the comb repetition rate and offset beats are recorded by frequency counters with
1 Hz refresh rates, and the lock-in amplifier outputs are recorded. With the lock-in amplifier time
constant set to 300 ms, the lock-in amplifiers have 5 time constants to respond before the reading
is polled for each point, so any scanning direction dependent line center pulling is smaller than the
random scan-to-scan variability in line center determination.
After each point, the repetition rate is tuned by an amount sufficient to slew the pump frequency
by∼5 MHz (∼1.8 Hz change in repetition rate). The pump remains offset locked to the same comb
mode throughout the course of each scan. The total continuous scanning range of the pump (and
therefore for the idler) for comb-calibrated scans is limited to ∼800 MHz by the comb scanning
electronics; the comb repetition rate can only be changed by a relatively small amount while still
retaining its lock onto the direct digital synthesizer (DDS) that stabilizes the repetition rate.
To keep the signal offset within the frequency counter bandpass filter at each point, a feed-
forward system is used to tune the signal frequency using a double-pass acousto-optic modulator
(AOM) setup. In a double-pass configuration, the frequency shift induced by the AOM is doubled,
while making the pointing of the beam independent of the frequency applied to the AOM.18 Stable
pointing is crucial to the operation of the system, as good spatial overlap between the comb light
and each of the cw beams is important for generating offset beat signals on the high speed detectors.
After the counters are read for a data point and the repetition rate is slewed to the next point, the
amount the signal frequency needs to be shifted by is calculated using the change in the repetition
rate, the signal comb mode number, and the amount the signal was away from the 30 MHz target
offset frequency for the previous point; this frequency shift is then applied to the frequency of
the RF generator that drives the AOM. The AOM diffraction efficiency is high enough to provide
reliable signal/comb offset beat measurements in the driving frequency range of 150-210 MHz,
5

which corresponds to a frequency shift of 300-420 MHz when taking into account the double-pass
configuration. When the calculated desired AOM frequency lies outside this range, the drive fre-
quency is shifted by 50 MHz (corresponding to a 100 MHz change in the shifted signal frequency,
matching the comb repetition rate), and the signal mode number is incremented or decremented by
one, depending on whether the 100 MHz shift was positive or negative.
This signal-shifting scheme allows the shifted signal frequency to be determined using the
frequency comb at each point, despite the fact the signal frequency is fixed (with the exception of
some slow drift) while the comb repetition rate is slewing. The unshifted signal frequency can then
be determined simply by subtracting the AOM frequency shift, which is precisely known from the
digital setting of the RF generator at each point, and this unshifted signal frequency is subtracted
from the directly measured pump frequency to determine the idler frequency.
Spectroscopy Configuration
The plasma cell used in this work, Black Widow, shown in Figure 2, was the same cell used by
Takeshi Oka in many of his velocity modulation experiments. It allows for liquid nitrogen cooling
of the plasma to reach an estimated rotational temperature of ∼166 K for HCO+, as shown in
the Boltzmann plot in Figure 3, using plasma conditions of 30 mTorr CO in 500 mTorr H2 with
a 35 kHz, 140 mA discharge. The idler beam is coupled through Brewster windows on either
end of the cell into the central bore of the discharge cell. For this work, three different optical
configurations were used: single-pass, double-pass and cavity-enhanced, all of which relied on
heterodyne modulation and detection at ∼80 MHz.
The comb calibrated scans presented in this paper used a simple single-pass configuration,
where the cavity mirrors shown in Figure 1 were removed and the cavity-locking RF modulation
and feedback circuit were disabled. This allowed for the acquisition of Doppler-broadened scans
with signal-to-noise ratios of ∼300 for the strongest lines and ∼100 for the weakest ones, but due
to the lack of a bidirectional beam and sufficient laser power, did not allow for the observation of
Lamb dips. A typical comb-calibrated scan is shown in Figure 4.
6

Figure 2: “Black Widow”, the liquid nitrogen cooled positive column discharge cell acquired from
Takeshi Oka and used for the work in this paper. The central bore, where the plasma discharge
occurs, is surrounded by a sheath of flowing liquid nitrogen, which is in turn surrounded by a
vacuum jacket to prevent ice from forming on the cell.
A series of double-pass wavemeter-calibrated scans were collected for the previously unob-
served P(11) through P(17) transitions. In the double-pass configuration, a single mirror was placed
on the far side of the cell to back-reflect the idler for a second pass through the cell. Approximately
30% of the reflected beam was then picked off with a silicon window and directed to a high-speed
detector, the signal from which was demodulated first at the heterodyne frequency, then at twice
the plasma frequency (2f ), as opposed to the 1f demodulation that was used for the single-pass
work. The linecenters determined from these scans are shown in Table 1, and compared to the
calculated values from the fit parameters determined by the comb-calibrated work. All but one of
the linecenters determined from these scans fall within the expected 70 MHz uncertainty from the
wavemeter calibration. The one exception, P(17), is thought to be off by more than the uncertainty
due to an inaccurate signal reading caused by poor optical alignment.
A few uncalibrated scans were collected with the cavity mirrors in place in a noise immune
cavity enhanced optical heterodyne velocity modulation spectroscopy (NICE-OHVMS)19 config-
uration. One such scan, showing strong central Lamb dip features on top of the Doppler profile,
is shown in Figure 5. Unfortunately, the dielectric coatings on the mirrors were found to be hy-
groscopic, which led to poor laser coupling efficiency through the cavity in this wavelength range
and degraded performance over time. To obtain optimal Lamb dip depth, the total cell pressure
had to be decreased to ∼200 mTorr and the discharge current had to be turned down as low as
7

-1.6
-1.4
-1.2
-1.0
-0.8
Ln(A
)
12010080604020
Lower State Energy (cm-1
)
Figure 3: Boltzmann plot for R(1) through R(9), with the slope indicating a plasma temperature of
∼166 K. The vertical axis is the natural log of the line strength normalized peak-to-peak amplitude
of a double-pass scan for each transition.
Table 1: Previously unobserved wavemeter-calibrated scans of the P(11) through P(17) transitions.
Uncertainties are ∼70 MHz, limited by the wavemeter uncertainties for the pump and signal fre-
quencies added in quadrature. Calculations are based on ground state constants from Cazzoli et
al.14 and excited state constants determined from our comb-calibrated scans.
Transition Observed (cm−1) Calculated (cm−1) Obs - Calc (MHz)
P(11) 3054.730 3054.73019(4) -6
P(12) 3051.502 3051.49993(5) 62
P(13) 3048.245 3048.24688(6) -57
P(14) 3044.969 3044.97111(7) -63
P(15) 3041.672 3041.67269(8) -21
P(16) 3038.354 3038.35169(9) 69
P(17) 3035.013 3035.00817(10) 145
possible while still maintaining a stable plasma, to ∼100 mA. Both the lower pressure and the
lower discharge current produce lower overall density of HCO+ within the cell. This decreased
density combined with the poor laser transmission through the cavity cause the signal-to-noise
in the NICE-OHMS scans to be significantly compromised compared to the single- and double-
pass scans, despite the factor of ∼400 greater path length that NICE-OHMS provides through the
plasma.
8

-7
-6
-5
-4
-3
-2
-1
Sig
nal (
V)
3073.643073.633073.62
Idler Frequency (cm-1
)
Figure 4: A typical comb-calibrated scan (red dots) of the P(5) transition of HCO+, along with a
fit to the data (blue line). Error bars for the points are not shown, as they would be smaller than the
point size for both intensity and frequency.
Results and Discussion
Each comb calibrated scan was fit to a second derivative of a Gaussian function, which approxi-
mates the convolution of heterodyne modulation with velocity modulation observed in the exper-
iment. Between 4 and 7 scans were acquired of each transition, and the data acquired from those
fits were used to compute the average linecenters and standard errors shown in Table 2. The errors
varied somewhat from one transition to the next, but the average uncertainty was found to be∼600
kHz.
As can be seen by the fit in Figure 4, this fit function is not perfect, likely due to imperfect
setting of the detection phases. For this work, both the RF and plasma demodulation phases were
set to maximize the signal-to-noise of a single detection channel out of the four channels that were
acquired with each scan. It is likely that there is some dispersive component to the lineshape
function, rather than it being purely absorptive. It is also likely that the velocity modulation of
the ions is not purely sinusoidal and that the lock-in demodulation is not exactly in phase with the
velocity modulation, and both of these factors can also affect the overall lineshape.
There is also a slight asymmetry in the observed lineshapes for several of the scans that is not
fully understood at this time. By adding a slightly sloped baseline to the data, we can make it
9

-8
-7
-6
-5
-4
-3
-2
Sig
nal (
V)
3073.653073.60
Idler Frequency (cm-1
)
Figure 5: A roughly calibrated scan of the P(5) transition of HCO+, showing the Lamb dips that are
obtainable with cavity enhancement combined with lower cell pressure. The frequency calibration
of this scan was based on the line center determined from the comb calibrated scans combined
with the approximate scan voltage to frequency transfer function of the seed laser.
significantly more symmetric, and also make the fit slightly better. Symmetrizing the data in this
way causes the determined linecenter to shift by less than 1 MHz for even the most asymmetric
scans. Given that we do not know the physical cause of this phenomenon, we have taken the
approach of manipulating the data as little as possible, so this symmetrizing was only done to
estimate the potential error induced by the asymmetry. When asymmetry is present, it tends to
manifest with the low-frequency lobe of the lineshape having a greater maximum than the high-
frequency one. Such a systematic error would be mitigated by subtraction of observed linecenters,
as is done in the combination differences analysis described in the following several paragraphs.
Based on the errors in the calculation of rotational transitions, it appears that random scan-to-scan
variability is the limiting factor in linecenter determination, and not the effects of this asymmetry.
For approximately half of the comb-calibrated scans, the determined linecenters disagreed with
the previously measured HCO+ transition frequencies5 by greater than the specified accuracy of 30
MHz. It was found that the source of the errors was incorrect comb mode number determination
for either the signal or the pump beams due to inaccuracy of the wavemeter. These incorrectly
10

Table 2: A list of the comb-calibrated HCO+ transition center frequencies (with associated uncer-
tainties) observed in the current work, compared with previous measurements.
Transition Linecenter (cm−1) Previous Work5 (cm−1) Previous-Current (MHz)
R(0) 3091.690432(16) 3091.6919(10) 44
R(1) 3094.618099(27) 3094.6181(10) 0
R(2) 3097.522054(07) 3097.5223(10) 7
R(3) 3100.402249(25) 3100.4034(10) 35
R(4) 3103.258604(21) 3103.2586(10) 0
R(5) 3106.090956(19) 3106.0909(10) -2
R(6) 3108.899376(20) 3108.9002(10) 25
R(7) 3111.683680(04) 3111.6841(10) 13
R(8) 3114.443835(05) 3114.4445(10) 20
R(9) 3117.179881(41) 3117.1800(10) 4
P(1) 3085.763903(23) 3085.7646(10) 21
P(2) 3082.765487(53) 3082.7662(10) 21
P(3) 3079.743422(15) 3079.7437(10) 8
P(4) 3076.698005(05) 3076.6977(10) -9
P(5) 3073.629188(16) 3073.6291(10) -3
P(6) 3070.537136(19) 3070.5377(10) 17
P(7) 3067.421924(37) 3067.4224(10) 14
P(8) 3064.283464(10) 3064.2834(10) -2
P(9) 3061.122045(18) 3061.1226(10) 17
P(10) 3057.937606(08) 3057.9380(10) 12
calibrated scans were easily corrected by adding or subtracting a multiple of the comb repetition
rate to or from the calculated idler frequency. After correcting the idler frequency calibration, it
was found that all but two of the the observed transitions agreed with Amano’s previous work to
within 30 MHz. The two exceptions to the 30 MHz agreement were the R(0) and R(3) transitions,
but those were both further verified by comparing the combination difference analysis with directly
measured rotation transitions, as shown in Table 3. Any remaining error in the determination of
comb mode numbers would appear as an error of ∼100 MHz, which is not observed.
A combination differences analysis was performed to demonstrate the accuracy of our comb-
calibrated rovibrational compared to known rotational transitions. First, frequencies of transitions
sharing the same upper state energy level, e.g. R(0) and P(2), were subtracted from one another to
generate ground state energy level spacings for pairs of energy levels separated by two rotational
energy levels. For example, the J=2←0 spacing was calculated from fR(0)− fP(2), the J=3←1
11

Table 3: Indirectly calculated rotational transition frequencies derived from the data in Table 2
compared to the directly measured rotational transitions compiled by Cazzoli et al.14
J’ J” Calc. Freq. (MHz) Obs. Freq.14 (MHz) Calc - Obs (MHz)
0 1 n/a 89188.5247 n/a
1 2 178374.6(17) 178375.0563 -0.5
2 3 267557.0(19) n/a n/a
3 4 356732.3(19) 356734.2230 -2.0
4 5 445903.9(21) 445902.8721 1.0
5 6 535061.0(23) 535061.5810 -0.5
6 7 624207.4(26) 624208.3606 -1.0
7 8 713344.0(27) 713341.2278 2.8
8 9 802455.7(27) 802458.1995 -2.5
9 10 891558.4(27) 891557.2903 1.1
spacing was calculated from fR(1)− fP(3), and so forth for all observed transitions up to the J=10←8
spacing.
Then the directly measured J=1←0 transition was subtracted from the J=2←0 energy level
spacing to indirectly compute the J=2←1 rotational transition frequency. This computed frequency
was then subtracted from the J=3←1 spacing to compute the J=3←2 transition frequency, and the
process was repeated for higher rotational energy levels up to J=10←9. At each step, the calculated
rotational transition from the previous step was used with a new energy level difference to compute
a new rotational transition. The indirectly calculated rotational transitions in the current work are
compared to the previously observed rotational transition frequencies in Table 3.
Such an analysis was also carried out for the ν1 (C-H stretch mode) first vibrationally excited
state. To our knowledge, the only directly observed rotational transition was J=3←2.15 This single
transition, combined with our rovibrational data, is sufficient to compute the expected rotational
transitions from J=1←0 up to J=10←9, as shown in Table 4. The comb-calibrated data were also
fit using the previously determined ground state constants,14 and the following vibrationally ex-
cited state constants were determined: ν1 = 3088.739009(5) cm−1, B1 = 44240.536(9) MHz, and
D1 = 82.31(9) kHz. These values agree within 2σ with the uncertainties those previously deter-
mined by Amano [3088.73951(31) cm−1, 44240.34(33) MHz, and 80.3(33) kHz] using infrared
spectroscopy,5 while disagreeing by 5σ with the B1 and D1 determined by an “all-inclusive” fit by
12

Lattanzi et al. that used data from several microwave and infrared papers to determine constants
across several vibrational states to determine B1 = 44240.614(17) MHz and D1 = 86.56(82) kHz.15
Given that the only data for the ν1 state included in the “all-inclusive” fit were Amano’s infrared
spectrum (which reported transitions with 30 MHz uncertainties) and a single rotational transi-
tion (J=3←2),20 we do not currently understand the small magnitude of uncertainties reported by
Lattanzi et al.
Table 4: Pure rotational transitions for the vibrationally excited ν1 state of HCO+, calculated from
the rovibrational data in Table 2 and the directly observed15 J=3←2 rotational transition.
J’ J” Calc. Freq. (MHz) Uncertainty (MHz)
0 1 88486.7 1.9
1 2 176955.4 1.6
2 3 n/a n/a
3 4 353900.7 0.9
4 5 442366.0 1.1
5 6 530813.3 1.3
6 7 619257.7 1.6
7 8 707676.3 1.9
8 9 796093.7 1.9
9 10 884477.9 2.4
Conclusions
The current work demonstrates the ability of Doppler-broadened comb-calibrated velocity modu-
lation spectroscopy to determine linecenters with sub-MHz accuracy and precision. This accuracy
has been verified by performing a combination differences analysis of the rovibrational data and
comparing the results to the previously observed rotational spectrum of vibrational ground state
HCO+. The potential of extending the technique to sub-Doppler work has also been demonstrated.
With a proper set of cavity mirrors, it should be possible to further improve the precision of this
technique. From the current series of fits, the Doppler-limited linewidth is ∼450 MHz, and the
uncertainty of a single fit is ∼350 kHz. From the Lamb dip scan of HCO+ shown in Figure 5, the
peak-to-peak linewidth of the central sub-Doppler feature is only ∼50 MHz, so it is reasonable
13

to assume that the precision of a fit to sub-Doppler features would be approximately an order of
magnitude more precise than one to a Doppler-broadened scan, assuming the S/N problem can be
solved by a non-hygroscopic set of cavity mirrors. The investigation into whether the accuracy is
also improved by the same factor will be the subject of future work.
One of the greatest advantages of this indirect approach over direct rotational spectroscopy is
the generality of it. The chemistry within positive column discharge cells tends to be very rich,
so it is possible to make a wide variety of molecular ions. The cell used in the current work was
cooled with liquid nitrogen, but it could easily be cooled by water or air, or even heated to attain
greater population in higher rotational levels and compute the rotational spectrum up to very high
J values. The infrared source and detectors are also very versatile in terms of spectral coverage;
entire rovibrational bands for a wide variety of ions lie within its tuning range, and can be observed
without any changes to the optoelectronic system.
This work also has implications for astronomical searches for the astrophysically relevant ion
HCO+. While the ground vibrational state has been thoroughly studied, little work has previously
been done in this vibrationally excited state. Rotational transitions in the vibrationally excited state
could be of astrophysical interest, particularly in hot, dense environments such as hot cores and
circumstellar envelopes.21
Acknowledgments
The authors would like to acknowledge an NSF grant (CHE 12-13811) and a NASA Laboratory
Astrophysics grant for funding. BJM wishes to acknowledge support from a David & Lucile
Packard Fellowship and a Camille Dreyfus Teacher-Scholar award. BMS would like to thank a
NASA Earth and Space Science Fellowship (NESSF NNX11AO06H), and JNH is grateful for
support by a Robert & Carolyn Springborn fellowship and an NSF Graduate Research Fellowship
(DGE 11-44245 FLLW). The authors would also like to thank Takeshi Oka for supplying the
discharge cell and associated electronics and pumps used for this work.
14
References
(1) Wing, W.; Ruff, G.; Lamb, W.; Spezeski, J. Phys. Rev. Lett. 1976, 36, 1488–1491
(2) Gudeman, C. S.; Begemann, M. H.; Pfaff, J.; Saykally, R. J. Phys. Rev. Lett. 1983, 50, 727–
731
(3) Stephenson, S. K.; Saykally, R. J. J. Mol. Spectrosc. 2005, 231, 145–153
(4) Gudeman, C. S.; Saykally, R. J. Annu. Rev. Phys. Chem. 1984, 35, 387–418
(5) Amano, T. J. Chem. Phys. 1983, 79, 3595
(6) Verbraak, H.; Ngai, A. K. Y.; Persijn, S. T.; Harren, F. J. M.; Linnartz, H. Chem. Phys. Lett.
2007, 442, 145–149
(7) Buhl, D.; Snyder, L. E. Nat. 1970, 228, 267–9
(8) Klemperer, W. Nat. 1970, 227, 1230–1230
(9) Woods, R.; Dixon, T.; Saykally, R.; Szanto, P. Phys. Rev. Lett. 1975, 35, 1269–1272
(10) Sanchez Contreras, C.; Sahai, R. Astrophys. J. 2004, 602, 960–977
(11) Purcell, C. R. et al. Mon. Not. R. Astron. Soc. 2006, 367, 553–576
(12) Liszt, H.; Lucas, R. Astron. Astrophys. 2004, 428, 445–450
(13) Milam, S. N.; Savage, C.; Ziurys, L. M.; Wyckoff, S. Astrophys. J. 2004, 615, 1054–1062
(14) Cazzoli, G.; Cludi, L.; Buffa, G.; Puzzarini, C. Astrophys. J. Sup. 2012, 203, 11
(15) Lattanzi, V.; Walters, A.; Drouin, B. J.; Pearson, J. C. Astrophys. J. 2007, 662, 771–778
(16) Crabtree, K. N.; Hodges, J. N.; Siller, B. M.; Perry, A. J.; Kelly, J. E.; II, P. A. J.; McCall, B. J.
Chem. Phys. Lett. 2012, 551, 1 – 6
(17) Mills, A. A.; Siller, B. M.; McCall, B. J. Chem. Phys. Lett. 2010, 501, 1 – 5
15

(18) Donley, E. A.; Heavner, T. P.; Levi, F.; Tataw, M. O.; Jefferts, S. R. Rev. Sci. Instrum. 2005,
76, 063112
(19) Siller, B. M.; Porambo, M. W.; Mills, A. A.; McCall, B. J. Opt. Express 2011, 19, 24822–
24827
(20) Hirota, E.; Endo, Y. Journal of Molecular Spectroscopy 1988, 127, 527 – 534
(21) Blake, G. A.; Laughlin, K. B.; Cohen, R. C.; Busarow, K. L.; Saykally, R. J. Astrophys. J.
1987, 316, L45–L48
16